Embed Size (px)
Citation preview

Evolutionary developmental biology, or ‘evo-devo’, has grown rapidly over the past two decades as a synthesis of evolutionary and developmental biology1,2. The key ques-tions in evo-devo studies are how development affects the evolution of morphological traits and, in turn, how developmental processes evolve. In particular, consider-ing development in conjunction with evolutionary pro-cesses can shed light on the origin of new variation that serves as raw material for natural selection. Evo-devo therefore contributes an aspect to evolutionary biology that complements population biology and the evolution-ary synthesis2. Similarly, the focus on the evolution of developmental processes provides a crucial perspective that permits developmental biologists to relate findings from different model organisms to evolving lineages.
Evo-devo has long emphasized morphological traits1,3. Decisive advances in recent years have been achieved by using quantitative approaches to characterize shapes4 and by integrating them with methods from evolutionary biology, genetics and developmental biology. As a result, investigators have a powerful and flexible set of analytical tools for answering specific questions, and new ones are added regularly. Moreover, a wide range of study designs can be used in evo-devo studies, from experiments in the classical model species to broad comparative analyses across major taxonomic groups (BOX 1).
Following the tradition of developmental genetics, evo-devo has predominantly focused on drastic morpho-logical changes: clear-cut ‘phenotypes’ that can easily be scored without measurement, such as flowers that have
different types of symmetry5. If shape variation is quanti-fied, however, a more subtle picture emerges. For instance, a population may contain a continuum of flower shapes, of which the different symmetry types are the extremes, and quantifying shapes may reveal the adaptive value of shape through its effect on pollination success6. Whereas the drastic phenotype simplifies the experiments in the laboratory, quantitative information permits a more detailed picture of evolutionary processes4.
In recent years, more and more studies have quan-tified shape to address evo-devo questions. These stud-ies use shape variation as a ‘common currency’ to link experimental or comparative approaches from different biological disciplines. In the first two sections of this Review, I briefly survey the approaches for quantifying morphological variation and its genetic components, which are important preliminary steps that provide the basis for further analyses. I then present an overview of morphological integration and modularity, which have been a particular focus of attention for research into the evo-devo of shape. I also introduce allometry and functional aspects, which have not been as widely discussed in evo-devo as modularity but are both important topics. Finally, I review studies on the macroevolution of shape and discuss what direction future analyses might take.
Quantifying shape variationMany morphological traits can be quantified effec-tively by single measurements of the size of a part — for example, the diameters of eyespots on butterfly wings7
Faculty of Life Sciences, University of Manchester, Michael Smith Building, Oxford Road, Manchester M13 9PT, UK.e-mail: [email protected]:10.1038/nrg2829Published online 10 August 2010
ShapeThe shape of an object encompasses all of its geometric properties except its size, position and orientation.
Morphological integrationThe covariation of morphological structures in an organism or of parts in a structure, which may reflect developmental or functional interactions among traits.
AllometryThe dependence of shape on size, often characterized by a regression of shape on size.
Evolution and development of shape: integrating quantitative approachesChristian Peter Klingenberg
Abstract | Morphological traits have long been a focus of evolutionary developmental biology (‘evo-devo’), but new methods for quantifying shape variation are opening unprecedented possibilities for investigating the developmental basis of evolutionary change. Morphometric analyses are revealing that development mediates complex interactions between genetic and environmental factors affecting shape. Evolution results from changes in those interactions, as natural selection favours shapes that more effectively perform some fitness-related functions. Quantitative studies of shape can characterize developmental and genetic effects and discover their relative importance. They integrate evo-devo and related disciplines into a coherent understanding of evolutionary processes from populations to large-scale evolutionary radiations.
R E V I E W S
nATuRE REvIEWS | Genetics voluME 11 | SEpTEMbER 2010 | 623
© 20 Macmillan Publishers Limited. All rights reserved10

Box 1 | Study organisms and study designs
A key factor in evolutionary developmental biology (‘evo-devo’) has been the search for new model species in addition to those traditionally used in genetics and developmental biology99. As a result, a wide variety of experimental, observational and comparative study designs is now available for studying the evo-devo of shape. These include experiments using classical model organisms that are fully controlled for genetic and environmental factors41,42,44,83, studies of variation in natural populations in the field6,25, analyses of shape variation in domesticated species17,100 and broad comparative studies in large groups of extant or fossil organisms76,87. Each of these approaches has its own strengths and weaknesses.
The primary advantage of classical model organisms is the ease of experimental manipulation and the degree of control over factors that are not of specific interest. Inbred lines provide genetically identical individuals, and laboratory culture under standardized conditions provides full control over environmental conditions. Consequently, it is easy to separate shape variation that is due to specific genetic factors or to spontaneous variation in the developmental system44. Likewise, in experimental settings, developmental changes can be visualized and quantified precisely with tools such as vital staining and strains of organisms carrying mutations of interest or marker transgenes10,41,42,83.
Studies of natural populations cannot use these specialized tools, but instead they can directly examine actual evolutionary processes. For example, Gómez and colleagues studied natural selection6,94 and quantitative genetic variation25 of flower shape in Erysimum mediohispanicum, which is an excellent ‘population model’ for floral evolution because its populations contain considerable variation in flower shape, including differences in floral symmetry (see the figure; part a shows an actinomorphic flower and part b shows a zygomorphic flower).
Even greater morphological variation can be found in domesticated species, such as pigeons100 or dogs17,20. In dogs, the amount of cranial shape variation has been shown to be comparable to that across the entire order Carnivora, and many dogs have entirely novel shapes outside the range of wild species17 (see the figure; part c shows the skull of a pug and part d shows the skull of a bull terrier). In some cases, it is possible to follow changes over time and relate them to artificial selection by breeders20.
The results of natural evolution over long timescales can be studied by comparative studies of diversification in groups of related organisms. Various comparative methods are available to extract information on evolutionary changes of shape. Sidlauskas76 reconstructed the evolution of head shape in a group of characid fishes to identify factors involved in their diversification (see the figure; part e shows Synaptolaemus cingulatus and part f shows Hypomasticus julii).
By combining study designs and databases, investigators can set up approaches for addressing a wide range of evo-devo questions.
Images in parts a and b courtesy of J. M. Gómez, Universidad de Granada, Spain. Images in parts c and d courtesy of A. G. Drake, College of the Holy Cross, USA. Images in parts e and f courtesy of M. Sabaj Pérez, Academy of Natural Sciences of Philadelphia, USA.
c
e
d
f
Nature Reviews | Genetics
a b
Vital stainingStaining of live organisms to follow developmental processes (for example, calcium-binding stains, such as Alizarin Red and Calcein, label bone tissue and, if administered at different times, can indicate bone growth).
or the lengths of primate limb elements8. other traits are inherently more complex and cannot be characterized sufficiently by their size alone. For these traits, analyses also should consider information about shape, which concerns the proportions and relative positions of parts.
Extracting shape information. Shape is mathematically defined as all of the geometric features of an object except its size, position and orientation9. This definition may sound somewhat abstract, but it is the same defini-tion that we intuitively use when we view a photograph:
R E V I E W S
624 | SEpTEMbER 2010 | voluME 11 www.nature.com/reviews/genetics
© 20 Macmillan Publishers Limited. All rights reserved10
Shape spaceA special type of morphospace in which each point represents a shape and the distances between points correspond to the amount of shape change between the respective shapes.
Principal component analysisA multivariate analysis that provides a new coordinate system whose axes, the principal components, successively account for the maximum amount of variance and are uncorrelated with each other.
Canonical variate analysisA multivariate analysis that finds new shape variables that maximize the separation between groups (such as species or genotypes) relative to the variation within groups.
Multivariate regressionA type of analysis in which variation in one set of variables, the dependent variables, is predicted or explained by variation in one or more other variables, the independent variables.
Partial least squares analysisA multivariate analysis that aims to find the optimal variables for showing patterns of covariation (for example, in studies of integration). The analysis looks for new variables that maximize covariation between two sets of variables (for example, between the shapes of two anatomical structures).
ConstraintThe tendency for evolutionary change to occur in some directions of a morphospace more than in other directions.
we routinely ignore information about size, position and orientation (we can easily recognize the Eiffel Tower on a small picture, even if we are far from paris when looking at it or we are holding the picture upside down).
To apply this definition, investigators collect data that represent biological forms as length measurements, the arrangement of morphological landmarks9 or the entire outlines10,11 or surfaces12 of the specimens. The most widely used approach in current morphometrics is to rep-resent organismal forms by landmarks, and this Review will therefore focus mostly on methods related to them. landmarks are points that can be located precisely on all forms and establish a clear one-to-one correspondence between all specimens included in a study. For example, in the human face, the tip of the nose or the corners of the mouth are possible landmarks. landmarks are cho-sen to cover the entire structure under study in suffi-cient anatomical detail, but the number and distribution of landmarks are often limited in practice.
For some structures, landmarks are sparse or una-vailable over extensive regions because there are few anatomical features that can be used for defining land-marks (for example, the surface of the cranial vault in humans). In such situations, many studies have added semi-landmarks: points on an outline or surface that can be slid along the outline or surface to correspond-ing locations according to some criterion (for example, the semi-landmarks could be regularly spaced points11 or be distributed to minimize localized deformations13). Different criteria for sliding semi-landmarks make different implicit assumptions about the changes in the tissue between landmarks. using different criteria can influence the results of morphometric studies14 and therefore the results of such analyses need to be interpreted with some caution15.
To extract the shape information from the positions of landmarks, the extraneous variation of size, position and orientation is removed in a procedure called the procrustes superimposition9 (BOX 2). The coordinates of landmarks aligned by this procedure exclusively contain shape variation. All possible shapes for any given number of landmarks define a shape space: a multidimensional, nonlinear space in which each point represents a differ-ent shape, and of which the procrustes-aligned shapes in a sample provide a local approximation9 (BOX 2). Morphometric studies address specific biological ques-tions by examining the variation in this shape space with the methods of multivariate statistical analysis.
Multivariate analysis. Shape variation is inherently mul-tidimensional because even simple shapes can vary in many different ways. Accordingly, analyses should use multivariate methods that simultaneously consider the covariation of all landmark coordinates16.
A variety of multivariate methods are available for answering specific questions9. Most of them find new variables, corresponding to directions in shape space, which optimize criteria related to the question of inter-est. For instance, principal component analysis can be used for examining the main patterns of variation in the data11,17, canonical variate analysis provides the best
separation of known groups18, multivariate regression can be used for analysing allometry or evolutionary change in shape over time19,20 and partial least squares analysis can be used to examine covariation of shapes21,22. A wide range of additional multivariate methods exist, some of which have been specifically devised for morphometric applications.
Visualization. Geometric morphometrics differs from other applications of multivariate statistics in that most results from the analyses can be visualized as shape changes and interpreted anatomically. Every possible shape corresponds to a point in the shape space and, conversely, every direction in shape space corresponds to a specific shape change, which can be shown graphi-cally by relative shifts of landmarks or by deforma-tions of outline diagrams (BOX 2) or three-dimensional surface models12,17.
Interpretations of shape changes need to take into account that the displacements of landmarks are inher-ently relative to each other. It is important to realize that landmarks are not ‘moving’ independently but are ‘pushed’ or ‘pulled’ around by changes in the tissues in which they are embedded.
Morphometric analyses tend to answer biological questions by going back and forth between abstract representations of variation as a scatter of data points in the shape space and the concrete anatomical changes associated with specific directions.
Genetic and epigenetic control of shapeThe degree to which genetic and environmental factors influence the development of morphological traits is the subject of a long-standing debate in biology. In particu-lar, a central question for evo-devo is how development translates genomic variation into the shape variation that is available for evolution by selection or drift.
Quantifying total genetic variation. To assess how much of shape variation has a genetic basis, a range of approaches from quantitative genetics can be used23. If breeding experiments can be performed or pedigree information is available, genetic variances and cov-ariances among shape variables can be estimated and assembled in a matrix, called the G matrix. This matrix characterizes the genetic component of shape variation in the population, integrating effects of loci throughout the entire genome. This has been done for a wide range of organisms, including laboratory mice24 and samples from natural populations of plants25, insects26,27, turtles28 and even humans29.
using estimated G matrices, it is possible to predict the response to selection for specific shape features — that is, the shape change between the generations before and after selection. For most examples, the directions of predicted responses are deflected substantially from the direction of the original selection24,27,29. In other words, for selection on some particular feature of shape, there is also a response in other aspects of shape that were not originally selected for. These results indicate that genetic constraints on evolution of shape may be widespread30.
R E V I E W S
nATuRE REvIEWS | Genetics voluME 11 | SEpTEMbER 2010 | 625
© 20 Macmillan Publishers Limited. All rights reserved10

Quantitative trait lociGenes or small genomic regions that affect a phenotypic trait of interest.
Specific loci affecting shape. A different strategy is to esti-mate the effects of individual genes or specific genomic regions on shape. For example, genetic marker informa-tion can be used for mapping quantitative trait loci (QTls) that affect shape in experimental populations derived from interspecific or interpopulation crosses11,31–34, from crosses of laboratory strains after artificial selection35–37 or
from variation in natural populations38. An alternative is to use panels of controlled genotypes carrying mutations39–43 or chromosomal deficiencies44 to pinpoint effects on shape. Analyses identifying gene effects on shape require specific multivariate methods, but in return they provide unique information about the developmental basis and evolutionary implications of genetic variation (BOX 3).
Nature Reviews | Genetics
Original configurations
Scaling to the same size
Translation to the same location
Rotation to optimal fit
Box 2 | Extracting shape information: the core of geometric morphometrics
Most morphometric analyses in evolutionary developmental biology (‘evo-devo’)4 and other areas of biology use information from configurations of landmarks. Because shape is defined as the geometric attributes of an object except for size, position and orientation, information about shape variation can be obtained by removing this extra information in a procedure called the Procrustes superimposition9.
The Procrustes superimposition starts with the configurations of landmark coordinates, as they were measured, and successively removes variation in size, position and orientation (see the figure). The procedure starts by scaling configurations to a standard size and moving them to a standard position. Size is quantified as centroid size, which is computed as the square root of the sum of squared distances of the landmarks from the centre of gravity of a configuration. To remove variation in position, all configurations are translated so that their centres of gravity are at the origin of the coordinate system. Finally, configurations are rotated about this common centre of gravity to bring all configurations into an optimal orientation in which the sum of squared deviations between corresponding landmarks is minimal.
The variation in the landmark coordinates after the Procrustes superimposition (for example, the bottom diagram in the figure) is the variation in shape. These coordinates can therefore be used in subsequent analyses. Because this variation concerns the relative displacements of landmarks to each other in many directions, it is important to use multivariate methods16 (analyses of individual landmarks or even coordinates ignore the correlations between them).
Shape variation can be characterized in shape spaces. A shape space represents all possible shapes for a given number of landmarks by points, so the distances between points represent the similarities between the corresponding shapes. Accordingly, shape changes are associated with distances and directions in the shape space16. Shape spaces are complex, non-Euclidean spaces: for instance, for the simplest shapes, triangles, the shape space is the surface of a sphere9. For a limited range of shapes, the Procrustes superimposition provides a local approximation of the positions in shape space9. This approximation is satisfactory even for large scales of biological variation95, as it might be encountered in studies of large-scale evolutionary diversification17,76 or through development41,83. The resulting shape data can be used for analyses with the usual tools of multivariate statistics.
Shape changes can be visualized so that the results of statistical analyses can be interpreted anatomically. For instance, morphing techniques such as the thin-plate spline9 can interpolate shape changes from the landmarks to rectangular grids or entire outline drawings representing the specimens (see the figure). The deformations of the grids or drawings then show the shape changes from comparisons between species or from the results of statistical analyses.
R E V I E W S
626 | SEpTEMbER 2010 | voluME 11 www.nature.com/reviews/genetics
© 20 Macmillan Publishers Limited. All rights reserved10

Nature Reviews | Genetics
AA
BB
AB
d
a
a
Direction of selection
Box 3 | Quantifying gene effects on shape
Because shape variation is inherently multidimensional, gene effects have not just magnitudes but also directions. Unless most of the shape variation is concentrated in a single dimension of the shape space31, it is likely that focusing on individual principal components34,38 or landmark coordinates33 for genetic analysis will miss interesting information. Therefore, fully multivariate methods are required for estimating genetic parameters11,24,32,35,36. These analyses provide a wealth of information about patterns of genetic effects.
integration of genetic effectsBecause multivariate estimates describe genetic effects as the joint effect on multiple aspects of shape, they are suitable for the study of pleiotropy as a genetic basis for integration. Several studies have shown the integration of quantitative trait locus (QTL) effects within structures32,36,37 and joint effects of QTLs on different anatomical structures34.
Patterns of total genetic integration, as they are seen in genetic covariance matrices (G matrices), are the composite of the effects of all QTLs that influence shape variation. Although many studies have examined the genetic architecture of shape in various organisms11,31–44, limitations of statistical power and genetic resolution have so far prevented a comprehensive analysis how individual QTLs contribute to the overall patterns of shape variation in the G matrix.
QtL effects and dominanceMultivariate QTL studies have found that the vectors of additive and dominance effects tend not to be colinear but point in different directions of shape space35,37,101 (vectors a and d in the figure). This means that the phenotype of a heterozygous individual tends not to be on the midpoint between the two homozygotes, but is different from both of them in some aspect of shape: the average shapes for the three genotypes form a triangle in shape space (AA, AB and BB in the figure).
This means that the combination of two different alleles has a developmental effect that is distinct from both homozygous genotypes for the corresponding alleles. Therefore, the combination of alleles at a locus does not just determine whether there is more or less of the same developmental activity; there also seems to be an interaction among alleles that alters the developmental outcome qualitatively. This type of interaction may provide useful information about the regulation of developmentally relevant genes.
That the two homozygotes and the heterozygote form a triangle in shape space also has an evolutionary consequence. It implies overdominance of shape for a range of directions in shape space (blue sector in the figure, limited by directions perpendicular to the lines connecting AB to AA and BB). If directional selection acts in these directions (heavy arrow in the figure), the fitness of AB is higher than that of both homozygotes and balanced polymorphism may result35,101,102. This multivariate view of genetic effects provides a new perspective on the maintenance of variation under selection that is applicable not just to shape but to multidimensional traits in general.
Such studies, despite limitations of statistical power, consistently reveal multiple loci that affect shape, suggest-ing that shape is influenced by many genes distributed throughout the genome. likewise, the genetic control of variability around the average shape of a genotype seems to be influenced by many genes39,44. These results are consistent with theoretical studies that have modelled phenotypic variation as an outcome of nonlinear dynam-ics of developmental processes45 or, more specifically, the processes of regulation of developmental genes46.
Genetic and epigenetic effects. Shape variation may originate directly from genetic changes in developmental processes that build morphological structures, or it may be mediated by epigenetic effects47–49. Epigenetic effects are defined as the developmental interactions among cells, tissues and their environments47,49. This definition follows Waddington’s original concept of epi-genetics49 and includes a wide range of developmental mechanisms (it thus differs from the more recent redefi-nition of the term that focuses on chromatin modifica-tion). Epigenetic interactions can translate a localized
developmental change into integrated and widespread morphological variation50. because of their role in trans-mitting genetic effects, epigenetic interactions are crucial for understanding how genetic variation is expressed and integrated among traits50,51 (BOX 4).
For instance, the shape of bones is influenced by the mechanical forces they experience during development48. The mandible shape of mice was significantly affected both by hard or soft food and by a mutation causing muscular dystrophy10. both treatments reduced epi-genetic effects on mandible growth under mechanical loading, one by environmental manipulation and the other by genetic means. Similarly, the discovery that localized defects in human craniofacial development are associated with widespread changes in skull and brain shape18,52 suggests a developmental association.
The key importance of epigenetic effects in evo-devo is in shaping the patterns of integration in morphological structures via interactions among developmental processes50,51. Epigenetic effects are also of key impor-tance in that they provide flexibility in developmental programmes, such as in phenotypic plasticity.
R E V I E W S
nATuRE REvIEWS | Genetics voluME 11 | SEpTEMbER 2010 | 627
© 20 Macmillan Publishers Limited. All rights reserved10

Box 4 | Inferring developmental interactions from morphological data
Morphological integration between traits can originate in different ways68. Covariation between traits can result from a direct interaction between the developmental pathways (for example, signalling between tissues) that generate the traits50; this can be regarded as an epigenetic interaction. Alternatively there can be parallel variation in separate developmental pathways without an actual interaction between them — for example, two separate developmental processes could be affected by the same environmental stimulus or allelic variation for a gene could be involved in both processes68. In addition to the developmental differences, the two modes of integration may also differ in their evolutionary implications68.
A useful and practical way to distinguish the two origins of integration is to examine the covariation between the fluctuating asymmetries of the two traits. Because the deviations between the left and right sides, which are the focus of fluctuating asymmetry, are produced by random perturbations in the development of the traits103, there will be no covariation between the asymmetries of two traits unless the developmental perturbations are transmitted between traits by epigenetic interactions. Moreover, because the left and right sides of an individual share the same genome and very nearly the same environmental conditions, there is no basis for covariation of traits by parallel variation (note that this latter condition does not apply to plants and sessile animals). The covariation of the asymmetries of different traits is therefore due to direct interactions of the respective developmental pathways, and not parallel variation68.
This reasoning has been applied to a wide range of traits and organisms, including the wings of flies44,62 and crickets27, the mandibles of rodents62,63,71 and shrews70, vole teeth21, and the skulls of newts65 and of various mammals17,72. In many of these studies, the patterns of fluctuating asymmetry and of variation among individuals are similar, so it is plausible that direct interactions of developmental pathways also mediate the expression of variation from environmental or genetic sources. In other examples, however, marked discrepancies in the patterns of integration were found69,72.
A different approach to uncovering developmental interactions is to use organisms with alterations of specific developmental processes caused by, for example, mutations of developmental genes, and to record the effects on shape41,50. If localized developmental changes result in widespread morphological changes, they are interpreted as consequences of developmental interactions. The crux of this approach is to assure that the initial developmental effect of the mutant is indeed localized to exclude the possibility that the gene of interest has parallel effects on multiple developmental pathways that do not interact. Genetic mosaic analysis may be a promising approach to address this issue.
Fluctuating asymmetrySubtle deviations between paired structures on the left and right body sides due to random perturbations of developmental processes.
ModulesParts of biological systems tend to be organized into clusters, or modules, which consist of parts that are integrated tightly by many or strong interactions and which are relatively independent from other modules because there are fewer or weaker interactions between them.
Phenotypic plasticity and developmental instability. The non-genetic component of variation is not just a ‘residual’ but is itself of interest in evo-devo. phenotypic plasticity, the component of variation induced by environmental effects, can be of key evolutionary importance53,54 and even the random component of developmental instability can provide information on developmental interactions among parts (BOX 4). plasticity is based on epigenetic effects; an environmen-tal stimulus can alter developmental processes so that a difference in the adult shape arises48,53. Environmental stimuli can be physical factors, such as temperature39, or complex stimuli, such as diet55.
Another non-genetic component of variation is developmental instability — that is, the morphological variation arising from random fluctuations in the devel-opmental system. Its link to plasticity is controversial and empirical studies have produced mixed results27,39,44,56–58. It has been used to infer the developmental basis of morphological covariation (BOX 4).
Sensitivity to environmental stimuli or random fluc-tuations can be influenced by genetic variation in a wide range of genes39,44. It is unclear whether specific pathways
involved in buffering of variation (such as chaperone proteins59) have stronger effects on buffering of shape than other genes57,58, or whether buffering and plasticity are generic outcomes of the functioning of developmen-tal systems45,46. because these mechanisms regulate the expression of new phenotypic variation, understanding them is an important challenge for evo-devo.
Morphological integration and modularityWhether genetic or non-genetic variation is the main focus of interest, a central question in evo-devo is how this variation is organized. Traits of organisms do not vary independently but are integrated with each other, reflecting coordination in development, function and evolution51. This integration is usually not homogene-ous, but there are complexes of more tightly integrated traits, called modules, that are relatively independent of one another1,51. Integration and modularity are there-fore closely linked concepts in evo-devo that have been studied in a wide variety of different systems, from intraspecific studies to macroevolutionary analyses across large clades21,22,37,41,51,60–65.
Modularity is found in the organization of biological networks in various different contexts, from gene regu-lation to food webs in ecosystems. Studies of morpho-logical integration and modularity differ from analyses of networks in other contexts because the interactions responsible for integration are not directly observable and instead need to be inferred from the patterns of cov-ariation among traits51. Accordingly, delimiting modules from data on patterns of covariation is a key concern for the evo-devo of shape62.
Defining and delimiting modules. Modules are defined as complexes that are highly integrated internally but are relatively independent of each other. Therefore, the covariation among groups of traits corresponding to modules is expected to be weaker than the covaria-tion among groups made by partitioning traits differ-ently37,62,63. This means that systematic comparison of a partition of traits made according to a hypothesis of modularity to other partitions of traits can be used to test the hypothesis of modularity62. This approach has been used with landmark data in a range of organ-isms17,22,27,41,62,65. As a rule, these studies have found that the strength of covariation varies within a fairly limited range — that is, even if the covariation among mod-ules is weaker than the covariation among arbitrary subsets of landmarks, this difference is not very big. This indicates that morphological modularity is not an all-or-nothing phenomenon but tends to be a matter of degrees63. In other words, modules are not totally independent of each other and they are not completely integrated internally.
Several other approaches for identifying mod-ules from patterns of covariation have also been proposed64,66,67. These include clustering methods64 and various statistical models66,67 that address the relative strengths of integration within and between modules. because of the discrepancies in methods, the results from different analyses can be difficult to compare51.
R E V I E W S
628 | SEpTEMbER 2010 | voluME 11 www.nature.com/reviews/genetics
© 20 Macmillan Publishers Limited. All rights reserved10

Box 5 | Modularity in different contexts
Modularity is a general property of biological systems from molecular interactions to ecosystem function; even if we limit the discussion to morphological traits, modularity occurs in a series of distinct but interrelated contexts51.
Developmental modularityDevelopmental interactions, such as inductive signalling, are not homogeneously distributed but tend to be localized within specific regions (morphogenetic fields; for example, imaginal discs, limb buds or tooth germs). These interactions provide strong integration in these regions, which therefore form modules.
Developmental modularity can be studied in morphological data by examining covariation of fluctuating asymmetry (BOX 4). Because the developmental system expresses variation from other sources (such as genetic or environmental sources), developmental modularity is fundamentally important for these other levels as well.
Genetic modularityGenetic modules are established by genetic covariation among traits. This can be by pleiotropic effects of single loci or by genetic linkage between loci with effects on different parts.
Genetic modularity can be analysed in G matrices or quantitative trait locus (QTL) effects (BOX 3). Covariation by pleiotropy can be due to direct developmental interaction and is therefore related to developmental modularity. In turn, changes in the genetic basis of development can affect developmental modularity.
Functional modularityInteractions among parts that carry out organismal functions produce integration at the functional level. For example, masticatory forces apply to broad regions of the skull and mandible and can influence their growth93. These interactions relate to the biomechanical role of parts — for example, as lever mechanisms or resonators — so parts that contribute to the same functions form functional modules.
Biomechanical studies are needed to identify the interactions of the parts involved in functional modularity. Functional modularity is related to developmental modularity because development affects function through morphological variation, and function in turn can influence development via processes such as bone remodelling in response to mechanical load. There is a connection between functional and genetic modularity through natural selection on functional performance, which moulds genetic variation within populations79.
evolutionary modularityEvolutionary modularity is the result of integrated evolution in distinct complexes of traits. This integration of evolutionary changes may result from coordinated selection or from drift of genetically correlated traits73.
Evolutionary modularity can be inferred from comparative analysis of data from multiple taxa in an evolutionary lineage. It relates to genetic modularity through the effects of genetic constraints on evolutionary change (for example, under random drift, evolutionary modularity is expected to match genetic modularity). It is also linked to functional modularity by the effects of selection on functional performance, which is expected to produce evolutionary change structured according to functional modules.
To establish the relationships among these levels of modularity, more studies will be needed that systematically collect data across multiple levels. Such comparisons have only just begun to be made17,27,60,70.
Modularity has been found in many, but not all, structures that have been studied. In particular, studies of wings in flies62 and crickets27 found strong inte-gration throughout the wing rather than a modular structure. Studies of mammalian mandibles60,62,63,66 and skulls17,64 have tended to show some degree of mod-ularity. Comparative analyses have shown that modu-larity can evolve among related species60,64,66, but there are also features of modularity that are conserved on macroevolutionary timescales17,64.
As a further development of the modularity perspec-tive, Hallgrímsson et al.41 proposed the metaphor of the palimpsest. like reused parchment, on which older writ-ing may not have been erased completely and therefore
might be partly visible under a newer text, several suc-cessive developmental processes can all leave traces in the pattern of covariation among traits. If the patterns of modularity and integration produced by these proc-esses are incongruent, each of the superimposed patterns will obscure other patterns. As a result, even if distinct modularity exists in the developmental processes, it may not be decipherable in the cumulative pattern accrued throughout development and no clear modular structure may emerge in the covariation among traits.
Sources of integration and modularity. Morphological integration can originate from any process that produces joint variation in multiple traits, from within-individual variation to long-term evolution (BOX 5). It is therefore possible to compare patterns of integration and modu-larity at different levels, which can provide insights into evolutionary processes51.
because all genetic or environmental effects on mor-phometric traits are expressed through the develop-mental system that produces the structure under study, the developmental origin of integration and modular-ity is of crucial importance for the evolution of shape68. Accordingly, comparing developmental integration (inferred from integration of asymmetry; BOX 4) to pat-terns of genetic or phenotypic integration is important for assessing the role of developmental processes in determining shape variation. Comparisons have pro-vided mixed results17,27,39,44,56,58,63,69–72 and thus suggest that developmental interactions are major contributors to the total genetic and phenotypic shape variation in populations, but other factors may also contribute to a greater or lesser extent.
The fact that the G matrix characterizes the genetic variation available for evolution by natural selection or neutral drift provides a link from these levels of intra-population variation to the patterns of evolution-ary diversification73. Evolutionary integration can be analysed with comparative methods73,74, which can be applied to shape data in combination with information on the phylogeny of the study group12,17,74–76. Whether the patterns of evolutionary integration agree with those of G matrices in populations provides information about the possible roles of selection and constraints in the evolution of the group.
Constraints. Integration among traits can act as a con-straint on evolution by concentrating variation in some specific directions of the shape space and limiting varia-tion in other directions (FIG. 1). This may be easiest to see for examples that are simple measurements, such as the diameters of eyespots on butterfly wings7 or the lengths of limb bones in primates8. If there is a very strong cor-relation between two measurements, a scatter plot of two such traits will show that most data points fall along a single line. There is much more variation in the direction along the line than perpendicular to it. The stronger the correlation is — that is, the more integrated the traits are — the more extreme is the discrepancy in the amounts of variation in different directions. If genetic variation is concentrated in such a manner, there is a genetic
R E V I E W S
nATuRE REvIEWS | Genetics voluME 11 | SEpTEMbER 2010 | 629
© 20 Macmillan Publishers Limited. All rights reserved10
Nature Reviews | Genetics
ed
b ca
Rela
tive
size
of a
nter
ior e
yesp
ot
Relative size of posterior eyespot
6
4
2
0
–2
–4
–620–2 6–4 4–6
Col
our c
ompo
sitio
n of
eye
spot
4Colour composition of eyespot 6
3
2
1
0
–1
–2
–310–1 3–2 2–3
BG BB
GG GB
LS LL
SS SL
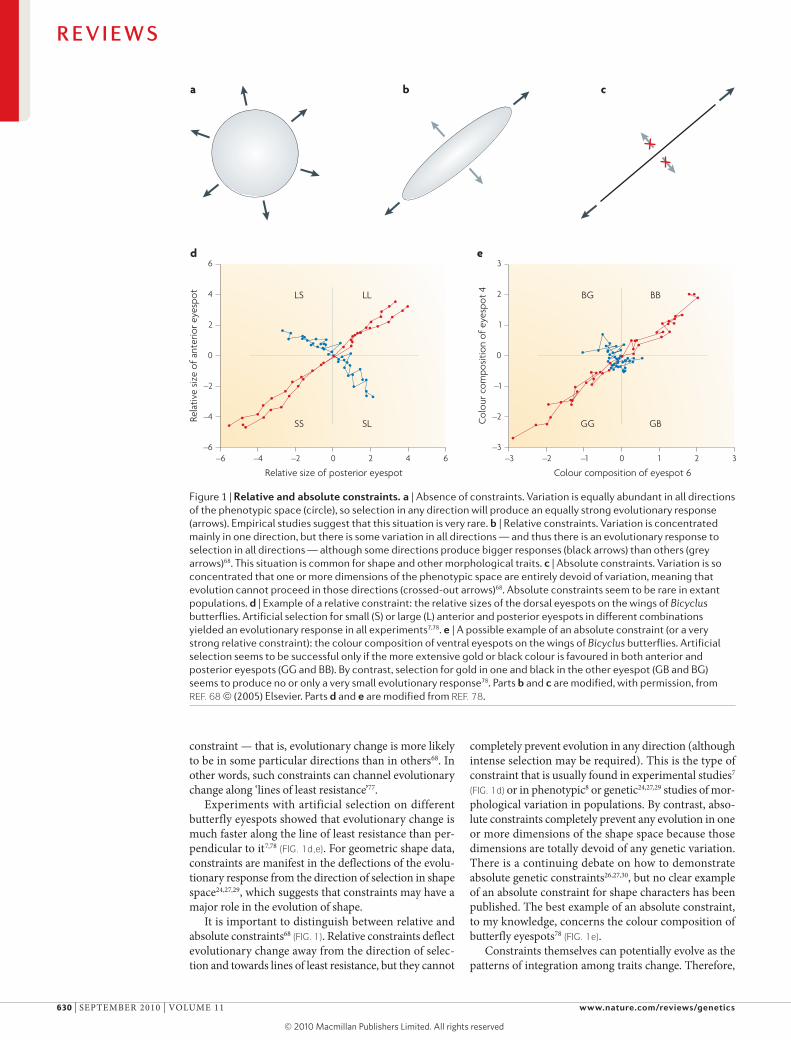
Figure 1 | Relative and absolute constraints. a | Absence of constraints. Variation is equally abundant in all directions of the phenotypic space (circle), so selection in any direction will produce an equally strong evolutionary response (arrows). Empirical studies suggest that this situation is very rare. b | Relative constraints. Variation is concentrated mainly in one direction, but there is some variation in all directions — and thus there is an evolutionary response to selection in all directions — although some directions produce bigger responses (black arrows) than others (grey arrows)68. This situation is common for shape and other morphological traits. c | Absolute constraints. Variation is so concentrated that one or more dimensions of the phenotypic space are entirely devoid of variation, meaning that evolution cannot proceed in those directions (crossed-out arrows)68. Absolute constraints seem to be rare in extant populations. d | Example of a relative constraint: the relative sizes of the dorsal eyespots on the wings of Bicyclus butterflies. Artificial selection for small (S) or large (L) anterior and posterior eyespots in different combinations yielded an evolutionary response in all experiments7,78. e | A possible example of an absolute constraint (or a very strong relative constraint): the colour composition of ventral eyespots on the wings of Bicyclus butterflies. Artificial selection seems to be successful only if the more extensive gold or black colour is favoured in both anterior and posterior eyespots (GG and BB). By contrast, selection for gold in one and black in the other eyespot (GB and BG) seems to produce no or only a very small evolutionary response78. Parts b and c are modified, with permission, from REF. 68 © (2005) Elsevier. Parts d and e are modified from REF. 78.
constraint — that is, evolutionary change is more likely to be in some particular directions than in others68. In other words, such constraints can channel evolutionary change along ‘lines of least resistance’77.
Experiments with artificial selection on different butterfly eyespots showed that evolutionary change is much faster along the line of least resistance than per-pendicular to it7,78 (FIG. 1d,e). For geometric shape data, constraints are manifest in the deflections of the evolu-tionary response from the direction of selection in shape space24,27,29, which suggests that constraints may have a major role in the evolution of shape.
It is important to distinguish between relative and absolute constraints68 (FIG. 1). Relative constraints deflect evolutionary change away from the direction of selec-tion and towards lines of least resistance, but they cannot
completely prevent evolution in any direction (although intense selection may be required). This is the type of constraint that is usually found in experimental studies7 (FIG. 1d) or in phenotypic8 or genetic24,27,29 studies of mor-phological variation in populations. by contrast, abso-lute constraints completely prevent any evolution in one or more dimensions of the shape space because those dimensions are totally devoid of any genetic variation. There is a continuing debate on how to demonstrate absolute genetic constraints26,27,30, but no clear example of an absolute constraint for shape characters has been published. The best example of an absolute constraint, to my knowledge, concerns the colour composition of butterfly eyespots78 (FIG. 1e).
Constraints themselves can potentially evolve as the patterns of integration among traits change. Therefore,
R E V I E W S
630 | SEpTEMbER 2010 | voluME 11 www.nature.com/reviews/genetics
© 20 Macmillan Publishers Limited. All rights reserved10
constraints that affect particular populations or evolu-tionary lineages, even if they are absolute constraints, may be overcome at larger phylogenetic scales. Weakening or loss of a constraint can facilitate evolutionary change. For example, intraspecific integration between fore- and hindlimb elements is weaker in great apes than it is in old or new World monkeys; the fact that great apes show a much greater variation of relative limb lengths than other apes has been interpreted as resulting from the relaxation of an evolutionary constraint8. The ease with which such uncoupling of traits can be achieved by selection depends on the developmental-genetic architecture of the traits68,78.
Much of the discussion on evolutionary constraints in the context of evo-devo has centred on modularity as a way to break constraints1,78,79. If traits under diver-gent selection are organized into different modules, they will be able to evolve towards their respective optima with minimal interference with each other. Accordingly, modularity should increase the potential for evolution-ary change79. Some evidence for this hypothesis has been found80, but there is much scope for further studies.
AllometryAllometry is the dependence of shape on size and tends to be one of the dominant factors of morphological variation, reflecting the abundant variation of size81. As organisms grow, their size and shape change jointly — this is the reason why allometry is tightly linked to development. Even if only adults are considered, there is a link to ontogeny because the size differences among adults reflect variation in the extent of growth they have undergone82.
because size variation affects the entire organism, it is often a strong integrating factor and thus allometry is potentially a strong constraint. Although exceptions exist83, allometries are often nearly straight lines in shape space. Accordingly, allometry can channel evolutionary changes along the corresponding directions. For exam-ple, sex dimorphism has long been related to allometry because the larger sex may be an allometrically scaled-up version of the smaller sex22,84,85.
In geometric morphometrics, allometry is usu-ally analysed by a multivariate regression of shape on size19. Regression fits a straight line to the data points that represent the expected shape for each value of size. The deviations of individual data points from this line — the residuals — represent shape variation that is not explained by size. A correction for the effects of allometry can be done simply by using these residuals from the regression of shape on size in further analyses. because allometry is an integrating factor, other pat-terns, such as modularity, tend to be more apparent after size correction62.
Allometry is not constant but can differ among closely related species84–86. The evolution of allometry can be studied by constructing ‘allometric spaces’ in which taxa are arranged according to the similarity of their allometric patterns86,87. The importance of these analyses for evo-devo is that they reflect evolution-ary change in growth patterns, which in turn may be
related to ecological factors. For example, a comparison of allometries in rodents found that there are distinct groupings according to diet86.
Evo-devo and functionResearch in evo-devo has tended not to emphasize functional aspects of evolution, and has mostly focused on the origin of new variation1,3. but function and adaptive value are essential for fully understanding the evolution of morphological features. Therefore, a ‘func-tional evo-devo’ is needed to bring these considerations into evo-devo88.
Function has been an important aspect in discus-sions of modularity88. because divergent adaptation of traits involved in different functions may be impeded by integration among parts, modularity offers a possible escape from such evolutionary constraints. Accordingly, one might expect developmental systems to evolve so that the patterns of genetic integration and modularity match the patterns of functional interactions among traits79,89. This hypothesis can be tested in systems in which developmental units are not congruent with func-tional units, either because multiple parts of different developmental origins are jointly involved in a single function or because different parts of a developmental unit perform different functions88. There have been few rigorous tests of this hypothesis; of the studies performed so far, some provide support (for example, some stud-ies show that flowers and inflorescences are integrated for accurate pollination90), whereas others are inconsist-ent with the hypothesis (for example, the cricket wing consists of functionally differentiated parts that are not separate modules27).
Many other evo-devo studies have shown clear impli-cations for function. In teeth, for example, development provides great flexibility for shape changes with clear functional implications91. Moreover, if multiple molar teeth are to form an effective grinding surface, their shapes, sizes and positions need to be coordinated by the development of the teeth and the growth processes of the jaws, so the developmental and genetic integra-tion in the molar tooth rows is an important aspect of their function21,36.
Some studies have explicitly included biomechanical aspects to identify morphological features that are relevant for function. For example, the lower jaw of cichlid fish can be viewed as a lever system for open-ing and closing, and simple genetic changes have been shown to produce functionally relevant changes in its development89. Moreover, biomechanical methods can estimate the mechanical strains that result from the use of structures92. Such methods could be used to examine the effects of masticatory forces on facial growth patterns93.
For a full understanding of function, it is neces-sary to know the selection regime for the structure of interest. An excellent example is the plant Erysimum mediohispanicum (BOX 1), in which detailed studies of selection on flower shape were conducted6,94. plants with more zygomorphic flowers attracted more pollinators6. Experiments with artificial flowers of different shapes
R E V I E W S
nATuRE REvIEWS | Genetics voluME 11 | SEpTEMbER 2010 | 631
© 20 Macmillan Publishers Limited. All rights reserved10

Box 6 | Mapping shape data onto phylogenies
To understand the evolution of shape, it is useful to reconstruct the history of shape changes explicitly. Starting from the shape data obtained from extant species and information on the phylogeny of the study group, the primary task is to estimate the shapes at the internal nodes of the phylogeny — that is, the shapes of the hypothetical ancestors in the lineage. A range of methods exist for this purpose, but the method in most widespread use is squared-change parsimony73–75.
Squared-change parsimony minimizes the sum of squared distances in shape space between each node and the nodes to which it is connected by the branches of the phylogenetic tree. This method has a number of properties that makes it useful as an estimate of the ancestral shapes in the phylogeny and is readily integrated in the multivariate context of shape spaces74,75. Inferred ancestral shapes can be visualized directly12,104 or the information on shape changes can be used in further analyses75,76. The method also can be used to study the evolution of shape differences, such as the male–female differences for studies of sexual shape dimorphism85.
An example of this approach is shown in the figure. The coloured dots represent the species averages in the space spanned by the first two principal components of head shape in a group of fishes consisting of two main clades and two outgroup taxa. The black lines represent the branches of the phylogeny based on reconstructions of ancestral shapes by squared-change parsimony. It is evident that clade C has diversified relatively little (red and orange dots), whereas clade A has continually expanded into new regions of morphospace (blue dots).
Squared-change parsimony is also the basis for other analyses concerning the phylogeny of shape, such as testing whether there is a phylogenetic signal in shape data75. If such a signal is present, comparative methods, such as the method of independent contrasts73,74, should be used that take into account the phylogenetic relationship among species.
Comparative methods provide estimates of the patterns of evolutionary changes across the phylogeny of the group under study. For example, these patterns provide information about evolutionary integration and the patterns of covariation of phylogenetic shape changes17. Comparing these patterns of evolutionary integration to patterns of intraspecific variation can provide insights into the mechanisms that produce evolutionary change17,60,61, including the role of genetic constraints that may force evolutionary change to follow ‘lines of least resistance’77. Systematic and large-scale studies have only just begun but are a promising approach for gaining insights into the developmental and genetic basis of morphological change at large phylogenetic scales, which is a central task for studying the evolutionary developmental biology of shape.
Figure is modified, with permission, from REF. 76 © (2008) John Wiley & Sons, Inc.
Nature Reviews | Genetics
Prin
cipa
l com
pone
nt 2
Principal component 1–0.1 0.2–0.2 0 0.1–0.3
0.1
0
0.2
–0.1
–0.2
Clade AAnostomidaeChilodontidae
Clade CCurimatidaeProchilodontidae
OutgroupsHemiodus and Parodon
Squared-change parsimonyA method for inferring ancestral phenotypic values in a phylogeny by minimizing the sum of squared phenotypic changes over all branches of the phylogeny.
Independent contrastsA method that addresses the interdependence in comparative data due to shared ancestry among species by focusing on differences between contrasts of phenotypic values between sister nodes in a phylogeny.
R E V I E W S
632 | SEpTEMbER 2010 | voluME 11 www.nature.com/reviews/genetics
© 20 Macmillan Publishers Limited. All rights reserved10

showed that different pollinators prefer specific shapes and therefore may impose variable selection dep-ending on the composition of pollinator communities94. Together with information on quantitative genetic variation25 and the developmental basis of flower symmetry5, such studies can establish a strong functional context in evo-devo.
MacroevolutionEvo-devo studies have mostly focused on large-scale evolutionary phenomena, such as the conservation of Hox gene clusters or the origin of body plans in animals, whereas morphometric studies have mostly focused on evolution at much smaller scales. An increasing number of studies have investigated shape variation at large scales17,64,76,80,95,96. As phylogenetic trees and comparative methods for shape data74–76 become more widespread, it is becoming more feasible to conduct detailed analyses of morphological diversification based on a reconstructed history of shape change60,75,76.
Filling morphospaces. If shapes are represented as points in a morphospace, evolutionary change is visualized as paths from ancestors to descendants through the mor-phospace. The evolution of a group of organisms appears as a branching tree expanding from the location of the common ancestor in various directions of the space. This information can be obtained by mapping shape data onto a phylogeny (BOX 6).
The patterns of changes in the morphospace can then be interpreted to reconstruct the dynamics of the evo-lutionary process. Major shifts manifest themselves as ‘jumps’ that are candidates for the search for key develop-mental and adaptive changes. Evolutionary trends appear as strings of changes along a particular direction.
Sidlauskas76 reconstructed the evolution of head shape in two lineages of characiform fishes (BOX 1; BOX 6). one of the lineages occupies a compact area of the morphos-pace, whereas the sister lineage diversified substantially along one direction in morphospace that corresponds to a trend associated with the elongation of the quadrate bone and new variation in the orientation of the snout that can be directed up or down. The elongation of the quadrate changed the position of the jaw joint and thus seems to have provided an opportunity for continued morphological diversification into new regions of shape space, resulting in more and more extreme head shapes and adaptation to various new feeding modes76.
patterns in morphospaces can be informative even when no phylogeny is available (meaning that direc-tions of evolutionary changes cannot be inferred). For example, parallel scatters of skull shapes in placental and marsupial groups in morphospace suggest cor-responding evolutionary processes in both groups of mammals97. Such parallelisms of variation may be due to selection and adaptation to corresponding niches (for example, for the mammalian skulls there is an associa-tion with diet97) or a shared constraint, such as allometry. Similarly, analysis of head shape in cichlid fish showed that radiations in different lakes produced parallel adaptations to diet96.
Evolution of developmental systems. The question of how developmental systems evolve is at the core of evo-devo and is a key factor for understanding the evolution of shape. If the developmental system is altered, the con-straints it imposes on the production of new variation may also change, which in turn will modify the dynamics of evolution68. Such a change may well be involved in the diversification of head shape in characiform fishes76.
Some results indicate that the nature of developmental processes is crucial for the evolutionary flexibility of traits. In butterflies, artificial selection can more readily break the size association among the serially homolo-gous eyespots than the association of colour composi-tion among the eyespots78 (FIG. 1d,e), and among related species the relative sizes of eyespots differ more than does the colour composition78. This finding is consistent with a morphogen gradient model78 in which local regulation is more easily achieved for the amount of the signal rather than for the specific nature of the response in the target tissue. Accordingly, changes to developmental processes can overcome some constraints more easily than others.
laboratory studies indicate that mutations in many genes can produce changes in the patterns of shape variation39,41, and QTl studies suggest that many loci affect average shape37,38. These observations imply that there are many targets for evolutionary change that affect shape. It may therefore be somewhat surprising that some key genes have important roles in changes in widely sepa-rate groups of animals. For example, bone morphoge-netic protein 4 and calmodulin have been shown to have important roles in the differentiation of shapes of fish jaws and bird beaks98. The role of key developmental genes, a long-term focus of evo-devo, in the context of polygenic inheritance of shape remains to be fully explored.
ConclusionsThe study of shape has many aspects to offer to the field of evo-devo. Analysis of shape requires an explicitly quantitative approach and therefore provides the power to identify a multitude of subtle effects. Such analyses show that development mediates interactions between many genetic and environmental factors and affects evolution in a dynamic manner.
Modularity and integrating factors, such as allometry, have been identified as important determinants of con-straints on the evolution of shape. but they have also been shown to evolve. Hence the constraints themselves are not constant but can change over evolutionary time: most microevolutionary constraints are dynamic and not static on macroevolutionary timescales. Accordingly, a task for future analyses will be to identify the factors involved in their evolution: is the evolution of allometries and modularity a result of selection on those constraints themselves or is it a by-product of the evolution of the average shapes of taxa?
Functional and ecological considerations are highly relevant to the evolution of shape, and quantitative analy-ses can make these aspects more prominent in evo-devo. As a result, evo-devo will provide a richer picture of the interactions of development with external factors in the process of evolution.
MorphospaceA multidimensional space in which forms of organisms are represented by points, and distances between points correspond to the morphological similarity between forms.
R E V I E W S
nATuRE REvIEWS | Genetics voluME 11 | SEpTEMbER 2010 | 633
© 20 Macmillan Publishers Limited. All rights reserved10

1. Raff, R. A. The Shape of Life: genes, development and the evolution of animal Form (Univ. of Chicago Press, Chicago, 1996).
2. Amundson, R. The Changing Role of the embryo in evolutionary Thought: Roots of evo-devo (Cambridge Univ. Press, 2005).
3. Minelli, A. The development of animal Form: Ontogeny, Morphology and evolution (Cambridge Univ. Press, 2003).
4. Klingenberg, C. P. Morphometrics and the role of the phenotype in studies of the evolution of developmental mechanisms. gene 287, 3–10 (2002).
5. Kim, M. et al. Regulatory genes control a key morphological and ecological trait transferred between species. Science 322, 1116–1119 (2008).
6. Gómez, J. M., Perfectti, F. & Camacho, J. P. M. Natural selection on erysimum mediohispanicum flower shape: insights into the evolution of zygomorphy. am. Nat. 168, 531–545 (2006).This paper pioneered the estimation of natural selection on shape using geometric morphometrics.
7. Beldade, P., Koops, K. & Brakefield, P. M. Developmental constraints versus flexibility in morphological evolution. Nature 416, 844–847 (2002).
8. Young, N. M., Wagner, G. P. & Hallgrímsson, B. Development and the evolvability of human limbs. Proc. Natl acad. Sci. USa 107, 3400–3405 (2010).
9. Dryden, I. L. & Mardia, K. V. Statistical Shape analysis (Wiley, Chichester, 1998).An outstanding mathematical treatment of shape statistics. Although written for a mathematical readership, this book is very clear and an invaluable reference.
10. Renaud, S., Auffray, J.-C. & de la Porte, S. Epigenetic effects on the mouse mandible: common features and discrepancies in remodeling due to muscular dystrophy and response to food consistency. BMC evol. Biol. 10, 28 (2010).
11. Langlade, N. B. et al. Evolution through genetically controlled allometry space. Proc. Natl acad. Sci. USa 102, 10221–10226 (2005).
12. McPeek, M. A., Shen, L., Torrey, J. Z. & Farid, H. The tempo and mode of three-dimensional morphological evolution in male reproductive structure. am. Nat. 171, E158–E178 (2008).
13. Gunz, P., Mitteroecker, P. & Bookstein, F. L. in Modern Morphometrics in Physical anthropology (ed. Slice, D. E.) 73–98 (Kluwer Academic/Plenum, New York, 2005).
14. Perez, S. I., Bernal, V. & Gonzalez, P. N. Differences between sliding semi-landmark methods in geometric morohometrics, with an application to human craniofacial variation. J. anat. 208, 769–784 (2006).
15. Klingenberg, C. P. Novelty and ‘homology-free’ morphometrics: what’s in a name? evol. Biol. 35, 186–190 (2008).
16. Klingenberg, C. P. & Monteiro, L. R. Distances and directions in multidimensional shape spaces: implications for morphometric applications. Syst. Biol. 54, 678–688 (2005).
17. Drake, A. G. & Klingenberg, C. P. Large-scale diversification of skull shape in domestic dogs: disparity and modularity. am. Nat. 175, 289–301 (2010).
18. Weinberg, S. M., Andreasen, N. C. & Nopoulos, P. Three-dimensional morphometric analysis of brain shape in nonsyndromic orofacial clefting. J. anat. 214, 926–936 (2009).
19. Monteiro, L. R. Multivariate regression models and geometric morphometrics: the search for causal factors in the analysis of shape. Syst. Biol. 48, 192–199 (1999).
20. Drake, A. G. & Klingenberg, C. P. The pace of morphological change: historical transformation of skull shape in St. Bernard dogs. Proc. R. Soc. Lond. B 275, 71–76 (2008).
21. Laffont, R., Renvoisé, E., Navarro, N., Alibert, P. & Montuire, S. Morphological modularity and assessment of developmental processes within the vole dental row (Microtus arvalis, Arvicolinae, Rodentia). evol. dev. 11, 302–311 (2009).
22. Bruner, E., Martin-Loeches, M. & Colom, R. Human midsagittal brain shape variation: patterns, allometry and integration. J. anat. 216, 589–599 (2010).
23. Lynch, M. & Walsh, B. genetics and analysis of Quantitative Traits. (Sinauer, Sunderland, Massachusetts, 1998).
24. Klingenberg, C. P. & Leamy, L. J. Quantitative genetics of geometric shape in the mouse mandible. evolution 55, 2342–2352 (2001).A first application of the multivariate theory of evolutionary quantitative genetics to geometric morphometric data.
25. Gómez, J. M., Abdelaziz, M., Muñoz-Pajares, J. & Perfectti, F. Heritability and genetic correlation of corolla shape and size in erysimum mediohispanicum. evolution 63, 1820–1831 (2009).
26. Mezey, J. G. & Houle, D. The dimensionality of genetic variation for wing shape in drosophila melanogaster. evolution 59, 1027–1038 (2005).
27. Klingenberg, C. P., Debat, V. & Roff, D. A. Quantitative genetics of shape in cricket wings: developmental integration in a functional structure. evolution 10 May 2010 (doi:10.1111/j.1558-5646.2010.01030.x).
28. Myers, E. M., Janzen, F. J., Adams, D. C. & Tucker, J. K. Quantitative genetics of plastron shape in slider turtles (Trachemys scripta). evolution 60, 563–572 (2006).
29. Martínez-Abadías, N., Paschetta, C., de Azevedo, S., Esparza, M. & González-José, R. Developmental and genetic constraints on neurocranial globularity: insights from analyses of deformed skulls and quantitative genetics. evol. Biol. 36, 37–56 (2009).
30. Walsh, B. & Blows, M. W. Abundant genetic variation + strong selection = multivariate genetic constraints: a geometric view of adaptation. annu. Rev. ecol. evol. Syst. 40, 41–59 (2009).
31. Liu, J. et al. Genetic analysis of a morphological shape difference in the male genitalia of drosophila simulans and d. mauritiana. genetics 142, 1129–1145 (1996).A paper that broke new ground by mapping QTLs for shape differences between genitalia of two Drosophila species.
32. Burgio, G., Baylac, M., Heyer, E. & Montagutelli, X. Genetic analysis of skull shape variation and morphological integration in the mouse using interspecific recombinant congenic strains between C57BL/6 and mice of the Mus spretus species. evolution 63, 2668–2686 (2009).
33. Albert, A. Y. K. et al. The genetics of adaptive shape shift in stickleback: pleiotropy and effect size. evolution 62, 76–85 (2008).
34. Feng, X. et al. Evolution of allometry in antirrhinum. Plant Cell 21, 2999–3007 (2009).
35. Klingenberg, C. P., Leamy, L. J., Routman, E. J. & Cheverud, J. M. Genetic architecture of mandible shape in mice: effects of quantitative trait loci analyzed by geometric morphometrics. genetics 157, 785–802 (2001).
36. Workman, M. S., Leamy, L. J., Routman, E. J. & Cheverud, J. M. Analysis of quantitative trait locus effects on the size and shape of mandibular molars in mice. genetics 160, 1573–1586 (2002).
37. Klingenberg, C. P., Leamy, L. J. & Cheverud, J. M. Integration and modularity of quantitative trait locus effects on geometric shape in the mouse mandible. genetics 166, 1909–1921 (2004).
38. Mezey, J. G., Houle, D. & Nuzhdin, S. V. Naturally segregating quantitative trait loci affecting wing shape of drosophila melanogaster. genetics 169, 2101–2113 (2005).
39. Debat, V., Debelle, A. & Dworkin, I. Plasticity, canalization, and developmental stability of the drosophila wing: joint effects of mutations and developmental temperature. evolution 63, 2864–2876 (2009).
40. Bensmihen, S. et al. Mutational spaces for leaf shape and size. HFSP J. 2, 110–120 (2008).
41. Hallgrímsson, B. et al. Deciphering the palimpsest: studying the relationship between morphological integration and phenotypic covariation. evol. Biol. 36, 355–376 (2009).A broad overview on a number of topics concerning morphological integration and its developmental basis.
42. Dworkin, I. & Gibson, G. Epidermal growth factor receptor and transforming growth factor-β signaling contributes to variation for wing shape in drosophila melanogaster. genetics 173, 1417–1431 (2006).
43. Weber, K., Johnson, N., Champlin, D. & Patty, A. Many P-element insertions affect wing shape in drosophila melanogaster. genetics 169, 1461–1475 (2005).
44. Breuker, C. J., Patterson, J. S. & Klingenberg, C. P. A single basis for developmental buffering of drosophila wing shape. PLoS ONe 1, e7 (2006).
45. Klingenberg, C. P. & Nijhout, H. F. Genetics of fluctuating asymmetry: a developmental model of developmental instability. evolution 53, 358–375 (1999).
46. Siegal, M. L. & Bergman, A. Waddington’s canalization revisited: developmental stability and evolution. Proc. Natl acad. Sci. USa 99, 10528–10532 (2002).
47. Müller, G. B. & Olsson, L. in Keywords and Concepts in evolutionary developmental Biology (eds Hall, B. K. & Olson, W. M.) 114–123 (Harvard Univ. Press, Cambridge, Massachusetts, 2003).
48. Young, R. L. & Badyaev, A. V. Evolution of ontogeny: linking epigenetic remodeling and genetic adaptation in skeletal structures. Integr. Comp. Biol. 47, 234–244 (2007).
49. Jamniczky, H. A. et al. Rediscovering Waddington in the post-genomic age. Bioessays 32, 553–558 (2010).
50. Hallgrímsson, B., Lieberman, D. E., Liu, W., Ford-Hutchinson, A. F. & Jirik, F. R. Epigenetic interactions and the structure of phenotypic variation in the cranium. evol. dev. 9, 76–91 (2007).
51. Klingenberg, C. P. Morphological integration and developmental modularity. annu. Rev. ecol. evol. Syst. 39, 115–132 (2008).
52. Richtsmeier, J. T. & DeLeon, V. B. Morphological integration of the skull in craniofacial anomalies. Orthod. Craniofac. Res. 12, 149–158 (2009).
53. Gilbert, S. F. & Epel, D. ecological developmental Biology (Sinauer Associates, Sunderland, Massachusetts, 2008).
54. West-Eberhard, M. J. developmental Plasticity and evolution. (Oxford Univ. Press, New York, 2003).
55. Wund, M. A., Baker, J. A., Clancy, B., Golub, J. L. & Foster, S. A. A test of the ‘flexible stem’ model of evolution: ancestral plasticity, genetic accommodation, and morphological divergence in the threespine stickleback radiation. am. Nat. 172, 449–462 (2008).
56. Debat, V. & David, P. Mapping phenotypes: canalization, plasticity and developmental stability. Trends ecol. evol. 16, 555–561 (2001).
57. Milton, C. C., Huynh, B., Batterham, P., Rutherford, S. L. & Hoffmann, A. A. Quantitative trait symmetry independent of Hsp90 buffering: distinct modes of genetic canalization and developmental stability. Proc. Natl acad. Sci. USa 100, 13396–13401 (2003).
58. Debat, V., Milton, C. C., Rutherford, S., Klingenberg, C. P. & Hoffmann, A. A. Hsp90 and the quantitative variation of wing shape in drosophila melanogaster. evolution 60, 2529–2538 (2006).
59. Rutherford, S. L. Between genotype and phenotype: protein chaperones and evolvability. Nature Rev. genet. 4, 263–274 (2003).
60. Monteiro, L. R. & Nogueira, M. R. Adaptive radiations, ecological specialization, and the evolutionary integration of complex morphological structures. evolution 64, 724–744 (2010).A thorough morphometric analysis of adaptation and evolutionary integration in the mandible across the spectacular diversification of a family of bats.
61. Monteiro, L. R., Bonato, V. & dos Reis, S. F. Evolutionary integration and morphological diversification in complex morphological structures: mandible shape divergence in spiny rats (Rodentia, echimyidae). evol. dev. 7, 429–439 (2005).
62. Klingenberg, C. P. Morphometric integration and modularity in configurations of landmarks: Tools for evaluating a-priori hypotheses. evol. dev. 11, 405–421 (2009).A paper describing existing and new methods for analysing integration and modularity in landmark data.
63. Klingenberg, C. P., Mebus, K. & Auffray, J.-C. Developmental integration in a complex morphological structure: how distinct are the modules in the mouse mandible? evol. dev. 5, 522–531 (2003).
64. Goswami, A. Cranial modularity shifts during mammalian evolution. am. Nat. 168, 270–280 (2006).
65. Ivanovic, A. & Kalezic, M. L. Testing the hypothesis of morphological integration on a skull of a vertebrate with a biphasic life cycle: a case study of the alpine newt. J. exp. Zool. 26 May 2010 (doi:10.1002/jez.b.21358).
66. Márquez, E. J. A statistical framework for testing modularity in multidimensional data. evolution 62, 2688–2708 (2008).
67. Mitteroecker, P. & Bookstein, F. L. The conceptual and statistical relationship between modularity and morphological integration. Syst. Biol. 56, 818–836 (2007).
R E V I E W S
634 | SEpTEMbER 2010 | voluME 11 www.nature.com/reviews/genetics
© 20 Macmillan Publishers Limited. All rights reserved10

68. Klingenberg, C. P. in Variation: a Central Concept in Biology (eds Hallgrímsson, B. & Hall, B. K.) 219–247 (Elsevier, Burlington, Massachusetts, 2005).
69. Debat, V., Alibert, P., David, P., Paradis, E. & Auffray, J.-C. Independence between developmental stability and canalization in the skull of the house mouse. Proc. R. Soc. Lond. B 267, 423–430 (2000).
70. Young, R. L. & Badyaev, A. V. Evolutionary persistence of phenotypic integration: influence of developmental and functional relationships on complex trait evolution. evolution 60, 1291–1299 (2006).
71. Zelditch, M. L., Wood, A. R., Bonett, R. M. & Swiderski, D. L. Modularity of the rodent mandible: integrating bones, muscles, and teeth. evol. dev. 10, 756–768 (2008).
72. Willmore, K. E., Klingenberg, C. P. & Hallgrímsson, B. The relationship between fluctuating asymmetry and environmental variance in rhesus macaque skulls. evolution 59, 898–909 (2005).
73. Felsenstein, J. Inferring Phylogenies (Sinauer Associates, Sunderland, Massachusetts, 2004).
74. Rohlf, F. J. Comparative methods for the analysis of continuous variables: geometric interpretations. evolution 55, 2143–2160 (2001).
75. Klingenberg, C. P. & Gidaszewski, N. A. Testing and quantifying phylogenetic signals and homoplasy in morphometric data. Syst. Biol. 59, 245–261 (2010).
76. Sidlauskas, B. Continuous and arrested morphological diversification in sister clades of characiform fishes: a phylomorphospace approach. evolution 62, 3135–3156 (2008).An innovative application of explicit mapping of shape data onto phylogenetic trees.
77. Schluter, D. Adaptive radiation along genetic lines of least resistance. evolution 50, 1766–1774 (1996).
78. Allen, C. E., Beldade, P., Zwaan, B. J. & Brakefield, P. M. Differences in the selection response of serially repeated color pattern characters: standing variation, development, and evolution. BMC evol. Biol. 8, 94 (2008).An exemplary study using artificial selection to explore constraints on the evolution of morphological traits. The paper also discusses the possible developmental basis of the constraints.
79. Wagner, G. P. & Altenberg, L. Complex adaptations and the evolution of evolvability. evolution 50, 967–976 (1996).
80. Goswami, A. & Polly, P. D. The influence of modularity on cranial morphological disparity in Carnivora and Primates (Mammalia). PLoS ONe 5, e9517 (2010).
81. Klingenberg, C. P. in advances in Morphometrics. (eds Marcus, L. F., Corti, M., Loy, A., Naylor, G. J. P. & Slice, D. E.) 23–49 (Plenum, New York, 1996).
82. Shingleton, A. W., Mirth, C. K. & Bates, P. W. Developmental model of static allometry in holometabolous insects. Proc. R. Soc. Lond. B 275, 1875–1885 (2008).
83. Kimmel, C. B., DeLaurier, A., Ullmann, B., Dowd, J. & McFadden, M. Modes of developmental outgrowth and shaping of a craniofacial bone in zebrafish. PLoS ONe 5, e9475 (2010).
84. Cardini, A. & Elton, S. Variation in guenon skulls (II): sexual dimorphism. J. Hum. evol. 54, 638–647 (2008).
85. Gidaszewski, N. A., Baylac, M. & Klingenberg, C. P. Evolution of sexual dimorphism of wing shape in the drosophila melanogaster subgroup. BMC evol. Biol. 9, 110 (2009).
86. Wilson, L. A. B. & Sánchez-Villagra, M. R. Diversity trends and their ontogenetic basis: an exploration of allometric disparity in rodents. Proc. R. Soc. Lond. B 277, 1227–1234 (2010).
87. Gerber, S., Eble, G. J. & Neige, P. Allometric space and allometric disparity: a developmental perspective in the macroevolutionary analysis of morphological disparity. evolution 62, 1450–1457 (2008).An important study of the evolution of allometry on a large evolutionary scale.
88. Breuker, C. J., Debat, V. & Klingenberg, C. P. Functional evo-devo. Trends ecol. evol. 21, 488–492 (2006).
89. Albertson, R. C., Streelman, J. T., Kocher, T. D. & Yelick, P. C. Integration and evolution of the cichlid mandible: the molecular basis of alternate feeding strategies. Proc. Natl acad. Sci. USa 102, 16287–16292 (2005).
90. Armbruster, W. S., Pélabon, C., Hansen, T. F. & Mulder, C. P. H. in Phenotypic Integration: Studying the ecology and evolution of Complex Phenotypes (eds Pigliucci, M. & Preston, K.) 23–49 (Oxford Univ. Press, New York, 2004).
91. Salazar-Ciudad, I. & Jernvall, J. A computational model of teeth and the developmental origins of morphological variation. Nature 464, 583–586 (2010).
92. Panagiotopoulou, O. Finite element analysis (FEA): applying an engineering method to functional morphology in anthropology and human biology. ann. Hum. Biol. 36, 609–623 (2009).
93. Kupczik, K. et al. Masticatory loading and bone adaptation in the supraorbital torus of developing macaques. am. J. Phys. anthropol. 139, 193–203 (2009).
94. Gómez, J. M. et al. Spatial variation in selection on corolla shape in a generalist plant is promoted by the preference patterns of its local pollinators. Proc. R. Soc. Lond. B 275, 2241–2249 (2008).
95. Marcus, L. F., Hingst-Zaher, E. & Zaher, H. Application of landmark morphometrics to skulls representing the orders of living mammals. Hystrix 11, 27–47 (2000).
96. Cooper, W. J. et al. Bentho-pelagic divergence of cichlid feeding architecture was prodigious and consistent during multiple adaptive radiations within African rift-lakes. PLoS ONe 5, e9551 (2010).
97. Wroe, S. & Milne, N. Convergence and remarkably consistent constraint in the evolution of carnivore skull shape. evolution 61, 1251–1260 (2007).
98. Parsons, K. J. & Albertson, R. C. Roles for Bmp4 and CaM1 in shaping the jaw: evo-devo and beyond. annu. Rev. genet. 43, 369–388 (2009).
99. Jenner, R. A. & Wills, M. A. The choice of model organisms in evo-devo. Nature Rev. genet. 8, 311–319 (2007).
100. Helms, J. A. & Brugmann, S. A. The origins of species-specific facial morphology: the proof is in the pigeon. Integr. Comp. Biol. 47, 338–342 (2007).
101. Kenney-Hunt, J. P. & Cheverud, J. M. Differential dominance of pleiotropic loci for mouse skeletal traits. evolution 63, 1845–1851 (2009).
102. Ehrich, T. H. et al. Pleiotropic effects on mandibular morphology, I. Developmental morphological integration and differential dominance. J. exp. Zool. 296B, 258–279 (2003).
103. Klingenberg, C. P. in developmental Instability: Causes and Consequences (ed. Polak, M.) 14–34 (Oxford Univ. Press, New York, 2003).
104. Astúa, D. Evolution of scapular size and shape in didelphid marsupials (didelphimorphia: didelphidae). evolution 63, 2438–2456 (2009).
AcknowledgementsI thank J. M. Gómez, A. Drake, B. Sidlauskas and M. Sabaj Perez for providing the images in Box 1, and C. Allen and B. Sidlauskas for providing the graphs in Figure 1 and Box 6, respectively. I greatly appreciate the thoughtful comments of three anonymous referees on earlier versions of this article.
Competing interests statementThe author declares no competing financial interests.
FURTHER INFORMATIONChristian Peter Klingenberg’s homepage: http://www.flywings.org.ukMorphometrics at SUNY Stony Brook (includes announcements of meetings and courses, software, a bibliography and a list of researchers): http://life.bio.sunysb.edu/morphMorphometrics.org (includes access to the MORPHMET community mailing list): http://www.morphometrics.org
ALL Links ARe Active in the onLine pDF
R E V I E W S
nATuRE REvIEWS | Genetics voluME 11 | SEpTEMbER 2010 | 635
© 20 Macmillan Publishers Limited. All rights reserved10