Embed Size (px)
Citation preview
Evidence for Relative Position Coding in the Posterior Fusiform
GyrusMark D. Lescroart, Kenneth Hayworth, Irving Biederman
Neuroscience ProgramUniversity of Southern California
Presented at the Society for Neuroscience ConferenceNovember 6, 2007

Relations are easy and fast
“This Way” by Robert Hague
“This Way” by Robert Hague
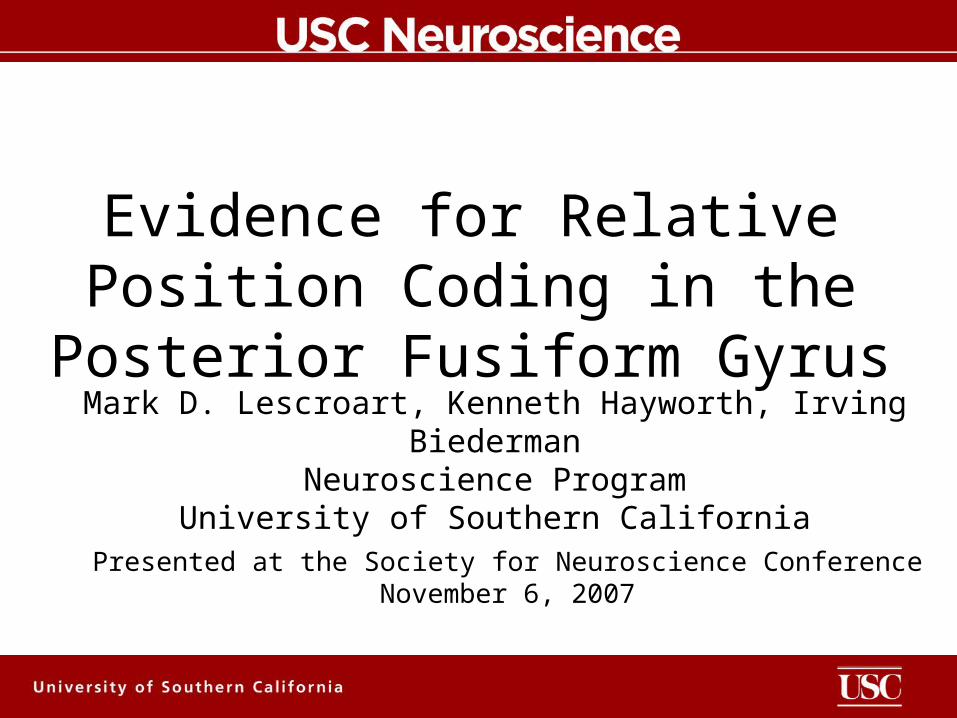
Intro Shape Demo
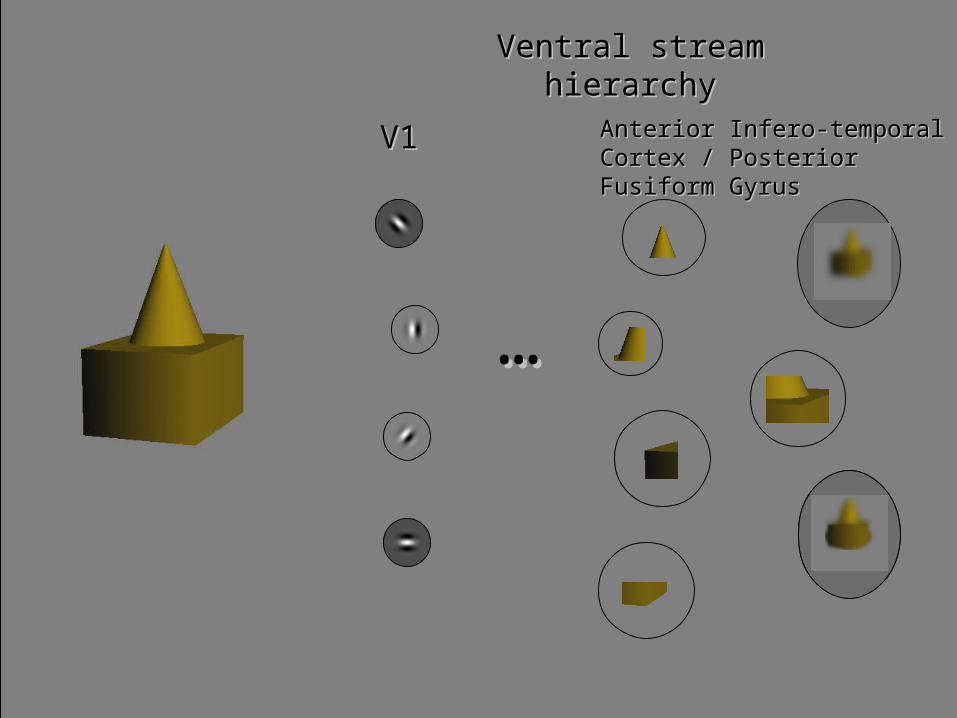
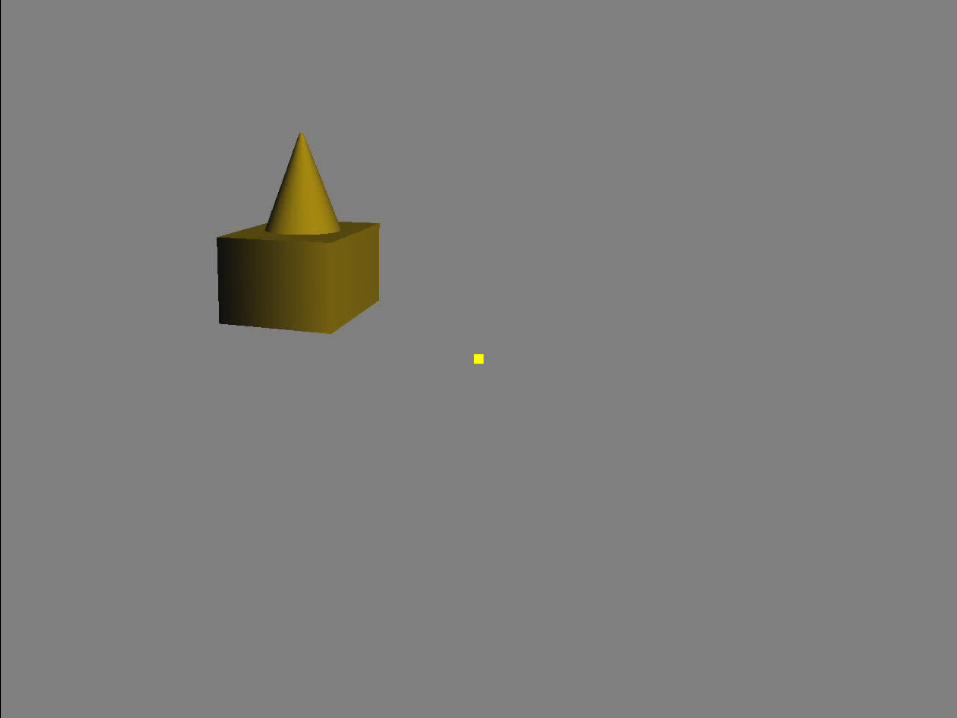
Unlabeled Feature Hierarchy
……
V1V1 Anterior Infero-temporal Cortex / Anterior Infero-temporal Cortex / Posterior Fusiform GyrusPosterior Fusiform Gyrus
Ventral stream hierarchyVentral stream hierarchy

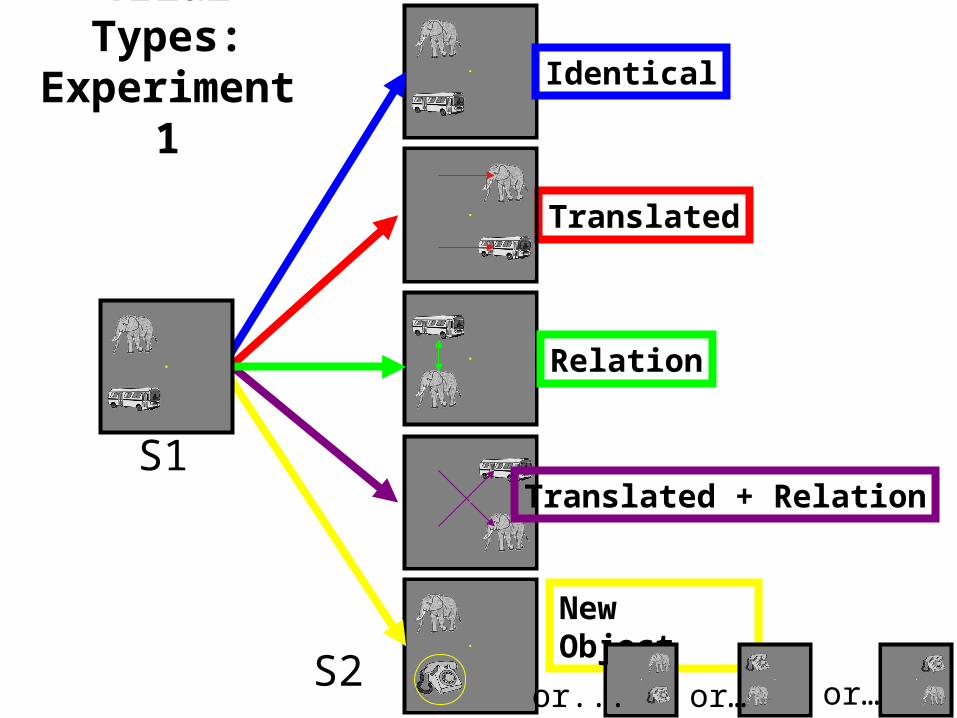
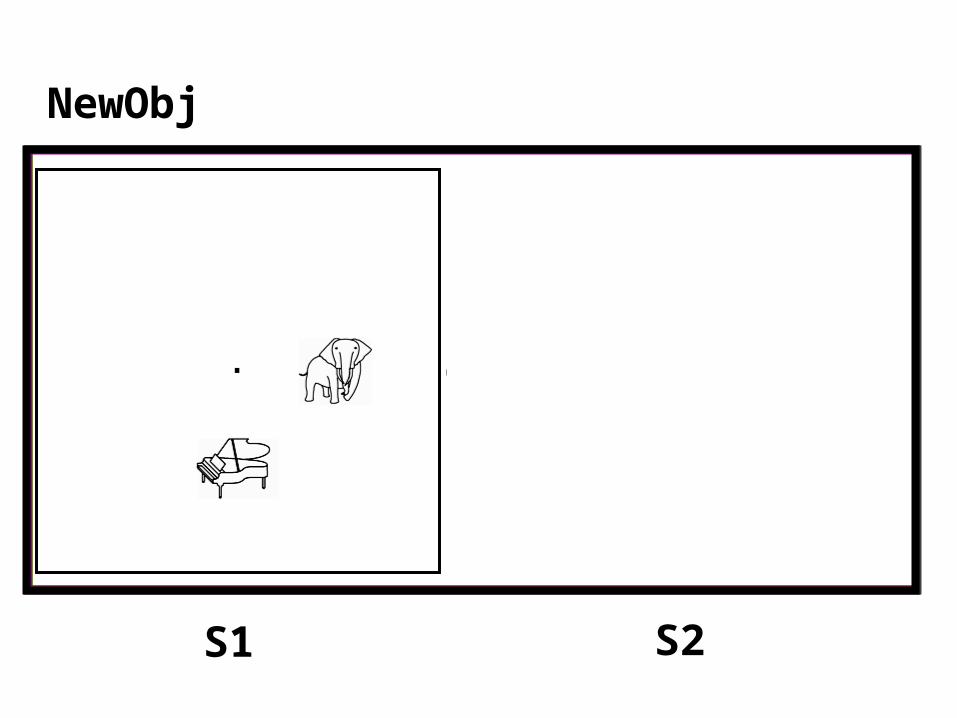
New Object
S1
S2
Identical
Translated
Relation
Translated + Relation
or... or… or…
Trial Types:Experiment 1
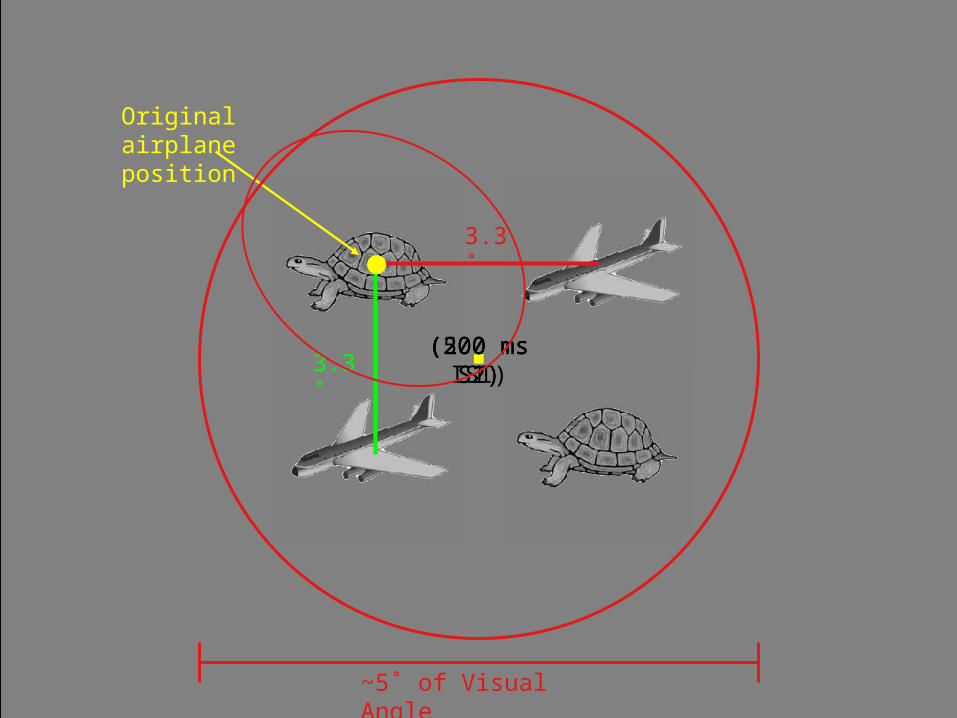
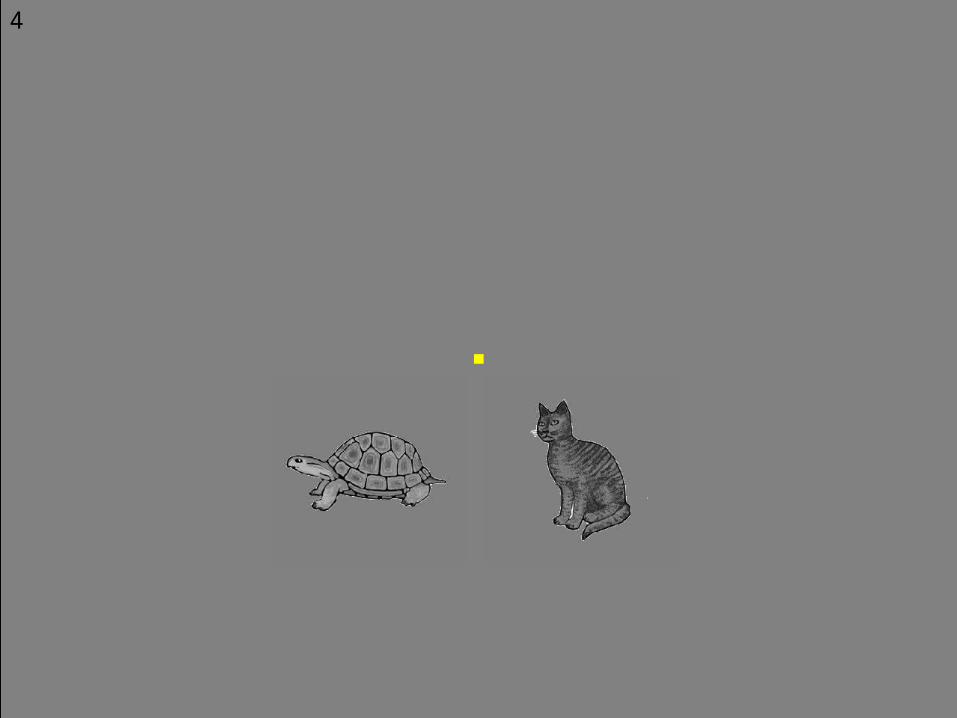
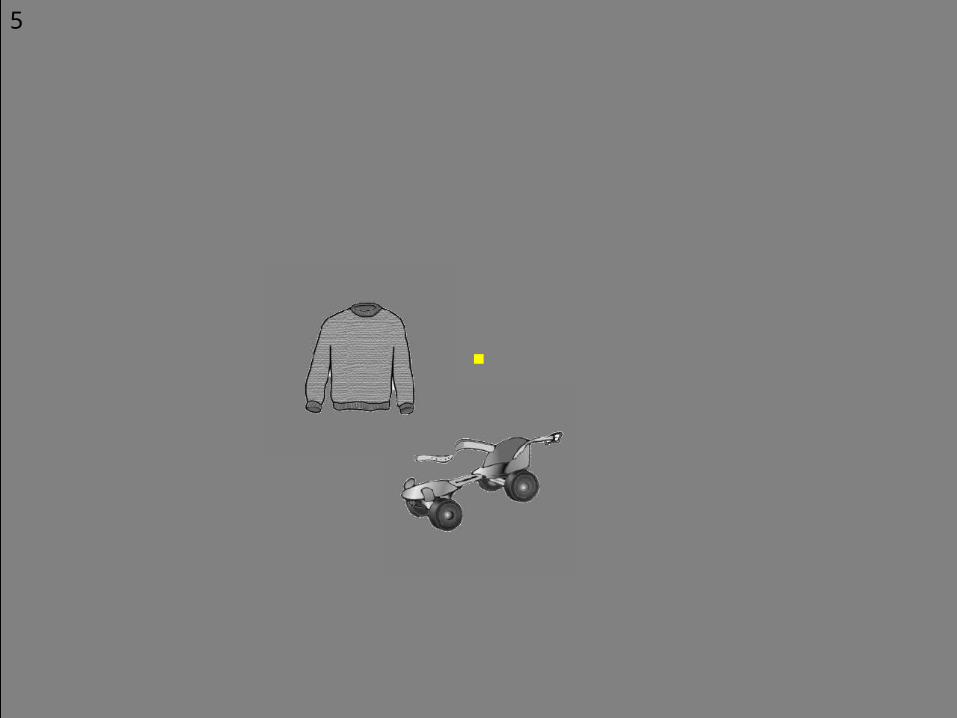
First Trial Demo3.3˚
3.3˚
Original airplane position
(200 ms S1)(200 ms S2)(500 ms ISI)
~5˚ of Visual Angle
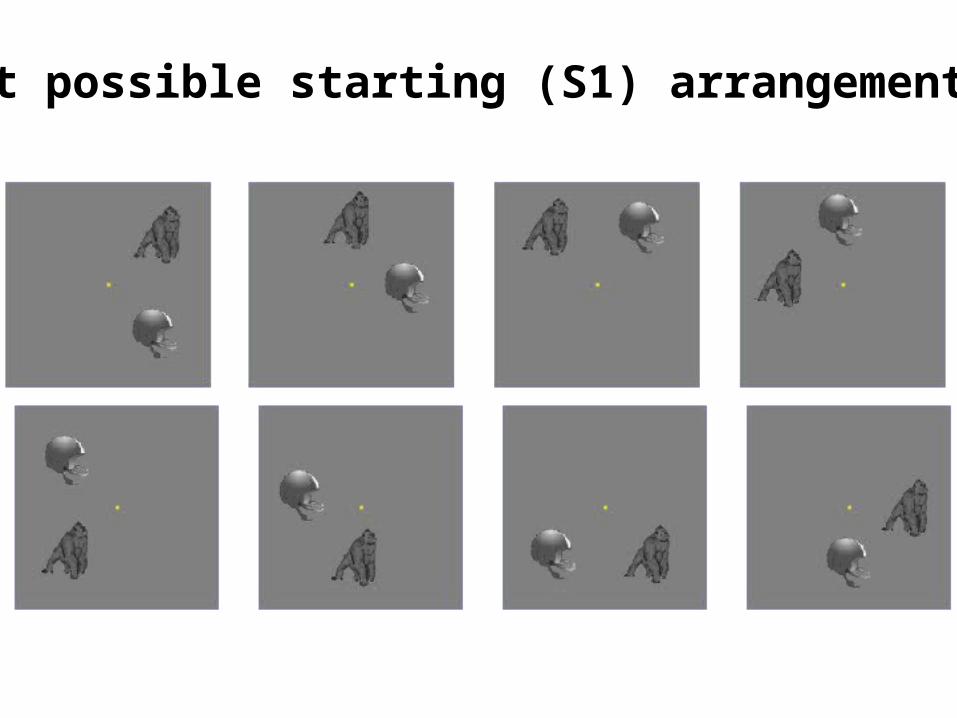
Possible S1 ArrangementsEight possible starting (S1) arrangements:
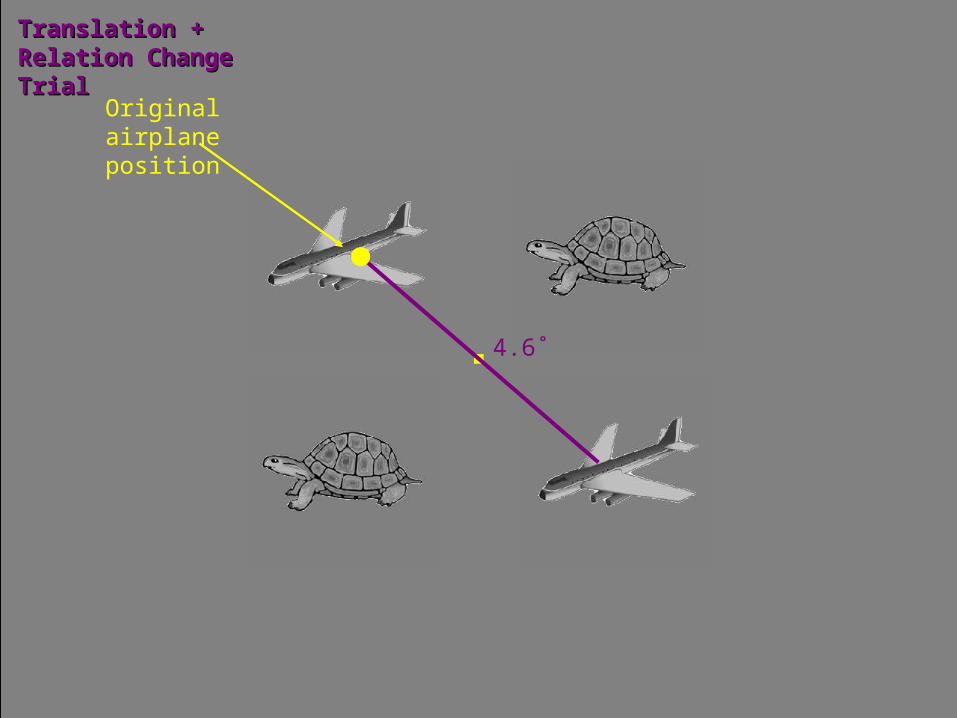
Example Trial - Trans+Rel
Translation + Relation Translation + Relation Change TrialChange Trial
4.6˚
Original airplane position
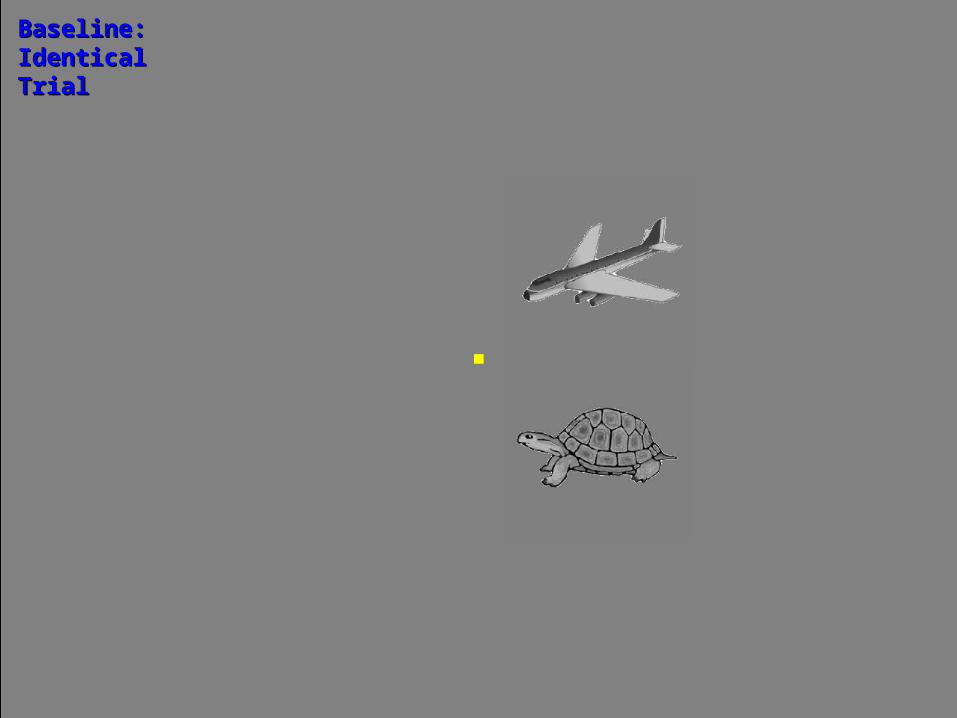
Example Trial - Ident
Baseline: Baseline: Identical TrialIdentical Trial
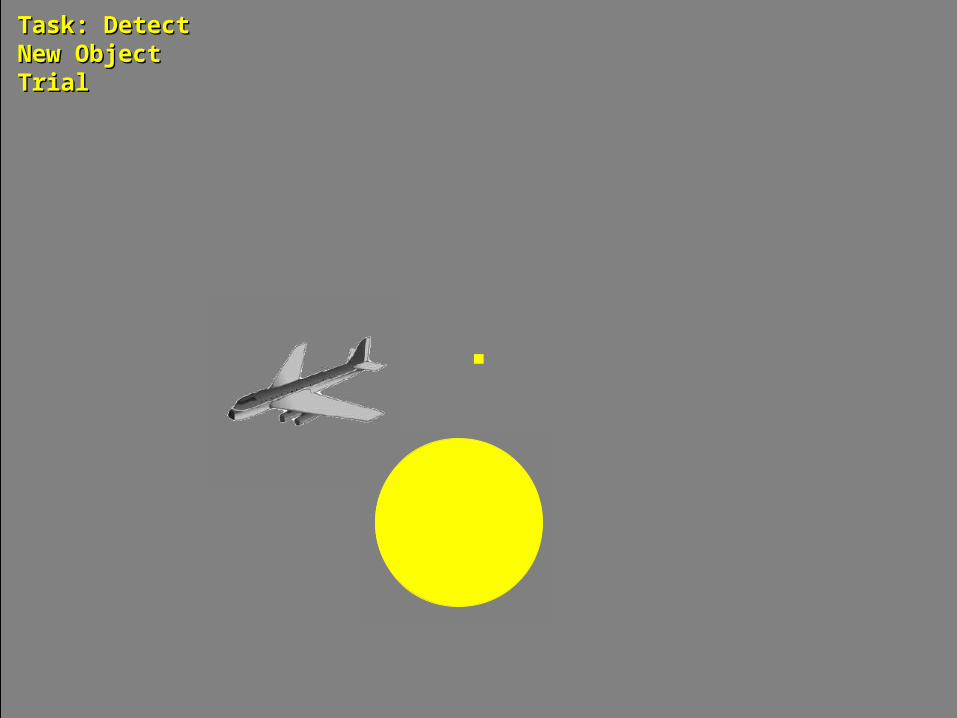
Example Trial - New Object
Task: Detect Task: Detect New Object TrialNew Object Trial
Relation (swap)Relation (swap)
Participation1 - Trans
1
Relation (swap)Relation (swap)
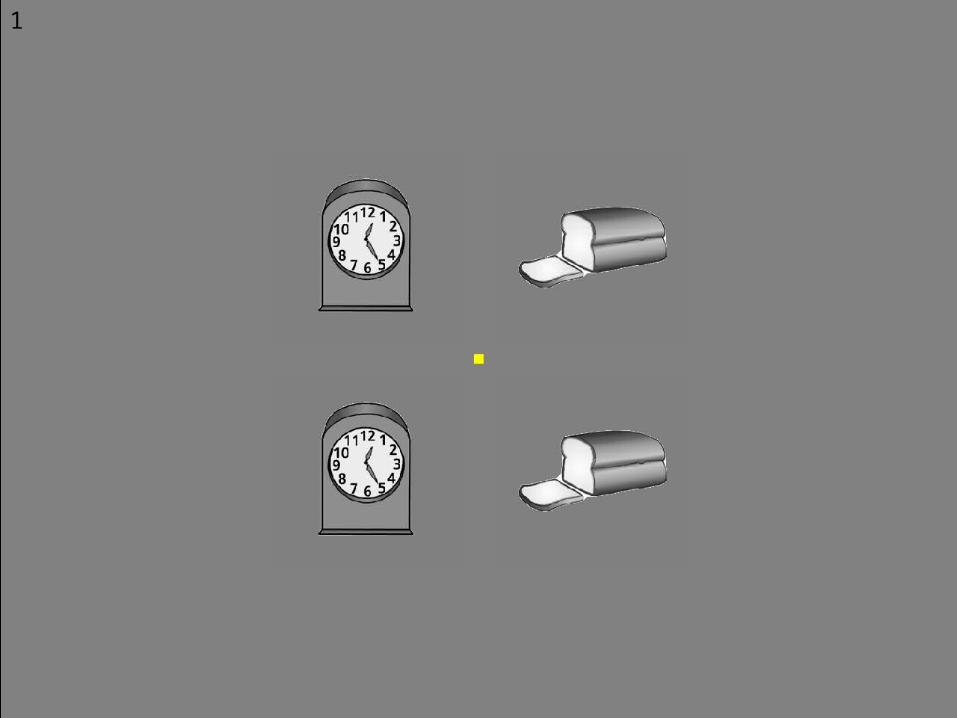
Participation2 - Ident
2
Relation (swap)Relation (swap)
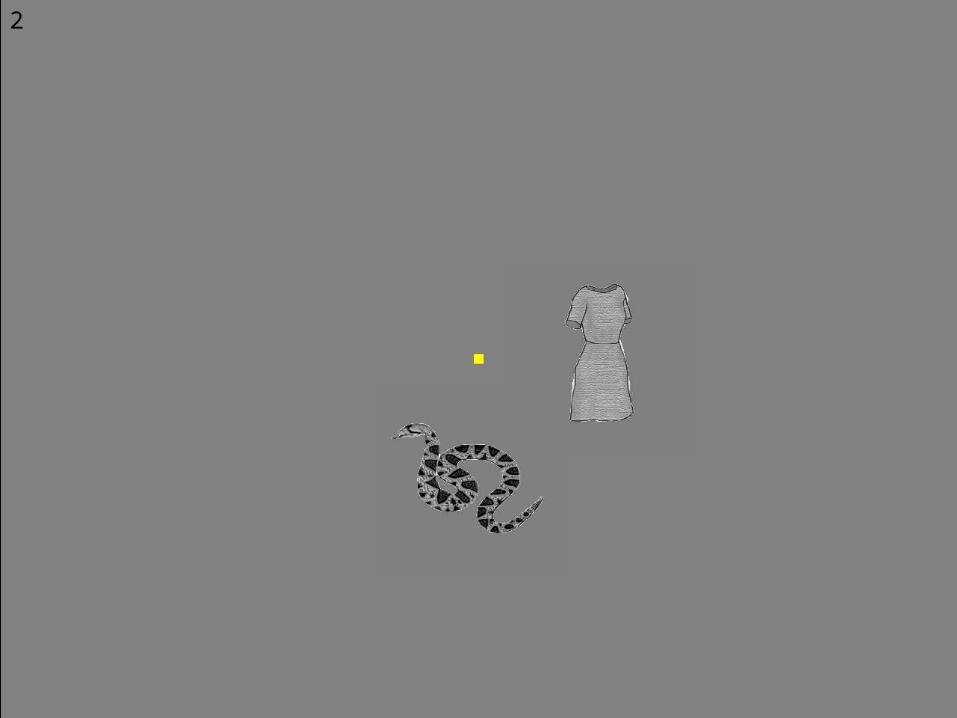
Participation3 - Trans
3
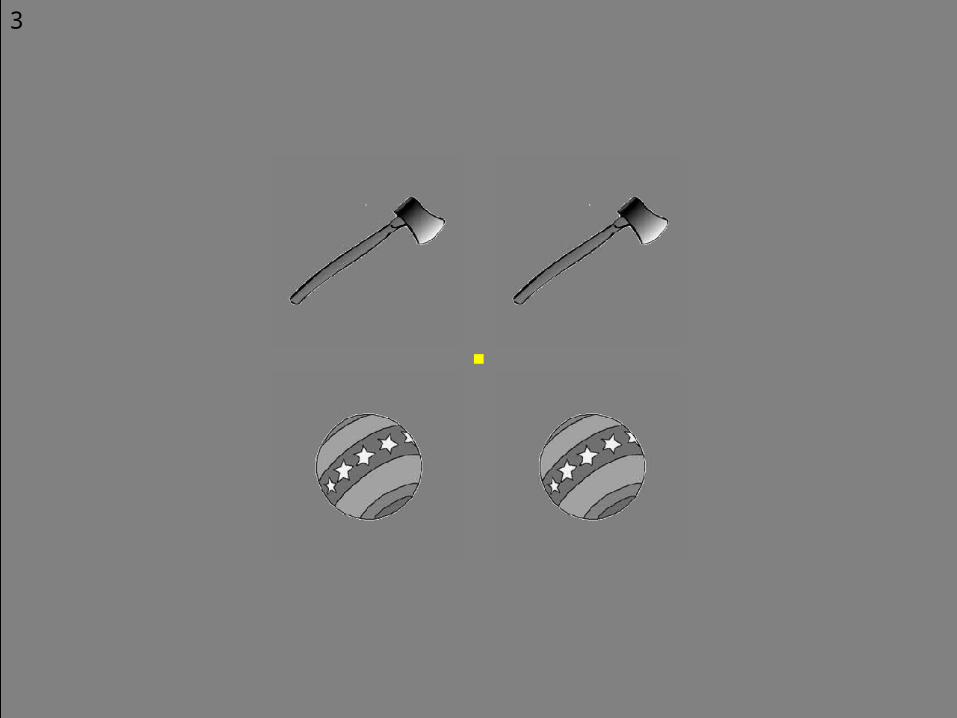
Participation4 - NewObj
4
Relation (swap)Relation (swap)
Participation5 - Rel
5
New Object
S1
S2
Identical
Translated
Relation
Translated + Relation
or... or… or…
Trial Types:Experiment 1
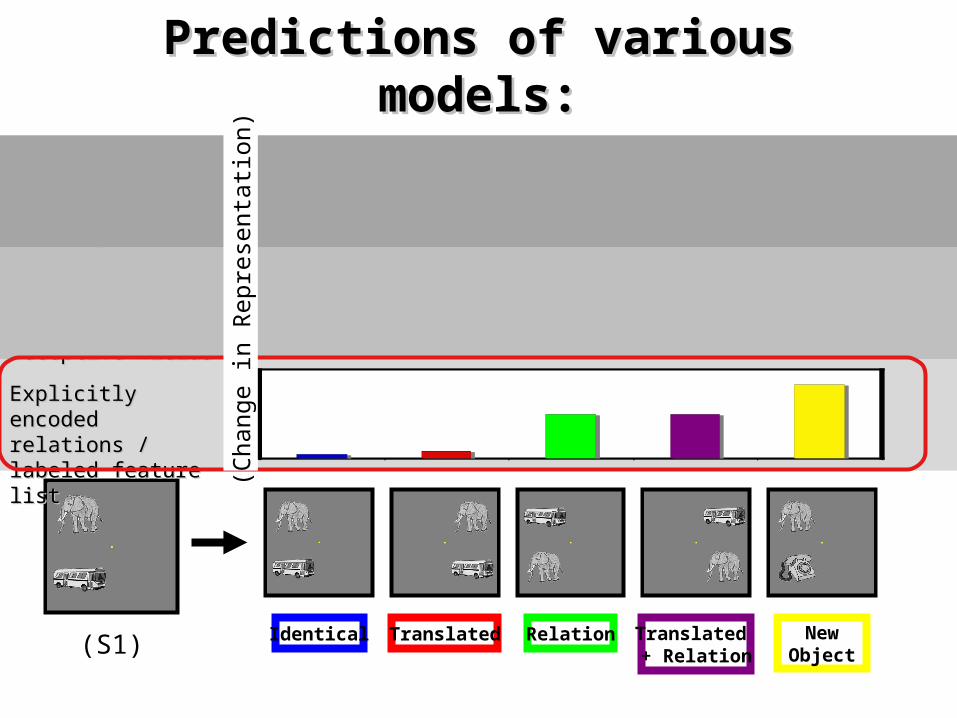
(S1)
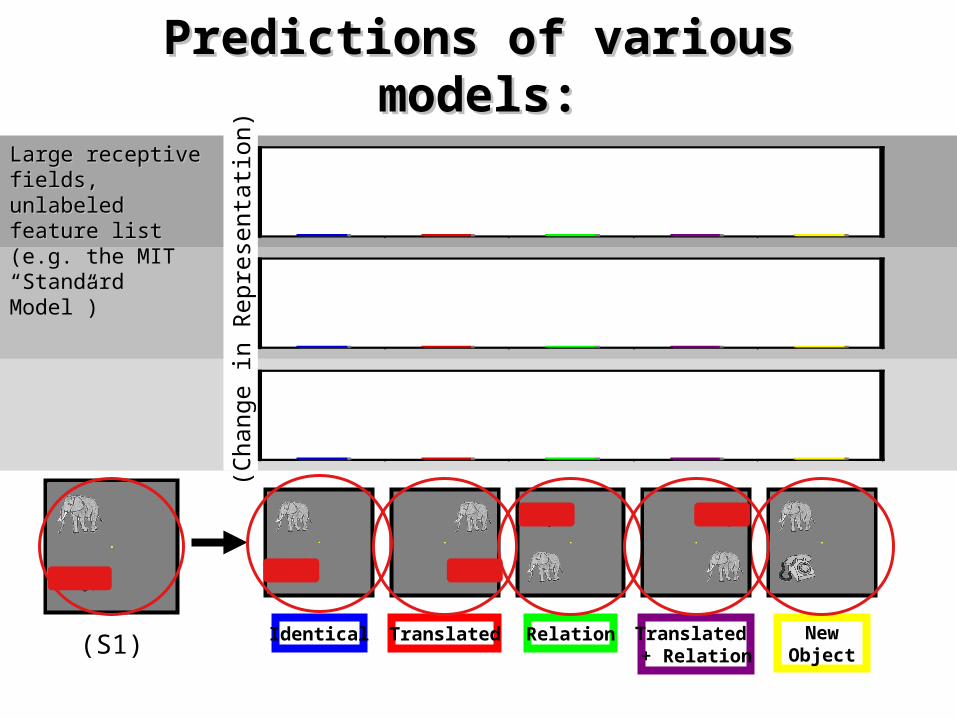
Predictions of various models:Predictions of various models:
Large receptive fields, Large receptive fields, unlabeled feature list unlabeled feature list (e.g. the MIT (e.g. the MIT “Standard Model”)“Standard Model”) 0
0.1
0.2
0.3
0.4
0.5
0.6
0
0.1
0.2
0.3
0.4
0.5
0.6
0
0.1
0.2
0.3
0.4
0.5
0.6
(Cha
nge
in R
epre
sent
atio
n)
Identical Translated Relation New Object
Translated + Relation
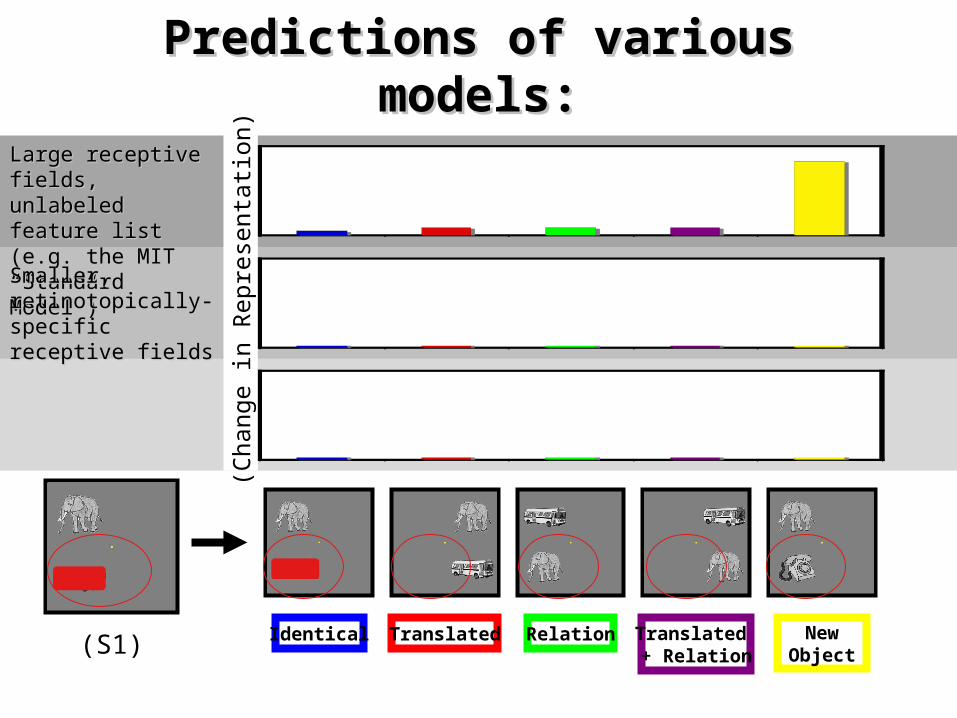
(S1)
Predictions of various models:Predictions of various models:
Large receptive fields, Large receptive fields, unlabeled feature list unlabeled feature list (e.g. the MIT (e.g. the MIT “Standard Model”)“Standard Model”) 0
0.1
0.2
0.3
0.4
0.5
0.6
0
0.1
0.2
0.3
0.4
0.5
0.6
Smaller, Smaller, retinotopically-specific retinotopically-specific receptive fields receptive fields
0
0.1
0.2
0.3
0.4
0.5
0.6
(Cha
nge
in R
epre
sent
atio
n)
Identical Translated Relation New Object
Translated + Relation
(S1)
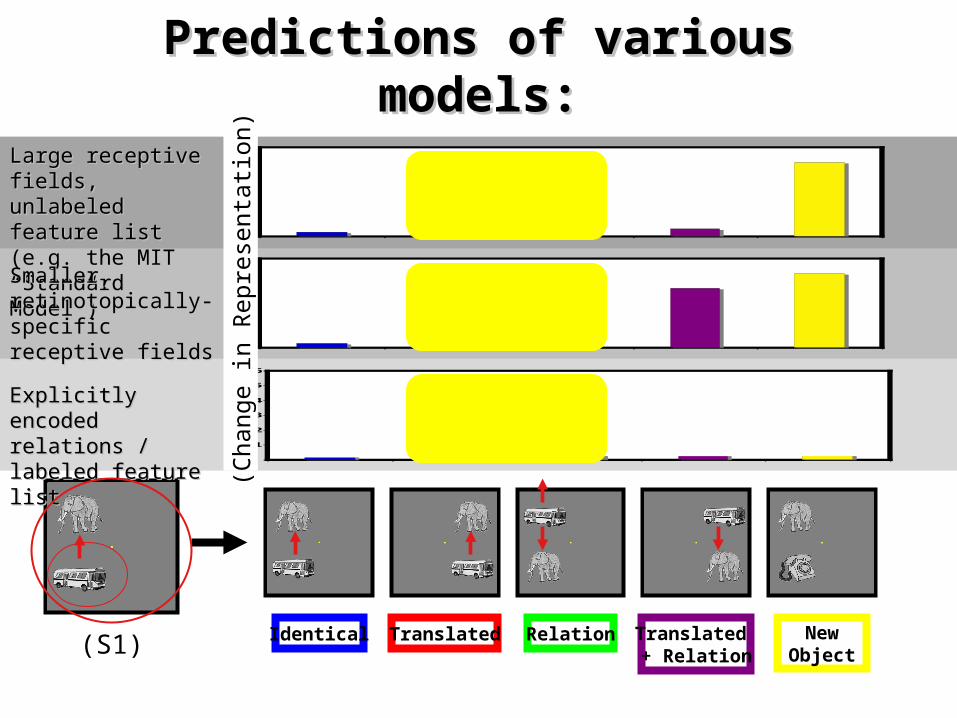
Predictions of various models:Predictions of various models:
Large receptive fields, Large receptive fields, unlabeled feature list unlabeled feature list (e.g. the MIT (e.g. the MIT “Standard Model”)“Standard Model”) 0
0.1
0.2
0.3
0.4
0.5
0.6
0
0.1
0.2
0.3
0.4
0.5
0.6
Smaller, Smaller, retinotopically-specific retinotopically-specific receptive fields receptive fields
0
0.1
0.2
0.3
0.4
0.5
0.6
(Cha
nge
in R
epre
sent
atio
n)
Explicitly encoded Explicitly encoded relations / labeled relations / labeled feature listfeature list
Identical Translated Relation New Object
Translated + Relation
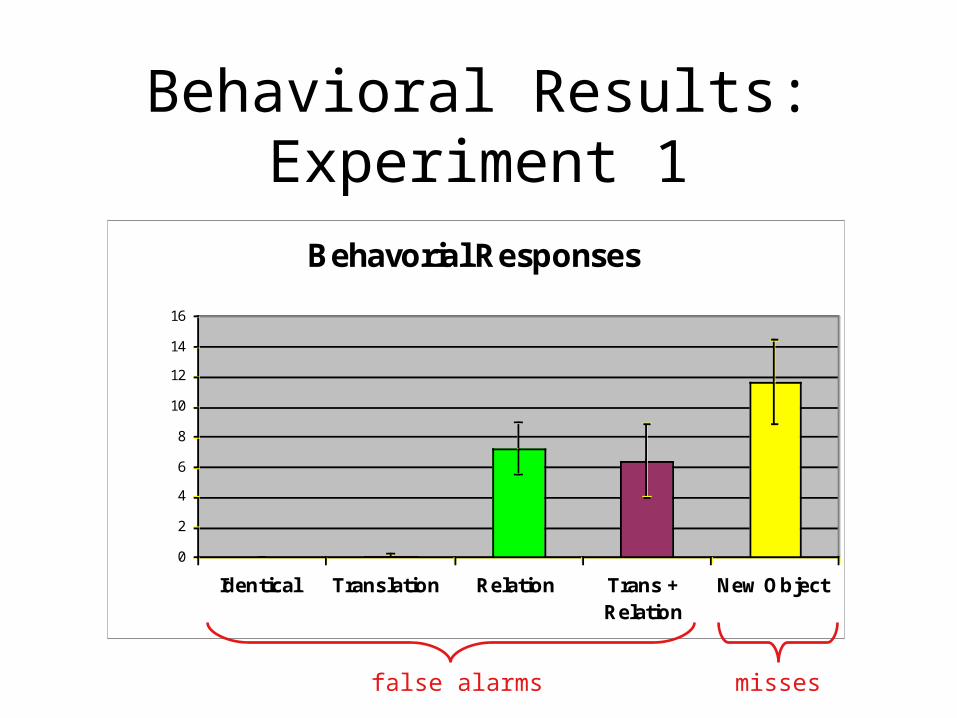
Behavorial Responses
0
2
4
6
8
10
12
14
16
Identical Translation Relation Trans +Relation
New Object
% Error Rate
Behavioral Results: Experiment 1
false alarms misses
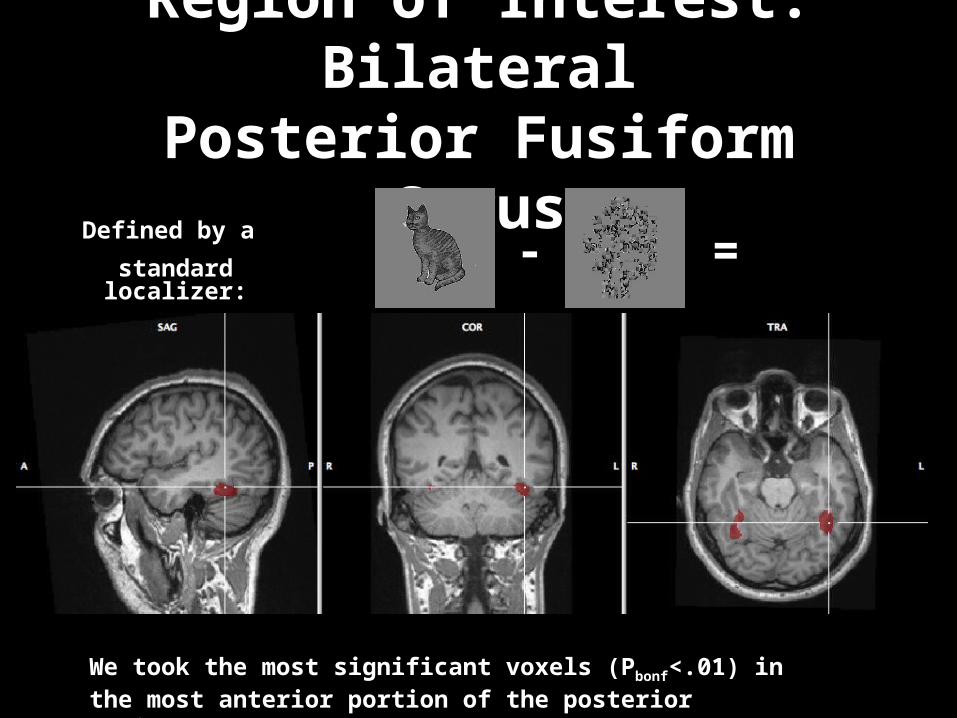
Region of Interest: BilateralRegion of Interest: BilateralPosterior Fusiform GyrusPosterior Fusiform Gyrus
Defined by a Defined by a
standard localizer:standard localizer: -- ==
We took the most significant voxels (PWe took the most significant voxels (Pbonfbonf<.01) in the most <.01) in the most
anterior portion of the posterior fusiform gyrusanterior portion of the posterior fusiform gyrus
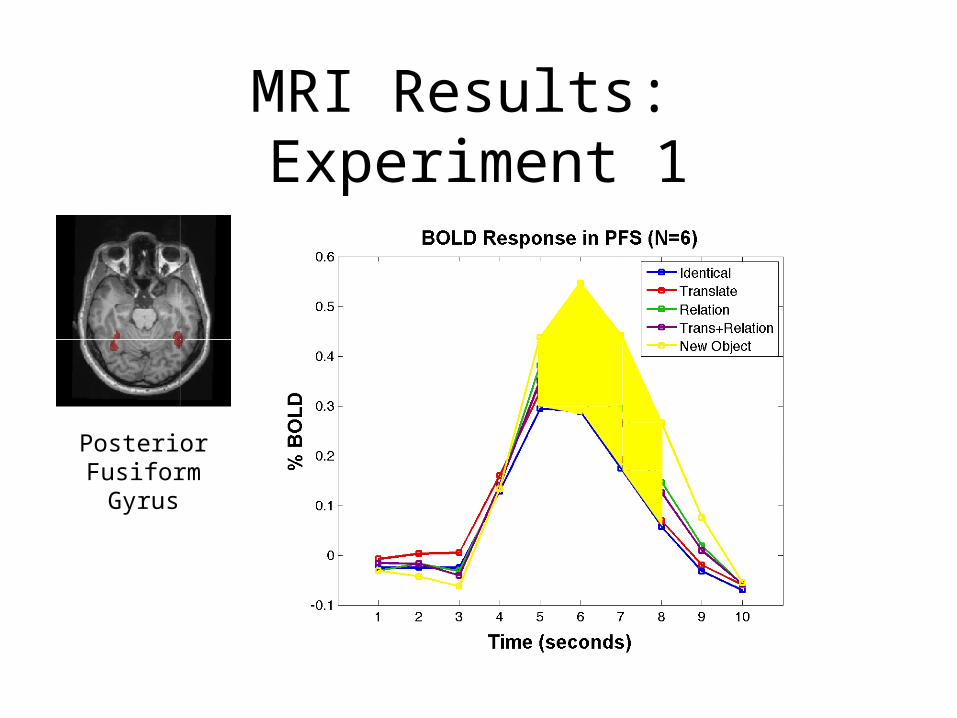
MRI Results: Experiment 1
Posterior Fusiform
Gyrus
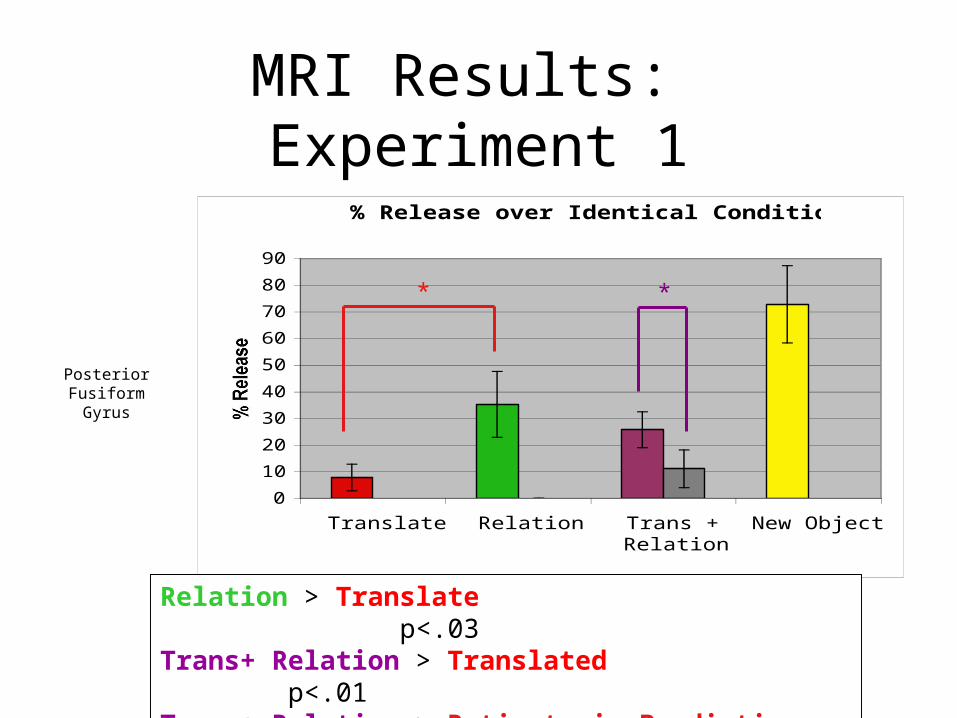
MRI Results: Experiment 1
% Release over Identical Condition (pFs)
0
10
20
30
40
50
60
70
80
90
Translate Relation Trans +Relation
New Object
% Release
Relation > Translate p<.03Trans+ Relation > Translated p<.01Trans+ Relation > Retinotopic Prediction p<.01Relation > Trans+ Relation n.s.
Posterior Fusiform
Gyrus
* *
Example T1 trial (in 45 degrees reference frame)
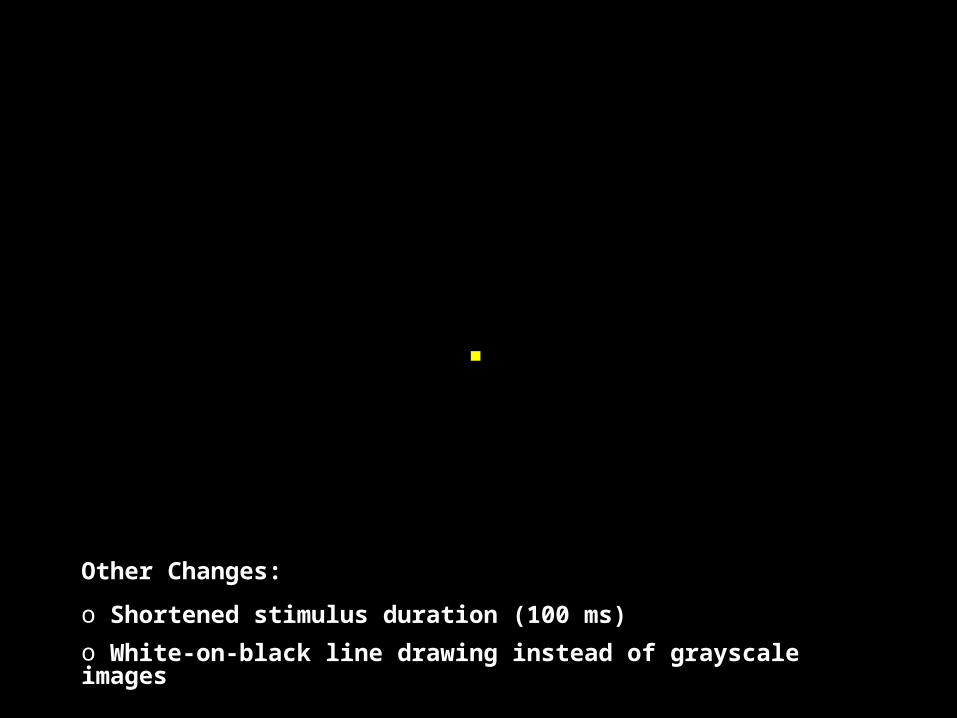
Other Changes: Other Changes:
o Shortened stimulus duration (100 ms)Shortened stimulus duration (100 ms)
o White-on-black line drawing instead of grayscale imagesWhite-on-black line drawing instead of grayscale images
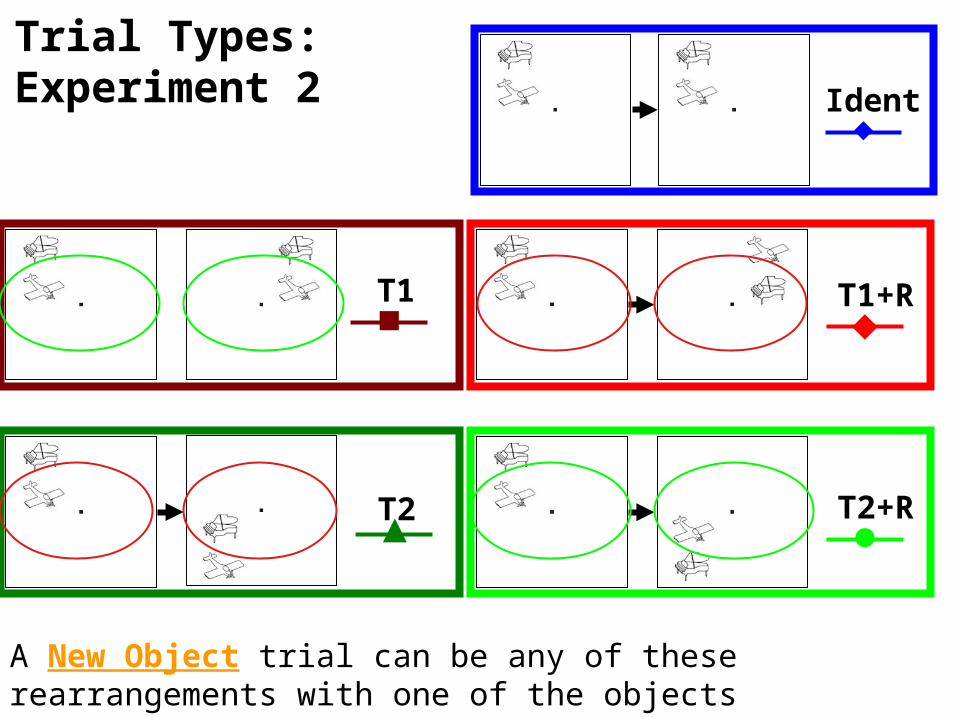
T2
T1
T2+R
T1+R
A New Object trial can be any of these rearrangements with one of the objects changed.
Trial Types: Experiment 2 Ident
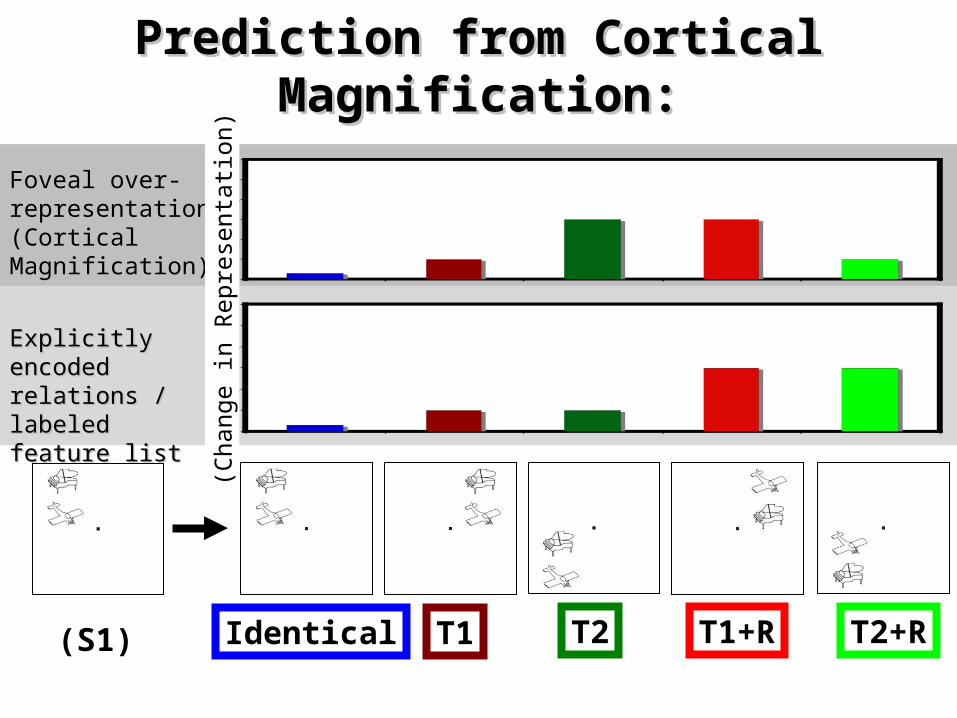
Prediction from Cortical Prediction from Cortical Magnification:Magnification:
Foveal over-Foveal over-representation representation (Cortical (Cortical Magnification)Magnification)
0
0.1
0.2
0.3
0.4
0.5
0.6
Explicitly encoded Explicitly encoded relations / labeled relations / labeled feature listfeature list
(S1) Identical T1 T2 T1+R T2+R
0
0.1
0.2
0.3
0.4
0.5
0.6
(Cha
nge
in R
epre
sent
atio
n)
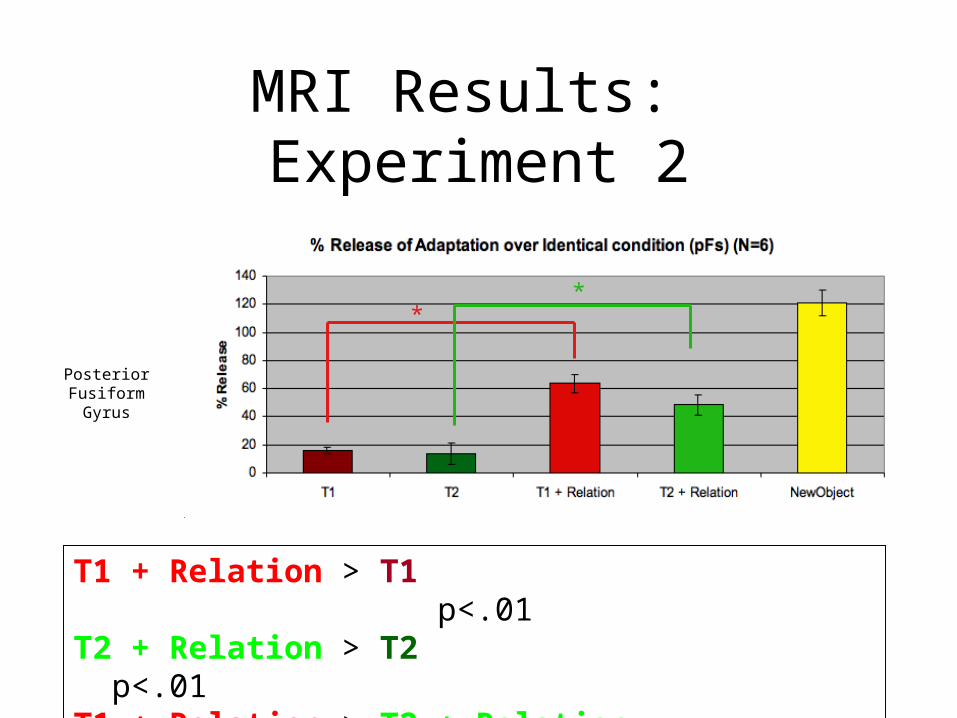
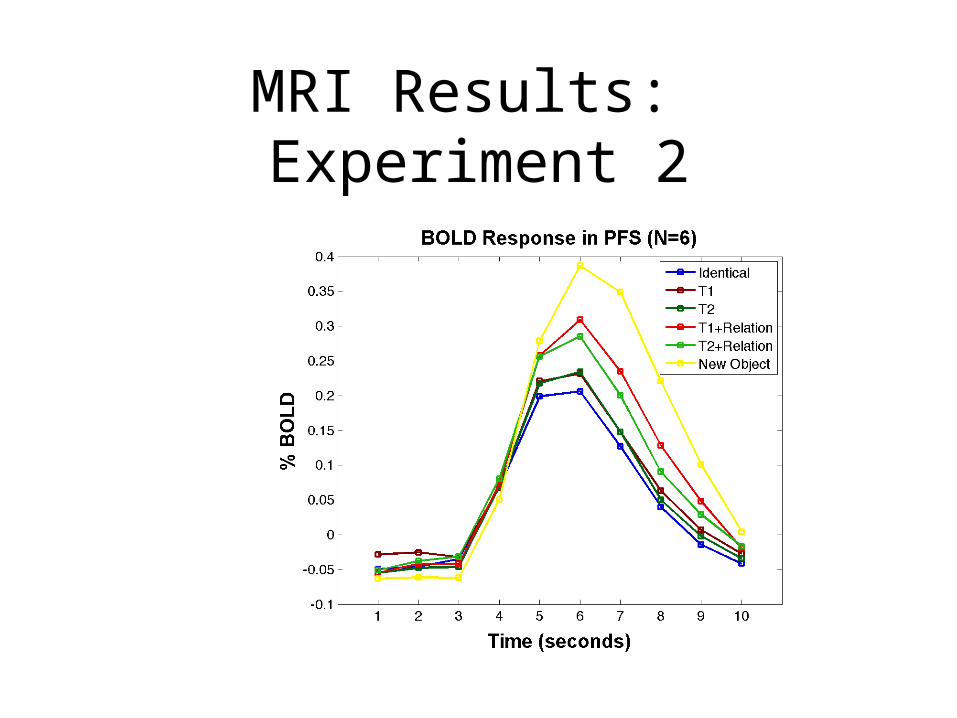
MRI Results: Experiment 2
T1 + Relation > T1 p<.01T2 + Relation > T2 p<.01T1 + Relation > T2 + Relation n.s.Note: Trend of T1 > T2 and T1+R > T2+R is close to significant
**
Posterior Fusiform
Gyrus
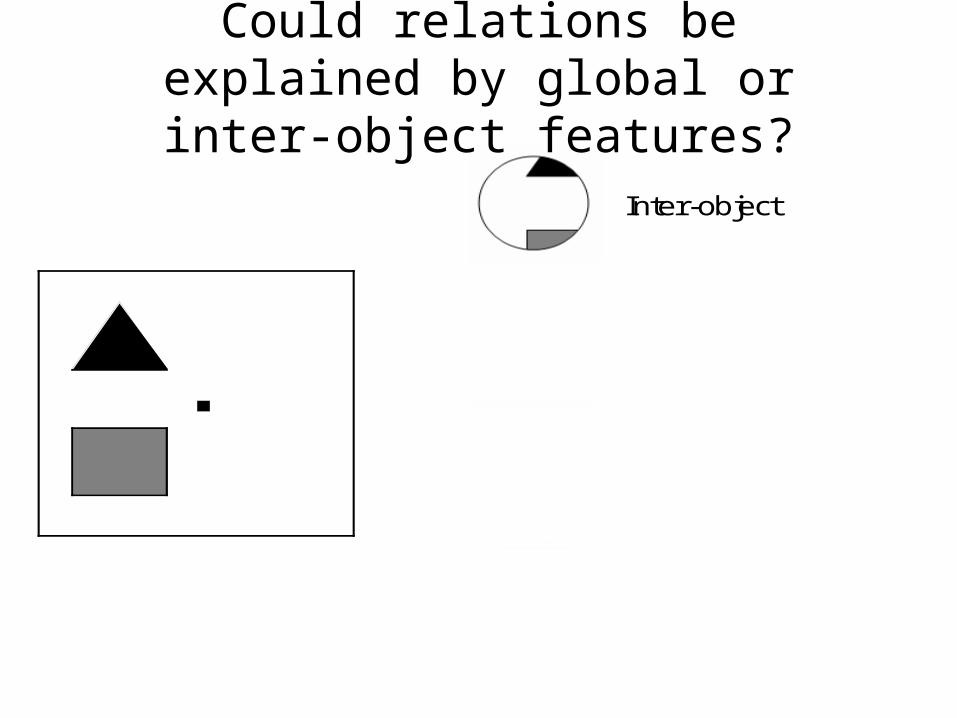
Inter-object
Scene outline
low spatial frequency
global shape
Could relations be explained by global or inter-object features?
Ident+GFTrans+GFRelT+RNewObj
One of above trial types where one object changes identity
S1 S2
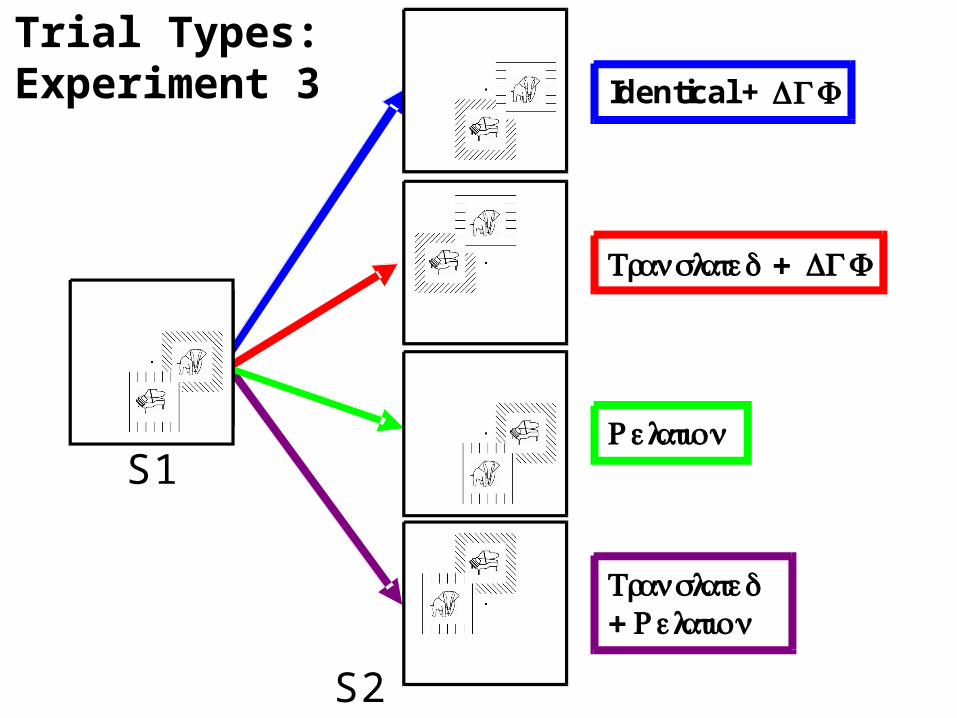
S1
S2
Identical + ΔGF
Translated + ΔGF
Relation
Translated + Relation
Trial TypesTrial Types:Experiment 3
HMAX BOLD Release Predictions
0
0.01
0.02
0.03
0.04
0.05
0.06
Ident+GF Trans+GF Rel Trans+Rel New Object
C2 correlation
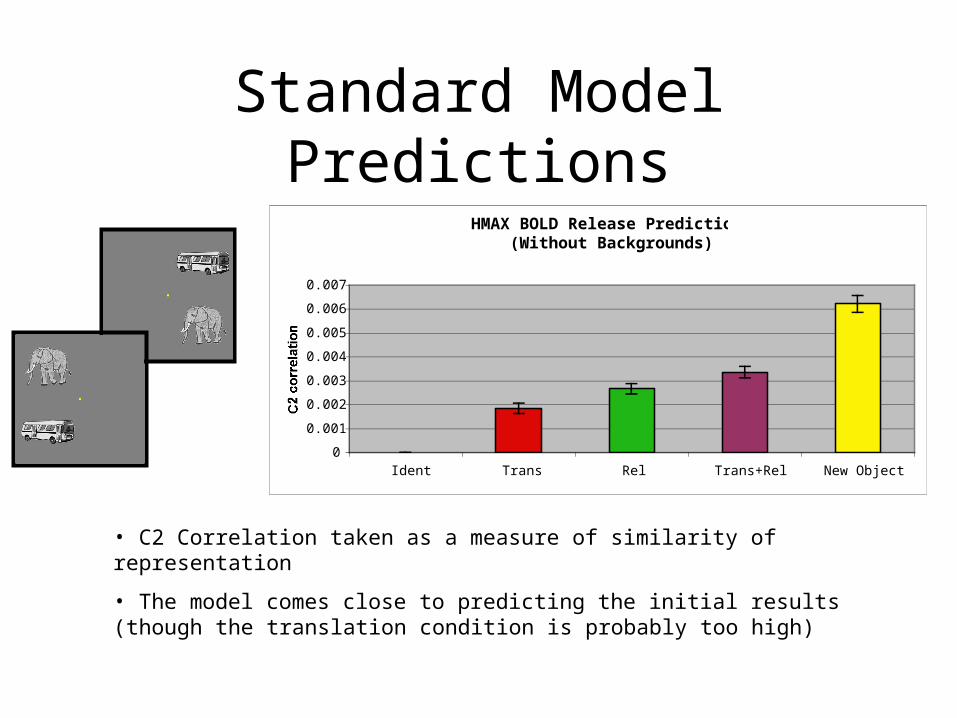
Standard Model Predictions
HMAX BOLD Release Predictions(Without Backgrounds)
0
0.001
0.002
0.003
0.004
0.005
0.006
0.007
Ident Trans Rel Trans+Rel New Object
C2 correlation
• C2 Correlation taken as a measure of similarity of representation
• The model comes close to predicting the initial results (though the translation condition is probably too high)
HMAX BOLD Release Predictions
0
0.01
0.02
0.03
0.04
0.05
0.06
Ident+GF Trans+GF Rel Trans+Rel New Object
C2 correlation
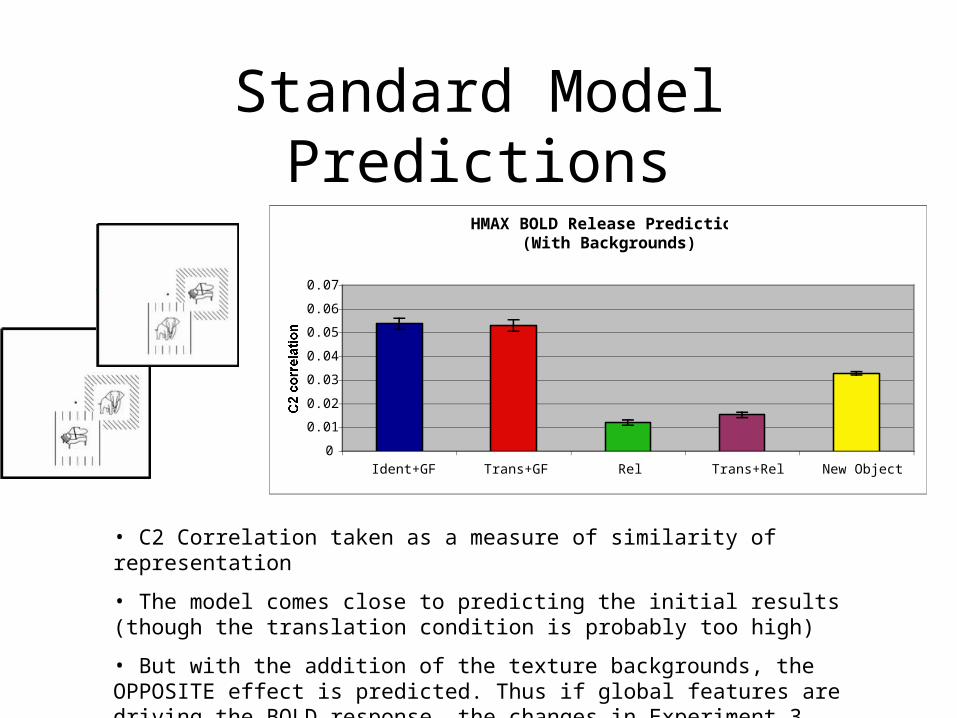
Standard Model Predictions
HMAX BOLD Release Predictions(Without Backgrounds)
0
0.001
0.002
0.003
0.004
0.005
0.006
0.007
Ident Trans Rel Trans+Rel New Object
C2 correlation
HMAX BOLD Release Predictions(With Backgrounds)
0
0.01
0.02
0.03
0.04
0.05
0.06
0.07
Ident+GF Trans+GF Rel Trans+Rel New Object
C2 correlation
• C2 Correlation taken as a measure of similarity of representation
• The model comes close to predicting the initial results (though the translation condition is probably too high)
• But with the addition of the texture backgrounds, the OPPOSITE effect is predicted. Thus if global features are driving the BOLD response, the changes in Experiment 3 ought to drastically change the results
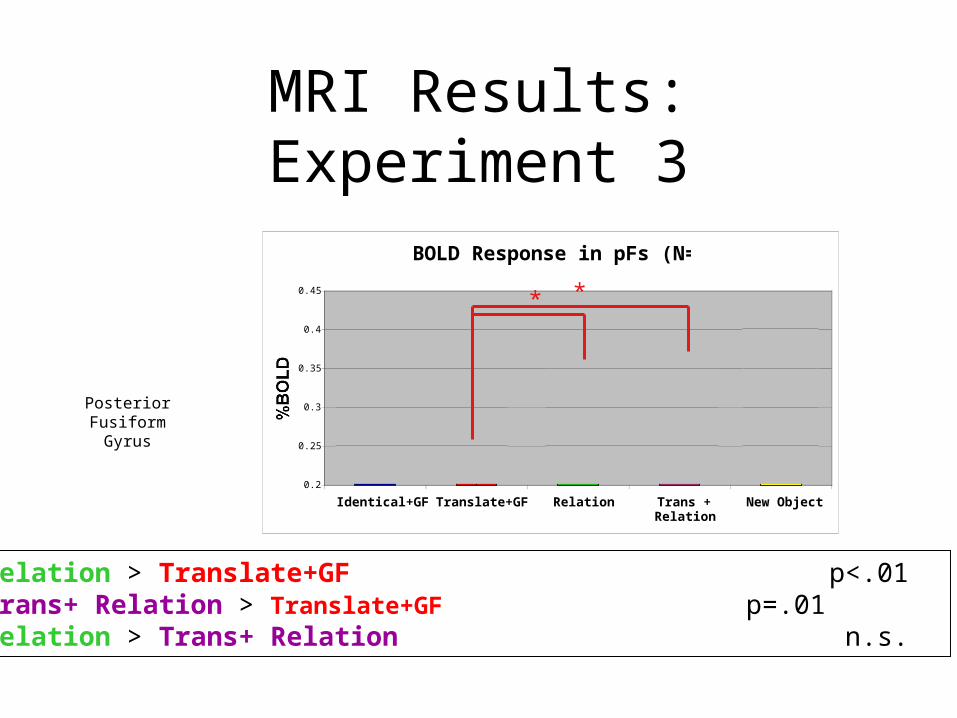
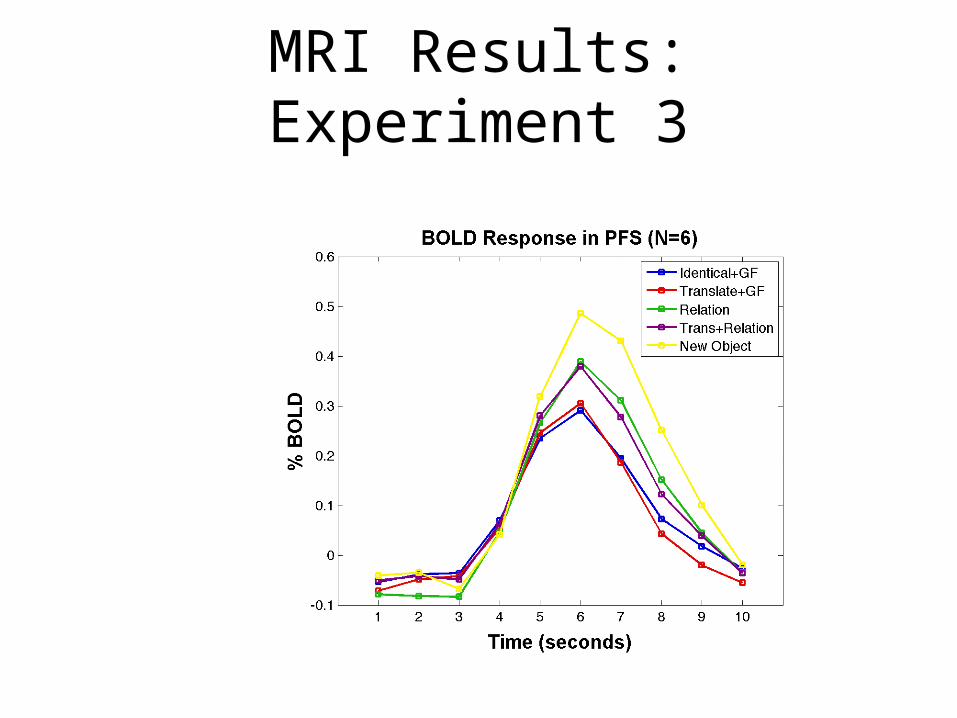
BOLD Response in pFs (N=6)
0.2
0.25
0.3
0.35
0.4
0.45
Identical+GF Translate+GF Relation Trans +Relation
New Object
%BOLD
Relation > Translate+GF p<.01Trans+ Relation > Translate+GF p=.01Relation > Trans+ Relation n.s.
MRI Results: Experiment 3
* *
Posterior Fusiform
Gyrus
(S1)
Predictions of various models:Predictions of various models:
Large receptive fields, Large receptive fields, unlabeled feature list unlabeled feature list (e.g. the MIT (e.g. the MIT “Standard Model”)“Standard Model”) 0
0.1
0.2
0.3
0.4
0.5
0.6
0
0.1
0.2
0.3
0.4
0.5
0.6
Smaller, Smaller, retinotopically-specific retinotopically-specific receptive fields receptive fields
0
0.1
0.2
0.3
0.4
0.5
0.6
Explicitly encoded Explicitly encoded relations / labeled relations / labeled feature listfeature list
Identical Translated Relation New Object
Translated + Relation
(Cha
nge
in R
epre
sent
atio
n)
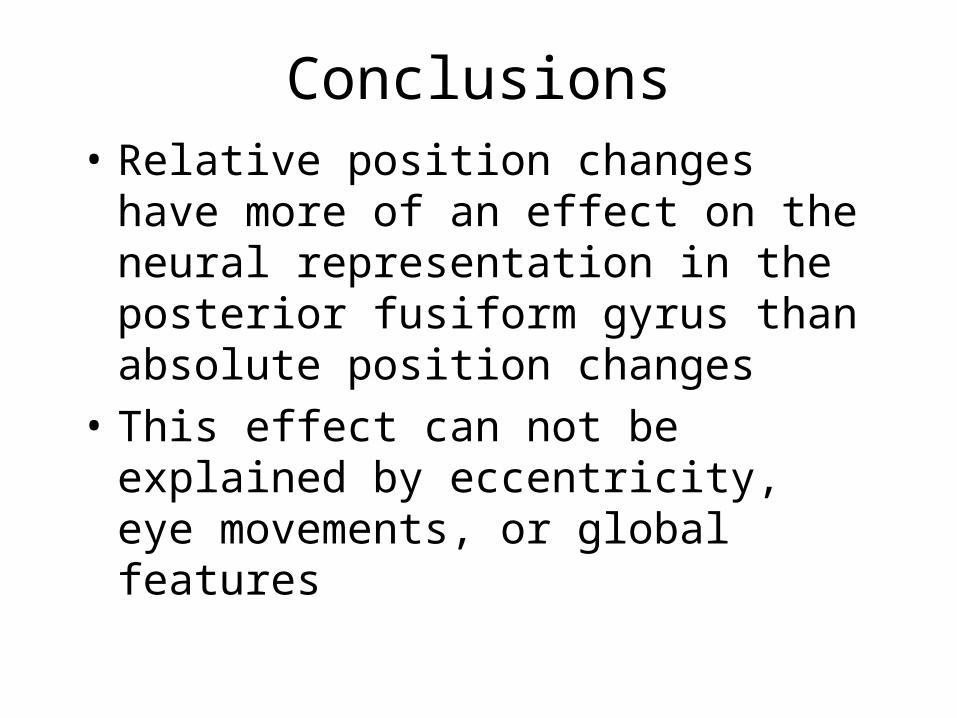
Conclusions• Relative position changes have more of
an effect on the neural representation in the posterior fusiform gyrus than absolute position changes
• This effect can not be explained by eccentricity, eye movements, or global features
AcknowledgementsCo-AuthorsCo-Authors::
Ken HayworthKen Hayworth
Dr. Irving BiedermanDr. Irving Biederman
Special Thanks to: Special Thanks to:
Dr. Xiaomin YueDr. Xiaomin Yue
Jiye KimJiye Kim
Xiaokun XuXiaokun Xu
Dave BergDave Berg
Funded byFunded by::
NSF Grants BCS NSF Grants BCS
04-20794, 05-31177, 04-20794, 05-31177,
and 06-17699 to I.B.and 06-17699 to I.B.

終

Extra Slides
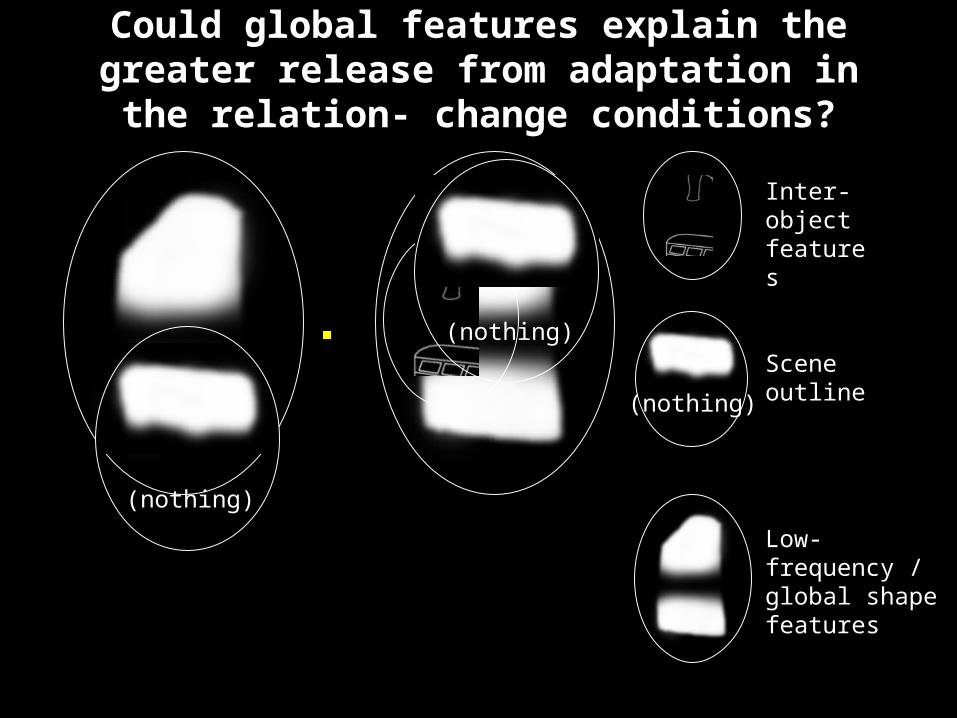
Low-frequency / Low-frequency / global shape global shape featuresfeatures
Inter-Inter-object object featuresfeatures
(nothing)
Scene Scene outlineoutline(nothing)
Could global features explain the greater Could global features explain the greater release from adaptation in the relation- release from adaptation in the relation-
change conditions?change conditions?
(nothing)
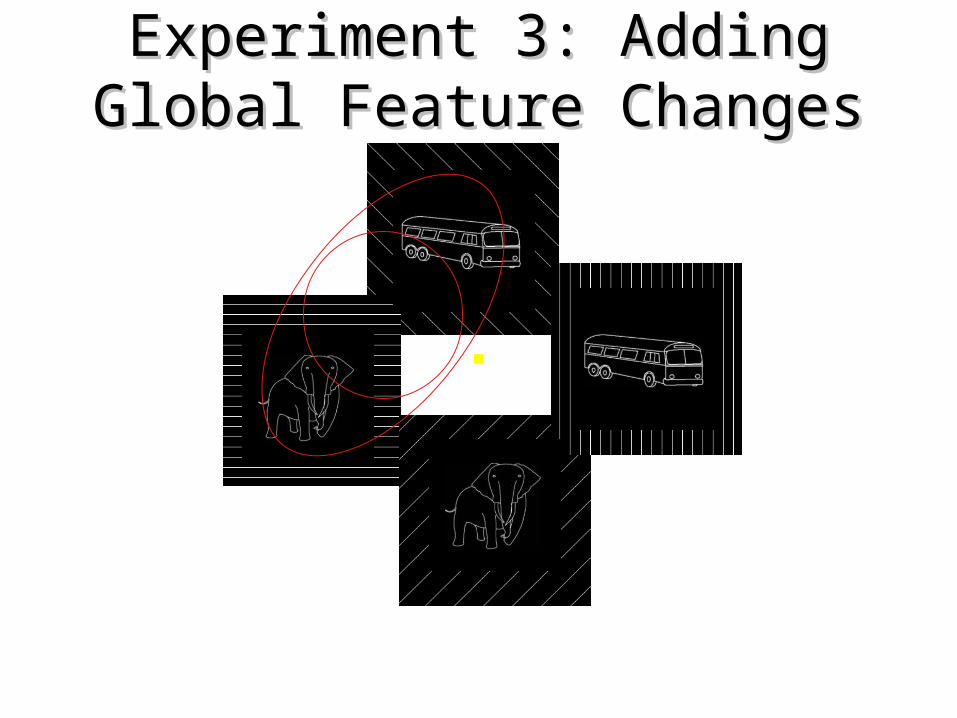
Experiment 3: Adding Global Experiment 3: Adding Global Feature ChangesFeature Changes
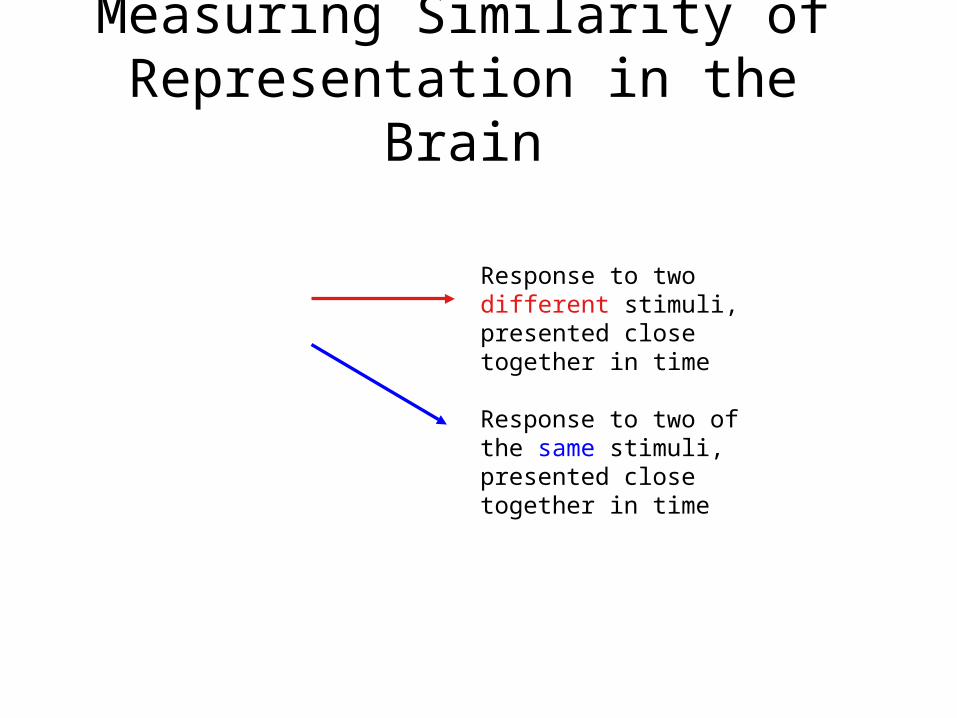
Measuring Similarity of Representation in the Brain
Response to two different stimuli, presented close together in time
Response to two of the same stimuli, presented close together in time
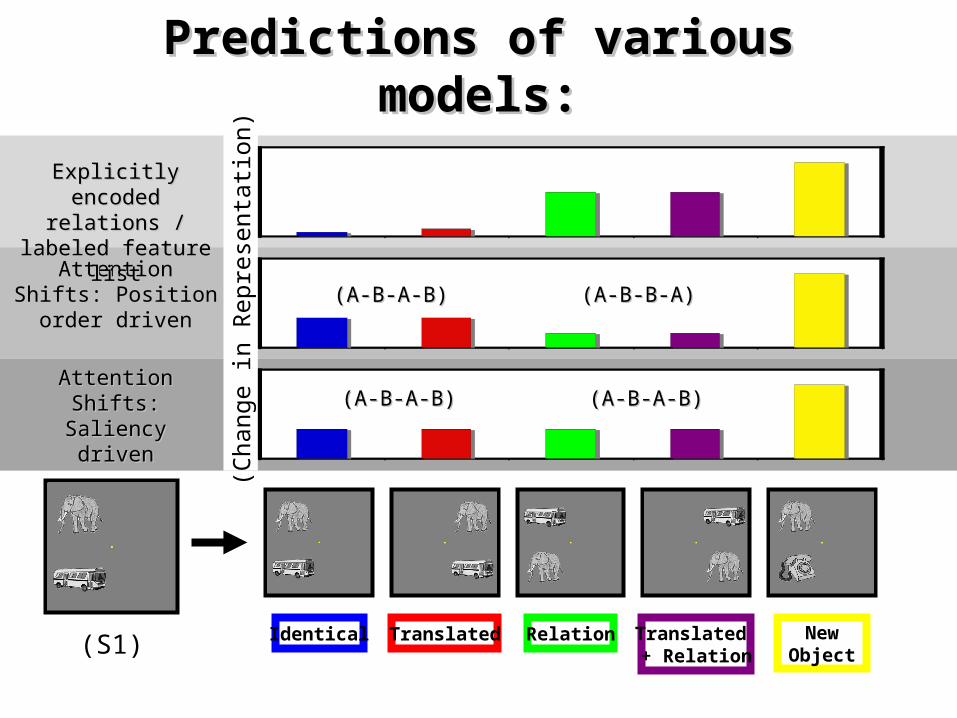
(S1)
Predictions of various models:Predictions of various models:
Attention Shifts: Attention Shifts: Saliency drivenSaliency driven
0
0.1
0.2
0.3
0.4
0.5
0.6
0
0.1
0.2
0.3
0.4
0.5
0.6
Attention Shifts: Attention Shifts: Position order drivenPosition order driven
0
0.1
0.2
0.3
0.4
0.5
0.6
(Cha
nge
in R
epre
sent
atio
n)Explicitly encoded Explicitly encoded relations / labeled relations / labeled
feature listfeature list
Identical Translated Relation New Object
Translated + Relation
(A-B-B-A)(A-B-B-A)(A-B-A-B)(A-B-A-B)
(A-B-A-B)(A-B-A-B) (A-B-A-B)(A-B-A-B)
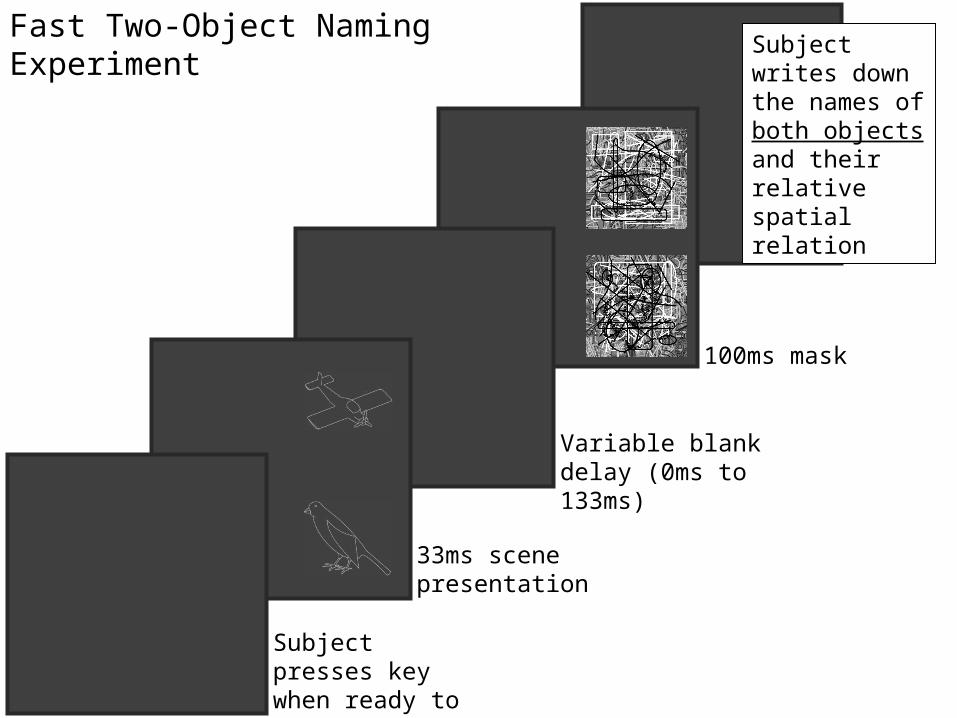
Subject presses key when ready to start trial
33ms scene presentation
100ms mask
Variable blank delay (0ms to 133ms)
Subject writes down the names of both objects and their relative spatial relation
Fast Two-Object Naming Experiment
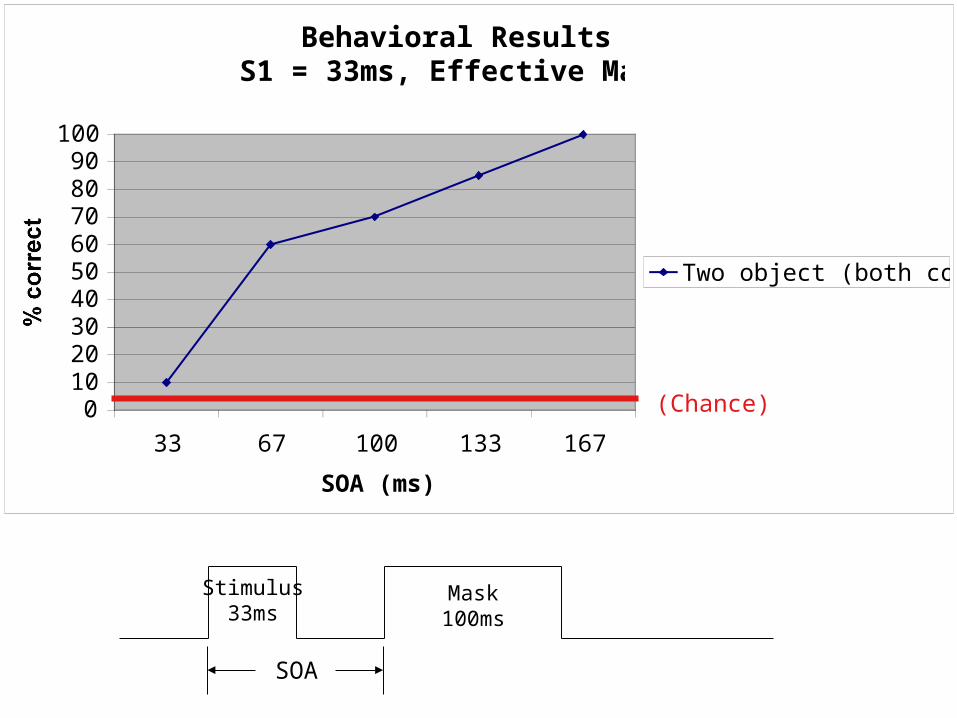
Fast Naming Results
Stimulus33ms
Mask100ms
SOA
Behavioral ResultsS1 = 33ms, Effective Mask =
0102030405060708090
100
33 67 100 133 167
SOA (ms)
% correct
Two object (both correct)
(Chance)
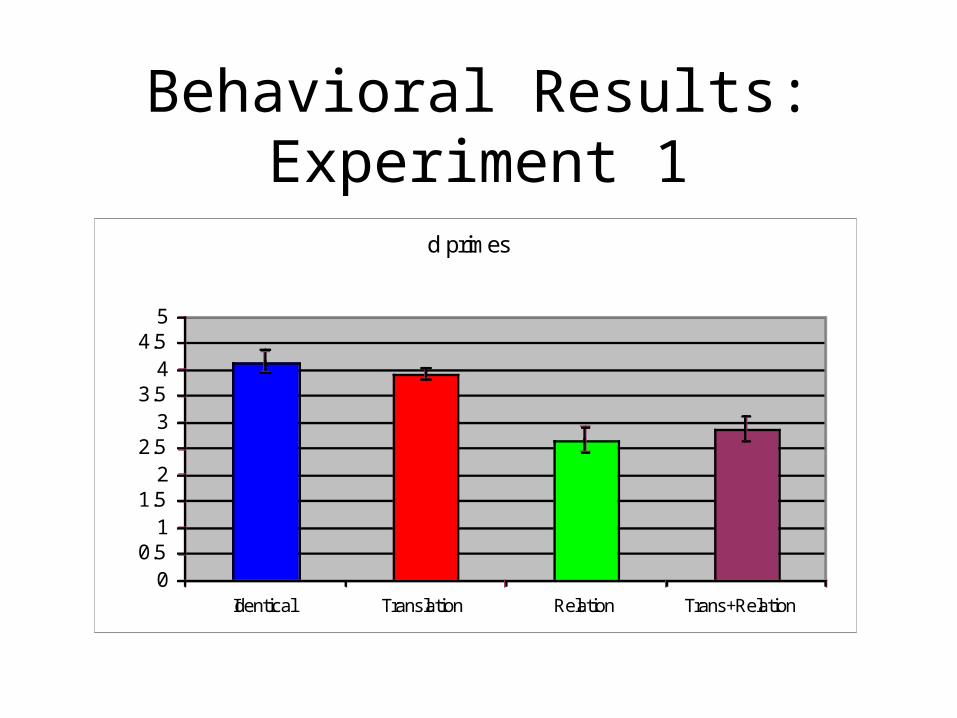
d primes
00.5
11.5
22.5
33.5
44.5
5
Identical Translation Relation Trans+Relation
d Prime
Behavioral Results: Experiment 1
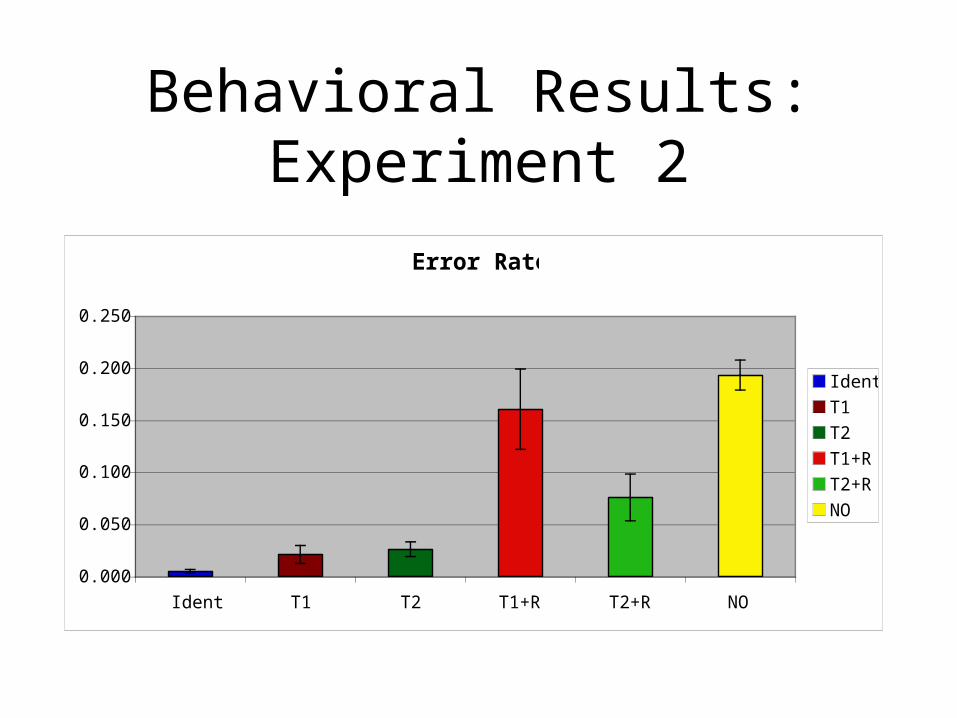
Behavioral Results: Experiment 2
Error Rates
0.000
0.050
0.100
0.150
0.200
0.250
Ident T1 T2 T1+R T2+R NO
Ident
T1
T2
T1+R
T2+R
NO
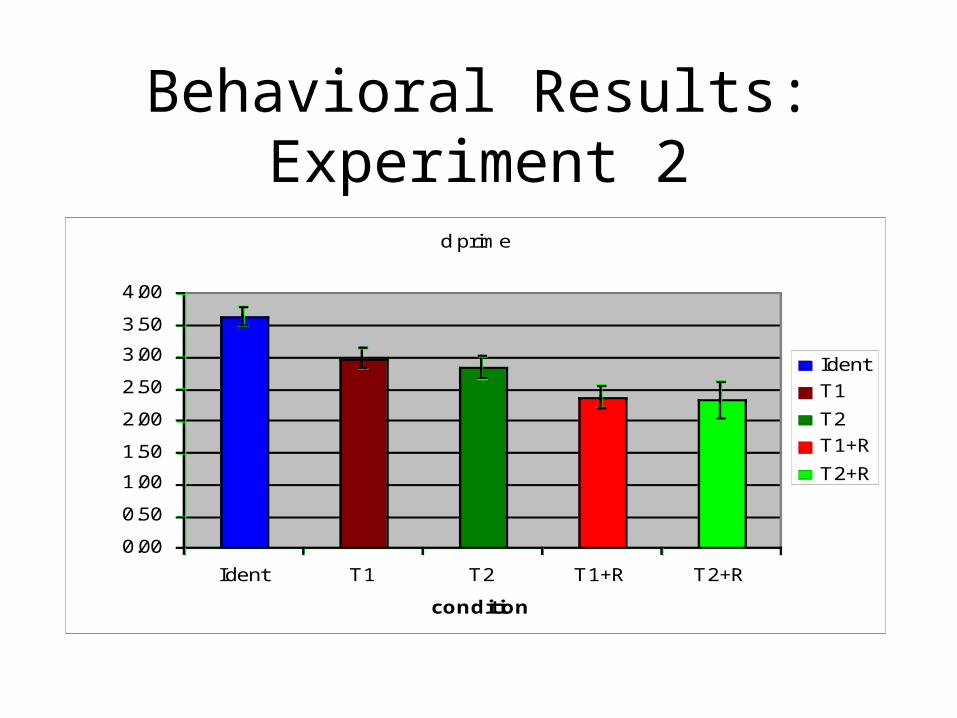
Behavioral Results: Experiment 2
d prime
0.00
0.50
1.00
1.50
2.00
2.50
3.00
3.50
4.00
Ident T1 T2 T1+R T2+R
condition
d prime
Ident
T1
T2
T1+R
T2+R
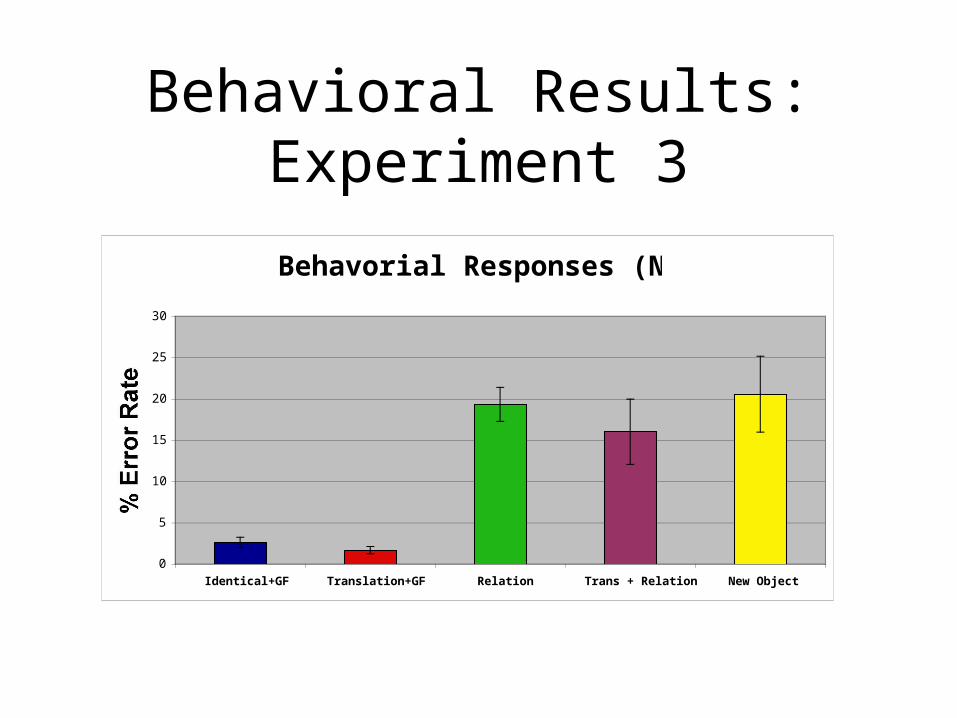
Behavorial Responses (N=6)
0
5
10
15
20
25
30
Identical+GF Translation+GF Relation Trans + Relation New Object
% Error Rate
Behavioral Results: Experiment 3
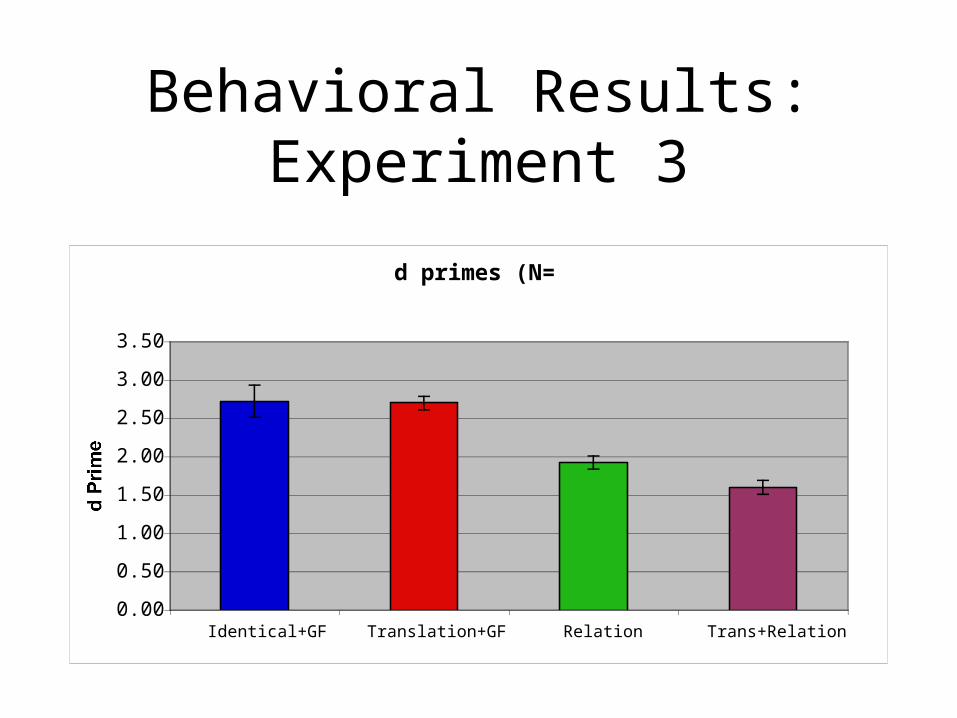
Behavioral Results: Experiment 3
d primes (N=6)
0.00
0.50
1.00
1.50
2.00
2.50
3.00
3.50
Identical+GF Translation+GF Relation Trans+Relation
d Prime
MRI Results: Experiment 2
MRI Results: Experiment 3
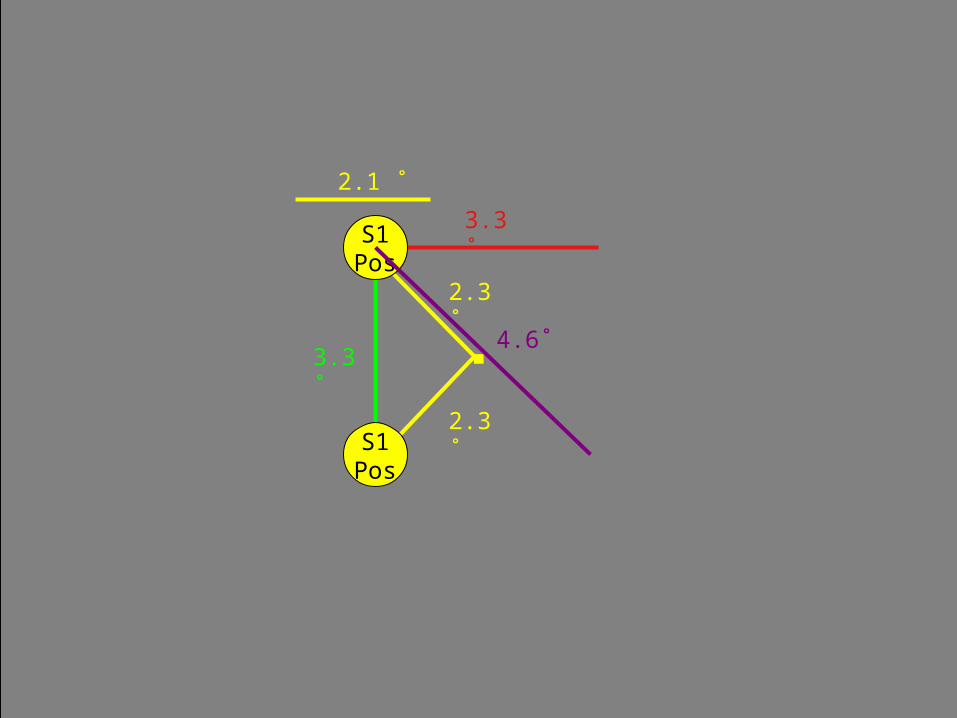
Stimulus Parameters
2.1 ˚
3.3˚
2.3˚
2.3˚
3.3˚S1Pos
S1Pos
4.6˚
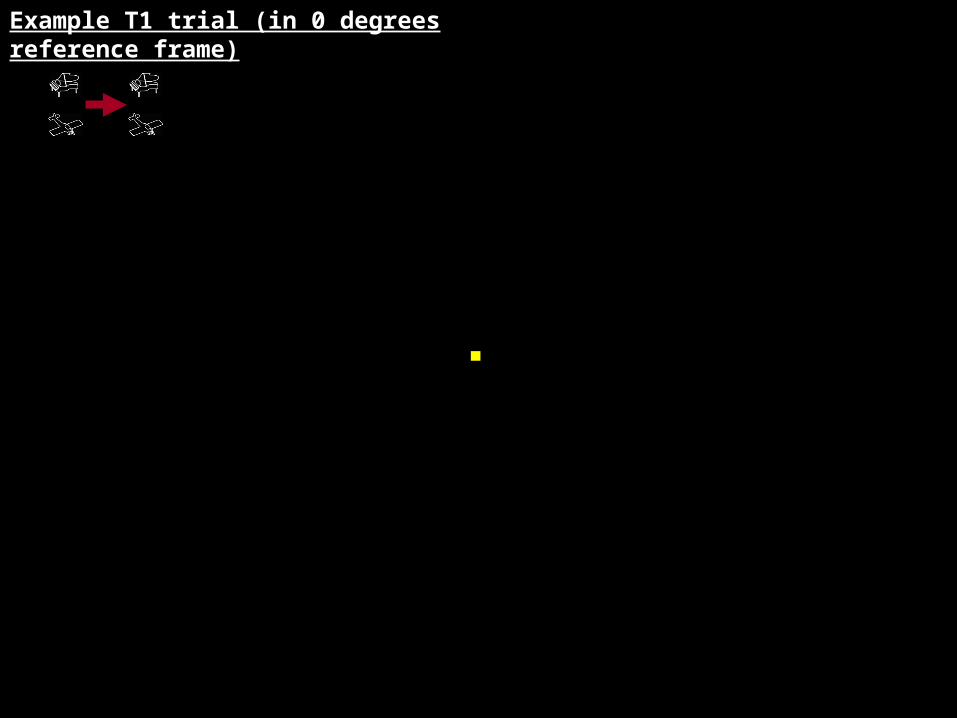
Example T1 trial (in 0 degrees reference frame)Example T1 trial (in 0 degrees reference frame)
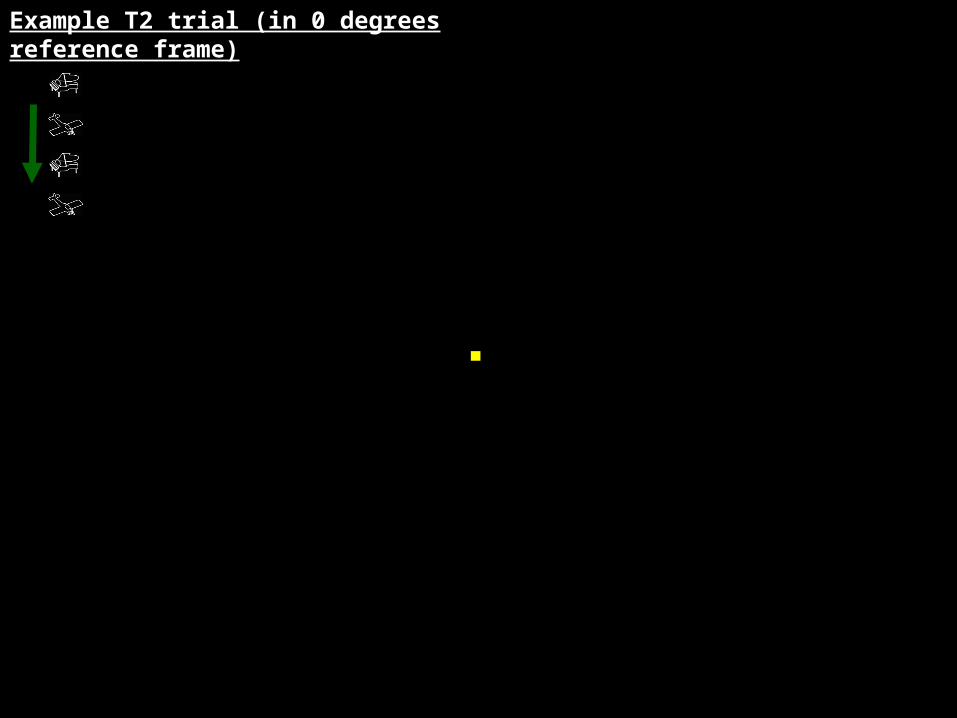
Example T2 trial (in 0 degrees reference frame)Example T2 trial (in 0 degrees reference frame)
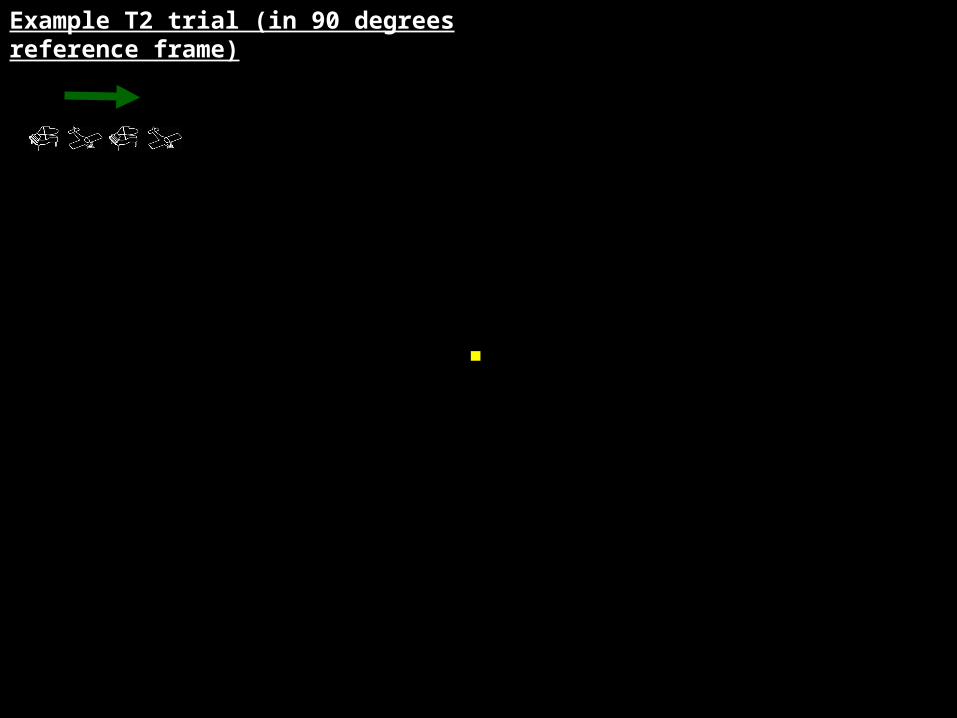
Example T2 trial (in 90 degrees reference frame)Example T2 trial (in 90 degrees reference frame)
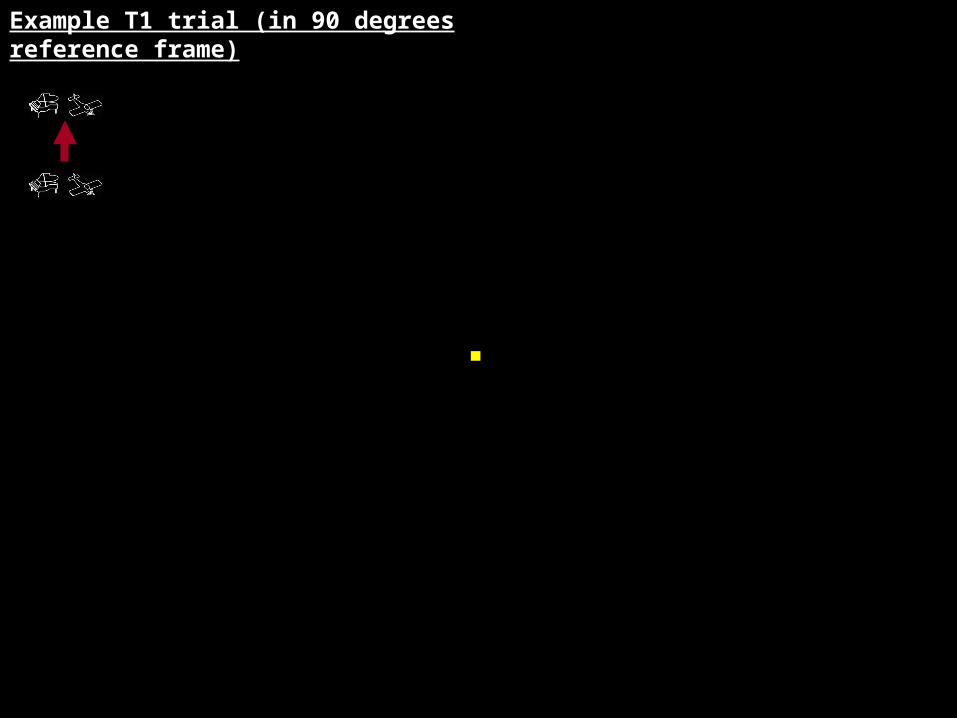
Example T1 trial (in 90 degrees reference frame)Example T1 trial (in 90 degrees reference frame)
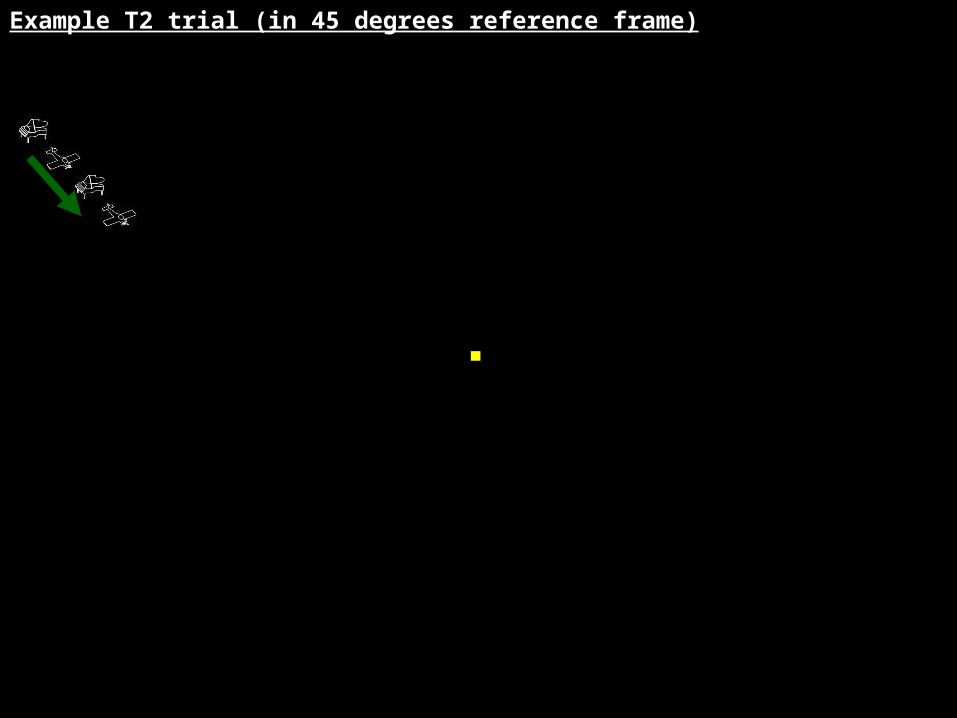
Example T2 trial (in 45 degrees reference frame)