Embed Size (px)
Citation preview

Int. J. Productivity and Quality Management, Vol. X, No. Y, xxxx 1
Copyright © 200x Inderscience Enterprises Ltd.
Evidence for quality management systems being instrumental in improving supplier performance: the case of the wind power sector
Jordi Castelló*, Josep Llach and Rodolfo de Castro Department of Business Organization, Management and Product Design, Universitat de Girona, Escola Politècnica Superior, Campus de Montilivi, C/Mª Aurèlia Capmany, 61, 17003 Girona, Spain Email: [email protected] Email: [email protected] Email: [email protected] *Corresponding author
Abstract: This paper evaluates whether ISO certification enables a supplier to become an extended resource in a specific sector. The evaluation consisted of a statistical analysis of data from 90 suppliers to a wind turbine manufacturer. The suppliers were selected, evaluated and audited as extended resources from a resource-based view (RBV). We test the differences that the qualified suppliers exhibit in main ISO processes and we identify specific areas that will improve supplier relationships. We also demonstrate significant differences exist when the level of technology the supplier uses is taken into account. Our results may well be applicable in a wider manufacturing processes context. We determine that ISO certification alone is not enough to cement a positive relationship in an upstream supply chain environment, despite such relationships being crucial to the success of a business, and support the use of a wider sector-specific certification tool that goes beyond ISO certification.
Keywords: supplier evaluation; supplier relationships; quality management; ISO certification.
Reference to this paper should be made as follows: Castelló, J., Llach, J. and de Castro, R. (xxxx) ‘Evidence for quality management systems being instrumental in improving supplier performance: the case of the wind power sector’, Int. J. Productivity and Quality Management, Vol. X, No. Y, pp.000–000.
Biographical notes: Jordi Castelló is a PhD student in Doctoral Programme in Technology at the University of Girona. He has Master Business Administration (MBA) at UPC, Master in Operations Management at UPC and Master’s degree in Business Innovation Technology Management at UdG and he has more than 15 years of experience in wind business. His current research interest is in the area of supply chain management, business process management and innovation management.

2 J. Castelló et al.
Josep Llach is a Professor at the University of Girona. His research is focused on innovation in production and operations management and in family businesses. Since 2004 he works in UdG. He has several articles published in ISI journals.
Rodolfo de Castro is a Professor at the University of Girona. His research is focused on lean thinking in production and operations management and in supply chain management. Since 1997 he works in UdG. He has more than ten articles published in ISI journals
1 Introduction
Nowadays, quality problems often breach organisations’ boundaries (upstream and downstream) and directly impact a whole supply chain. Thus, ensuring quality in upstream supply chains has become a competitive priority for many companies because it is no longer the companies themselves who are competing with each other, but the supply chains that are in competition with each other (Christopher and Towill, 2000). Suppliers are a critical upstream echelon of the supply chain, and their integration has a direct impact on the efficiency and responsiveness of the entire supply chain. Consequently, many manufacturing industries are required to select suitable suppliers who can provide materials and components to the industry at the right time, the right quantity, the right quality and the right place (Maurya et al., 2013).
In sectors with advanced technology and complex products, one of the key areas their attention must be focussed on is how to efficiently manage the supply chain. One such industrial sector doing exactly this is the wind power sector.
Wind power is no longer simple idea, but one that has developed into a major and dependable source of energy. The key to success for the wind power industry is in constructing the supply chain (Prostean et al., 2014).
The wind power supply chain is made up of different echelons: suppliers, wind turbine manufactures, electrical distribution companies and end customers (Castelló et al, 2016). Wind turbine manufacturers represent one tier in that supply chain and one of their greatest challenges is to achieve maximum availability and reliability of operating wind turbines. Customers (electricity distribution companies) stipulate availability and reliability (usually between 97.5% and 98%) in their contracts (Wilburn et al., 2011). In other words, maximum, uninterrupted power generation must be achieved.
The technological complexity of wind turbines, with over 8,000 very varied components (Aubrey, 2007), together with the large number of technologies required to produce a turbine (machining, castings, forgings, hydraulics, welding, electricity, electronics, composites), makes quality assurance in the supply chain very complex.
A competitive priority for wind turbine manufacturers, and one of the major challenges they face, is ensuring the quality of the components in the supply chain. Hence, wind turbine developers have focused on identifying suppliers who can provide quality components on time (Prostean et al., 2014).
That said, incorporating quality into the supply chain is not unique to the wind power sector, as quality in the supply chain of a complex product can be a differentiating factor and provide a competitive advantage.

Evidence for QMS being instrumental in improving supplier performance 3
The purpose of this research is to examine the upstream supply chain of the wind energy sector to determine whether the ISO 9001: 2008 quality management system (QMS) model is adequate or whether the sector requires more advanced models to achieve the reliability levels demanded by its customers. We use a resource-based view (RBV) as the theoretical paradigm to underpin this study, although we also refer to more developed theories, such as the extended resource-based view which supports the supply chain model (Rungtusanatham et al., 2003).
ISO 9001 accreditation requires a third-party audit which evaluates the QMS the company has in place, against the requirements outlined in the standard. Third-party audits are performed by independent certification bodies free of any conflict of interest in the customer-supplier relationship. Independent auditors are a key component of a third-party audit. However, despite more than two decades of using third-party audits, many quality managers and professionals still do not see the value in or necessity of these third-party audits (Kluse, 2013). Some studies reveal significant differences between the perceptions (in terms of profits, performance, standard compliance, improvements, etc.) of auditing that customers have and those that the auditors themselves have (Castka et al., 2015; Kluse, 2013; Power and Terziovski, 2007). Neither is there a better understanding of how academics and practitioners perceive the TPAs process either (Kluse, 2013).
In some industrial sectors, for instance aerospace or the automotive sector, power systems, oil and gas, or the food industry, purchasing managers push for ISO certification (third-party audits) of their suppliers bidding for some projects or tenders. Following this, the customer quality team will later perform second-party audits of the same suppliers in order to ensure product quality. Ironically this praxis only consumes resources, time and money and does not add any value to the company.
Second-party audits are an external audit, led by the customer or by a contracted organisation on behalf of the customer and performed at and on the supplier’s facilities. In other words, the purchasing order is in place, and the goods or services are being, or will be, delivered. Second-party audits are subject to the rules of contract laws and/or commercial agreements, as they provide contractual direction from the customer to the supplier. Second-party audits tend to be more formal than first-party audits because the outcomes of the audit could well influence the customer’s future purchasing decisions.
This conflict of interest between third-party and second-party audits is the motivation for our research. Furthermore, an extensive literature review reveals there is a lack of empirical evidence regarding the relationship between implementing ISO 9001 and second-party audits and their impact on business performance (Hadzhiev, 2012). For this reason, in our research, we use second-party audits as a ‘driving’ tool, to analyse if QMS, in accordance with ISO 9001, is an adequate model with which to manage the upstream supply chain in the wind power sector.
The paper is structured as follows:
1 introduction
2 a literature review relating to supply chain and quality management and including the study’s hypothesis
3 methodology, samples and data collection
4 results and analysis
5 discussion

4 J. Castelló et al.
6 conclusions including research limitations, managerial implications and future research directions.
2 Literature review
Traditional wisdom suggests that business network integration is critical for smooth supply chain functioning and higher levels of integration lead to better quality and productivity performance (Hong et al., 2015). Now, organisations are becoming increasingly aware of the importance of a supplier’s role in an organisation (Soh et al., 2016).
In recent years, interest in emerging synergies and the integration between the paradigms of supply chain management (SCM) and QMS has increased among academics, researchers and practitioners (El Mokadem, 2016; Lin et al., 2013; Prajogo et al., 2012; Sroufe and Cukovic, 2008). In today’s highly competitive markets, a company’s success or failure largely depends on its SCM. Companies are well aware that as products become more and more complex, diversified and customised, along with a short time to market being demanded, they need to integrate and develop their supply chain to create a competitive advantage. In this context, many resources and capabilities considered to be a competitive advantage are actually shared with suppliers. These capabilities include producing reliable products, fast time to market, low cost, high quality, high flexibility and excellent levels of service. In the face of this, integrating QMS principles and SCM best practices will help companies to achieve a competitive advantage.
2.1 Supply chain management
In essence, SCM encompasses companies which first transform raw materials into intermediate goods and finally into end products. These same companies then deliver the goods and products to the final customer though a distribution system.
The roots of SCM can be traced to two bodies of knowledge:
1 purchasing and supply activities
2 transportation and logistics management (Tan et al., 1998).
Christopher and Peck (2004) define the supply chain as ‘the network of organisations that are involved, through upstream and downstream linkages, in the different processes and activities that produce value in the form of products and services in the hands of the ultimate customer’.
The SCM paradigm has become a powerful management weapon in recent years, as currently companies do not compete with each other directly, but rather in terms of supply (Fawcett et al., 2006; Christopher and Towill, 2000), because nowadays each and every company depends on their supply chain. This new paradigm implies new ways of managing the supply chain. In a traditional supply chain, suppliers are selected on price alone (Chen and Yang, 2002), but today this way of doing business is no longer an option. In the new and effective supply chain, ‘members must sustain customer driven culture, offering the right product, in the right place, at the right time and the right price’ (Fisher, 1997). In the search for competitive advantages in the supply chain, companies,

Evidence for QMS being instrumental in improving supplier performance 5
consultants, practitioners and academics have had to integrate the principles of QMS with the best practices from the process and SCM. Merging these two concepts, SCM and QMS, is a crucial element if companies are to be competitive in the future (Flynn and Flynn, 2005; Prajogo et al., 2012; Robinson and Malhotra, 2005; Truong et al., 2016).
2.2 QMS model: the ISO 9000 standards
QMS, in accordance with ISO 9001, may well be the International Organization of Standardization’s (ISO) most popular product. The ISO 9000 series formalised a QMS protocol for evaluating companies’ skills and their ability to design, produce and deliver quality products and services (Curkovic and Pagell, 1999). In the last three decades, thousands of companies around the world have embraced the ISO 9000 standard in their quest to improve company performance and customer satisfaction.
However, despite having been internationally recognised and widely accepted since its publication in 1987, the ISO 9000 standard (even in its latest version ISO 9001:2008) has been subject to controversy and criticism concerning the success and/or failure of its implementation and/or whether its costs outweigh the performance benefits for companies. The literature is full of research articles describing ISO 9000 certification successes and failures and the resulting impacts on company profits and performance. For instance, Curkovic and Pagell (1999) point out that ISO 9000 is not directly connected to product quality and other researchers argue that certification does not ensure an improvement in a firm’s performance (Anderson et al., 1999; Dimara et al., 2004; Morris, 2006; Tsekouras et al., 2002). Moreover, there are many studies that show some companies adopt ISO certification under pressure from their customers (Anderson et al., 1999; Davis, 2004; Martínez-Costa et al., 2008).
According to Romano (2002), while ISO 9000 does define some requirements for the purchasing process, such as evaluating and selecting suppliers, verifying purchased products, and monitoring supplier quality, it does not require suppliers to be certified, unlike other standards such as ISO/TS 16949 which require suppliers to be certified by a third-party certification body equivalent to, at least, ISO 9000:2000 (Davis, 2004; Willem, 2004).
Naveh and Marcus (2005) emphasise that a certified company could still have substandard processes and products because certification does not tell the company how to design more reliable and efficient products; likewise, Sroufe and Curkovic (2008), in a theory building paper, argued that “ISO registration alone is not enough to do anything beyond ensure compliance with the registration standard.”
Prajogo et al. (2012) suggest that simply being ISO 9000 accredited, does not translate into high performance and firms need to go beyond the basic ISO 9000 requirements. Moreover, İlkay and Alsan (2012) showed that, in terms of performance, there is no significant difference between firms who are certified and those who are not. More recently, Terziovski and Guerrero (2014) analysed the impact of ISO 9000 on product and process innovation performance, and found that ISO 9000 certification does not have a statistically significant relationship with product innovation performance measures.

6 J. Castelló et al.
Nevertheless, the literature on the ISO 9000 series certification is not all criticism and controversy. Several studies highlight how ISO 9000 can help companies improve their performance and efficiency. Some authors point out that certification improves product and service quality and collaboration with suppliers, and reduces customer complaints and internal costs, thus boosting company profitability (Casadesús and Karapetrovic, 2005). Other authors stress that certification strengthens workforce motivation, increases market share and advances the international expansion of the company (Brown et al, 1998; Zaramdini, 2007). Chow-Chua et al. (2003) also point out that ISO certification improves processes and procedures, enhances a company’s image in the marketplace and assists its international expansion.
While the impact ISO 9000 has on performance results remains a source of controversy, all of the studies do agree that a minimum level of improvement in a firm’s management can be established and attributed to ISO 9000 (Naveh and Marcus, 2005; Prajogo et al., 2012; Sroufe and Curkovic, 2008).
2.3 Integration of QMS and SCM
While the supply chain concept is implicitly referred to in the ISO 9001:2008 standard as ‘supplier-organisation-customer’, there is still considerable disagreement about integrating ISO 9001 into a company’s SCM strategy.
Careful reviewing of the ISO 9001:2008 standards shows that it focuses more on the organisation than beyond the organisation. Although deals superficially with supply chain integration and collaboration, in terms of both upstream to suppliers or downstream to customers, ISO 9001:2008 still remains the most widely accepted and integrated QMS in world-class manufacturing firms.
In some companies ISO 9000 use has become a universal quality management norm and in a review of the literature we found that there are many studies concerning such integration. Some of the starting points of these studies encompass a more strategic view and focus on the links and integration between SCM and TQM (Gunasekaran and McGaughey, 2003; Kanji and Wong, 1999; Talib et al., 2010; Vanichchinchai and Igel, 2009), whereas other contributions start from a more operational approach and are dedicated to examining the supply chain quality management relationship (Flynn and Flynn, 2005; Foster, 2008; Kannan and Tan, 2005; Kaynak and Hartley, 2008; Kuei and Madu, 2001; Lin et al., 2005, 2013; Prajogo et al., 2012; Robinson and Malhotra, 2005; Romano and Vinelli, 2001; Sila et al., 2006; Truong et al., 2016).
Other work in the literature analysed the integrations between ISO 9001 QMS and SC, for instance, Casadesús and de Castro (2005), using empirical methods analysed the impact of ISO 9000 certification on the supply chain and Sroufe and Curkovic (2008) analysed the positive effect of integrating ISO 9000 in the SC. Both studies found that ISO 9000 itself does not provide a competitive advantage, therefore underlining that ISO registration alone is not enough to ensure anything beyond compliance with the registration standard.
Meanwhile, Prajogo et al., (2012) analysed the effects different aspects of ISO 9000 implementation had on SC management practices and their impact on operational performance and found that advanced implantation of ISO 9000 does have positive effects on SC activities, whereas basic implantation has no direct influence on SC management practices at all. El Mokadem (2015), investigating ISO 9000 implantation and its alignment with SC activities, also found that an advanced level of implemented

Evidence for QMS being instrumental in improving supplier performance 7
ISO practices has an impact on customer priorities and supplier selection. And, more recently, Truong et al. (2016) proposed a theory building framework to develop SC quality management practices designed to increase a firm’s performance and provided a ‘road map’ for implementing supply chain quality management practices. They also highlighted the fact that there is very little literature dealing with integrating quality management practices and SC.
2.4 Hypothesis development
The literature review leads to some conclusions. A number of authors have pointed out that ISO standards ensure that a QMS exists, but cannot guarantee its functionality in the entire supply chain.
Furthermore, controversy still surrounds ISO 9001 and the standard continues to attract a great deal of criticism, but there is also conflicting evidence concerning the implications of adopting ISO for the supply chain (Sroufe and Curkovic, 2008). However, despite this, the ISO 9001 QMS is currently one of the most widely accepted and internationally employed standards.
By incorporating the standard, a firm can extend its strategic resources beyond the boundaries of the company itself and with successful SCM can use these resources to its competitive advantage. Taking into account the extended RBV of the firm (Mathews, 2003) the ISO system can contribute to gaining a competitive advantage, even though its implementation has different and diverse impacts on a company’s performance (Prajogo et al., 2012).
According to the ISO 9000 literature review, some authors go so far as to classify different levels of ISO 9000 implementation, for example, ‘daily practices’ which refer to basic implementation, the ‘catalyst for change’ referring to advanced implementation, or ‘supportive implementation’, when there is a clear top executive commitment to improving firm management (Naveh and Marcus, 2005; Prajogo et al., 2012).
Therefore, within the framework of the literature review above and as the implementation of ISO 9001:2008 in wind turbine (WT) manufacturer suppliers can be considered as an extended resource of the firm, we propose the following research question: When WT suppliers have implemented ISO 9001, can we consider them as an extended resource?
In order to answer this question we propose two hypotheses based on the literature outlined above:
H1a Wind turbine suppliers implement different levels of ISO9001.
H1b Implementing ISO9901 assures a positive relationship with the wind power suppliers. As an addendum to this research question, with the level of ISO 9001:2008 implementation in the wind power sector, we wonder whether suppliers completely satisfy the requirements of the standard, or if there are, in fact, potential areas for improvement.
We assumed, based on the literature, that there are differences in the level of internalisation of the QMS and their real impact. However, we want to examine whether the technological level of a supplier is connected with the positive relationship we are exploring in the supply chain. Therefore, along the very same lines as other authors (Sroufe and Curkovic, 2008) in relation to the supply chain, and given the technical

8 J. Castelló et al.
complexity of a wind turbine and the variety of industrial sectors that make up a wind power supply chain, we want to explore the different behaviours associated with the level of implementation, and whether these vary according to the sector the supplier belongs to. Thus, we propose the second research question: Is the technical complexity of a wind turbine and its different technologies responsible for the different levels of ISO9001implementation?
3 Methodology
3.1 Sample and data collection
The data used in this paper are based on audits of 90 technical suppliers to a major wind turbine manufacturer. This manufacturer is ranked in the top 15 largest companies in the sector in terms of installed power (BTM Consult, 2011). Located in Europe, but with production centres in the USA and South America as well, it employs more than 1,500 workers and has an income of over €400m per annum (EWEA, 2009).
An extensive literature review revealed there is little empirical evidence of the relationship between ISO 9000 implementation and supplier activities (Lo and Yeung, 2006; Prajogo et al., 2012). Most of the contributions referenced in the literature review section are based on surveys. In this paper, we used primary data from audits of suppliers who were vetted and chosen using very thorough selection criteria.
A substantial number of the companies audited (40%) are global players and have been mentioned in the sector’s specialised journals such as MAKE Consulting (2013) or BTM Consult (2011). Our audits were carried out following the ISO 9001:2008 framework and under the supervision of one of the authors of this paper in his role as the Global Quality Director of the wind turbine company. All the suppliers audited work with the ISO 9001:2008 standard because of a specific requirement from the set of design conditions (IEC 61400-22, 2010) that must be met in order to certify a wind turbine. Furthermore, all the suppliers had passed a previous assessment and selection process and product qualification in accordance with the company’s standard procedure. This procedure is a three-step process beginning with supplier assessment and qualification, followed by supplier/component qualification and finishing when the supplier is authorised for future serial production.
One of the key aspects in selecting suppliers is the different technologies they supply to the wind turbine, which is a highly technical and complex product (Aubrey, 2007). With this complexity in mind, we chose the most significant components and technologies that constitute a wind turbine for the scope of this study. Thus, the core components and suppliers involved in manufacturing a wind turbine were chosen and grouped into six categories: (T1) structural components, (T2) composites (T3) machining (T4) power generation, (T5) general systems, and (T6) painting. Figure 1 shows a typical wind turbine lay-out with the main components of this study.

Evidence for QMS being instrumental in improving supplier performance 9
Figure 1 Layout of the components of a wind turbine (see online version for colours)
Basically, the components and suppliers chosen are those who have a direct impact on the quality, availability, and reliability of a wind turbine, as well and its structural integrity and safety.
The principal components of a wind turbine are:
1 blades
2 extender
3 pitch system
4 hub
5 cover
6 main frame
7 main shaft
8 lights
9 gearbox
10 hydraulic, lubricating and cooling systems
11 mechanical brake
12 generator
13 converter
14 transformer

10 J. Castelló et al.
15 anemometer
16 crane
17 tower
18 yaw system.
Table 1 shows the distribution of the sample classified by technologies. The suppliers are classified into six technologies, although for the purpose of this paper the last (painting) has been ignored for two reasons: its level of complexity is low and there is only one supplier. Table 1 Classification of the main components of a wind turbine by technology
Technology Main components No. of units T1 Structural
components Hub, main frames, structural bolts and nuts, flanges, forged rings, towers, extenders, plates and cutting
plates, foundations, welding frames
24
T2 Composites Blades, nacelle cover, deflector 10 T3 Machining Hub, main frames, support frames, yaw, bearings,
yaw crow, main shaft 25
T4 Power generation Gearbox, generator, electrical cabinets, transformer, pitch system, converter
17
T5 General systems Yaw systems, hydraulic and cooling systems, elevator, internal fits, electrical systems, motor boxes,
crane, mechanical brake, lights, wires
13
T6 Painting Painting 1 Total 90
Table 2 describes the suppliers by location and size, and Table 3 presents the main figures for the audits in terms of number of days required to complete the audits. Table 2 Sample description by location and size
No. of employees Europe South
America North
America Asia Total
>500 8 5 1 8 22 100–500 14 4 3 3 24 <100 37 4 0 3 44 Total 59 13 4 14 90
Table 3 Main figures for the audits
Europe South America
North America Asia Total days
Audits 59 13 4 14 90 Audit days 104 36 7 11 158 Auditors leaders/support
19 6 - 6 31
Countries 8 1 1 3 13

Evidence for QMS being instrumental in improving supplier performance 11
The audits were performed in accordance with the procedures and standards of the company and took between three and five days depending on the size of the supply company being audited and the complexity of the product being produced.
From these tables, the enormous effort involved in collecting the data for this paper can be appreciated. In fact, the rigor of the data collection process is one of the foremost contributions of this paper as, unlike other papers where the data used is based on individual responses to a survey, this paper relies on the data collected during an audit at a supplier’s own facilities and workshops and which was then reviewed and accepted by the suppliers in a final closed audit meeting.
To avoid audit ‘measurement bias’, all the auditors were not only trained to the company’s standards, but also had a week’s training with the company and then during the audits they use the same company guidelines and standards for procedures, instructions, question check list, and criterial scoring. Table 4 Questionnaire description
P1 Management system and responsibility v1 QMS and responsibility (general requirements) v2 Control of documentation v3 Control of records v4 Planning P2 Resource management v5 Competence, training and awareness v6 Infrastructure and work environment P3 Product completion v7 Planning of product completion v8 Customer related processes v9 Design and development v10 Purchasing processes and information v11 Supplier evaluation v12 Product and service provision v13 Preservation of product v14 Identification and traceability v15 Verification of purchased product v16 Control of monitoring and measuring equipment P4 Measuring, analysis and improvement v17 Monitoring and measurement of processes v18 Product monitoring and measurement v19 Data analysis v20 Non-conforming product control v21 Corrective and preventive actions

12 J. Castelló et al.
3.2 Measures
The questionnaire used to assess the suppliers during the audit is based on the ISO 9001:2008 requirements and organised into 21 items spread over the four main processes: (P1) management system and responsibility, (P2) resource management, (P3) product completion, (P4) measuring, analysis and improvement. The company auditor graded these items on a 4-point scale (see Table 4).
The items audited are closely connected to ISO 9001:2008, but as the audit was done by the customer (the wind turbine manufacturer) the answers focus on evaluating product related supply performance. Depending on the value of the answers we were able to validate the level of impact each item has.
The Likert scale value was clear: 0 = not implemented item, 1 = partially implemented item with non-conformities, 2 = implemented item with observations and 3 = fully implemented item. With this scoring, it is possible to understand the level of ISO implementation for each and every item we asked about. However, after this audit the supplier classification is based on additional information. The firm that carried out the audits works with four levels which the suppliers are categorised into based on the grades they obtain. Grade A (85% +) is a fully-authorised supplier, grade B (70%–84%) is an authorised supplier requiring some improvements in the long term, grade C (50%–69%) is a conditionally-authorised supplier whose deliveries require monitoring, and grade D (<50%) is a non-authorised supplier. In order to test the hypothesis, we consider that a supplier has a positive relationship if they are graded as A or B.
4 Results
To achieve this study's objectives, the data analysis was performed in two steps:
1 an overall descriptive analysis of the data to validate the role of ISO 9001:2008 to assure supplier quality
2 a statistical contextual analysis to detect possible differences, by technology, in terms of levels of quality.
To carry out the statistical data analysis we conducted three successive analyses based on the data we had collected from the audits. In the first section, we present the results from the descriptive analysis based on the raw data and then, to analyse the level of implementation of QMS, we used a further contextual analysis.
4.1 Descriptive analysis
Firstly, we analysed the global audit scores (GAS) we obtained in the 90 audits i.e., the average of the audit results for the 21 items from every supplier. Secondly, we analysed the individual grades of the 21 items transversally.
The GAS, gives the supplier both a letter grade and a numerical score for the level of QMS implementation. The results are the following: the sample average is 2.13 out of 3, with a standard deviation of 0.353 within a range of 1.05–2.90. From these results and because of their variation, we can verify (as expected based on the literature review) that there are different levels of implementation. Table 5 presents the classification of the

Evidence for QMS being instrumental in improving supplier performance 13
sample by the suppliers’ location and the numerical scores they obtained, as well as the letter ranking assigned to them by the auditors. The scores obtained by the suppliers are organised into the four levels described earlier.
With the 90 audits (Table 5), we observe that four suppliers received a D (non-authorised supplier), 34 suppliers a C (conditionally-authorised supplier requiring monitoring of deliveries), 43 suppliers a B (authorised supplier requiring long term improvements) and 9 suppliers an A grade (fully-authorised supplier). Table 5 Supplier classification according to GAS
Grade (0–3) EU + Spain
South America
North America Asia Total %
A (>2.5) 5 2 1 1 9 10% B (>=2.1–<=2.5) 31 7 1 4 43 47.8% C (>1.5–<2.1) 20 4 2 8 34 37.8% D (<=1.5) 3 - - 1 4 4.4% Total 90 100%
Table 6 Descriptive statistics of the items
Process Item No. Mean (st. dev.)
D C B A 0–1.5 1.5–2.1 2.1–2.5 2.5–3
(≤49%) (50–70%) (71–84%) (≥85%) P1 v1 87 2.29 (0.63) 2.292
v2 84 2.09 (0.69) 2.092 v3 85 2.27 (0.62) 2.267 v4 86 2.01 (0.68) 2.007
P2 v5 75 2.44 (0.54) 2.439 v6 88 1.96 (0.69) 1.959
P3 v7 86 1.94 (0.71) 1.944 v8 84 2.04 (0.76) 2.043 v9 11 2.15 (0.73) 2.145 v10 68 2.26 (0.65) 2.255 v11 66 2.13 (0.72) 2.129 v12 83 1.88 (0.69) 1.882 v13 85 2.31 (0.69) 2.311 v14 90 2.40 (0.64) 2.401 v15 89 2.28 (0.65) 2.275 v16 85 2.24 (0.65) 2.238
P4 v17 87 2.28 (0.67) 2.284 v18 87 2.24 (0.76) 2.245 v19 66 1.90 (0.72) 1.898 v20 88 2.02 (0.63) 2.021 v21 87 1.81 (0.69) 1.811

14 J. Castelló et al.
The assessment is clear: more than 40% of suppliers were unable to have a positive relationship with the firm because they are classified as C or D. Therefore, we cannot conclude that the ISO 9001 standard ensures a supplier’s quality level in such a way that they can be considered an extended capability for the firm.
Next, we present the results of the 21 items for the whole sample (Table 6). Thus, we can observe that all the items have a B or C classification. This result
confirms the generally accepted idea that ISO assessment is an average. There are no extremes and all items exhibit ‘normal’ behaviour.
On the other hand, there are items which received an average mark of less than 2.1. These are considered as QMS ‘weaknesses’, meaning that in these areas there is a low implementation level and so these will require greater attention from the suppliers and the wind turbine manufactures. These items were: (v2) control of documentation, (v4) planning, (v6) infrastructure and work environment, (v7) planning of product completion, (v8) customer related product, (v12) product and service provision, (v19) data analysis, (v20) non-conforming product control and (v21) corrective and preventive actions.
During the study, we did not find any items with an average below 1.5 (level D), but we did establish that there are suppliers with C or D classifications (Table 5). As a result, we can confirm that ISO 9001:2008 does not guarantee a consistent QMS standard in the wind energy sector and we can identify which areas need to be improved.
4.2 Contextual analysis
The contextual analysis section is structured into two parts that follow the analysis process. Firstly, a principal component analysis was performed to build latent constructs for each main process guided by the ISO 9001 standard. Secondly, an analytical approach was applied to determine whether the technology the supplier had at their disposal could affect the results previously obtained.
Because the analysis is strictly based on the ISO 9001 questionnaire, the authors considered using formative constructs to assess the original main processes.
Different quality criteria are required to assess the measurement properties of the formative constructs. Loadings are misleading because the estimation does not consider the intraset correlations for each block, thus, aspects such as internal reliability and convergent validity are not applicable to formative constructs (Bollen and Lennox, 1991). Psychometric properties are interpreted using weights and their statistical significance, which provide information on how each indicator contributes to the respective construct.
However, we took the precaution to test for multicollinearity. Multicollinearity is an undesirable property in formative models (Diamantopoulos and Winklhofer, 2001) because it may inflate bootstrap standard errors and thus trigger type II errors (Cenfetelli and Bassellier, 2009). An inspection of the variance inflation factor (VIF) using SPSS 20.0 for Windows did not raise any concerns about multicollinearity (Table 7) because the VIF values were well below the cut-off value of 5 (Kleinbaum et al., 1988).

Evidence for QMS being instrumental in improving supplier performance 15
Table 7 Validation of measurement: item reliability and bootstrapping
Variables/indicator Item reliability Significance
(bootstrapping) VIF Weights Significance*
Latent variable 1 (L1) v1 1.259 0.347 ** v2 1.248 0.285 ** v3 1.26 0.549 ** v4 1.274 0.245 ** Latent variable 2 (L2) v5 1.009 0.516 ** v6 1.009 0.809 ** Latent variable 3 (L3) v7 1.47 0.175 ** v8 1.358 0.263 ** v9 1.075 –0.068 v10 1.457 0.203 ** v11 1.358 0.271 ** v12 1.138 0.246 ** v13 1.276 0.226 ** v14 1.266 0.137 v15 1.439 0.121 v16 1.097 0.235 ** Latent variable 4 (L4) v17 1.301 0.276 ** v18 1.219 0.365 ** v19 1.149 0.437 ** v20 1.287 0.223 v21 1.279 0.319 ** Latent variable 5 L1 1.939 0.282 ** L2 1.538 0.128 ** L3 2.715 0.444 ** L4 2.314 0.309 **
Note: Results using Smarts PLS 2.0. ** significant at p-level <0.05.
Source: Ringle et al. (2005)
As for the weight values, the contributions to the formative measure for all dimensions were not significant; as indicated by p-value > 0.05. Nevertheless, they have been included because they belong to the construct from a conceptual point of view. Taken together, these results indicate that the measurement model used in this research is reliable and valid.
Once the latent dimensions were validated, including the second-order latent dimensions composed of the four first-order dimensions, we proceeded to detect statistical differences between suppliers according to their level of technology.
16 J. Castelló et al.
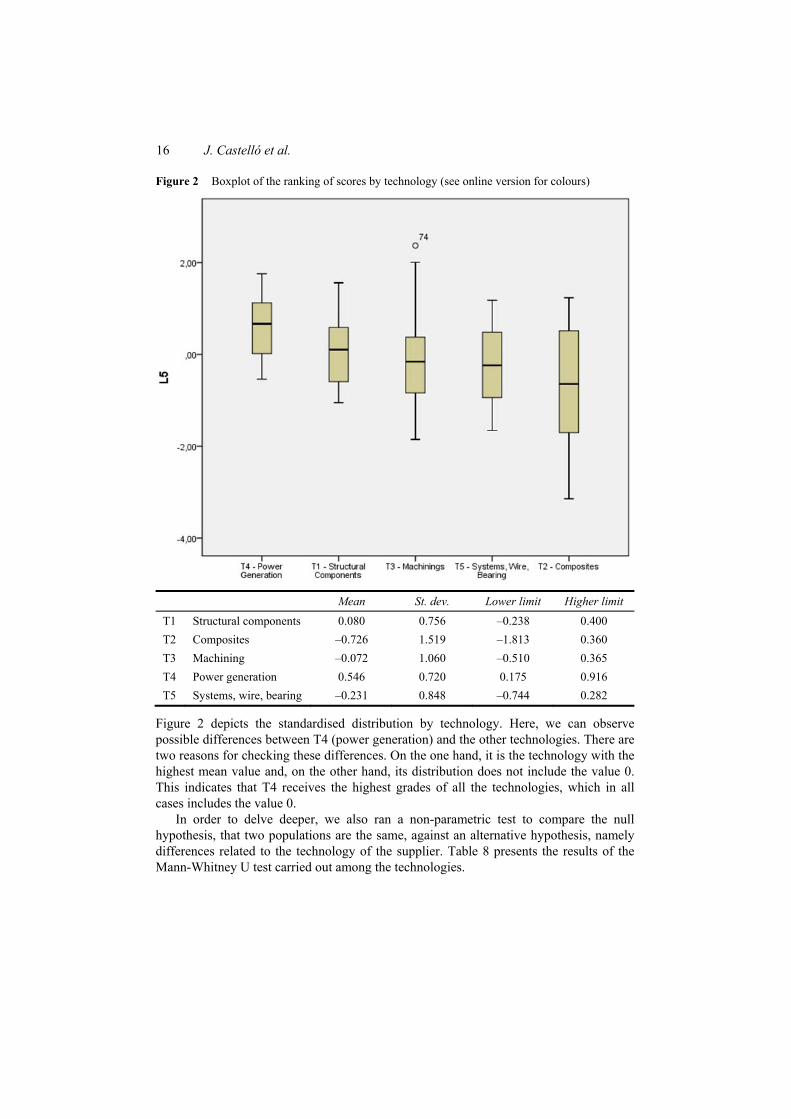
Figure 2 Boxplot of the ranking of scores by technology (see online version for colours)
Mean St. dev. Lower limit Higher limit T1 Structural components 0.080 0.756 –0.238 0.400 T2 Composites –0.726 1.519 –1.813 0.360 T3 Machining –0.072 1.060 –0.510 0.365 T4 Power generation 0.546 0.720 0.175 0.916 T5 Systems, wire, bearing –0.231 0.848 –0.744 0.282
Figure 2 depicts the standardised distribution by technology. Here, we can observe possible differences between T4 (power generation) and the other technologies. There are two reasons for checking these differences. On the one hand, it is the technology with the highest mean value and, on the other hand, its distribution does not include the value 0. This indicates that T4 receives the highest grades of all the technologies, which in all cases includes the value 0.
In order to delve deeper, we also ran a non-parametric test to compare the null hypothesis, that two populations are the same, against an alternative hypothesis, namely differences related to the technology of the supplier. Table 8 presents the results of the Mann-Whitney U test carried out among the technologies.

Evidence for QMS being instrumental in improving supplier performance 17
Table 8 Mann-Whitney U test by technologies
N U Mann-Whitney
W Wilcoxon Z Significance
(bilateral) T1 – struct. components T1 vs. T2 24/10 85 140 –1.323 0.186 T1 vs. T3 24/25 261 586 –0.78 0.435 T1 vs. T4 24/17 134 434 –1.852 0.064* T1 vs. T5 24/13 128 219 –0.891 0.373 T2 – composites T2 vs. T3 10/25 102 157 –0.84 0.401 T2 vs. T4 10/17 43 98 –2.109 0.035** T2 vs. T5 10/13 58 113 –0.434 0.664 T3 – machining T3 vs. T4 25/17 127 452 –2.191 0.028** T3 vs. T5 25/13 156 247 –0.2 0.841 T4 – power generation T4 vs. T5 17/13 56 147 –2.281 0.023**
Note: *significant at p-value <0.10; **significant at p-value <0.05.
5 Discussion of results
In this section, we discuss the audit outcomes in order to answer the two research questions proposed in Section 2.
According to the GAS by supplier (Table 5), more than 40% of the suppliers are classified as C or D. As we explained in the Measures section, we have considered four levels for supplier classification based on the results for the items in question. We found four suppliers in category D, i.e., four suppliers who do not satisfy the standards and could not be considered authorised suppliers. We then found 34 suppliers in category C (conditionally-authorised supplier whose deliveries require monitoring). In the case of these suppliers, some major non-compliance or deviations according to the standard or contractual specifications were detected during the audits. Forty-three suppliers were ranked as B (authorised supplier requiring some long-term improvements), which means in their case we found some minor non-conformities and notes for improvement. Finally, nine suppliers were placed in category A (fully-authorised supplier) as they did not breach any of the rules, standards or contractual specifications. We understand a positive relationship ranking goes to those suppliers graded A or B, because C or D implies extra monitoring activities which do not allow capabilities to be extended beyond the firm.
However, while a QMS according to ISO 9001 is quite widely implemented in the sector, it is not ‘well implemented’ as there are a large number of suppliers falling into category C.
Therefore, we accept hypothesis H1a, because in the wind power sector ISO 9001:2008 is being implemented to varying degrees, and we reject hypothesis H2a because some of the suppliers are qualified as C or D.

18 J. Castelló et al.
To sum up, in relation to the first research question (RQ1) , we can affirm that generally ISO 9001:2008 is a standard implemented in the sector, but we cannot accept that ISO ensures a positive relationship between suppliers and the wind turbine manufacturer and, in fact, there are areas, as demonstrated by the low scoring, which require improvement.
When the 21 items are reviewed individually (Table 6), we can observe points of difference between some of the items. An average below 2.1 points means that during the audit we detected a breach in the standard and so these are areas for improvement. They are v2, v4, v6, v7, v8, v12, v19, v20 and v21. We also present some aspects where there are potential areas for improvement.
To examine the second research question (RQ2), we have to observe results of the contextual analysis.
The model we created was based on a formative principal component analysis based on four main processes guided by ISO 9001. The second order latent variable L5 represents to what degree the supplier in question implements ISO 9001, taking into account the four main processes represented by L1–L4 as first order Latent variables. In Figure 2, the differences between averages in the T4 (power generation) group of technologies and the averages of the other technologies can be observed. These differences are corroborated and validated by the results in Table 8. All significant differences are related to T4 technology, even though there are no differences between the others. Aside from T4 technology, the final order is not significant either, as we cannot be sure of the differences between the degrees of implementation by the suppliers. However, we would like to draw attention to the last position of T2 (composites) technology.
Note that, the components supplied by those suppliers who belong to T4 technology (power generation) are components where the manufacturing processes, with respect to other technologies, have high levels of automation, especially in the case of T2 processes, which contain a great deal of manual content because of the use of moulds and tools. Furthermore, these particular production processes are in of the hands of low-skilled workers.
To sum up, we can say that in the case of the wind power sector, when we are able to assign the degree of QMS implementation using a model and stratify suppliers by manufacturing technologies, and we were able to observe diverse behaviours in their implementation and significant differences, especially in relation to T4, which has a higher degree of implementation than the others.
6 Conclusions
In this article, we have provided evidence for integrating the concepts of upstream Supply Chain and QMS to test the use of suppliers as extended resources in very complex product sectors, such as the wind generation sector. However, this behaviour does not extend to all technologies, with some of them showing significant differences in the audit results.
According to the GAS outcomes, we observe that, on average, all the suppliers ensure a minimum quality level as the overall GAS outcome is 2.13 points, i.e., higher than the 2.1 cut-off point. However, due to the deviation of the GAS outcome, we have detected suppliers who fall into categories C and D. In this sense, we must stress that ISO

Evidence for QMS being instrumental in improving supplier performance 19
certification alone does not ensure anything beyond a compliance with the standard and that certification only shows that a QMS exists in the organisation, but cannot ensure a company’s efficiency or its extension of capabilities through its suppliers.
Furthermore, in view of the data obtained from the study of the 21 items and the four main processes (Table 6), we can confirm that ISO 9001:2008 is the standard implemented across the wind energy sector and that we did not detect any significant differences between the 21 items. Nevertheless, as we mentioned in the Discussion section, we have identified some areas for improvement: (v2) control of documentation, (v4) planning, (v6) infrastructure and work environment, (v7) planning of product completion, (v8) customer related product, (v12) product and service provision, (v19) data analysis, (v20) non-conforming product control, and (v21) corrective and preventive actions. Moreover, all these items are basically related to P3 (product realisation) and P4 (measurement, analysis and improvement). Despite this finding from the descriptive analysis, the results of the contextual analysis highlight and validate the reality of many practitioners' daily experience. There are significant differences in implementation between different ‘technological families’ that constitute a wind turbine and have the ISO 9001: 2008 standard in operation. Therefore, it is not possible to consider the ISO 9000 series as being the only way to validate a QMS.
After the audits, we organised a number of interviews with some Supplier Quality Assurance Engineer (SQAE) auditors to gather their opinions and explore their feelings about the appraisals. They agree that ISO 9001:2008 is a good tool for aligning company processes towards achieving company integration, but it does not go far enough in some key aspects, such as product completion, data analysis, and corrective and preventive actions.
A lesson learnt from this research is that, although ISO 9001 is implemented in the sector, there are several items or areas which need improving and which are connected directly to the product, namely
1 product completion
2 measurement analysis and improvement.
We can also conclude that the QMS model, according to ISO 9001: 2008, is a general model and is not sufficiently exact to meet the specific product requirements of certain sectors with a high demand of technical complexity.
Hence, some sectors have developed sector-specific QMS, such as QS 9000 for the automotive industry and AS 9000 for the aerospace industry, TE 9000 for tooling and equipment, TL 9000 for telecommunications, PS 9000 for pharmaceutical packaging materials or GMP for food, drug and pharmaceutical products, GLP for laboratories or FDA for foodstuffs, drugs and cosmetics. These sectors have specific quality management standards to ensure they meet their sector’s specific technical requirements.
In the wind energy sector, we found differing degrees of QMS implementation, depending on the technology being used and/or product complexity, and we tested these differences statistically based on the results from supplier audits. Furthermore, as mentioned in the literature review, the ISO 9001:2008 standard implicitly refers to the supply chain concept as ‘supplier-organisation-customer’ but, in fact, focuses specifically on a company’s internal organisation and does not examine upstream and downstream relationships in depth.

20 J. Castelló et al.
As we mentioned in the introduction, competition between supply chains, rather than competition between individual companies has become more important’. For this reason, (and based on our day-to-day experience and the outcomes of this study), efficiently managing the relationship between company and supplier beyond ISO certification is a key factor in successful performance.
From the authors’ the point of view, ISO 9001 must be adopted for concepts and tools [e.g., supplier development, supplier monitoring, advanced quality plans (AQP), production part approval processes (PPAP) etc.]. However, improving the quality of products, the relationship between customer and suppliers, and of course improving a company’s efficiency and their supply chain are all issues which need addressing in depth.
One of the limitations of this work, is that it has focussed solely on the wind power sector, however, its findings can be extended to other high-tech industrial sectors as well.
Moreover, from the literature review of SCM and QMS (in ISO 9000 model) integration, we have found that the majority of data collection comes from surveys (surveyed feelings and perceptions), whereas in our research we have used primary data collect through customer audits (second-party audits). Furthermore, the extensive literature review demonstrates a lack of empirical evidence regarding the relationship between ISO 9000 implementation and second-party audits. Hence, we encourage researchers to analyse SCM and QMS integration using field data collection methods.
Finally, we would like to highlight the theoretical and managerial implications of this paper as its findings lead to a number of implications for managers and researchers. From a managerial point of view, as mentioned in the introduction, compliance with the ISO 9001 accreditation requires a third-party audit and certification. However, managers should also consider second-party audits as, in our opinion, they have a positive impact for both customer and suppliers. They can help suppliers improve their manufacturing processes and, subsequently, the quality of their product(s). Furthermore, the suppliers can compare themselves to their competitors and identify and eliminate any weak points they may have. Supplies have the opportunity to see their process from the customer’s point of view; a point of view which is often more critical and more relevant.
Therefore, from the theoretical perspective, the ISO 9001 standard should be focused on upstream supply chain activities. Suppliers’ relationships are a critical echelon in the supply chain because, as we mentioned earlier, quality problems usually cross the organisation’s boundaries and have an impact on the entire supply chain.
Acknowledgments
The authors are grateful for the financial support from the Spanish Ministry of Economy and Competitiveness ECO2013-46954-C3-3-R and from the Autonomous Government of Catalonia 2014 SGR 868.
References Anderson, S.W., Daly, J.D. and Johnson, M.F. (1999) ‘Why firms seek ISO 9000 certification:
regulatory compliance competitive advantage?’, Production Operations Management, Vol. 8, No. 1, pp.28–43.

Evidence for QMS being instrumental in improving supplier performance 21
Aubrey, C. (2007) ‘Supply chain: the race to meet demand’, Wind Directions, January/February, pp.27–34 [online] http://www.ewea.org/publications/wind-directions/archive/.
Bollen, K. and Lennox, R. (1991) ‘Conventional wisdom on measurement: a structural equation perspective’, Psychological Bulletin, Vol. 110, No. 2, pp.305–314.
Brown, A., van der Wiele, T. and Loughton, K. (1998) ‘Smaller enterprises’ experiences with ISO 9000’, International Journal of Quality and Reliability Management, Vol. 15, No. 3, pp.273–285.
BTM Consult (2011) International Wind Energy Development, Supply Chain Assessment 2012–2015, BTM Consult.
Casadesús, M. and de Castro, R. (2005) ‘How improving quality improves supply chain management: empirical study’, The TQM Magazine, Vol. 17, No. 4, pp.345–357.
Casadesús, M. and Karapetrovic, S. (2005) ‘Has ISO 9000 lost some of its lustre? A longitudinal impact study’, International Journal of Operations and Production Management, Vol. 2, No. 6, pp.580–596.
Castelló, J., De Castro, R. and Bikfalvi, A. (2016) ‘Hybrid supply chain strategies in wind business’, in Addo-Tenkorang, R. et al (Eds.): Supply Chain Strategies and the Engineer-to-Order Approach, IGI Global, pp.201–223.
Castka, P., Prajogo, D., Sohal, A. and Yeung, A.C.L. (2015) ‘Understanding firms’ selection of their ISO9000 third-party certifiers’, International Journal Production Economics, Vol. 162, pp.125–133 [online] http://www.sciencedirect.com/science/article/pii/S0925527315000249.
Cenfetelli, R.T. and Bassellier, G. (2009) ‘Interpretation of formative measurement in information systems research’, Management Information Systems Quarterly, Vol. 33, No. 4, pp.7–15.
Chen, C.C. and Yang, C.C. (2002) ‘Cost-effectiveness based performance evaluation for suppliers and operations’, Quality Management Journal, Vol. 9, No. 4, pp.59–73.
Chow-Chua, C., Goh, M. and Boon Wan, T. (2003) ‘Does ISO 9000 certification improve business performance?’, International Journal of Quality and Reliability Management, Vol. 20, No. 8, pp.936–953.
Christopher, M. and Peck, H. (2004) ‘Building the resilient supply chain’, The International Journal of Logistics Management, Vol. 15, No. 2, pp.1–14.
Christopher, M. and Towill, D.R. (2000) ‘Supply chain migration from lean and functional to agile and customised’, Supply Chain Management: An International Journal, Vol. 5, No. 4, pp.206–213.
Curkovic, S. and Pagell, M. (1999) ‘A critical examination of the ability of ISO 9000 certification to lead a competitive advantage’, Journal of Quality Management, Vol. 4, No. 1, pp.55–67.
Davis, B. (2004) ‘One standard fits all’, Professional Engineering, Vol. 17, No. 9, pp.43–45. Diamantopoulos, A. and Winklhofer, H. (2001) ‘Index construction with formative indicators:
an alternative to scale development’, Journal of Marketing Research, Vol. 38, No. 2, pp.269–277.
Dimara, E., Skuras, D., Tsekouras, K. and Goutsos, S. (2004) ‘Strategic orientation and financial performance of firms implementing ISO 9000’, The International Journal of Quality and Reliability Management, Vol. 21, No. 1, pp.72–90.
El Mokadem, M. (2016) ‘ISO 9000 moderation role over supply chain alignment in manufacturing context’, Journal of Manufacturing Technology Management, Vol. 27, No. 3, pp.338–363.
European Wind Energy Association (EWEA) (2009) Wind Energy – The Facts. The Economics of Wind Power, Routledge, London.
Fawcett, S., Ellram, L. and Odgen, J. (2006) Integrated Supply Chain Management: An Integrative Approach, Upper Saddle River, Prentice Hall, NJ.
Fisher, M. (1997) ‘What is the right supply chain for your product?’, Harvard Business Review, March–April, pp.105–116 [online] https://hbr.org/archive-toc/3972.

22 J. Castelló et al.
Flynn, B.B. and Flynn, E.J. (2005) ‘Synergies between supply chain and quality management: emerging implications’, International Journal of Production Research, Vol. 43, No. 16, pp.3421–3436.
Foster, S.T. (2008) ‘Towards an understand of supply chain quality management’, Journal of Operations Management, Vol. 26, No. 4, pp.461–446.
Gunasekaran, A. and McGaughey, R.E. (2003) ‘TQM is supply chain management’, The TQM Magazine, Vol. 15, No. 6, pp.361–363.
Hadzhiev, B. (2012) Second – Party Quality Auditing in the Automotive Industry, PhD Thesis. Jacobs University, Bremen, Germany.
Hong, P., Marvel, J.H. and Modi, S, (2015) ‘A survey of business network integration: implications for quality and productivity performance’, International Journal Productivity and Quality Management, Vol. 15, No. 2, pp.131–152.
İlkay, M.S. and Aslan, E. (2012) ‘The effect of the ISO 9001 quality management system on the performance of SMEs’, International Journal of Quality & Reliability Management, Vol. 29, No. 7, pp.753–778.
International Electrotechnical Commission (IEC) 61400-22 (2010) Wind Turbines – Part 22: Conformity Testing and Certification, Genève.
Kanji, G.K. and Wong, A., (1999) ‘Business excellence model for supply chain management’, Total Quality Management, Vol. 10, No. 8, pp.1147–1168.
Kannan, V.R. and Tan, K.C. (2005) ‘Just in time, total quality management and supply chain: understanding their linkages and impact on business performance’, The International Journal of Management Science Omega, Vol. 33, No. 2, pp.153–163.
Kaynak, H. and Harley, J.L. (2008) ‘A replication and extension of quality management into the supply chain’, Journal of Operations Management, Vol. 26, No. 4, pp.468–489.
Kleinbaum, D.G., Kupper, L.L. and Muller, K.E. (1988) Applied Regression Analysis and Other Multivariable Methods, Duxbury Press, Belmont, CA.
Kluse, C. (2013) ‘Third-party quality management system audits: perceptions, limitations, and recommended improvements’, Quality Issues and Insights in the 21 Century, Vol. 2, No. 1, pp.28–45.
Kuei, C. and Madu, C.N. (2001) ‘Identifying critical success factors for supply chain quality management’, Asia Pacific Management Review, Vol. 6, No. 4, pp.409–423.
Lin, C., Chow, W.S., Madu, C.N., Kuei, C. and Yu, P.P. (2005) ‘A structural equation model of supply chain quality management and organizational performance’, International Journal of Production Economics, Vol. 96, No. 3, pp.355–365.
Lin, C., Kuei, C-h. and Chai, K-W. (2013) ‘Identifying critical enablers and pathways to high performance supply chain quality management’, International Journal of Operations & Production Management, Vol. 33, No. 3, pp.347–370.
Lo, V.H.Y. and Yeung, A. (2006). ‘Managing quality effectively in supply chain: a preliminary study’, Supply Chain Management: An International Journal, Vol. 11, No. 3, pp.208–215.
MAKE Consulting (2013) Market Report Global Wind Power Supply Chain, Aarhus, Denmark. Martínez-Costa, M., Martínez-Lorente, A.R. and Choi, T.Y. (2008) ‘Simultaneous consideration of
TQM and ISO 9000 on performance and motivation: an empirical study of Spanish companies’, International Journal of Production Economics, Vol. 113, No. 1, pp.23–39.
Mathews, J.A. (2003) ‘Strategizing by firms in the presence of markets for resources’, Industrial and Corporate Change, Vol. 12, No. 6, pp.1157–1193.
Maurya, A.H., Narkhede, B.E., Raut, R.D. and Shrawge, A.S. (2013) ‘Suppliers selection in supply chain using analytical hierarchy process’, International Journal Productivity and Quality Management, Vol. 11, No. 3, pp.357–369.
Morris, P.W. (2006) ‘ISO 9000 and financial performance in the electronics industry’, Journal of American Academy of Business, Vol. 8, No. 2, pp.227–235.

Evidence for QMS being instrumental in improving supplier performance 23
Naveh, E. and Marcus, A. (2005) ‘Achieving competitive advantage through implementing a replicable management standard: Installing and using ISO 9000’, Journal of Operations Management, Vol. 24, No. 1, pp.1–26.
Power, D. and Terziovski M. (2007) ‘Quality audit roles and skills: perceptions of non-financial auditors and their clients’, Journal of Operations Management, Vol. 25, No. 1, pp.126–147.
Prajogo, D., Huo, B. and Han, Z. (2012) ‘The effects of different aspects of ISO 9000 implementation on key supply chain management practices and operational performance’, Supply Chain Management: An International Journal, Vol. 17, No. 3, pp.306–322.
Prostean, G., Badeaa, A., Vasarb, C. and Octavian, P. (2014) ‘Risk variables in wind power supply chain’, Procedia – Social and Behavioral Sciences, Vol. 124, pp.124–132 [online] http://www.sciencedirect.com/science/article/pii/S1877042814020163.
Ringle, C.M., Wende, S. and Will, A. (2005) Smart PLS 2.0 (Beta), University of Hamburg, Hamburg, Germany.
Robinson, C.J. and Malhotra, M.K. (2005) ‘Defining the concept of supply chain quality management and its relevance to academic and industrial practice’, International Journal of Production Economics, Vol. 96, No. 3, pp.315–337.
Romano, P. (2002) ‘Impact of supply chain sensitivity to quality certification on quality management practices and performance’, Total Quality Management, Vol. 13, No. 7, pp.981–1000.
Romano, P. and Vinelli, A. (2001) ‘Quality management in a supply chain perspective’, International Journal of Operations and Production Management, Vol. 21, No. 4, pp.446–460.
Rungtusanatham, M., Salvador, F., Forza, C. and Choi, T.Y. (2003) ‘Supply-chain linkages and operational performance’, International Journal of Operations and Production Management, Vol. 23, No. 9, pp.1084–1099.
Sila, I., Ebrahimpour, M. and Birkholz, C. (2006) ‘Quality in supply chains: an empirical analysis’, Supply Chain Management: An International Journal, Vol. 11, No. 6, pp.491–502.
Soh, K.L., Jayaraman, K., Yen, T.S. and Kiumarsi, S. (2016) ‘The role of suppliers in establishing buyer-supplier relationship towards better supplier performance’, International Journal Productivity and Quality Management, Vol. 17, No. 2, pp.183–197.
Sroufe, R. and Curkovic, S. (2008) ‘An examination of ISO 9000:2000 and supply chain quality assurance’, Journal of Operations Management, Vol. 26, No. 4, pp.503–520.
Talib, F., Rahman, Z. and Qureshi, M.N. (2010) ‘Integrating total quality management and supply management: similarities and benefits’, The IUP Journal of Supply Chain Management, Vol. 7, No. 4, pp.26–44.
Tan, K.C., Kannan, V.J. and Handfield, R.B. (1998) ‘Supply chain management: supplier performance and firm performance’, International Journal of Purchasing and Materials Management, Vol. 34, No. 3, pp.2–9.
Terziovski, M. and Guerrero J.L. (2014) ‘ISO 9000 quality system certification and its impact on product and process innovation performance’, International Journal Production Economics, Vol. 158, pp.197–207 [online] http://www.sciencedirect.com/science/article/pii/S0925527314002692.
Truong Q.H., Sampaio, P., Sameiro Carvalho, M., Fernandes, A.C., Thi Binh, D. and Vilhenac, E. (2016) ‘An extensive structural model of supply chain quality management and firm performance’, International Journal of Quality & Reliability Management, Vol. 33, No. 4, pp.444–464.
Truong, Q.H., Sampaio, P., Sameiro Carvalho, M., Fernandes, A.C., Thi Binh, D. and Vilhenac, E. (2016) ‘An extensive structural model of supply chain quality management and firm performance’, International Journal of Quality & Reliability Management, Vol. 33, No. 4 pp.444–464.

24 J. Castelló et al.
Tsekouras, K., Dimara, E. and Skuras, D. (2002) ‘Adoption of a quality assurance scheme and its effects on firm performance: a study of Greek firms implementing ISO 9000’, Total Quality Management, Vol. 13, No. 6, pp.827–841.
Vanichchinchai, A. and Igel, B. (2009) ‘Total quality management and supply chain management: similarities and differences’, The TQM Journal, Vol. 21, No. 3, pp.249–260.
Wilburn, D.R. (2011) Wind Energy in the United States and Materials Required for the Land-based Wind Turbine Industry from 2010 Through 2030: U.S. Geological Survey Scientific Investigations Report 2011–5036 [online] http://pubs.usgs.gov/sir/2011/5036 (accessed 17 July 2016).
Willem, M. (2004) ‘Make a smooth change to TS 16949’, Quality, Vol. 43, No. 8, pp.40–44. Zaramdini, W. (2007) ‘An empirical study of the motives and benefits of ISO 9000 certification:
the UAE experience’, International Journal of Quality and Reliability Management, Vol. 24, No. 5, pp.472–491.