Embed Size (px)
Citation preview

SANDIA REPORT
SAND2007-1051 Unlimited Release Printed February 2007 Evaluation of Weld Porosity in Laser Beam Seam Welds: Optimizing Continuous Wave and Square Wave Modulated processes.
Jerome T. Norris, Matthew J. Perricone, R. Allen Roach, Kevin M. Faraone, and Chad M. Ellison
Prepared by Sandia National Laboratories Albuquerque, New Mexico 87185 and Livermore, California 94550 Sandia is a multiprogram laboratory operated by Sandia Corporation, a Lockheed Martin Company, for the United States Department of Energy’s National Nuclear Security Administration under Contract DE-AC04-94AL85000. Approved for public release; further dissemination unlimited.

2
Issued by Sandia National Laboratories, operated for the United States Department of Energy by Sandia Corporation.
NOTICE: This report was prepared as an account of work sponsored by an agency of the United States Government. Neither the United States Government, nor any agency thereof, nor any of their employees, nor any of their contractors, subcontractors, or their employees, make any warranty, express or implied, or assume any legal liability or responsibility for the accuracy, completeness, or usefulness of any information, apparatus, product, or process disclosed, or represent that its use would not infringe privately owned rights. Reference herein to any specific commercial product, process, or service by trade name, trademark, manufacturer, or otherwise, does not necessarily constitute or imply its endorsement, recommendation, or favoring by the United States Government, any agency thereof, or any of their contractors or subcontractors. The views and opinions expressed herein do not necessarily state or reflect those of the United States Government, any agency thereof, or any of their contractors. Printed in the United States of America. This report has been reproduced directly from the best available copy. Available to DOE and DOE contractors from
U.S. Department of Energy Office of Scientific and Technical Information P.O. Box 62 Oak Ridge, TN 37831 Telephone: (865) 576-8401 Facsimile: (865) 576-5728 E-Mail: [email protected] Online ordering: http://www.osti.gov/bridge
Available to the public from U.S. Department of Commerce National Technical Information Service 5285 Port Royal Rd. Springfield, VA 22161 Telephone: (800) 553-6847 Facsimile: (703) 605-6900 E-Mail: [email protected] Online order: http://www.ntis.gov/help/ordermethods.asp?loc=7-4-0#online

3
SAND2007-1051 Unlimited Release
Printed February 2007
Evaluation of Weld Porosity in Laser Beam Seam Welds: Optimizing Continuous Wave and Square
Wave Modulated processes.
Jerome T. Norris, Matthew J. Perricone, & R. Allen Roach 1813 Joining and Coatings
Sandia National Laboratories P.O. Box 5800
Albuquerque, New Mexico 87185-0889
Kevin M. Faraone & Chad M. Ellison Honeywell FM&T
2000 E 95th St. Kansas City, MO 64131-3030
Abstract Nd:YAG laser joining is a high energy density (HED) process that can produce high-speed, low-heat input welds with a high depth-to-width aspect ratio. This is optimized by formation of a “keyhole” in the weld pool resulting from high vapor pressures associated with laser interaction with the metallic substrate. It is generally accepted that pores form in HED welds due to the instability and frequent collapse of the keyhole. In order to maintain an open keyhole, weld pool forces must be balanced such that vapor pressure and weld pool inertia forces are in equilibrium. Travel speed and laser beam power largely control the way these forces are balanced, as well as welding mode (Continuous Wave or Square Wave) and shielding gas type. A study into the phenomenon of weld pool porosity in 304L stainless steel was conducted to better understand and predict how welding parameters impact the weld pool dynamics that lead to pore formation. This work is intended to aid in development and verification of a finite element computer model of weld pool fluid flow dynamics being developed in parallel efforts and assist in weld development activities for the W76 and future RRW programs.

4
Acknowledgments The authors would like to thank the many people at Sandia National Laboratories that contributed to various aspects of this study. The assistance of A. Kilgo and her colleagues in the Metallography Lab (1822) are greatly appreciated, as are the efforts of S. Holmes in radiography. Many thanks to E. Vernon and P. Fuerschbach for their recognition of the fundamental need for work in this area that made funding of this project possible. The contribution of D. MacCallum to the editing of this report also deserves recognition. Finally, the insightful conversations with P. Gorman and G. Pressley regarding this work were much appreciated.

5
Contents Acknowledgments.................................................................................................4 1. Introduction ................................................................................................9 2. Experimental Setup....................................................................................9 3. Results & Discussion ...............................................................................10
3.1 Characterization of porosity..................................................................10 3.2 Effects of CW Power and Travel Speed...............................................12 3.3 Effect of Gas Shielding on CW welds...................................................15 3.4 Introduction to Square Wave (SQW) Modulation .................................17 3.5 Effect of Square Wave Modulation Welding Parameters .....................19
4. Conclusions..............................................................................................25
Figures
Figure 1: Weld setup schematic identifying fixturing and shield gas
orientation relative to the laser beam .......................................................10 Figure 2: X-ray Radiography identifying pore formation types for argon
shielded sharp focus Rofin CW LBW’s.....................................................11 Figure 3: Argon shielded sharp focus Rofin CW LBW’s with 120 mm lens.
250 – 1200 W, 30 – 80 ipm (Left). Transverse micrographs (right) at 80 ipm 680 W (A) and 30 ipm 450 W (B) having equal penetration of 0.058” .......................................................................................................11
Figure 4: Argon shielded sharp focus Rofin CW LBW’s with 120 mm lens. 250 – 1200 W, 30 – 80 ipm ......................................................................12
Figure 5: Argon shielded sharp focus Rofin CW LBW’s with 120 mm lens. 250 – 1200 W, 30 – 80 ipm ......................................................................13
Figure 6: Argon shielded sharp focus Rofin CW LBW’s. 250 – 1000 W, 40 ipm. Table specifies laser beam diameter for each lens at sharp focus. .......................................................................................................15
Figure 7: Sharp focus Rofin CW LBW’s at 350 – 1200 W, 40 ipm. 70 CFH flow rate....................................................................................................15
Figure 8: X-ray radiography exhibiting episodic root porosity for deep penetration argon (a.) and helium (b.) welds. Rofin CW, 935 W, 40 ipm ...........................................................................................................16
Figure 9: X-ray radiography contrasting approximately equal penetration welds made under various gas shielding conditions. Rofin CW , 1165 W, 40 ipm. 70 CFH flow rate ....................................................................16

6
Figure 10: Transverse metallographic cross-sections depicting changes in heat flow patterns for changing travel speed and shield gas type. 1165 W, 40 ipm (a.) and 80 ipm (b.) welded with argon shielding. Rofin CW, 1165 W, 40 ipm welded with nitrogen (c.) ...............................17
Figure 11: Schematic of SQW modulation operator defined parameters ............18 Figure 12: Integrating sphere temporal wave form measurements. Constant
50% Pp modulation...................................................................................19 Figure 13: Prometec laser Scope characterization of various focal length
lenses (left). Weld depth characterization map – parameters limited by visual acceptance criteria - §3.4 (right). High flow rate UHP argon ....20
Figure 14: Penetration map contrasting weld mode, 200 mm lens (left). Metallographic transverse sections displaying the effect of weld mode – 36 ipm, 435 W (right).............................................................................21
Figure 15: Penetration map comparing high and low weld speeds. Lines depicted only to relay approximate changes in penetration efficiency (ηp) for changing weld speed @ 100% Pp. High flow UHP argon, 160 mm lens....................................................................................................22
Figure 16: Porosity/penetration map representing multiple weld speeds and various SQW modulation parameters (left). X-ray radiographs representative of various porosity levels (right). High flow UHP argon. .......................................................................................................23
Figure 17: Porosity/penetration map representing multiple weld speeds and various SQW modulation parameters. High flow UHP argon. .................24
Figure 18: Porosity/penetration map representing multiple weld speeds and various SQW modulation parameters. High flow UHP argon ..................24
Figure 19: 100% Pp SQW modulated LBW’s with a 120 mm lens. High flow UHP argon ...............................................................................................25

7
Nomenclature
CW Continuous Wave
DC Duty Cycle
D/W Depth-to-width aspect ratio
EDM Electric Discharge Machining
HED High Energy Density
LBW Laser Beam Welding
Nd:YAG Neodymium-doped Yttrium Aluminum Garnet
SQW Square Wave (Modulation)
ηp Weld Penetration Efficiency
%Pp Percent Peak Power
%Pmean Percent Mean Power

8

9
1. Introduction Formation of weld porosity is problematic in continuous wave (CW) or square wave modulated Nd:YAG laser welding, particularly for high power, sharp focus welds. Although its presence is not necessarily catastrophic, it remains undesirable and poses not-easily-quantified risks; weld strength being a main concern. The extent to which the attendant strength reduction is problematic depends upon the weldment’s intended application, weld joint type, loading forces, and (most importantly) porosity characteristics: size, frequency, and location. Each of these characteristics detract from the inherent benefits of high power Nd:YAG laser beam welding (LBW): high production speeds, deep weld penetration, and low heat input. Furthermore, assessing weld reliability in the presence of these pores can be difficult. Common remedies to this phenomenon involve defocusing the beam, reducing weld speed, or readjusting power, but these adjustments are generally applied unsystematically in reaction to observed weld behavior. The present study seeks to quantitatively identify mechanisms that govern pore formation using CW and square wave modulated lasers in an effort to predict and control pore formation characteristics and minimize porosity wherever possible. In doing so, a broad operating space of laser welding will be characterized for each laser power mode.
2. Experimental Setup A Rofin Sinar CW 015 HQ Nd:YAG laser and a Lumonics JK802 Nd:YAG laser were used to make sharp focus standing edge welds on 304L stainless steel (Figure 1). Both lasers are fiber delivered and flash lamp driven. Weld samples were 4 X 1 X 0.050” with weld lengths of approximately 3.5”. Power was measured prior to each test set with either an Ophir Nova II meter with a 1000 W thermal head detector or Macken Instruments P2000 laser power probe. Average power ranged from 250 – 1200 W at travel speeds from 30 – 80 ipm with a 1/e2 spot size of 200 – 400 µm. Spot size was measured with a Prometec Laser Scope UFF100. All welds were made at sharp focus using 80, 120, 160, 200 mm lenses. Square wave modulation was applied at amplitudes of 50, 100, and 150% peak power. Modulation frequency was adjusted to provide 75 – 85% overlap at the range of travel speeds studied. Weld samples were wire cut (electric discharge machining, EDM) and lightly machined along one length to remove any EDM wire deposit and to maintaining square corners while inducing minimal deformation for optimum part fitup. Weld porosity was quantified in terms of nominal pore diameter, frequency, and location via X-ray radiography. Longitudinal and transverse metallographic sectioning allowed assessment of weld penetration, width, and cross-sectional area. Shielding gas was delivered with a side shield nozzle leading the weld pool (CW tests) or coaxially (Square Wave Modulated tests) at >70 CFH. Gas type was varied using UHP argon, nitrogen, carbon dioxide, and unshielded (in air) welds.

10
Figure 1: Weld setup schematic identifying fixturing and shield gas orientation relative to the laser beam. Specific setup for Rofin CW tests. Lumonics SQW modulated tests utilized co-axial shielding.
3. Results & Discussion 3.1 Characterization of porosity: X-ray radiography was used to characterize porosity throughout the fusion zone. The standing edge joint geometry allowed for a “side-to-side” x-ray of the sample to be obtained, resulting in images that reduce pore volume to a two-dimensional space relative to its penetration. Pore location along the weld width cannot be determined as no “top-down” x-rays were taken. Thus, differentiating individual pores in the same plane relative to the weld width was not possible. As a result, some pores appeared irregular in shape or oversized, limiting pore analysis to approximations of pore diameter, location and frequency. While some inference of pore location relative to width may be taken from metallographic transverse cross-sections this information was not perceived critical to the pore analysis. Due to contrasting difference between the pores and the surrounding material, the pore diameter resolution was limited to 0.005”. Pores measuring less than 0.005” diameter were defined as micro pores. For each sample, pore diameter and frequency were measured by the average pore height and the number of pores within a section of weld. Multiple sections for each sample, typically ¾ – 1” long, were measured and averaged. Location was referenced relative to weld penetration.
Laser Beam
Gas Shielding
v
Weld Sample
Welding Fixture

11
Figure 2: X-ray Radiography identifying pore formation types for argon shielded sharp focus CW LBW’s.
Analysis of Rofin CW welds exhibited three types of porosity formation: Uniform, Transitional and Root porosity (Figure 2). Uniform porosity displayed an even distribution of smaller pores throughout the fusion zone. This type of porosity was observed at high weld velocities (i.e. 80 ipm). Root porosity, which predominately formed at the root of the weld, was relatively consistent in size for a given set of weld parameters and appeared periodically along the length of the weld. This seems to imply keyhole collapse occurs at a finite frequency. Transitional porosity exhibited characteristics of both – root formed pores as well as smaller pores throughout the fusion zone.
Figure 3: Argon shielded sharp focus Rofin CW LBW’s with 120 mm lens. 250 – 1200 W, 30 – 80 ipm (Left). Transverse micrographs (right) at 80 ipm 680 W (A) and 30 ipm 450 W (B) having equal penetration of 0.058”.
0
0.02
0.04
0.06
0.08
0.1
0.12
0
0.005
0.01
0.015
0.02
0.025
0.03
0.035
0.04
400 600 800 1000 1200
30 ipm40 ipm60 ipm80 ipm
Pene
trat
ion
(Inch
es)
Pore Diam
eter (Inches)
Power (W)
Transitional porosity
Uniform porosity
Root porosity
B. A.

12
3.2 Effects of CW Power and Travel Speed: A broad range of welding parameters were covered in this study, yielding welds of various sizes and penetrations. Analysis of the 120 mm lens (~275 µm spot diameter) data set welded with UHP argon yielded a porosity / penetration map where pore size and weld depth was identified as a function of CW power (250 – 1200 W) and travel speed (30 – 80 ipm). The solid lines correspond to power vs. penetration while the dashed lines identify trends in changing pore diameter as a function of changing power. Each line is color coded respective to its weld speed; travel speed increases from upper left to lower right. These data demonstrate that increasing travel speed greatly decreases the nominal pore size for a given penetration. Weld A of Figure 3 was made at 80 ipm / 680 W yielding occasional micro porosity (the two pores seen in the Weld A cross section are less then 0.003” in diameter) while Weld B was made at 30 ipm / 450 W producing root porosity with a nominal pore size of 0.006” (pores not shown in this cross-section). Weld area analysis showed welds A and B (Figure 3) to have comparable weld depths of ~0.058” despite their considerable difference in heat input; 510 and 900 J/in, respectively. The higher travel speed of the low heat input weld (weld A) presumably limited the width of the keyhole reducing overall weld volume however without hampering weld depth. It is noteworthy that many higher heat input welds resulted in rolled corners of the standing edge joint. Conversely, selective welding parameters with lower heat input produced equal penetration welds of narrower width leaving joint corners undisturbed. These observations highlight the fact that multiple sets of welding parameters can achieve a specified penetration with very different resultant weld pool shapes and porosity forming tendencies.
0
0.005
0.01
0.015
0.02
0.025
0.03
0.035
0.04
0 1 2 3 4 5 6 7 8
30 ipm40 ipm60 ipm
80 ipm
Pore
Dia
met
er (I
nche
s)
Weld Cross-sectional Area (mm^2) Figure 4: Argon shielded sharp focus Rofin CW LBW’s with 120 mm lens. 250 – 1200 W, 30 – 80 ipm.
Characterization of the effect of weld parameters on the direction of heat flow into the part is crucial to understanding the mechanisms driving porosity formation and devising methods by which to avoid its occurrence. From an application perspective, the

13
functionality of a weld is strongly, but not exclusively, related to the depth of penetration, or melting along the joint interface. The width of the keyhole, extending normal to the joint, is more closely related to the part fit-up tolerances for a given set of welding parameters rather than joint strength. As shown in Figure 3, Welds A & B have identical penetration depths but differ in the volume of weld metal and propensity for porosity formation. These differences can be tied to the amount of heat input associated with each set of welding parameters. For heat-sensitive components, minimization of heat input to achieve the desired weld penetration is an absolute necessity. From an engineering standpoint then, a reasonable way to quantify this figure of merit is to define a parameter called Weld Penetration Efficiency (ηp), which is the acquired depth of penetration per unit of heat input. Primarily, the combined effect of power, travel speed, and shield gas type define the weld’s resulting penetration efficiency, assuming all material properties are constant. Identified in Figure 4 is the linear relationship found between nominal pore size and increasing weld volume (approximated by cross-sectional area from metallographic samples). By increasing keyhole width, weld volume is increased along with the size of the expected pore. By reducing weld volume (“area” for a metallographic section) through a decrease in heat input, pore size is minimized as well as weld temperature and distortion in the part. The implication of these observations is particularly germane to heat-sensitive parts where the pursuit of high penetration efficiency operating space is crucial for optimal weld development. Further analysis of the 120 mm lens data set is presented in Figure 5 where each weld is identified by the type of porosity exhibited. No measurable pores were observed in welds below 0.057” penetration (Figure 5 – left), identified by the label “Micro”. For the purposes of this study, only pores measuring greater than 0.005” in diameter (resolution limit of x-ray technique) are included in quantification of pore size. Welds exhibiting pores below the 0.005” diameter that were observable but not measurable were considered few and their effect on weld performance was expected to be negligible due to their small size and sporadic occurrence along the length of the weld.
0
0.02
0.04
0.06
0.08
0.1
0.12
0 500 1000 1500 2000 2500
Pene
trat
ion
(Inch
es)
Joules / inch
Micro
Root
Transitional
Uniform
0
0.02
0.04
0.06
0.08
0.1
0.12
0
0.005
0.01
0.015
0.02
0.025
0.03
0.035
0.04
0 500 1000 1500 2000 2500
MicroRootSemi-UniformUniform
Pene
trat
ion
(Inch
es)
Pore Diam
eter (Inches)
Joules / inch Figure 5: Argon shielded sharp focus Rofin CW LBW’s with 120 mm lens. 250 – 1200 W, 30 – 80 ipm.

14
When the various travel speeds studied were normalized through heat input (J/in), the type of porosity formed could be segregated into distinct operating regimes. Representative lines have been drawn in Figure 5 distinguishing these regions, which also correspond to changing penetration efficiencies. It was observed that for a set weld speed, pore forming tendencies change from micro-porosity to root, transitional, or uniform porosity with increasing power (and therefore heat input). For example, welds prepared at 80 ipm produced high penetration efficiency welds that shifted from micro porosity to uniform porosity as power was increased; large root pores were not observed. In contrast, welds prepared at 30 ipm displaying a lower penetration efficiency transitioned with increasing power from micro porosity to root porosity. This is not surprising given the increased weld volume associated with lower travel speed welds increases the propensity to trap larger diameter (volume) pores.
The goal of this study, in part, was to identify predictive mechanisms to determine the bias for porosity formation in a particular operating regime and to what degree porosity is present. From Figure 4, it was found that weld area measurements may be used to determine nominal pore size when x-ray radiography is not available. By analyzing weld penetration and nominal pore diameter as a function of processing parameters (Figure 5 – right), heat input (J/in) was determined to be a good predictor of pore size as well. At a constant heat input, various porosity types are observed for different penetrations and weld volumes.
It was noted that no pores were observed in any of the 120 mm lens data set below ~0.055” penetration. To identify the effect of focal length on pore formation, additional tests were run at 40 ipm and varying powers (250 – 1200 W) with 80mm and 160mm lenses. Juxtaposition of the data sets for each of the three lenses (Figure 6) demonstrated that shorter focal length lenses (i.e. 80mm) produce root porosity at shallower penetrations than longer lenses (i.e. 160mm). The 80mm lens started forming pores between 0.030 – 0.047” penetration while the 160mm lens did not form pores until penetration reached 0.052 – 0.070”. The cross-hatched region in Figure 6 better identifies the initiation area of pore formation. The early onset of pores for the shorter focal length lens may be attributed to its smaller spot size (Figure 6 – table) influencing keyhole size and/or degree of weld spatter. High speed imaging techniques are being developed to help better explain this phenomenon. Nonetheless, from an application standpoint, the observed trends in porosity as they relate to focal length are favorable since the longer lenses offer both a larger processing waist and a reduced beam angle decreasing the likelihood of beam clipping. The tighter beam angle also allows for side shielding to be positioned closer to the weld providing better shield gas coverage.

15
0.380160
0.275120
0.200 mm80 mm
Spot Diameter
Focal Length
0.380160
0.275120
0.200 mm80 mm
Spot Diameter
Focal Length
Figure 6: Argon shielded sharp focus Rofin CW LBW’s. 250 – 1000 W, 40 ipm. Table specifies laser beam diameter for each lens at sharp focus.
0.02
0.04
0.06
0.08
0.1
0.12
400 600 800 1000 1200
ArgonHeliumNitrogenCO2Unshielded
Pene
trat
ion
(Inch
es)
Power (W)
Figure 7: Sharp focus Rofin CW LBW’s at 350 – 1200 W, 40 ipm. 70 CFH flow rate.
3.3 Effect of Gas Shielding on CW welds: Shielding gas showed the greatest impact on pore formation in this study. Both inert and surface reactive gas types were used in this investigation. Gas shielding demonstrated considerable influence on severity of porosity formation and in what operating regime porosity may be seen. All welds in this portion of experiments were made with a 120 mm focal length lens at 40 ipm. CW power was varied from 450 – 1200 W. Argon was used for the welds described here, though select welding parameters were conducted with helium, nitrogen, CO2, and without shielding. Helium was found to produce a slight reduction in penetration compared to that of argon for the parameters tested (Figure 7). This was not expected, particularly for higher powers. The anticipation was that the higher ionization potential of helium would suppress plasma absorption of laser energy providing more energy at the work piece for increased penetration and/or weld volume.
Root Porosity
Micro Porosity
0.02
0.03
0.04
0.05
0.06
0.07
0.08
0.09
0.1
60 80 100 120 140 160 180
Pene
trat
ion
(Inch
es)
Focal Length (mm)

16
Shielding gas type, for the parameters studied, had a modest effect on weld penetration which was further convoluted by the bounds of the standing edge joint geometry. Several observations regarding the effect of gas type on weld aspect ratio were made but were not mechanistically investigated due to time and funding constraints.
Argon and helium produced similar size pores at high powers; however, pores were more frequent with helium, and many pores formed near the weld surface (Figure 8). This phenomenon produced more undulation in surface appearance and correlated to a higher tendency for blowhole formation. Furthermore, this behavior occurred predominately at deeper penetrations (~2 mm). At shallower penetrations, only pore frequency increased – pore size and location were consistent with that seen in argon.
Figure 8: X-ray radiography exhibiting episodic root porosity for deep penetration argon (a.) and helium (b.) welds. Rofin CW, 935 W, 40 ipm.
In contrast, surface reacting gas types demonstrated considerable differences in porosity formation (Figure 9). Surface reactive shielding gas types included nitrogen, carbon dioxide, and unshielded welds. Unshielded welds showed very few pores with no identifiable periodicity even at deep penetration. As expected when welding in oxygen containing environments, weld bead appearance suffered. Conversely, nitrogen and carbon dioxide shielded welds exuded improved surface appearance over that of an unshielded weld but most importantly, no pores formed irrespective of weld penetration (up to ~0.100”). This would imply that shield gas type, particularly surface reactive gases have considerable impact on weld pool dynamics and/or surface forces (i.e. surface tension, viscosity) such that it results in keyhole stabilization. Nitrogen and carbon dioxide both showed reasonably smooth surface appearance, though nitrogen produced more rippling of the surface than carbon dioxide.
Figure 9: X-ray radiography contrasting approximately equal penetration welds made under various gas shielding conditions. Rofin CW, 1165 W, 40 ipm. 70 CFH flow rate.

17
As previously identified, size and shape of the fusion zone is variable upon the magnitude of heat flow into the part, largely driven by power, speed, and shielding gas type (for a constant material, joint geometry, and surface finish). The three welds examined in Figure 10 were made at 1165 W. Weld “a” and “b” were shielded with argon at 40 and 80 ipm, respectively. Weld “a” produced a large volume weld with considerable root porosity, rolling the corners of the weld sample. Weld “b” produced a high penetration efficiency weld with maximized aspect ratio (D/W), exhibiting only small diameter pores (uniform porosity) and with only half the heat input to that of “a”. Comparatively, weld “a” and “c” were made with the same weld schedule (1165 W, 40 ipm) with the exception that weld “c” was shielded with nitrogen. Given the similarities in weld shape between weld “b” and “c”, it would seem that changes in shield gas type can alter the heat and/or fluid flow patterns enough to emulate those of a higher speed weld. Weld “b” has a heat input of 875 J/in while weld “c” is twice that at 1750 J/in. The fact that weld “a” and “c” have the same heat input but weld “c” produces a much smaller weld area, suggests that absorptivity and/or melting efficiency is altered by the surface reactive gas (nitrogen). Further work must be done in this area to resolve these mechanistic issues.
Figure 10: Transverse metallographic cross-sections depicting changes in heat flow patterns for changing travel speed and shield gas type. 1165 W, 40 ipm (a.) and 80 ipm (b.) welded with argon shielding. Rofin CW, 1165 W, 40 ipm welded with nitrogen (c.)
3.4 Introduction to Square Wave (SQW) Modulation: Prior to discussing the effects of square wave modulation on weld porosity, it is necessary to understand the processing parameters which define how modulation occurs. SQW modulation is characterized by three parameters; Percent Peak Power (%Pp), Percent Average Power (%Pmean) and Modulation Frequency – each of which is defined as a percentage of the laser’s total output power (in the present case, 800W). By setting the Percent Peak Power and the Percent Average Power, pulse duration as a function of duty cycle (which corresponds to the %Pmean divided by the %Pp) adjusts automatically. Pulse duration is found by multiplying the duty cycle by the inverse of the modulation frequency. For example, a setting of 50% Pp (or 400W) and 25% Pmean (or 200 W) produces a duty cycle of 0.50 (Figure 11). As the %Pmean setting approaches the %Pp value, the duty cycle increases, simultaneously increasing the pulse length. At a modulation frequency of 200Hz and a duty cycle of 0.50, a pulse duration of 2.5ms is
a b c
18
produced. For this study Percent Peak Power was set at 50, 100, or 150%. For each Percent Peak Power setting, a range of Percent Average Powers (15 – 100%) was used. Welding parameters (combined influence of %Pp, %Pmean, & weld speed) were limited by acceptable weld bead appearance: no excessive presence of weld balls, weld bead convexity, or surface irregularities resulting from extreme weld spatter.
Figure 11: Schematic of SQW modulation operator defined parameters.
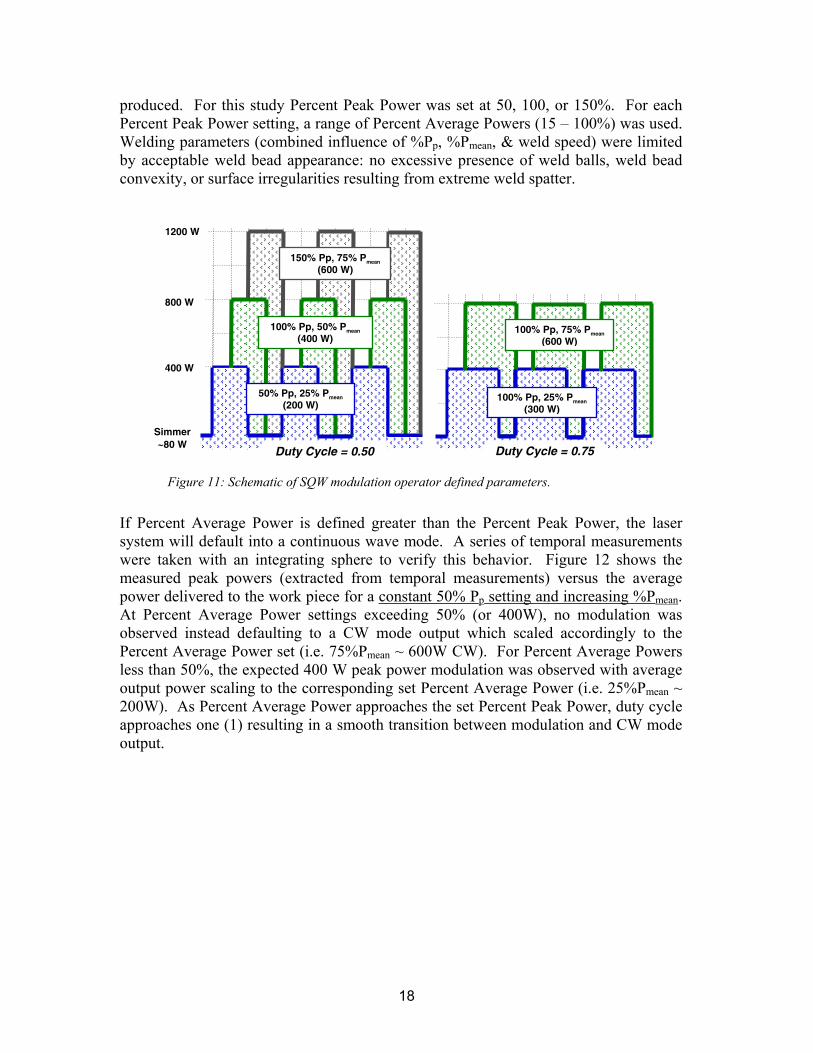
If Percent Average Power is defined greater than the Percent Peak Power, the laser system will default into a continuous wave mode. A series of temporal measurements were taken with an integrating sphere to verify this behavior. Figure 12 shows the measured peak powers (extracted from temporal measurements) versus the average power delivered to the work piece for a constant 50% Pp setting and increasing %Pmean. At Percent Average Power settings exceeding 50% (or 400W), no modulation was observed instead defaulting to a CW mode output which scaled accordingly to the Percent Average Power set (i.e. 75%Pmean ~ 600W CW). For Percent Average Powers less than 50%, the expected 400 W peak power modulation was observed with average output power scaling to the corresponding set Percent Average Power (i.e. 25%Pmean ~ 200W). As Percent Average Power approaches the set Percent Peak Power, duty cycle approaches one (1) resulting in a smooth transition between modulation and CW mode output.
Simmer ~80 W
400 W
800 W
1200 W
150% Pp, 75% Pmean
(600 W)
100% Pp, 50% Pmean
(400 W)
50% Pp, 25% Pmean
(200 W) 100% Pp, 25% Pmean
(300 W)
100% Pp, 75% Pmean (600 W)
Duty Cycle = 0.75 Duty Cycle = 0.50

19
Figure 12: Integrating sphere temporal wave form measurements. Constant 50% Pp modulation.
The waveform produced by square wave modulation is unlike a typical top-hat pulse in that power output between pulses does not drop to zero but rather to a simmer (or background) value. The particular laser used in this study generated a simmer of ~80 W (Figure 11). Because of the simmer experienced between each pulse, the peak power measured is less than that defined at the control interface. Consequently, the shorter the duty cycle, the lower the measured peak power since the sum of the simmer power makes up a larger portion of the total output power. This behavior is further amplified for Percent Peak Power settings above 100%.
3.5 Effect of Square Wave Modulation Welding Parameters: Although weld requirements typically specify a depth of penetration, it is not uncommon for weld bead width to also be constrained. One such case would include perimeter welds where the weld bead is not allowed to roll or extend beyond the part’s edge due to interference fit with subsequent assemblies. Although a longer focal length lens can provide a deeper depth of field (deeper waist) to reduce process sensitivity to focus variations, a narrower cone angle to avoid beam clipping and (as it was previously identified for CW welds) a broad operating space with minimal weld porosity, a longer lens also produces a wider bead width. This can hamper its use in weld width constrained applications. Figure 13 – left identifies changes in beam radius and angle for increasing focal length lenses.
0
100
200
300
400
500
600
700
800
0 100 200 300 400 500 600 700 800
Peak
Pow
er te
mpo
ral (W
)
Average Power Ophir
(W)
25% Pmean
DEFAULT TO CW -P
mean > 50%
50% Pp MODULATED -395 W Expected
40% Pmean
55% Pmean

20
Figure 13: Prometec laser Scope characterization of various focal length lenses (left). Weld depth characterization map – parameters limited by visual acceptance criteria - §3.4 (right). High flow rate UHP argon.
Also identified in Figure 13 is a graph which contrasts changes in weld bead width for changing laser mode (CW and SQW modulation) and lens focal length. Weld penetrations for the 120 and 200mm lenses, although not specifically identified, ranged from 0.010 – 0.085” with the greatest penetration corresponding to the widest weld bead width. The exception to this was the point shown for the 120mm lens using 150% Pp modulation; the 120mm lens was not capable of 0.085” penetration due to the onset of drilling. Note, the tested parameters were subject to the conditions identified in §3.4; thus, not all lenses were tested to cover the same parameter space (powers and travel speeds). When welding in CW mode, it was found that the larger spot size of the 200mm lens produced a bead width nearly double that of the smaller 120mm lens spot. The 150% Pp modulation with the 200mm lens reduced weld width by approximately half, or equal to that of a CW mode 120mm lens. Thus, SQW modulation allows for long focal length lenses to be used under bead-width-constrained applications. For the focal lengths studied to contrast welds of equal penetration, weld bead width narrowed with increasing percent SQW modulation and surface convexity.
Similar to the utilization of high peak powers in pulsed Nd:YAG lasers to induce keyhole mode welding for increased depth of penetration, square wave modulation can be used to generate keyhole mode welds at the low average powers typically characteristic of conduction mode welds. Figure 14 characterizes weld penetration of a 200 mm lens as a function of heat input for travel speeds ranging from 36 – 120 ipm and juxtaposes two different laser modes: CW and 150% square wave modulation. As CW power increases, weld mode changes from conduction to keyhole resulting in a sudden jump in weld penetration. This occurred at ~1000J/in heat input for welds prepared at 36 ipm. When the beam was modulated, keyhole mode welds were obtained even with heat input <1000J/in. Note that point A of Figure 14 corresponds to
Lens (mm)
Beam Radius
(r)
Beam Angle
(θ) 200 0.190 9.0° 120 0.120 11.5° 80 0.095 14.5°
0.00
0.01
0.02
0.03
0.04
0.05
0.06
0.07
0.08
0.09
0.10
120 160 200
@ Constant 60 ipm
CW150% Pp
Wel
d W
idth
(in)
Focal Length (mm)

21
metallographic cross-section A producing a weld penetration of 0.048” with a 725 J/in heat input (435 W average power, 36 ipm, and 150% Pp modulation). Using the same average power and travel speed in CW mode, only 0.010” penetration was achieved (Weld B – Figure 14). It is important to note that the increased weld depth achieved by SQW modulation is most significant at lower travel speeds and decreases with increasing speed. Thus, temperature sensitive applications can capitalize on this type of laser modulation rather than attempting to control heat input exclusively by high travel speeds. Furthermore, complex part geometries (e.g., tight radii of curvature) can be extremely difficult for motion control to track at high speeds; for these cases faster weld travel speeds cannot minimize heat input adequately. SQW modulation has the ability to satisfy both low heat input and deep penetration requirements at lower travel speeds. Consequently, in multi-constrained applications (reduced temperature, high depth of penetration, and limited bead width), SQW modulation can enlarge an already limited processing window.
Figure 14: Penetration map contrasting weld mode, 200 mm lens (left). Metallographic transverse sections displaying the effect of weld mode – 36 ipm, 435 W (right).
Given that the penetration gain obtained through SQW modulation decreases for increased weld speed, it can be inferred that an upper bound for penetration efficiency may exist. As established in §3.2, each set of welding parameters has associated with it a weld penetration efficiency. By investigating the effects of SQW modulation, it has been identified that a penetration efficiency for each level (or percent) of modulation also exists. In Figure 14, the data points for a constant weld speed and laser mode delineate regimes of changing weld penetration efficiency. At high travel speeds, little change in the slope was noted when the data for CW and SQW modulation were compared. This behavior was observed for all three focal length lenses studied. Figure 15 displays this more clearly where penetration is plotted as a function of heat input for two weld speeds (120 and 36 ipm) and for multiple laser modes; CW, 100 and 150%
0
0.01
0.02
0.03
0.04
0.05
0.06
0.07
0.08
200 400 600 800 1000 1200 1400
36 ipm60 ipm90 ipm120 ipm
Pene
trat
ion
- Nom
inal
(in)
Heat input (J/in)
Solid - 150% PpHollow - CW
Transition to Keyhole
A
B
A.
B.

22
Pp. At 36 ipm, penetration efficiency increases with increasing modulation – an upper bound for penetration efficiency was not observed. However, welds made at 120 ipm produced weld penetrations that varied with heat input in a starkly linear manner, irrespective of laser mode. This implies that they all exhibit the maximum penetration efficiency possible (Figure 15 – Max ηp), meaning that increasing heat input is the only avenue through which to increase weld penetration at that travel speed. While this study did not identify the mechanism(s) limiting penetration efficiency, it is suspected that shifts in heat flow driven by changes in weld pool shape and the bounds of melting efficiency likely play a roll in this observed phenomena. Furthermore, the upper bound in penetration efficiency identified here provides a benchmark from which to compare the efficiency of a developed weld schedule.
0
0.01
0.02
0.03
0.04
0.05
0.06
0.07
0.08
0 200 400 600 800 1000 1200 1400
CW100%Pp150% Pp
Pene
trat
ion
- Nom
inal
(in)
Heat input (J/in)
Solid - 120 ipmHollow - 36 ipm
Max ηpLow ηp
Figure 15: Penetration map comparing high and low weld speeds. Lines depicted only to relay approximate changes in penetration efficiency (ηp) for changing weld speed @ 100% Pp. High flow UHP argon, 160 mm lens.
Porosity formation in SQW modulated welds was found to be quite different from that of CW welds. In Figure 16-left, a porosity map was devised to identify the occurrence of porosity for multiple focal length lenses (and therefore spot sizes) at various penetrations. Unlike the porosity trends found in CW mode welds, the porosity formed in square wave modulated welds showed no location preference, periodicity, or common sizing. For this reason, porosity in these welds was categorized qualitatively by its severity: heavy, light, or no porosity. The porosity map in Figure 16 displays the distribution of pore free (circle), lightly porous (square) and heavily (triangle) porous welds as a function of focal length. It is important to note that the SQW modulated light porosity is analogous to CW micro-porosity in that most pores formed are smaller than 0.005” in diameter. Despite the fact that no obvious trends were observed, porosity in general appeared less severe than that of many equal penetration CW welds. Figure 16-right displays four representative x-ray radiographs – one for each porosity type and one representative of commonly formed CW porosity. The CW representative weld exhibits periodic root porosity having a weld depth of 0.070”. In contrast, the

23
heavy porosity weld displays less frequent irregular sized pores nominally smaller in diameter with an increase in penetration (0.079”) of ~15%. Also, reduced heat input is obtained with SQW modulation for equal penetration welds inferring reduced weld temperatures may be obtained. The resulting porosity-penetration map developed in this study can be extremely useful for developing weld schedules that need to achieve a certain penetration range while avoiding significant porosity formation. This porosity-penetration map demonstrates that for a desired weld penetration, for example 0.050”, a 120 mm lens would produce only heavy porosity. Employing a 160mm lens instead increases the potential for pore free or lightly porous welds. Choosing a 200mm lens improves the situation even further, as no pores or only light porosity is expected. The weld defect tendencies of a process illustrated in this this manner can aide welding engineers in development of a robust schedule.
Figure 16: Porosity/penetration map representing multiple weld speeds and various SQW modulation parameters (left). X-ray radiographs representative of various porosity levels (right). High flow UHP argon.
Analysis of the porosity map presented reveals three regions of interest relating penetration, severity of porosity, and focal length. Of the processing parameters explored a pore free region is identified in Figure 17-left. Just as the onset of CW-formed porosity could be deferred with increasing focal length, square wave modulated welds exhibited the same behavior. Conversely, Figure 17-right identifies penetration depths for each focal length where all explored parameters exhibited porosity – typically heavy.
0
0.01
0.02
0.03
0.04
0.05
0.06
0.07
0.08 No PoresLight PorosityHeavy Porosity
Pene
trat
ion
- Nom
inal
(in)
120 mm 160 mm 200 mm
Focal Length Lens
BM6 Pene =0.079”
Heavy SQW Porosity
V2 Pene =0.048”
Light SQW Porosity
V1 Pene =0.030”
No Porosity
CW Mode Porosity
Pene =0.070” U5

24
Figure 17: Porosity/penetration map representing multiple weld speeds and various SQW modulation parameters. High flow UHP argon.
The third region of interest represented in the porosity map is shown in Figure 18. Within an intermediate penetration range – unique to each focal length – welds can be either pore free or porous to varying extents. The pore free welds in this operating regime were found to be the result of increased weld speed. Heavy porosity was observed less frequently and was predominately limited to deeper penetrations for longer focal length lenses. Shorter focal lengths were shown to have more expansive regions of overlapping light and heavy porosity, making the obtainment of a pore free weld much more challenging.
Figure 18: Porosity/penetration map representing multiple weld speeds and various SQW modulation parameters. High flow UHP argon.
0
0.01
0.02
0.03
0.04
0.05
0.06
0.07
0.08 No PoresLight PorosityHeavy Porosity
Pene
trat
ion
- Nom
inal
(in)
120 mm 160 mm 200 mm
Focal Length Lens
Pore Free Region
0
0.01
0.02
0.03
0.04
0.05
0.06
0.07
0.08 No PoresLight PorosityHeavy Porosity
Pene
trat
ion
- Nom
inal
(in)
120 mm 160 mm 200 mm
Focal Length Lens
Pore Forming Region
0
0.01
0.02
0.03
0.04
0.05
0.06
0.07
0.08 No PoresLight PorosityHeavy Porosity
Pene
trat
ion
- Nom
inal
(in)
120 mm 160 mm 200 mm
Focal Length Lens

25
Figure 19: 100% Pp SQW modulated LBW’s with a 120 mm lens. High flow UHP argon.
By proper processing lens selection and appropriate square wave modulation, LBW porosity can be avoided to some extent. The combination of weld speed and average power and its effect of porosity is shown in Figure 19 for SQW modulated welds. The severity of weld porosity for welds prepared at a 100% Pp with a 120mm lens is graded from 0 – 4. The contour lines correspond to increasing weld speed, which was found to significantly reduce porosity, consistent with the trends identified in CW welds. A single contour line of 0.030” penetration is shown to relate the combined effect of average power and speed on weld pool shape.
4. Conclusions This study has demonstrated that porosity in CW Nd:YAG welds is a weld defect generated by weld pool fluid dynamics, which is largely determined by laser parameters and the choice of shielding gas. The following conclusions can be drawn from the experiments detailed in this report:
1) The relationship between penetration, power, and pore diameter was demonstrated by the experiments conducted in this study.
2) A new term, Weld Penetration Efficiency, was defined to describe the weld penetration as a function of heat input. This figure of merit was found to be useful in distinguishing between different laser modes and operating regimes.
3) Square Wave modulation exhibited significant improvement in weld penetration efficiency when compared to Continuous Wave laser welding. This was also observed at lower travel speeds, which is advantageous for intricate parts with welding paths with tight radii of curvature.
Pore Level (0-none, 4-heavy)
Ave
rage
Pow
er (W
)
43210
600
500
400
300
200
< 60 ipm
60 ipm
90 ipm
120 ipm
0.030” penecontour

26
4) Penetration-porosity maps developed in this study demonstrated that focusing lenses with longer focal lengths provide deeper penetration welds before the onset of pore formation compared to focusing lenses with a shorter focal length.
5) Increasing travel speeds were found to minimize porosity by driving root porosity to uniform porosity.
6) As power increases at constant travel speed and beam diameter, pore diameter and frequency also increase.
7) Surface-reacting gases were found to significantly reduce/eliminate porosity in 304L, though further examination of the mechanistic effect of these different gas types is required.

27
Distribution:
1 MS0319 M. E. Gonzales 02613 1 MS0319 J. T. Bond 02613 1 MS0319 S. M. Deblassie 02613 1 MS0431 P. W. Fuerschbach 00513 1 MS0529 C. E Warren 05356 1 MS0836 J. F. Dempsey 01524 1 MS0869 P. H. Gorman 02722 1 MS0886 A. C. Kilgo 01822 1 MS0889 D. O MacCallum 01813 1 MS0889 F. M. Hosking 01813 4 MS0889 J. T. Norris 01813 1 MS0889 M. J. Perricone 01813 1 MS1064 S. E. Lott 02610 1 MS1064 R. A. Roach 02614 1 MS1064 G. E. Vernon 02614 1 MS1393 J. R. Fellerhoff 12940 2 MS0899 Technical Library 04536 2 MS9018 Central Technical Files 08944 1 W. Rendulic Honeywell FM&T Mail Drop FH40 2000 E 95th St. Kansas City, MO 64131-3030 2 K. M. Faraone Honeywell FM&T Mail Drop FH40 2000 E 95th St. Kansas City, MO 64131-3030 2 C. M. Ellison Honeywell FM&T Mail Drop FH40 2000 E 95th St. Kansas City, MO 64131-3030