Embed Size (px)
Citation preview
Evaluation of the ITRON Open Way AMI Meter
By William Bathgate, EE, ME
March 1, 2017
3/6/2017 1

Agenda
3/6/2017 2
• Billing and kWh calculation issues• Security and Privacy• Non Compliance to FCC/UL standards

Agenda – Part 1
3/6/2017 3
• Billings Issues• The AMI meter was supposed to be more
accurate but my bill increased – Why?

Meter accuracy and your bill
3/6/2017 4
• As professed by ITRON the AMI meter is “accurate” based on the Navigant Consulting Report in 2010 and referenced on the ITRON web site. However within this report the extremely high rate of billing complaints after the installation of the new meters is evident and explanations were difficult to verify as to their cause. The number of complaints was dramatic. This test was done in Texas with temperature ranges from ~30 to ~88 degrees.
• Control testing conditions were not well explained in this report, in particular the type of load the meter accuracy was compared to.
• Restive loads such as light bulbs • Inductive loads such as electric motors• No discussion on how the AMI meters did the kWh calculation, since it is really not a
meter, but is a computer, with averaging of samples over a fixed period of time?
• What is very different in the AMI meter is the algorithm used to calculate the readings from the sensor into the indicated display. The analog meter is a type of “totalizing” meter just like a gas pump. • The AMI meter uses sensor data, which has to be averaged by a mathematical
calculation and then registered into memory and on the LCD display. • The gas pump has a weight and measures standards sticker to assure the Consumer they
are getting what they paid for, there is no such concept on an AMI meter. ANSI C12.1 standards are laboratory measurements under controlled conditions and inadequate
Meter accuracy and your bill
3/6/2017 5
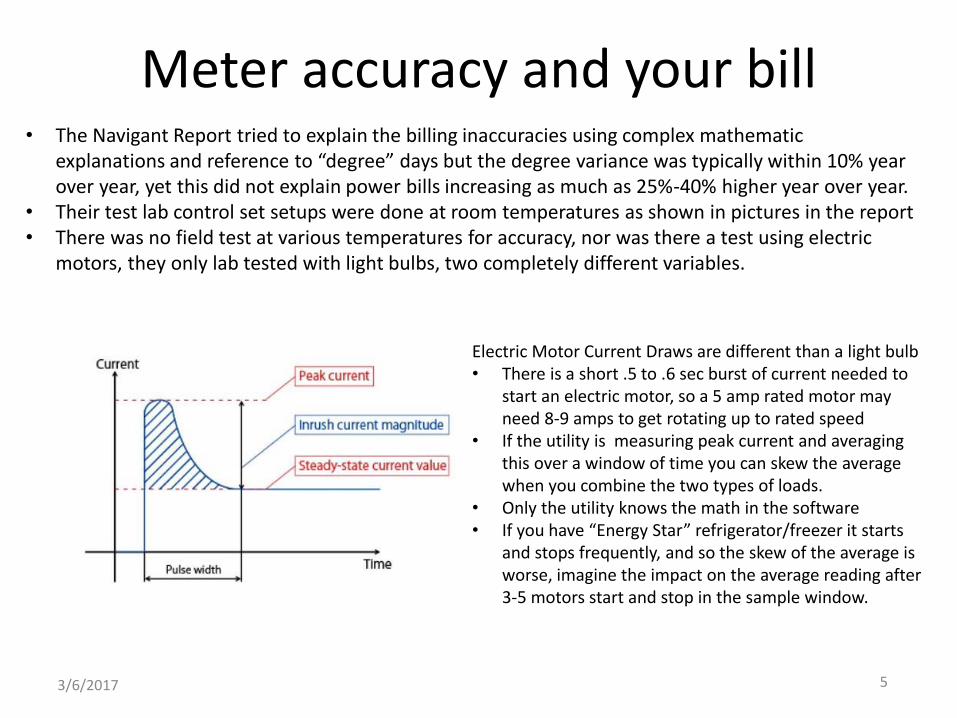
• The Navigant Report tried to explain the billing inaccuracies using complex mathematic explanations and reference to “degree” days but the degree variance was typically within 10% year over year, yet this did not explain power bills increasing as much as 25%-40% higher year over year.
• Their test lab control set setups were done at room temperatures as shown in pictures in the report • There was no field test at various temperatures for accuracy, nor was there a test using electric
motors, they only lab tested with light bulbs, two completely different variables.
Electric Motor Current Draws are different than a light bulb• There is a short .5 to .6 sec burst of current needed to
start an electric motor, so a 5 amp rated motor may need 8-9 amps to get rotating up to rated speed
• If the utility is measuring peak current and averaging this over a window of time you can skew the average when you combine the two types of loads.
• Only the utility knows the math in the software • If you have “Energy Star” refrigerator/freezer it starts
and stops frequently, and so the skew of the average is worse, imagine the impact on the average reading after 3-5 motors start and stop in the sample window.

Why is the Bill Higher?It depends on how it is calculated
Totalized versus Average of the Peaks
3/6/2017 6
Total Amps Calculation
100 17 Readings @ 10 Amps = 170 Amps
95 2 readings @ 20 Amps = 40 Amps electric Motor Surge Amps
90 1 reading @30 Amps = 30 Amps
85 Total Amps = 240 Amps
80 240 Amps / 20 = 12.0 Amps average
75 Total Amps "Totalized Method" = 240 Amps
70 "Average of the Peaks Method" (10+20+20+40) =22.5 Amps *20 = 450 Amps Total65
60
55
50
45
40
35
30 —————
25
20 ————— —————
15
10 ————————————————————————————————————————————————————— —————————— ———————————————— ————————————————
5
0
0.50 1.00 1.50 2.00 2.50 3.00 3.50 4.00 4.50 5.00 5.50 6.00 6.50 7.00 7.50 8.00 8.50 9.00 9.50 10.00
Seconds
The utilities will not likely reveal how they are doing this calculation, unless forced under court order

My Energy Insight ReadingsAverage Daily AMI kWh Use 2.37 kWh @ 0.13 per kWh = $0.31 (865 kWh/Yr.)
3/6/2017 7
Note – No breakers were on and the time and reading of the meter is not a simple “Text” message
As you can see this is not just simply reading power consumption. This is full blown surveillance
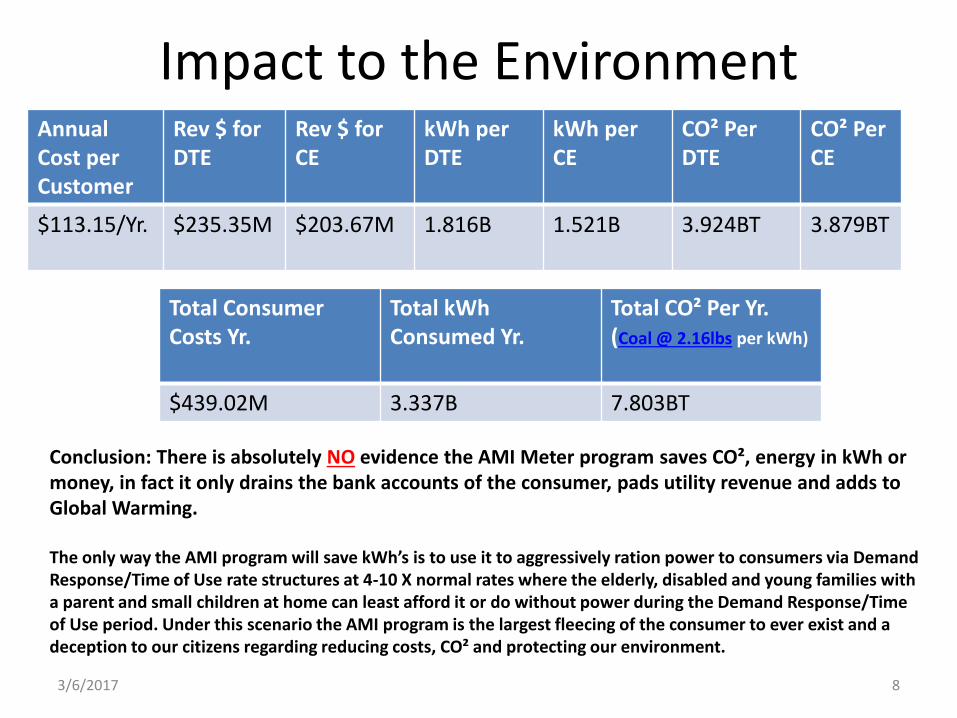
Impact to the EnvironmentAnnual Cost per Customer
Rev $ for DTE
Rev $ for CE
kWh per DTE
kWh per CE
CO² Per DTE
CO² Per CE
$113.15/Yr. $235.35M $203.67M 1.816B 1.521B 3.924BT 3.879BT
3/6/2017 8
Total Consumer Costs Yr.
Total kWh Consumed Yr.
Total CO² Per Yr. (Coal @ 2.16lbs per kWh)
$439.02M 3.337B 7.803BT
Conclusion: There is absolutely NO evidence the AMI Meter program saves CO², energy in kWh or money, in fact it only drains the bank accounts of the consumer, pads utility revenue and adds to Global Warming.
The only way the AMI program will save kWh’s is to use it to aggressively ration power to consumers via Demand Response/Time of Use rate structures at 4-10 X normal rates where the elderly, disabled and young families with a parent and small children at home can least afford it or do without power during the Demand Response/Time of Use period. Under this scenario the AMI program is the largest fleecing of the consumer to ever exist and a deception to our citizens regarding reducing costs, CO² and protecting our environment.

What’s Coming? Your bill – under Demand Response or called Time of Use Rates
3/6/2017 9
Data Source – DTE Energy “Smart Currents” Pilot - Final Report dated August 15, 2014

What’s Coming? Your bill – under Demand Response or called Time of Use Rates
3/6/2017 10
Data Source – DTE Energy Current Rate Plan (excluding Distribution Charges) 2/28/2017
Note - Critical peak rate to be called on short notice up to 20 days per year

Cost Example @ 25.6 kWh/Day
3/6/2017 11
$0.00000
$1.00000
$2.00000
$3.00000
$4.00000
$5.00000
$6.00000
$7.00000
$8.00000
$9.00000
2016 Analog 2016 AMI TOU 2017 AMI 2017 AMI TOU 2017 AMI 2017 AMI TOU/PP
DTE Cost Comparison Analog/AMI/ TOU Rates (M-F) – excluding Transmission charges
53%Increase
649%Increase
15%Increase
PP=Critical Peak Pricing @$0.95 kWh
@17kWhRate
@17kWhRate

How do you keep your bill low?
3/6/2017 12
Retain your Analog Meter!

Agenda – Part 2
• Security and Privacy– Many of the needed controls for a fully secure environment as
not yet in place. Reference - NISTIR 7628 Revision 1 - Guidelines for Smart Grid Cybersecurity
– There are millions of access points in the network, including physical access to back doors of the meter equipment and network
– DTE Energy employee robbed at gunpoint on Detroit's west side, thief got away with only $2 9:02 AM, Jan 11, 2017, what if the thief got a hold of the hand held AMI reader?
3/6/2017 13

“We only collect data for billing”
3/6/2017 14Reference: NISTIR 7628 Revision 1 - Guidelines for Smart Grid Cybersecurity

Security Risk - Physical Back Door
3/6/2017 15
A connection to the meter directly by passes encryption, allowing privacy to be violated and risk. Insertion of code, altering the network traffic and injecting malicious code.

Network Weak Link
3/6/2017 16
Weak Link
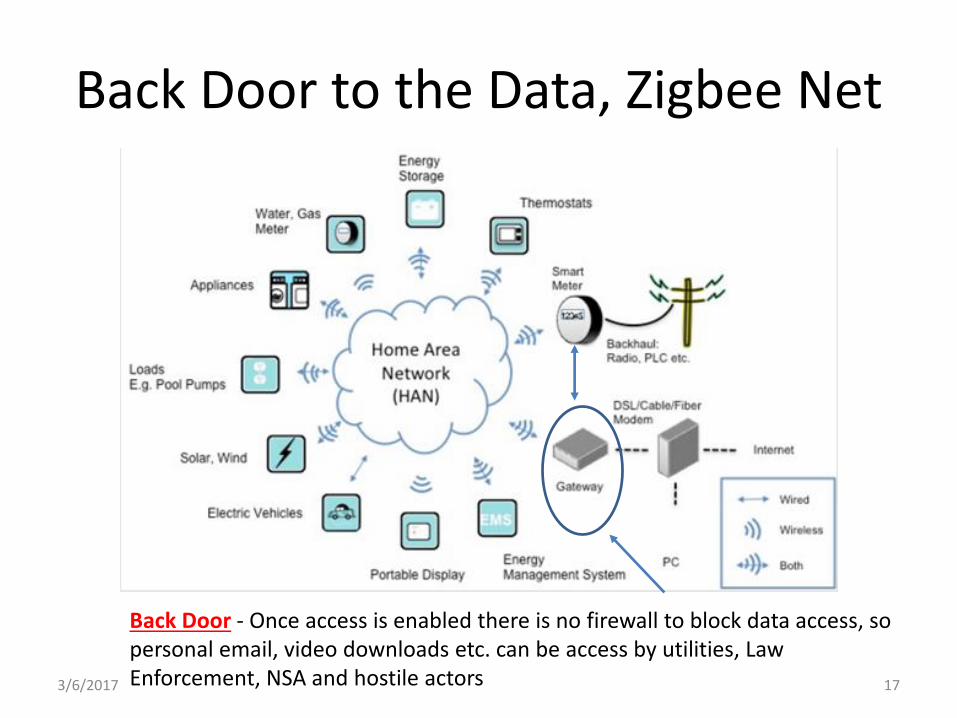
Back Door to the Data, Zigbee Net
3/6/2017 17
Back Door - Once access is enabled there is no firewall to block data access, so personal email, video downloads etc. can be access by utilities, Law Enforcement, NSA and hostile actors

Agenda – Part 3
3/6/2017 18
• Dirty Electricity• The AMI meter, Opt-Out Meter and various versions of
the Electronic meters all currently exhibit dirty electricity.
• The is no way to “fix” the current design without a direct connection to an Earth Ground source and a circuit redesign.
• An external fix to dirty electricity at your service panel costs anywhere from 2,000 to 7,000 for UL approved filters.
• Customer appliances are breaking down, especially any appliance with an electric motor or critical electronics

SMPS with Common Mode Filter –Principles You Need to Understand
3/6/2017 19
The Standard Single Phase 60 Cycle/Second Waveform with EMI/RFI introduced by the SMPS
This waveform displayed is the same as an oscilloscope trace would look like, you cannot see this on a common voltmeter. Now we have introduced the effects of EMI/RFI via the SMPS to the same wire carrying the house current. This effect can be better depending on the environment especially how good the house earth ground is magnetically coupling the house voltage currents. There are many variables that affect this waveform. The image in red should never be there, I have found this pattern consistent with every AMI meter, including the AMI meter with the radios off and the various digital meter alternatives. It is not compliant to FCC rules for “conducted” Emissions Class A or Class B
SMPS with a Proper Common Mode Filter
3/6/2017 20
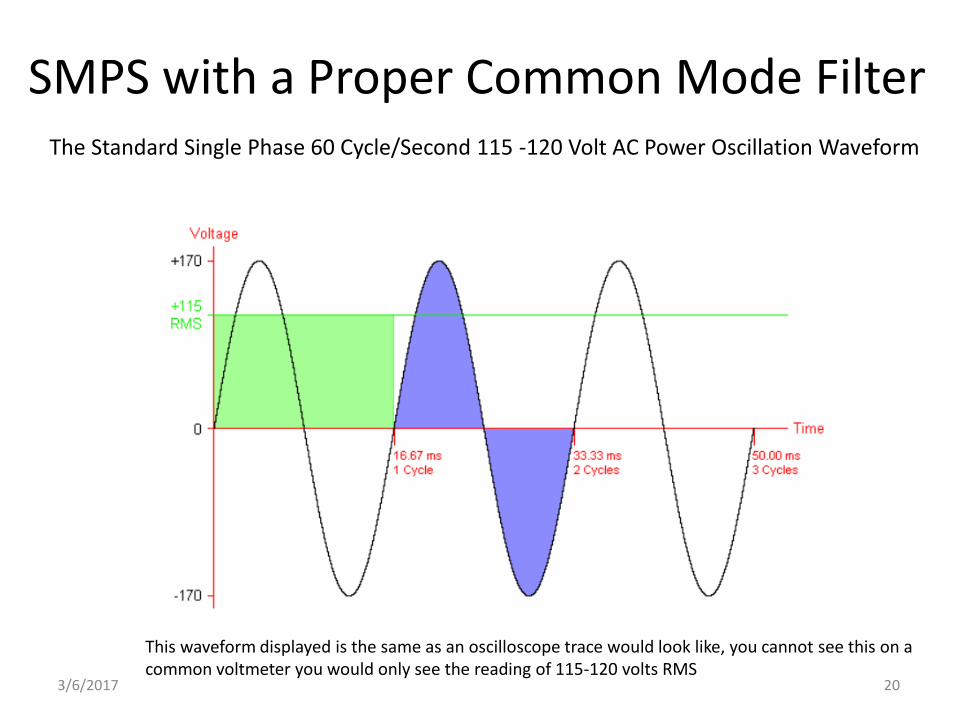
The Standard Single Phase 60 Cycle/Second 115 -120 Volt AC Power Oscillation Waveform
This waveform displayed is the same as an oscilloscope trace would look like, you cannot see this on a common voltmeter you would only see the reading of 115-120 volts RMS

SMPS with Common Mode Filter –Principles You Need to Understand
3/6/2017 21
The Standard Single Phase 60 Cycle/Second Waveform with EMI/RFI introduced by the SMPS
The image in red is for both AMI meters with the radios on/off and the various forms of “Electronic Meters. It is not compliant to FCC/UL rules for “conducted” Emissions Class A or Class B. Shown here are the limits for CONDUCTED emissions (not Radio Emissions which is a different spec.), which are fed back into the home wiring at the load panel. This is placing stress on all electronics and electric motors in the home, causing early appliance motor failures, appliance electronic control failures and radio interference in addition to health effects such as insomnia, tinnitus, headaches, blood sugar levels and nervous disorders such as neuropathy and heart rhythm. In order to become compliant the meter mfg. would have scrap the current SMPS design, and include one that connects to a earth ground path.
Class Alimits

What can be done to remove Dirty Electricity within the meter?
3/6/2017 22
• A complete redesign of the SMPS board to include UL and FCC specifications for conducted emissions of EMI/RFI and stray currents
• Inclusion of differential and common mode filter components
• Inclusion of a direct connection to an Earth Ground

SMPS/EMI/RFI with Common Mode Filter and Filter Capacitors added
3/6/2017 23
In this representation we have added Filter Capacitors to “Clip” the frequency oscillations, you will note that for this to work there needs to be a ground connection as shown. The AMI meter does not have a connection to ground and therefore cannot be made safe to meet the FCC Conductive Emissions Standard
240 Volts AC In
240 Volts AC out to the AC to DC converter or “Bridge Rectifier”
Typical Capacitors
Earth Ground

SMPS with Common Mode Filter –Health Effects You Need to Understand
3/6/2017 24
• This report is not meant to be a comprehensive review of the health effects from the oscillations present in a SMPS such as the AMI’s oscillations in the form of “Dirty Electricity”, but here are some important issues.
• In August 2010, in a spectacular announcement that got very little coverage, noted epidemiologist, Samuel Milham, MD linked the growth of electrification and the incidence of four of the big six diseases. In his book “Dirty Electricity: Electrification and the Diseases of Civilization.” Dr. Milham connects dirty electricity with heart disease, cancer, diabetes, neurological disorders like ALS and suicide. See http://www.electricsense.com/5229/dirty-electricity-electrification-and-the-diseases-of-civilization/
• This report is not to comment on the radio emissions of the AMI meter except to say there is a lot of research and reports with the most alarming one on low level radiation direct link to cancer in the same 900 MHz frequency range used by the AMI meter and cell phones. The difference is that the cell phone can be turned off, while the AMI meter never goes off and it is on every home on the street creating a “Radio Soup” environment you cannot get away from.
The National Toxicology Report found here at http://biorxiv.org/content/early/2016/06/23/055699.full.pdf+html

Summary
3/6/2017 25

Back Up Slides
3/6/2017 26
About the Author
3/6/2017 27
I hold an electrical engineering and mechanical engineering degree and previously was employed through
late 2015 for 8 years at the Emerson Electric Company. While at Emerson Electric I was the Senior Program
Manager for Power Distribution Systems and in charge of RF and IP based digitally controlled high power
AC power switching system product lines in use in over 100 countries. I was also directly responsible for
product certifications such as UL, CE, PSE and many other countries electrical certification bodies. I am
very familiar with the electrical and electronic design of the AMI meters in use because I was responsible for
very similar products with over 1 Million units installed across the world.
I hold a DOD Top Secret Clearance, serving in Cyber Security at the USMDA and Homeland Security
I have done this analysis due to my own curiosity without conflict of interest of this new technology.
I have 40 Years work experience in design and deployment of:
High tech power management systems, UPS and power distribution
Switched Mode Power Supplies
Electrical and Electronic hardware engineering
Computer systems engineering
Radio Systems design and testing
High Current and High Voltage switches
Internet communications using both wired and wireless technologies
UL, CE (Europe), Africa, Japan, Australia and China product safety certifications
Cyber encryption and protection of Radio Communications using digital signals
RFI/EMI mitigation
BACKGROUND: William S. Bathgate

Overall Observations of the ITRON Meter
3/6/2017 28
• After a hard look at the design and construction of this ITRON meter there are the following observations
• The biggest weakness is in the power disconnect, it suffers from a small surface area for the disconnect contact and would be prone to excessive heating and likely result in contact pitting and carbon deposits that are not readily visible by the customer and there is not a sensory circuit that could detect it and report it to the consumer or the utility. This design would be prone to creating unpredicted fires.
• The second weakness which is causing thousands to become ill is the lack of a common mode and differential filtering of the SMPS oscillations being injected from the meter onto the house wiring circuit, thus making the whole house into an antenna with dangerous RFI/EMI. Overall costs for the needed components would be around $1.50 per meter/circuit board. There are ways to design a SMPS without these filters but this design would need to have a solid ground reference to earth, but this meter design and construction does not permit an earth ground so this scenario is unfeasible.
• The power required to run the AMI meter is borne by the homeowner, this was never disclosed to the public that their bill will go up by over ~$115.00 per year just to power the meter. Also the added load on generating capacity was never used in the justification for the investment required for the deployment of AMI. This gives a false impression on the AMI program reducing energy consumption. It does not save any energy for the consumer or the utility. The current Analog meter does not cost the consumer or the utility any energy to power it.

Overall Observations of the ITRON Meter
3/6/2017 29
• Additional observations
• The privacy and security of the full AMI program is another exposure that has not been fully disclosed to the consumer. The broad based scenario of incorporating the Internet of Things (IoT) in the home environment and linking it to a meter creates increased exposure of personal information to third parties without consent. The fact that the consumer agreed to the service agreement of the utility for provision of electricity also implies the the consumer has by default agreed to the disclosure of personal information to places not named should be a large concern. Image if this was the case when you buy gas for your vehicle. Should the gas provider require you to ID the type of vehicle you are driving before the pump is tuned on?
• The utility consistently states the RF emissions of the meters meet FCC requirements, this is a misleading statement, FCC requirements are for the effects of enough ionizing power to cause the brain to heat up 1° C. There have been over 800 peer reviewed independent studies not funded by the industry that have linked this type of low level non ionizing RF radiation to a group of diseases including brain cancer, Parkinson's, Alzheimer's, high blood pressure, Tinnitus, skin rashes and open sores as an example. Industry funded studies do not concur with these findings so this adds to confusion on the health effects attributed to the meters. I have personally met many of the affected consumers and this is no joke or set of psychological conditions.
• The fact that there is a set of circuit boards in a power meter at all is a large risk, the circuit boards would not be able to withstand a lightning strike or a power surge without an explosive reaction and likely melting of the circuits. This would lead to total destruction of the unit and lead to a possible fire.
The Truth on RF Emissions
3/6/2017 30
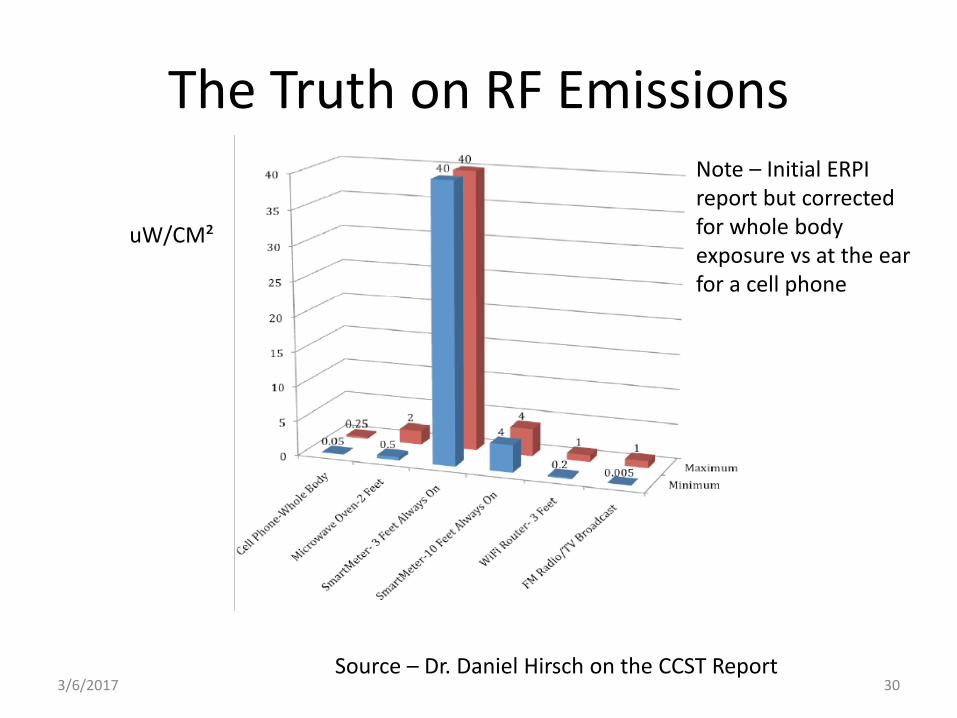
uW/CM²
Source – Dr. Daniel Hirsch on the CCST Report
Note – Initial ERPI report but corrected for whole body exposure vs at the ear for a cell phone

Has the investment in new AMI meters benefited the consumer?
• The utility is passionate about the need for AMI. Their primary benefits are:– Reduction in meter reader workforce costs
• The has been no rebate or discount to the consumer for this savings the utility gains, where did this savings go?
– Ability to monitor the expanse of outages • This may marginally benefit the consumer but communications of their outage existed before via phone anyway. However the savings to the utility
has never been remunerated and returned to consumers.
– Ability to turn off services to non paying consumers without out a “Truck Roll”• This will save the utility money, yet the savings are not passed on to the consumer, every time a truck roll is avoided the utility should be sending a
check equal to that costs savings to the consumer base.
– Ability to save energy • The AMI meters themselves increases demand for energy capacity and costs the consumer ~115.00 per year in added costs they were never told
about. In addition there is a question of fairness in reporting how inductive loads are calculated in the meter readings. The lack of transparency in the data manipulations for inductive loads versus resistive loads has never been elaborated by the utility.
• The only way this will save energy is to require 100% compliance to Time of Use/Demand response to ration power to consumers. Demand Response policies have never been explained and enumerated to the consumer and many of these policies are already in the pipeline. Federal law requires that if DR is made available in a service area it is to be 100% enforced.
– Ability to incorporate alternative energy sources• This only applies to the utility. The utilities are blocking consumers the ability to sell back to the grid. The utilities have increased their rates to build
alternative energy sources and increased their billing to pay for these facilities. However they are also charging the current rates to the customer for what they now obtain for free.
– Ability to dynamically manage energy demands• The use of a network topology for meter reading is a benefit to the utility to possibly obtain real time information to match capacity to demands.
However the AMI system is only communicating power consumption on a daily basis so how is this to become a real time system unless the AMI meters begin transmitting demand at an almost constant rate. This has never been communicated to the consumer. The load of data collected if in a real time system would overwhelm the ability to process the data. If the intent is managing capacity to demand is the reason for deploying AMI then collecting the data once a day will not ever accomplish the goal to match capacity to demand. This is the critical flaw in the AMI concept at the point of use and the whole reasoning to deploy AMI and fails to accomplish this goal of dynamically managing the grid when only collecting data once a day. Since the AMI enabled Gas meters rely on the electric AMI meter, and the AMI electric meter justification is dubious with only daily readings the sum of the benefits of AMI is only related to elimination of manual meter readers, which has not resulted in any consumer savings.
– The need for AMI to reduce energy consumption• The most recent report from Michigan LARA estimate from 2014-2015 year predicts residential electric energy consumption as flat, with commercial
consumption reducing and industrial sectors growing by 3 % with a combined increase of 0.8 %. The revised report for 2016-2017 still states the growth as lower than historic values. Why do we need hundreds of millions of added costs to support a flat demand curve? Is this a solution looking for a problem?
3/6/2017 31

What’s Coming? Your bill – under Demand Response or called Time of Use Rates
3/6/2017 32
Data Source – DTE Energy Current Rate Plan versus a TOU Plan (excluding Distribution Charges) Net a 53% Increase in your bill – Note Analog Meter
A Typical Day Excluding Distribution Charges up to Feb 22, 2017 Under DR/TOU
Analog Meter Time of Day kWh Used [email protected] AMI Meter Variable Rate Costs/Variable
AM 00:00 - 01:00 0.4260 $0.0336 $0.0473 $0.020
01:00 - 02:00 0.4150 $0.0327 $0.0473 $0.020
02:00 - 03:00 0.3870 $0.0305 $0.0473 $0.018
03:00 - 04:00 0.4200 $0.0331 $0.0473 $0.020
04:00 - 05:00 0.3700 $0.0292 $0.0473 $0.017
05:00 - 06:00 0.4320 $0.0341 $0.0473 $0.020
06:00 - 07:00 0.4170 $0.0329 $0.0473 $0.020
07:00 - 08:00 0.4590 $0.0362 $0.0827 $0.038
08:00 - 09:00 0.8290 $0.0654 $0.0827 $0.069
09:00 - 10:00 1.2340 $0.0973 $0.0827 $0.102
10:00 - 11:00 1.4970 $0.1181 $0.0827 $0.124
11:00 - 12:00 1.7560 $0.1385 $0.0827 $0.145
PM 01:00 - 02:00 1.3120 $0.1035 $0.0827 $0.109
02:00 - 03:00 2.2570 $0.1780 $0.0827 $0.187
03:00 - 04:00 1.6570 $0.1307 $0.1419 $0.235
04:00 - 05:00 1.5070 $0.1189 $0.1419 $0.214
05:00 - 06:00 1.4110 $0.1113 $0.1419 $0.200
06:00 - 07:00 1.9850 $0.1566 $0.1419 $0.282
07:00 - 08:00 1.5160 $0.1196 $0.0827 $0.125
08:00 - 09:00 1.3940 $0.1100 $0.0827 $0.115
09:00 - 10:00 1.4710 $0.1160 $0.0827 $0.122
10:00 - 11:00 1.1770 $0.0928 $0.0827 $0.097
11:00 - 12:00 0.9350 $0.0738 $0.0473 $0.044
Total 25.2640 $1.5302 $2.343
Net Increase from TOU --------------- 53.12%

What’s Coming? Your bill – under Demand Response or called Time of Use Rates
3/6/2017 33
Data Source – DTE Energy Current Rate Plan versus a TOU Plan (excluding Distribution Charges) Net a 15% Increase in your bill
A Typical Day Excluding Distribution Charges after Feb 23, 2017 Under DR/TOU
Analog Meter Time of Day kWh Used [email protected] AMI Meter Variable Rate Costs/Variable
AM 00:00 - 01:00 0.4260 $0.0342 $0.0473 $0.020
01:00 - 02:00 0.4150 $0.0333 $0.0473 $0.020
02:00 - 03:00 0.3870 $0.0311 $0.0473 $0.018
03:00 - 04:00 0.4200 $0.0337 $0.0473 $0.020
04:00 - 05:00 0.3700 $0.0297 $0.0473 $0.017
05:00 - 06:00 0.4320 $0.0347 $0.0473 $0.020
06:00 - 07:00 0.4170 $0.0335 $0.0473 $0.020
07:00 - 08:00 0.4590 $0.0369 $0.0827 $0.038
08:00 - 09:00 0.8290 $0.0666 $0.0827 $0.069
09:00 - 10:00 1.2340 $0.0992 $0.0827 $0.102
10:00 - 11:00 1.4970 $0.1203 $0.0827 $0.124
11:00 - 12:00 1.7560 $0.1411 $0.0827 $0.145
PM 01:00 - 02:00 1.3120 $0.1054 $0.0827 $0.109
02:00 - 03:00 2.2570 $0.1813 $0.0827 $0.187
03:00 - 04:00 1.6570 $0.1331 $0.1419 $0.235
04:00 - 05:00 1.5070 $0.1211 $0.1419 $0.214
* Note >17 kWh 05:00 - 06:00 1.4110 $0.1134 [email protected] $0.1419 $0.200
06:00 - 07:00 1.9850 $0.1595 $0.1419 $0.282
07:00 - 08:00 1.5160 $0.1218 $0.0827 $0.125
08:00 - 09:00 1.3940 $0.1120 $0.0827 $0.115
09:00 - 10:00 1.4710 $0.1182 $0.0827 $0.122
10:00 - 11:00 1.1770 $0.0946 $0.0827 $0.097
11:00 - 12:00 0.9350 $0.0751 $0.0473 $0.044
Total 25.2640 $2.0300 $2.343
Net Increase from TOU --------------- 15.42%
What’s Coming? Your bill – under Demand Response or called Time of Use Rates
3/6/2017 34
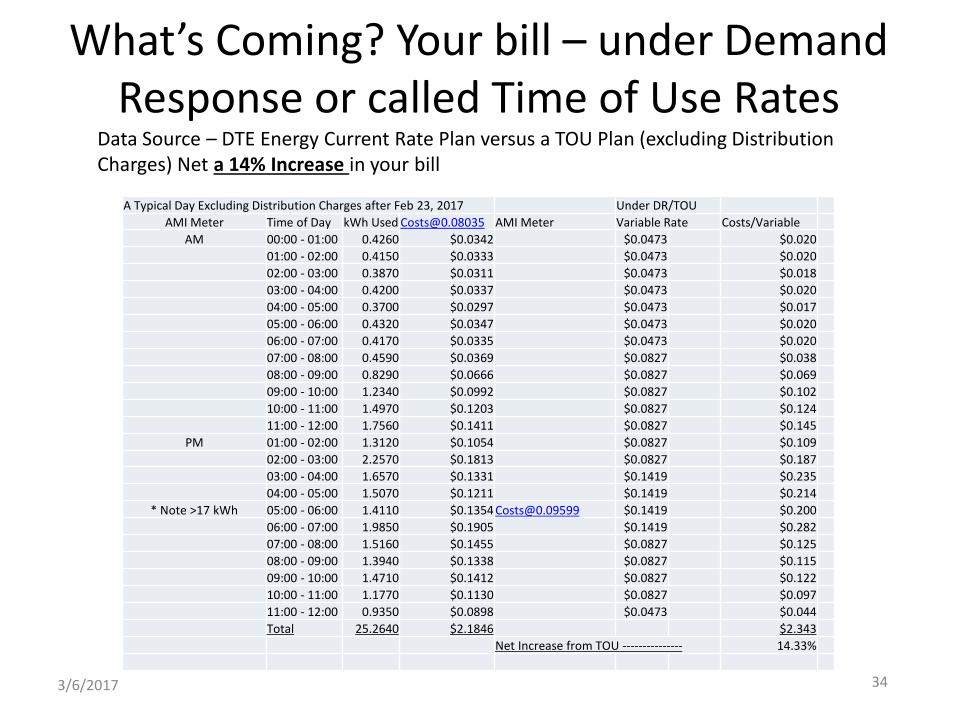
Data Source – DTE Energy Current Rate Plan versus a TOU Plan (excluding Distribution Charges) Net a 14% Increase in your bill
A Typical Day Excluding Distribution Charges after Feb 23, 2017 Under DR/TOU
AMI Meter Time of Day kWh Used [email protected] AMI Meter Variable Rate Costs/Variable
AM 00:00 - 01:00 0.4260 $0.0342 $0.0473 $0.020
01:00 - 02:00 0.4150 $0.0333 $0.0473 $0.020
02:00 - 03:00 0.3870 $0.0311 $0.0473 $0.018
03:00 - 04:00 0.4200 $0.0337 $0.0473 $0.020
04:00 - 05:00 0.3700 $0.0297 $0.0473 $0.017
05:00 - 06:00 0.4320 $0.0347 $0.0473 $0.020
06:00 - 07:00 0.4170 $0.0335 $0.0473 $0.020
07:00 - 08:00 0.4590 $0.0369 $0.0827 $0.038
08:00 - 09:00 0.8290 $0.0666 $0.0827 $0.069
09:00 - 10:00 1.2340 $0.0992 $0.0827 $0.102
10:00 - 11:00 1.4970 $0.1203 $0.0827 $0.124
11:00 - 12:00 1.7560 $0.1411 $0.0827 $0.145
PM 01:00 - 02:00 1.3120 $0.1054 $0.0827 $0.109
02:00 - 03:00 2.2570 $0.1813 $0.0827 $0.187
03:00 - 04:00 1.6570 $0.1331 $0.1419 $0.235
04:00 - 05:00 1.5070 $0.1211 $0.1419 $0.214
* Note >17 kWh 05:00 - 06:00 1.4110 $0.1354 [email protected] $0.1419 $0.200
06:00 - 07:00 1.9850 $0.1905 $0.1419 $0.282
07:00 - 08:00 1.5160 $0.1455 $0.0827 $0.125
08:00 - 09:00 1.3940 $0.1338 $0.0827 $0.115
09:00 - 10:00 1.4710 $0.1412 $0.0827 $0.122
10:00 - 11:00 1.1770 $0.1130 $0.0827 $0.097
11:00 - 12:00 0.9350 $0.0898 $0.0473 $0.044
Total 25.2640 $2.1846 $2.343
Net Increase from TOU --------------- 14.33%

What’s Coming? Your bill – under Demand Response or called Time of Use Rates
3/6/2017 35
Data Source – DTE Energy Current Rate Plan after 2/27/17 versus a TOU Plan (excluding Distribution Charges) Net a 249% Increase in your bill
A Typical Hot Summar Day Excluding Distribution Charges after Feb 23, 2017 Under DR/TOU
AMI Meter Time of Day kWh Used [email protected] AMI Meter Variable Rate Costs/Variable
AM 00:00 - 01:00 0.4260 $0.0342 $0.0473 $0.020
01:00 - 02:00 0.4150 $0.0333 $0.0473 $0.020
02:00 - 03:00 0.3870 $0.0311 $0.0473 $0.018
03:00 - 04:00 0.4200 $0.0337 $0.0473 $0.020
04:00 - 05:00 0.3700 $0.0297 $0.0473 $0.017
05:00 - 06:00 0.4320 $0.0347 $0.0473 $0.020
06:00 - 07:00 0.4170 $0.0335 $0.0473 $0.020
07:00 - 08:00 0.4590 $0.0369 $0.0827 $0.038
08:00 - 09:00 0.8290 $0.0666 $0.0827 $0.069
09:00 - 10:00 1.2340 $0.0992 $0.0827 $0.102
10:00 - 11:00 1.4970 $0.1203 $0.0827 $0.124
11:00 - 12:00 1.7560 $0.1411 $0.0827 $0.145
PM 01:00 - 02:00 1.3120 $0.1054 $0.0827 $0.109
02:00 - 03:00 2.2570 $0.1813 $0.0827 $0.187
03:00 - 04:00 1.6570 $0.1331 $0.9500 $1.574
04:00 - 05:00 1.5070 $0.1211 $0.9500 $1.432
* Note >17 kWh of the day 05:00 - 06:00 1.4110 $0.1354 [email protected] $0.9500 $1.340
06:00 - 07:00 1.9850 $0.1905 $0.9500 $1.886
07:00 - 08:00 1.5160 $0.1455 $0.0827 $0.125
08:00 - 09:00 1.3940 $0.1338 $0.0827 $0.115
09:00 - 10:00 1.4710 $0.1412 $0.0827 $0.122
10:00 - 11:00 1.1770 $0.1130 $0.0827 $0.097
11:00 - 12:00 0.9350 $0.0898 $0.0473 $0.044
Total 25.2640 $2.1846 $7.645
Net Increase from TOU --------------- 249.92%

ITRON Radios Characteristics
3/6/2017 36
• ZIGBEE Home Area Network (HAN) Radio Signal
• Encrypted Packet Radio Network (GPRS), @2.4GHz radio frequency• Uses a Mesh Network topology similar to the AMI meter’s 902-928 MHz radio• Also uses a gateway to your home network router• The ITRON Meter acts as the coordinator, therefore you need to contact the utility
to register each device you add to include them in the HAN network• The packet size is 127 bytes• Coordinator power levels are up to 1 Watt, though mostly 0.4 Watts

ITRON Meter Vulnerability
3/6/2017 37
• Can the radio signals be hacked?
• The 902-928 MHz and the HAN ZIGBEE 2.4 GHz radio packets are AES 128 encrypted . Therefore it is unlikely that a hacker would take the steps needed to attack your home via the network. It would not gain them anything financially.
• The Collector which is the most vulnerable component (Weak Link) is the regional repeater/collector. While this device cannot be easily hacked, it can be attacked. I do not condone in any way any actions but any terrorist group can obtain a shotgun and disable it by shooting it. It is unclear what individual homes would experience regarding their power, it may cause a massive power shutdown due to a “false Positive” to a tampering of the meter. A large scale reconnect would create serious damage to the grid
• Another method would be to design a broadband RF interference transmitter operating at >30 Watts and flood the repeater with signals so it cannot collect data.
Weak Link

ITRON Meter Vulnerability
3/6/2017 38
• Privacy - Can your personal information be hacked?
• The 902-928 MHz radio sends personal usage on a 1-15 minute interval to the utility. The signal can determine if you are at home, when you use your power the most, and whether the load is resistive (Light Bulbs) or inductive (electric motors).
• With the Energy Bridge device they can determine the model number and serial number of the appliances you have, turn off your appliances remotely without your permission and share your personal information with third parties you will not be able to control. They also can connect to your Smart TV and scan what TV shows you watch and report that to third parties. With a Smart TV they can actually listen to your conversations. Spam and Phishing attacks will likely expand if you hook up to the HAN network.
• With the Energy Bridge device they can connect to your home network router and listen to your internet traffic such as VOIP phone conversations, emails, streamed downloads etc. Since they will be directly connected to the router via a wired connection and do not need encryption to detect the traffic.
• Each Meter also has a infrared LED at the top which flashes more frequently as you use more power. If you have a night vision goggle you can readily see this. Police can use this as an indicator of a possible illegal drug growing indicator. Thieves can use this to determine if a house is not occupied at the time.
SMPS with Common Mode Filter –Principles You Need to Understand
3/6/2017 39
• What you need to know about the effects of applying electrical and magnetic principles
• Whenever you switch electricity between on and off you create an electrical spike in the electrical signal that looks like a saw tooth shape waveform on an oscilloscope, this creates RF noise (static) and magnetic effects, these are called EMI/RFI leading to dirty electricity.
• When you place a voltmeter into an common house outlet the volt meter is providing an RMS measurement. RMS is an abbreviation of the term “Root Mean Square”. The actual peak voltage of a common house 115-120 volt AC cycle is about 177 volts. The RMS voltage is 120 volts. Never grab a house circuit with your hands, it will kill you because you are not be able to let go of the wires, because your muscles contract and the current will not let you release yourself. Then you go in heart seizure, this is very deadly.

SMPS with Common Mode Filter –Principles You Need to Understand
3/6/2017 40
• What you need to know about the effects of applying electrical and magnetic principles
• A SMPS utilizes a switching semiconductor (electronic chip) circuit to reduce the overall size and weight of the power supply and improves efficiency. This chip has other components that limit the amount of voltage rise in the switching circuit, these are called capacitors and can be in either cylindrical in shape, a flat or box shape. There are many other parts but these are the key components.
• A SMPS works similarly as if you were to turn your light switch on and off at a very high frequency. The amount of voltage reaching the light would be reduced to a fraction of its full voltage illumination making the light dim. You could do the same thing with a very large resistor, but that resistor would get extremely hot very quickly, consume large amperages and waste power.

Common Mode Filter - SamplePlease note this is an example of the Common Mode Filter from a different design example
3/6/2017 41
Here the choke coil and the capacitors combine to remove dirty electricity in this UL approved and FCC compliant design