Embed Size (px)
Citation preview
Journal of Human Resource and Sustainability Studies, 2016, 4, 281-292 http://www.scirp.org/journal/jhrss
ISSN Online: 2328-4870 ISSN Print: 2328-4862
DOI: 10.4236/jhrss.2016.44028 October 21, 2016
Evaluation of the Employee Core Competencies Influencing the Performance Appraisal System with Reference to Agriculture Research Institutes, Hyderabad: A Multiple Regression Analysis
K. D. V. Prasad1*, Rajesh Vaidya2, M. Mrutyunjaya Rao1
1Faculty of Commerce, Rashtrasant Tukdoji Maharaj Nagpur University, Nagpur, India 2Department of Management and Technology, Shree Ramdeobaba College of Engineering and Management, Nagpur, India
Abstract In this research study we reported the results on the employee core competencies in-fluencing the evaluation performance appraisal system using multiple regression analysis with reference to Agriculture Research Institutes employees in Hyderabad Metro, India. The primary data were collected from the performance appraisal forms of 400 employees working in the agriculture research institutes in Hyderabad, India consisting of from 300 men and 100 women employees. The seven independent fac-tors, Job knowledge, Skill level, Job execution, Initiative, Client Orientation, Team Work, Compliance to Policies and Practices, one dependent factor outcome of the Performance Appraisal System (PAS), the Rating were measured. The descriptive analysis, correlation techniques and parametric statistics like t-test and multiple re-gression analysis were carried out to arrive at the conclusions. To measure the relia-bility of the scale used for this study, and internal consistencies of the instrument, the reliability statistics—Cronbach’s alpha (C-Alpha) was estimated. The overall C-Alpha value is 0.91, and the C-Alpha values for all the factors ranged from 0.81 to 0.89, whereas overall Spearman Brown Split-half is measured at 0.88. The multiple regres-sion analysis reveals 74% variance observed in this model and except client orienta-tion all core-competencies are influencing the model and outcome of the perfor-mance appraisal outcome—the Final Rating.
Keywords Performance Appraisal, Cronbach Alpha, Spearman-Brown Reliability, Effectiveness, Regression
How to cite this paper: Prasad, K.D.V., Vaidya, R. and Mrutyunjaya Rao, M. (2016) Evaluation of the Employee Core Compe-tencies Influencing the Performance Ap-praisal System with Reference to Agriculture Research Institutes, Hyderabad: A Multiple Regression Analysis. Journal of Human Resource and Sustainability Studies, 4, 281- 292. http://dx.doi.org/10.4236/jhrss.2016.44028 Received: September 19, 2016 Accepted: October 18, 2016 Published: October 21, 2016 Copyright © 2016 by authors and Scientific Research Publishing Inc. This work is licensed under the Creative Commons Attribution International License (CC BY 4.0). http://creativecommons.org/licenses/by/4.0/
Open Access
K. D. V. Prasad et al.
282
1. Introduction
Performance Appraisal is a formal system of review and evaluation of individual or team task performance, and in general peers review an individual’s performance on a continuing yearly basis. The Performance Appraisal System (PAS) is a development tool used to measure the actual performance in an organization, aligning the strategic goals with that of individual performance. Using PAS an employee’s performance is measured against core competencies such as job knowledge, Skill level, Job execution, Initiative, Client orientation, Team Work, quality and quantity of output, leadership qualities, and compliance to policies and practices including safety and environment, efficient handling of available resources, intuitiveness to take new assignments. How-ever the core competencies will vary from organization to organizations depending on its objectives, business strategies, and mission.
The performance management is an extensive, methodical, sequential and conti-nuous process that involves performance mapping processes and sequences [1]. Per-formance measurement is the process that an organization follows to objectively meas-ure how well its stated objectives/mission or goals are being met. In general this in-volves phases like, articulating and arriving at an agreement on objectives, selecting performance indicators and setting goals/challenges, observing performance, and ana-lyzing those results against a set of goals that were formulated in the organization. Or-ganizations that emphasize accountability tend to use performance targets, but too much emphasis on "hard" targets can potentially have dysfunctional consequences. Or-ganizations focus more on management improvement which may place less emphasis on setting and achieving targets, and instead require organizations to demonstrate steady improvements in performance. In most of the organizations across the globe an employee performance is measured on yearly basis. In general most of the organiza-tions include the performance appraisal system under Performance Management sys-tem, where supervisor/subordinate interviews with a standard performance appraisal form with the factors to be appraised or listed in the form [2]. The performance man-agement provides more opportunities for individuals to discuss their work with their managers in an attractive atmosphere [3]. Performance Appraisal system is a conti-nuous process and a natural aspect of management and assess performance by refer-ence to agreed objectives. Performance management gives direction to the employees through guidance from management (Medlin, 2013). The human resources managers believe that PAS is a good tool for performance improvement [4]. The performance appraisal system, if well designed and implemented, can benefit both the employees and the organizations [5]. DeNisis and Pritchard (2006) [6] aver that attitudes toward per-formance management affect the performance of employees in organisations.
Use of Performance Appraisal System in Agricultural Research Institutes (ARIs) The main objective of PAS in ARI is to improve employee and institutes perfor-
mance. Though the PAS can some dissatisfaction over how the employee as appraised, still it can help to achieve institutes’ vision and mission. PAS is one of the human re-sources valuable functional area which is helpful in correcting the deviations/errors in
K. D. V. Prasad et al.
283
employee performance. At the Institute PAS is effectively used for Human Resource Planning in assessing a list of staff to be promoted, to identify the underperformed em-ployees who need a corrective action. PAS is also a useful tool for succession planning and provides a profile for the institutes strengths and weakness. The PAS evaluations ratings will be used for Recruitment and Selection at the next level. The ratings will provide benchmarks for evaluating internal applicant responses obtained through in-terviews. The PAS will be used to identify the Training and Development needs of the institute by identifying the employee deficiencies in those core competencies that effect the outcome of the institute. The PAS system is helpful for career planning, compensa-tion program, succession planning and human resources development.
2. Review of Literature
Performance appraisal is an unpleasant management practice. With so much contro-versy in it, appraisal is continually used in the public sector around the world as an in-strument to oversee the performance of its personnel [7]. Researchers suggested to have an effective human resource system for organizations the use of an appraisal system which is reliable and accurate for employee assessment and organisational development [8]-[10]. From the results of the factors influencing the Employees’ service performance in Ministry of Education in Sultanate of Omani using Factor Analysis suggested that the training and performance appraisal have a significant influence on the employees’ Performance [11].
George Ndemo Ochoti et al. (2012) [12] studied the Factors Influencing Employee Performance Appraisal System: A Case of the Ministry of State for Provincial Adminis-tration & Internal Security, Kenya. Performance Appraisal system is a good tool for human resource management and performance improvement [4]. Involving the em-ployees to understand organizational goals, what is expected of them and what they will expect for achieving their performance goal will help in organizational development [13]. PAS should also link individual performance with reward management [14]. Linking performance with reward increases the levels of performances and should be used in both public and private sectors [15]
Feedback is an important factor of PAS and the rates should be given feedback on their competence and overall progress [16]. The 360 degree feedback method can be utilized by organizations as this method combines evaluations from various sources in-to over all appraisal [17]. Performance ratings are based on rater evaluations which are subject to human judgements and biasedness. Personal factors and prejudices are like to influence ratings [18]. The interpersonal factors are important to the PAS as they in-fluence the outcome of the interactions [19] (Greenberg, 1993). The employee attitude toward the system is strongly linked to satisfaction with the system. The perceptions of fairness of the system are an important aspect that contributes to its effectiveness [20]. Understanding the employee’s attitude and behaviour about the PAS in organizations is important as they are key to determine the effectiveness [21]. Zakaria et al. (2012) [22] reported that (HRM practices can develop the performance of an organisation by con-
K. D. V. Prasad et al.
284
tributing to employee satisfaction. The performance appraisal is arguably one of the more critical factor in terms of organisation performance and appears to be an indis-pensable part of any HRM system when compared among the HR practices studied [23].
Yee and Chen 2009 [24] applied fuzzy set theory in the multi-criteria performance appraisal system and developed a performance appraisal system utilizing the perfor-mance appraisal criteria from an Information and Communication Technology based company in Malaysia. This system uses multifactorial evaluation model in assisting high-level management and following a systemic approach for assessing the employee performance.
3. Objectives and Hypotheses
The objective of the study is to present the main factors influence the PAS system in the agriculture sector institute employees; • To identify the core-competencies that influence PAS at the workplace of Agricul-
ture research institutes in Hyderabad, India. • To identify whether there are any significant mean differences in the above said
factors in influencing the PAS. Research question
1) Does Performance Appraisal System process influence the organizational perfor-mance and effectiveness?
2) Does the seven independent core competencies—Job knowledge, Skill level, Job ex-ecution, Initiative, Client Orientation, Team Work, Compliance to Policies and Practices one dependent factor outcome of the PAS Rating influence the PAS?
HYPOTHESES Based on the identified problem, research question and the objectives the following
hypotheses were formed: H1: There are significant differences among seven independent core competencies
that influence the PAS. H2: There are no significant differences among the core competencies that influence
the PAS.
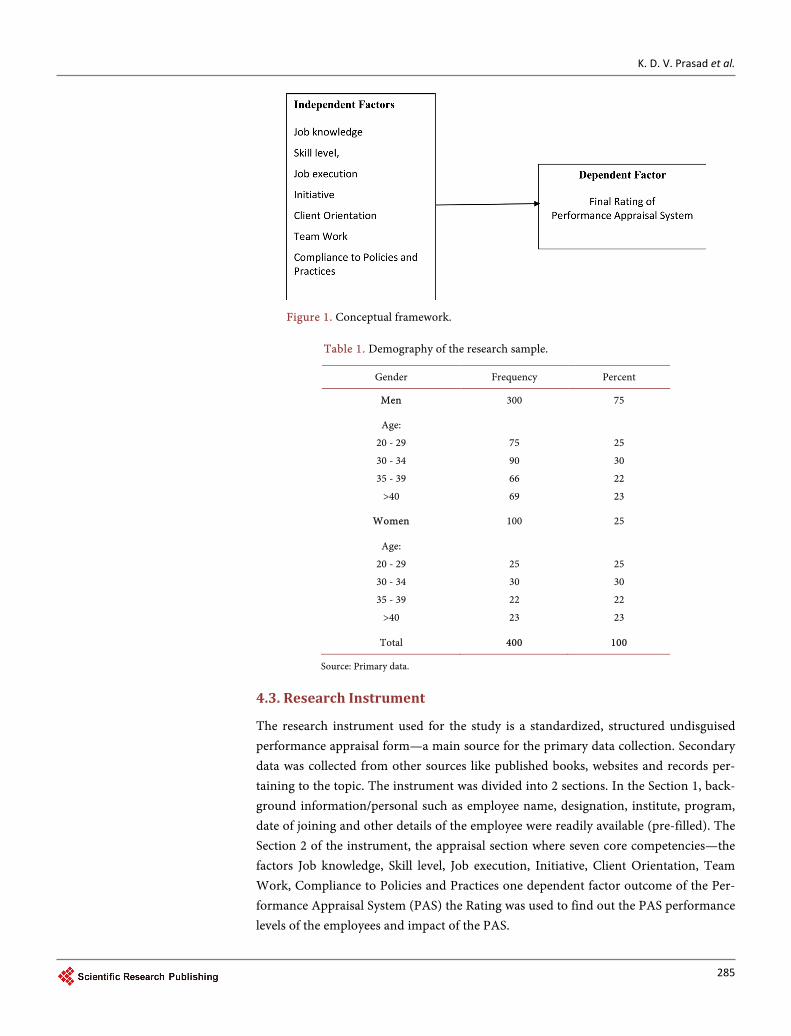
4. Research Methodology 4.1. Conceptual Framework
The proposed framework was adopted based on the past research [12]. The factors un-der the study have been represented diagrammatically to show the relationship between independent factors and dependent factors (Figure 1).
4.2. Data Collection
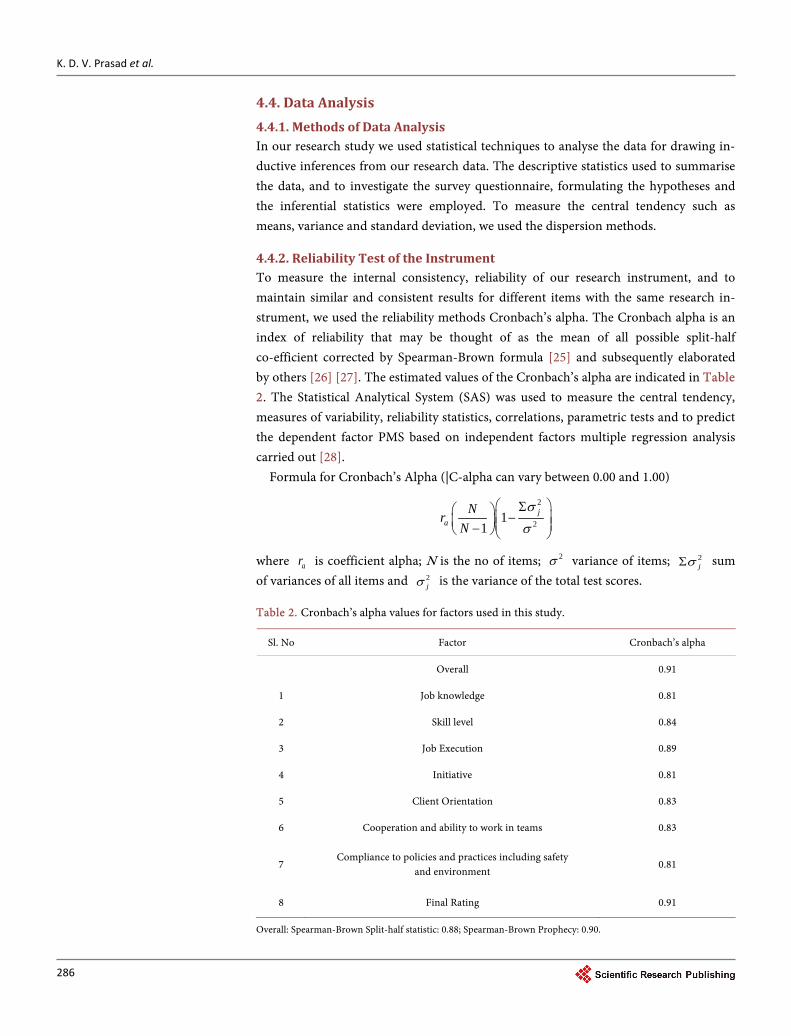
Sample Size: A sample size of 400 employees selected using simple random sampling without replacement, where each number of the subset has an equal probability of be-ing chosen, and the demography of sample indicated in the Table 1.
K. D. V. Prasad et al.
285
Figure 1. Conceptual framework.
Table 1. Demography of the research sample.
Gender Frequency Percent
Men 300 75
Age:
20 - 29
30 - 34
35 - 39
>40
75
90
66
69
25
30
22
23
Women 100 25
Age:
20 - 29
30 - 34
35 - 39
>40
25
30
22
23
25
30
22
23
Total 400 100
Source: Primary data.
4.3. Research Instrument
The research instrument used for the study is a standardized, structured undisguised performance appraisal form—a main source for the primary data collection. Secondary data was collected from other sources like published books, websites and records per-taining to the topic. The instrument was divided into 2 sections. In the Section 1, back-ground information/personal such as employee name, designation, institute, program, date of joining and other details of the employee were readily available (pre-filled). The Section 2 of the instrument, the appraisal section where seven core competencies—the factors Job knowledge, Skill level, Job execution, Initiative, Client Orientation, Team Work, Compliance to Policies and Practices one dependent factor outcome of the Per-formance Appraisal System (PAS) the Rating was used to find out the PAS performance levels of the employees and impact of the PAS.
K. D. V. Prasad et al.
286
4.4. Data Analysis 4.4.1. Methods of Data Analysis In our research study we used statistical techniques to analyse the data for drawing in-ductive inferences from our research data. The descriptive statistics used to summarise the data, and to investigate the survey questionnaire, formulating the hypotheses and the inferential statistics were employed. To measure the central tendency such as means, variance and standard deviation, we used the dispersion methods.
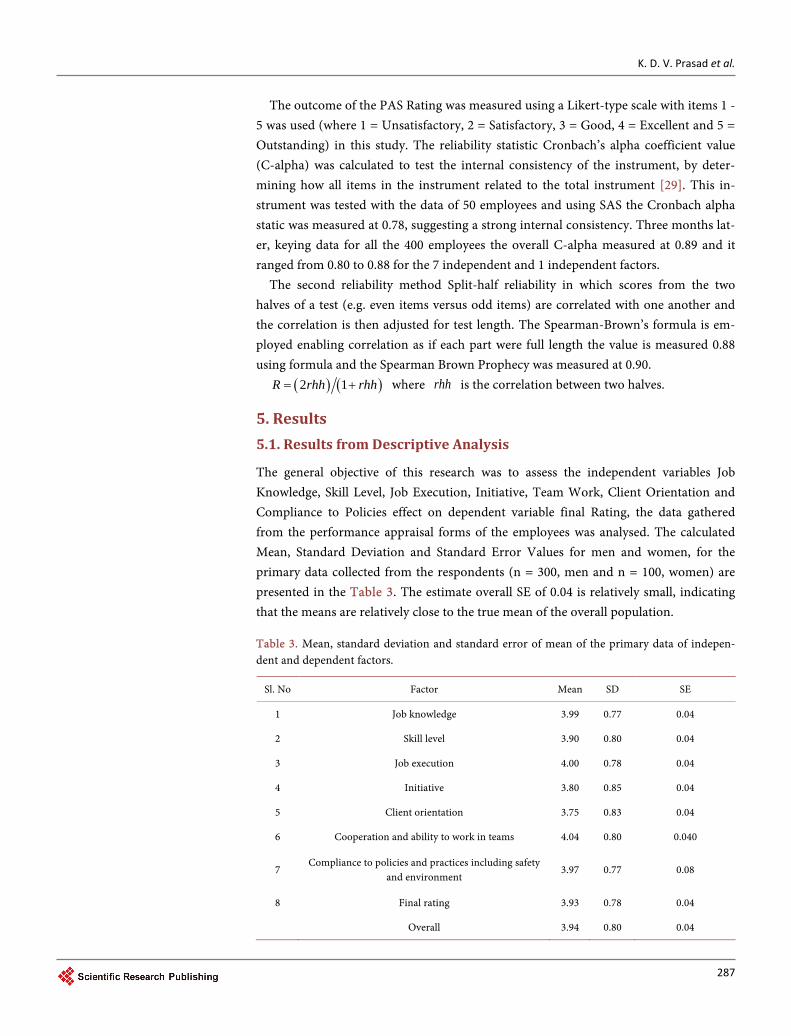
4.4.2. Reliability Test of the Instrument To measure the internal consistency, reliability of our research instrument, and to maintain similar and consistent results for different items with the same research in-strument, we used the reliability methods Cronbach’s alpha. The Cronbach alpha is an index of reliability that may be thought of as the mean of all possible split-half co-efficient corrected by Spearman-Brown formula [25] and subsequently elaborated by others [26] [27]. The estimated values of the Cronbach’s alpha are indicated in Table 2. The Statistical Analytical System (SAS) was used to measure the central tendency, measures of variability, reliability statistics, correlations, parametric tests and to predict the dependent factor PMS based on independent factors multiple regression analysis carried out [28].
Formula for Cronbach’s Alpha (|C-alpha can vary between 0.00 and 1.00)
2
211
ja
NrN
σσ
Σ − −
where ar is coefficient alpha; N is the no of items; 2σ variance of items; 2jσΣ sum
of variances of all items and 2jσ is the variance of the total test scores.
Table 2. Cronbach’s alpha values for factors used in this study.
Sl. No Factor Cronbach’s alpha
Overall 0.91
1 Job knowledge 0.81
2 Skill level 0.84
3 Job Execution 0.89
4 Initiative 0.81
5 Client Orientation 0.83
6 Cooperation and ability to work in teams 0.83
7 Compliance to policies and practices including safety
and environment 0.81
8 Final Rating 0.91
Overall: Spearman-Brown Split-half statistic: 0.88; Spearman-Brown Prophecy: 0.90.
K. D. V. Prasad et al.
287
The outcome of the PAS Rating was measured using a Likert-type scale with items 1 - 5 was used (where 1 = Unsatisfactory, 2 = Satisfactory, 3 = Good, 4 = Excellent and 5 = Outstanding) in this study. The reliability statistic Cronbach’s alpha coefficient value (C-alpha) was calculated to test the internal consistency of the instrument, by deter-mining how all items in the instrument related to the total instrument [29]. This in-strument was tested with the data of 50 employees and using SAS the Cronbach alpha static was measured at 0.78, suggesting a strong internal consistency. Three months lat-er, keying data for all the 400 employees the overall C-alpha measured at 0.89 and it ranged from 0.80 to 0.88 for the 7 independent and 1 independent factors.
The second reliability method Split-half reliability in which scores from the two halves of a test (e.g. even items versus odd items) are correlated with one another and the correlation is then adjusted for test length. The Spearman-Brown’s formula is em-ployed enabling correlation as if each part were full length the value is measured 0.88 using formula and the Spearman Brown Prophecy was measured at 0.90.
( ) ( )2 1R rhh rhh= + where rhh is the correlation between two halves.
5. Results 5.1. Results from Descriptive Analysis
The general objective of this research was to assess the independent variables Job Knowledge, Skill Level, Job Execution, Initiative, Team Work, Client Orientation and Compliance to Policies effect on dependent variable final Rating, the data gathered from the performance appraisal forms of the employees was analysed. The calculated Mean, Standard Deviation and Standard Error Values for men and women, for the primary data collected from the respondents (n = 300, men and n = 100, women) are presented in the Table 3. The estimate overall SE of 0.04 is relatively small, indicating that the means are relatively close to the true mean of the overall population.
Table 3. Mean, standard deviation and standard error of mean of the primary data of indepen-dent and dependent factors.
Sl. No Factor Mean SD SE
1 Job knowledge 3.99 0.77 0.04
2 Skill level 3.90 0.80 0.04
3 Job execution 4.00 0.78 0.04
4 Initiative 3.80 0.85 0.04
5 Client orientation 3.75 0.83 0.04
6 Cooperation and ability to work in teams 4.04 0.80 0.040
7 Compliance to policies and practices including safety
and environment 3.97 0.77 0.08
8 Final rating 3.93 0.78 0.04
Overall 3.94 0.80 0.04
K. D. V. Prasad et al.
288
Table 4. Correlation among the study variables.
Job Knowledge Job Skill Job Execution Initiative Client Orientation Tem Work Compliance To Policies Rating (Final)
Job Knowledge 1
Job Skill 0.691** 1
Job Execution 0.539** 0.511** 1
Initiative 0.589** 0.506** 0.651** 1
Client Orientation 0.552** 0.533** 0.592** 0.560** 1
Team Work 0.392** 0.400** 0.521** 0.494** 0.556** 1
Compliance to Policies 0.452** 0.430** 0.548** 0.502** 0.504** 0.525** 1
Rating (Final) 0.638** 0.660** 0.735** 0.670** 0.606** 0.610** 0.646** 1
Pearson Correlation **Correlation is significant at prob. <0.01; Source: Primary Data.
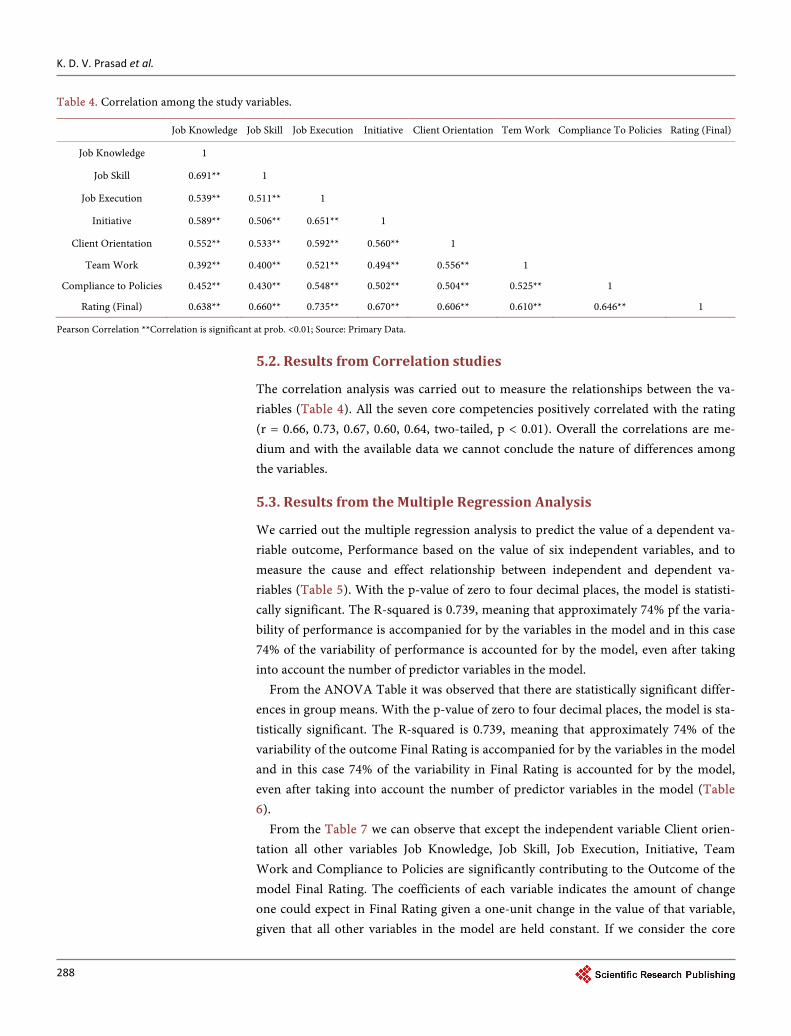
5.2. Results from Correlation studies
The correlation analysis was carried out to measure the relationships between the va-riables (Table 4). All the seven core competencies positively correlated with the rating (r = 0.66, 0.73, 0.67, 0.60, 0.64, two-tailed, p < 0.01). Overall the correlations are me-dium and with the available data we cannot conclude the nature of differences among the variables.
5.3. Results from the Multiple Regression Analysis
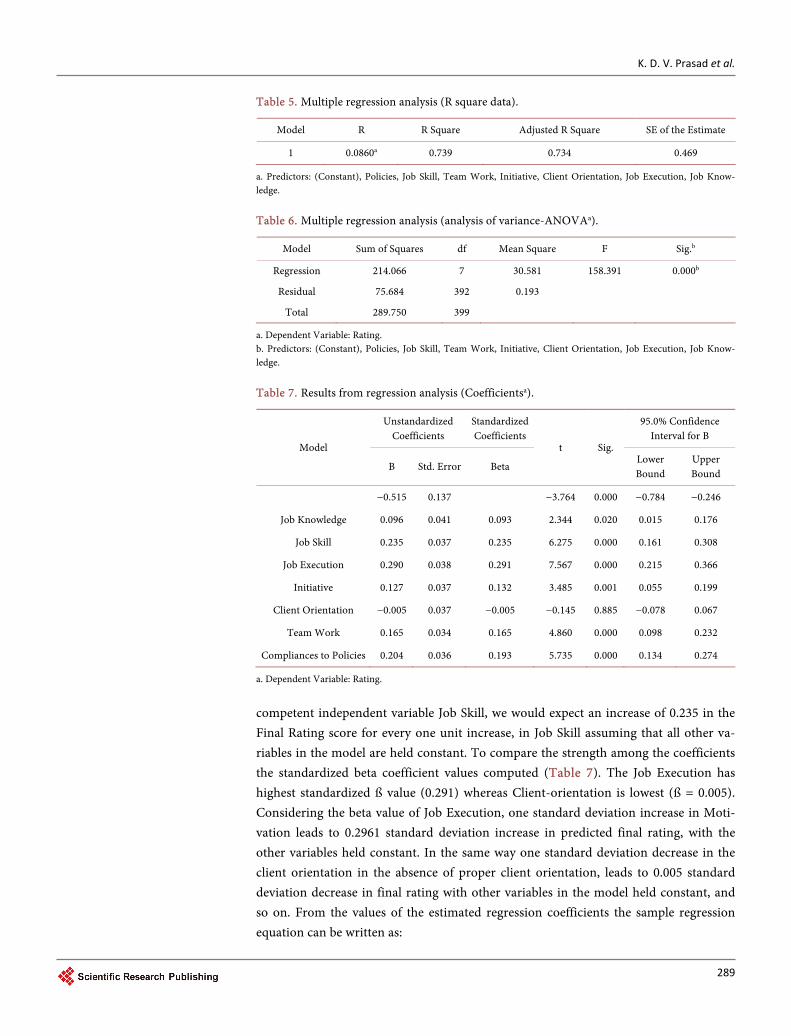
We carried out the multiple regression analysis to predict the value of a dependent va-riable outcome, Performance based on the value of six independent variables, and to measure the cause and effect relationship between independent and dependent va-riables (Table 5). With the p-value of zero to four decimal places, the model is statisti-cally significant. The R-squared is 0.739, meaning that approximately 74% pf the varia-bility of performance is accompanied for by the variables in the model and in this case 74% of the variability of performance is accounted for by the model, even after taking into account the number of predictor variables in the model.
From the ANOVA Table it was observed that there are statistically significant differ-ences in group means. With the p-value of zero to four decimal places, the model is sta-tistically significant. The R-squared is 0.739, meaning that approximately 74% of the variability of the outcome Final Rating is accompanied for by the variables in the model and in this case 74% of the variability in Final Rating is accounted for by the model, even after taking into account the number of predictor variables in the model (Table 6).
From the Table 7 we can observe that except the independent variable Client orien-tation all other variables Job Knowledge, Job Skill, Job Execution, Initiative, Team Work and Compliance to Policies are significantly contributing to the Outcome of the model Final Rating. The coefficients of each variable indicates the amount of change one could expect in Final Rating given a one-unit change in the value of that variable, given that all other variables in the model are held constant. If we consider the core
K. D. V. Prasad et al.
289
Table 5. Multiple regression analysis (R square data).
Model R R Square Adjusted R Square SE of the Estimate
1 0.0860a 0.739 0.734 0.469
a. Predictors: (Constant), Policies, Job Skill, Team Work, Initiative, Client Orientation, Job Execution, Job Know-ledge.
Table 6. Multiple regression analysis (analysis of variance-ANOVAa).
Model Sum of Squares df Mean Square F Sig.b
Regression 214.066 7 30.581 158.391 0.000b
Residual 75.684 392 0.193
Total 289.750 399
a. Dependent Variable: Rating. b. Predictors: (Constant), Policies, Job Skill, Team Work, Initiative, Client Orientation, Job Execution, Job Know-ledge.
Table 7. Results from regression analysis (Coefficientsa).
Model
Unstandardized Coefficients
Standardized Coefficients
t Sig.
95.0% Confidence Interval for B
B Std. Error Beta Lower Bound
Upper Bound
−0.515 0.137
−3.764 0.000 −0.784 −0.246
Job Knowledge 0.096 0.041 0.093 2.344 0.020 0.015 0.176
Job Skill 0.235 0.037 0.235 6.275 0.000 0.161 0.308
Job Execution 0.290 0.038 0.291 7.567 0.000 0.215 0.366
Initiative 0.127 0.037 0.132 3.485 0.001 0.055 0.199
Client Orientation −0.005 0.037 −0.005 −0.145 0.885 −0.078 0.067
Team Work 0.165 0.034 0.165 4.860 0.000 0.098 0.232
Compliances to Policies 0.204 0.036 0.193 5.735 0.000 0.134 0.274
a. Dependent Variable: Rating.
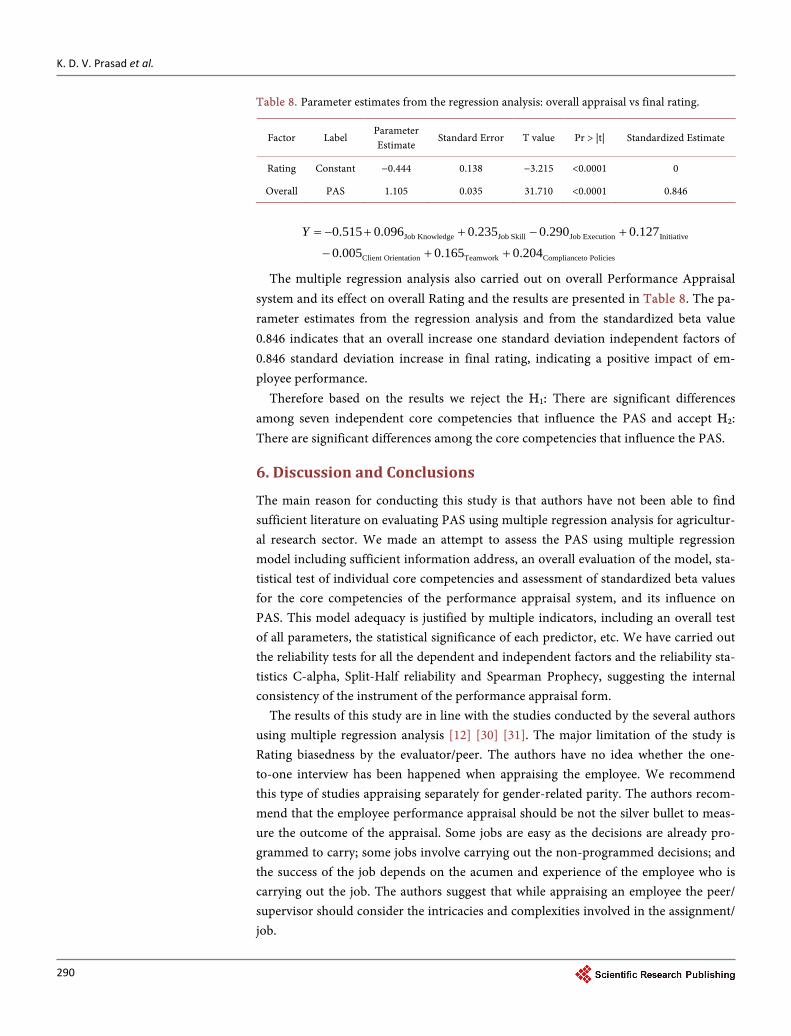
competent independent variable Job Skill, we would expect an increase of 0.235 in the Final Rating score for every one unit increase, in Job Skill assuming that all other va-riables in the model are held constant. To compare the strength among the coefficients the standardized beta coefficient values computed (Table 7). The Job Execution has highest standardized ß value (0.291) whereas Client-orientation is lowest (ß = 0.005). Considering the beta value of Job Execution, one standard deviation increase in Moti-vation leads to 0.2961 standard deviation increase in predicted final rating, with the other variables held constant. In the same way one standard deviation decrease in the client orientation in the absence of proper client orientation, leads to 0.005 standard deviation decrease in final rating with other variables in the model held constant, and so on. From the values of the estimated regression coefficients the sample regression equation can be written as:
K. D. V. Prasad et al.
290
Table 8. Parameter estimates from the regression analysis: overall appraisal vs final rating.
Factor Label Parameter Estimate
Standard Error T value Pr > |t| Standardized Estimate
Rating Constant −0.444 0.138 −3.215 <0.0001 0
Overall PAS 1.105 0.035 31.710 <0.0001 0.846
Job Knowledge Job Skill Job Execution Initiative
Client Orientation Teamwork Complianceto Policies
0.515 0.096 0.235 0.290 0.127
0.005 0.165 0.204
Y = − + + − +
− + +
The multiple regression analysis also carried out on overall Performance Appraisal system and its effect on overall Rating and the results are presented in Table 8. The pa-rameter estimates from the regression analysis and from the standardized beta value 0.846 indicates that an overall increase one standard deviation independent factors of 0.846 standard deviation increase in final rating, indicating a positive impact of em-ployee performance.
Therefore based on the results we reject the H1: There are significant differences among seven independent core competencies that influence the PAS and accept H2: There are significant differences among the core competencies that influence the PAS.
6. Discussion and Conclusions
The main reason for conducting this study is that authors have not been able to find sufficient literature on evaluating PAS using multiple regression analysis for agricultur-al research sector. We made an attempt to assess the PAS using multiple regression model including sufficient information address, an overall evaluation of the model, sta-tistical test of individual core competencies and assessment of standardized beta values for the core competencies of the performance appraisal system, and its influence on PAS. This model adequacy is justified by multiple indicators, including an overall test of all parameters, the statistical significance of each predictor, etc. We have carried out the reliability tests for all the dependent and independent factors and the reliability sta-tistics C-alpha, Split-Half reliability and Spearman Prophecy, suggesting the internal consistency of the instrument of the performance appraisal form.
The results of this study are in line with the studies conducted by the several authors using multiple regression analysis [12] [30] [31]. The major limitation of the study is Rating biasedness by the evaluator/peer. The authors have no idea whether the one- to-one interview has been happened when appraising the employee. We recommend this type of studies appraising separately for gender-related parity. The authors recom-mend that the employee performance appraisal should be not the silver bullet to meas-ure the outcome of the appraisal. Some jobs are easy as the decisions are already pro-grammed to carry; some jobs involve carrying out the non-programmed decisions; and the success of the job depends on the acumen and experience of the employee who is carrying out the job. The authors suggest that while appraising an employee the peer/ supervisor should consider the intricacies and complexities involved in the assignment/ job.
K. D. V. Prasad et al.
291
References [1] Garvin, D.A. (1998) The Process of Organizing and Management.
http://sloanreview.mit.edu/article/the-processes-of-organization-and-management/.
[2] Dargham, N.A.S. (2009) Effective Management of the Performance Appraisal Process in Lebanon: An Exploratory Study. Maître de Conférences à la FGM.
[3] Armstrong, M. (1991) A Handbook of Personnel Management Practice. 4th Edition, Kogan Page, London.
[4] Longenecker, C.O. and Goff, S.J. (1992) Performance Appraisal Effectiveness: A Matter of Perspective. Advanced Management Journal, 57, 18-23.
[5] Coens, A.T. and Jenkins, M. (2000) Abolishing Performance Appraisals. Berret-Koehler Publishers, Inc., San Francisco.
[6] DeNisi, A. and Protchard, R. (2006) Performance Appraisal, Performance Management and Improving Individual Performance: A Motivational Framework. Management and Organi-zation Review, 2, 253-277. http://dx.doi.org/10.1111/j.1740-8784.2006.00042.x
[7] Vallance, S. (1999) Performance Appraisal in Singapore, Thailand and the Philippines: A Cultural Perspective. Australian Journal of Public Administration, 58, 78-95. http://dx.doi.org/10.1111/1467-8500.00129
[8] Armstrong, M. (2003) A Handbook of Human Resource Management Practice. Kogan Page, London.
[9] Bohlander, G. and Snell, S. (2004) Managing Human Resources. SouthWestern, Mason, Ohio.
[10] Desler, G. (2008) Human Resource Management. 11th Edition, Pearson, Upper Saddle Riv-er, New Jersey.
[11] Saleh, A.L.S., Piaw, C.Y. and Idris, A.R. (2015) Factors Influencing the Employees’ Service Performance in Ministry of Education n Sultanate of Oman. Procedia Social and Behavioral Sciences, 197, 23-30. http://dx.doi.org/10.1016/j.sbspro.2015.07.043
[12] Ochoti, G.N., Maronga, E., Muathe, S., Nyabwanga, R.N. and Ronoh, P.K. (2012) Factors Influencing Employee Performance Appraisal System: A Case of the Ministry of State for Provincial Administration & Internal Security, Kenya. International Journal of Business and Social Science, 3, 37-45.
[13] Bertone, S., Brown, M., Cressey, P., Frizzell, J., Keating, C., Morris, A. and Worland, D. (1998) Developing Effective Consultation Practices: Case Studies of Consultation at Work: Melbourne. South Pacific Publishing, Melbourne, Australia.
[14] Townley, B. (1999) Practical Reason and Performance Appraisal. Journal of Management Studies, 36, 287-306. http://dx.doi.org/10.1111/1467-6486.00137
[15] Armstrong M. and Brown, D. (2005) Reward Strategies and Trends in the United Kingdom: the Land of Diverse and Pragmatic Dreams. Compensations and Benefits Review, 37, 41-53. http://dx.doi.org/10.1177/0886368705277659
[16] Longenecker, C.O. (1997) Why Managerial Performance Appraisals Are Ineffective: Causes and Lessons. Journal of Career Development International, 2, 212-218. http://dx.doi.org/10.1108/13620439710174606
[17] Garavan, T.N., Morley, M. and Flynn, M. (1997) 360-Degree Feedback: Its Role in Em-ployee Development. Journal of Management Development, 16, 134-147. http://dx.doi.org/10.1108/02621719710164300
[18] Cleveland, J.N. and Murphy, K.R. (1992) Analyzing Performance Appraisal as a Goal Di-rected Behavior. Research in Personnel and Human Resources Management, 10, 121-185.
K. D. V. Prasad et al.
292
[19] Greenberg, J. (1993) The Social Side of Fairness: Interpersonal and Informational Classes of Organizational Justice. In: Cropanzano, R., Ed., Justice in the Workplace: Approaching Fairness in Human Resource Management, Lawrence Erlbaum, Hillsdale, 79103.
[20] Boswell, W.R. and Boudreau, J.W. (2000) Employee Satisfaction with Performance Ap-praisals and Appraisers. Human Resource Development Quarterly, 11, 283-299. http://dx.doi.org/10.1002/1532-1096(200023)11:3<283::AID-HRDQ6>3.0.CO;2-3
[21] McDowall, A. and Fletcher, C. (2004) Employee Development: An Organizational Justice Perspective. Journal of Personnel Review, 33, 8-29.
[22] Zakaria, N., Zainal, S., and Nasurdin, A. (2012) Investigating the Role of Human Resource Management Practices on the Performance of SME: A Conceptual Framework. Journal of Global Management, 3, 74-92. http://dx.doi.org/10.1108/00483480410510606
[23] Shrivastava, A. and Purang, P. (2011) Employee Perceptions of Performance Appraisals: A Comparative Study on Indian Banks. The International Journal of Human Resource Man-agement, 22, 632-647. http://dx.doi.org/10.1080/09585192.2011.543639
[24] Yee, C.C. and Chen, Y.Y. (2009) Performance Appraisal System Using Multifactorial Eval-uation Model. World Academy of Science, Engineering and Technology, International Journal of Mathematical, Computational, Physical, Electrical and Computer Engineering, 3, 304-308.
[25] Cronbach, L. (1951) Coefficient Alpha and Internal Structure of Tests. Psychometrika, 16, 297-334. http://dx.doi.org/10.1007/BF02310555
[26] Novick, M.R. and Lewis, C. (1975) Coefficient Alpha and the Reliability of Composite Measurements. Psychometrika, 32, 1-13. http://dx.doi.org/10.1007/BF02289400
[27] Kaiser, H.F. and Michael, W.B. (1974) Domain Validity and Generalisability. Educational and Psychological Measurement, 35, 1-13.
[28] SAS Institute Inc. (2008) SAS/STAT® 9.3 User’s Guide. SAS Institute Inc., Cary.
[29] Gay, L.R., Mills, G.E. and Airasin, P. (2009) Educational Research: Competencies for Anal-ysis and Applications. Merrill Greenwood, Columbus.
[30] Poornima, V. and John Manohar, S. (2015) Performance Appraisal System and Employee Satisfaction among Its Employees in Bangalore. International Journal of Science and Re-search, 4, 1169-1174.
[31] Chee Hong, E.N., Zheng Hao, L., Ramesh, K., Ramendran, C. and Vimala, K. (2012) An Ef-fectiveness of Human Resource Management Practices on Employee Retention in Institute of Higher Learning: A Regression Analysis. International Journal of Business Research and Management, 3, 60-79.
Submit or recommend next manuscript to SCIRP and we will provide best service for you:
Accepting pre-submission inquiries through Email, Facebook, LinkedIn, Twitter, etc. A wide selection of journals (inclusive of 9 subjects, more than 200 journals) Providing 24-hour high-quality service User-friendly online submission system Fair and swift peer-review system Efficient typesetting and proofreading procedure Display of the result of downloads and visits, as well as the number of cited articles Maximum dissemination of your research work
Submit your manuscript at: http://papersubmission.scirp.org/ Or contact [email protected]