Embed Size (px)
Citation preview

EVALUATION OF THE BOND AND TENSILE STRENGTH OF GFRP BARS EXPOSED
TO HARSH ENVIRONMENT
by
Saber Abedi
A Thesis Presented to the Faculty of the American University of Sharjah
College of Engineering in Partial Fulfillment of the Requirements
for the Degree of
Master of Science in Civil Engineering
Sharjah, United Arab Emirates
January 2014

© 2014 Saber Abedi. All rights reserved.

Approval Signatures We, the undersigned, approve the Master’s Thesis of Saber Abedi. Thesis Title: Evaluation of the Bond and Tensile Strength of GFRP Bars Exposed to Harsh
Environment
Signature Date of Signature (dd/mm/yyyy) ______________________________ __________________ Dr. Adil K. Al-Tamimi Professor, Department of Civil Engineering Thesis Advisor ______________________________ __________________ Dr. Farid H. Abed Associate Professor, Department of Civil Engineering Thesis Co-Advisor ______________________________ __________________ Dr. Sherif Yehia Associate Professor, Department of Civil Engineering Thesis Co-Advisor ______________________________ __________________ Dr. Mohammad AlHamaydeh Associate Professor, Department of Civil Engineering Thesis Committee Member ______________________________ __________________ Dr. Shivakumar Ranganathan Assistant Professor, Department of Mechanical Engineering Thesis Committee Member ______________________________ __________________ Dr. Aliosman Akan Head, Department of Civil Engineering ______________________________ __________________ Dr. Hany El-Kadi Associate Dean, College of Engineering ______________________________ __________________ Dr. Leland Thomas Blank Dean, College of Engineering ______________________________ __________________ Dr. Khaled Assaleh Director, Graduate Studies

Acknowledgements
I would like to express my gratitude to my thesis supervisors, committee members, family,
and friends, without whom the completion of this research would have never been possible.
Words are not enough to express my feelings to people who helped me to reach what I have
always been dreaming about. First and foremost, I would like to thank my thesis supervisor,
Dr. Adil Al-Tamimi for his supervision, motivation, and guidance throughout the research
program, for believing in my ability to finish this project and guiding me through the right
path to success. I am also grateful to my thesis co-advisors, Drs. Farid H. Abed and Sherif
Yehia for their supportive comments and encouragements. I would also like to acknowledge
Eng. Arshi Faridi and Eng. Mohammad Ansari for their support during the experimental
stage of this research for supervising and controlling the experiment trials. I would like to
thank Conmix, BASF, and Pultron companies, for providing us with concrete, epoxy, and
GFRP bars to conduct the experiments. Many thanks also go to my parents for their love and
support. They truly helped me to see myself achieving my goals. Finally, I would like to
acknowledge my true friends, Sina Shabani, Shahin Dehbashi and Amin Bigdeli for their
honest feedback and encouragement to finish this research during the entire Master’s
program.

Dedicated to my parents, without whom none of my success would be possible

6
Abstract
Fiber-reinforced polymers (FRP) have become one of the fastest-emerging materials to
compete with conventional steel bars for use in concrete. The mechanical properties and
durability of FRP materials are the main concerns that require attention. Different
characteristics of FRP should be considered when estimating the service life of these
polymers because they are relatively new materials in the Middle East region. By knowing
the reduction in the mechanical properties of FRP bars, the durability of the bars can be
predicted using data from short-term evaluation. In this thesis, the bond and tensile strength
of the bars are examined before and after exposure to various conditions in order to reveal
possible deterioration. The emphasis of this research is mainly on the evaluation of glass
fiber-reinforced polymer (GFRP) bars exposed to harsh environmental conditions such as the
splash zones that simulate seawater immersion, high temperatures combined with high
moisture, and high alkalinity. Short-term behavior of GFRP bars can be established by
comparing conditioned specimens vs. unconditioned specimens. The Arrhenius equation is
used to find the long-term behavior of the GFRP materials. In this study, GFRP bars were
kept in different environments for three different intervals: 30, 60, and 90 days. Uniaxial and
pullout tests were conducted after each exposure to measure the tensile and bond strength.
The alkaline solution was the most damaging environment for the bond strength of GFRP
bars with a 33.6% reduction. Tensile strength was most affected by the seawater simulation
environment, which caused a 13.31% reduction. Arrhenius modeling showed that a GFRP bar
required 61 days to reach 90% of its initial bond strength, and 8.5 years to reach 70% of its
initial tensile strength when the bar was exposed to high temperature.
Search Terms: GFRP, Bond, Tensile, Harsh environment, Arrhenius equation

7
Table of Contents
Abstract ...................................................................................................................................... 6
List of Figures ............................................................................................................................ 9
List of Tables ........................................................................................................................... 12
Chapter 1: Introduction ............................................................................................................ 13
1.1. Background ............................................................................................................... 13
1.2. Research Objectives .................................................................................................. 15
Chapter 2: Literature Review ................................................................................................... 16
2.1. Bond Strength ............................................................................................................ 16
2.2. Tensile Strength......................................................................................................... 22
Chapter 3: Material and Environment Preparations ................................................................. 26
3.1. Concrete Wooden Forms ........................................................................................... 26
3.2. GFRP Bars................................................................................................................. 26
3.3. Splash Zone Exposure ............................................................................................... 27
3.4. Alkaline Solution Exposure ...................................................................................... 27
3.5. High Temperature and Humidity Exposure .............................................................. 28
Chapter 4: Research Methodology........................................................................................... 30
4.1. Characteristics of the Materials ................................................................................. 30
4.1.1. Concrete ............................................................................................................. 30
4.1.2. GFRP.................................................................................................................. 31
4.1.3. Epoxy ................................................................................................................. 32
4.2. Pullout Test ............................................................................................................... 33
4.3. Tensile Test ............................................................................................................... 37
Chapter 5: Results and Discussion ........................................................................................... 40
5.1. Pullout Test ............................................................................................................... 40
5.2. Tensile Test ............................................................................................................... 45
5.3. Arrhenius Modeling .................................................................................................. 50
8
Chapter 6: Conclusions and Recommendations ...................................................................... 56
6.1. Conclusions ............................................................................................................... 56
6.2. Recommendations ..................................................................................................... 57
References ................................................................................................................................ 58
Appendix .................................................................................................................................. 61
A. Temperature and Humidity ............................................................................................... 61
B. Pullout Test Graphs .......................................................................................................... 64
Vita ........................................................................................................................................... 74

9
List of Figures
Figure 2.1: Bond-Strength Evolution of Conditioned GFRP Bars at 23 oC, 40 oC, and 50 oC [11] ......................................................................................................................... 19
Figure 2.2: Types of GFRP Bars Used in the Experiment [12] ............................................... 20
Figure 3.1: Samples of Cubical Wooden Forms Prepared for the Pullout Test ....................... 26
Figure 3.2: GFRP Bars before Exposure ................................................................................. 26
Figure 3.3: AUS Sustainability Center for Simulating the Splash Zone ................................. 27
Figure 3.4: GFRP Bars Exposed to the Alkaline Environment ............................................... 27
Figure 3.5: Laboratory Grade Sodium Hydroxide Pellets ....................................................... 28
Figure 3.6: Variations in Temperature during the Exposure of Bars ....................................... 28
Figure 3.7: Variations in Humidity during the Exposure of Bars ............................................ 29
Figure 4.1: Concresive 1450i Container .................................................................................. 33
Figure 4.2: Pullout Test Specification [24] .............................................................................. 34
Figure 4.3: Samples of Cubic Wooden Forms Prepared before Casting Concrete .................. 35
Figure 4.4: Samples after Casting ............................................................................................ 35
Figure 4.5: Pullout Test Setup ................................................................................................. 36
Figure 4.6: ASTM D638–10 Standards for Tensile Test [25] ................................................. 37
Figure 4.7: GFRP Bars after Cutting ....................................................................................... 38
Figure 4.8: Steel Grips for Gripping Both Ends of GFRP Bars during the Uniaxial Test....... 38
Figure 4.9: GFRP Bar Tensile Test Setup ............................................................................... 39
Figure 5.1: Complete Pullout Failure....................................................................................... 41
Figure 5.2: Failure of the Concrete Cover ............................................................................... 41
Figure 5.3: Concrete Block Split ............................................................................................. 42
Figure 5.4: Load-Extension Relationship of GFRP Bar Exposed to the Sun after 30 Days.... 42
Figure 5.5: Maximum Load for Each Specimen after the Pullout Test ................................... 43
Figure 5.6: Bond Stress for Each Specimen ............................................................................ 43
Figure 5.7: Percentage Retention of Bond Stress for Different Type of Exposures ................ 44

10
Figure 5.8: Retention of Bond Stress of GFRP Bars Exposed to Sun ..................................... 45
Figure 5.9: GFRP Bar Mode of Failure after a Tensile Test ................................................... 45
Figure 5.10: Stress-Strain Relationship of Unconditioned GFRP ........................................... 47
Figure 5.11: Maximum Tensile Stress for Different Types of Exposures ............................... 48
Figure 5.12: Percentage Retention of Tensile Stress for Different Types of Exposures in Current Study ...................................................................................................... 48
Figure 5.13: Retention of Tensile Strength of GFRP Bars Exposed to Sun Compared to Previous Study .................................................................................................... 49
Figure 5.14: Retention of Tensile Strength of GFRP Bars Exposed to Seawater Solution Compared to Previous Study .............................................................................. 49
Figure 5.15: Retention of Tensile Strength of GFRP Bars Exposed to Alkaline Solution Compared to Previous Study .............................................................................. 50
Figure 5.16: Regression Analysis for Bond Strength .............................................................. 52
Figure 5.17: Regression Analysis for Tensile Strength ........................................................... 52
Figure 5.18: Arrhenius Plots of Bond Strength Degradation ................................................... 53
Figure 5.19: Arrhenius Plots of Tensile Strength Degradation ................................................ 53
Figure 5.20: Long-term Performance of the Bond Strength of GFRP Bars ............................ 54
Figure 5.21: Long-term Performance of the Tensile Strength of GFRP Bars ......................... 54
Figure B.1: Load-Extension Relationship of Unexposed GFRP Bar (Sample 1) .................... 64
Figure B.2: Load-Extension Relationship of Unexposed GFRP Bar (Sample2) ..................... 64
Figure B.3: Load-Extension Relationship of GFRP Bar Exposed to the Sun after 30 Days (Sample 1) ............................................................................................................ 65
Figure B.4: Load-Extension Relationship of GFRP Bar Exposed to the Sun after 30 Days (Sample 2) ............................................................................................................ 65
Figure B.5: Load-Extension Relationship of GFRP Bar Exposed to the Sun after 60 Days (Sample 1) ............................................................................................................ 66
Figure B.6: Load-Extension Relationship of GFRP Bar Exposed to the Sun after 60 Days (Sample 2) ............................................................................................................ 66
Figure B.7: Load-Extension Relationship of GFRP Bar Exposed to the Sun after 90 Days (Sample 1) ............................................................................................................ 67
Figure B.8: Load-Extension Relationship of GFRP Bar Exposed to the Sun after 90 Days (Sample 2) ............................................................................................................ 67

11
Figure B.9: Load-Extension Relationship of GFRP Bar Exposed to the Salt Solution after 30 Days (Sample 1) .............................................................................................. 68
Figure B.10: Load-Extension Relationship of GFRP Bar Exposed to the Salt Solution after 30 Days (Sample 2) ............................................................................................ 68
Figure B.11: Load-Extension Relationship of GFRP Bar Exposed to the Salt Solution after 60 Days (Sample 1) ............................................................................................. 69
Figure B.12: Load-Extension Relationship of GFRP Bar Exposed to the Salt Solution after 60 Days (Sample 2) ............................................................................................. 69
Figure B.13: Load-Extension Relationship of GFRP Bar Exposed to the Salt Solution after 90 Days (Sample 1) ............................................................................................. 70
Figure B.14: Load-Extension Relationship of GFRP Bar Exposed to the Salt Solution after 90 Days (Sample 2) ............................................................................................. 70
Figure B.15: Load-Extension Relationship of GFRP Bar Exposed to the Alkaline Solution after 30 Days (Sample 1) .................................................................................... 71
Figure B.16: Load-Extension Relationship of GFRP Bar Exposed to the Alkaline Solution
after 30 Days (Sample 2) .................................................................................... 71
Figure B.17: Load-Extension Relationship of GFRP Bar Exposed to the Alkaline Soluion after 60 Days (Sample 1) .................................................................................... 72
Figure B.18: Load-Extension Relationship of GFRP bar Exposed to the Alkaline Solution after 60 Days (Sample 2) .................................................................................... 72
Figure B.19: Load-Extension Relationship of GFRP bar Exposed to the Alkaline Solution after 90 Days (Sample 1) .................................................................................... 73
Figure B.20: Load-Extension Relationship of GFRP bar Exposed to the Alkaline Solution
after 90 Days (Sample 2) .................................................................................... 73

12
List of Tables
Table 1.1: Properties of steel and different FRP materials [8] ................................................ 14 Table 2.1: FRP Rod Properties [9] ........................................................................................... 16 Table 2.2: Material Aspects of FRP Specimens [10] ............................................................... 17 Table 2.3: Compositions of Solution 2 to Solution 5 [10] ....................................................... 17 Table 2.4: Characteristics of the GFRP Bars Used in the Study, (Manufacturer’s Data)
[12] ........................................................................................................................ 19 Table 2.5: Bond strength of GFRP Bars Exposed to Different Solutions in Various Studies . 22 Table 2.6: Tensile Strength of GFRP Bars Exposed to Different Solutions in Various
Studies .................................................................................................................... 25 Table 4.1: Concrete Mix Design Specifications (Conmix Company) ..................................... 30 Table 4.2: Concrete Mix Design Detailed Specifications (Conmix Company) ....................... 31 Table 4.3: Mechanical and Physical Properties of GFRP Bar ................................................. 32 Table 4.4: Setting Time of the Concresive 1450i .................................................................... 32 Table 4.5: Number of Specimens and Duration of the Exposure ............................................ 33 Table 5.1: Maximum Load, Bond Strength, and Failure Type of the Specimens after
Pullout Test ............................................................................................................ 40 Table 5.2: Maximum Load and Tensile Strength Capacity for all GFRP Specimens ............. 46 Table 5.3: Service Life Prediction of GFRP Bars for Different Type of Exposures ............... 55 Table A.1: Variation of Temperature and Humidity during the Exposure of GFRP Bars ...... 61

13
1. Chapter 1: Introduction
1.1. Background
Ensuring the durability and sustainability of materials is becoming the most
challenging concern in the construction materials field. During the last two decades,
researchers have found that fiber-reinforced polymers (FRP) can be used in place of
traditional steel bars to reduce the problems associated with corrosion of steel [1]. Other
advantages of FRPs are recognized, such as their ability to sustain a high tensile load (nearly
double that of a steel bar), their flexibility, their ease of use and low environmental impact,
and their light weight (one FRP bar weighs approximately one fourth as much as a steel bar
with the same dimensions [2]). Carbon and glass are the most commonly used FRPs in
today’s structures. However, the low cost of glass FRPs (GFRPs) results in their wider use
compared to carbon FRPs (CFRPs).
The most critical and unclear issue regarding the use of these materials is their
durability under harsh environmental conditions [3]. GFRP reinforcements are mainly used in
bridges and parking garages. Different environments and loading situations can affect the
properties of the GFRP reinforcement and of the concrete itself, especially when the structure
is located in an open area and is subjected to different kinds of exposures [4]. Chlorides and
carbonation, which reduce the alkalinity of concrete, do not affect the durability of GFRP
bars; however, field conditions have a significant effect on concrete durability [5].
Occasionally, the strength of reinforcing bars is reduced even before they are used in
construction.
Different criteria may affect these bars, such as the storage environment or a high pH
during the casting of concrete. The pH of fresh concrete is approximately 12.6 due to the
presence of calcium hydroxide, Ca(OH)2, which forms during the hydration of cement.
Dissolution of the calcium hydroxide creates hydroxyl ions in the pore water, which give
concrete its high pH. Calcium hydroxide can undergo a reaction with carbon dioxide from the
atmosphere to produce calcium carbonate (CaCO3). This conversion of calcium hydroxide to
calcium carbonate influences the surrounding fluid pH, which falls to about 8.3.
GFRP bars are anisotropic materials, with the longitudinal axis being the strongest.
The diameter of the bar is important because an increase in the bar diameter will result in a

14
decrease in tensile strength [6]. Different types of glass fibers are also available commercially
for structural uses, such as E-glass, S-glass, C-glass, and AR-glass. E-glass is used in
structures because of its high modulus and high electrical and acid resistance. S-glass,
however, has higher stiffness compared to E-glass, but costs more, making it less competitive
than E-glass. C-glass, on the other hand, is used for its chemical stability in harsh
environments, while AR-glass is mainly used in alkaline environments that negatively affect
the strength of the other types of glass fibers. Among all the available types of glass fibers, E-
glass is the most effective and economical type for use in structures.
One of the most common uses of GFRP bars is in bridge decks, where they are an
effective alternative to steel bars. They are lighter than steel, which makes their transportation
easier and more economical. Moreover, the dead load on the bridge structure is reduced due
to the lightweight nature of the glass fibers [7]. Table 1.1 shows a comparison of the
properties of steel and other FRP materials.
Table 1.1: Properties of steel and different FRP materials [7]
Steel GFRP CFRP AFRP
Nominal yield
stress, ksi (MPa)
40 to 75
(276 to 517) N/A N/A N/A
Tensile strength,
ksi (MPa)
70 to 100
(483 to 690)
70 to 230
(483 to 1600)
87 to 535
(600 to 3690)
250 to 368
(1720 to 2540)
Elastic modulus,
x 103 ksi (GPa)
29
(200)
5.1 to 7.4
(35 to 51)
15.9 to 84
(120 to 580)
6 to 18.2
(41 to 125)
Yield strain, % 0.14 to 0.25 N/A N/A N/A
Rupture strain, % 6 to 12 1.2 to 3.1 0.5 to 1.7 1.9 to 4.4
The Middle East, and especially the United Arab Emirates, is known for its high
temperatures (around 50 oC) and harsh environment, including high humidity during the
summer. The use of FRP materials instead of steel reinforcements has many advantages
under these conditions. For instance, FRPs have higher strength, higher corrosion resistance,

15
and a higher strength-to-weight ratio. The lower cost of E-glass FRP compared to other FRP
materials makes it a popular reinforcement for concrete. Studying the strength and durability
of GFRP materials under the harsh environment found in the Middle East is therefore very
important.
1.2. Research Objectives
The main research objectives of this thesis are to:
Evaluate the GFRP performance after exposure to a harsh environment (high
temperature, cycles of seawater splash zone, and high alkalinity) by testing the bond
and tensile strengths.
Predict the long-term performance of GFRP bars using Arrhenius modeling.

16
2. Chapter 2: Literature Review
2.1. Bond Strength
Micelli and Nanni [8] tested the mechanical and physical properties of different FRP
materials to observe the causes of damage and strength retention. Five types of FRP bars
were exposed to alkaline conditions at high temperature. The specimens were also tested
under a combination of temperature cycles, high moisture, and ultraviolet radiation.
Properties of the FRP samples used in this study are summarized in Table 2.1.
Table 2.1: FRP Rod Properties [8]
Rod Fibers Matrix Diameter (mm)
C1 Carbon Epoxy/vinyl ester 8.26
C2 Carbon Epoxy/vinyl ester 8.00
C3 Carbon Epoxy 7.94
G1 (prototype) Glass E Thermoplastic 12.00
G2 Glass E Polyester 6.35
The time and temperature exposures were: 21 days at 60 oC for exposure 1; 42 days at
60 oC for exposure 2; and, 42 days at 22 oC for exposure 3. The G1 rods had a tensile strength
of 924 MPa with a modulus of around 42.6 GPa. The G2 rods showed lower values for their
mechanical properties due to their lower fiber content, which made their tensile strength only
326 MPa with a modulus of 30 GPa. The other three rod types were made of carbon fibers.
These rods had a high tensile strength, but C3 had a lower tensile strength compared to the
other two CFRP rods, which had a tensile strength of 1013 MPa and modulus of 108 GPa.
The ultimate strength decreased noticeably in the G2 rods due to a lower resin. A
reduction of 30% was recorded after exposure 1, and 40% after exposure 2. A comparison of
the FRP rods made of glass fibers indicated that the thermoplastic resin was better than the
polyester resin. The polyester resin was not recommended for the construction industry
because it was negatively affected by alkali ion penetration as well.
The research program designed to evaluate the durability performance of FRP
reinforcing bars for concrete structures has included the use of accelerated aging tests. Table
2.2 shows lists of materials investigated. GFRP and CFRP bars embedded in concrete were

17
exposed to five different solutions: water, two types of simulated alkaline pore solutions of
normal and high performance concrete, saline solution, and an alkaline solution containing
chloride ions, as summarized in Table 2.3 [9]. The aging process was accelerated by wetting
and drying cycles, as well as freezing and thawing cycles.
Table 2.2: Material Aspects of FRP Specimens [9]
Bar type Fiber type Resin type Bar size Nominal
diameter
Brand
name
GFRP1 E-glass Vinyl ester #3 and #4 9.53 and 12.70 Aslan
100
GFRP2 E2-glass Vinyl ester #3 9.53 N/A
CFRP Carbon Epoxy #3 9.53 Aslan
200
Table 2.3: Compositions of Solution 2 to Solution 5 [9]
Solution
no.
Quantity in g/L (mol/L)
NaOH KOH Ca(OH)2 NaCl Na2SO4
Solution 1 Water only
Solution 2 2.4 (0.06) 19.6 (0.35) 2 (0.027) - -
Solution 3 0.6 (0.015) 1.4 (0.025) 0.037 (0.005) - -
Solution 4 - - - 30 5
Solution 5 - 5.6 (0.1) - 71.66 (1.23) -
Two types of concrete mixes were used. The first type was normal weight concrete
with strength of 20 MPa, and the second was high performance concrete with a strength of 65
MPa. Pullout tests were conducted to find the effects of exposure on the durability of bond
strength between the FRP bars and concrete. Solution 2 was the most damaging environment
for the FRP bars. Solution 3 was the next most aggressive, followed by 1 (Water) and then 4.
Increasing the temperature of the solutions reduced the strength of the bars. Overall, GFRP
bars showed a significant strength loss due to exposure, whereas the strength of CFRP bars
did not change significantly; consequently, CFRPs are viewed as more durable than GFRPs
under the conditions tested. Continuous immersion of the GFRP bars caused greater strength
loss. GFRP2 had higher tensile strength, despite the similarity of its matrix and

18
manufacturing process to those of GFRP1. This observation indicated that the glass fiber
matrix interphase was the cause of reduced durability. The bond strength of FRP bars was
also dependent on the type of concrete. Due to its low bond capacity, low performance
concrete would split before complete pullout; therefore, the use of high performance concrete
with a larger concrete specimen could help to reduce the splitting before pullout.
Robert and Benmokrane [10] studied the durability of the bond between GFRP bars
and concrete. They investigated the effect of aging on bonds at different temperatures, and
chose GFRP because it is noncorrosive and nonconductive, lightweight, and can provide high
strength. The long-term performance of GFRP is very important under special conditions
such as highly alkaline environments and high temperatures. The difference in bond strength
before and after exposure was considered to be a measure of the durability of the bond
between the GFRP bars and concrete. The GFRP bars were embedded in concrete and tested
in tap water at 23 oC, 40 oC, and 50 oC.
This previous study used sand-coated GFRP bars with a nominal diameter of 12.7
mm. The 28-day compressive strengths of concrete were between 55 to 62 MPa. A single
GFRP bar was embedded along the central axis of the concrete cube, and the bar’s bonded
length was five times that of the bar diameter. All specimens were cast and kept at saturated
humidity for 40 days, and then immersed in tap water at 23 oC for 180 days for initial
conditioning. Samples were then exposed to three different temperatures for three different
durations (60, 120, and 180 days). Elongation of the bars was recorded during the pullout test
using LVDT. The load was applied on the GFRP bar at a rate of 20 kN/min. All the
specimens tested under pullout tests failed by slipping through the free-end, and no yielding
occurred because of the brittleness of the GFRP material. The bar core pulled out, and bond
failure occurred at the interface of the concrete and sand coating or at the interface of the
sand coating and the bar. Failure occurred at those sites because of the concrete’s high shear
strength. Microstructural examination showed no significant interface failure after
conditioning of 180 days in 23 oC and 50 oC tap water. The bond strength of GFRP bars
therefore appeared to decrease as the duration of immersion increased; however, increasing
the temperature up to 50 oC had no major effect on the bond strength. The values of the bond
strength retentions were 94%, 93%, and 92% for immersion in tap water at temperatures of
23, 40, and 50 oC, respectively, after 180 days of exposure. Figure 2.1 shows that the
reduction in bond strength is negligible when the temperature is increased to 50 oC.

19
Figure 2.1: Bond-Strength Evolution of Conditioned GFRP Bars at 23 oC, 40 oC, and 50 oC [10]
The effects of temperature and environment on the properties of glass fiber bars have
also been examined [11]. The effect of water and alkaline environments on the bond strength
was tested under different temperatures ranging from 20 oC to 120 oC. Table 2.4 and Figure
2.4 show the characteristics of the different bars used in this experiment.
Table 2.4: Characteristics of the GFRP Bars Used in the Study, (Manufacturer’s Data) [11]
GFRP rod Diameter (mm) Shape Tensile Strength
(MPa)
Elastic modulus
(MPa)
G1 12.7 Round 655 40,800
G2 12.7 Round 655 40,800
G3 12.7 Round 800 42,000
The G1 rod has a unidirectional E-glass fiber core with a high-grade polyester resin
and sand coating. The G2 was similar to the G1 except that it had a matrix of vinyl ester
resin. The G3 bar was made from a continuous E-glass fiber with a matrix of urethane-
modified vinyl ester.

20
Figure 2.2: Types of GFRP Bars Used in the Experiment [11]
A pullout test was carried out to find the bond strength between the concrete and
rebar. Displacement of the machine was controlled at 1 mm/min and different temperatures
were examined by using thermocouples at the center of the rod. The effects of environmental
exposure to an alkaline situation were tested by immersing the specimens in a liquid
containing 1 mol/l NaOH, pH 13. Penetration of the liquid from both ends of the samples was
prevented by coating the specimens in an epoxy resin. The bond strength of the bars
increased with time; which may reflect an increase in concrete strength over time. Continuing
the curing process may lead to a major increase in concrete strength for periods up to a few
years [12]. However, the properties of the bars deteriorated when exposed to high
temperatures and alkaline environments. Another conclusion from this experiment was that
the rate of degradation of the rebar was directly proportional to the nature of the resin matrix.
Zhou et al. [13] used accelerated aging methods to study the long-term bond
performance of GFRP bars embedded in concrete to their nearest real value. They chose 120
specimens for bond testing because de-bonding is the most critical mode of failure and
weakens the structure. In their experiment, pullout tests were carried out because of their
simplicity in determining bond strength. They used GFRP-ribbed bars, with a nominal
diameter of 17 mm, made of 28% thermosetting polyester resin and 72% type E glass fibers.
The temperature was controlled at 20 oC, and the specimens were tested after 30, 45, 60, and
75 days. The following five different environments were chosen to simulate the real
conditions.
(1) Tap water (H2O), with high humidity;

21
(2) Chloride (HCl) + sulfate (H2SO4), pH 2;
(3) Chloride (HCl) + sulfate (H2SO4), pH 3;
(4) Chloride (HCl) + sulfate (H2SO4) with a pH 4;
(5) Specimens open to an indoor natural environment as a control condition.
The maximum bond strength loss occurred after 75 days under the combined exposure
to Chloride and Sulfate at pH 2. The researchers concluded that strength of GFRP at pH 2
should be used as a reference in Arrhenius equation because it is the most critical type of
environment out of the 5 types in the experiment. The average pH value of acid rain in their
region is 5.6. The time to reach a given bond strength retention at different pH values can be
approximately calculated by combining results for different environments and plotting bond
strength retention vs. the logarithm of time. Arrhenius and time shift factor equations showed
that GFRP bars held at pH 5.6 for 232 days responded similarly to being placed in outdoor
conditions for 34 years. This means that in places with acid rain, the GFRP embedded in the
concrete will lose bond strength quickly. Knowing the durability and bond strength of GFRPs
after several years is very important because de-bonding causes structures to fail earlier than
expected.
Masmoudi et al. [14] used eighty specimens to study the effect of long-term bond
performance of GFRP bars under different temperatures (20, 40, 60, and 80 oC). Pullout bond
testing was performed on specimens that had a 500 mm long GFRP bar embedded vertically
in 150x150x150 mm and 180x180x180 mm concrete cubes, for 8 and 16 mm bar diameters,
respectively. After the thermal treatment (40, 60, and 80 oC) for 4 and 8 months, pullout tests
were performed at a displacement rate of 1.2 mm/min. Four LVDTs, with accuracy equal to
0.001 mm, were also attached for each pullout test [14]. The GFRP bars experienced minimal
bond strength reduction after 4 and 8 months of exposure at temperatures up to 60 oC. In
addition, no major damage was observed on the interface between the GFRP bars and the
concrete after 240 days of thermal loading in a dry environment. However, the bond strength
decreased as the diameter increased.
Table 2.5 shows a summary of the bond strength of GFRP bars exposed to different
solutions for different periods, as presented in various studies.

22
Table 2.5: Bond strength of GFRP Bars Exposed to Different Solutions in Various Studies
Reference Matrix
material
Diameter
(mm) Exposure type Temperature Exposure days
Strength loss
(%)
Robert
and Nanni
[10]
Sand
coated 12.7 Water
23 60, 120, 180 0, 4, 6
40 60, 120, 180 1, 5, 7
50 60, 120, 180 2, 6, 8
Abbasi
and Hogg
[11]
E-glass 12.7
Water 60 30, 120, 240 6, 7, 9
Alkaline (pH 12.5) 39 30, 120, 240 7, 14, 12
Zhou et
al. [5]
E-glass
Polyester 16
Alkaline (pH 2) - 30, 45, 60, 75 10, 18, 17, 22
Alkaline (pH 3) - 30, 45, 60, 75 9, 10, 14, 16
Alkaline (pH 4) - 30, 45, 60, 75 6, 4, 12, 14
Masmoudi
et al. [14] E-glass 16 High Temperature
40 120 2.2
60 120 3.5
80 120 4.2
2.2. Tensile Strength
Kim et al. [15] studied the short-term durability of GFRP rods exposed to different
environments, including moisture, chloride, alkali with high pH, and freeze-thaw cycling for
different periods of time. E-glass/vinyl ester rods 12.7 mm in diameter were used for a tensile
test. The impact of harsh environments on the GFRP bars was evaluated by comparing the
tensile strength of the exposed bars to that of unconditioned bars. Tap water was used to
simulate high moisture. NaCl solution was used to simulate the chloride environment or
seawater salinity. KOH, NaOH, and Ca(OH)2 solutions were used to create alkaline
conditions at pH 12.7. Samples were kept in a long galvanized steel tube 50 mm in diameter
that was filled with each simulation solution. The tensile strength was reduced in all
environments as exposure time increased. The alkali attack damaged the bars more than the
other cases; this could be due to a weak interface between the fiber and the matrix.
Porter and Barnes [16] conducted an accelerated test on three different types of GFRP
bars in alkaline solutions with high pH at a high temperature of 60 oC for 19-81 days. All bars
had a diameter of 9.4 mm and were made of different E-glass resins. Their tensile tests
indicated a 29-66% loss in strength. High tensile loss occurred due to the resins used to form
the GFRP bars.
Gaona [17] also examined the durability of GFRP bars exposed to alkaline solution.
The GFRP rebar was type E-glass/vinyl ester matrix with a diameter of 16 mm. The
temperature was 35 degrees—that is, close to concrete temperature while hardening. Bars

23
were exposed to a high pH for 350 days and showed a tensile reduction of 23%. However, the
elastic modulus of the bars increased by 9% over the 50-week conditioning.
Chu et al. [18] studied the effects of alkalinity on the tensile properties of E-
glass/vinyl ester composite strips. Specimens were placed into deionized water or alkaline
solution at different temperatures (23, 40, 60, and 80 oC) for 18 months. Bars were immersed
in alkaline solutions formed by mixing 10.89 g/l of CaCO3 and 5.95 g/l of Ca(OH)2 to
provide a pH of 11.5, and to simulate concrete pore water. The tensile strength losses were
between 35% and 72% of the initial strength.
Al-Zahrani [19] studied the effects of harsh environments on the tensile strength of
GFRP bars with different matrix resins. All GFRP bars were type E glass and the resin
materials were vinyl ester, modified vinyl ester, and polyurethane. Samples were tested in
four aggressive solutions (alkaline, alkaline + seawater, alkaline + sea salt, and acidic) at
three different temperatures (60 oC, 24-hour thermal variations of 22 oC and 60 oC, and
outdoors) for 3, 6, 9, and 12 months. The tensile test showed the highest percentage reduction
for the three types of GFRP bars with exposure to alkaline + sea salt treatment at 60 oC. The
GFRP bar with polyurethane was less affected compared to the other types of GFRP bars.
The residual tensile strength of GFRP bare bars has also been examined after
subjecting the bars to different environmental conditions for 6 months [20]. The different
environments were tap water, seawater, and alkaline solution at different temperatures (23,
35, 50, and 65 oC). The GFRP bars were E-glass type with three layers of urethane-modified
vinyl ester that contained 70% fibers. The bars had a diameter of 9.5 mm and a tensile
strength of 756 MPa. The reduction in the tensile strength after 6 months was 2.7%, 12%, and
13.7% in the water, seawater, and alkaline solution, respectively.
In North America, bridge deck slabs are exposed to severe environmental conditions
such as freeze-thaw action or traffic fatigue loads. The use of GFRP reinforced bars is
reasonable; nevertheless, their durability needs more research because information is not
documented well in this category. Alves et al. [4] examined the effect of different harsh
environments on the bond strength of GFRP bars reinforced in concrete. A total of 36
specimens were tested in a pullout test to investigate the bond strength between the GFRP
bars and concrete. To do this test, the specimens were cut in half. The concrete used for this

24
study was normal concrete with a compressive strength of 50MPa. Different modes of
failure were observed in this study:
Pure pullout failure, where the bar was pulled out of the specimen without cracks or
splits.
Concrete cover failure, where a small crack appeared in the cover and went through
the whole block.
Diagonal failure, which might have occurred because the concrete was not
homogeneous.
The fatigue load due to cyclic load caused around 50% of the loss of bonding. Thus,
the use of large concrete covers is beneficial when the GFRP bar has a large diameter.
The manufacture of nano-GFRP bars is a recent development. These bars are
produced by a pultrusion method like normal GFRP bars; however, during pultrusion, nano
materials like silica (SiO2), alumina (Al2O3), and silicon nitride (Si3N4) are added to the vinyl
ester resin at 1, 3, and 5 percent of the weight. The tensile strength of these new materials is
higher than that of normal bars following exposure to alkaline solutions [21]. Table 2.6 shows
a summary of the tensile strengths of GFRP bars exposed to different solutions for different
durations, as presented in various studies.
The use of high performance concrete is recommended for bond strength because
normal weight concrete has low bond capacity that leads to splitting before complete pullout
[9]. Therefore, a concrete with 50MPa compressive strength is used in the current study.
Different studies show that a GFRP bar containing vinyl ester resin is better than one
containing a thermoplastic or polyester resin [8,11]. Therefore, the GFRP bars selected for
the current study contained vinyl ester resin. The bond and tensile strength reductions were
also expected to be less for bars exposed to high temperature than for bars exposed to alkaline
conditions.
In the current study, GFRP bars were directly exposed to harsh environments, unlike
the cases in the previous studies where bars were either embedded in concrete for pullout
tests or covered by cement mortar for tensile tests. Kim et al. [15] also exposed GFRP bars
directly to harsh environments prior to a tensile test. This scenario, where bars are directly
exposed, can happen in real life applications; for example, when bars are in storage before
delivery to the construction site or when bars are delivered to the site and the project is

25
delayed for some reason. Table 2.6 shows the tensile strength of GFRP bars exposed to
different solutions for different periods of time in various studies.
Table 2.6: Tensile Strength of GFRP Bars Exposed to Different Solutions in Various Studies
Reference Matrix glass
material Bar diameter
(mm) Conditioning
solution Temperature
Exposure period (days)
Tensile loss (%)
Kim et al [15]
E-glass/vinyl ester 12.7
Water 25, 40, 80 132 11, 16, 22
Sea water 25, 40, 80 132 14, 13, 19
Alkaline (pH 13) 25, 40, 80 60 32, 30, 40
Porter & Barnes
[16] E-glass/IP, BV 9.4 Alkaline 60 19-81 29-66
Gaona [17] E-glass/vinyl ester 16 Alkaline (pH 12) 35 350 23
Chu et al. [18]
E-glass/vinyl ester Strip:0.063x
15.24
Deionized water 23, 40, 60, 80 525
35, 49, 63, 72
Alkaline 42, 47, 61, 62
Al-Zahrani [19]
E-glass/modified vinyl ester
12
Alkaline (pH 13.5) 60
360
77
Alkaline + sea water 60 58
Alkaline + Sabkha 60 49
Thermal variation 20 to 60 5
Outdoor Varied 6
Al-Zahrani [19]
E-glass/vinyl ester 12
Alkaline (pH 13.5)
60 360
71
Alkaline + sea water 77
Alkaline + Sabkha 66
Al-Zahrani [19]
E-glass polyurethane
12
Alkaline (pH 13.5) 60
360
21
Alkaline + sea water 60 19
Alkaline + sea salt 60 27
Thermal variation 22-60 15
Outdoors Varied 21
Alsayed et al. [20]
E-glass/urethane Modified vinyl
ester 9.5
Water
50 180
2.7
Sea water 12
Alkali solution 13.7
Chen et al. [22]
E-glass/vinyl ester 9.5
Water
20, 40, 60
120 for 20 5, 3, 29
Alkaline (pH 13.6) 14, 11, 36
Alkaline (pH 12.7) 70 for 40 and 60
8, 8, 27
Sea water 3, 2, 26
Chen et al. [22]
E2-glass/vinyl ester 9.5 Alkaline (pH 13.6) 40, 60 60 31, 48
20 120 45

26
3. Chapter 3: Material and Environment Preparations
3.1. Concrete Wooden Forms
A total of 20 cubic wooden forms required for the pullout tests were manufactured to
test the bond strength of GFRP bars embedded in concrete. Each side of a cube form was 200
mm thick, with a small 16 mm diameter hole cut into the bottom center at a depth of 10 mm.
Figure 3.1 shows samples of the prepared wooden forms before casting the concrete.
Figure 3.1: Samples of Cubical Wooden Forms Prepared for the Pullout Test
3.2. GFRP Bars
A total length of 30 meters of GFRP bars was used for both the pullout and tensile
tests: 20 meters of 16mm diameter bar for the pullout test, and 10 meters of 12 mm diameter
for the tensile test. The maximum length of the GFRP bars for each sample was 1 meter;
therefore, to simplify the exposure, each bar was cut to 1 meter length before being put into
different exposure environments. The bars were coated with an epoxy resin on both ends to
prevent penetration of liquid. Figure 3.2 shows the GFRP bars before exposure.
Figure 3.2: GFRP Bars before Exposure

27
3.3. Splash Zone Exposure
A sustainability center was designed for the project in order to simulate the splash
zone in a harsh environment. Samples were placed in the lower tank containing 4% saline
water. A water pump was used to move the water to the upper tank. Water then returned to
the lower tank via gravity. This environment creates wet/dry cycles of saline water for
samples in the tank, which is more severe than simply exposing the bars to saline solution
without wet/dry cycles, as was done in previous studies. Figure 3.3 shows the sustainability
center and the bars inside the tank.
Figure 3.3: AUS Sustainability Center for Simulating the Splash Zone
3.4. Alkaline Solution Exposure
Sodium hydroxide (NaOH) is a strong base that is highly soluble in water. Thus,
laboratory sodium hydroxide pellets were used to provide an alkaline environment with a pH
of 13. To reach the desired pH value, 0.1 mole of NaOH was needed per liter of water. Since
NaOH has a molar mass of 40 g/mol, 4 grams of NaOH should be dissolved in 1 liter of water
to obtain pH 13. Figure 3.4 shows the GFRP bars exposed to the alkaline environment, and
Figure 3.5 shows laboratory grade sodium hydroxide pellets.
Figure 3.4: GFRP Bars Exposed to the Alkaline Environment

28
Figure 3.5: Laboratory Grade Sodium Hydroxide Pellets
3.5. High Temperature and Humidity Exposure
The last exposure type was the high temperature and humidity environment. The
GFRP samples were simply placed on the ground next to the sustainability center during the
summer, when the temperature was at its highest. Figures 3.6 and 3.7 show the variations in
temperature and humidity recorded during the GFRP bar exposure, respectively. Daily
temperatures and humidity percentages are presented in Appendix A.
Figure 3.6: Variations in Temperature during the Exposure of Bars
25
30
35
40
45
50
16-May 5-Jun 25-Jun 15-Jul 4-Aug 24-Aug 13-Sep 3-Oct 23-Oct
Tem
pera
ture
(C
)
Date
Outside Temperature
Tank Temperature

29
Figure 3.7: Variations in Humidity during the Exposure of Bars
35
40
45
50
55
60
65
70
75
80
85
16-May 5-Jun 25-Jun 15-Jul 4-Aug 24-Aug 13-Sep 3-Oct 23-Oct
Hu
mid
ity
(%)
Date

30
4. Chapter 4: Research Methodology
4.1. Characteristics of the Materials
4.1.1. Concrete
The concrete mix design used for the pullout samples in this study had a compressive
strength of 50 MPa. The concrete was mixed and cast by a local company, Conmix Company.
The mix design information and details are provided in Tables 4.1-4.2.
Table 4.1: Concrete Mix Design Specifications (Conmix Company)
Concrete Mix Design
Strength Class
Cube Comp. Str.
Max Agg. Size
Cement Qty
Cement Type
Water/Cement
C50
50 MPa @ 28 Days
20 mm
450 (Kg/m3)
OPC
0.38
Aggregate
Source
0/0.6mm
Al Ain
0/5 mm
Siji
0/5 mm
RAK
5/10 mm
Siji
10/20 mm
Siji
Moisture %
Absorption %
Specific Gravity
0.8
0.8
2.6
1.2
1.2
2.7
1.5
1.5
2.6
0.3
0.7
2.9
0.3
0.7
2.9
Percent Mix 13 35 0 18 34

31
Table 4.2: Concrete Mix Design Detailed Specifications (Conmix Company)
Material Volume
(L)
Specific
Gravity
Proportions
(kg/m3)
Absorption
%
Moisture
%
Moisture
correction
(kg/m3)
Final
proportion
(kg/m3)
Cement 145.16 3.1 450 0 0 - 450
GGBS 0 2.9 0 0 0 0 0
Micro
Silica 0 2.2 0 0 0 0 0
Water 171 1 171 0 0 -0.5 171
Washed
Sand 0/5
mm
231.91 2.7 626 1.2 1.2 0 630
Red Dune
sand 0/0.6
mm
86.14 2.6 224 0.8 0.8 0 220
CR Sand
(0/5) mm 0 2.6 0 1.5 1.5 0 0
CR Agg.
10/20 mm 225.28 2.9 662.3 0.7 0.3 -2.6 660
CR. Agg.
5/10 mm 119.27 2.9 350.6 0.7 0.3 -1.4 350
Additive1 6.25 1.21 7.56 0 60 4.5 7.56
Additive2 0 1.20 0 0 60 0 0
Additive3 0 1.20 0 0 60 0 0
Air 15 - - - - - -
1000 2489
4.1.2. GFRP
The mechanical and physical properties of the GFRP bar used in this study are
summarized in Table 4.3.

32
Table 4.3: Mechanical and Physical Properties of GFRP Bar
4.1.3. Epoxy
Finding the best applicable epoxy is one of the critical points for the pullout test
because the GFRP bar should be completely attached to the grip, and slippage should not
occur in the grip between the epoxy and the bar. Concresive 1450i, manufactured by the
BASF Company, was the most suitable epoxy for the pullout test. It contains two components
of advanced pure epoxy in side-by-side cartridges. It is more convenient to use the special
shotgun when applying the epoxy to the desired area, and it helps the contents of the two
cartridges to mix well. Table 4.4 shows the setting time of the epoxy and Figure 4.1 shows a
sample of the Concresive 1450i.
Table 4.4: Setting Time of the Concresive 1450i
Temperature (oC) Working Time (minute) Curing Time (minute)
-5 120 420
0 60 240
5 20 120
20 7 30
30 4 25
40 2 15
Material Property Units Value
Mechanical Properties
Tensile strength MPa 1000
Tensile modulus GPa 54.5
Shear strength (single sided) MPa 260
Shear strength (double sided) MPa 520
Physical properties
Longitudinal coefficient of thermal expansion x 10-6/C 7.2
Transverse coefficient of thermal expansion x 10-6/C 22
Moisture absorption % 0.024
Glass content % Volume 65.4
% Weight 75

33
Figure 4.1: Concresive 1450i Container
Generally, the use of GFRP bars is expected to improve the durability of the structure
compared to normal steel reinforcements because of the resistance to corrosion of the GFRP
bars. However, the properties of the materials can change under high temperatures and highly
alkaline environments, so different tests should be conducted to study the behavior of the
GFRP bars following exposure to harsh environments. Investigating the bond and tensile
strength is the main objective of the present study. Table 4.5 shows numbers of specimens
and the duration of the exposure for the GFRP bars used in the present study.
Table 4.5: Number of Specimens and Duration of the Exposure
Exposure to sun Exposure to splash zone Exposure to alkalinity
2 specimens for 30 days 2 specimens for 30 days 2 specimens for 30 days
2 specimens for 60 days 2 specimens for 60 days 2 specimens for 60 days
2 specimens for 90 days 2 specimens for 90 days 2 specimens for 90 days
4.2. Pullout Test
Bond stress is the strength between the interaction of the rebar surface and the
concrete surface. The pullout procedure is the main test used to find the bond strength with
which the rebar is embedded in the concrete, and a tensile force is applied at a constant rate to
pull the GFRP bar out of the concrete [23].

34
GFRP samples were kept in the specified environment to start the exposure. Wooden
forms for the concrete were prepared as per the test geometry recommended by the ACI
440.3R-04 code [24], also shown in Figure 4.2. The GFRP bars were kept in the different
environments for 30 days, and then two samples were taken from each exposure, as well as
two unconditioned control samples from the lab. A total of 8 wooden forms, and 8 GFRP bars
were taken to Conmix Company to cast the concrete. Specimens were 200 mm concrete
cubes with a single bar embedded vertically along the central axis of the wooden form, as
shown in Figure 4.3. The bar’s bonded length (80 mm) was five times the bar diameter. The
de-bonding tube should be strong enough to allow complete pullout of the bar from the
concrete cube. After testing different materials, Poly Vinyl Chloride (PVC) pipes were
chosen as de-bonding tubes to prevent contact between the bar and the concrete. Figure 4.4
shows the samples after concrete casting by the Conmix Company. This procedure was also
repeated for 60 and 90 day exposures.
Figure 4.2: Pullout Test Specification [24]

35
Figure 4.3: Samples of Cubic Wooden Forms Prepared before Casting Concrete
Figure 4.4: Samples after Casting
36
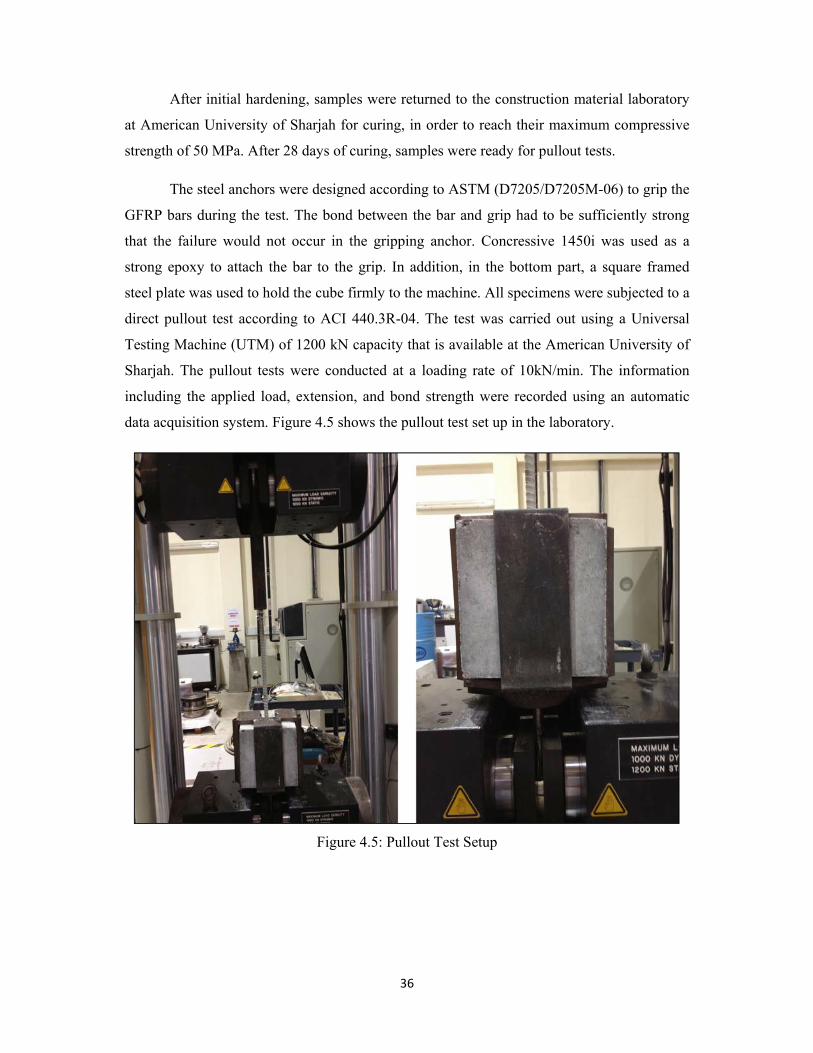
After initial hardening, samples were returned to the construction material laboratory
at American University of Sharjah for curing, in order to reach their maximum compressive
strength of 50 MPa. After 28 days of curing, samples were ready for pullout tests.
The steel anchors were designed according to ASTM (D7205/D7205M-06) to grip the
GFRP bars during the test. The bond between the bar and grip had to be sufficiently strong
that the failure would not occur in the gripping anchor. Concressive 1450i was used as a
strong epoxy to attach the bar to the grip. In addition, in the bottom part, a square framed
steel plate was used to hold the cube firmly to the machine. All specimens were subjected to a
direct pullout test according to ACI 440.3R-04. The test was carried out using a Universal
Testing Machine (UTM) of 1200 kN capacity that is available at the American University of
Sharjah. The pullout tests were conducted at a loading rate of 10kN/min. The information
including the applied load, extension, and bond strength were recorded using an automatic
data acquisition system. Figure 4.5 shows the pullout test set up in the laboratory.
Figure 4.5: Pullout Test Setup

37
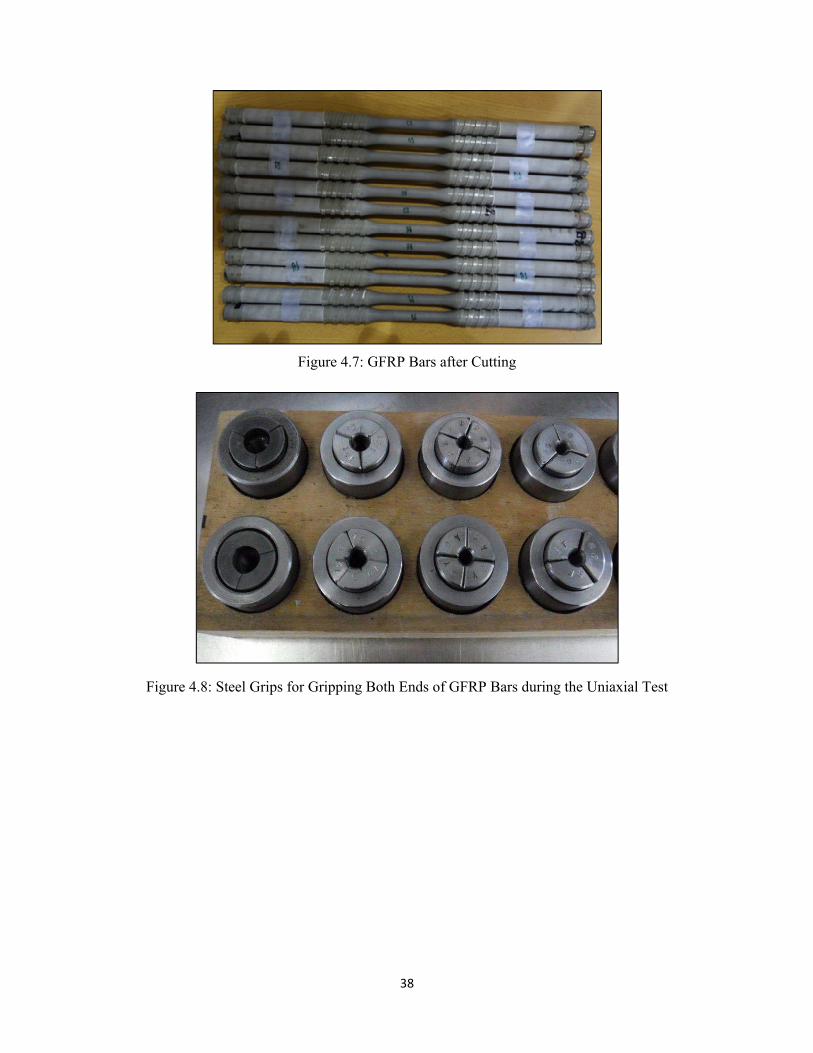
4.3. Tensile Test
The tensile test suggested by the ASTM D638–10 [25], with the geometry shown in
Figure 4.6, was utilized in this study to evaluate the tensile strength of GFRP bars. After each
time period, two samples were collected from each type of exposure and the bars were
prepared and cut for the uniaxial tensile test. Figure 4.7 shows samples of the GFRP bar
specimens used for the uniaxial test. The test was carried out using a Universal Testing
Machine. Special steel grips, as shown in Figure 4.8, were needed to grip both ends of the
GFRP bars during the test in order to prevent slippage of the bars prior to failure. Figure 4.9
shows the tensile test setup using the UTM.
Figure 4.6: ASTM D638–10 Standards for Tensile Test [25]
38
Figure 4.7: GFRP Bars after Cutting
Figure 4.8: Steel Grips for Gripping Both Ends of GFRP Bars during the Uniaxial Test

39
Figure 4.9: GFRP Bar Tensile Test Setup

40
5. Chapter 5: Results and Discussion
5.1. Pullout Test
Table 5.1 shows the maximum load for each pullout specimen and its failure mode.
The bond strength was calculated using the typical shear equation [11]:
T = P/A (5.1)
where T is the bond strength, P is the maximum load, and A is the circumferential area of the
embedded bar = (The bar’s bonded length) x (circumference) = (5db) x (πdb) = 5πdb2.
Table 5.1: Maximum Load, Bond Strength, and Failure Type of the Specimens after Pullout
Test
Sample Maximum Load
(kN)
Bond Strength
(MPa) Type of Failure
Lab-1 85.0 21.1 Bar pull out
Lab-2 85.4 21.2 Bar pull out
Sun 30-1 79.3 19.7 Bar pull out + Concrete Block Split
Sun 30-2 83.0 20.6 Bar pull out
Sun 60-2 78.0 19.4 Bar pull out
Sun 60-2 79.8 19.8 Bar pull out + Concrete Cover Failure
Sun 90-1 71.1 17.7 Bar pull out
Sun 90-2 73.8 18.3 Bar pull out + Concrete Cover Failure
Salt 30-1 75.8 18.9 Bar pull out
Salt 30-2 77.9 19.4 Bar pull out + Concrete Cover Failure
Salt 60-1 71.6 17.8 Bar pull out
Salt 60-2 71.9 17.9 Bar pull out
Salt 90-1 68.1 17.0 Bar pull out
Salt 90-2 69.3 17.2 Bar pull out
Alkaline 30-1 70.5 17.5 Bar pull out
Alkaline 30-2 70.6 17.6 Bar pull out + Concrete Block Split
Alkaline 60-1 60.1 15.0 Bar pull out
Alkaline 60-2 60.6 15.1 Bar pull out + Concrete Cover Failure
Alkaline 90-1 50.9 12.7 Bar pull out
Alkaline 90-2 62.3 15.5 Bar pull out + Concrete Cover Failure

41
All the pullout specimens failed by slipping through the free end. Three failure modes
were mainly observed during the pullout tests of the GFRP bars with concrete. The first mode
was a complete pullout failure, where the bar was pulled out of the concrete specimen
without any splitting or cracking along the concrete surfaces, as shown in Figure 5.1. The
second failure mode was controlled by the failure of the concrete cover, where cracks
developed along the concrete surface, as shown in Figure 5.2. On the other hand, a concrete
block split was observed as a third type of failure mode, as shown in Figure 5.3. The third
failure mode was observed in two samples only: one exposed to sun and the other was
exposed to alkaline conditions, both for 30 days of exposure.
Figure 5.1: Complete Pullout Failure
Figure 5.2: Failure of the Concrete Cover

42
Figure 5.3: Concrete Block Split
Figure 5.4 shows one example of the load-extension relationship of the GFRP bar
during the pullout test. After reaching its maximum load, the load drops to zero immediately.
The loads vs. extension graphs for all other samples are presented in Appendix B.
Figure 5.4: Load-Extension Relationship of GFRP Bar Exposed to the Sun after 30 Days
The GFRP bars were directly exposed to solutions known to significantly accelerate
aging in order to predict their long-term durability. Figure 5.5 and Figure 5.6 show bar charts
of the maximum load and bond strength, respectively, of each specimen in the pullout test. A
variation in the effects of each exposure can be clearly seen. High temperature and humidity
had the lowest effect on the bars compared to the other two exposures. The bond strength of
the GFRP bars that were kept in splash zone exposure had slightly lower values than those
kept in the hot and humid exposure. However, the alkalinity effect on the bond strength of
0
10
20
30
40
50
60
70
80
90
0 1 2 3 4 5 6 7 8
Bon
d t
est
load
(k
N)
Extension (mm)

43
GFRP bar was greater than that seen with the other exposures, as the bond strength was
significantly lower.
Figure 5.5: Maximum Load for Each Specimen after the Pullout Test
Figure 5.6: Bond Stress for Each Specimen
0
10
20
30
40
50
60
70
80
90B
ond
tes
t lo
ad (
kN
)
Sample
0
5
10
15
20
25
Bon
d S
tres
s (M
Pa)
Sample

44
Figure 5.7 shows the percentage retention for the three different exposures. The
alkaline environment clearly has the greatest effect on the GFRP bars. The specimens
exposed to the high temperature and humidity showed a high reduction after 90 days of
exposure.
Figure 5.7: Percentage Retention of Bond Stress for Different Type of Exposures
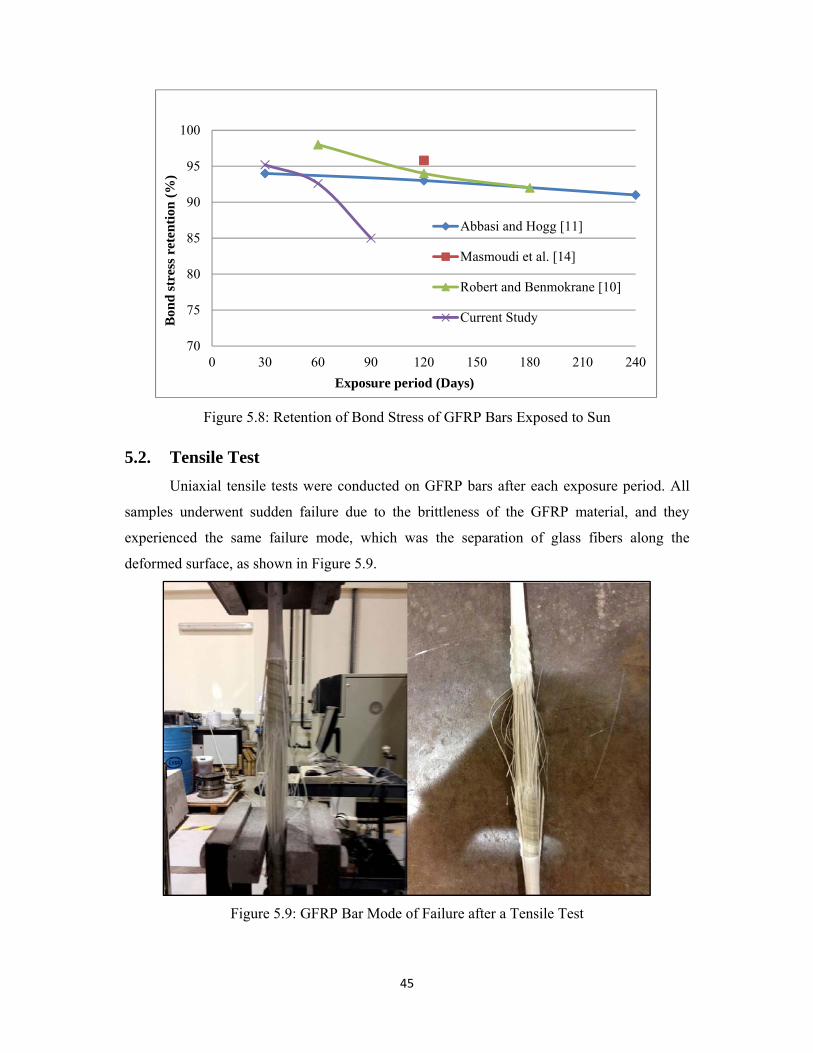
The bond strength of GFRP bars obtained in the present study was also compared
with reported results from other studies. Figure 5.8 shows a comparison of the bond strength
retention for GFRPs exposed to sun for different durations with results presented by three
other authors. The degradation trend of the bond strength observed in current study is
generally steeper than that reported in the other studies. This is due to different method of
exposure. In the other studies, the bars were exposed to the sun while embedded in the
concrete cube, whereas in the current study, the bars were directly exposed to the sun.
Previous studies used the same type of exposure, and the differences in their results, as shown
in Figure 5.8, arose because Robert and Benmokrane [10] used sand-coated GFRP bars,
which have weaker glass fibers.
82.79
70.84
66.41
90.16
84.15
80.61
95.2092.55
84.99
50
55
60
65
70
75
80
85
90
95
100
30 Days 60 Days 90 Days
Bon
d s
tres
s re
ten
tion
(%
)
Exposure Duration
Alkaline
Salt
Sun
45
Figure 5.8: Retention of Bond Stress of GFRP Bars Exposed to Sun
5.2. Tensile Test
Uniaxial tensile tests were conducted on GFRP bars after each exposure period. All
samples underwent sudden failure due to the brittleness of the GFRP material, and they
experienced the same failure mode, which was the separation of glass fibers along the
deformed surface, as shown in Figure 5.9.
Figure 5.9: GFRP Bar Mode of Failure after a Tensile Test
70
75
80
85
90
95
100
0 30 60 90 120 150 180 210 240
Bon
d s
tres
s re
tent
ion
(%
)
Exposure period (Days)
Abbasi and Hogg [11]
Masmoudi et al. [14]
Robert and Benmokrane [10]
Current Study

46
Table 5.2 shows a summary of the tensile test results, including the maximum load
and tensile strength for each specimen.
Table 5.2: Maximum Load and Tensile Strength Capacity for all GFRP Specimens
Exposures Duration Maximum Load (kN) Tensile Stress (MPa)
Lab-1 - 59.2 950.8
Lab-2 - 60.0 964.2
Sun-1 30 60.0 964.4
Sun-2 30 59.4 954.0
Sun-1 60 57.7 926.9
Sun-2 60 56.9 914.0
Sun-1 90 55.4 889.8
Sun-2 90 55.3 889.2
Salt-1 30 56.4 906.6
Salt-2 30 56.5 909.0
Salt-1 60 55.4 891.1
Salt-2 60 55.2 887.8
Salt-1 90 54.1 869.8
Salt-2 90 49.2 790.5
Alkaline-1 30 55.5 892.0
Alkaline-2 30 56.8 912.3
Alkaline-1 60 58.3 937.3
Alkaline-2 60 58.2 935.5
Alkaline-1 90 59.5 955.7
Alkaline-2 90 58.0 931.9
A sample of the stress-strain relationship for an unconditioned GFRP bar is presented
in Figure 5.10. The current study focused on retention of the tensile stress, so strain gauges
were not used to record the strain values.

47
Figure 5.10: Stress-Strain Relationship of Unconditioned GFRP
A comparison of the tensile strength between the control specimen and all other
exposures is illustrated by the bar chart shown in Figure 5.11. High temperature and humidity
had the least effect on the bars compared to the other two exposures. The tensile strength
recorded for the GFRP bars kept in the splash zone exposure was slightly lower than that
observed for the GFRP bars exposed to sun, for the three durations. On the other hand,
alkalinity exposure had a different effect on the tensile strength of the GFRP bars. The tensile
strength decreased after 30 days of exposure, and then increased after 60 days and 90 days of
exposure. More investigation is required because no evidence exists for increasing tensile
strength of GFRP bars exposed to alkaline environments. A chemical reaction may be
occurring between the alkaline solution and the glass material; this reaction may be rapid at
the beginning and then needed more time to cause a reduction in the strength of the bars.
Figure 5.12 also shows the tensile percentage retention for the three different exposures.
The GFRP specimens exposed to the high temperature and humidity showed no
significant reduction after 30, 60, and 90 days of exposure. Figure 5.13 shows a residual
tensile strength comparison between the current study and another study that used the same
type of exposure. The trend lines of the tensile strength retention for both studies are the
same; however, the percentage retention in each study is different over specific days of
exposure. Kim et al. [15] found that GFRP bars retained almost 83% of their initial strength
after 90 days of exposure. In current study; however, the strength retention was around 93%
for the same period of exposure. This shows that the GFRP bars used in current study had
better performance than those used in the previous study.
0
200
400
600
800
1000
0 1 2 3 4
Str
ess
(MP
a)
Strain %

48
Figure 5.11: Maximum Tensile Stress for Different Types of Exposures
Figure 5.12: Percentage Retention of Tensile Stress for Different Types of Exposures in Current Study
700
750
800
850
900
950
1000T
ensi
le S
tres
s(M
Pa)
Sample
75
80
85
90
95
100
30 60 90
Ten
sile
Str
ess
Ret
enti
on %
Exposure Duration
SunSaltAlkaline

49
Figure 5.13: Retention of Tensile Strength of GFRP Bars Exposed to Sun Compared to
Previous Study
For the specimens exposed to the seawater simulation tank, the strength loss was 13%
after 90 days of exposure in the current study and 16% in a previous study, as shown in
Figure 5.14. The trend lines are not the same because other factors affected the exposure. In
the current study, the seawater environment was simulated in tanks with wet/dry cycles open
to air, so the high temperature also contributed to the degradation of the tensile strength of the
GFRP bars. Although the current study had a more severe environment, the bars showed
better performance after 90 days of exposure to saline solution.
Figure 5.14: Retention of Tensile Strength of GFRP Bars Exposed to Seawater Solution
Compared to Previous Study
30
40
50
60
70
80
90
100
110
20 40 60 80 100 120
Ten
sile
ret
enti
on (
%)
Exposure period (Days)
Kim et al. [15]
Current Study
30
40
50
60
70
80
90
100
20 40 60 80 100 120
Ten
sile
ret
enti
on (
%)
Exposure period (Days)
Kim et al. [15]
Current Study

50
A comparison between the current study and another similar study for GFRP bars
exposed to high alkaline is presented in Figure 5.15. A high tensile strength reduction was
expected after testing the bars; however, the trend line for this study showed an increase in
the tensile strength. No clear explanation is evident for this case and further investigation
should be done. This phenomenon may be attributed to the slow reaction between the glass
matrix of GFRP bars and the NaOH solution at the beginning of the exposure.
Figure 5.15: Retention of Tensile Strength of GFRP Bars Exposed to Alkaline Solution
Compared to Previous Study
5.3. Arrhenius Modeling
Arrhenius modeling and time shift factors (TSF) are two approaches that can be
utilized to predict the long-term behavior of GFRP bars [26].
Time shift factor is an equation that estimates the service life of GFRP bars by
relating the accelerated and non-accelerated exposures. It can be used to extrapolate the
accelerated data and obtain the long-term effects of the environment on the bars. The TSF
value is measured between different temperatures and can be expressed by following
equation [22]:
TSF = exp .
exp .
(5.2)
where B is a constant that is determined using the time shift of two known curves and T1, T2
are temperatures between which the TSF is calculated (T1 is the lower temperature).
30
40
50
60
70
80
90
100
110
20 40 60 80 100 120
Ten
sile
ret
enti
on (
%)
Exposure period (Days)
Kim et al. [15]
Current Study

51
The TSF equation needs only two sets of data at different temperatures. TSF can be
calculated by taking the ratio of the time required for the specific strength reduction from two
different temperatures and then substituting the values to give the B value. Thereafter, TSF
can be found for any other temperature.
In the present research study, different exposures were tested for three different
durations: 30, 60, and 90 days. Therefore, based on the short-term data from the accelerated
tests, the Arrhenius model was implemented to predict the long-term behavior of the GFRP
bars [5].
k = A exp ( ) (5.3)
where k is the degradation rate (1/time), A is the constant of the material and degradation
process, Ea is the activation energy, R is the universal gas constant, and T is the temperature
in Kelvins.
Adopting the Arrhenius equation, a service life prediction can be obtained using
accelerated aging data [26]. An accelerated aging test consists of two stages. First, FRP bars
are exposed to different severe environments to accelerate the aging process. Second, long-
term properties of the bars are predicted based on the accelerated test results. The strength
retention versus time in logarithmic scale can be plotted using linear regression with the value
of R2 being at least 0.80, according to the ASTM D 3045 [27]. If the regression is not linear,
the Arrhenius equation cannot be used [28]. This approach provided a good procedure for
the prediction of the long-term performance of FRP materials. The main assumption of this
model is that the degradation mechanism of the material will not change with time and
temperature during the exposure, but the rate of degradation will be accelerated with the
increase in temperature. The Arrhenius equation can be converted into Equation 5.4 which is
the linear form of the Arrhenius model, where the logarithm of time needed for GFRP
strength to reach a certain value is a linear function of 1/T with a slope of Ea/R [5].
(5.4)
Figures 5.16-5.17 show the percentage retention vs. exposure duration for bond and
tensile strength of the GFRP bars. Linear regression analysis was conducted for all exposures
to fit a regression line through all sets of data with R2 values higher than 0.8. All R2 values

52
were more than 0.88 except for the case of tensile strength for bars exposed to alkaline
solution. Hence, the relationship between service life and strength retention can be found
through Arrhenius modeling.
Figure 5.16: Regression Analysis for Bond Strength
Figure 5.17: Regression Analysis for Tensile Strength
Long-term performance of GFRP bars can be predicted and plotted in two ways. The
first method is by plotting the property percentage retention in linear scale versus time in
logarithmic scale for different durations; the second is by plotting time as a function of
R² = 0.9614
R² = 0.9358
R² = 0.9192
30
40
50
60
70
80
90
100
0 20 40 60 80 100
Bon
d st
ress
ret
enti
on (
%)
Days
Sun
Salt
Alkaline
R² = 0.8856
R² = 0.9657
70
75
80
85
90
95
100
105
0 20 40 60 80 100
Ten
sile
str
ess
rete
nti
on (
%)
Days
Sun
Salt

53
inverse temperature for different property percentage retentions. Plotting the natural log of
retention time vs. the inverse of temperature in Kelvins gave the Arrhenius relationships
shown in Figures 5.18-5.19. Straight lines were fitted to the data, as expressed in Equation 3,
to obtain the Ea/R, which is the slope of the lines in the graphs.
Figure 5.18: Arrhenius Plots of Bond Strength Degradation
Figure 5.19: Arrhenius Plots of Tensile Strength Degradation
4.5
4.75
5
5.25
5.5
5.75
6
3.1 3.15 3.2 3.25
ln (
Bon
d r
eten
tion
) (
%)
(1/T) * 1000 (T:Kelvin)
30% Retention
40% Retention
50% Retention
60% Retention
70% Retention
4.4
4.5
4.6
4.7
4.8
4.9
5
5.1
3.1 3.15 3.2 3.25
ln (
Ten
sile
ret
enti
on)
(%
)
(1/T) * 1000 (T:Kelvin)
30% Retention
40% Retention
50% Retention
60% Retention
70% Retention
45° C35° C
45° C
35° C

54
For predicting the long-term performance of GFRP bars, Figures 5.20-5.21 were
plotted with exposure time on the horizontal axis in logarithmic scale, and the property
retention value on the vertical axis using a linear scale.
Figure 5.20: Long-term Performance of the Bond Strength of GFRP Bars
Figure 5.21: Long-term Performance of the Tensile Strength of GFRP Bars
Substitution of the values for strength retention in the logarithmic equation of each
line gives the long-term properties for each type of exposure and for specific percentage
retention. Table 5.3 is a summary of the results obtained from Arrhenius modeling.
y = -8.708ln(x) + 125.73R² = 0.8331
y = -8.691ln(x) + 119.73R² = 1
y = -15.16ln(x) + 133.96R² = 0.9881
30
40
50
60
70
80
90
100
10 100 1000
Bon
d s
tres
s re
ten
tion
(%
)
Exposure days
Sun
Salt
Alkaline
y = -6.53ln(x) + 122.51R² = 0.9924
y = -6.883ln(x) + 118.98R² = 0.814
50
60
70
80
90
100
10 100 1000
Ten
sile
str
ess
rete
nti
on (
%)
Exposure days
Sun
Salt

55
Table 5.3: Service Life Prediction of GFRP Bars for Different Type of Exposures
Number of years it takes for GFRP bars to reach a certain strength
Type of exposure (bond) Type of exposure (tensile)
% Retention Sun Salt Alkaline Sun Salt Alkaline
40 51.7 26.4 1.3 841.9 263.7 -
50 16.4 8.4 0.7 182.0 61.7 -
60 5.2 2.6 0.4 39.4 14.4 -
70 1.6 0.8 0.2 8.5 3.4 -
80 191 (days) 97 (days) 36 (days) 672 (days) 289 (days) -
90 61 (days) 31 (days) 19 (days) 146 (days) 70 (days) -

56
6. Chapter 6: Conclusions and Recommendations
6.1. Conclusions
The following conclusions can be derived from this research:
All specimens tested by pullout tests failed by bond slipping through the free-end.
Few concrete specimens also suffered cracks and/or small crushing in the bottom.
Alkaline solution was the most severe environment for the GFRP bars. The strength
reductions were 17.21%, 29.16%, and 33.59% at exposure of 30, 60, and 90 days,
respectively. The seawater solution was the second most aggressive exposure,
followed by the high temperature environment. The bond strength for GFRP bars
exposed to high temperature was reduced by 4.8%, 7.5%, and 15.0%s at 30, 60, and
90 days, respectively.
GFRP bars showed no reduction in tensile strength during up to 30 days of hot and
humid exposure. However there were reduction of 3.86% and 7.1% at 60 and 90 days
respectively due to the same exposure. Alkaline solution exposure showed lower
strength compared to the hot and humid exposure. However, the tensile strength was
not reduced after increasing the exposure period. The seawater splash zone
environment affected the GFRP bar strength more severely than the other exposures.
There was an increase in the tensile strength for the specimens exposed to alkaline
solution. It could be attributed to a complex short term chemical reaction that would
develop between the glass matrix and NaOH solution. However this strength would
be reduced in the long run for possible deterioration of the bond. More investigations
are required to understand this behavior.
Long-term performance behavior of the GFRP bars embedded in concrete was
estimated according to Arrhenius modeling. The bond strength retains 90% of its full
capacity after 61, 31, and 19 days when exposed to sun, seawater solution, and high
alkali solution, respectively. Therefore it is recommended to store GFRP bars
carefully in the site with minimum exposures in order to maintain their initial bond
strength.

57
It will take 146 and 70 days to fall below 90% of the initial tensile strength for bars
exposed to sun and salt conditions, respectively. Alkaline exposure data could not fit
the modeling to predict the long-term performance of the bars because R2 value was
less than 0.80.
In structures such as parking garages, bridge decks, retaining walls, and marine
structures, GFRP bars should be seriously considered as an alternative to steel in view
of the extent of the deterioration due to corrosion of steel. However, protection of
GFRP bars before using them should be considered because physical and mechanical
properties of these bars would change due to long exposure to harsh environment.
6.2. Recommendations
The following is recommended for further studies:
This research program tested only the bond and tensile strength of the GFRP bars.
Additional research can be done on flexural behavior of concrete beams reinforced
with GFRP bars after exposure to adverse environments.
Arrhenius modeling can be validated by testing extra bars exposed for a longer period
(1 or 2 years).

58
References
[1] M. Robert and B. Benmokrane, "Behavior of GFRP Reinforcing Bars Subjected to Extreme Temperatures," Journal of Composites for Construction, vol. 14, pp. 353-360, 2010.
[2] M. Schurch and P. Jost, "GFRP Soft-Eye for TBM Breakthrough: Possibilities with a Modern Construction Material," International Symposium on Underground Excavation and Tunnelling, 2006.
[3] G. Nkurunziza, A. Debaiky, P. Cousin and B. Benmokrane, "Durability of GFRP bars: A critical review of the literature," Progress in structural engineering and materials, vol. 7, pp. 194-209, 2005.
[4] J. Alves, A. El-Ragaby and E. El-Salakawi, "Durability of GFRP Bars’ Bond to Concrete under Different Loading and Environmental Conditions," ASCE, pp. 249-262, 2011.
[5] J. Zhou, X. Chen and S. Chen, "Durability and service life prediction of GFRP bars embedded in concrete under," Nuclear Engineering and Design, vol. 241, pp. 4095-4102, 2011.
[6] A. S. Kamal and M. Boulfiza, "Durability of GFRP Rebars in Simulated Concrete Solutions under Accelerated Aging Conditions," Journal of Composites for Construction, no. 15, pp. 473-481, 2011.
[7] ACI Committee 440.1R-01, "Guide for Design and Construction of Concrete Reinforced with FRP Bars.," American Concrete Institute.Farmington Hills 440.1R-0, 2001.
[8] F. Micelli and A. Nanni, "Durability of FRP rods for concrete structures," Construction and Building Materials, vol. 18, pp. 491-503, 2004.
[9] Y. Chen, J. F. Davalos, I. Ray and H. Kim, "Accelerated aging tests for evaluations of durability performance," Composite Structures, vol. 78, pp. 101-111, September 2007.
[10] M. Robert and B. Benmokrane, "Effect of aging on bond of GFRP bars embedded in concrete," Cement & Concrete Composites, vol. 32, pp. 461-467, 2010.
[11] A. Abbasi and P. J. Hogg, "Temperature and environmental effects on glass fibre rebar: modulus, strength and interfacial bond strength with concrete," Composites: Part B, vol. 36, pp. 394-404, 2005.
[12] S. Tastani and S. Pantazopoulou, "Experimental evaluation of the direct tension-pullout
59
bond test," Bond in concrete—from research to standards, pp. 1-8, 2002.
[13] J. Zhou, X. Chen and S. Chen, "Durability and service life prediction of GFRP bars embedded in concrete under," Nuclear Engineering and Design, vol. 241, pp. 4095-4102, 2011.
[14] R. Masmoudi, M. Ben Ouezdou, A. Daoud and A. Masmooudi, "Long-term bond performance of GFRP bars in concrete under temperature ranging from 20 oC to 80 oC," Construction and Building Materials, vol. 25, pp. 486-493, 2011.
[15] H. Kim, Y. Park, Y. You and C. Moon, "Short-term durability test for GFRP rods under various environmental conditions," Composite Structures, vol. 83, pp. 37-47, 2007.
[16] M. Porter and B. Barnes, "Accelerated durability of FRP reinforcement for concrete structures," Durability of fiber reinforced polymer for construction, pp. 191-201, 1998.
[17] F. Gaona, "Characterization of design parameters for fiber reinforced composite reinforced concrete systems," 2003.
[18] W. Chu, L. Wu and V. Karbhari, "Durability evaluation of moderate temperature cured E-glass/vinylester systems," Composite Structures, no. 66, p. 367–376, 2004.
[19] M. Al-Zahrani, "Tensile strength degradation of glass fiber reinforced polymer bars in aggressive solutions both as stand-alone and cast-in-concrete," in 8th international symposium on fiber-polymer reinforcement for concrete structures, 2007.
[20] S. Alsayed, A. Alhozaimy, Y. Al-Salloum and T. Almusallam, "Durability of the new generation of GFRP rebars under severe environments.," in Durability of fiber reinforced polymer (FRP) composites for construction, Montreal, 2002.
[21] J. Won, Y. Yoon, B. Hong, T. Choi and S. Lee, "Durability characteristics of nano-GFRP composite reinforcing bars for concrete," Composite Structures, 2011.
[22] Y. Chen, J. F. Davalos and I. Ray, "Durability Prediction for GFRP Reinforcing Bars Using Short-Term Data of Accelerated Aging Tests," Journal of Composites for Construction, ASCE, no. 10, pp. 279-286, 2006.
[23] E. G. Nawy, Reinforced Concrete, A Fundamental Approach, 2009.
[24] ACI Committee, "Guide Test Methods for Fiber-Reinforced Polymers (FRPs) for Reinforcing or Strengthening Concrete Structures," ACI 440.3R-04, 2004.
[25] ASTM International, Standard Test Method for Tensile Properties of Plastics, Pennsylvania: ASTM Int'l, 2011.

60
[26] J. Huang and R. Aboutaha, "Environmental Reduction Factors for GFRP Bars Used as Concrete Reinforcement: New Scientific Approach," Journal of Composites for Construction, pp. 479-486, 2010.
[27] American Society for Testing and Material (ASTM), Annual book of ASTM standards, West Conshohocken, PA, USA, 2000.
[28] L. C. Bank, T. R. Gentryb, B. P. Thompsona and J. S. Russella, "A model specification for FRP composites for civil engineering structures," Construction and Building Materials 17, p. 405–437, 2003.
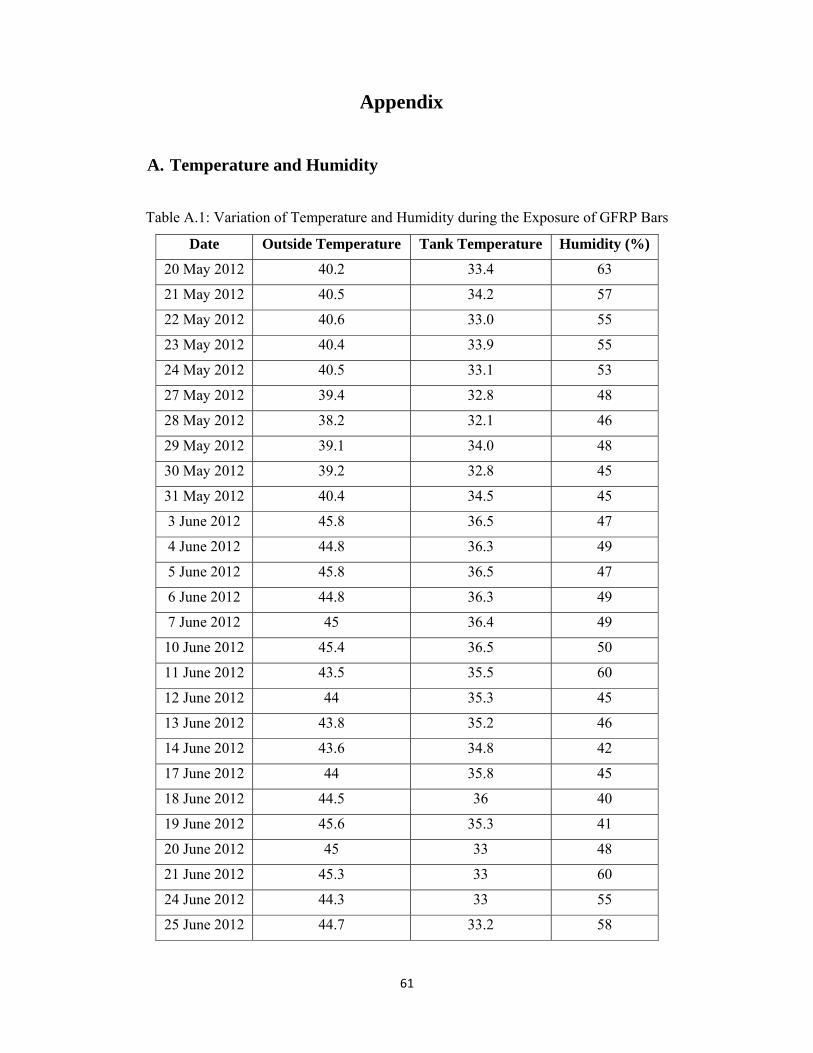
61
Appendix
A. Temperature and Humidity
Table A.1: Variation of Temperature and Humidity during the Exposure of GFRP Bars
Date Outside Temperature Tank Temperature Humidity (%)
20 May 2012 40.2 33.4 63
21 May 2012 40.5 34.2 57
22 May 2012 40.6 33.0 55
23 May 2012 40.4 33.9 55
24 May 2012 40.5 33.1 53
27 May 2012 39.4 32.8 48
28 May 2012 38.2 32.1 46
29 May 2012 39.1 34.0 48
30 May 2012 39.2 32.8 45
31 May 2012 40.4 34.5 45
3 June 2012 45.8 36.5 47
4 June 2012 44.8 36.3 49
5 June 2012 45.8 36.5 47
6 June 2012 44.8 36.3 49
7 June 2012 45 36.4 49
10 June 2012 45.4 36.5 50
11 June 2012 43.5 35.5 60
12 June 2012 44 35.3 45
13 June 2012 43.8 35.2 46
14 June 2012 43.6 34.8 42
17 June 2012 44 35.8 45
18 June 2012 44.5 36 40
19 June 2012 45.6 35.3 41
20 June 2012 45 33 48
21 June 2012 45.3 33 60
24 June 2012 44.3 33 55
25 June 2012 44.7 33.2 58
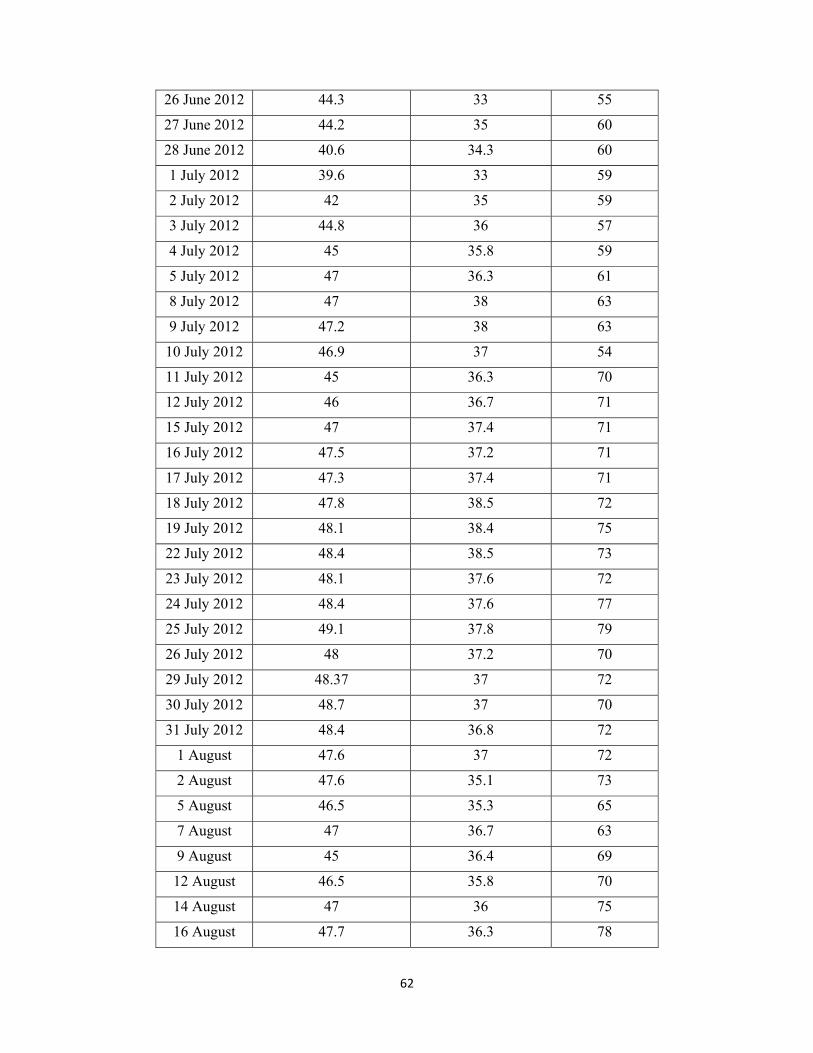
62
26 June 2012 44.3 33 55
27 June 2012 44.2 35 60
28 June 2012 40.6 34.3 60
1 July 2012 39.6 33 59
2 July 2012 42 35 59
3 July 2012 44.8 36 57
4 July 2012 45 35.8 59
5 July 2012 47 36.3 61
8 July 2012 47 38 63
9 July 2012 47.2 38 63
10 July 2012 46.9 37 54
11 July 2012 45 36.3 70
12 July 2012 46 36.7 71
15 July 2012 47 37.4 71
16 July 2012 47.5 37.2 71
17 July 2012 47.3 37.4 71
18 July 2012 47.8 38.5 72
19 July 2012 48.1 38.4 75
22 July 2012 48.4 38.5 73
23 July 2012 48.1 37.6 72
24 July 2012 48.4 37.6 77
25 July 2012 49.1 37.8 79
26 July 2012 48 37.2 70
29 July 2012 48.37 37 72
30 July 2012 48.7 37 70
31 July 2012 48.4 36.8 72
1 August 47.6 37 72
2 August 47.6 35.1 73
5 August 46.5 35.3 65
7 August 47 36.7 63
9 August 45 36.4 69
12 August 46.5 35.8 70
14 August 47 36 75
16 August 47.7 36.3 78

63
19 August 46.5 36.2 82
21 August 46.0 36.8 80
23 August 46.7 37 76
26 August 46.0 36 65
28 August 45.2 35.5 63
30 August 45.5 35.5 62
2 September 44.7 34.8 57
4 September 44.8 34.5 58
6 September 44.0 34.2 55
9 September 43.2 33.5 60
11 September 42.5 33.2 58
13 September 41.8 33 68
16 September 41.7 31.9 66
18 September 40.2 32.1 60
20 September 40 32 58
23 September 40.5 32.3 59
25 September 41 31.9 60
27 September 39.5 31.5 63
30 September 41 32.3 60
2 October 38 29.2 57
4 October 37.3 29.3 52
7 October 37.5 29 50
9 October 35.2 28.7 45
11 October 34.6 28.9 49
14 October 35.2 28.3 54
16 October 36.8 27.9 53
18 October 35.5 27.2 52
21 October 34 27 52

64
B. Pullout Test Graphs
Figure B.1: Load-Extension Relationship of Unexposed GFRP Bar (Sample 1)
Figure B.2: Load-Extension Relationship of Unexposed GFRP Bar (Sample2)
-10
0
10
20
30
40
50
60
70
80
90
0 2 4 6 8 10 12 14
Bon
d te
st lo
ad (
kN
)
Extension (mm)
0
10
20
30
40
50
60
70
80
90
0 2 4 6 8 10 12 14
Bon
d te
st lo
ad (
kN
)
Extension (mm)

65
Figure B.3: Load-Extension Relationship of GFRP Bar Exposed to the Sun after 30 Days
(Sample 1)
Figure B.4: Load-Extension Relationship of GFRP Bar Exposed to the Sun after 30 Days
(Sample 2)
0
10
20
30
40
50
60
70
80
90
0 1 2 3 4 5 6 7 8
Bon
d te
st lo
ad (
kN
)
Extension (mm)
0
10
20
30
40
50
60
70
80
90
0 2 4 6 8 10 12
Bon
d te
st lo
ad(k
N)
Extension (mm)
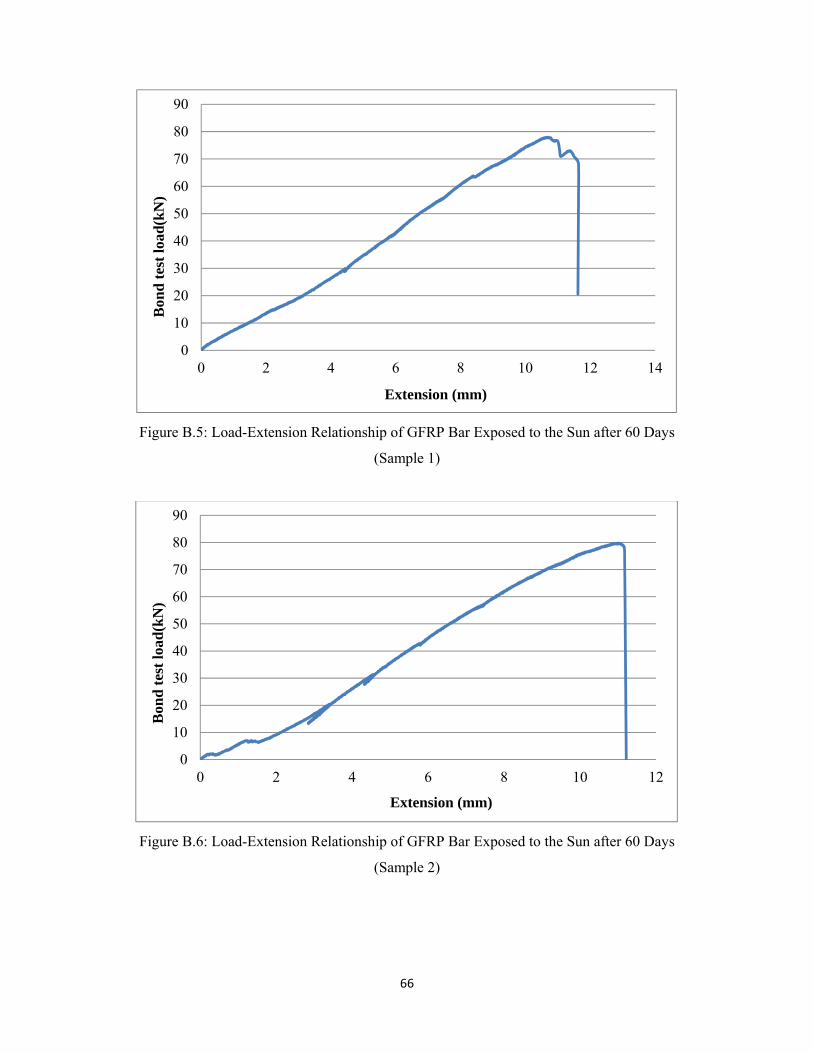
66
Figure B.5: Load-Extension Relationship of GFRP Bar Exposed to the Sun after 60 Days
(Sample 1)
Figure B.6: Load-Extension Relationship of GFRP Bar Exposed to the Sun after 60 Days
(Sample 2)
0
10
20
30
40
50
60
70
80
90
0 2 4 6 8 10 12 14
Bon
d te
st lo
ad(k
N)
Extension (mm)
0
10
20
30
40
50
60
70
80
90
0 2 4 6 8 10 12
Bon
d te
st lo
ad(k
N)
Extension (mm)

67
Figure B.7: Load-Extension Relationship of GFRP Bar Exposed to the Sun after 90 Days
(Sample 1)
Figure B.8: Load-Extension Relationship of GFRP Bar Exposed to the Sun after 90 Days
(Sample 2)
0
10
20
30
40
50
60
70
80
0 2 4 6 8 10 12 14 16
Bon
d t
est
load
(kN
)
Extension (mm)
0
10
20
30
40
50
60
70
80
0 2 4 6 8 10 12
Bon
d t
est
load
(kN
)
Extension (mm)

68
Figure B.9: Load-Extension Relationship of GFRP Bar Exposed to the Salt Solution after 30
Days (Sample 1)
Figure B.10: Load-Extension Relationship of GFRP Bar Exposed to the Salt Solution after 30
Days (Sample 2)
0
10
20
30
40
50
60
70
80
90
0 3 6 9 12 15 18 21
Bon
d t
est
load
(kN
)
Extension (mm)
0
10
20
30
40
50
60
70
80
0 2 4 6 8 10 12
Bon
d te
st lo
ad(k
N)
Extension (mm)

69
Figure B.11: Load-Extension Relationship of GFRP Bar Exposed to the Salt Solution after 60
Days (Sample 1)
Figure B.12: Load-Extension Relationship of GFRP Bar Exposed to the Salt Solution after 60
Days (Sample 2)
0
10
20
30
40
50
60
70
80
0 2 4 6 8 10 12 14
Bon
d t
est
load
(kN
)
Extension (mm)
0
10
20
30
40
50
60
70
80
0 2 4 6 8 10 12
Bon
d t
est
load
(kN
)
Extension (mm)

70
Figure B.13: Load-Extension Relationship of GFRP Bar Exposed to the Salt Solution after 90
Days (Sample 1)
Figure B.14: Load-Extension Relationship of GFRP Bar Exposed to the Salt Solution after 90
Days (Sample 2)
0
10
20
30
40
50
60
70
80
0 2 4 6 8 10
Bon
d te
st lo
ad(k
N)
Extension (mm)
0
10
20
30
40
50
60
70
80
0 2 4 6 8 10
Bon
d te
st lo
ad(k
N)
Extension (mm)

71
Figure B.15: Load-Extension Relationship of GFRP Bar Exposed to the Alkaline Solution
after 30 Days (Sample 1)
Figure B.16: Load-Extension Relationship of GFRP Bar Exposed to the Alkaline Solution
after 30 Days (Sample 2)
0
10
20
30
40
50
60
70
80
0 2 4 6 8 10 12
Bon
d t
est
load
(kN
)
Extension (mm)
0
10
20
30
40
50
60
70
80
0 2 4 6 8 10 12 14
Bon
d te
st lo
ad(k
N)
Extension (mm)

72
Figure B.17: Load-Extension Relationship of GFRP Bar Exposed to the Alkaline Soluion
after 60 Days (Sample 1)
Figure B.18: Load-Extension Relationship of GFRP bar Exposed to the Alkaline Solution
after 60 Days (Sample 2)
0
10
20
30
40
50
60
70
0 2 4 6 8 10 12
Bon
d t
est
load
(kN
)
Extension (mm)
0
10
20
30
40
50
60
70
0 2 4 6 8 10
Bon
d te
st lo
ad(k
N)
Extension (mm)

73
Figure B.19: Load-Extension Relationship of GFRP bar Exposed to the Alkaline Solution
after 90 Days (Sample 1)
Figure B.20: Load-Extension Relationship of GFRP bar Exposed to the Alkaline Solution
after 90 Days (Sample 2)
0
10
20
30
40
50
60
0 2 4 6 8 10
Bon
d t
est
load
(kN
)
Extension (mm)
0
10
20
30
40
50
60
70
0 2 4 6 8 10
Bon
d t
est
load
(kN
)
Extension (mm)
74
Vita
Saber Abedi was born on December 7, 1987, in Dubai, UAE. He started his education
at the Towheed Iranian Primary School in Dubai, and he graduated from Towheed Iranian
High School in 2005.
He continued his education at the American University of Sharjah and graduated in
August 2010 with a B.S. degree in Civil Engineering. In 2010, he started his graduate studies
at the American University of Sharjah in the Master’s program in Civil Engineering Science.
During his studies, he worked as a research and teaching assistant. He was in charge of
several courses and performed lab duties primarily in the surveying and construction material
laboratory. He is expected to receive the M.S. degree in Civil Engineering in January 2014.