Embed Size (px)
Citation preview

1
Creep Behaviour and Residual Tensile Properties of GFRP 1 Reinforcing Bars Subjected to Different Sustained Service Loads 2
3 T. Youssef and B. Benmokrane 4
5 6 7 Synopsis: Creep tests have been conducted on six commercial GFRP bars, pertaining to 8 three different manufacturers, under two levels of sustained service load (nominally 15% 9 and 30% of the ultimate tensile strength). The test duration was 10000 hours (417 days). 10 At the end of the test duration, the samples were tested statically to infer upon their 11 residual tensile properties. It is evident that GFRP bars with lower fiber content and/or 12 bigger diameter exhibit higher levels of creep strain than their counterparts of high fiber 13 content and smaller diameter. Residual tensile property tests show barely any change as 14 to the bars’ longitudinal tensile properties. Microstructural analysis indicates that there is 15 no degradation in the matrix or the fiber-matrix interface, within the GFRP bars after the 16 lengthy duration. 17 18 19 20 21 22 23 24 25 26 27 28 29 30 31 32 33 34 35 36 37 38 39 40 41 Keywords: Glass fiber-reinforced polymers (GFRP), Reinforcing bars, Creep behaviour, 42 Serviceability, Sustained service load, Strain 43
44

2
1 T. Youssef is a PhD Candidate at the Department of Civil Engineering, University of 2 Sherbrooke, Sherbrooke, Quebec, Canada. His research interests include the long-term 3 performance of FRP bars and FRP reinforced concrete members. 4 5 ACI member B. Benmokrane is an NSERC Research Chair Professor in FRP 6 Reinforcement for Concrete Infrastructures and Tier-1 Canada Research Chair in 7 Advanced Composite Materials for Civil Structures in the Department of Civil 8 Engineering at the University of Sherbrooke, Sherbrooke, Quebec, Canada. His research 9 interests include the development and application of advanced composite materials in 10 civil engineering structures. He is a member in the CSA (Canadian Standard Association) 11 committees on FRP structural components and FRP reinforcing materials for buildings 12 (CSA-S806), for bridges (CSA-S6), and for Specification (CSA S807) and ACI 13 committee 440 FRP Reinforcement. 14 15 16
INTRODUCTION 17 18 Not only the creep and shrinkage of concrete, but the creep of GFRP bars, account for the 19 total long-term deflection of GFRP reinforced concrete members. Creep behavior of 20 GFRP bars in general, whether creep deformation or creep rupture, has a dramatic 21 influence on the design of GFRP reinforced concrete beams. The accumulation of creep 22 deformation/strain within GFRP reinforcing bars affects the longterm performance of the 23 comprising concrete element. This manifests in crack width/propagation and longterm 24 deflection (i.e. serviceability). There is a pressing need for producing data and ranking 25 the creep performance of currently available commercial GFRP bars. 26
27 After exhibiting initial elastic strain, a GFRP bar goes through the first phase 28
where creep strain grows rapidly in a short time period. The second phase is typically 29 time lengthy and characterized by constant slope. The third phase may never occur unless 30 the stress applied is much higher than the service load (Fib 2007). Creep behavior, of 31 GFRP, also synergizes with other adverse environmental conditions yielding a more 32 pronounced effect on GFRP reinforced concrete. Gaona (2003) and Youssef et al. (2008) 33 have conducted creep behavior experiments on a variety of GFRP bars for lengthy 34 periods. The former study concluded that creep strain increase for three different types of 35 15.9 mm GFRP bars, subjected to sustained load levels ranging from 23 to 27% fu,ave is in 36 the order of 2 to 6.6% of initial elastic strain ε0; surrounding environment was controlled 37 at (31oC and 67% relative humidity) for a test duration of six months. Showing fair 38 agreement, the latter study (Youssef et al. 2008) yields creep strain values that range from 39 2 to 8.7% ε0 for two types of 9.5 mm commercial GFRP bars; the test duration ranged 40 from 4000 to 8600 hours (5.5 to 12 months approx.); sustained load levels ranged from 41 15 to 45% fu,ave at standard laboratory atmosphere (23 ± 3 oC and 50 ± 10% relative 42 humidity). 43
44 Based on the findings of researchers such as Yamaguchi et al. 1997 and Seki et 45
al. 1997 and using the most conservative results available in literature, the ACI 440.1R-46

3
06 design guideline has assigned GFRP the creep rupture stress limit of 20% of the bar’s 1 tensile strength. The corresponding values for the CAN/CSA-S806-02 standard is 25%. 2 Nevertheless, studies such as Greenwood 2002, Youssef et al. 2008 and Budelman & 3 Rotasy 1993, suggest creep rupture stress limits varying between 45% and 60% fu,ave. For 4 this study, the chosen sustained load levels are 15% and 30% fu,ave to cover the range of 5 creep rupture stress limits indicated by the aforementioned guidelines. A comparative 6 study between all bar-types is to take place under the same ambient environmental 7 conditions. 8
9 After lengthy exposure times (10000 hours approx.) in air or alkaline solutions 10
(pH 12.8) at room temperature, most results obtained from earlier efforts indicate that the 11 modulus of elasticity of GFRP bars and hybrid glass/carbon FRP bars exhibit no 12 significant change (e.g. Nkurunziza et al. 2005 and Rahman et al. 1995) under a variety 13 of sustained load levels. As for the loss in tensile strength, it is typically negligible for 14 tests conducted in air yet variant for bars saturated in de-ionized water (pH 7.0) or 15 alkaline solutions (pH 12.8). No consistent relationship was found between residual 16 tensile strength and the intensity of sustained load. 17
18 CAN/CSA S807-10 has set a standard for conducting creep behaviour tests 19
where GFRP bars are subjected to two levels of sustained load (20% and 40% of the 20 ultimate tensile strength fu,ave); strain readings are reported at 1000, 3000 and 10000 21 hours from test inception. On the other hand, the ACI 440.1R-06 guide and the 22 CAN/CSA-S806-02 standards adopt the same method for creep rupture testing of FRP 23 bars where five sustained load levels are applied to a particular FRP bar-type (of the same 24 batch). The ACI 440.R-07 report refers to the traditional methods for creep testing. The 25 adopted method for the current study is that of gravity loading using a lever arm - so 26 called creep frame - to permit greater loads. 27 28
This study mainly aims to remedy the lack of data regarding the creep 29 deformation of different types and sizes of GFRP bars under two different levels of 30 service load. The residual tensile properties (modulus of elasticity and tensile strength), 31 after a 10000 hour test-period (417 days), are observed as well. The main objectives 32 herein are to: (i) assess and compare the creep behavior of six different types of GFRP 33 bars under service load and (ii) gain insight into the GFRP bars’ residual tensile 34 properties (modulus of elasticity and tensile strength) after lengthy duration (417 days). 35 This study serves as a baseline to subsequent tests where GFRP bars are tested under the 36 coupled effect of sustained load and environmental adversities/aggressivities. 37 38
EXPERIMENTAL PROGRAM 39 40
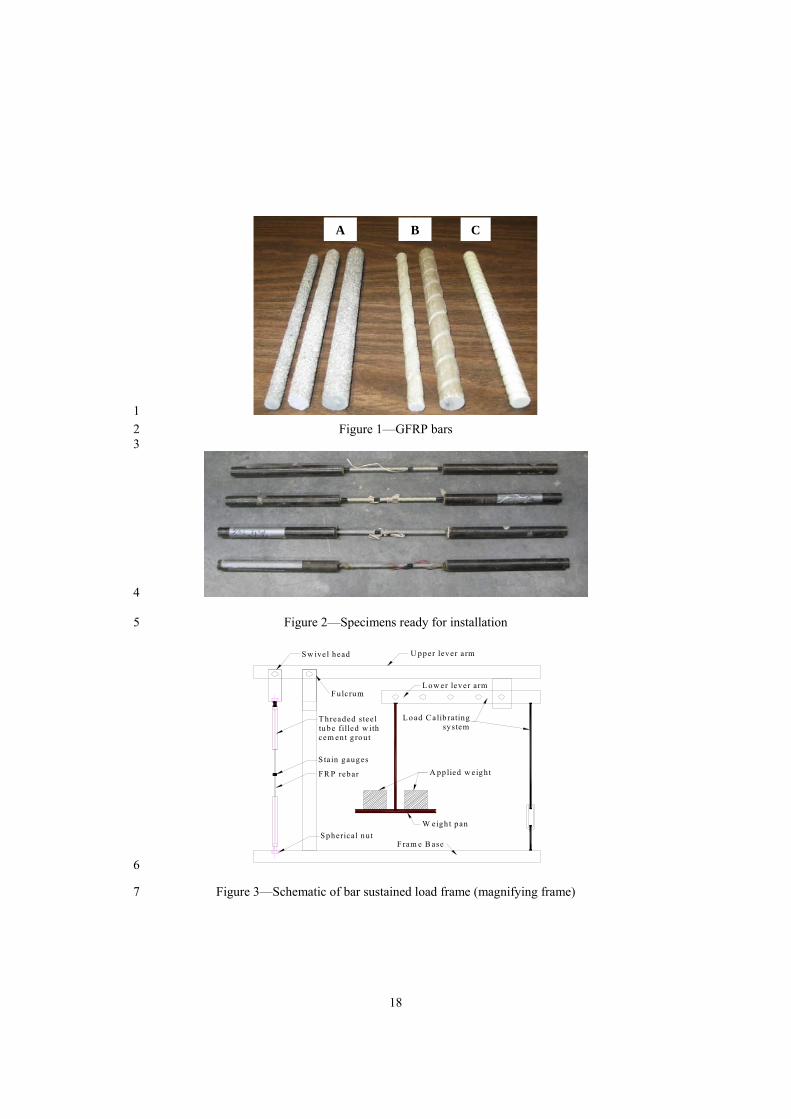
Fifty two samples of six commercial GFRP bars, pertaining to four different 41 sizes and three different manufacturers (Figure 1), are examined in this study. For 42 manufacturer A, GFRP, is made of high-strength E-glass fibers impregnated in vinylester 43 resin. The bar’s circular cross section is manufactured by a process that couples 44 pultrusion with sand-coating along the external surface of the bar. The GFRP bars of 45 manufacturer B is also made of E-glass fibers that are drawn/pultruded through a 46

4
vinylester resin bath; surface undulation (helical wrapping) and sand are applied prior to 1 thermosetting of the polymeric resin. As for manufacturer C, the core of the rebar is made 2 using the pultrusion process. In this continual process high-strength glass fibres are 3 drawn through a tool where they are impregnated with liquid synthetic resin. The 4 impregnated fibres are sent through a profiling mould and are hardened. The ribs are 5 ground and hardened into the bars. Further detail as to the physical properties of the six 6 bar-types and their appearance are available in Table 1 and Figure 1, respectively. The 7 main mechanical properties, as obtained through tensile tests conducted prior to creep 8 testing (average ultimate tensile strength fu,ave modulus of elasticity Ef and average 9 ultimate tensile strain εu,ave), are displayed in Table 2. 10
11 The parameters of interest in this study are the bar-type, size/diameter, and the 12
axial sustained load level. For each bar-type, two levels of sustained tensile load 13 (nominally15% and 25-30% fu,ave) were applied, inducing a range of initial strain ε0 14 ranging roughly from 2000 to 7000 µε. Four to five samples are assigned to each 15 sustained load level per bar-type. The surrounding environment whilst conducting the 16 long-term creep tests is standard laboratory atmosphere (23 ± 3 oC and 50 ± 10% relative 17 humidity). 18
19 All samples were prepared in accordance to the CSA-S806-02 and the ACI 20
440.3R-04 guides (See Figure 2). Each one of the two ends, of a bar sample, was fitted 21 into a 410 mm-long steel tube (grip) using Bristar 100 expansive grout. The steel pipe-22 grips were screwed onto spherical nuts that keep the sample intact with the frame. Two 23 Kyowa 10-mm strain gauges (120 ohm resistance and a gauge factor of 2.10) were 24 installed –on opposite sides- at the middle of the free portion of each sample. Strain 25 measurements were taken using a portable strain indicator. 26
27 The schematic of a sustained-load frame, shown in Figure 3, illustrates the 28
comprising frame elements and location of the sample within. The aim of such frames is 29 to have a constant tensile load sustained along the bar’s length for extended time 30 durations. The load should be maintained perfectly axial assuring that no eccentricity or 31 bending occurs. The load magnifying system (the two lever arms and sustained weight-32 pan) multiplies the kept-on-pan weight to reach a certain percentage of the sample’s 33 ultimate tensile capacity. Prior to installation, all frames were calibrated using a 34 standardized steel rod, five sets of different weight magnitudes and a strain indicator. The 35 typical scenario for bar installation, in chronological order, is as follows: (i) The two 36 lever arms are upheld in a pseudo-horizontal position that allows placement and fitting of 37 an FRP sample between the base and the swivel, using threaded bolts and spherical nuts; 38 (ii) The necessary weight (pre-calculated on the basis of frame calibration) is placed on 39 the pan; this may disturb the horizontality of the lever arms and in turn apply eccentric 40 load onto the bar’s cross section; (iii) A trade-off takes place between manually 41 tightening (or loosening) the spherical nuts at the pipe-grip ends and adjusting the load 42 calibration system at the back of the frame; this restores the horizontality of the lever-43 arms (aided by high-precision spirit levels) and consequently the concentricity of the load 44 onto the sample. 45
46

5
Strain measurements are taken once the GFRP bars are installed under the 1 prescribed load, then at following regular intervals for the extended test duration (10000 2 hours ≈ 417 days). The device used is a P-3500 portable strain indicator (with an 3 accuracy of 3 µε), manufactured by Measurements Group Inc. The horizontality of the 4 two lever arms are checked every time in advance (using a spirit-level on each arm) to 5 assure that the load is maintained concentric. The frequency of strain readings was 6 typically as follows: every six hours for the first two days; every day for the first week; 7 biweekly when the rate of change of creep strain significantly decreases. Each 8 measurement, indicated on the graphs (Figure 4 and Figure 5), is actually an average of 9 the two back-to-back gauges installed onto the bar-sample. As per CAN/CSA S807-10, 10 creep strain values are recorded and presented at 1000, 3000 and 10000 hours (Table 3 11 and Table 4). 12
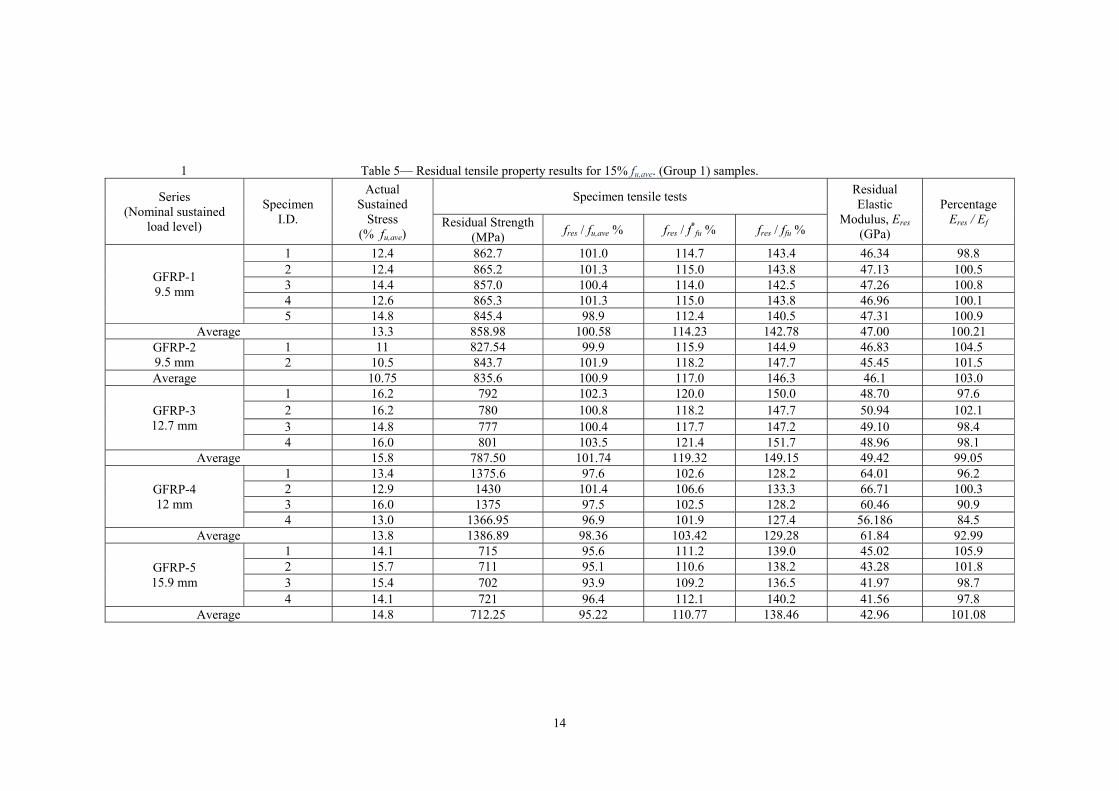
13 After sufficing the 10000 hour duration or more, all samples were uninstalled 14
from their comprising frames. Static tensile tests were then conducted on the samples 15 using an MTS tensile test machine. Residual tensile properties, indicated as percentage of 16 the ultimate tensile strength (% fu,ave) and as percentage of the Young’s modulus (% Ef), 17 are presented in Table 5 and Table 6 in the discussion section below. Some samples were 18 reserved for microstructural analysis to know if the matrix or fiber-matrix interface 19 within the bars were affected after the lengthy duration. 20
21 TEST RESULTS AND DISCUSSION 22
23 In this section, the creep-strain measurements obtained during the long-term testing phase 24 are displayed (Figure 4 and Figure 5) and discussed. In compliance with the ACI 440.3R-25 04 guide, measurements were taken regularly; readings at test inception as well as at 26 specific milestones (1000 hours, 3000 hours and 10000 hours) were also recorded (Tables 27 3 and 4). A following phase is that of residual tensile testing from which residual tensile 28 properties of the creep-tested bars are obtained; this includes residual tensile strength and 29 residual Young’s modulus (Table 5 and Table 6). Furthermore, the outcome of 30 microstructural analysis of the six commercial GFRP bars is presented. 31 32 Creep Tensile Strain 33
For any GFRP bar, the creep characteristics are known by monitoring the 34 change in axial strain with time under constant applied stress. The creep behavior of all 35 GFRP bars is displayed in Figure 4 and Figure 5 as well as Tables 3 and 4. It was 36 observed that for all bars, exhibiting standard laboratory conditions, there was no sign of 37 creep failure for the assigned sustained load levels. For sample sets exhibiting the 38 nominal tensile stress of 15% fu,ave , the upper-bound creep-strain percentages (maximum 39 values in each dataset) after 10000 hours are 8.7, 2.5, 3.2, 4.1, 15.7 and 8.3% for bar-40 types GFRP-1, GFRP-2, GFRP-3, GFRP-4, GFRP-5 and GFRP-6, respectively (Figure 41 4). The corresponding values for (25-30%) fu,ave are 11.8, 3.8, 12, 5.6, 15.8 and 8.6, 42 respectively (Figure 5). The values displayed above are significantly greater than the 43 average value for each data set, in certain cases. In general, no consistent relationship is 44 found between the magnitude of accumulated creep strain and sustained load level. It is 45 important to consider that the rate of creep-strain increase tapers down greatly with time 46

6
when extrapolating the obtained measurements over the service life of a concrete 1 structure (e.g., 75 years). The 10000-hour term has gained consensus as the period that 2 captures most of the resulting creep strain. The variance, in replicates, of the same data-3 set is significant. However, this is typical for creep tests regardless the devoted degree of 4 precision and caution. 5
6 Creep coefficients can be determined by linearizing the creep-strain curve into 7
strain versus log time. When fashioned in such a manner, GFRP materials approximate to 8 a linear relationship. The equation for the total strain of the commercial bars can be 9 written as: 10
ε (t) = β log t + ε0 11
where ε (t) is the total strain in the material after a time period t (10000 hours for this 12 study), ε0 is the initial (elastic) strain value and β is the creep rate parameter that is equal 13 to dε(t)/ dt. Using linear regression for the obtained data, the creep coefficients for the 14 upper boundary values of GFRP samples, installed under nominal 15% fu,ave were 15 determined as 46.7, 15.7, 23.5, 38.5, 138.1 and 77.0 for GFRP-1, GFRP-2, GFRP-3, 16 GFRP-4, GFRP-5 and GFRP-6, respectively. Similarly, the creep coefficients for nominal 17 30% fu,ave samples were 32.5, 216.6, 105.9, 98.9, 106.9 and 344.7 for the same GFRP bar-18 types respectively. It is evident that the coefficient β increases significantly with the 19 increase of applied stress. 20 21 Residual Tensile Properties (Strength and Young’s Modulus) 22 After the elapse of the test duration (10000 hours), all bars were dismantled from their 23 comprising frames and tensile tests were conducted to obtain residual properties. For all 24 samples, the rupture mode was burring of the fibres; preceded by and helical wrap 25 unwinding in the case of GFRP-2 and GFRP-6 bars. The average residual strength for all 26 bars was negligibly affected by the lengthy period under constant load; the loss 27 percentage ranged from 0 to 5.4% fu,ave. Typically the loss for all data sets, if any, was 28 less than the standard deviation yielded by mechanical property testing. Similarly, the 29 average loss of the modulus of elasticity, for each dataset, was as low as 0 to 8% Ef. The 30 maximum loss was that of GFRP-4 at 15% fu. However, that percentage loss of 8% is still 31 less than the standard deviation obtained from static tensile tests. The level of sustained 32 load had no impact on the residual tensile properties for all bars types. 33 34 Microstructural Analysis 35 The formation of microcracks in the resin and the debonding at the interface of 36 fibers/matrix are the most common phenomena occurring in a GFRP material under 37 sustained load and/or adverse environment. In this respect, investigation (Scan Electron 38 Microscopy - SEM - analysis) took place using selected samples of the tested bars after 39 the 10000 hour test duration to have a better understanding of the causes behind strength 40 loss, if any. Micrographs, in Figure 6 show a magnified cross section of the samples prior 41 to testing. Figure 7 shows magnified cross-section images of the rupture zone for all 42 tested bar types. Samples of GFRP-1, GFRP-2, GFRP-3, GFRP-4, GFRP-5 and GFRP-6 43 were tested after the aforementioned duration after exhibiting 30%, 30%, 25%, 25%, 30% 44 and 30% fu,ave, respectively. Results show that all bar types show no signs of debonding 45

7
between the fibers and vinylester resin, and no induced microcracks. Subsequent SEM 1 tests have also indicated that the external surface of all bars remained unchanged. 2
3 CONCLUSIONS 4
5 In this paper, a study was conducted regarding the creep behavior of fifty two GFRP bar-6 samples, of six different commercial brands, over a period of 10000 hours (417 days). 7 The glass/vinylester GFRP bars (of diameters 9.5 mm, 12 mm, 12.7 mm and 15.9 mm), 8 were tested in room temperature (23 ± 3 oC) and subjected to constant sustained load 9 service levels, nominally 15% and 30% of the ultimate tensile strength fu,ave. The 10 following conclusions can be drawn from the longterm tests, residual tensile tests and 11 microstructural analysis at the end of the test duration: 12 13
1- The creep strain evolution, for the tested six commercial types, typically starts 14 with a high rate at the first 80 to 120 hours then tapers down asymptotically with 15 time. For bars that exhibited 15% fu,ave the upper-bound (maximum) values for 16 accumulated creep strain after 10000 hours were 8.8%, 2.5%, 4.1%, 3.2%, 8.3% 17 and 15.7% of the initial (Immediate elastic) strain ε0, for bar-types GFRP-1, 18 GFRP-2, GFRP-3, GFRP-4, GFRP-5 and GFRP-6, respectively. Similarly, the 19 upper-bound values for 25-30% fu,ave were 3.8%, 11.8%, 12.0%, 5.6%, 8.6% and 20 11.8% for the same bar-types, respectively. 21
2- The upper-bound values in certain cases are much higher than the average 22 accumulated strain calculated for the replicates of each test-set. Nevertheless, 23 these high upper-bound values are low and inconsequential compared to the 24 creep coefficient of concrete itself that varies between 150% and 400%. 25
3- There is no evident/clear relationship between the applied load level and 26 resulting creep strain after 10000 hours. Moreover, due to the inherent noisy 27 nature of the data, an isochronous stress-strain relationship between the 28 magnitude of sustained stress and accumulated strain cannot be derived. 29
4- In general, bars of bigger diameters exhibit greater creep strain values; possibly 30 due to the curing factor which is better for bars of small diameter. 31
5- The residual tensile strength and modulus of elasticity, for all samples that 32 survived the 1000 hour duration, were found barely changed (almost retaining 33 their full strength). The loss percentage ranged from 0-5.4% fu,ave and 0-8% Ef 34 for tensile strength and Young`s modulus respectively. In both cases, the loss 35 was less than the standard deviation yielded by mechanical property testing. 36
6- Microstructural analysis was conducted on samples from both commercial bars 37 that exhibited 25% and 30% fu,ave for 10000 hours. No microcracks were found 38 indicating that there is no sign of degradation for GFRP bars exhibiting service 39 load. 40 41
ACKNOWLEDGEMENTS 42 43 The authors acknowledge the financial support received from the Natural Science 44
and Engineering Research Council of Canada (NSERC), the Fond Quebecois pour la 45 Recherche en Nature et Technologie (FQRNT), and the Network of Centres of 46

8
Excellence on Intelligent Sensing for Innovative Structures ISIS-Canada. Sincere thanks 1 are due to Pultrall Inc. (Thetford Mines, Quebec), Hughes Brothers (Nebraska, U.S) and 2 Shoeck Bauteile GmbH (Germany) for generously providing the GFRP materials. Special 3 thanks are also given to Dr. Sherif El-Gamal, former Post-doctoral fellow at the 4 University of Sherbrooke and François Ntacorigira, technician at the Dept. of Civil En., 5 Univ. of Sherbrooke, for their help in the fabrication and testing the samples. 6
7 REFERENCES 8
9 American Concrete Institute. 2004. Guide Test Methods for Fiber Reinforced Polymers 10
(FRPs) for Reinforcing or Strengthening Concrete Structures. Committee 440, 11 Farmington Hills, Michigan USA, 41p. 12
American Concrete Institute. 2006. Guide for the Design and Construction of Concrete 13 Reinforced with FRP Bars. ACI 440.1R-06 Committee 440, Farmington Hills, Mich., 14 44p. 15
American Concrete Institute. 2007. Report on Fiber-Reinforced Polymer (FRP) 16 Reinforcement for Concrete Structures. Committee 440, Farmington Hills, Michigan, 17 USA, 228p. 18
Ando, N., Matsukawa, H., Hattori, A., and Mashima, A. 1997. Experimental studies on 19 the long-term tensile properties of FRP tendons. Proceeding of the Third International 20 Symposium on Non-Metallic (FRP) Reinforcement for Concrete Structures 21 (FRPRCS-3), Sapporo, Japan, October 14-16, V. 2, 203-210. 22
Benmokrane, B., and El-Salakawy, E., eds. 2002. Durability of Fiber Reinforced Polymer 23 (FRP) Composites for Construction. Proceedings of the Second International 24 Conference on Durability of Fibre-Reinforced Polymer (FRP) Composites for 25 Construction (CDCC’2002), Montreal, Quebec, Canada, May 28-31, 715 p 26
Canadian Standard Association (CSA). (2006). “Canadian Highway Bridge Design 27 Code.” CAN/CSA S6–06, Rexdale, ON, Canada. 28
Canadian Standards Association (CSA). 2002. Design and Construction of Building 29 Components with Fibre Reinforced Polymers. CAN/CSA S806–02, Rexdale, 30 Ontario, Canada, 177p. 31
Canadian Standard Association (CSA). 2010. Specification for Fibre-Reinforced 32 Polymers. CAN/CSA S807-10, Rexdale, Ontario, Canada, Final Draft, 35p. 33
FIB. (2007). “FRP reinforcement in RC structures”. FIB Bulletin 40. Fédération 34 Internationale de Béton, Chapter 3, 3.3 - 3.5. 35
Gaona, F. A. 2003. Characterization of Design Parameters for Composite Reinforced 36 Concrete Systems. PhD thesis, Texas A&M University, College Station, Texas, U.S, 37 115-121. 38
Greenwood, M. 2002. Creep-Rupture Testing to Predict Long-Term Performance. 39 Proceedings 2nd Intl. Conference on the Durability of Fibre Reinforced Polymer 40 (FRP) Composites for Construction, University of Sherbrooke, Sherbrooke, Quebec, 41 203-212. 42
Hughes Brothers Inc. Fiberglass Rebar. Technical Datasheet, Hughes Brothers Inc., 43 Nebraska, U.S, 2007, 4 p. 44
Karbhari, V.M., Chin, J. W., Hunston, D., Benmokrane, B., Juska, T., Morgan, R., Lesko, 45 J. J., Sorathia, U., and Reynaud, D. 2003. Durability Gap Analysis for Fiber-46

9
Reinforced Polymer Composites in Civil Infrastructure. Journal of Composites for 1 Construction, August 2003, 238–247. 2
Nkurunziza, G., Benmokrane, B., Debaiky, A. and Masmoudi, R. 2005. Effect of 3 Sustained Load and Environment on Long Term-Tensile Properties of Glass Fiber-4 Reinforced Polymer Reinforcing Bars. ACI Structural Journal, July-August 2005, 5 615-621. 6
Pultrall Inc. V-Rod Composite Reinforcing Rods. Technical Datasheet, Pultrall Inc., 7 Thetford Mines, Quebec, Canada, 2007, 7 p. 8
Seki, H., Sekijima, K.., and Konno, T. 1997. Test Method on Creep of Continuous Fiber 9 Reinforcing Materials. Proceedings of the Third International Symposium on Non-10 Metallic (FRP) Reinforcement for Concrete Structures (FRPRCS-3), Sapporo, Japan, 11 October 14-16, V. 2, 195-202. 12
Rahman, A. H., Kingsley, C. Y., Crimi, J. 1995. Behaviour of FRP Grid Reinforcement 13 for Concrete under Sustained Load. Proceedings of the Second International 14 Symposium on Non-Metallic (FRP) Reinforcement for Concrete Structures 15 (FRPRCS-2), Ghent, Belgium, October 23-25, 90-99. 16
Shoeck Bauteile GmbH. Technical Information Schoeck Combar. Technical Datasheet, 17 Shoeck Bauteile GmbH, Vimbucher Strabe 2, 76534 Baden-Baden, Germany, 18 October 2007, 32 p. 19
Yamaguchi, T., Kato, Y., Nishimura, T., and Uomoto, T. 1997. Creep Rupture of FRP 20 rods made of Aramid, Carbon, and Glass Fibers. Proceedings of the Third 21 International Symposium on Non-Metallic (FRP) Reinforcement for Concrete 22 Structures (FRPRCS-3), Sapporo, Japan, October 14-16, V. 2, 179-186. 23
Youssef, T., El-Gamal, S., El-Salakawy, E. and Benmokrane, B. 2008. Experimental 24 Results of Sustained Load (Creep) Tests on FRP Reinforcing Bars for Concrete 25 Structures. The 37th CSCE Annual Conference, Quebec City, Quebec, Canada, CD-26 ROM, 10 p. 27

10
Table 1— Physical Properties of the Six Types of GFRP bars 1
GFRP-1 9.5 mm
GFRP-2 9.5 mm
GFRP-3 12.7 mm
GFRP-4 12mm
GFRP-5 15.9 mm
GFRP-6 15.9 mm
Surface Sand coated Helical wrap/ sand coated
Sand coated
Grooved Sand
coated Helical wrap/ sand coated
Fiber content (% volume)
56.8 50.6 64.5 75.2 66.6 57.5
Longitudinal coefficient of thermal expansion
(x 10-6 oC) 7.0 6.58 6.7 5.7 8.5 7.8
Transverse coefficient of thermal expansion
(x 10-6 oC) 28.6 33.7 27.2 18.2 29.9 43.5
Density (g/cm3)
1.94 1.89 1.99 2.25 2.01 1.95
Water absorption (%)
0.31 N.A 0.15 0.12 0.18 0.52
Glass transition temperature (oC)
105 106 105 170 112 80
Cure ratio (%) 98 99 98 97 95 95
2 3 4 5 6 7 8 9 10

11
Table 2— Mechanical Properties of the tested Six GFRP bar-types as obtained from tensile tests (10 samples per bar-type). 1
Nomenclature (ACI
440.1R-06) GFRP-1 9.5 mm
GFRP-2 9.5 mm
GFRP-3 12.7 mm
GFRP-4 12mm GFRP-5 15.9 mm
GFRP-6 15.9 mm
Average ultimate tensile stress (MPa)
fu,ave
854 ± 34 828 ± 38 774 ± 38 1410 ± 23 748 ± 35 783 ± 20.5
Guaranteed tensile stress (MPa)
f*fu
(f*fu = fu,ave
- 3σ) 752 714 660 1341 643 722
Design tensile stress (MPa)
(ACI 440.1R-06) ffu = CE x f*
fu ; CE = 0.8
602 571 528 1073 514 578
Modulus of elasticity (GPa)
Ef 46.9 ± 1.2 44.8 ± 1.4 49.9 ± 2.4 66.5 ± 6.2 42.5 ± 2.7 41 ± 0.3
Average ultimate strain (µε)
εu,ave 18232 ± 767 18484 ± 868 15620 ± 956 21368 ± 1601 17712 ± 1082 19270 ± 541
Guaranteed strain (µε)
ε*fu = εu,ave - 3σ 15931 15880 12752 16565 14467 17647
Design tensile strain (µε) (ACI 440.1R-06)
εfu = CE x ε*fu 12745 12704 10202 13252 11574 14118
Allowable strain for sustained load (µε) ff,s = 0.2 x εfu 2549 2541 2040 2650 2315 2824
(ACI 440.1R-06)

12
1 Table 3—Creep-test details of GFRP bars subjected to 15% fu (Group 1) 2
Bar Type/ Diameter
Sample Number
Elastic Strain ε0
ε0/ εu
ratio* (% fu,ave)
ε0/ ε*fu
ratio*
Creep Strain (Strain Increase)
(με) after
Creep Strain-Elastic Strain ratio (% of actual initial strain)
after
1000 hrs
3000 hrs
10000 hrs
1000 hrs
3000 hrs
10000 hrs
GFRP-1 9.5 mm
(15% fu,ave)
1 2264 12.4 14.2 46 68 93 2.0 3.0 4.1
2 2268 12.4 14.2 28 101 176 1.2 4.5 7.8
3 2631 14.4 16.5 1 181 132 0.0 6.9 5.0
4 2306 12.6 14.5 8 75 166 0.3 3.3 7.2
5 2703 14.8 17.0 155 145 239 5.7 5.4 8.8
GFRP-2 9.5 mm
(15% fu,ave)
1 2032 11.0 12.8 30 -8 -12 1.5 -0.4 -0.6
2 1941 10.5 12.2 11 29 33 0.6 1.5 1.7
3 2105 11.4 13.3 10 -4 53 0.5 -0.2 2.5
GFRP-3 12.7 mm
(15% fu,ave)
1 2536 16.2 19.9 8 22 51 0.3 0.9 2.0
2 2525 16.2 19.8 26 47 92 1.0 1.9 3.6
3 2304 14.8 18.1 -34 -7 15 -1.5 -0.3 0.7
4 2497 16.0 19.6 50 83 102 2.0 3.3 4.1
GFRP-4 12 mm
(15% fu,ave)
1 2865 13.4 17.3 5 -8 19 0.2 -0.3 0.7
2 2766 12.9 16.7 17 44 61 0.6 1.6 2.2
3 3412 16.0 20.6 74 86 110 2.2 2.5 3.2
4 2775 13.0 16.8 42 66 72 1.5 2.4 2.6
GFRP-5 15.9 mm
(15% fu,ave)
1 2495 14.1 17.2 84 114 145 3.4 4.6 5.8
2 2789 15.7 19.3 47 78 118 1.7 2.8 4.2
3 2723 15.4 18.8 86 120 134 3.2 4.4 4.9
4 2497 14.1 17.3 132 165 207 5.3 6.6 8.3
GFRP-6 15.9 mm
(15% fu,ave)
1 2959 15.4 16.8 349 394 464 11.8 13.3 15.7
2 2848 14.8 16.1 193 237 276 6.8 8.3 9.7
3 3657 19.0 20.7 424 480 573 11.6 13.1 15.7
4 3298 17.1 18.7 282 313 375 8.6 9.5 11.4 3 4 5 6 7 8 9 10

13
1 Table 4— Creep-test details of GFRP bars subjected to 25% and 30% fu (Group 2) 2
Bar Type/ Diameter
Sample Number
Elastic Strain ε0
ε0/ εu,ave
ratio* (% fu,ave)
ε0/ ε*
fu
ratio*
Creep Strain (Strain Increase)
(με) after
Creep Strain-Elastic Strain ratio (% of actual initial strain)
after
1000 hrs
3000 hrs
10000 hrs
1000 hrs
3000 hrs
10000 hrs
GFRP-1 9.5 mm
1 3809 20.9 23.9 -6 48 46 -0.2 1.3 1.2 2 5674 31.1 35.6 -166 -132 -163 -2.9 -2.3 -2.9 3 5214 28.6 32.7 74 39 29 1.4 0.7 0.6 4 6021 33.0 37.8 -269 -286 -288 -4.5 -4.8 -4.8 5 5255 28.8 33.0 114 176 199 2.2 3.3 3.8
GFRP-2 9.5 mm
1 6946 37.6 43.7 702 758 819 10.1 10.9 11.8
2 5377 29.1 33.9 78 63 108 1.5 1.2 2.0
3 9006 48.7 56.7 -22 37 220 -0.2 0.4 2.4
4 5600 30.3 35.3 206 230 308 3.7 4.1 5.5
GFRP-3 12.7 mm (Set a)
1 3790 24.3 29.7 56 46 201 1.5 1.2 5.3 2 3922 25.1 30.8 57 343 472 1.5 8.7 12.0 3 4040 25.9 31.7 93 127 255 2.3 3.1 6.3 4 4542 29.1 35.6 271 263 227 6.0 5.8 5.0
GFRP-3 12.7 mm (Set b)
1 4144 26.5 32.5 3 -120 -83 0.1 -2.9 -2.0 2 3835 24.6 30.1 102 58 61 2.7 1.5 1.6 3 4005 25.6 31.4 45 61 N/A 1.1 1.5 N/A
GFRP-4 12 mm
1 4328 20.3 26.1 -9 181 166 -0.2 4.2 3.8 2 4266 20.0 25.8 112 156 201 2.6 3.7 4.7 3 3680 17.2 22.2 -19 57 61 -0.5 1.5 1.7 4 4026 18.8 24.3 59 112 77 1.5 2.8 1.95 4091 19.1 24.7 189 199 231 4.6 4.9 5.6
GFRP-5 15.9 mm
1 6613 37.3 45.7 49 101 210 0.7 1.5 3.2 2 5475 30.9 37.8 257 246 470 4.7 4.5 8.6 3 5162 29.1 35.7 294 321 339 5.7 6.2 6.6 4 5214 29.4 36.0 157 258 321 3.0 4.9 6.2
GFRP-6 15.9 mm
1 6946 37.6 43.7 702 758 819 10.1 10.9 11.8
2 5377 29.1 33.9 78 63 108 1.5 1.2 2.0
3 9006 48.7 56.7 -22 37 220 -0.2 0.4 2.4
4 5600 30.3 35.3 206 230 308 3.7 4.1 5.5
14
Table 5— Residual tensile property results for 15% fu,ave. (Group 1) samples. 1
Series (Nominal sustained
load level)
Specimen I.D.
Actual Sustained
Stress (% fu,ave)
Specimen tensile tests Residual Elastic
Modulus, Eres (GPa)
Percentage Eres / Ef Residual Strength
(MPa)fres / fu,ave % fres / f
*fu % fres / ffu %
GFRP-1 9.5 mm
1 12.4 862.7 101.0 114.7 143.4 46.34 98.8 2 12.4 865.2 101.3 115.0 143.8 47.13 100.5 3 14.4 857.0 100.4 114.0 142.5 47.26 100.8 4 12.6 865.3 101.3 115.0 143.8 46.96 100.1 5 14.8 845.4 98.9 112.4 140.5 47.31 100.9
Average 13.3 858.98 100.58 114.23 142.78 47.00 100.21 GFRP-2 9.5 mm
1 11 827.54 99.9 115.9 144.9 46.83 104.5 2 10.5 843.7 101.9 118.2 147.7 45.45 101.5
Average 10.75 835.6 100.9 117.0 146.3 46.1 103.0
GFRP-3 12.7 mm
1 16.2 792 102.3 120.0 150.0 48.70 97.6 2 16.2 780 100.8 118.2 147.7 50.94 102.1 3 14.8 777 100.4 117.7 147.2 49.10 98.4 4 16.0 801 103.5 121.4 151.7 48.96 98.1
Average 15.8 787.50 101.74 119.32 149.15 49.42 99.05
GFRP-4 12 mm
1 13.4 1375.6 97.6 102.6 128.2 64.01 96.2 2 12.9 1430 101.4 106.6 133.3 66.71 100.3 3 16.0 1375 97.5 102.5 128.2 60.46 90.9 4 13.0 1366.95 96.9 101.9 127.4 56.186 84.5
Average 13.8 1386.89 98.36 103.42 129.28 61.84 92.99
GFRP-5 15.9 mm
1 14.1 715 95.6 111.2 139.0 45.02 105.9 2 15.7 711 95.1 110.6 138.2 43.28 101.8 3 15.4 702 93.9 109.2 136.5 41.97 98.7 4 14.1 721 96.4 112.1 140.2 41.56 97.8
Average 14.8 712.25 95.22 110.77 138.46 42.96 101.08

15
GFRP-6 15.9 mm
1 14.8 799 102.0 110.7 138.4 41.61 101.5 2 19.0 801 102.3 111.0 138.8 42.16 102.8 3 17.1 762 97.3 105.6 132.0 42.22 103.0
Average 17.0 787.33 100.55 109.12 136.41 42.00 102.43

16
Table 6— Residual tensile property results 25% & 30% fu,ave. (Group 2) samples. 1
Series (Nominal sustained
load level)
Specimen I.D.
Actual Sustained Stress (% fu,ave)
Specimen tensile tests Residual Elastic
Modulus, Eres (GPa) Percentage
Eres / Ef Residual Strength (MPa)
fres / fu,ave % fres / f*
fu % fres / ffu %
GFRP-1 9.5 mm
1 31.1 829 97.1 110.2 137.8 45.20 96.4 2 28.6 862.7 101.0 114.7 143.4 48.47 103.3 3 33.0 810.9 95.0 107.8 134.8 47.61 101.5 4 28.8 815.5 95.5 108.4 135.6 47.98 102.3
Average 30.4 829.54 97.14 110.31 137.89 47.32 100.89
GFRP-2 9.5 mm
1 37.6 864.5 104.4 121.1 151.3 43.75 97.7 2 29.1 806.3 97.4 112.9 141.2 50.6 113.0 3 48.7 765.2 92.4 107.2 134.0 42.5 95.0 4 30.3 779.1 94.1 109.1 136.4 46.6 104.0
Average 36.4 803.7 97.1 112.6 140.7 45.9 104.0 GFRP-3 12.7 mm (Set a)
1 24.3 802 103.6 121.5 151.9 49.15 98.5 2 25.86 767 99.1 116.2 145.3 53.18 106.6 3 29.08 793 102.5 120.2 150.2 47.79 95.8
Average 26.40 787.33 101.72 119.29 149.12 50.04 100.28 GFRP-3 12.7 mm (Set b)
1 26.53 751 97.0 113.8 142.2 55.82 111.9 2 24.55 810 104.7 122.7 153.4 48.96 98.1 3 25.64 761 98.3 115.3 144.1 48.94 98.1
Average 25.57 774.00 100.00 117.27 146.59 51.24 102.68
GFRP-4 12 mm
1 20.25 1368.38 97.0 102.0 127.6 60.05 90.3 2 19.96 1366.90 96.9 101.9 127.4 60.89 91.6 3 17.22 1361.38 96.6 101.5 126.9 66.23 99.6 4 18.84 1394.13 98.9 104.0 130.0 69.99 105.3
Average 19.07 1372.70 97.35 102.36 127.95 64.29 96.68 GFRP-5 15.9 mm
1 37.3 705 94.3 109.6 137.1 41.65 98.0 2 30.9 732 97.9 113.8 142.3 43.33 101.9

17
3 29.1 703 94.0 109.3 136.7 39.22 92.3 Average 32.46 713.33 95.37 110.94 138.67 41.40 97.41
GFRP-6 15.9 mm
1 32.82 821.26 104.9 113.8 142.3 42.57 103.8 2 26.19 784 100.1 108.7 135.8 41.32 100.8 3 30.10 777 99.2 107.7 134.6 41.63 101.5
Average 29.70 794.09 101.42 110.06 137.58 41.84 102.04 1 2
18
1
Figure 1—GFRP bars 2 3
4
Figure 2—Specimens ready for installation 5
U pper lever armS w ivel head
F ulcrum
A pplied w eight
F ram e B ase
L oad C alib ratingsystem
F R P rebar
S ta in gauges
L ow er lever arm
T hreaded steeltube filled w ithcem en t g rout
W eigh t pan
S pherical nu t
6
Figure 3—Schematic of bar sustained load frame (magnifying frame)7
A B C

19
1 Figure 4—Creep strain evolution for samples at 15% fu,ave: 9.5 mm GFRP bars (above); 2
12 mm and 12.7 mm GFRP bars (middle); 15.9 mm GFRP bars (below) 3 4
Figure 5—Creep strain evolution for 9.5 mm GFRP bars (above) at 30% fu,ave; 12 mm and 5 12.7 mm GFRP bars at 25% fu,ave (middle); 15.9 mm GFRP bars at 30% fu,ave (below) 6

20
1
Figure 6—Enlarged samples’ cross section before applying sustained load 2
Figure 7—Enlarged samples’ cross section after exhibiting 10000 hours of loading under 3 different sustained load levels 4
GFRP-1 GFRP-2
GFRP-3
GFRP-6GFRP-5
GFRP-4
GFRP-6 (30% fu,ave)GFRP-5 (30% fu,ave)
GFRP-4 (25% fu,ave)GFRP-3 (25% fu,ave)
GFRP-2 (30% fu,ave)GFRP-1 (30% fu,ave)


![Research Article Brittle Creep Failure, Critical Behavior ...downloads.hindawi.com/journals/amse/2015/101035.pdf · ] on creep failure of concrete focus mainly on tensile and exural](https://img.dokumen.tips/doc/110x75/5f452273e03bcb5bf076190b/research-article-brittle-creep-failure-critical-behavior-on-creep-failure.jpg)


