Embed Size (px)
Citation preview
Evaluation of stress distribution patterns on short implants with differing crown heights: A Three
Dimensional Finite Element Analysis
A THESIS SUBMITTED TO THE FACULTY OF THE GRADUATE SCHOOL
OF THE UNIVERSITY OF MINNESOTA BY
Tanawat Ritkajorn, D.D.S.
IN PARTIAL FULFILLMENT OF THE REQUIREMENTS FOR THE DEGREE OF MASTER OF SCIENCE
Alex S. L. Fok, PhD.
December 2010

©Tanawat Ritkajorn, 2010

i
Acknowledgments
I would like to thank my principal advisor Dr. Alex S. L. Fok, Director of the Dental Research Center for Biomaterials and Biomechanics, School of Dentistry, University of Minnesota, for providing me with this invaluable experience in biomechanical research methodology and for allowing me access to the facilities. To the best fellow I have met thus far, Jianying Li, Ph.D., I am ever so grateful for his wise counsel and his patience in guiding me, a novice in biomechanics and finite element analysis research. I would also like to thank Dr. Andrea Hsu for her gracious advice and the proofreading of this thesis. My deepest gratitude to my Program Director, Dr. James R. Holtan, Graduate Prosthodontic Program Director, University of Minnesota, School of Dentistry, for instigating in me this drive to excel throughout my residency training and for supporting my research. Above all, I am thankful to my co-director, Dr. John K. Schulte, for being the inspiration of this short implant research and a steppingstone in my implant prosthodontic education.

ii
Dedication
To my parents, Suranart and Pradab Ritkajorn, and my aunt, Supun
Karkjanakeyoon, for their unconditional love and support. I am grateful for everything they have done to support our family. It is their
unfaltering faith, encouragement, and generous financial contribution that allowed me to pursue my education in the United States. This work is a reflection of these exceptional human beings whom I have the honor of calling parents.
iii
Abstract Statement of problem: The use of short dental implants is usually confined to areas of
the mouth with limited vertical bone height. As a result, longer implant crowns are
required to restore the occlusion with the opposing arch, leading to a disproportionate
crown-to-implant ratio (C/I ratio).
Purpose: The purpose of this study was to evaluate the stress distribution patterns on
crestal bone of short implants plateau-designed connected with different crown heights,
and to compare these findings with those of regular implants.
Material and Methods: Two implant designs (∅5 mm×6 mm and ∅5 mm×11 mm) and
abutments (∅5 mm×9 mm and ∅5 mm×5 mm) were scanned using a micro-CT scanner.
STL surface models were subsequently extracted to generate surfaces. All models were
imported to Abaqus CAE for three-dimensional non-linear finite element analysis. For
each implant model, loadings of 100, 200, and 700 N were simulated in 2 directions: pure
vertical and at an oblique angle of 15 degrees.
Results: At 100 and 200 N oblique loads, peak compressive and tensile stresses ranged
from 18.30 to 53.57 MPa and 7.39 to 43.95 MPa, respectively. At 700 N oblique loads,
the ∅5 mm×6 mm implant with long abutment model exceeded the compressive and
tensile strength of cortical bone, at 193.4 and 158.6 MPa correspondingly. For 700 N
oblique loads, increasing crown height increased peak compressive stress by 28.6 % and
peak tensile stress by 28.4 %. Stress distribution patterns showed the highest amounts of
stress located at the implant crest module in cortical bone.
Conclusion: Stress distribution patterns for the oblique loads of 100 and 200 N were
similar in all models, regardless of the C/I ratios. All peak stresses were within
physiological tolerance. At 700 N loads, increasing crown height resulted in bone failure.

iv Table of Contents
Acknowledgments i
Dedication ii
Abstract iii
Table of contents iv
List of Tables vi
List of Figures vii
Chapter I Introduction 1
Objectives 3
Hypothesis 3
Keywords 4
Limitation 4
Benefit of study 4
Chapter II Literature Review
The use and survival of short dental implants 5
Crown-to-implant ratios 8
Crestal bone loss and stress distribution 10
Finite element analysis 11
Chapter III Material and Methods 16
Chapter IV Results 23
Chapter V Discussion and Conclusion 37

v Conclusion 42
Clinical implication 42
Bibliography 43

vi
List of Tables
Table 1 Young’s Modulus and Poisson’s Ratio of Materials Used 19
Table 2 Number of elements and nodes used in FE Models 21
Table 3 Maximum Compressive Stress of all models under oblique loads of 700 N 24
Table 4 Maximum Tensile Stress of all models under oblique loads of 700 N 28
Table 5 Maximum Compressive Stress of all models under vertical loads of 700 N 32
Table 6 Maximum Tensile Stress of all models under vertical loads of 700 N 33
vii List of Figures
Figure 1. Implant and Abutment Geometry 17
Figure 2. Measurement of models 18
Figure 3. Implant-bone models 20
Figure 4. Maximum Compressive Stress in all models. 23
Figure 5. Minimum Principal Stress on Model A under oblique loads of 200 N 24
Figure 6. Minimum Principal Stress on Model B under oblique loads of 200 N 25
Figure 7. Minimum Principal Stress on Model C under oblique loads of 200 N 25
Figure 8. Minimum Principal Stress on Model D under oblique loads of 200 N 26
Figure 9. Minimum Principal Stress distribution pattern in Model B under oblique
loads of 200 N 27
Figure 10 Maximum Tensile Stress in all models. 28
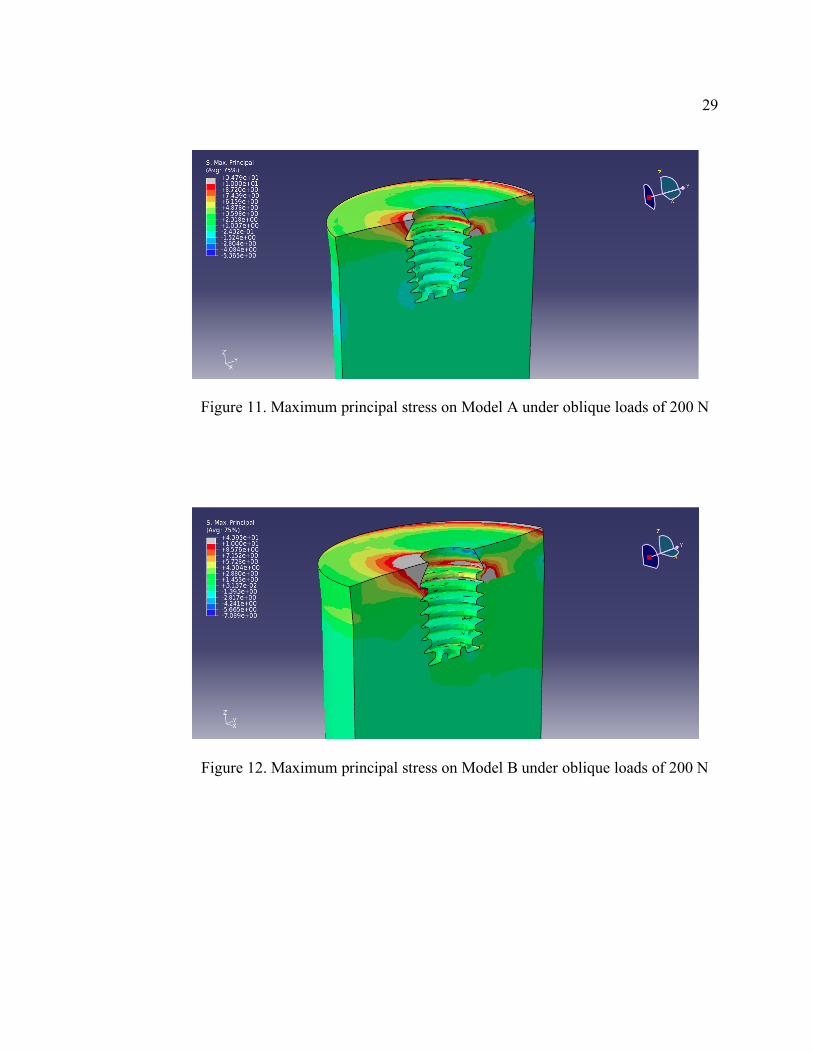
Figure 11 Maximum Principal Stress on Model A under oblique loads of 200 N 29
Figure 12 Maximum Principal Stress on Model B under oblique loads of 200 N 29
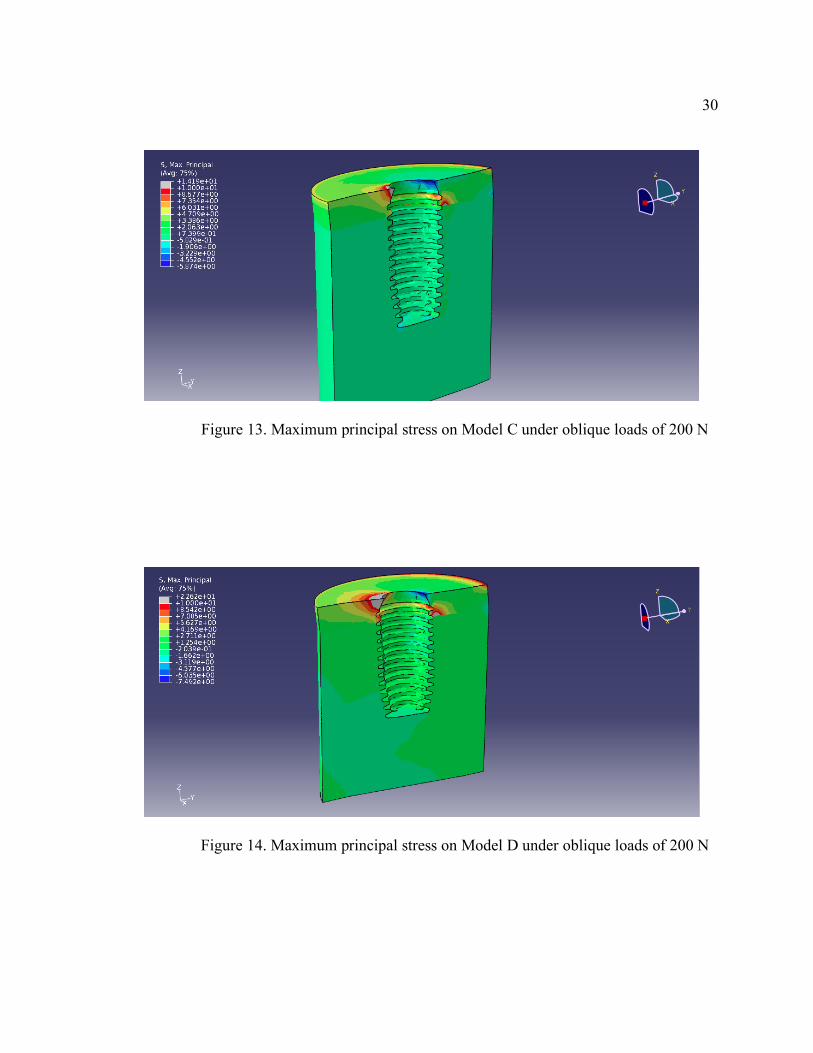
Figure 13 Maximum Principal Stress on Model C under oblique loads of 200 N 30
Figure 14 Maximum Principal Stress on Model D under oblique loads of 200 N 30
Figure 15 Maximum Compressive Stress in all models 32
Figure 16 Maximum Tensile Stress in all models 33
Figure 17 Minimum Principal Stress distribution pattern on Model B under vertical
loads of 200 N 34
Figure 18 Maximum Principal Stress distribution pattern on Model B under vertical
loads of 200 N 35

viii Figure 19. Von Mises stress along the cortical bone-implant interface on
the side of the stress concentration under vertical and oblique loads of 200 N. 36
1
Chapter I
Introduction
Background and rationale
The use of osseointegrated dental implants to restore missing portions of a
patient’s occlusion has proven to be a successful treatment modality.1-2 Factors
associated with successful osseointegration of a dental implant include implant
biocompatibility, implant surface characteristics, implant geometry, implant diameter
and implant length.3 The latter, adequate implant length, has been associated with
high implant survival rates and a favorable prognosis.4-5 However, placement of
longer implants is not always feasible due to anatomical limitations, such as the
position of the inferior alveolar nerve in the mandibular arch or the possibility of
sinus pneumatization in the maxillary arch. With resorbed alveolar ridges, bone
augmentation procedures are necessary to regain vertical height in order to
accommodate implants of the desired length. Such advanced surgical techniques,
including autogenous block grafting or nerve repositioning, are associated with a high
level of morbidity.6 Therefore, in the severely resorbed posterior edentulous areas,
placement of short implants offers a simpler alternative for patients. Not only does it
avoid potential vital structure injury, it can also shorten overall treatment time.
2 Recent literature reviews reported comparable survival rates between short
implants and standard or long implants.7-8 This interesting finding has led many
implant manufacturers to produce short implants for the benefit of patients and
clinicians. Clinical application of these implants involves mainly the posterior maxilla
and mandible where there is limited vertical bone height. When restoring these short
implants, in order to occlude with the opposing dentition, the implant crown will be
moderately longer than the implant fixture within bone. This results in a
disproportionate crown-to-implant ratio. As vertical and lateral forces are exerted on
these implant crowns, it creates a Class I lever situation. The occlusal loads on
implants may create a bending moment, increasing stress concentration on the crest of
the alveolar ridge at the implant-to-tissue interface, thus causing potential crestal bone
loss.9
Multiple methods have been used to study the influence of the biomechanical
environment on implant restorations, notably the finite element (FE) method. This
method has been used to predict stress distribution patterns in the implant-bone
interface in different clinical scenarios.10 This tool allows for an effective method of
investigation of complex systems such as the implant-bone system.
3 Objectives
1. To evaluate the stress distribution patterns on crestal bone of a short implant
(∅5 mm×6 mm, plateau-designed, press fit implant) connected to differing
crown heights.
2. To compare the stress distribution patterns on crestal bone of a short implant
(∅5 mm×6 mm) to those of a regular implant (∅5 mm×11 mm) connected to
differing crown heights.
Hypothesis
Null Hypothesis (H0)
There will be no significant difference in stress distribution patterns on crestal
bone of a short implant connected to differing crown heights. Also, there will be no
significant difference in stress distribution patterns on crestal bone of a short implant
compared to those of a regular implant connected to differing crown heights.
Alternative Hypothesis (H1)
There will be a significant difference in stress distribution patterns on crestal bone
of a short implant connected to differing crown heights. Also, there will be a significant
difference in stress distribution patterns on crestal bone of a short implant compared to
those of a regular implant connected to differing crown heights.
4 Keywords
Short dental implants
Survival
Stress distribution
Crown-to-implant ratios
Three-dimensional finite element analysis
Limitation
Due to the complexity of three-dimensional implant modeling, short implants
produced by only one manufacturer were included in the study. Other short implants
available on the market should be included in future studies to compare variations in
stress distribution patterns.
Benefits of study
This simulation generates visible stress distribution patterns on surrounding bone
of implants under loading conditions. It helps a clinician to understand and to visualize
the effect on bone after restoring a short implant with a crown having a disproportionate
crown-to-implant ratio, otherwise not observable in patients. Moreover, it predicts the
stress concentration on crestal bone when these restorations are subjected to various
loading conditions.

5
Chapter II
LITERATURE REVIEW
The use and survival of short dental implants
Crown-to-implant ratios
Crestal bone loss and stress distribution
Finite element analysis
The use and survival of short dental implants
Implant length is the dimension measured from the platform to the apex of an
implant.5 Though no universal definition is available, various authors set their own
criteria for short dental implants and most describe it as a designed intra-bony device
from 7 mm to 10 mm in length.7,11 In general, 10 mm or less is considered to be a short
dental implant. Historically, it has been recommended to use the longest implant
wherever possible.5 Advantages of increased implant length include increased initial
stability, long-term resistance to bending moment forces, expedited healing and
decreased risk of movement at the implant-bone interface.9 For these reasons, short
implants were not widely used in clinical practice.
Nowadays, there is a wide variety of application for implants, ranging from single
tooth replacement to full mouth reconstruction with a high success rate. In 1981, Adell et

6 al.’s 15-year study on osseointegrated implant in the treatment of edentulous jaws
showed success rates of 81% in the maxilla and 91% in the mandible.1 However, no data
on implant diameter and length was provided. Another longitudinal study on implant
survival followed 660 implants for 5-12 years. The authors reported a higher number of
implant loss for short Branemark implants placed in the posterior maxilla compared to
long implants. Implants of 7mm long had a failure rate of 9.5% compared to 3.8% for all
other lengths.12 As observed by Goodacre et al., the number of implants lost increased
with the use of short implants and implant placement in poor bone quality.13
Implant length and diameter in relation to implant survival was further studied by
Winkler et al.4 A total of 2917 implants were evaluated and followed for 36 months.
Shorter implants had significantly lower survival rates compared to longer implants, with
only a 66.7% survival rate for 7mm long implants. The retrospective study by Scurria et
al. analyzed a total of 384 implants placed and subsequently restored with 108
prostheses.14 It was concluded that shorter implants and implants with diameters of less
than 4 mm had decreased survival probability.14 Thus, wherever possible implants were
recommended to be as long and as wide as possible within the anatomical limitations of
the patient.
More recently, Renouard and Nisand conducted a structured review evaluating the
impact of implant length and diameter on survival rates.7 A total of 53 human studies
were included. The authors defined a short implant as one having a length of 8mm or less
and a wide diameter implant as one with a width of 4.5mm or more. The highest failure
rates for short implants were reported in the older studies, which performed routine
surgical procedures without any regard for the bone quality and used machined-surface

7 implants. The belief was that short implants had reduced bone-to-implant contact; thus,
lower survival rates were expected when compared to longer implants. For many years,
the prognosis for short implants was unclear. However, more recent studies have reported
comparable survival rates for short implants with wide diameters to those obtained with
long-implants having standard-diameters. In a retrospective study, Grant et al. studied
survival of 335 short dental implants of 8 mm in length.15 The survival rate for 8-mm
long implants placed in the mandible was 99% after 2 years. Advantages of short
implants were described as shorter treatment time, lower cost, less discomfort, less
surgical risk, and greater surgical ease. Therefore, short-length (8 mm) dental implants
would offer an effective treatment alternative to bone grafting and nerve repositioning for
the atrophic posterior mandible.
The latest review by Romeo et al. analyzed the literature published from 2000 to 2008
comparing short implants (10 mm or less) to standard/long ones.16 A total of 13 articles
were included in this review. Most of the studies reported different survival rates for
short and standard implants, though the difference was insignificant. In the same year, a
retrospective cohort study evaluated the survival rates of short dental implants in the
posterior jaws. These implants were followed for 1-8 years.17 Six hundred and sixty one
patients received 1287 short Biotechnology Institute (BTI) implants (≤8.5 mm) from
2001 to 2008. This study showed an implant-based survival rate of short implants of
99.3% with 1-8 years of follow up. The authors suggested that the use of short implants
following strict clinical protocols could achieve predictable outcomes. Most of the
current publications show similar survival rates for short and standard implants. These
8 authors emphasize that treatment planning is a key factor for the success of short
implants.
Rough implant surfaces have also been evaluated for their effect on implant survival.
Kotsovilis et al. conducted a systematic review and meta-analysis on the effect of implant
length on the survival of rough-surface dental implants.8 Thirty-seven articles met the
inclusion criteria. The meta-analysis revealed no statistically significant difference in the
survival between short (≤ 8 or <10 mm) and conventional (≥10 mm) rough-surface
implants placed in totally or partially edentulous patients. When the placement of
conventional implants was impossible or when extensive advanced surgical procedures
was required, it was recommended that clinicians use short implants as an efficacious
treatment modality for the replacement of missing teeth in totally and partially edentulous
patients.
Crown-implant ratios (C/I)
The crown-to-implant (C/I) ratio is the relationship between the length of the
crown and the length of the implant embedded in bone. Implant length is the
measurement from the apex to the most coronal bone-implant contact, while crown
length is the distance from the occlual surface of the crown to the most coronal bone-
fixture contact. A favorable C/I ratio guideline has not been established in the dental
literature unlike crown-to-root ratios for natural teeth, which has been helpful for
clinicians in determining prognosis of treated teeth.
9 In general, it is assumed that the use of short implants with limited alveolar bone
height due to resorption leads to a greater C/I ratio. Under occlusal forces, the implant
crown acts as a lever arm. This creates a bending moment and transfers the stress to the
peri-implant crestal bone which may cause bone resorption.18 Crestal bone remodeling is
an initial predicting factor for implant failure. As the crestal bone resorption progresses,
the crown height increases. The stress in the cancellous bone also increases and implants
subjected to lateral load may result in implant failure.18
Lately, interesting new findings have been reported regarding the effect of C/I
ratio on surrounding bone. Blanes et al. conducted a longitudinal prospective study on the
influence of C/I ratio on crestal bone loss around dental implants placed in the posterior
region.19 The results showed the mean clinical C/I ratio was 1.77. Cumulative survival
rates for the group with a C/I ratio equal to or greater than 2 was 94.1%. Contrary to
general belief, higher C/I ratio was associated with less crestal bone loss.
A systematic review of 2 selected randomized-controlled clinical trials with at
least a 4 year follow-up period showed that C/I ratio of implant-supported restorations
did not influence the peri-implant crestal bone loss.20 Schulte et al. was the first to
evaluate the C/I ratio on single tooth implant-supported restorations and to compare it to
the guideline established for crown-to-root ratio of natural teeth.21 A total of 889 single
tooth implants were included in the study. The survival rate was 98.2 % with a mean
follow-up time of 2.3 years and the mean C/I ratio of implants in function was 1.3. It was
suggested that the guideline used for natural teeth should not be applied to potential
implant sites or existing implant-supported restorations. In 2010, a radiographic
retrospective cohort study by Birdi et al. investigated the C/I ratio of single implant-
10 supported restorations on short-length plateau-design implants.22 In this study, three
hundred and nine plateau-design implants with either 5.7 mm or 6 mm in length were
investigated. Mean follow-up time was 20.9 months. Mean C/I ratio was 2.0. The average
mesial and distal first bone-to-implant contact levels were 0.2 and 0.2 mm, respectively.
There was no association between C/I ratio and first bone-to-implant contact levels. It
was concluded that C/I ratio did not affect the success of the short-length plateau-design
implants.
Crestal bone loss and stress distribution
The majority of clinical complications of osseointegrated implants are related to
biomechanical factors, such as types of prosthesis and implant length.13 The close
apposition of bone to the titanium implant is the essential feature that allows for
transmission of stress from the implant to the bone without any appreciable relative
motion or abrasion.23
A key factor for the success or failure of a dental implant is the manner in which
stress is transferred to the surrounding bone.24 Factors influencing load distribution on
implants include gender, age, location of implant in the arch, and parafunctional habits.25
When the implants are subjected to unfavorable occlusal forces, stress accumulates in the
crestal region and crestal bone remodeling is observed. Crestal bone loss has been
observed around the permucosal area of dental implants for decades. Crestal bone
stability is one of the criteria used to evaluate the success of dental implants.26,27 Adell et
al. were the first to quantify the amount of crestal bone loss in a 15-year study on
osseointegrated implants on edentulous jaws. 1 Marginal bone loss was measured at the
11 time the abutment was connected, then 6 and 12 months postoperatively. These non-
loaded implants already exhibited a mean bone loss of 1.5 mm during the healing period
and the first year after abutment connection. Thereafter, only 0.1 mm of marginal bone
was lost annually in the group observed for 5-9 years. Branemark et al. also reported a 1
to 1.5 mm crestal bone loss during the first year after abutment connection.27 This crestal
bone loss was attributed to surgical trauma at the time of implant placement. After the
initial crestal bone loss, only 0.1 mm bone loss per year would be expected.
Finite element analysis
The finite element method (FEM) is a numerical method of analysis for stresses
and deformations in structures of any given geometry. The structure is discretized into the
so-called “finite elements” which are connected through nodes. This method has become
one of the most successful engineering computational methods and the most useful
analytical tool for decades.
Finite element analysis (FEA) has been extensively used to predict biomechanical
performance of dental implant.10 It allows researchers to investigate stress distribution at
the implant-bone interface within cortical and trabecular bone. Implant geometry causing
unfavorable stress distribution patterns may contribute to pathologic bone resorption or
bone atrophy.24 Due to the complexity of the implant-bone system, FEA was considered
to be the most suitable tool for analysis.
Load transfer at the implant-bone interface depends on the type of loading,
material properties of the implant, implant geometry, implant length and implant

12 diameter.24 Also, specific morphological characteristics of various commercial dental
implants affects clinical performance. Among these factors, FEA has been applied
extensively to study different components of implant geometry, namely the implant-
abutment connection, the crest module of an implant, and the implant length.
There is a large amount of literature available on implant-abutment connections.
Chun et al. studied the type of implant abutment and its influence on stress distribution in
bone under various loading conditions using FEA.29 The authors concluded that implant-
abutment connection affected stress distribution in bone, with the internal-hex implant
system generating the lowest Von Mises stress possible under all loading conditions
evaluated. Meanwhile, Kitagawa et al. used a nonlinear transient dynamic analysis under
impulsive loadings to compare internal-hex, taper connection implants (Ankylos) and
external-hex implant connection.30 Findings revealed greater movement associated with
the external-hex connection as compared to the tapered connection. In addition,
differences were observed in the rotation of components between dental implant systems
using a taper or an external-hex connection. A subsequent FEA study by Quaresma et al.
showed that internal-hex connection produced higher stresses on the alveolar bone
compared to the conical connection.31 Based on the results from using a simulated 3D
model of an external-hex implant connected to different abutment size, Maeda et al.
suggested the use of a smaller diameter abutment with a larger implant diameter
(platform-switching configuration). This configuration offered various biomechanical
advantages as it shifted the stress concentration area away from the crestal bone.32 Tabata
et al. presented similar results with a platform-switched implant using 2D FEA. Superior
biomechanical behavior was noted in terms of the stress distribution in the implant
13 fixture. This implant design had better stress distribution on the bone, showing a
reduction in the maximum stress by 80%.33 However, there was higher stress
concentration in the crown and retention screw.
Furthermore, studies have been conducted focusing on the relation between the
crest module of an implant and the stress in the bone. Shi et al. described the optimized
dental implant design that reduced crestal bone stress. In this 3D optimized design, the
important features required to reduce the peak stress at the crestal bone are a tapered crest
module and wider implant diameter.34 These findings are supported by Bozkaya et al.
That study evaluated how the external contour of an implant contributed to various bone
failure modes.35 Through 2D FEA, the crest module of implant with narrowing cross-
sections at the top of the cortical bone created more favorable load transfer characteristics
in single-tooth implants. Thus, this body and thread design for a dental implant were
advocated to minimize stress distribution on bone.36-37
Implant length is another topic of interest that has been analyzed by many studies,
most of which used FEA. The optimal length of a dental implant is difficult to define but
past studies have shown that implant length is more important than implant diameter at
reducing bone stress and achieving implant stability. Li et al. used this method to define
the optimal implant diameters and length in posterior maxillary type IV bone .38 Included
in the study were implant diameters ranging from 3.0 to 5.0 mm, and implant lengths
ranging from 6.0 to 14 mm. It was suggested that implants wider than 4 mm and longer
than 9 mm were the optimal selection for implants planned in type IV bone. Around
immediately loaded implants, Ding et al. showed that increasing implant diameter and
length resulted in lessened stress and strain on the crestal bone. 39 However, implant
14 diameter had a more significant effect than length to relieve the crestal stress and strain
concentration. This study exerted vertical and oblique loading of 150 N on seven implant
designs, which resulted in combinations of implant diameters ranging from 3.3 to 4.8 mm
and lengths ranging from 6 to 14 mm.
Subsequently, Baggi et al. studied the influence of implant diameter and length on
stress distribution of 5 different implant designs.40 Numerical results also suggested that
implant diameter might be more effective than implant length at minimizing stress
distribution around the bone. In addition to implant length and diameter, Anitua et al. also
examined the influence of implant geometry on stress distribution.17 A force of 150 N
was applied at an angle of 30 degrees. The four-implant systems studied (Tiny, Interna
Universal, Interna Plus, and Interna Wide) showed there was a significantly greater effect
of implant diameter on stress distribution in bone than implant length or geometry.
Maximum stress was located around the neck of the implant and distributed in the bone
adjacent to the first six threads of the implant. This could possibly imply that use of short
and wide implants may be a reasonable alternative in limited bone scenarios.
In addition to implant length and diameter, another study evaluated the influence
of implant taper on strains in the crestal bone using 3D FEA.41 Petrie and Williams used
various implants with a diameter ranging from 3.5 to 6 mm, length ranging from 5.75 to
23.5 mm and a taper form ranging from 0 to 14 degrees: this allowed for a total of 16
implant designs. These implants were subjected to oblique occlusal loading (200 N
vertical and 40 N horizontal). While evaluating the maximum shear strain in the crestal
bone, the authors found that increasing implant length and diameter reduced strain on
15 bone. Hence, the use of a wide and relatively long untapered implant seems to be the
most favorable choice.
Resorption patterns around implants caused by stress on crestal bone were
analyzed by Kitamura et al.18 The authors evaluated both pure vertical resorption and
conical resorption. With the pure vertical resorption models, as the bone resorption
progressed, implant crown height automatically increased. The stresses of the cortical and
cancellous bone increased with resorption depth.
Recently, the use of short implant for patients has increased due to the reported
increased survival rates. More than 220 implant brands have been identified, produced by
about 80 manufacturers. Implants are manufactured and sold without providing any clear
evidence to the claims of alleged benefits of specific morphological characteristics of
dental implants.42 One such implant system (Bicon; Bicon Inc, Boston, Mass)
incorporates the taper shoulder, locking taper connection, and smaller abutment diameter.
Although this system offers short implants to the market, there has been no investigation
using the FE method to analyze the effect of such short and wide dental implants
connected to differing crown heights. Therefore, the purpose of this study is to evaluate
the stress distribution patterns on crestal bone of a short implant (∅5 mm×6 mm, plateau-
designed, press fit implant) connected to differing crown heights. Additionally, this study
will evaluate the stress distribution patterns on crestal bone for a short implant (∅5
mm×6 mm.) and compare those findings to regular implants (∅5 mm×11 mm.)
connected to similar crown heights.
16
Chapter III
Material and methods
Material
Dental implant (Bicon; Bicon Inc, Boston, Mass) ∅5 mm×6 mm Integra-CPTM Part
Number 260-350-306
Dental implant (Bicon; Bicon Inc, Boston, Mass) ∅5 mm×11 mm Integra-CPTM Part
Number 260-350-311
Abutment ∅5 mm×5 and ∅5 mm×9 mm, zero degree, 3 mm post, Part Number 260-
350-050
A micro-CT scanner (X-TEK XT H 225;Metris, Leuven, Belgium)
Methods
Software used
Altair Hypermesh (Hyperworks; Altair Engineering, Inc, Troy, Mich)
Amira (Amira;Visage Imaging GmbH, Berlin, Germany)
VG Studio Max 2.0 (VG Studio Max 2.0; Volume graphics GmbH, Heidelberg,
German)
CTpro (Metris; Leuven, Belgium)
Abaqus CAE, (ABAQUS CAE; Hibbitt, Karlsson & Sorensen, Inc, Plymouth, Mich)
17
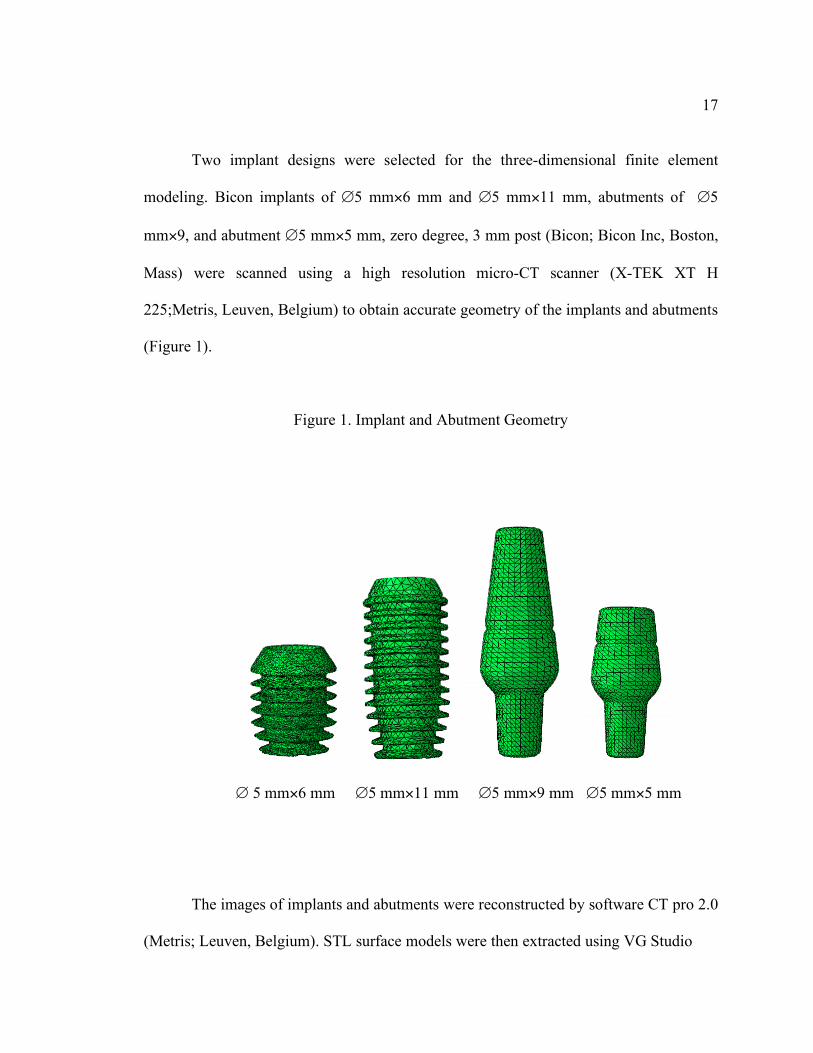
Two implant designs were selected for the three-dimensional finite element
modeling. Bicon implants of ∅5 mm×6 mm and ∅5 mm×11 mm, abutments of ∅5
mm×9, and abutment ∅5 mm×5 mm, zero degree, 3 mm post (Bicon; Bicon Inc, Boston,
Mass) were scanned using a high resolution micro-CT scanner (X-TEK XT H
225;Metris, Leuven, Belgium) to obtain accurate geometry of the implants and abutments
(Figure 1).
Figure 1. Implant and Abutment Geometry
∅ 5 mm×6 mm ∅5 mm×11 mm ∅5 mm×9 mm ∅5 mm×5 mm
The images of implants and abutments were reconstructed by software CT pro 2.0
(Metris; Leuven, Belgium). STL surface models were then extracted using VG Studio
18 Max 2.0 (VG Studio Max 2.0; Volume graphics GmbH, Heidelberg, German). The STL
files were imported to Amira (Amira; Visage Imaging GmbH, Berlin, Germany) in order
to generate surfaces of implants and abutments. Mesh refinement and modeling were
performed using Hypermesh (Hyperworks; Altair Engineering, Inc, Troy, Mich). The
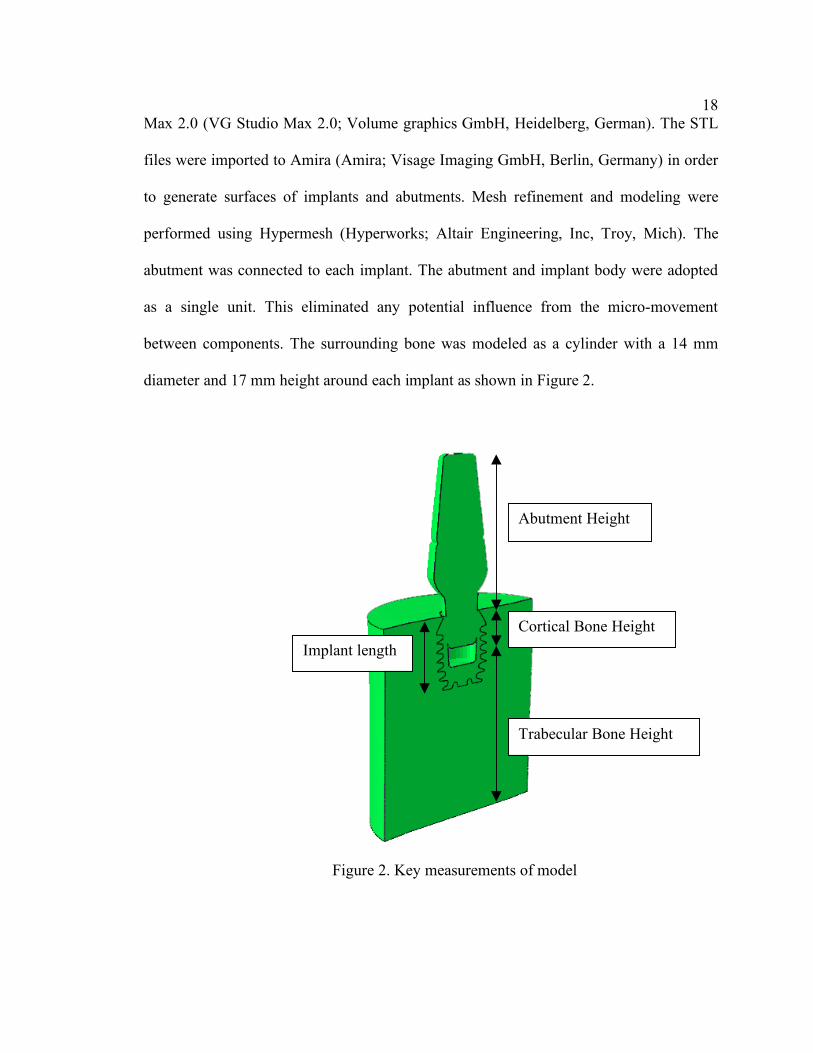
abutment was connected to each implant. The abutment and implant body were adopted
as a single unit. This eliminated any potential influence from the micro-movement
between components. The surrounding bone was modeled as a cylinder with a 14 mm
diameter and 17 mm height around each implant as shown in Figure 2.
Figure 2. Key measurements of model
Abutment Height
Cortical Bone Height
Trabecular Bone Height
Implant length

19 The bone model was sufficiently large compared to the implant dimensions such
that the boundary conditions were irrelevant over the area analyzed for stress distribution.
Gingival soft tissues were not modeled as they were much softer than the other
components. Cortical bone and trabecular bone were assumed to be homogenous,
isotropic, and linearly elastic and the material properties used in the 3D FE model are
shown in Table 1. These properties represent type II bone quality.43 This bone has a thick
cortical layer surrounded by dense trabecular bone of favorable strength.
Table 1. Young’s Modulus and Poisson’s Ratio of Materials Used.
Materials Young’s Modulus (GPa) Poisson’s
ratio
Abutment(Ti6Al4V)29,35-36,41 114 0.34
Implant (Ti6Al4V) 29,35-36,41 114 0.34
Cortical bone44,35-36 14.0 0.32
Trabecular bone34,46 1.37 0.40
Cortical bone and trabecular bone were separated. Cortical bone was modeled to
the same level as the implant platform. The thickness of cortical bone was assumed to be
2 mm.29 Tetrahedral iso-parametric elements were used for the mesh. The external
surfaces of the bone model were constrained on the vertical walls and the inferior wall of
the bone models. Nonlinear contact with a frictional coefficients of 0.2 was assumed
between the abutment and implant in the locking taper connection. Implants were
considered to be perfectly osseointegrated.

20
Stress analysis was performed for four models: Model A, a short implant (∅5
mm×6 mm) connected with a regular abutment (∅5 mm×5 mm); Model B, a short
implant (∅5 mm×6 mm) connected with a long abutment (∅5 mm×9 mm); Model C, a
regular implant (∅5 mm×11 mm) connected with a regular abutment (∅5 mm×5 mm) as
a control model; and Model D, a regular implant (∅5 mm×11 mm) connected with a long
abutment (∅5 mm×9 mm) (Figure 3). This resulted in a C/I ratio of 1.33/1, 2/1, 0.7/1,
1.09/1 for Model A, B, C, and D respectively. (Figure 3)
Figure 3. Implant-bone models
Model A Model B Model C Model D
The number of elements and nodes contained in the models are given in Table 2.
21
Table 2. Number of elements and nodes used in the FE models
Components Number of Elements Number of Nodes
Bicon implant (5×11 mm) 42225 11732
Bicon implant (5×6 mm) 26656 7638
Long abutment 11972 2944
Abutment 8165 2097
Cortical bone 38687 9073
Cancellous bone 107604 24178
All models were imported to Abaqus CAE, (ABAQUS CAE; Hibbitt, Karlsson &
Sorensen, Inc, Plymouth, Mich) for analysis. Two loading conditions were simulated on
each implant model: pure vertical and oblique loads. An oblique load was simulated by
applying a 100 N load at a 15-degree angle from the vertical axis to the central node on
the occlusal surface of the abutment. This consisted of a 96.3 N vertical component and a
26.8 N lateral component.44,45 Also, additional loading conditions included the
application of a 200-N and a 700-N (overload condition) oblique force. The 100, 200, and
700 N (overload condition) pure vertical loading conditions were also tested. The 700 N
was assumed to be forces generated by bruxers which are as much as four to six times
higher than those of non-bruxers.47 Since bone can be classified as a brittle material, the
principal stresses were used to evaluate the stress distribution pattern around the crestal
region. The highest maximum and minimum principal stresses exerted on the bone of
each model were used for comparison. Stress distribution patterns along each implant
22 were analyzed and compared among the 4 models.
Bone failure can be defined as local fracture of the bone due to excessive local
loads. Assuming that ultimate bone strength is the physiological limit, local overloading
at cortical bone occurs during compression, at a maximum compressive principal stress
exceeding 170-190 MPa in modulus, and under tension, at a maximum tensile principal
stress exceeding 100-130 MPa.41 Similarly, in trabecular bone, local overloading occurs
when the most tensile principal stress and/or the most compressive principal stress
exceeds 5 MPa.41
23
Results
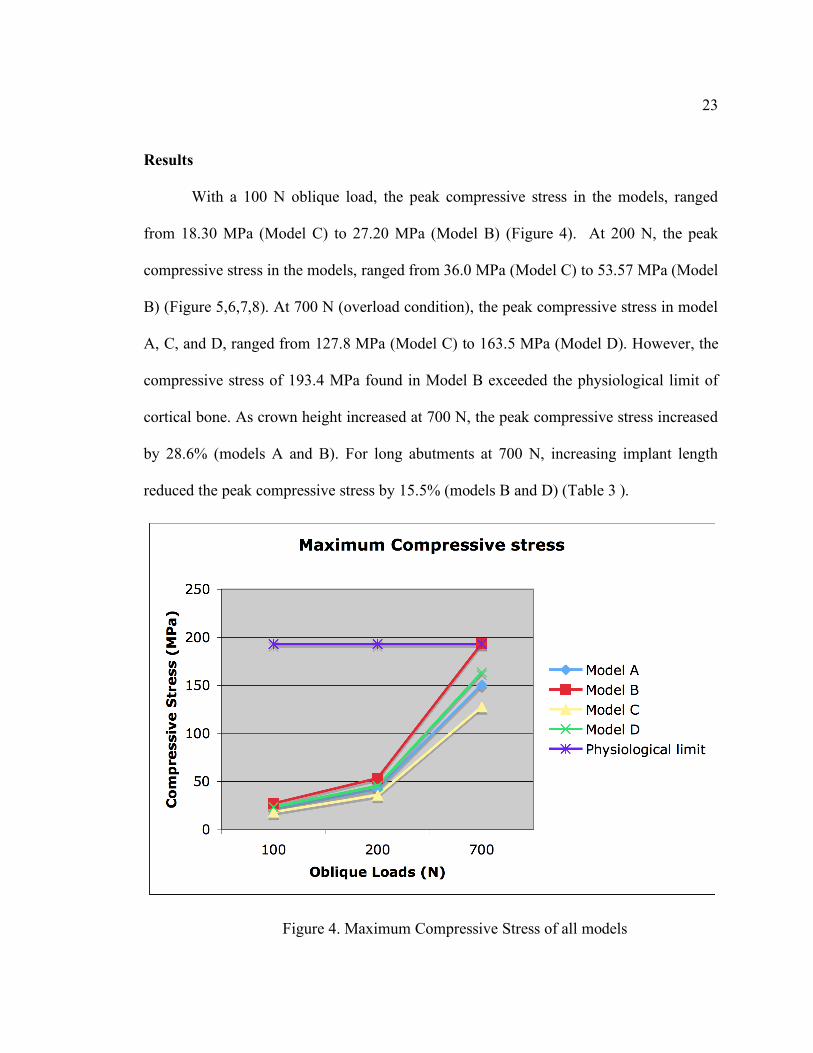
With a 100 N oblique load, the peak compressive stress in the models, ranged
from 18.30 MPa (Model C) to 27.20 MPa (Model B) (Figure 4). At 200 N, the peak
compressive stress in the models, ranged from 36.0 MPa (Model C) to 53.57 MPa (Model
B) (Figure 5,6,7,8). At 700 N (overload condition), the peak compressive stress in model
A, C, and D, ranged from 127.8 MPa (Model C) to 163.5 MPa (Model D). However, the
compressive stress of 193.4 MPa found in Model B exceeded the physiological limit of
cortical bone. As crown height increased at 700 N, the peak compressive stress increased
by 28.6% (models A and B). For long abutments at 700 N, increasing implant length
reduced the peak compressive stress by 15.5% (models B and D) (Table 3 ).
Figure 4. Maximum Compressive Stress of all models
24
Implant length
Abutment Height
6 mm
11 mm
5 mm
150.4 MPa
127.8 MPa
9 mm
193.4 MPa
163.5 MPa
Table 3. Maximum Compressive Stress of all models under oblique loads of 700 N
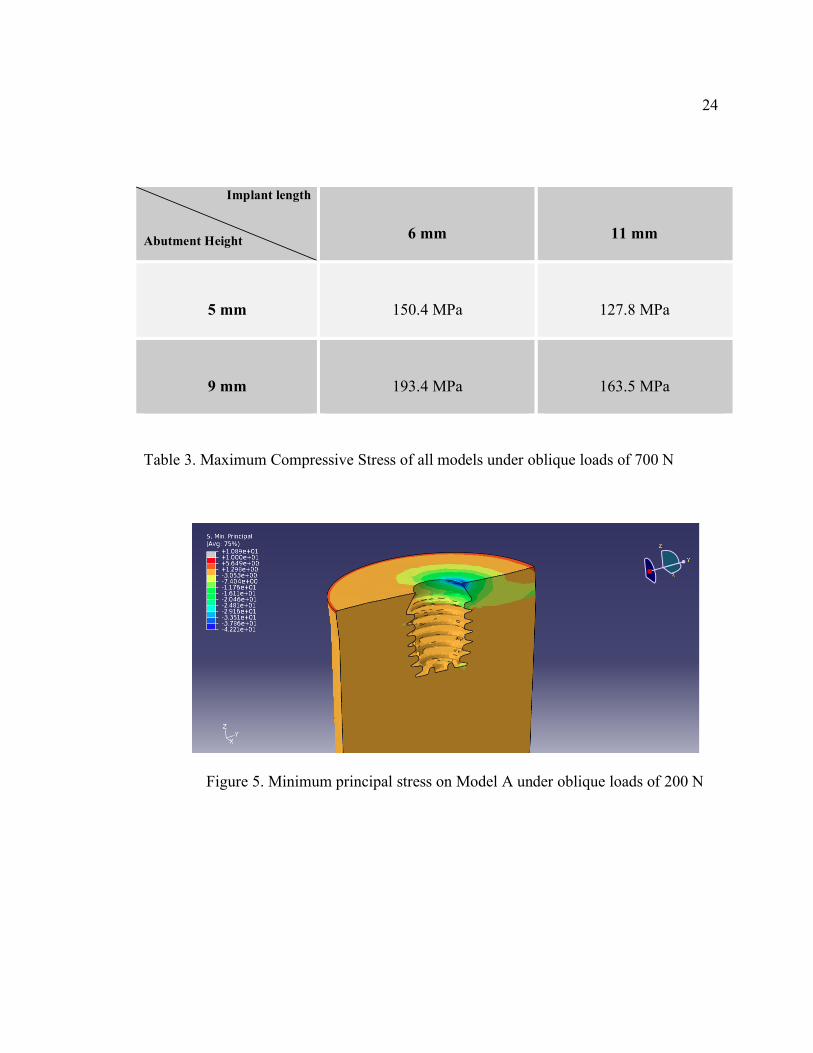
Figure 5. Minimum principal stress on Model A under oblique loads of 200 N
25
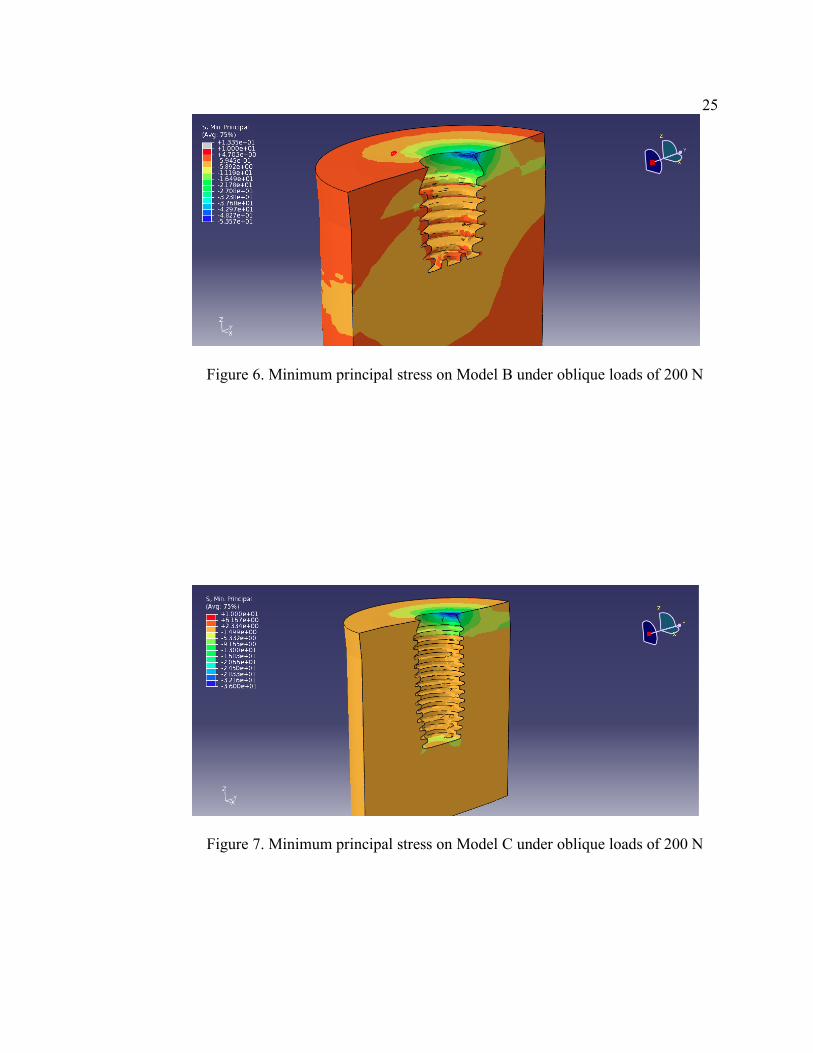
Figure 6. Minimum principal stress on Model B under oblique loads of 200 N
Figure 7. Minimum principal stress on Model C under oblique loads of 200 N
26
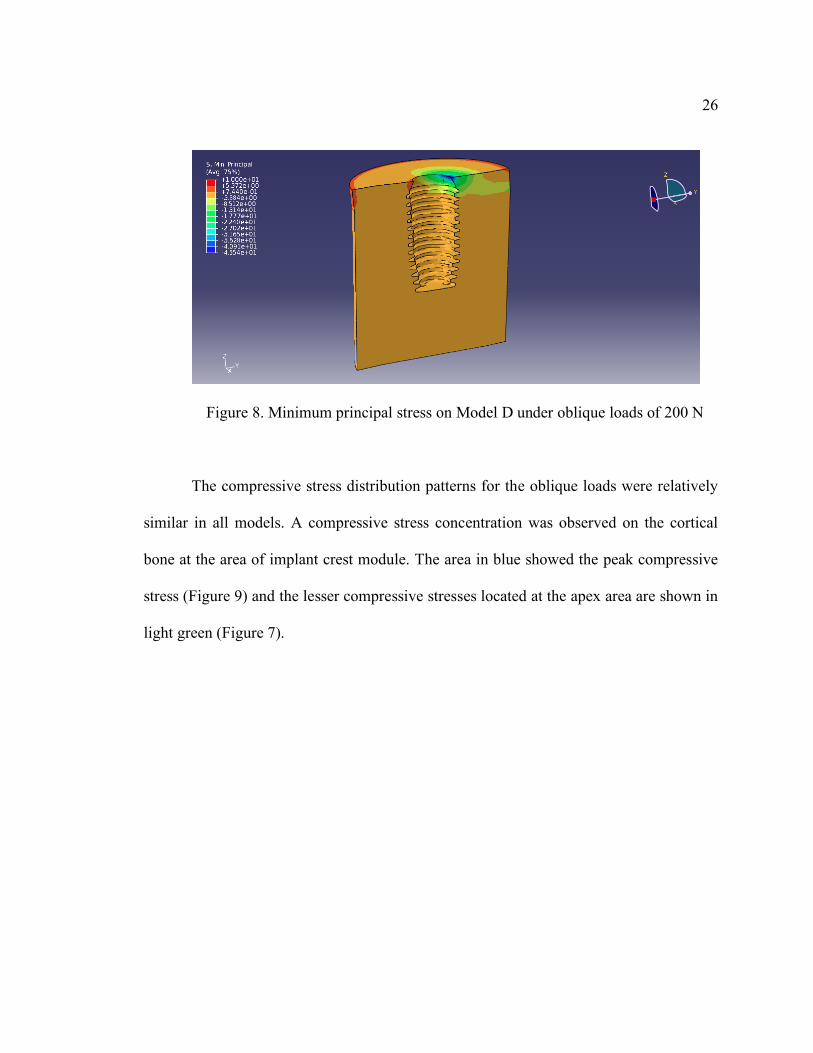
Figure 8. Minimum principal stress on Model D under oblique loads of 200 N
The compressive stress distribution patterns for the oblique loads were relatively
similar in all models. A compressive stress concentration was observed on the cortical
bone at the area of implant crest module. The area in blue showed the peak compressive
stress (Figure 9) and the lesser compressive stresses located at the apex area are shown in
light green (Figure 7).
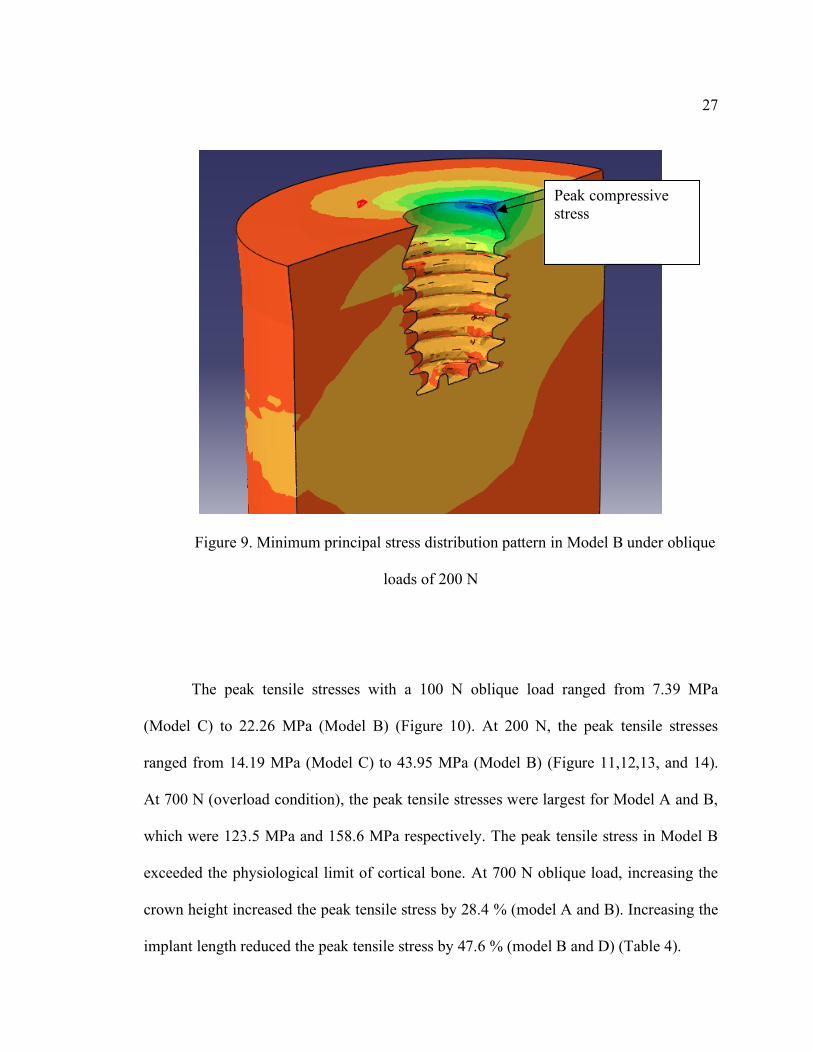
27
Figure 9. Minimum principal stress distribution pattern in Model B under oblique
loads of 200 N
The peak tensile stresses with a 100 N oblique load ranged from 7.39 MPa
(Model C) to 22.26 MPa (Model B) (Figure 10). At 200 N, the peak tensile stresses
ranged from 14.19 MPa (Model C) to 43.95 MPa (Model B) (Figure 11,12,13, and 14).
At 700 N (overload condition), the peak tensile stresses were largest for Model A and B,
which were 123.5 MPa and 158.6 MPa respectively. The peak tensile stress in Model B
exceeded the physiological limit of cortical bone. At 700 N oblique load, increasing the
crown height increased the peak tensile stress by 28.4 % (model A and B). Increasing the
implant length reduced the peak tensile stress by 47.6 % (model B and D) (Table 4).
Peak compressive stress

28
Figure 10. Maximum Tensile Stress of all models
Implant length
Abutment Height
6 mm
11 mm
5 mm
123.5 MPa
51.5 MPa
9 mm
158.6 MPa
83.0 MPa
Table 4. Maximum Tensile Stress of all models under oblique loads of 700 N
29
Figure 11. Maximum principal stress on Model A under oblique loads of 200 N
Figure 12. Maximum principal stress on Model B under oblique loads of 200 N
30
Figure 13. Maximum principal stress on Model C under oblique loads of 200 N
Figure 14. Maximum principal stress on Model D under oblique loads of 200 N
31
The tensile stress distribution patterns for the oblique loads were relatively similar
in all models. A tensile stress concentration was observed in the cortical bone at the area
of the implant crest module on the same side as the point of loading (in grey color)
(Figure 11,12,13, and14). Tensile stresses also accumulated at the junction between the
cortical bone and trabecular bone opposite to the point of loading.
For pure vertical loads, all models showed comparable peak compressive stresses
regardless of implant length and crown height (Figure 15). At 700 N (overload
condition), the peak compressive stress ranged from 54.0 to 70.87 MPa (Table 5); while
peak tensile stresses were highest in Model A and B, at 73.72 MPa and 77.98 MPa,
respectively(Table 6). Under overload conditions, lower peak tensile stresses were
observed in Model C with 35.76 MPa, and in model D with 36.43 MPa. (Figure 16)
Increasing the crown height increased the peak tensile stress by 5.7 % (model A and B).
For long abutments (model B and D), increasing implant length reduced the peak tensile
stress by 53.28 % (Table 6).
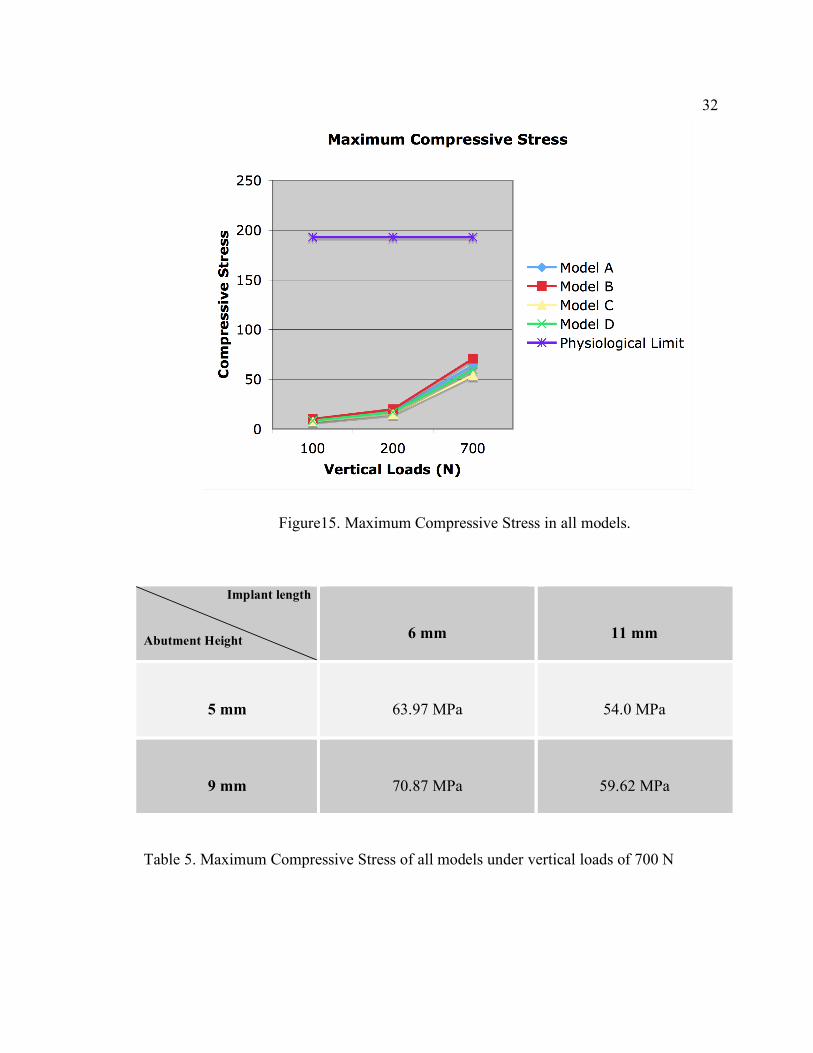
32
Figure15. Maximum Compressive Stress in all models.
Implant length
Abutment Height
6 mm
11 mm
5 mm
63.97 MPa
54.0 MPa
9 mm
70.87 MPa
59.62 MPa
Table 5. Maximum Compressive Stress of all models under vertical loads of 700 N

33
Figure 16. Maximum Tensile Stress in all models.
Implant length
Abutment Height
6 mm
11 mm
5 mm
73.72 MPa
35.76 MPa
9 mm
77.98 MPa
36.43 MPa
Table 6. Maximum Tensile Stress of all models under vertical loads of 700 N
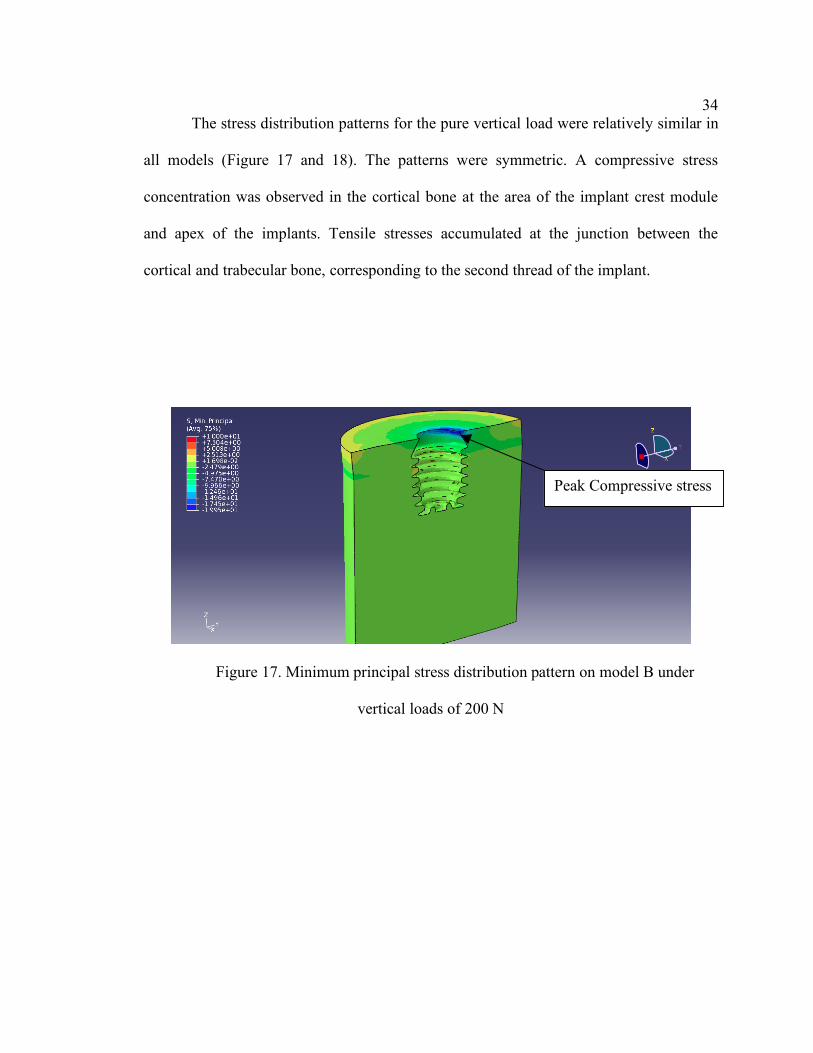
34 The stress distribution patterns for the pure vertical load were relatively similar in
all models (Figure 17 and 18). The patterns were symmetric. A compressive stress
concentration was observed in the cortical bone at the area of the implant crest module
and apex of the implants. Tensile stresses accumulated at the junction between the
cortical and trabecular bone, corresponding to the second thread of the implant.
Figure 17. Minimum principal stress distribution pattern on model B under
vertical loads of 200 N
Peak Compressive stress
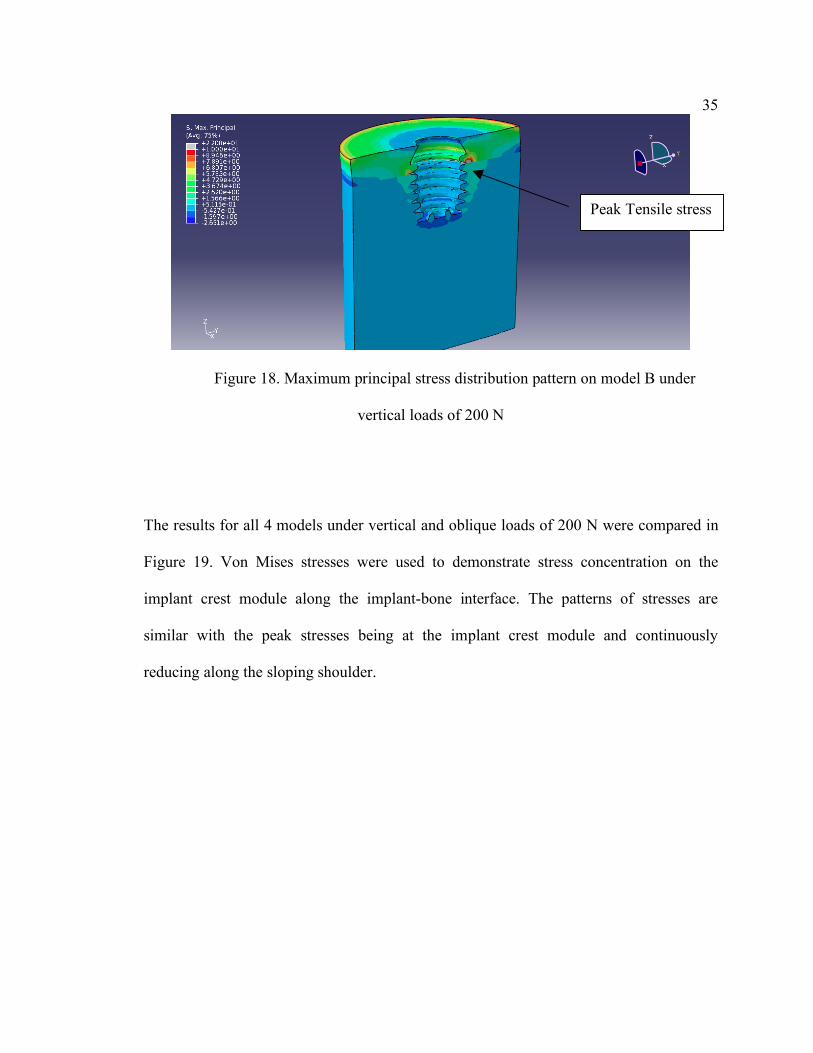
35
Figure 18. Maximum principal stress distribution pattern on model B under
vertical loads of 200 N
The results for all 4 models under vertical and oblique loads of 200 N were compared in
Figure 19. Von Mises stresses were used to demonstrate stress concentration on the
implant crest module along the implant-bone interface. The patterns of stresses are
similar with the peak stresses being at the implant crest module and continuously
reducing along the sloping shoulder.
Peak Tensile stress

36
O200A = Model A under an oblique load of 200 N
O200B = Model B under an oblique load of 200 N
O200C = Model C under an oblique load of 200 N
O200D = Model D under an oblique load of 200 N
V200A = Model A under a vertical load of 200 N
V200B = Model B under a vertical load of 200 N
V200C = Model C under a vertical load of 200 N
V200D = Model D under a vertical load of 200 N
Figure 19. Von Mises stress along the cortical bone-implant interface on the side of the
stress concentration under vertical and oblique loads of 200 N.
O200B
O200A
O200D O200C
V200A V200D
V200B
V200C
37 Discussion
The purpose of this study was to use three-dimensional FE models to evaluate the
stress distribution patterns on crestal bone of short implants connected to different crown
heights, and to compare these results to those obtained on regular implants. In order to
simplify the study, no restorations were placed on the abutments for ease of
manipulation, cost-effectiveness and simplicity. Since these simplifying measures were
applied to all models, assumptions from one model can be directly compared to the other
without affecting the final conclusions.
The data rejects the null hypothesis as there was a significant difference in stress
distribution patterns on crestal bone of a short implant connected to different crown
heights. Also, there was a significant difference in stress distribution patterns on crestal
bone of a short implant compared to those of a regular implant connected to different
crown heights
For a given implant geometry, the results of this study showed that the
compressive and tensile stress distribution patterns on a Bicon implants were
concentrated in the cortical bone at the area of the implant crest module and at the apex
of the implant. The observed patterns were in agreement with the shape optimized
implant design proposed by Shi et al that was similar to the Bicon design.34 The authors
used a 3D optimized dental implant design to show the important features necessary to
reduce the peak stress at crestal bone: a tapered crest module and a wider diameter of
implant.34 Similar results were reported by Bozkaya et al., in a 2D FEA study evaluating
the effects of implant external contour on bone failure modes. 35 The crest module of an
38 implant with narrowing cross-sections at the top of the cortical bone created more
favorable load transfer characteristics for single-tooth implants. 35 Winkler et al4 , Bahat
et al12 and Goodacre et al13 reported the unfavorable survival rate of short implants
compared to regular implants. For those studies, short implants used were mainly
machined surface external hexagon design or hydroxyapatite-coated cylinder design.4,12,13
Unlike the present study that used the tapered crest module, rough surface, plateau design
which similar to the optimized implant design by Shi et al. This may result in the
different load transfer characteristics of implants leading to the different survival rates.
For this study, a cone beam computed tomography scan was not used to derive the
bone models. Rather, these bone models were computer-generated. However, when
compared to the study by Shi et al, similar trends were found for the Von Mises stresses
at the bone-implant interface.34 This present study showed that stresses concentrated on
the implant crest module and continuously reduced along the sloping shoulder. Also,
short implants showed the higher Von Mises stresses at the crestal region compared to
regular implants as shown in Figure 19.
Of the loading conditions selected, the 15-degree angle oblique loads of 100 and
200 N were chosen to be tested because these forces were comparable to in vivo forces of
mastication. These forces are biologically feasible actions that can be performed on an
implant in vivo.44,45 Oblique loads represent a more realistic scenario of mastication than
forces applied only in the occlusal directions. For a given force, oblique forces will cause
the highest localized stress in the cortical bone.24 In fact, under static force
measurements, Helkimo et al. indicated that the average biting force is 100-150 N in
adult males, who have a higher biting force than females.45
39 Shulte et al. measured the C/I ratio of single tooth implant-supported restorations
with a survival rate of 98.2 % and reported a mean C/I ratio of 1.3/1, which is similar to
that of Model A.21 Moreover, Blanes et al. conducted a longitudinal prospective study on
the influence of C/I ratio on crestal bone loss around dental implants placed in the
posterior region.19 The mean clinical C/I ratio was 1.77 and the cumulative survival rate
of implants with a C/I ratio equal to or greater than 2 was 94.1%. Higher C/I ratios were
associated with less crestal bone loss. In a recent radiographic study by Birdi et al., the
C/I ratio of single implant-supported restorations on short-length plateau-design implants
in a clinical practice had a mean value of 2.0.22 The average mesial and distal first bone-
to-implant contact levels were 0.2 and 0.2 mm, respectively. It was concluded that the C/I
ratio did not affect the success of the short-length plateau-design implants. In this study,
mean age of patients was 61.3. Interestingly, occlusal forces are somewhat decreased due
to age-related deterioration of the dentition in most situations.45 In Birdi’s study, the
population of patients involved implant placement in posterior region.22 The 93.2 % of
implant sites were in the posterior region, which resulted in 60.5 % of tooth replaced
were molars. 22 Location of an implant in the arch is directly related to the direction of
forces. In the posterior region, the directions of forces are more vertical compared to the
anterior region, which has more oblique forces. Based on the findings in this study under
vertical loads of 100, 200 and 700 N, all implant models showed peak stress values far
below the physiological limit of bone. This simulation may be approximated to the
occlusal forces generated in the molar region, which is more vertical. Thus, location of an
implant in the arch is an important factor to be considered when using short implants.
40 At normal masticatory forces (100 and 200 N), the use of short implants with the
disproportionate C/I ratios showed the peak tensile and compressive stress values below
the physiological limits of cortical and trabecular bone. The results from the present
simulations may indicate that a disproportionate C/I ratio under normal masticatory
forces does not affect implant survival rate as also shown clinically by Schulte et al21,
Blanes et al19, and Birdi et al22’s studies. However, under overload conditions, increasing
crown height increased the peak tensile and compressive stresses on the cortical bone.
This increase in restoration height led to stress levels surpassing the threshold of
physiological tolerance of cortical (100-190 MPa) and trabecular bone (5 MPa), which
may lead to eventual failure of said bone.
Biomechanically, extending crown height increases force lever arm and results in
higher compressive stresses as shown in Table 1. The results by Kitamura et al. showed
that implants with pronounced crestal bone resorption around implant neck, which
increased crown height demonstrated higher stresses.18 Based on the findings of this
study, increasing length of implant and reducing C/I ratio decreased both peak tensile and
compressive stresses.
One interesting finding was that short implants (Model A and B) were associated
with higher tensile stresses regardless of loading conditions and abutment heights. For
vertical loads, short implants demonstrated higher tensile stresses compared to regular
implants. Increasing implant length from 6 mm to 11 mm reduced peak tensile stresses by
53.28 % under vertical loads of 700 N. Sahin et al. stated multiple factors influencing
load distribution on implants, such as gender, age, location of implant in the arch and
parafunctional habits.25 In patients with parafunctional habits or those with high stress
41 factors, implant length may play a more important role to the survival rate compared to
implants placed in patients with normal masticatory forces.9
Bates et al described the nature of mastication as a chewing cycle. 48 The average
human chewing frequency is 75 strokes/min. The duration of tooth contact in 1 cycle is
about 0.3 seconds. It is the repetition of loadings. The present simulation was performed
with static loadings while occlusal loading is cyclic in nature. As the number of cycles of
load increases, forces required to induce bone failure may be less than the static loads that
were tested in this present study.
Due to the complexity of three-dimensional implant modeling, short implants
produced form only one manufacturer were included in the study. The same simulation
may be used to compare stress distribution patterns among different commercial
implants.
42 Conclusion.
Within the limitations of this study, the stress distribution patterns under oblique
loads of 100 and 200 N were similar in all models regardless of the C/I ratio. The peak
compressive and tensile stresses on the cortical and trabecular bone were below the
physiological tolerance, even though implants with 2/1 C/I ratios produced higher
stresses.
At 700 N, increasing crown height as in Model B resulted in the peak tensile and
compressive stresses exceeding the physiological limits, which may lead to bone failure.
Increasing implant length reduced the peak tensile and compressive stresses as seen in
other models.
Stress distribution patterns for pure vertical loads of 100, 200, and 700 N were
similar in all models regardless of the C/I ratio. The peak compressive and tensile stresses
on the cortical and trabecular bone were below the physiological tolerance for all pure
vertical load levels.
Clinical implication
In a normal masticatory environment, short implants may function under the
physiological tolerance of bone. However, disproportionate C/I ratio may lead to bone
failure under overload conditions.
43 Bibliography
1. Adell R, Lekholm U, Rockler B, Brånemark PI. A 15-year study of osseointegrated implants in the treatment of the edentulous jaw. Int J Oral Surg 1981;10:387-416.
2. Zarb GA, Schmitt A. The longitudinal clinical effectiveness of osseointegrated
dental implants: the Toronto study. Part III: Problems and complications encountered. J Prosthet Dent 1990;64:185-94.
3. Cooper LF. A role for surface topography in creating and maintaining bone at
titanium endosseous implants. J Prosthet Dent 2000;84:522-34.
4. Winkler S, Morris HF, Ochi S. Implant survival to 36 months as related to length and diameter. Ann Periodontol 2000;5:22-31.
5. Lee JH, Frias V, Lee KW, Wright RF. Effect of implant size and shape on implant
success rates: a literature review. J Prosthet Dent 2005;94:377-81.
6. Krogh PH, Worthington P, Davis WH, Keller EE. Does the risk of complication make transpositioning the inferior alveolar nerve in conjunction with implant placement a "last resort" surgical procedure? Int J Oral Maxillofac Implants 1994;9:249-54.
7. Renouard F, Nisand D. Impact of implant length and diameter on survival rates.
Clin Oral Implants Res 2006;17:35-51.
8. Kotsovilis S, Fourmousis I, Karoussis IK, Bamia C. A systematic review and meta-analysis on the effect of implant length on the survival of rough-surface dental implants. J Periodontol 2009;80:1700-18.
9. Misch CE. Contemporary Implant Dentistry. 3rd ed. St. Louis: Elsevier; 2008. p.
105-129,543-556. 10. Van Staden RC, Guan H, Loo YC. Application of the finite element method in
dental implant research. Comput Methods Biomech Biomed Engin 2006;9:257-70.
11. Hagi D, Deporter DA, Pilliar RM, Arenovich T. A targeted review of study
outcomes with short (< or = 7 mm) endosseous dental implants placed in partially edentulous patients. J Periodontol 2004;75:798-804.
12. Bahat O. Brånemark system implants in the posterior maxilla: clinical study of
44 660 implants followed for 5 to 12 years. Int J Oral Maxillofac Implants 2000;15:646-53.
13. Goodacre CJ, Kan JY, Rungcharassaeng K. Clinical complications of
osseointegrated implants. J Prosthet Dent 1999;81:537-52.
14. Scurria MS, Morgan ZV 4th, Guckes AD, Li S, Koch G. Prognostic variables associated with implant failure: a retrospective effectiveness study. Int J Oral Maxillofac Implants 1998;13:400-6.
15. Grant BT, Pancko FX, Kraut RA. Outcomes of placing short dental implants in
the posterior mandible: a retrospective study of 124 cases. J Oral Maxillofac Surg 2009;67:713-7.
16. Romeo E, Bivio A, Mosca D, Scanferla M, Ghisolfi M, Storelli S. The use of
short dental implants in clinical practice: literature review. Minerva Stomatol 2010;59:23-31
17. Anitua E, Tapia R, Luzuriaga F, Orive G. Influence of implant length, diameter,
and geometry on stress distribution: A finite element analysis Int J Periodontics Restorative Dent 2010;30:88-95.
18. Kitamura E, Stegaroiu R, Nomura S, Miyakawa O. Biomechanical aspects of
marginal bone resorption around osseointegrated implants: considerations based on a three-dimensional finite element analysis. Clin Oral Impl Res 2004;15:401-12.
19. Blanes RJ, Bernard JP, Blanes ZM, Belser UC. A 10-year prospective study of
ITI dental implants placed in the posterior region. II: Influence of the crown-to-implant ratio and different prosthetic treatment modalities on crestal bone loss. Clin Oral Implants Res 2007;18:707-14.
20. Blanes RJ. To what extent does the crown-implant ratio affect the survival and
complications of implant-supported reconstructions? A systematic review. Clin Oral Impl Res 2009;20:67-72.
21. Schulte J, Flores AM, Weed M. Crown-to-implant ratios of single tooth implant-
supported restorations. J Prosthet Dent 2007;98:1-5.
22. Birdi B, Schulte J, Kovacs A, Weed M, Chuang SK. Crown-to-implant ratios of short-length implants. J Oral Implantol 2010, In-Press.
23. Skalak R. Biomechanical considerations in osseointegrated prostheses. J Prosthet
Dent 1983;49:843-8.
45 24. Geng JP, Tan KB, Liu GR. Application of finite element analysis in implant
dentistry: a review of the literature. J Prosthet Dent 2001;85:585-98.
25. Sahin S, Cehreli MC, Yalçin E. The influence of functional forces on the biomechanics of implant-supported prostheses: a review. J Dent. 2002;30:271-82.
26. Smith DE, Zarb GA. Criteria for success of osseointegrated endosseous implants.
J Prosthet Dent 1989;62:567-72.
27. Brånemark PI, Hansson BO, Adell R, Breine U, Lindström J, Hallén O, Ohman A. Osseointegrated implants in the treatment of the edentulous jaw. Experience from a 10-year period. Scand J Plast Reconstr Surg Suppl 1977;16:1-132.
28. Albrektsson T, Zarb G, Worthington P, Eriksson AR. The long-term efficacy of
currently used dental implants: a review and proposed criteria of success. Int J Oral Maxillofac Implants 1986;1:11-25.
29. Chun HJ, Shin HS, Han CH, Lee SH. Influence of implant abutment type on stress distribution in bone under various loading conditions using finite element analysis. Int J Oral Maxillofac Implants 2006;21:195-202.
30. Kitagawa T, Tanimoto Y, Odaki M, Nemoto K, Aida M. Influence of
implant/abutment joint designs on abutment screw loosening in a dental implant system. J Biomed Mater Res B Appl Biomater 2005;75:457-63.
31. Quaresma SE, Cury PR, Sendyk WR, Sendyk C. A finite element analysis of two
different dental implants: stress distribution in the prosthesis, abutment, implant, and supporting bone. J Oral Implantol 2008;34:1-6.
32. Maeda Y, Miura J, Taki I, Sogo M. Biomechanical analysis on platform
switching: is there any biomechanical rationale? Clin Oral Implants Res 2007;18:581-4.
33. Tabata LF, Assunção WG, Adelino Ricardo Barão V, de Sousa EA, Gomes EA,
Delben JA. Implant platform switching: biomechanical approach using two-dimensional finite element analysis. J Craniofac Surg 2010;21:182-7.
34. Shi L, Li H, Fok AS, Ucer C, Devlin H, Horner K. Shape optimization of dental
implants. Int J Oral Maxillofac Implants 2007;22:911-20.

46 35. Bozkaya D, Muftu S, Muftu A. Evaluation of load transfer characteristics of five
different implants in compact bone at different load levels by finite elements analysis. J Prosthet Dent 2004;92:523-30.
36. Chun HJ, Cheong SY, Han JH, Heo SJ, Chung JP, Rhyu IC, Choi YC, Baik HK, Ku Y, Kim MH. Evaluation of design parameters of osseointegrated dental implants using finite element analysis. J Oral Rehabil 2002;29:565-74.
37. Huang HL, Chang CH, Hsu JT, Fallgatter AM, Ko CC. Comparison of implant
body designs and threaded designs of dental implants: A 3-dimensional finite element analysis. Int J Oral Maxillofac Implants 2007;22:551-62.
38. Li T, Kong L, Wang Y, Hu K, Song L, Liu B et al. Selection of optimal dental
implant diameter and length in type IV bone: a three dimensional finite element analysis. Int J Oral Maxillofac Surg 2009;38:1077-83.
39. Ding X, Liao SH, Zhu XH, Zhang XH, Zhang L. Effect of diameter and length on
stress distribution of the alveolar crest around immediate loading implants. Clin Implant Dent Relat Res 2008;11:279-87.
40. Baggi L, Cappelloni I, Girolamo MD, Maceri F, Variro G, The influence of
implant diameter and length on stress distribution of osseointegrated implants related to crestal bone geometry: A three dimensional finite element analysis. J Prosthet Dent 2008;100:422-31.
41. Petrie CS, Williams JL. Comparative evaluation of implant designs: influence of
diameter, length, and taper on strains in the alveolar crest: A three-dimensional finite element analysis. Clin Oral Impl Res 2005;16:486-94.
42. Jokstad A, Braegger U, Brunski JB, Carr AB, Naert I, Wennerberg A. Quality of
dental implants. Int Dent J 2003;53:409-43.
43. Lekholm U, Zarb GA: Patient selection and preparation. In: Brånemark PI, Zarb GA, Albrektsson T (eds): Tissue-integrated prostheses: Osseointegration in clinical dentistry. Quintessence, Chicago 1985, pp 199-209
44. Schrotengoer J, Tsao YP, Kinariwala V, Wang HM. Effect of microthreads and
platform switching on crestal bone stress levels: A finite element analysis. J Periodontol 2008;79:2166-72.
45. Helkimo E, Carlsson GE, Helkimo M. Bite force and state of dentition. Acta Odontol Scand. 1977;35:297-303.

47 46. Borchers L, Reichart P. Three-dimensional stress distribution around a dental
implant at different stages of interface development. J Dent Res 1983;62:155-9.
47. Gibbs CH, Mahan PE, Mauderli A, Lundeen HC, Walsh EK. Limits of human bite strength. J Prosthet Dent 1986;56:226-9.
48. Bates JF, Stafford GD, Harrison A. Masticatory function--a review of the
literature. 1. The form of the masticatory cycle. J Oral Rehabil 1975;2:281-301.