Embed Size (px)
Citation preview

Photoelastic Stress Patterns Produced by the
Angled Distal Implants in the All-on-Four®
Concept.
Tasneem Begg
A minithesis submitted in partial fulfilment of the requirements for the degree
Magister Chirurgiae Dentium (Prosthodontics) in the Department of Restorative
Dentistry
at the
University of the Western Cape
Supervisors:
Prof GAVM Geerts BChD, MChD (US), PDD (UWC)
Prof J Gryzagoridis Pr. Eng. BSc (Lamar), MSc (Texas A&M),
PhD (Cape Town) September 2006

ii
Photoelastic Stress Patterns Produced by the Angled Distal
Implants in the All-on-Four® Concept.
Tasneem Begg
Key Words Angled implants
Stress patterns
Photoelastic analysis
All-on-Four®
Axial loading
Non-axial loading
Bone

iii
ABSTRACT
Photoelastic Stress Patterns Produced by the Angled Distal Implants in the All-
on-Four® Concept.
T. Begg
MChD Minithesis (Prosthodontics), Department of Restorative Dentistry, Division
Prosthodontics, University of the Western Cape.
Statement of the problem. By tilting implants bone augmentation procedures and
vital anatomic structures may be avoided in the fabrication of implant-supported
prostheses. Angled implants are associated with greater stresses in the alveolar bone.
Purpose. The purpose of this study was to investigate the stress produced around the
angled distal implants under simulated occlusal loading in the All-on-Four® concept
by means of two-dimensional photoelastic stress models.
Materials and Methods. Four photoelastic resin models were prepared as follows:
The anterior central implants were placed 15mm apart (from centre point to centre
point of each implant). The distal implants were placed 20mm from the centre point of
the anterior implants. The implants were placed with their 2mm machined collar above
the platform of the model. The remaining three models were prepared as follows: two
implants were placed 15mm apart in the anterior central region. The distal implants
were placed 20mm from the central anterior implants on either side at 15, 30 and 45-
degree angles respectively in each of the photoelastic resin models.
Multiunit abutments were connected as follows: straight 4mm abutments were
connected to the non-angled implants, and 4mm angled, 17-degree abutments to the
15-degree angled implants and 30-degree abutments to the 30 and 45-degree distal
angled implants respectively. All the abutments were torqued to 35Ncm.
iv
Pick-up impressions were made of the abutments in each model to construct a metal
bar for each of the models. The models, with the passively attached bars, were
observed in a circular polariscope when various occlusal loads were applied (5kg,
10kg, 15kg). The resultant stress patterns around the implants were photographed and
recorded for analysis.
Results. Increased isochromatic fringe concentration patterns were observed with axial
and non-axial loading in model 4 with the distal implants placed at a 45-degree angle.
The fringe order of the 45-degree implant loaded with 15kg was over 2.50. The
clinical significance of these stress patterns may lead to increased crestal bone
resorption. With the 15 and 30-degree angled implants little difference in stress
patterns were observed between the straight parallel implants and the distal angled
implants with axial and non-axial loading. Cross-arch splinting may have decreased
the stress patterns.

v
DECLARATION
I declare that Photoelastic Stress Patterns Produced by Angled Distal Implants in the
All-on-Four® Concept is my own work, that it has not been submitted for any degree
or examination in any other university, and that all the sources I have used or quoted
have been indicated and acknowledged by complete references.
Full Name
Day of of 2006
Signed

vi
DEDICATION
For my Mom.
For always being there.

vii
ACKNOWLEDGEMENTS
Prof Geerts For the support, assistance, encouragement, and presence through four difficult years
of study. Dank u wel! Thank you for being my mentor. Your dry sense of humour will
be missed.
Prof G & UCT Mechanical Engineering Department Efharisto. Many thanks for taking a complete stranger under your wing. You were very
supportive and helpful at all times.
Nobel Biocare Without their support this study would not have been possible.
Words cannot express my sincere gratitude and appreciation to Melani Botes, Alexa
Wardman, Mia Gilbert and Bo Rangert.
Niel Du Plessis For always making me smile – through some dark days – thank you so much. You sat
after-hours making some superb bars. I will always be indebted to you.
UWC Dental faculty Special thanks to Bartho Siebrits for the photography.
Love and appreciation to my family and friends that supported and motivated me through the last four years.

viii
CONTENTS
TITLE PAGE i
KEYWORDS ii
ABSTRACT iii
DECLARATION v
DEDICATION vi
ACKNOWLEDGEMENTS vii
TABLE OF CONTENTS viii
LIST OF FIGURES xi
LIST OF TABLES xiii
LIST OF PHOTOGRAPH GALLERIES xiv
CHAPTER 1
LITERATURE REVIEW 1
Introduction 1
Photoelastic Analysis 2
The All-on-Four® Concept 3
Cantilevers 4
Axial and Non-axial Occlusal Loading/ 5
Angled Implants
CHAPTER 2
STUDY OBJECTIVES 8
Aim of the Study 8
Study Objectives 8
Null Hypothesis 8
ix
CHAPTER 3
MATERIALS AND METHOD 9
Preparation of Photoelastic Resin Models 10
Preparation of Implant Sites 10
Implant Abutment Connection 12
Impression Making 13
Models Cast 16
Bar Fabrication 17
Luting of Temporary Abutments to Cast Bar 20
Measuring Equipment 23
CHAPTER 4
RESULTS 28
Model 1: All Implants Parallel 29
Model 2: Distal Implants 15-degree Angle 33
Model 3: Distal Implants 30-degree Angle 37
Model 4: Distal Implants 45-degree Angle 41
CHAPTER 5
DISCUSSION 45
Limitations of Study 46
Clinical Relevance 49
CHAPTER 6
CONCLUSIONS AND RECOMMENDATIONS 52
BIBLIOGRAPHY 53

x
APPENDICES
Appendix A 61
Appendix B 62
Appendix C 63
Appendix D 64

xi
LIST OF FIGURES
Figure 1 Line diagram of top view photoelastic model 10
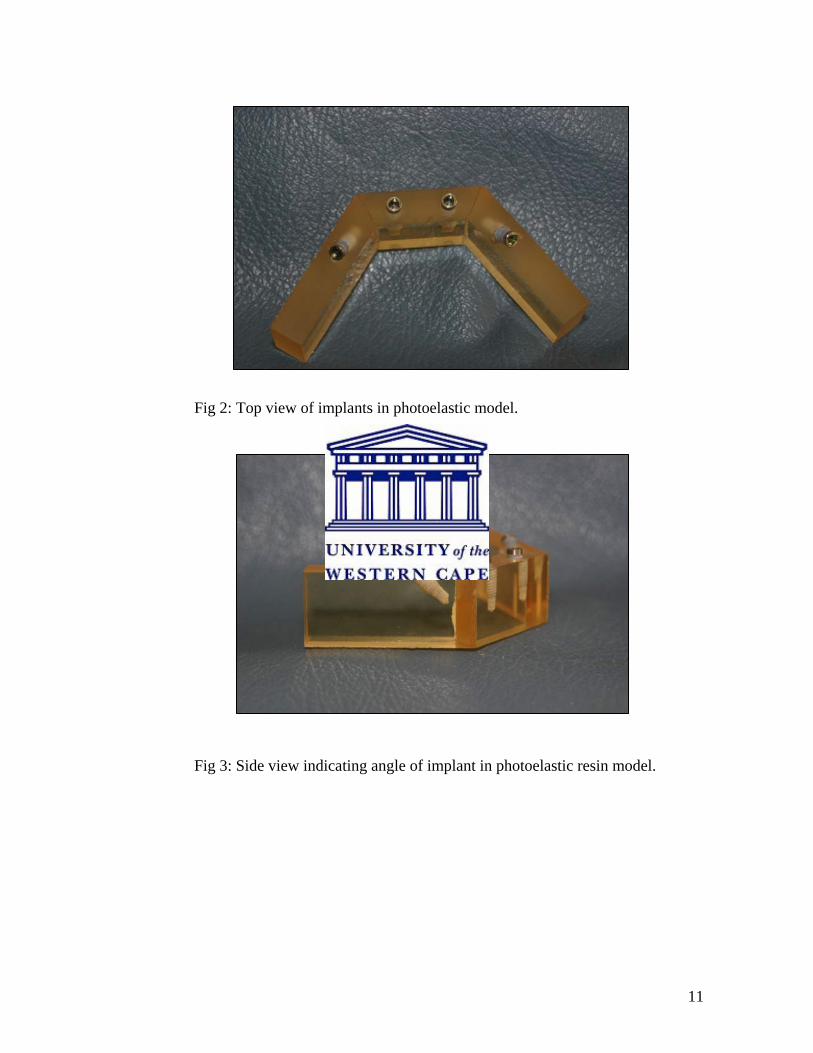
Figure 2 Top view of implants in photoelastic model 11
Figure 3 Side view indicating angle of implant in photoelastic resin model 11
Figure 4 Straight multiunit abutments connected to parallel implants 12
Figure 5 17-degree multiunit abutment on the 15-degree
distal angled implant 12
Figure 6 Custom-made special trays 13
Figure 7 Multiunit abutment open tray impression copings attached 13
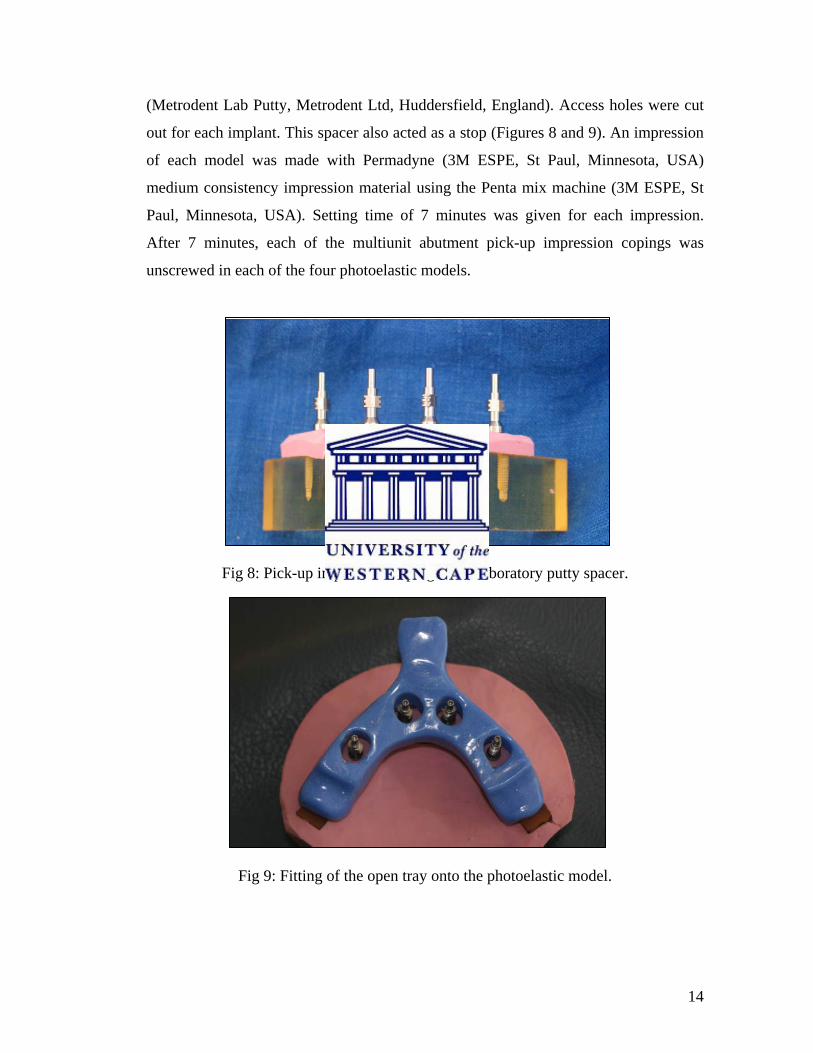
Figure 8 Pick-up impression copings with laboratory putty spacer 14
Figure 9 Fitting of the open tray onto the photoelastic model 14
Figure 10 Pick-up impression made with Permadyne (3M ESPE) 15
Figure 11 Pick-up impression with copings 15
Figure 12 Impressions boxed for casting with analogues attached 16
Figure 13 Resin Rock casts with laboratory analogues 16
Figure 14 Milling machine 17
Figure 15 Plastic coping being milled 17
Figure 16 Plastic sleeve milled 18
Figure 17 Plastic sleeves on cast with temporary abutments 18
Figure 18 Plastic bar ready for casting 18
Figure 19 Sprues attached 18
Figure 20 Panavia cement 20
Figure 21 Temporary abutments attached with floss to bar
prior to cementation 20
Figure 22 Completed bar with abutments luted 20
Figure 23 Front view Model 1 21
Figure 24 Top view Model 1 21
Figure 25 Front view Model 2 21
Figure 26 Top view Model 2 21

xii
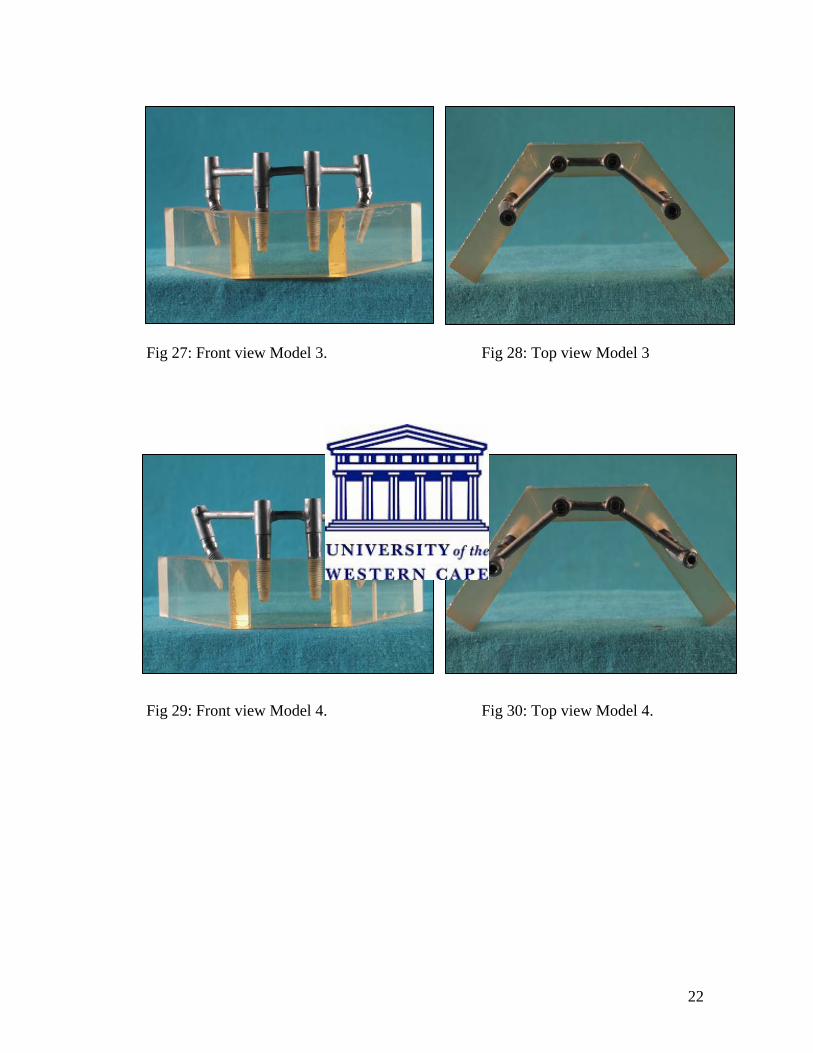
Figure 27 Front view Model 3 22
Figure 28 Top view Model 3 22
Figure 29 Front view Model 4 22
Figure 30 Top view Model 4 22
Figure 31 Circular polariscope 23
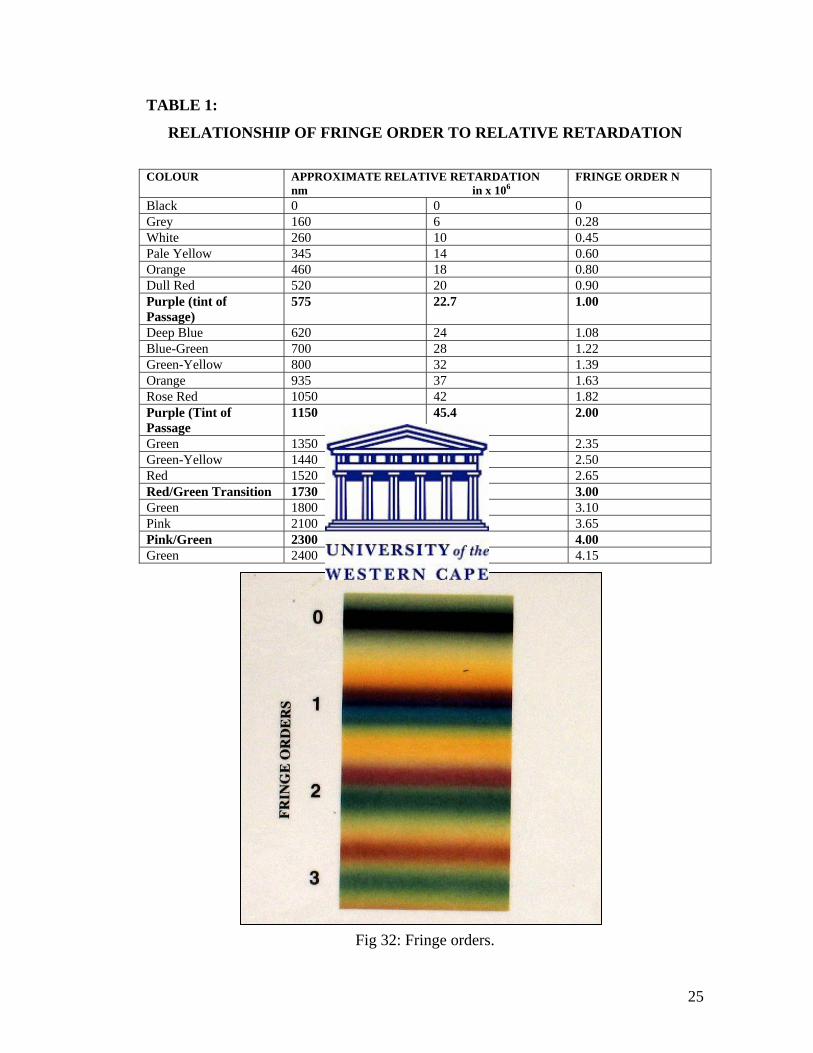
Figure 32 Fringe orders 25
Figure 33 Schematic diagram of loading jig 26
Figure 34 Compressive loading jig in circular polariscope 26
Figure 35 Outline of division of implant zones 28
Figure 36 Centre view Model 1 loaded with 5 kg 29
Figure 37 Graph of Model 1 Zone C to illustrate the correlation between load
application and fringe order 32
Figure 38 Centre view of Model 2 loaded with 5kg 33
Figure 39 Graph of Model 2 Zone C to illustrate the correlation between load
application and fringe order 36
Figure 40 Centre view of Model 3 loaded with 5kg 37
Figure 41 Graph of Model 3 Zone C to illustrate the correlation between load
application and fringe order 40
Figure 42 Centre view of Model 4 loaded with 5kg 41
Figure 43 Graph of Model 4 Zone C to illustrate the correlation between load
application and fringe order 44
Figure 44 Photoelastic model free of stress patterns after implant site
preparation 47
Figure 45 Implant torqued to 35Ncm 47

xiii
LIST OF TABLES
Table 1 - Relationship of Fringe Order to Relative Retardation 25

xiv
LIST OF PHOTOGRAPH GALLERIES
Gallery 1- Model 1 All Implants Parallel 30
Gallery 2- Model 2 Distal Implants at 15-Degree Angle 34
Gallery 3- Model 3 Distal Implants at 30-Degree Angle 38
Gallery 4- Model 4 Distal Implants at 45-Degree Angle 42

1
CHAPTER 1
LITERATURE REVIEW
Introduction
The periodontium best tolerates axially directed forces. Teeth are suspended in the
alveolar socket by the periodontal ligaments, which provide shock absorbing as well as
proprioceptive functions and are most efficient at tolerating axially directed forces.
Endosseous dental implants lack a periodontal ligament and are directly attached to the
surrounding bone. This was described by Brånemark (1965) as “osseointegration” and
Schroeder (1976) as “functional ankylosis” (Adell et al. 1981; Mericske-Stern et al.
1995). Masticatory and parafunctional forces are transmitted through the implant-
prosthesis to the surrounding alveolar bone. Conflicting reports exist in the literature
with regards to the effect of excessive occlusal loads and peri-implant bone response.
Animal studies by Isidor (1996) and Duyck et al. (2001) have found that occlusal
overloading may cause peri-implant bone resorption if the forces exceed the
physiological tolerance of the alveolar bone. Disparities in results were found in
similar animal studies conducted by Miyata et al. (1998) and Heitz-Mayfield et al.
(2004). Stresses around implants are influenced by the implant material,
macrostructure, thread design, number, loading protocol and the angulation of
placement (Kim et al. 2005).
Under ideal conditions all implants would be placed perpendicular to the ideal occlusal
plane so that masticatory forces would be directed axially along the length of the
implant. However, implant placement is often less than ideal due to poor bone volume
at the implant site, presence of anatomical structures, inaccurate planning and human
error (Bruggenkate et al. 1992).
2
Bone augmentation procedures are available to increase bone volume at a proposed
implant site. These procedures are a valuable adjunct to implant therapy but certain
risks and complications exist. Researchers have proposed the use of implants placed at
an angle so that strategic anatomical structures and grafting procedures may be
avoided (Bruggenkate et al. 1992; Krekmanov et al. 2000). Tilted implants can be
associated with higher stresses in the cortical and medullary bone (Canay et al. 1996;
Ueda et al. 2004).
Photoelastic Analysis
Stress analysis on implants may be performed by strain gauge analysis, finite element
analysis and photoelastic analysis (Clelland et al. 1993; Asundi and Kishen 2000;
Geng et al. 2001; Fernandes et al. 2003; Sütpideler et al. 2004).
Strain gauge analysis requires the placement of the gauges within the study model.
Electrical strain gauges work on the principle that the electrical resistance of a wire
changes in relation to the strain applied to it. Electrical strain gauges are used to
measure load, torque and pressure. Strain gauges measure strain at a single site and in
one direction only. By means of a combination of strain gauges in rosette formations
the magnitude and direction of principal stresses may be measured (Dally and Riley
1978; Clelland et al. 1993).
Finite element analysis (FEA) is based on computer modelling. The model to be
investigated is simulated by a special software programme (Geng et al. 2001;
Sütpideler et al. 2004). The FEA model is created by reducing a solid object into a
number of discrete elements that are connected at common nodal points. Each element
is assigned appropriate material properties that correspond to the properties of the
structure to be modelled. The FEA model allows simulated force application to
specific points in the system, and it provides the resultant forces in the surrounding
structures (Barbier et al. 1998; Geng et al. 2001; Bozkaya et al. 2004).

3
The photoelastic technique is commonly used in various engineering fields to
determine stresses and strains within a body. Photoelastic analysis has been widely
used in dentistry to study biomechanical stresses and strains in different kinds of
prostheses (Kenny and Richards 1998). The photoelastic model is a homogeneous
plastic material that simulates bone. Although the magnitude of stresses in real bone
can differ from those generated in the photoelastic model, the location and form of the
stresses are held to be similar (Fernandes et al. 2003).
Photoelastic materials have the ability to refract light within the beam of a polariscope
when deformed under loading conditions. The refracted light from the polariscope
appears as rainbow-like fringes within the body of the material. By comparing these
light fringes to known stress fringe charts the qualitative amount of stress can be
calculated (Dally and Riley 1978).
Photoelastic analysis is easy to conduct, accurate and the tests are conducted on a
closer approximation to the actual object rather than a computer-simulated model
(Fernandes et al. 2003). Asundi and Kishen (2000) also stated “the primary advantage
of photoelasticity is that it helps to visualize the complete field stress distribution”.
The All-on-Four® concept
Rehabilitation of atrophied edentulous arches with endosseous implants in the
posterior regions is often complicated by the presence of strategic anatomic structures
such as the mandibular canal and maxillary sinuses.
In several clinical studies, the technique for the placement of implants has been
modified in the posterior part of the mandible and maxilla. Distal implants were tilted
posteriorly 25 to 35 degrees from the axial. Implant-supported prostheses could be
extended further distally, and the length of cantilevers could be reduced without
transpositioning the mandibular nerve or performing bone grafting in the maxilla
(Krekmanov et al. 2000; Aparicio et al. 2001; Krönstrom et al. 2003). Patients gained a

4
mean distance of 6.5mm of prosthesis support in the mandible and 9.3mm in the
maxilla. At 12 months, Krönstrom et al. (2003) reported a 93% implant survival rate of
4 implants in the interforamina area supporting a fixed hybrid prosthesis using a one-
stage protocol. The distal implants were inclined towards the retromolar area by 30
degrees. They concluded that 4 implants in the interforamina area could successfully
support a complete fixed hybrid prosthesis using an early loading protocol.
Maló et al. (2003) introduced the All-on-Four® concept for immediate loading of
dental implants in the mandible. The placement of the implants is standardised by a
special surgical guide. Two anterior implants are placed parallel in the position of the
lateral incisors. The distal implants are placed just anterior to the mental foramen at a
30 to 45 degree angle. The implants are placed as cornerstones in the mandible. This
arrangement increases the anchorage of the implants, creates a shorter cantilever length
and creates a larger interimplant distance. Successful short-term clinical results have
also been obtained with the All-on-Four® technique in the maxilla (Maló et al. 2005).
Cantilevers
The classic Brånemark design of four to six implants placed in the interforamina
regions or between the maxillary sinuses with distal cantilevers for posterior occlusion
had no specific cantilever lengths. Brånemark recommended a length of two to three
premolars. Rangert et al. (1989) suggested that the cantilever lengths for a fixed
implant-supported prosthesis in the mandible should not exceed 15-20mm and 10mm
in the softer porous bone of the maxilla. A large cantilever may generate overloading,
possibly resulting in peri-implant bone loss and prosthetic failures. Duyck et al. (2000)
reported that the loading position on fixed full-arch implant-supported prostheses
could affect the resulting force on each of the supporting implants. When an occlusal
force was applied to the distal cantilever, the highest axial forces and bending
moments were recorded on the distal implants. Correlation between implant bone loss
and overloading induced by cantilevers remains unanswered. Shackleton et al. (1994)

5
indicated that long cantilevers (>15mm) induced more implant-prosthesis failures as
compared with cantilevers shorter than 15mm.
Rangert et al. (1989) and English (1990) as cited in Rodriguez et al. (1994) suggested
that the anterior-posterior or “AP spread” of the implants might also play a role in
determining cantilever lengths. English (1990) defined the anterior-posterior spread as
the distance between two parallel lines, one connecting the most distal implants and
the second parallel to the first, through the most anterior implants. He suggested that
the cantilever lengths should be limited to one and a half times the AP spread with 5
implants present. In the maxilla he suggested that the cantilever lengths should not
exceed 6-8mm. Rangert et al. (1989) recommended an AP spread of 10mm. English
(1990) advised that the “implant-crown” ratio should also be considered with
cantilever lengths. If the implant to crown ratio is not favourable the cantilever length
should be limited or non-existent.
The “All-on-Four” concept claims to have incorporated some of the biomechanical
concepts to minimise stresses along the implant-bone interface.
Axial and Non-axial Occlusal Loading / Angled Implants
Dental implant occlusal schemes and principles are largely derived from natural tooth
occlusion and complete denture occlusion with a few modifications (Taylor et al.
2005). The distribution of occlusal forces and load transfer at the bone-implant
interface is influenced by several factors such as: the opposing dentition, type of
loading, number of implants, implant geometry, spread, angulation of the implants,
cantilever length, design, rigidity of the prosthetic superstructure, prosthesis material,
superstructure fit, bone quality and quantity and mandibular deformation. Factors such
as age and sex of the patient as well as any parafunctional habits should also be
considered (Duyck et al. 2000; Sahin et al. 2002; Jackson 2003; Eskitascioglu et al.
2004; Kim et al. 2005).
6
During mastication, microstrains are generated at the bone-implant interface. At low
rates of microstrains (2000 microstrains or less), bone may become atrophic. With
excessive microstrains (more than 4000), bone resorption may occur with potential
loss of the implant. Stress and strain gradients which exceed the physiological
tolerance threshold of bone may cause microfractures at the bone-implant interface
(Carter et al. 1981; Carter and Caler 1983; Taylor 1989) as cited in Morris et al.
(2004). Cortical bone has higher strength in compression (170Mpa) than in tension
(100Mpa). Strength of trabecular bone is the same in compression and tension (2-5
Mpa).
Proprioception of natural teeth and implants differ greatly with an average of 3.8g
pressure for natural teeth tested horizontally vs. 580g horizontal force for implants
(Taylor et al. 2005). Maximum biting forces in dentate humans varies between
individuals and in different regions of the dental arch. Occlusal forces in dentate
patients vary from 383 to 880N for molars and 176-229N for incisors cited in Van Zyl
et al. (1995). Occlusal forces in patients with implant-supported prostheses are similar
to those of dentate patients (Sahin et al. 2002; Stanford 2005).
Excessive marginal bone loss around dental implants has been suggested to be the
result of plaque-induced peri-implantitis or occlusal overload (Isidor 1996; Miyata et
al. 1998; O’Mahony et al. 2000). The occlusal overload theory is supported by Isidor’s
(1996) monkey study, which demonstrated that compared with plaque accumulation,
crestal bone loss was more severe (more than three times greater) as a result of
excessive occlusal loads.
Literature on the effect of nonaxial loading of dental implants on the bone interface is
limited. Forces of occlusion are rarely vertical. During mastication the direction of
forces on an implant is rarely axial, the occlusal force is applied at different locations
and frequently in a direction that creates a lever-arm, which causes reacting forces and
bending moments in the bone (Rangert et al. 1989; Sahin et al. 2002). Taylor et al.
(2005) stated “the shape and surface texture of cylindrical, endosseous implants make
7
it impossible for a vertically applied load to be transmitted to the bone exclusively
through compressive loading. A threaded profile, or even a rough surface on an
implant indicate that the load will be transferred to bone by compression in some areas
but also tension and shear forces in other areas”.
At 5 years Krekmanov et al. (2000) reported no implant failures in the mandibles and
the cumulative success rate in the maxilla was 98% for tilted implants and 93% for
non-tilted implants. Aparicio et al. (2001) had similar results: after 5 years, the implant
cumulative success rate was 95.2% for the tilted implants and 91.3% for the axial
implants, and the prosthesis survival rate was 100%. At the fifth year, the average
marginal bone loss was 1.21mm for the tilted implants and 0.92mm for the axial ones.
These in vivo studies report greater survival rates for tilted implants. In vitro results
with studies of different methodology obtained by Canay et al. (1996) and Ueda et al.
(2004) demonstrated greater stresses around the tilted implants compared with the non-
tilted implants.
The current literature is deficient in in vitro studies to evaluate the stress patterns
surrounding distal angled implants supporting full arch fixed implant prostheses. Maló
et al. (2003, 2005) has reported on the short term clinical success of the All-on-Four®
concept. This fairly successful concept has not been evaluated by an in vitro test.

8
CHAPTER 2
STUDY OBJECTIVES
Aim of the Study:
To evaluate the photoelastic stress patterns around the angled distal implants under
various loading conditions in the All-on-Four® concept.
Study Objectives:
1. To evaluate the photoelastic stress patterns produced between four parallel
implants during occlusal loading (control).
2. To evaluate the photoelastic stress patterns produced during occlusal loading
around the angled distal implants placed at:
i) 15 degrees to the parallel anterior implants in the All-on-Four®
technique.
ii) 30 degrees to the anterior parallel implants in the All-on-Four®
technique.
iii) 45 degrees to the anterior parallel implants in the All-on-Four®
technique.
Null Hypothesis:
There is no difference in photoelastic stress patterns produced under various loads by the
distal angled implants in the All-on-Four® concept.

9
CHAPTER 3
MATERIALS AND METHOD
Treatment of fully edentulous patients with fixed implant supported prostheses has
evolved from the original Brånemark protocol. The All-on-Four® concept introduced
by Maló et al. in 2003 is a protocol for the implant restoration of the edentulous jaw
using four strategically placed osseointegrated implants. The key concepts of this
technique are the deliberate posterior angulation of the contralateral distal implants to
avoid strategic anatomical structures like the maxillary sinuses and the mental
foramina so that ridge augmentation procedures like sinus lifts and nerve repositioning
techniques may be avoided. A specific surgical guide designed for the treatment
protocol determines the implant positioning and angulation. In doing so, the overall
arch length of the restoration may be increased when compared to four parallel
implants. The angulation of the distal implants is approximately 30 to 45 degrees.
For this study, Professor Gryzagoridis constructed the photoelastic resin models at the
University of Cape Town, Mechanical Engineering department. The exact same
technique employed clinically to place the implants in the All-on-Four® concept was
utilised.

10
Preparation of Photoelastic Resin Models
Four photoelastic resin models were constructed to mimic the mandible. Preformed
sheets of photoelastic polycarbonate material (two dimensional photoelastic resin
sheets, Vishay Products, Malvern, PA, USA) were cut and cemented together in the
following proportions: height 20mm, width 10mm and length 45mm for the sides and
35mm for the centre piece (Figure 1). All four models were identical.
Fig 1: Line diagram of top view of photoelastic model.
Preparation of Implant Sites
Once the models had been constructed the implant sites were prepared with the aid of
the All-on-Four® surgical guide (Nobel Biocare, Göteborg, Sweden). All burs and
tapping instruments used were taken from the Nobel Biocare Tapered (Nobel Biocare,
Göteborg, Sweden) surgical range for each of the photoelastic resin models. Implants
were continually screwed in and out with an implant mount and hand wrench until
they could be fully seated. Kenney and Richards (1998) employed a similar method.
The first model was prepared with the four 4.3mm diameter by 13mm length implants
placed parallel to each other. The anterior central implants were placed 15mm apart
(from centre point to centre point of each implant). The distal implants were placed
20mm from the centre point of the anterior implants. The implants were placed with
their 2mm machined collar above the platform of the model. The remaining three
models were prepared as follows: two implants were placed 15mm apart in the anterior
central region. The distal implants were placed 20mm from the central anterior
implants on either side at 15, 30 and 45-degree angles respectively in each of the
photoelastic resin models (Figures 2 and 3).
35mm
45mm 45mm
11
Fig 2: Top view of implants in photoelastic model.
Fig 3: Side view indicating angle of implant in photoelastic resin model.

12
Implant Abutment Connection
Once the implants were placed, each implant was torqued to 35Ncm. Multiunit
abutments (Nobel Biocare, Göteborg, Sweden) were connected as follows: the straight
4mm multiunit abutments were connected to the straight implants (Figure 4) and the
4mm angled, 17-degree multiunit abutments to the 15-degree angled implants (Figure
5) and 30-degree multiunit abutments to the 30 and 45-degree distal angled implants
respectively. All the multiunit abutments were torqued to 35Ncm.
Fig 4: Straight multiunit abutments connected to parallel implants.
Fig 5: 17-degree multiunit abutment on the 15-degree distal angled implant.

13
Impression Making
Custom-made special trays (Figure 6) were fabricated with Metroform chemical cured
acrylic material (Metrodent Ltd, Huddersfield, England) for each model. The custom-
made special trays all had access holes for the open tray pick-up impression technique.
A thin layer of Adhesive (Coltene Whaledent, New Jersey, USA) was coated onto the
inner surface of each tray. The adhesive was allowed to dry for 20 minutes.
Fig 6: Custom-made special trays.
Fig 7: Multiunit abutment open tray impression copings attached.
Multiunit abutment (Nobel Biocare, Göteborg, Sweden) open tray impression copings
were connected to each multiunit abutment and hand tightened (Figure 7). A spacer to
mimic the gingival tissues of 3mm in height was constructed from laboratory putty
14
(Metrodent Lab Putty, Metrodent Ltd, Huddersfield, England). Access holes were cut
out for each implant. This spacer also acted as a stop (Figures 8 and 9). An impression
of each model was made with Permadyne (3M ESPE, St Paul, Minnesota, USA)
medium consistency impression material using the Penta mix machine (3M ESPE, St
Paul, Minnesota, USA). Setting time of 7 minutes was given for each impression.
After 7 minutes, each of the multiunit abutment pick-up impression copings was
unscrewed in each of the four photoelastic models.
Fig 8: Pick-up impression copings with laboratory putty spacer.
Fig 9: Fitting of the open tray onto the photoelastic model.

15
For this study the pick-up impression technique was chosen instead of the transfer
technique (Figures 10 and 11). Distortion of the impression may occur upon removal
of the impression from the transfer copings that are angled due to the tilt of the
implants (Vigolo et al. 2003; Naconecy et al. 2004).
Fig 10: Pick-up impression made with Permadyne (3M ESPE).
Fig 11: Pick-up impression with copings.

16
Models Cast
Once the impressions were removed from the photoelastic models multiunit abutment
laboratory analogues (Nobel Biocare, Göteborg, Sweden) were attached to the
impression copings and hand tightened. The impressions were cast in Resin Rock
(Modern Dental Materials, Whip Mix, Louisville, KY, USA) (Figures 12 and 13).
Fig 12: Impressions boxed for casting with analogues attached.
Fig 13: Resin Rock casts with laboratory analogues.

17
Bar Fabrication
Temporary multiunit abutments (4.3mm in diameter at the platform level, 3.3mm at
the coronal end) were attached to each laboratory analogue on the Resin Rock casts.
Plastic cylindrical tubes (Bego Hollow Sticks, Bego, Bremen, Germany) were then
milled with a metal lathe to create a casting sleeve that was uniform in thickness and
had a standardised centre. The solid plastic tube was 5mm in diameter and the centre
was milled to 3.5mm. The casting sleeve was 0.75mm thick. This created a uniform
cement space of 200µm.
A plastic casting bar of 2.5mm (Bego Stick, Bego, Bremen, Germany) in diameter was
then cemented with Adlock superglue to each of the milled plastic sleeves. The plastic
bars were then sprued with the plastic bar casting material which were cemented with
superglue (Figures 14 to 19). The plastic castings were then invested in a silica based
investment material Z4 (N & V Belgium, Vacalon, Pickerington, USA). Once
invested, the bars were then cast in a Mestra casting machine in one piece with casting
temperatures that ranged between 0-850 °C for seven hours. The superstructures were
cast in Talladium Tilite® alloy (Talladium Inc.,Valencia, CA, USA). Details of alloy
material used may be found in Appendix B.
Fig 14: Milling machine. Fig 15: Plastic coping being milled.

18
Fig 16: Plastic sleeve milled. Fig 17: Plastic sleeves on model with
temporary abutments.
Fig 18: Plastic bar ready for casting. Fig 19: Sprues attached.
One of the most important aspects of achieving success for implant-supported
prostheses is the passive fit of the superstructure on the abutments. The absence of a
passive fit may lead to prosthodontic or peri-implant complications (Hellden and
Dérand 1998; Eisenmann et al. 2004).
Passive fit has been defined as the “circumferential and simultaneous contact of all
abutments on their respective implants, and of all the gold cylinders of the prosthesis
on their respective abutments” (Glossary of Prosthodontic Terms 1987). Cast

19
frameworks, which do not fit to their abutments within this narrow definition, have
failed to achieve a passive fit (Wee et al. 1999).
Nicholls (1977) defined distortion as the “relative movement of a single point, or a
group of points away from some originally specified reference position such that
permanent deformation is apparent”. According to Misch (1999) various factors
influence the construction of a passive casting. These include material properties,
implant component factors and fabrication techniques used. Material properties relates
to the dimensional changes of impression, investment, casting and veneering materials
used. Manufacturing tolerances of the implant components and laboratory fabrication
techniques (cast or milled or laser-welded frameworks) or methods for correcting
misfit (sectioning and soldering, laser welding and spark erosion) all play a role in
providing a passive framework (Riedy et al. 1997).
Riedy et al. (1997) and Örtorp et al. (2003) found the precision of fit and passivity of
computer numeric controlled (CNC) milled titanium frameworks to be far superior and
more accurate than conventional forms of casting. Eisenmann et al. (2004) found an
improvement in fit of conventional cast frameworks in titanium and gold alloy that
were treated with spark erosion. The authors of this study recommended spark erosion
to refine framework fit.
In this study, because of limited funds and infrastructure inhibited the use of CNC
milled titanium frameworks or modifying the cast bars with spark erosion, an all in one
cast technique was used. The bars were then luted to the temporary abutments with a
resin cement. This technique was employed to improve the degree of fit and passivity
of the cast superstructure (Aparicio 1994; Clelland and van Putten 1997; Goossens and
Herbst 2003).

20
Luting of Temporary Abutments to Cast Bar
The temporary abutments were sandblasted with aluminium oxide particles. The bar
surface was cleaned with acetone to remove any impurities. Panavia F 2.0 (Kuraray
Dental, Düsseldorf, Germany) was mixed according to manufacturer’s instructions. A
thin layer of luting agent was applied to each temporary abutment. It was then slowly
inserted into the cast bar sleeve. The bar was then placed on the photoelastic model.
The temporary abutments were torqued down to 15 Ncm. Excess cement was removed
and the cement was allowed to self-cure with Oxyguard II (Kuraray Dental,
Düsseldorf, Germany) placed around the margins (Figures 20 to 30).
Fig 20: Panavia cement Fig 21: Temporary abutments attached
(Kuraray Medical Inc.). with floss to bar prior to cementation.
Fig 22: Completed bar with abutments luted.

21
Fig 23: Front view Model 1. Fig 24: Top view Model 1.
Fig 25: Front view Model 2. Fig 26: Top view Model 2.
22
Fig 27: Front view Model 3. Fig 28: Top view Model 3
Fig 29: Front view Model 4. Fig 30: Top view Model 4.

23
Measuring Equipment
Fig 31: Circular polariscope. Photoelastic analysis was accomplished using a circular polariscope that consisted of a
polariser, analyser, and an illumination system (Figure 31). The illumination system
used white light to produce the isochromatic fringe patterns. A standard loading frame
and customised jig were used to position the models in the polariscope.
Photoelastic analysis involves the application of known load conditions to a model
and, by utilising the induced birefringence of the material, to examine the stress
distribution within the model. Two different types of fringes can be observed in
photoelastic analysis i.e. isochromatic and isoclinic fringes. Isochromatic fringes are
lines of constant principal stress difference. If the source light is monochromatic these
appear as dark and light fringes, whereas with white light illumination coloured fringes
are observed. Isoclinic fringes occur whenever either principal stress direction
coincides with the axis of polarisation of the polariser. Isoclinic fringes appear as black
bands and provide information about the directions of the principal stresses in the
model. The stresses that are developed in the photoelastic model are observed as
isochromatic fringes, which can be viewed and photographed in the field of a plane or

24
circular polariscope. The total number of isochromatic fringes observed is directly
proportional to the stress in the photoelastic resin model. Fringes close to each other
represent areas of high stress concentration (Dally and Riley 1978).
“Fringe order” is the numerical value assigned to an observed fringe based on its
position in the colour sequence. Table 1 lists the sequence of coloured fringes
produced in a dark field with white light. The tint of passage is a sharp dividing zone
between red and blue in the first-order fringe, red and green in the second order fringe,
and pink and green in the third and fourth order fringes (Dally and Riley 1978).
The first tint of passage corresponds to fringe order one, the second tint of passage to
fringe order two, etc. The exact colour is dependent on the recording film, but the
sequence should be the same for most visual observations. Analysis with white light is
limited to the first five fringes because the colours become pale and difficult to
distinguish beyond that point (Dally and Riley 1978).
In this study, the isochromatic fringes produced when the bars were placed under
compressive loading were photographed in the field of a circular polariscope (Figure
31). The stress intensity indicated by the number of fringes and its locations were
subjectively compared for each of the photoelastic models.
Table 1 and Figure 32 display the different colours and the corresponding fringe order
values produced by two dimensional photoelastic materials. The relative retardation
values are the measurements of the different colour wavelengths that are produced
when a stress is applied.
25
TABLE 1:
RELATIONSHIP OF FRINGE ORDER TO RELATIVE RETARDATION
COLOUR APPROXIMATE RELATIVE RETARDATION
nm in x 106 FRINGE ORDER N
Black 0 0 0 Grey 160 6 0.28 White 260 10 0.45 Pale Yellow 345 14 0.60 Orange 460 18 0.80 Dull Red 520 20 0.90 Purple (tint of Passage)
575 22.7 1.00
Deep Blue 620 24 1.08 Blue-Green 700 28 1.22 Green-Yellow 800 32 1.39 Orange 935 37 1.63 Rose Red 1050 42 1.82 Purple (Tint of Passage
1150 45.4 2.00
Green 1350 53 2.35 Green-Yellow 1440 57 2.50 Red 1520 60 2.65 Red/Green Transition 1730 68 3.00 Green 1800 71 3.10 Pink 2100 83 3.65 Pink/Green 2300 90.8 4.00 Green 2400 95 4.15
Fig 32: Fringe orders.

26
Fig 33: Schematic diagram of loading jig.
Fig 34: Compressive loading jig in circular polariscope.
Load (weights)
Fixed to frame
Specimen Loaded between anvils
Free motion
anvil
anvil

27
Figure 33 is a schematic diagram of the loading jig used. The load was applied in a
compressive mode (Figure 34). The load was applied directly on to the abutments.
The anvils compressed two adjacent abutments on the specimen for each individual
load application. The anvils compressed the left side implant simultaneously with
implant number 2 of the central portion of the specimen. The two central implants
were compressed together as well and similarly the right side was loaded identically to
the left. This was possible because the specimen could be rotated accordingly under
the anvils to be normal to the illumination beam.
The models were first photographed unloaded. Residual stresses were observed in the
photoelastic models due to the stresses created by the insertion of the implants and
tightening of the abutment screws. Loads of 5, 10 and 15kg were applied to each of the
four models. Digital photographs were recorded with a Canon G3 camera. All the
details of the photography appear in Appendix C.
No calibration was necessary because no absolute values of stress were used. Professor
Gryzagoridis compared all the photographs and described the fringe order
concentrations obtained. The digital photographs were enlarged to 500% on a 17-inch
Mecer computer monitor. Each photograph was analysed individually and the colour
and fringe order recorded. This information is detailed in the Results chapter.

28
CHAPTER 4
RESULTS
To aid in analysis the area around each implant was divided into three zones:
A=coronal, B=middle and C=apex. Each zone was labelled alphabetically as outlined
in Figure 35. Two factors were considered in the analysis of the fringes: (1) the
number of fringes and (2) the proximity of fringes to each other (French et al. 1989).
Fig 35: Outline of division of implant zones.
Isochromatic fringe concentrations produced under various loads can be seen in Photo
Galleries 1-4. The number of fringes seen is directly proportional to the stress in the
model. Fringes within close proximity to each other represent areas of high stress
concentration. Concentration of the stresses is found mainly at the platform around the
first few threads and the apex of the implant. The fringe concentrations adjacent to the
implant indicate a higher fringe order. The black fringe concentrations seen further
from the implant within the photoelastic model indicates a zero fringe order.
Asymmetrical changes in the fringe concentrations were noted with an increase in the
angle of the distal implants and the amount of occlusal loading.
Zone A Zone B
Zone C
Coronal
Middle
Apex

29
MODEL 1: ALL IMPLANTS PARALLEL
A compressive loading jig was constructed to fit onto the circular polariscope. Model 1
was placed in the jig and first photographed unloaded. Symmetrical stress
concentrations were visible at the platform and apex of each of the implants unloaded.
With an increase in load from 5kg (Figure 36) to 15kg dramatic changes in fringe
concentrations were observed.
Fig 36: Centre View Model loaded 5 kg.

30
GALLERY 1
MODEL 1 - ALL IMPLANTS PARALLEL
RIGHT VIEW CENTRE LEFT VIEW
UNLOADED
LOADED 5 KG
LOADED 10 KG
LOADED 15 KG
Zone A
Zone B
Zone C
1 2
1 2
1 2
1 2

31
Right view - the right distal implant, together with one of the central implants were
loaded with 5kg, 10kg and 15kg respectively (Gallery 1). With an increase in load,
there was an increase in fringe order concentrations in Zones A and C. With the 5kg
load, fringe concentrations were symmetrical and within the first fringe order (see
Table 1 and Figure 32). The dull red/purple colour signifies a fringe order of 1.0 in
Zone A on the distal side and 1.39 on the mesial side. Zone C depicted fringe
concentrations within the second fringe order of 1.63 with the shade of orange. When
the specimen was loaded with 10kg an increase in fringe order to 1.82 was noted as
indicated by the red/purple colour in Zone C. With the 15kg load the fringe
concentrations became asymmetrical in Zones A and C. In Zone A the fringe
concentrations increased to the order of 2.00 indicated by the faint purple shade. In
Zone C fringe concentrations reached the third fringe order of 2.65 represented by the
faint red shade close to the apex.
Centre View - two distinct symmetrical fringe concentrations were observed in Zone A
and C of each implant. The anterior two implants marked 1 and 2, were loaded in
compression with 5, 10 and 15kg progressively. With the 5kg load the central implant
1 developed fringe concentrations, on the mesial aspect, within the second fringe order
of 1.22 as indicated by the arrow for the light blue/green shade. Zone B had a black
shadow that indicates a zero fringe order. In Zone C a fringe order of 1.82 was noted
with the arrow pointing to the rose red shade.
Central implant 2 exhibited concentrations, on the distal aspect, in Zone A that were
light blue/green in colour, denoting a fringe order of 1.22. In Zone B this implant had
an orange shade indicating a fringe order of 0.80. In Zone C the pattern was similar to
central implant 1, with the stresses slightly spreading further away from the implant.
Little change in fringe order concentrations were observed with an increase in 10 and
15 kg loads.
Left view - the left distal implant was loaded with the left central implant (number 2).
The fringe concentrations were not identical to the right implant. This implant had

32
more fringes on the distal aspect in Zone A for the unloaded and loaded situations.
With the 5kg load Zone A showed green/yellow tints indicating a second fringe order
of 1.39. Surrounding Zone B was a pale yellow shade with a fringe order of 0.60.
Enlarged concentrations on the mesial aspect of the implant were observed in Zone C.
These rose red shades as indicated by the arrow specify a fringe order of 1.82.
With the load increase to 10kg, Zone A depicted green /yellow shades indicating a
fringe order of 1.39. An orange hue equivalent of fringe order 0.80 was observed in
Zone B. In Zone C fringe concentrations in the order of 2.65 illustrated by a red band
was observed on the mesial aspect of the implant.
Finally with the specimen loaded with 15kg, not withstanding the lack of response
observed in the central implants the fringe concentrations increased in order and
spread further away from the implant. The photograph of the 15kg load illustrates
stress concentrations along the entire length of the implant. The orange tint in Zone A
indicates a fringe order of 1.63. Zone C has fringe concentrations of 2.65 exemplified
with a faint orange/red band.
Model 1 Zone C
0.000.501.001.502.002.503.00
0 5 10 15 20
Applied Load (Kg)
Frin
ge O
rder R
C1C2L
Fig 37: Graph of Model 1 Zone C to illustrate correlation between load application and
fringe order.

33
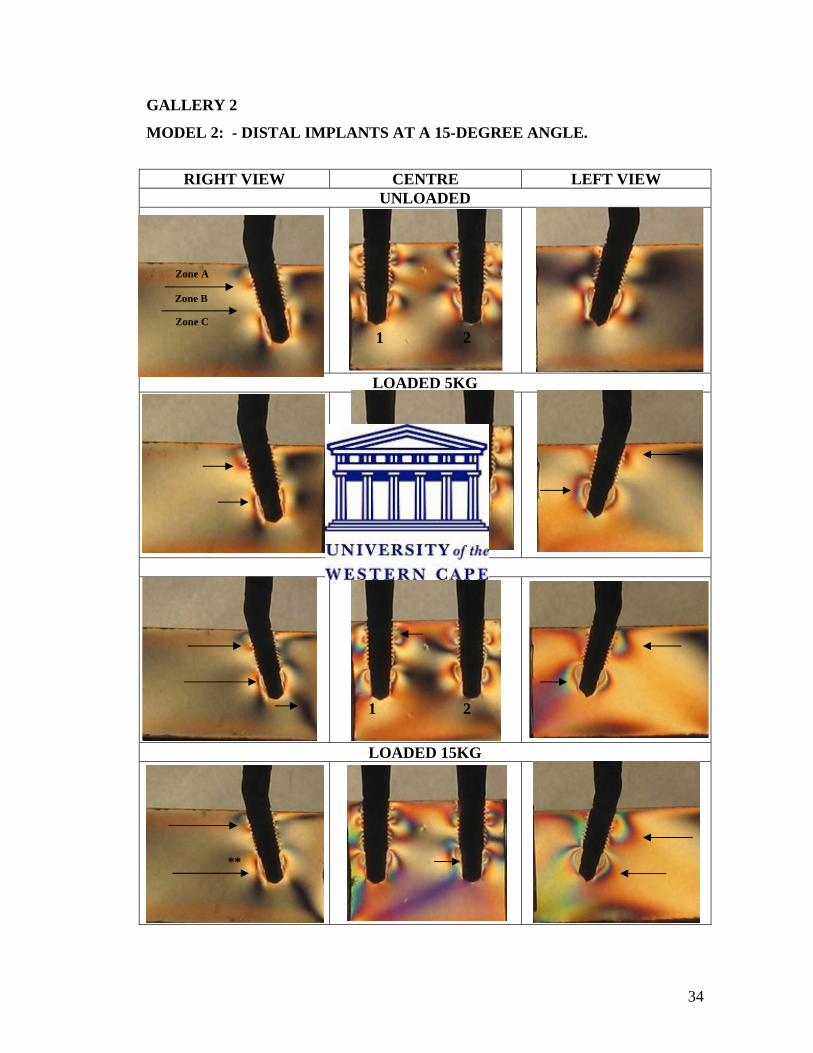
MODEL 2: DISTAL IMPLANTS 15-DEGREE ANGLE
Fig 38: Centre view of 15-degree model loaded with 5kg.
With this model both right and left distal implants were tilted at an angle of 15
degrees. The centre implants had zero degree inclination.
Loads of 5 (Figure 38), 10 and 15kg were applied respectively and the fringe
concentrations obtained for the unloaded and loaded conditions are shown in Gallery
2.
34
GALLERY 2
MODEL 2: - DISTAL IMPLANTS AT A 15-DEGREE ANGLE.
RIGHT VIEW CENTRE LEFT VIEW
UNLOADED
LOADED 5KG
LOADED 10KG
LOADED 15KG
**
Zone A
Zone B
Zone C
1 2
1 2
1 2
1 2

35
Right View - the right implant was tilted distally at a 15-degree angle. Non-axial loads
of 5, 10 and 15kg were applied respectively (Gallery 2). Fringe concentrations were
only observed in Zone A and C with each load. Zone B had a pale yellow shade for all
loads indicative of a fringe order and hence stress magnitude of 0.60.
Uncharacteristically the images for all loads on the right side were similar. With the
5kg load the fringe concentrations in Zone A was within the first order indicated by the
red hue 0.90. Zone C had stress concentrations within the first fringe order illustrated
by red/purple hues equivalent to 1.00. No pronounced difference in fringe
concentrations was observed when the load was increased to 10 and 15kg. The near
zero stress indication (grey /black hue) remain near or in proximity to the implant.
**This is an unexpected result with a possible explanation that the load as applied
directly above the implant was defused or distributed to the rest of the implants via the
connecting bar. Another explanation could be the insertion technique of the implant at
this site, which may have resulted in a different fringe concentration.
Centre View - fringe concentrations were distinguished in all three zones when axial
loads were applied to the centre implants 1 and 2. The space between the implants was
mainly characterised by black grey hues with some pale yellow tints and finally purple
near the apices of the implants. In Zone B with the 15kg load, very near the threads of
the implants blue-green hues suggesting a fringe order of 1.22 were displayed. In Zone
C a localised red fringe with an order of 2.65 was produced.
Left View - unloaded, Zone A and B had pale yellow and black shades respectively.
Zone C unloaded had ill-defined stress concentrations indicated by pale blue-green
shades. When a non-axial load of 5kg was applied, Zone A displayed fringe
concentrations with an orange tint (0.80) on the mesial aspect and a dull red shade
(0.90) on the distal side. In Zone B only pale yellow shades could be seen. In Zone C
the fringe concentrations displayed were rose red in colour in the order of 1.82 and on
the distal side orange, with a fringe order of 1.63.
36
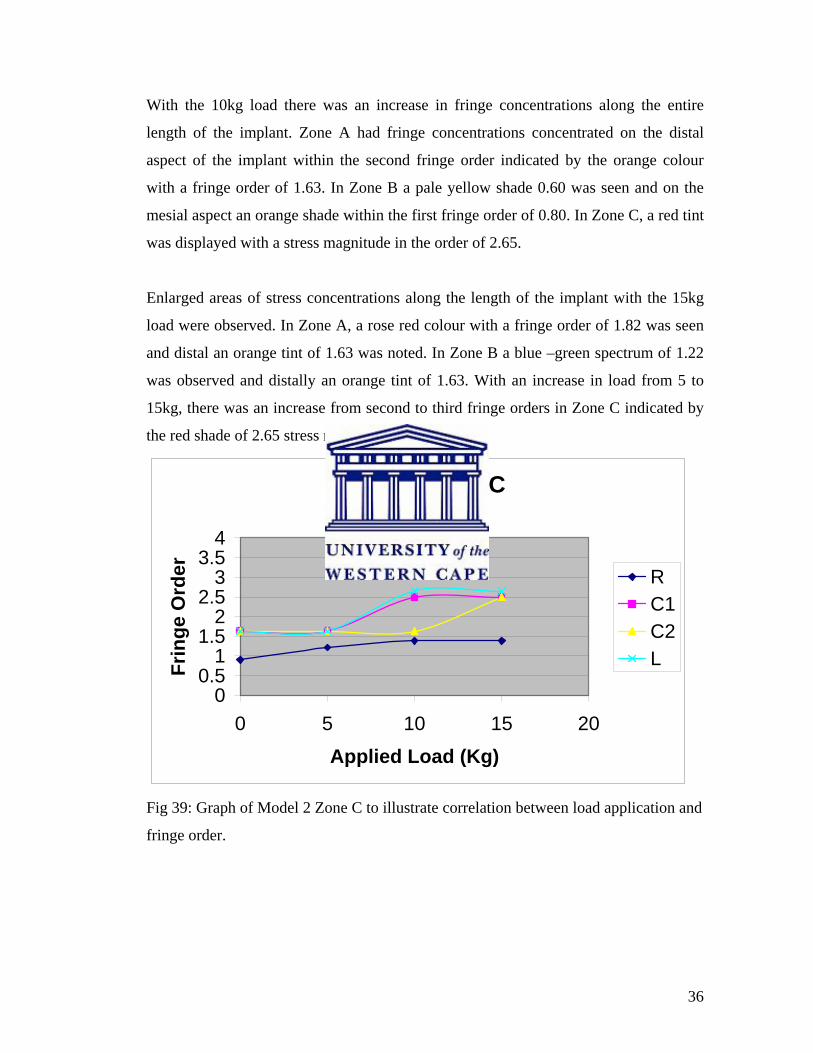
With the 10kg load there was an increase in fringe concentrations along the entire
length of the implant. Zone A had fringe concentrations concentrated on the distal
aspect of the implant within the second fringe order indicated by the orange colour
with a fringe order of 1.63. In Zone B a pale yellow shade 0.60 was seen and on the
mesial aspect an orange shade within the first fringe order of 0.80. In Zone C, a red tint
was displayed with a stress magnitude in the order of 2.65.
Enlarged areas of stress concentrations along the length of the implant with the 15kg
load were observed. In Zone A, a rose red colour with a fringe order of 1.82 was seen
and distal an orange tint of 1.63 was noted. In Zone B a blue –green spectrum of 1.22
was observed and distally an orange tint of 1.63. With an increase in load from 5 to
15kg, there was an increase from second to third fringe orders in Zone C indicated by
the red shade of 2.65 stress magnitude.
Model 2 Zone C
00.5
11.5
22.5
33.5
4
0 5 10 15 20
Applied Load (Kg)
Frin
ge O
rder R
C1C2L
Fig 39: Graph of Model 2 Zone C to illustrate correlation between load application and
fringe order.

37
MODEL 3: DISTAL IMPLANTS 30-DEGREE ANGLE
Fig 40: Centre view of 30-degree model loaded with 5kg.

38
GALLERY 3
MODEL 3 – DISTAL IMPLANTS AT A 30-DEGREE ANGLE
RIGHT VIEW CENTRE LEFT VIEW UNLOADED
LOADED 5KG
LOADED 10KG
LOADED 15KG
Zone A
Zone B
Zone C
1 2
1 2
1 2
1 2

39
Right View - the right implant was tilted distally at a 30-degree angle. Non-axial loads
as with the previous models were applied. Minimal residual stresses were seen with
the unloaded implant. With the 5 kg load, Zone A displayed stress concentrations
along the distal aspect with a purple tint of passage indicating a stress magnitude of
1.00. A pale yellow tint was observed in Zone B for all loads. Zone C illustrated a
purple tint of passage with 1.00 fringe order.
Isochromatic fringe concentrations for the 10 and 15kg loads were comparable. Zone
A for both loads displayed a blue-green shade with fringe order of 1.22. Zone C for all
loads applied remained constant. Stress concentrations intensified not only along the
apex of the implant but also in the “far fields of the model” as indicated by “X” that
changed from a black shade to pale yellow/orange.
Centre View - the unloaded picture shows fringe concentrations due to preload and
torque stresses. The fringe concentrations were found along the entire length of the
implants in Zones A, B and C. The fringe concentrations intensified with the 15kg
load. The concentrations became ill defined and central implant 1 had a broad red
band, marked (#) along its apex indicating a stress magnitude in the range of 1.82 –
2.00.
Left View - the unloaded implant demonstrated residual fringe concentrations in Zone
A and C. The stress magnitude in Zone A was minimal indicated by the orange hue
with a faint dull red fringe. Zone C had an orange band closest to the apex of the
implant with stress level of 1.63. With the 5, 10, and 15kg non-axial loads applied the
fringe concentrations remained the same and enlarged slightly. The unloaded picture
displayed a grey /pale yellow shade in the far fields. With the 15kg load the stress
concentration intensified close to the implant body and the far field area changed to
black**.
40
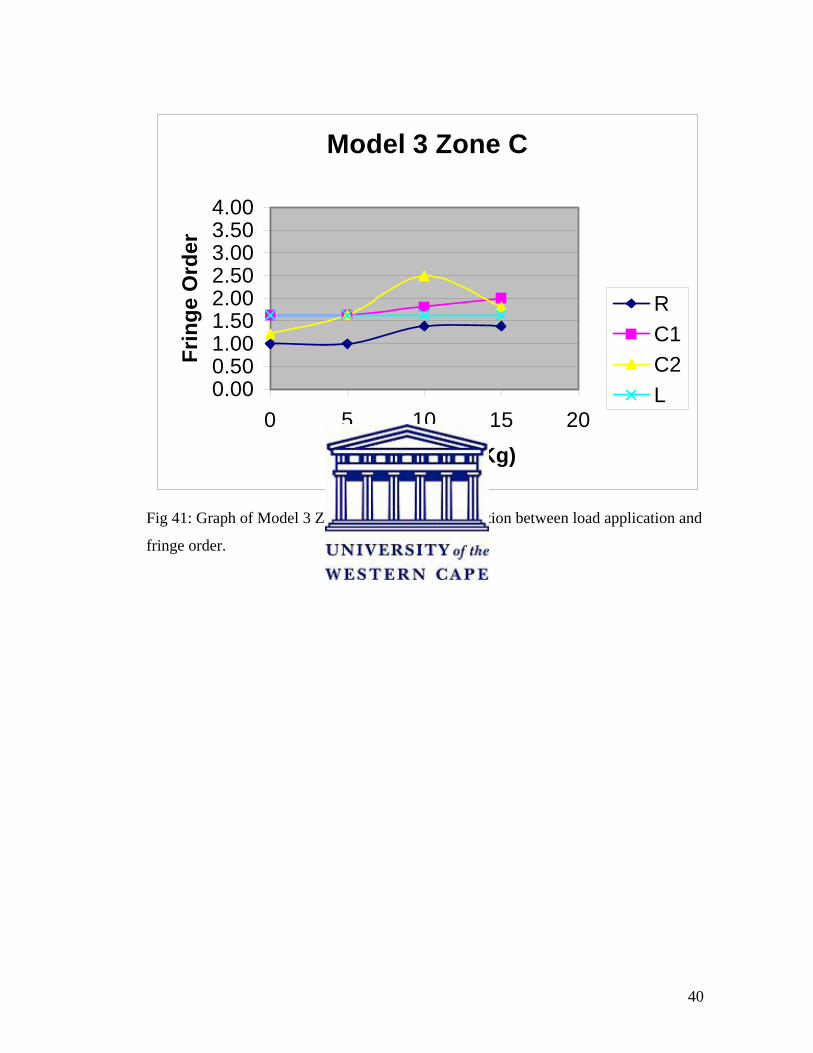
Fig 41: Graph of Model 3 Zone C to illustrate correlation between load application and
fringe order.
Model 3 Zone C
0.000.501.001.502.002.503.003.504.00
0 5 10 15 20
Applied Load (Kg)
Frin
ge O
rder
RC1C2L
41
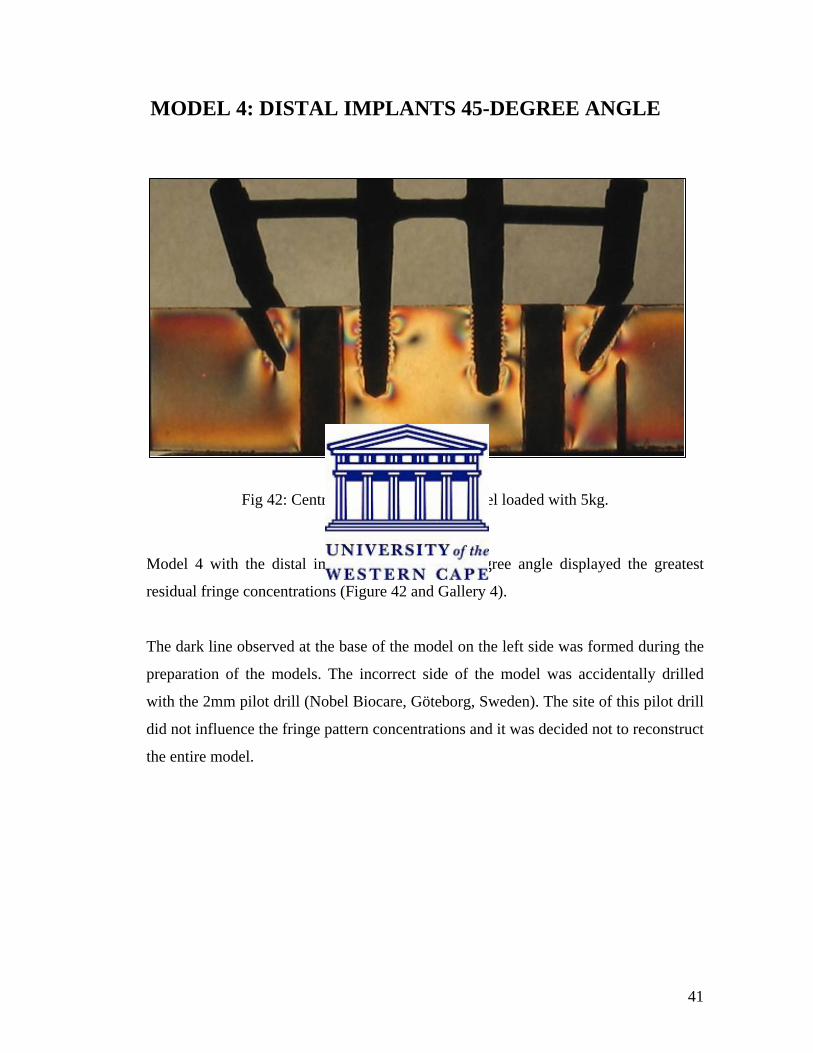
MODEL 4: DISTAL IMPLANTS 45-DEGREE ANGLE
Fig 42: Centre view of 45-degree model loaded with 5kg.
Model 4 with the distal implants tilted at a 45-degree angle displayed the greatest
residual fringe concentrations (Figure 42 and Gallery 4).
The dark line observed at the base of the model on the left side was formed during the
preparation of the models. The incorrect side of the model was accidentally drilled
with the 2mm pilot drill (Nobel Biocare, Göteborg, Sweden). The site of this pilot drill
did not influence the fringe pattern concentrations and it was decided not to reconstruct
the entire model.
42
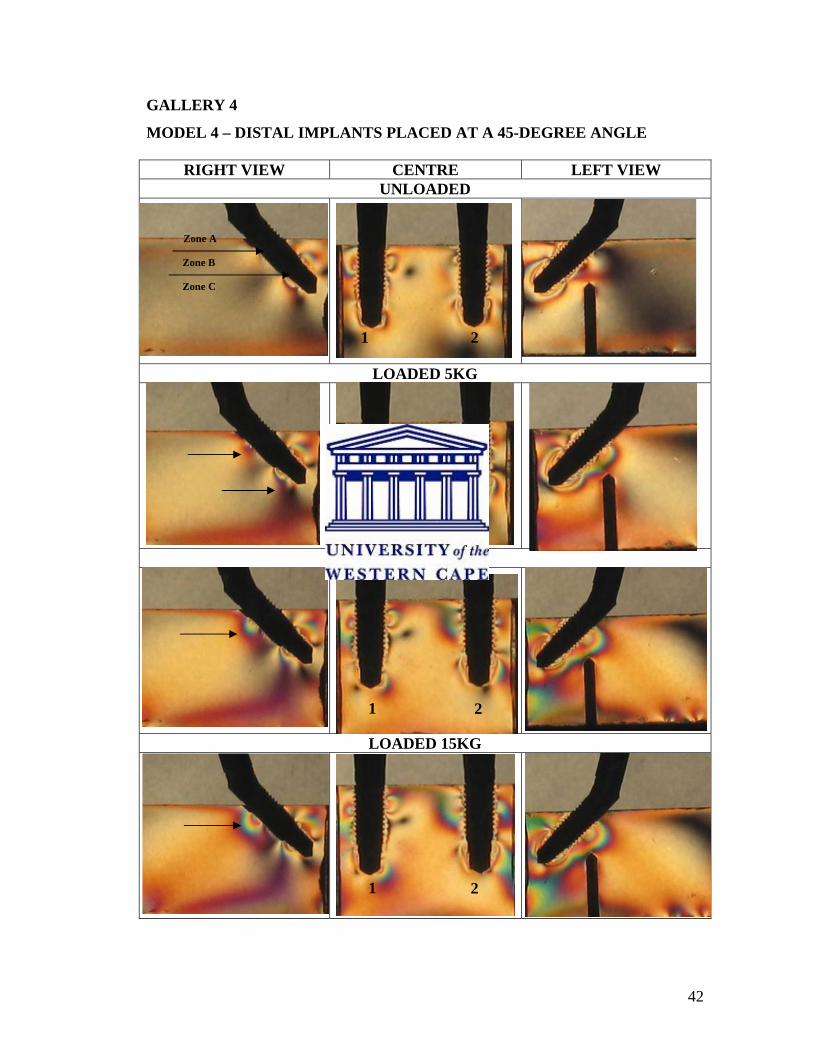
GALLERY 4
MODEL 4 – DISTAL IMPLANTS PLACED AT A 45-DEGREE ANGLE
RIGHT VIEW CENTRE LEFT VIEW UNLOADED
LOADED 5KG
LOADED 10KG
LOADED 15KG
Zone A
Zone B
Zone C
1 2
1 2
1 2
1 2

43
Right View - the unloaded right distal implant illustrated fringe concentrations in Zone
C due to residual stresses. On the mesial aspect of the implant it was quite pronounced
and within the second fringe order of 1.82 indicated by the rose red colour. This was
possibly due to the increase in implant angle placement. With the 5kg load an increase
in the fringe concentrations were observed in Zone A and C. In Zone A, a purple shade
= 1.00 along the distal aspect of the implant was visible. Zone C had two different
concentrations on the mesial and distal aspects of the implant. This is related to the
fulcrum effect at the centre of the implant. The fringe concentrations on the mesial side
were illustrated by the rose red colour (1.82). With the increase in loads to 10 and
15kg enlarged fringe concentrations were observed on the distal aspect of Zone A and
on the mesial aspect in Zone C. This is clearly illustrated in Zone A by the change in
shades from purple (1.00) to rose red (1.82) as indicated by the arrow.
Centre View - the unloaded central implants had minimal fringe concentrations in
Zone A. Minimal stresses were observed at the apex of each implant and ranged within
the first fringe order of 0.80 to 0.90 indicated by the orange and dull red shades. With
the 10kg load, the fringe concentrations increased in all three zones. Symmetrical
fringe concentrations were observed in Zone A of each implant. Zone B had black
shades indicating zero fringe order and Zone C had a small concentration of stress at
the apices of the implants marked by the faint red band with a stress magnitude of
1.82. With the 15kg load, asymmetrical fringe concentrations were observed in all
three zones. Zones A and C carried the greater stresses with Zone A having a fringe
order of 2.50 for implant 1 and 1.82 for implant 2. In Zone C, centre implant 1 had
minimal apical stresses in the range of 1.63 and implant 2 had a fringe order of 1.82
defined by the faint red fringe.
Left View - with the unloaded implant, fringe concentrations were observed distally in
Zone B and surrounding the apex of the implant in Zone C. The magnitude of stress
concentrations increased gradually with an increase in load applied. The 15kg load
displayed fringe concentrations along the entire length of the implant. The highest

44
stress magnitude of 3.10 with the green shade closest to the apex of the implant at the
distal tip was noted with this load and implant angle.
Fig 43: Graph of Model 4 Zone C to illustrate correlation between load application and
fringe order.
Model 4 Zone C
0.000.501.001.502.002.503.003.50
0 5 10 15 20
Applied Load (Kg)
Frin
ge O
rder R
C1C2L

45
CHAPTER 5
DISCUSSION
Treatment protocols for implant-supported prostheses advocating the insertion of tilted
implants are gaining increasing acceptance in the literature. Reports by Maló et al.
(2003, 2005) employing the All-On-Four® concept have shown promising results.
This study compared the effect of varying implant angulation, loading conditions and
stress fringe pattern generation in photoelastic models.
In this in vitro study, isochromatic fringe patterns were evident around the coronal
(Zone A) and apical areas (Zone C) of all the implants. In Model 1, all the implants
were parallel. Axial compressive loads of 5, 10 and 15 kg produced symmetrical fringe
concentrations in Zones A and C. The fringe order and magnitude of stress patterns
were comparative to the axial load.
In Model 2, the distal implants were angled at 15 degrees. No pronounced differences
in the stress fringe patterns were observed between the central parallel implants and
the distal angled implants for all loading conditions. The fringe concentrations
observed around the right distal implant were atypical. Very little change in fringe
order concentrations were observed with an increase in load applied. A possible reason
for this could be due to the implant insertion technique or discrepancy in implant-
abutment or abutment-bar connection.
In Model 3, the distal implants were inclined at 30 degrees. For all loading conditions
there was a notable increase in fringe patterns in Zone C at the apex of each implant.
The isochromatic stress concentrations of the straight and angled implants were not
notably different under load.
46
In Model 4, the distal implants were placed at a 45-degree angle. Residual stresses in
this model were greater compared with the other three models. This photoelastic model
illustrated greater isochromatic fringe concentrations around the angled implants
compared to the straight implants. The fringe pattern intensity and magnitude was
directly proportional to the size of the loads applied. The left angled implant under
15kg load had stress concentrations along its entire length.
In this descriptive study, the fringe order concentrations for model 4 with maximum
loading (15kg) were observed to be higher than model 1 with maximum loading
(15kg). The data are qualitative and no statistical analysis was performed whether
these observed differences are significant is unclear (Hekimoglu et al. 2004).
Limitations of the Study
The results of this in vitro experiment should be interpreted within the limitations of
the study. Experimental variables like variations in model preparation, abutment–
implant configurations, cement thickness, bar geometry and accuracy of fit and loading
conditions may have affected the results.
The photoelastic models are homogenous and isotropic (having same properties in all
directions) simulating an orthotropic material such as bone. These models do not
imitate the medullary and cortical bone in clinical situations (Brosh et al. 1998; Geng
et al. 2001).
The photoelastic models used in this study crudely represent the human mandible.
Unlike other reports the models used in this experiment were in three parts, which
were then cemented together. Other studies have used casting techniques to obtain
more realistic photoelastic models of the mandible into which the implants were
embedded during the molten phase of the photoelastic resin (Ueda et al. 2004). The
rationale behind the latter technique is the possibility of obtaining “stress-free” models
prior to loading. While this technique might provide a stress-free baseline from which

47
to compare the loaded situations the technique does not reflect what would occur in the
clinical situation. If in fact zero-value/stress-free models are obtained in this technique
then the stress patterns generated are a truer reflection of the effect of varying loading
conditions on the test models and the conclusions which may be drawn can be
considered to be more stringent.
However, Kenney and Richards (1998) used a similar technique to that employed in
this study. In their study, the implants were repeatedly screwed in and out of the
models until a stress-free site was obtained. This technique reflects more closely the
clinical procedure for the insertion of the implants. Whether a completely stress-free
situation is obtainable using this method is unsure.
In this study, completely stress-free sites were rarely obtained. No stress fringes were
observed when the sites for the fixtures were prepared (Figure 44). All implant sites
displayed increasing stress fringes once the implants were torqued in at 35Ncm (Figure
45). It is likely that in the clinical situation a completely stress-free osteotomy site is
rarely obtained once the implant has been torqued into position. In this regard, this
study more closely reflects the clinical situation. Whether these residual stress patterns
affect the results in the photoelastic models under loading conditions is uncertain.
Fig 44: Photoelastic model free of stress Fig 45: Implant torqued to 35Ncm.
patterns after implant site preparation.

48
The All-on-Four® concept promotes the use of longer distal implants. In this study, all
implants utilised were 13mm in length irrespective of angulation or site of placement.
The greater the length of the implant, the greater the implant-bone interface. It is
uncertain whether stresses may have been dissipated more along the length of the
implant if a longer distal implant had been used. There is no linear relationship
between implant length and success rate as reviewed by Wood and Vermilyea (2004)
and Lee et al. (2005). These authors do advocate the use of implants longer than 7mm.
Winkler et al. (2000) as cited in Wood and Vermilyea (2004) found the survival rates
of shorter implants statistically lower than longer implants. In Model 4, with the distal
implants placed at 45 degree angles, more coronal threads were exposed compared
with the other models, it is uncertain whether this may have influenced the results
obtained from this model.
An additional aspect to consider of this study was the combination of straight and
tilted implants with straight and angled abutments. In Model 2, the distal implants
tilted at 15-degrees had a 17-degree multiunit abutment connected. In Model 3 and 4
with the distal implants tilted at 30 and 45 degrees respectively, 30-degree multiunit
abutments were connected. Very little research has been conducted to examine the
effects of angled abutments on the implant-bone interface. Photoelastic and strain
gauge analyses on single implants connected with various abutments ranging in
inclination from 0 to 35 degrees have been conducted by Clelland and Gilat (1992);
Clelland et al. (1993) and Brosh et al. (1998). They found a significant increase in
stress and strain values with an increase in abutment angulation. These values however
were still within the physiological limitations of bone.
The superstructure was cemented to the temporary abutments with Panavia resin
cement. This technique is supported by Clelland and van Putten (1997) and Goossens
and Herbst (2003) who stated the advantages of this technique to improve passivity.
Cemented superstructures are generally accepted as being more passive than unitary
screw-retained bars. This technique would have reduced any further increases in

49
residual fringe concentrations. The stress patterns produced by a bar fabricated by the
computer-milled technique would be interesting to compare with the current study.
Another variable that should be considered when viewing the results is the increase in
length of the metal frameworks with an increase in the angulation of the distal
implants. A greater span length was created with the 45-degree distal implants. The
effect of this increased length of the span relative to increasing implant angle did not
fall within the scope of this study and could be explored in future studies.
Further investigation is needed to evaluate whether the implant to superstructure height
ratio may have influenced the isochromatic stress patterns produced. Once the bars
were connected to the abutments on the photoelastic models the difference in height
was visible between the zero inclination central implants and the distal angled
implants. It is uncertain if the distance may have influenced the fringe order patterns
produced.
A further limitation of this study is that fringe patterns cannot be extrapolated into
bone microstrain values. It can only indicate regions along the implant that are in all
probability vulnerable to develop microfractures. This study illustrated that stress is
concentrated along the coronal and apical parts of the implant. This is in agreement
with studies done by Clelland et al. (1993); Federick and Caputo (1996) and Brosh et
al. (1998).
Clinical Relevance
Alveolar bone like any other biological tissue displays an adaptive range in which
functional or non-functional demands may be tolerated. This range of tolerance to
injury is expressed as microstrains in bony tissues. The acceptable range is between
two thousand to four thousand microstrains. Above four thousand microstrains
microfractures are likely to occur at the bone-implant interface with potential loss of
osseointegration. Below two thousand microstrains a form of disuse atrophy may
result [Carter et al. (1981); Carter and Caler (1983); Taylor (1989) as cited in Morris et

50
al. (2004)]. Van Oosterwyk et al. (1998) describes Wolff’s Law (1892) “Law of Bone
Transformation” which states that every change in the function of bone causes a
change in the internal and external conformation of the bone. This process is called
bone adaptation. Frost (1983) as cited in Van Oosterwyk et al. (1998) defined a
minimum strain level that has to be exceeded to induce bone adaptation: the Minimum
Effective Strain (MES). Lanyon and Rubin (1982) quoted from Van Oosterwyk et al.
(1998) stated that not only the strain level but also the number of strain cycles and the
strain distribution change influences the bone response.
The osseointegrated interface is a dynamic biological environment. French et al.
(1989) stated that the biologic response of bone in the peri-implant region to occlusally
generated stress is directly proportional to the concentration and magnitude of the
stress. The concentration and magnitude of stress surrounding implants are subjected
to several variables such as the opposing occlusion, occlusal force, the number of
implants available to carry the load, the position of the implant within the prosthesis,
rigidity of the prosthesis and the implant geometry. In their in vitro photoelastic study
evaluating the peri-implant stresses of four commercial implants they found that tilting
forces as compared to axial forces exerted a greater magnitude of stress in the coronal
area. They concluded that occlusal forces should be axially applied when prostheses
are inserted.
There are conflicting reports in the literature about the effects of overload on the
implant bone-interface. Crestal cortical bone is much denser than medullary bone and
responds to injury in a much slower fashion than trabecular bone. Ongoing crestal
bone loss may be a sign of fixture overload and may result in loss of osseointegration
(Isidor 1996; Miyata et al.1998; Van Oosterwyk et al.1998; O’Mahony et al. 2000;
Heitz-Mayfield et al. 2004).
Stanford (2005) stated that the effects of occlusal overload might result in greater
biomechanical problems than actual bone loss. Goodacre et al. (2003) as cited in
Stanford (2005) found biomechanical factors, which include wear of prosthesis

51
material, prosthesis fractures and screw loosening more significant than crestal bone
loss.
Various studies have explored the question of angled implants. However, comparison
between the results is difficult due to different experimental methodologies (Canay et
al. 1996; Krekmanov et al. 2000; Aparicio et al. 2001; Krönstrom et al. 2003; Ueda et
al. 2004; Malo et al. 2003, 2005).
In this study, similar increases in stress fringe concentrations were seen as in Ueda et
al. (2004) and a finite element analysis of Canay et al. (1996).
An exhaustive search was conducted to find similar studies which compared stress
patterns in the All-on-Four® concept without success. This study seems to be unique
in its methodology and comparison with other similar studies should be conducted
with caution.
Based on the findings of this study the routine use of tilted implants should be
confirmed clinically through randomised prospective clinical trials.

52
CHAPTER 6
CONCLUSIONS AND RECOMMENDATIONS
The distal implants of the 45-degree model displayed the highest stress patterns, and
these increased with an increase in load. Caution is advised in the extrapolation of these
results to the clinical situation. Within the limitations of the study the following
conclusions can be drawn:
1. A 45-degree tilted distal implant cannot be recommended over a lesser tilt of 15
and 30 degrees.
2. Since stress patterns increased with higher loads for the 45-degree tilted implants,
these should be avoided for the patients with known parafunction associated with
increased occlusal forces like clenchers and bruxers.
3. The state of the opposing dentition and the patient’s occlusal scheme should be
considered before utilising this technique.
4. Further research can be conducted examining the effects of cross-arch
stabilisation (or lack thereof) on tilted implants.

53
BIBLIOGRAPHY
1. Adell R, Lekholm U, Rockler B, Brånemark PI. A 15-year study of
osseointegrated implants in the treatment of the edentulous jaw. International
Journal of Oral Surgery 1981;10:387-416.
2. Aparicio C. A new method to routinely achieve passive fit of ceramometal
prostheses over Brånemark osseointegrated implants: a two-year report.
International Journal of Periodontics & Restorative 1994;14:404-419.
3. Aparicio C, Perales P, Rangert B. Tilted implants as an alternative to maxillary
sinus grafting: a clinical, radiologic, and periotest study. Clinical Implant
Dentistry and Related Research 2001;3:39-49.
4. Asundi A, Kishen A. A strain gauge and photoelastic analysis of in vivo strain
and in vitro stress distribution in human dental supporting structures. Archives
of Oral Biology 2000;45:543-550.
5. Barbier L, vander Sloten J, Krzesinski G, Schepers E, van der Perre G. Finite
element analysis of non-axial versus axial loading of oral implants in the
mandible of the dog. Journal of Oral Rehabilitation 1998;25:847-858.
6. Bozkaya D, Muftu S, Muftu A. Evaluation of load transfer characteristics of
five different implants in compact bone at different load levels by finite
element analysis. Journal of Prosthetic Dentistry 2004;92:523-530.
7. Brosh T, Pilo R, Sudai D. The influence of abutment angulation on strains and
stresses along the implant/bone interface: Comparison between two
experimental techniques. Journal of Prosthetic Dentistry 1998;79:328-334.

54
8. Bruggenkate CM, Sutter F, Oosterbeek HS, Schroeder A. Indications for
angled implants. Journal of Prosthetic Dentistry 1992;76:85-93.
9. Canay S, Hersek N, Akpinar I, Asik Z. Comparison of stress distribution
around vertical and angled implants with finite-element analysis. Quintessence
International 1996;27:591-598.
10. Clelland NL, Gilat A. The effect of abutment angulation on stress transfer for
an implant. Journal of Prosthodontics 1992;1:24-28.
11. Clelland NL, Gilat A, McGlumphy EA, Brantley WA. A photoelastic and
strain gauge analysis of angled abutments for an implant system. International
Journal of Oral & Maxillofacial Implants 1993;8:541-548.
12. Clelland NL, van Putten MC. Comparison of strains produced in a bone
stimulant between conventional cast and resin-luted implant frameworks.
International Journal of Oral & Maxillofacial Implants 1997;12:793-799.
13. Dally LW, Riley WF. Experimental Stress Analysis. McGraw Hill, New York
1978:406-486.
14. Duyck J, Van Oosterwyck H, Vander Sloten J, De Cooman M, Puers R, Naert
I. Magnitude and distribution of occlusal forces on oral implants supporting
fixed prostheses: an in vivo study. Clinical Oral Implants Research
2000;11:465–475.
15. Duyck J, Rønold HJ, Van Oosterwyck H, Naert I, Vander Sloten J, Ellingsen
JE. The influence of static and dynamic loading on marginal bone reactions
around osseointegrated implants: an animal experimental study. Clinical Oral
Implants Research 2001;12:207-218.

55
16. Eisenmann E, Mokabberi A, Walter MH, Freesmeyer WB. Improving the fit of
implant supported superstructures using the spark erosion technique.
International Journal of Oral & Maxillofacial Implants 2004;19:810-818.
17. Eskitascioglu G, Usumez A, Sevimay M, Soykan E, Unsal E. The influence of
occlusal loading location on stresses transferred to implant-supported
prostheses and supporting bone: a three-dimensional finite element study.
Journal of Prosthetic Dentistry 2004;91:144-150.
18. Federick DR, Caputo AA. Effects of overdenture retention designs and implant
orientations on load transfer characteristics. Journal of Prosthetic Dentistry
1996;76:624-632.
19. Fernandes CP, Glantz PJ, Svensson SA, Bergmark A. Reflection
photoelasticity: a new method for studies of clinical mechanics in prosthetic
dentistry. Dental Materials 2003;19:106-117.
20. French AA, Bowles CQ, Parham PL, Eick JD, Killoy WJ, Cobb CM.
Comparison of peri-implant stress transmitted by four commercially available
osseointegrated implants. International Journal of Periodontics & Restorative
Dentistry 1989;9:221-230.
21. Geng JP, Tan KBC, Liu GR. Application of finite element analysis in implant
dentistry: A review of the literature. Journal of Prosthetic Dentistry
2001;85:585-598.
22. Glossary of Prosthodontic Terms. Journal of Prosthetic Dentistry 1987;58:713-
762.
56
23. Goossens IC, Herbst D. Evaluation of a new method to achieve optimal
passivity of implant-supported superstructures. South African Dental Journal
2003;58:279-85,287.
24. Heitz-Mayfield LJ, Schmid B, Weigel C, Gerber S, Bosshardt DD, Jönsson J,
Lang NP. Does excessive occlusal load affect osseointegration? An
experimental study in the dog. Clinical Oral Implants Research 2004;15:259-
268.
25. Hekimoglu C, Anil N, Cehreli MC. Analysis of strain around endosseous
dental implants opposing natural teeth or implants. Journal of Prosthetic
Dentistry 2004;92:441-446.
26. Helldén LB, Dérand T. Description and evaluation of a simplified method to
achieve passive fit between cast titanium frameworks and implants.
International Journal of Oral & Maxillofacial Implants 1998;13:190-196.
27. Isidor F. Loss of osseointegration caused by occlusal load of oral implants. A
clinical and radiographic study in monkeys. Clinical Oral Implants Research
1996;7:143-152.
28. Jackson BJ. Occlusal principles and clinical applications for endosseous
implants. Journal of Oral Implantology 2003;24:230-234.
29. Kenney R, Richards MW. Photoelastic stress patterns produced by implant-
retained overdentures. Journal of Prosthetic Dentistry 1998;80:559-564.
30. Kim Y, Oh TJ, Misch CE, Wang H-L. Occlusal considerations in implant
therapy: Clinical guidelines with biomechanical rationale. Clinical Oral
Implants Research 2005;16:26-35.

57
31. Krekmanov L, Kahn M, Rangert B, Lindstrom H. Tilting of posterior
mandibular and maxillary implants for improved prosthesis support.
International Journal of Oral & Maxillofacial Implants 2000;15:405-414.
32. Krönstrom M, Widbom T, Lofquist LE, Henningsom C, Widbom C, Lundberg
T. Early functional loading of conical Brånemark implants in the edentulous
mandible: A 12-month follow-up clinical report. Journal of Prosthetic
Dentistry 2003;89:335-340.
33. Lee JH, Frias V, Lee KW, Wright RF. Effect of implant size and shape on
implant success rates: A literature review. Journal of Prosthetic Dentistry
2005;94:377-381.
34. Maló P, Rangert B, Nobre M. “All-on-Four” immediate-function concept with
Brånemark System® implants for completely edentulous mandibles: A
retrospective clinical study. Clinical Implant Dentistry and Related Research
2003;5(Sup1):2-9.
35. Maló P, Rangert B, Nobre M. All-on-4 immediate-function concept with
Brånemark System® implants for completely edentulous maxillae: A 1-year
retrospective clinical study. Clinical Implant Dentistry and Related Research
2005;7(Sup1):588-594.
36. Mericske-Stern R, Hofmann J, Wedig A, Geering AH. In vivo measurements
of maximal occlusal force and minimal pressure threshold on overdentures
supported by implants or natural roots: a comparative study, Part 1.
International Journal of Oral & Maxillofacial Implants 1993;8:641-649.
37. Mericske-Stern R, Assal P, Mericske E, Bürgin W. Occlusal force and oral
tactile sensibility measured in partially edentulous patients with ITI implants.
International Journal of Oral & Maxillofacial Implants 1995;10:345-354.

58
38. Misch CE. Contemporary Implant Dentistry. Second Edition, Mosby St. Louis
Missouri 1999:609-628.
39. Miyata T, Kobayashi Y, Araki H, Motomura Y, Shin K. The influence of
controlled occlusal overload on peri-implant tissue: a histologic study in
monkeys. International Journal of Oral & Maxillofacial Implants
1998;13:677-683.
40. Morris H, Ochi S, Crum P, Orenstein IH, Winkler S. AICRG, Part I: A 6-year
multicentered, multidisciplinary clinical study of a new and innovative implant
design. Journal of Oral Implantology 2004;30:125-133.
41. Naconecy MM, Teixeira ER, Shinkai RSA, Frasca LCF, Cervieri A. Evaluation
of the accuracy of 3 transfer techniques for implant-supported prostheses with
multiple abutments. International Journal of Oral & Maxillofacial Implants
2004;19:192-198.
42. Nicholls JI. The measurement of distortion: theoretical considerations. Journal
of Prosthetic Dentistry 1977;37:578-586.
43. O’Mahony A, Bowles Q, Woolsey G, Robinson SJ, Spencer P. Stress
distribution in the single-unit osseointegrated dental implant: Finite element
analyses of axial and off-axial loading. Implant Dentistry 2000;9:207-218.
44. Örtorp A, Jemt T, Back T, Jalevik T. Comparisons of precision of fit between
cast and CNC-milled titanium implant frameworks for the edentulous
mandible. International Journal of Prosthodontics 2003;16:194-200.
45. Rangert B, Jemt T, Jörneus L. Forces and moments on Brånemark implants.
International Journal of Oral & Maxillofacial Implants 1989;4:241-247.

59
46. Rangert BR, Sullivan RM, Jemt TM. Load factor control for implants in the
posterior partially edentulous segment. International Journal of Oral &
Maxillofacial Implants 1997;12:360-370.
47. Riedy SJ, Lang BR, Lang BE. Fit of implant frameworks fabricated by
different techniques. Journal of Prosthetic Dentistry 1997;78:596-604.
48. Rodriguez AM, Aquilino SA, Lund PS. Cantilever and implant biomechanics:
a review of the literature: Part 2. Journal of Prosthodontics 1994;3:114-118.
49. Sahin S, Cehreli MC, Yalcin E. The influence of functional forces on the
biomechanics of implant-supported prostheses – a review. Journal of Dentistry
2002;30:271-282.
50. Schackleton JL, Carr L, Slabbert JCG, Becker PJ. Survival of fixed implant-
supported prostheses related to cantilever lengths. Journal of Prosthetic
Dentistry 1994;71:23-26.
51. Stanford CM. Issues and considerations in dental implant occlusion: what do
we know, and what do we need to find out? Journal of California Dental
Association 2005;33:329-336.
52. Sütpideler M, Eckert SE, Zobitz M, An KN. Finite element analysis of effect of
prosthesis height, angle of force application, and implant offset on supporting
bone. International Journal of Oral & Maxillofacial Implants 2004;19:819-
825.
53. Taylor TD, Wiens J, Carr A. Evidence-based considerations for removable
prosthodontic and dental implant occlusion: A literature review. Journal of
Prosthetic Dentistry 2005;94:555-560.

60
54. Ueda C, Markarian RA, Sendyk CL, Langana DC. Photoelastic analysis of
stress distribution on parallel and angled implants after installation of fixed
prosthesis. Brazilian Oral Research 2004;18:45-52.
55. Van Oosterwyk H, Duyck J, Vander Sloten J, Van der Perre G, De Cooman M,
Lievens S, Puers R, Naert I. The influence of bone mechanical properties and
implant fixation upon bone loading around oral implants. Clinical Oral
Implants Research 1998;9:407-418.
56. Van Zyl PP, Grundling NL, Jooste CH, Terblanche E. Three dimensional finite
element model of a human mandible incorporating six osseointegrated implants
for stress analysis of mandibular cantilever prosthesis. International Journal of
Oral & Maxillofacial Implants 1995;10:51-57.
57. Vigolo P, Majzoub Z, Cordioli G. Evaluation of the accuracy of three
techniques used for multiple implant abutment impressions. Journal of
Prosthetic Dentistry 2003;89:186-192.
58. Wee AG, Aquilino SA, Schneider RL. Strategies to achieve fit in implant
prosthodontics: a review of the literature. International Journal of
Prosthodontics 1999;12:167-178.
59. Wood MR, Vermilyea SG. A review of selected dental literature on evidence
based treatment planning for dental implants: Report of the Committee on
Research in Fixed Prosthodontics of the Academy of Fixed Prosthodontics.
Journal of Prosthetic Dentistry 2004;92:447-462.

61
APPENDIX A
LIST OF IMPLANT COMPONENTS USED
IMPLANT COMPONENTS
QUANTITY PRODUCT NUMBER
LOT NUMBER
Ø4.3 Replace Select Implants
16 29414 658259 x 16
Ø4.3 multiunit abutments 4mm
10 29202 654769 x5 649396 655313 x2
17° Angled RP Ø4.3 multiunit abutments 4mm
2 29239 651666 x2
30° Angled RP Ø4.3 multiunit abutments 4mm
4 29240 656855 x3 657383
Temporary RP Ø4.3 multiunit abutments
16 29046
Multiunit abutment open tray impression copings
8 29089 44776 x4
RP Ø4.3 multiunit abutment lab analogues
16 29110
Nobel Biocare Surgical kit for tapered implants
1 -
Nobel Biocare All-on-Four abutment try-in kit
1 -

62
APPENDIX B
METAL COMPOSITION OF BARS
Talladium Tilite Alloy
Contains
Nickel 60-76%
Chromium 12-21%
Molybdenum 4-14%
Titanium 4-6%
Physical properties:
Casting Temperatures 1329°C
Vicker’s Hardness 326-356
Yield Strength 6,621 bar (96 000psi)
Ultimate tensile strength 10,621 bar
Elongation 8-12%
Specific Gravity 7.7gm/cc

63
APPENDIX C
DETAILS OF PHOTOGRAPHY Camera Model Name Canon PowerShot G3
Shooting Date/Time 2006/04/28 14:58:04
Shooting Mode Aperture-Priority AE
Photo Effect Mode Neutral
Tv( Shutter Speed ) 1/30 sec.
Av( Aperture Value ) F 8.0
Metering Mode Center-weighted averaging
Exposure Compensation -1
ISO Speed 50
Lens 7.2 - 28.8mm
Focal Length 28.8mm
Digital Zoom x 3.6
Image Size 2272x1704
Image Quality Superfine
Flash Off
White Balance Auto
AF Mode Single AF
File Size 637KB
File Number 101-0151
Drive Mode Single-frame shooting

64
APPENDIX D
FRINGE ORDERS OF ZONE A AND C FOR MODELS 1-4
MODEL 1 FRINGE ORDERS OF ZONE A AND C
ZONE RIGHT CENTRE 1 CENTRE 2 LEFT
UNLOADED A 1.0 1.22 1.22 1.08
C 1.63 1.63 1.63 1.63
5KG A 1.0 1.22 1.22 1.39
C 1.63 1.82 2.65 1.82
10KG A 1.39 1.22 1.39 1.39
C 1.82 1.82 2.65 2.65
15KG A 2.00 1.22 1.39 1.63
C 2.65 1.82 2.65 2.65
MODEL 2 FRINGE ORDERS OF ZONE A AND C
ZONE RIGHT CENTRE 1 CENTRE 2 LEFT
UNLOADED A 0.90 1.39 1.22 0.60
C 0.90 1.63 1.63 1.63
5KG A 1.0 1.39 1.39 0.80
C 1.22 1.63 1.63 1.63
10KG A 0.90 1.63 1.63 1.63
C 1.39 2.50 1.63 2.65
15KG A 0.90 2.00 2.00 1.82
C 1.39 2.50 2.50 2.65

65
MODEL 3 FRINGE ORDERS OF ZONE A AND C
ZONE RIGHT CENTRE 1 CENTRE 2 LEFT
UNLOADED A 0.80 1.63 1.0 0.90
C 1.00 1.63 1.22 1.63
5KG A 1.00 1.82 1.63 1.0
C 1.00 1.63 1.63 1.63
10KG A 1.22 1.82 1.82 1.0
C 1.39 1.82 2.50 1.63
15KG A 1.39 2.50 1.82 0.90
C 1.39 2.00 1.82 1.63
MODEL 4 FRINGE ORDERS OF ZONE A AND C
ZONE RIGHT CENTRE 1 CENTRE 2 LEFT
UNLOADED A 0.28 1.63 1.0 0.60
C 1.82 0.9 0.8 1.82
5KG A 1.0 1.82 1.39 1.39
C 1.82 1.39 1.39 2.00
10KG A 1.39 2.0 1.63 1.82
C 1.82 1.63 1.82 2.65
15KG A 2.0 2.50 1.82 1.82
C 1.82 1.63 1.82 3.10