Embed Size (px)
Citation preview
Evaluation of simulated precipitation fields of some MAP events: sensitivity experiments
and model intercomparison
(1) LA CNRS/UPS, Toulouse, France
(2) CNRM, Météo-France, Toulouse, France(3) RPN, Montréal, Canada(4) ISAC, CNR, Bologna, Italy(5) University of L ’Aquila, Italy(6) University of Milano, Italy(7) University of Munich, Germany
E. Richard (1), N. Asencio (2), R. Benoit (3), A. Buzzi (4), R. Ferretti (5), F. Lascaux (1), P. Malguzzi (4), S. Serafin (6), G. Zängl (7), J-F. Georgis (1)
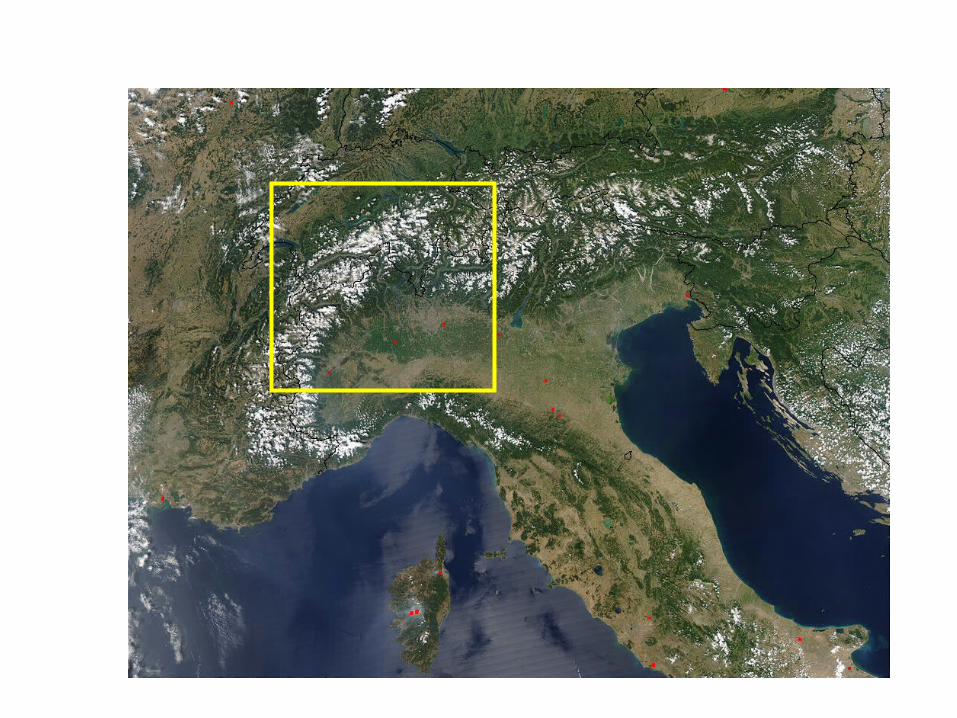
1. Sensitivity experiments based upon Meso-NH
IOP2a 17 September 1999:
A short, intense, isolated, convective event
70 mm within 12h

14:00
15:00
16:00
17:00
18:00
19:00
20:00
21:00
22:00
23:00
24:00

RADAR Reflectivity Z 2000mRADAR Reflectivity Z 2000m
OBSERVATIONOBSERVATION MESO-NH COMPUTATIONMESO-NH COMPUTATION
The convective system of MAP - IOP 2a (17 September, 1999, hourly time evolution)
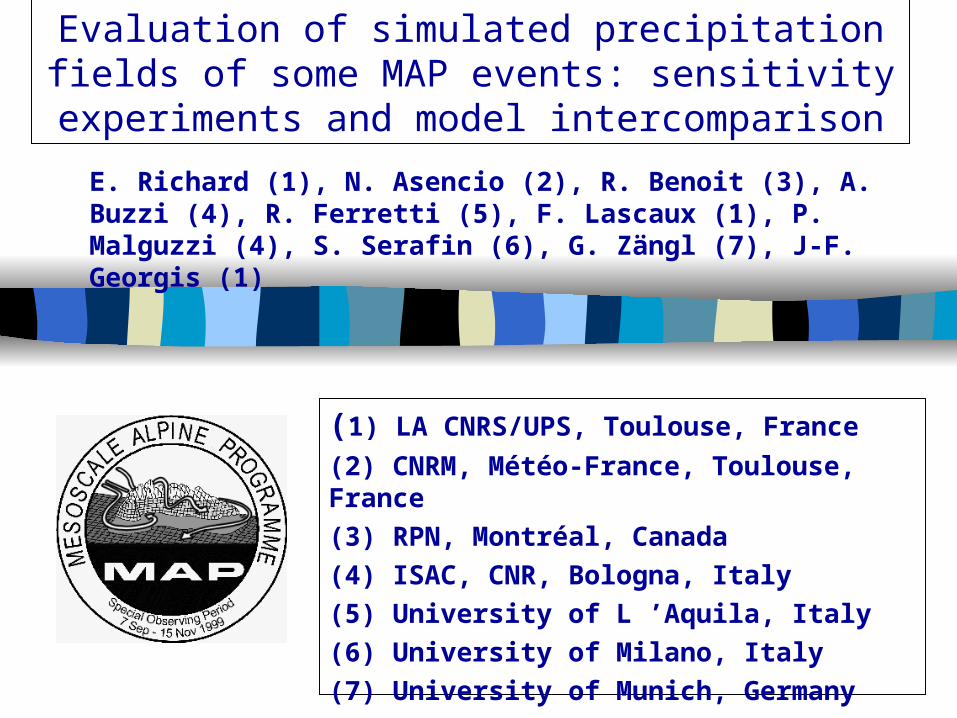
Toce Ticino watershed

ECMWF: OP. ANA ECMWF: OP. ANA 19991999
ARPEGE: OP. ANA. 1999ARPEGE: OP. ANA. 1999 ECMWF: REANALYSISECMWF: REANALYSIS
RADAR OBSERVATIONS

ANA. OP. 1999ANA. OP. 1999 REANALYSISREANALYSIS
850hPa water vapor mixing ratio : 17 September 1999 12UTC
IOP 2a
REANA (NO MAP REANA (NO MAP DATA)DATA)
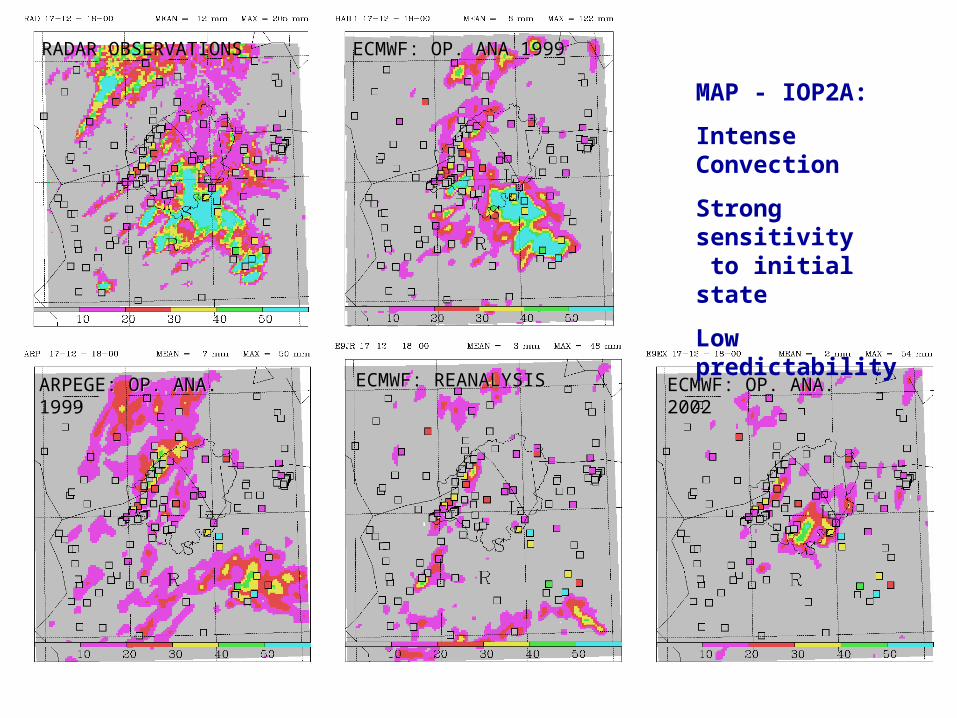
ECMWF: OP. ANA ECMWF: OP. ANA 19991999
ARPEGE: OP. ANA. 1999ARPEGE: OP. ANA. 1999 ECMWF: OP. ANA. ECMWF: OP. ANA. 20022002
ECMWF: REANALYSISECMWF: REANALYSIS
MAP - IOP2A:
Intense Convection
Strong sensitivity to initial state
Low predictability
RADAR OBSERVATIONS
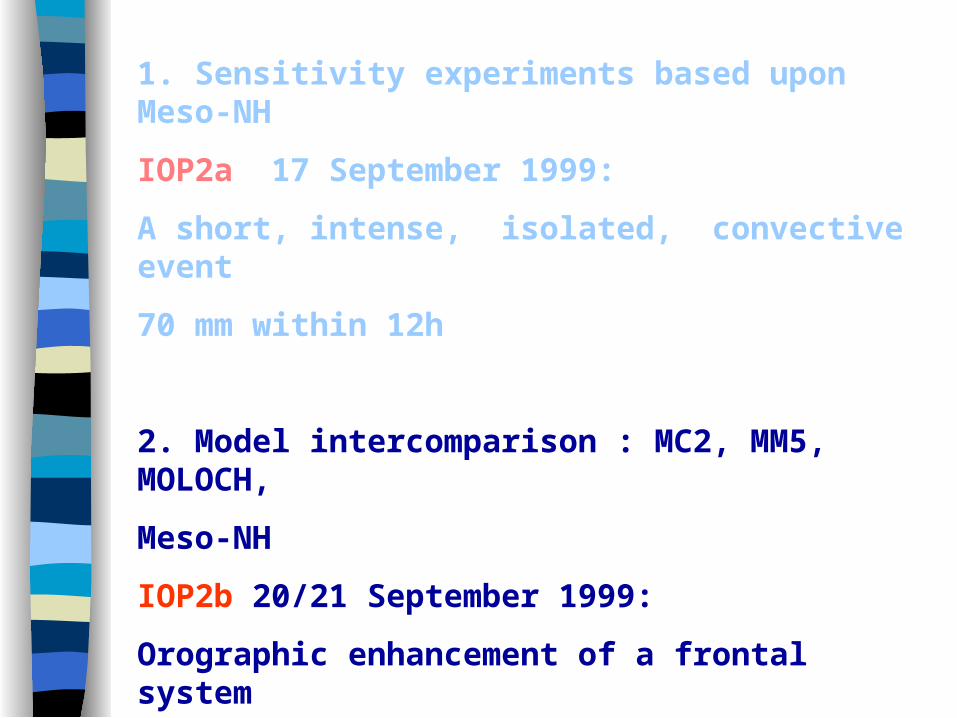
1. Sensitivity experiments based upon Meso-NH
IOP2a 17 September 1999:
A short, intense, isolated, convective event
70 mm within 12h
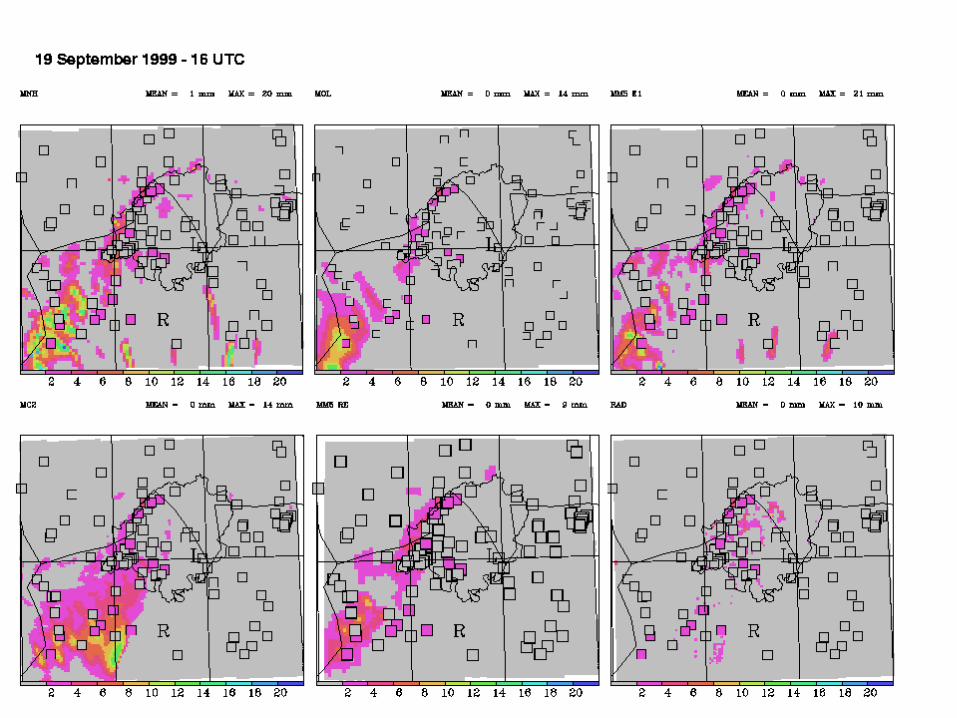
2. Model intercomparison : MC2, MM5, MOLOCH,
Meso-NH
IOP2b 20/21 September 1999:
Orographic enhancement of a frontal system
200 mm within 30h
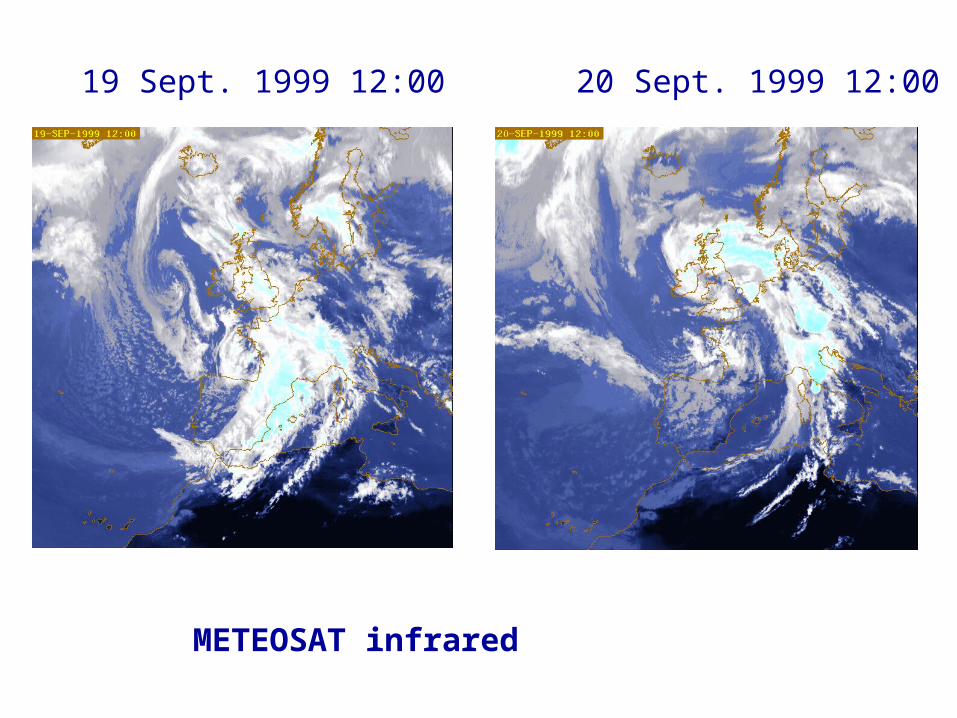
19 Sept. 1999 12:00 20 Sept. 1999 12:00
METEOSAT infrared
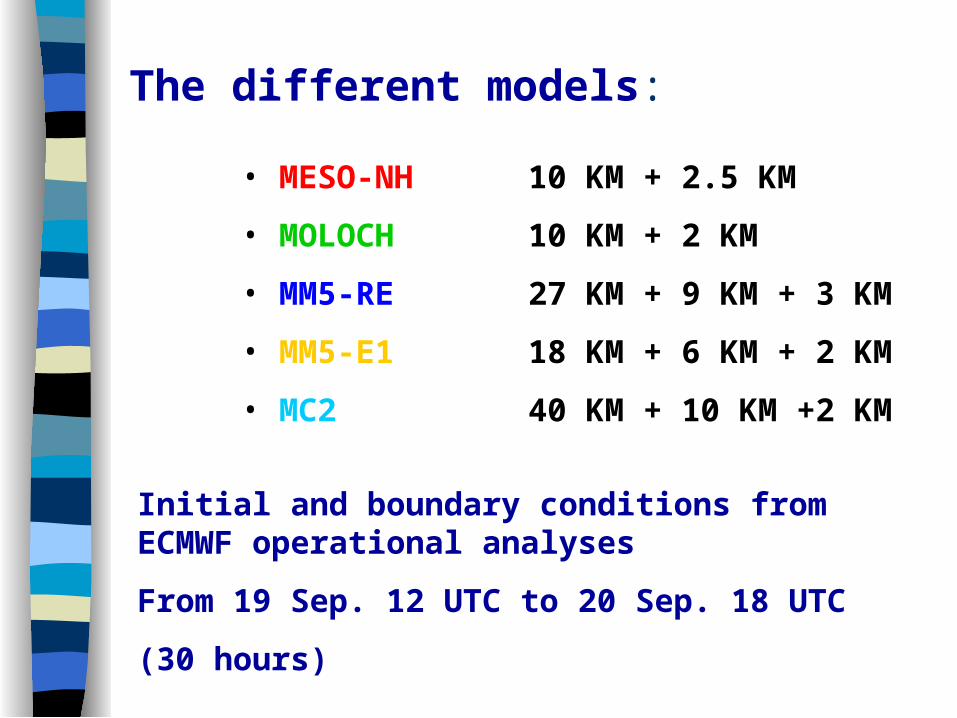
The different models:
• MESO-NH 10 KM + 2.5 KM
• MOLOCH 10 KM + 2 KM
• MM5-RE 27 KM + 9 KM + 3 KM
• MM5-E1 18 KM + 6 KM + 2 KM
• MC2 40 KM + 10 KM +2 KM
Initial and boundary conditions from ECMWF operational analyses
From 19 Sep. 12 UTC to 20 Sep. 18 UTC
(30 hours)
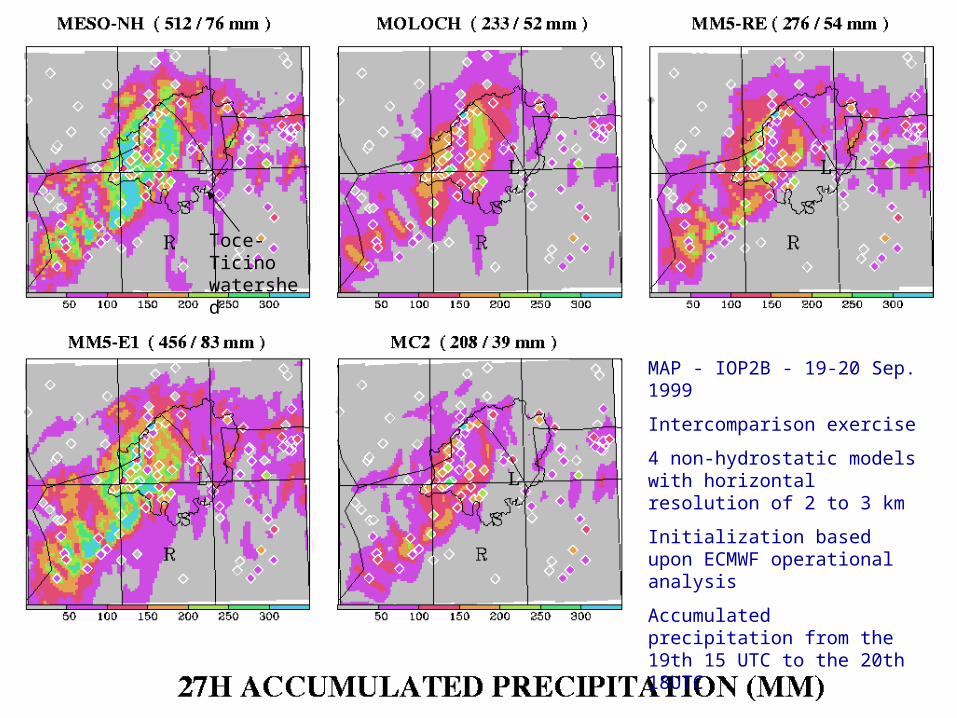
MAP - IOP2B - 19-20 Sep. 1999
Intercomparison exercise
4 non-hydrostatic models with horizontal resolution of 2 to 3 km
Initialization based upon ECMWF operational analysis
Accumulated precipitation from the 19th 15 UTC to the 20th 18UTC
Toce-Ticino watershed

Rain gauges
Time evolution of the mean hourly precipitation rate
Radar
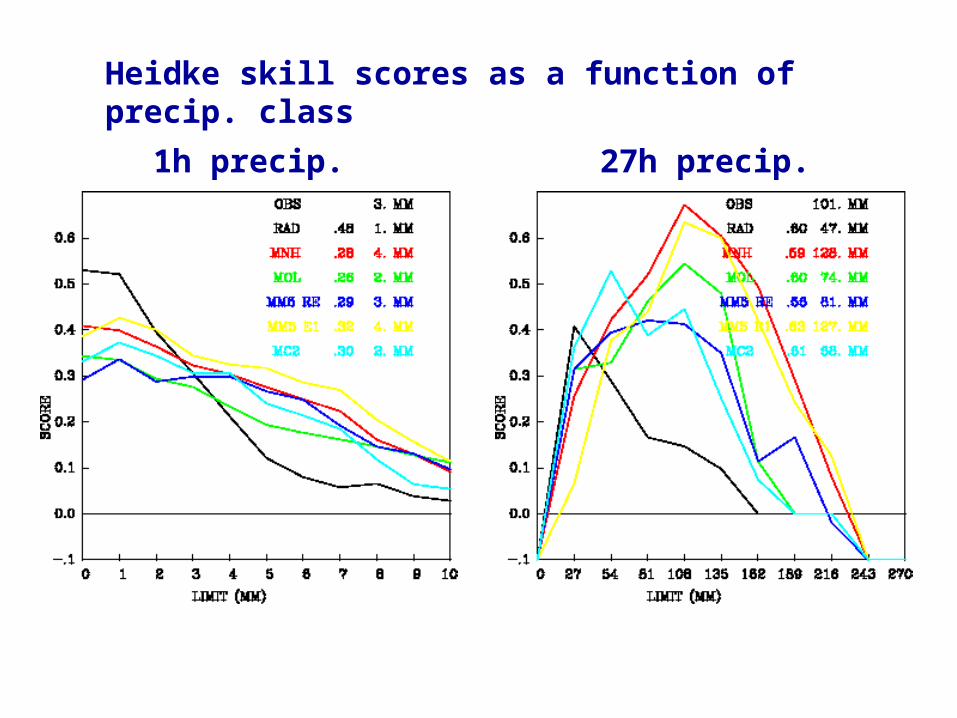
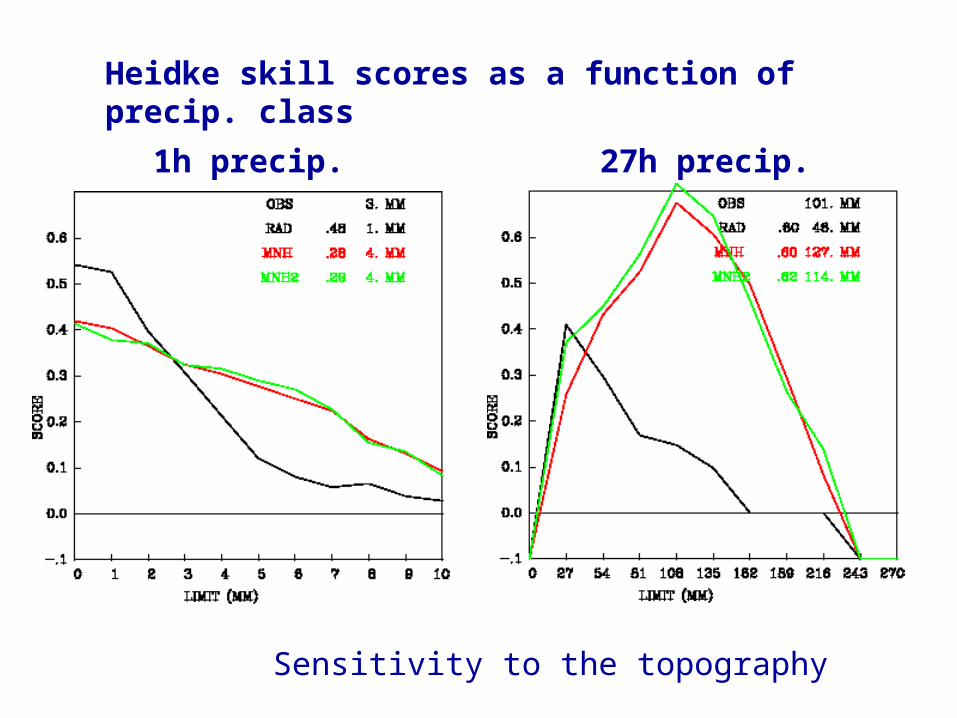
Heidke skill scores as a function of precip. class
1h precip. 27h precip.
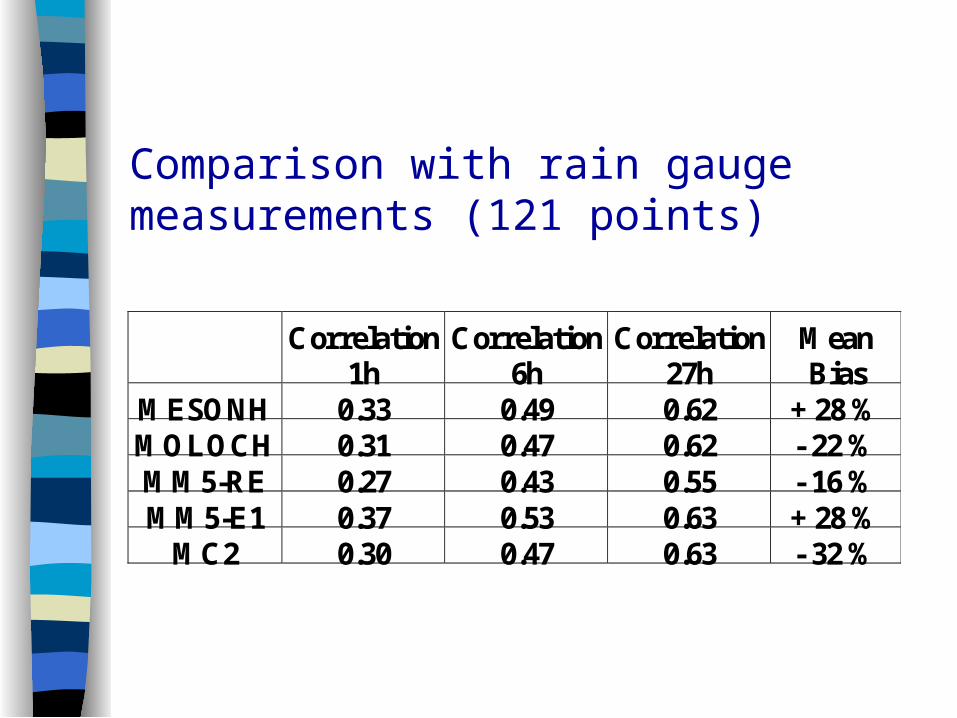
Comparison with rain gauge measurements (121 points)
Correlation 1h
Correlation 6h
Correlation 27h
Mean Bias
MESONH 0.33 0.49 0.62 + 28 % MOLOCH 0.31 0.47 0.62 - 22 % MM5-RE 0.27 0.43 0.55 - 16 % MM5-E1 0.37 0.53 0.63 + 28 %
MC2 0.30 0.47 0.63 - 32 %
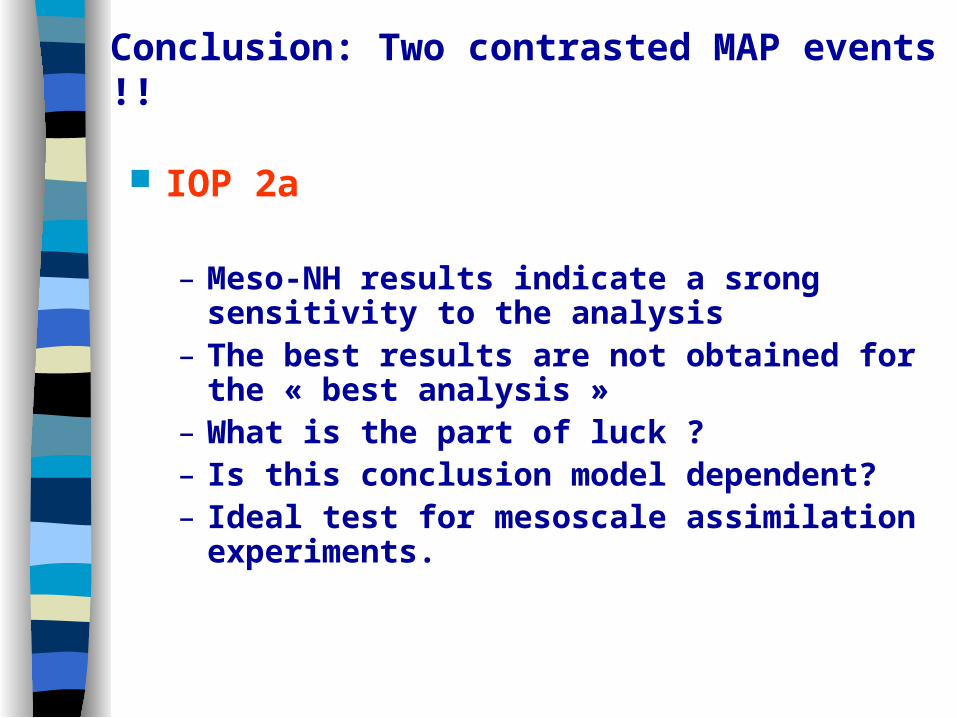
Conclusion: Two contrasted MAP events !!
IOP 2a
– Meso-NH results indicate a srong sensitivity to the analysis
– The best results are not obtained for the « best analysis »
– What is the part of luck ?– Is this conclusion model dependent?– Ideal test for mesoscale assimilation
experiments.
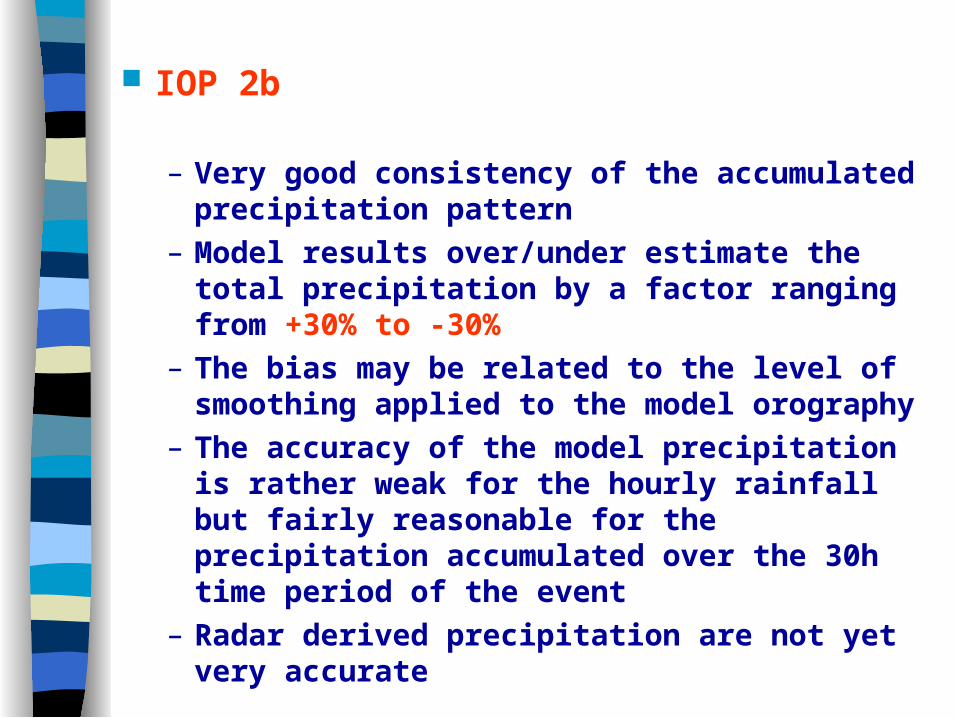
IOP 2b
– Very good consistency of the accumulated precipitation pattern
– Model results over/under estimate the total precipitation by a factor ranging from +30% to -30%
– The bias may be related to the level of smoothing applied to the model orography
– The accuracy of the model precipitation is rather weak for the hourly rainfall but fairly reasonable for the precipitation accumulated over the 30h time period of the event
– Radar derived precipitation are not yet very accurate

The End !
Interested ??
Join the MAP working group on Numerical Modelling
http://www.aero.obs-mip.fr/map/MAP_wgnum
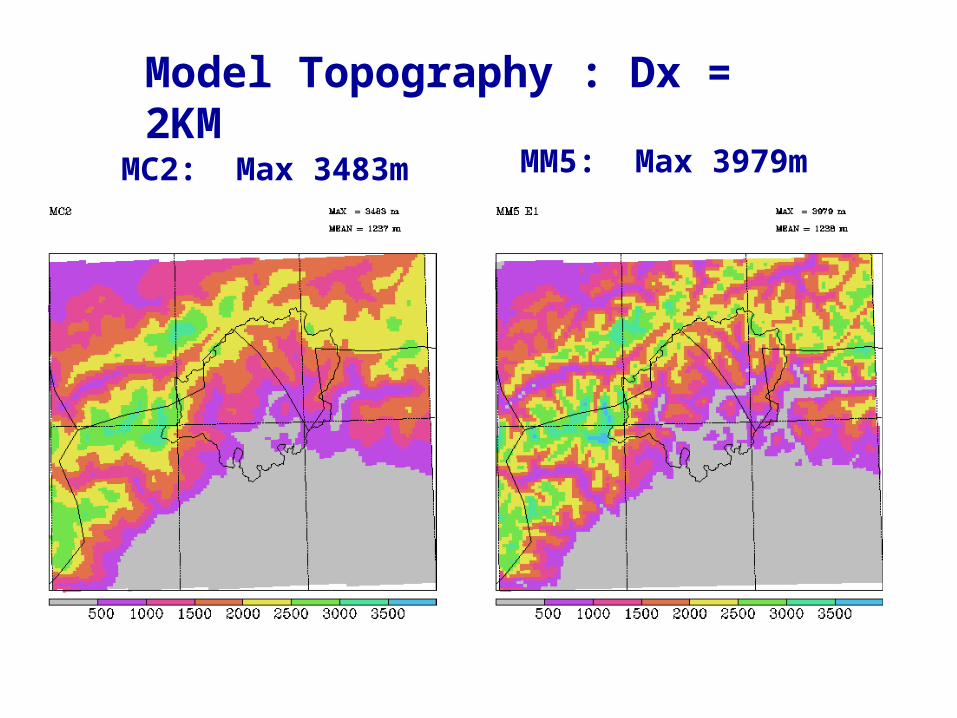
Model Topography : Dx = 2KM
MC2: Max 3483m
MM5: Max 3979m
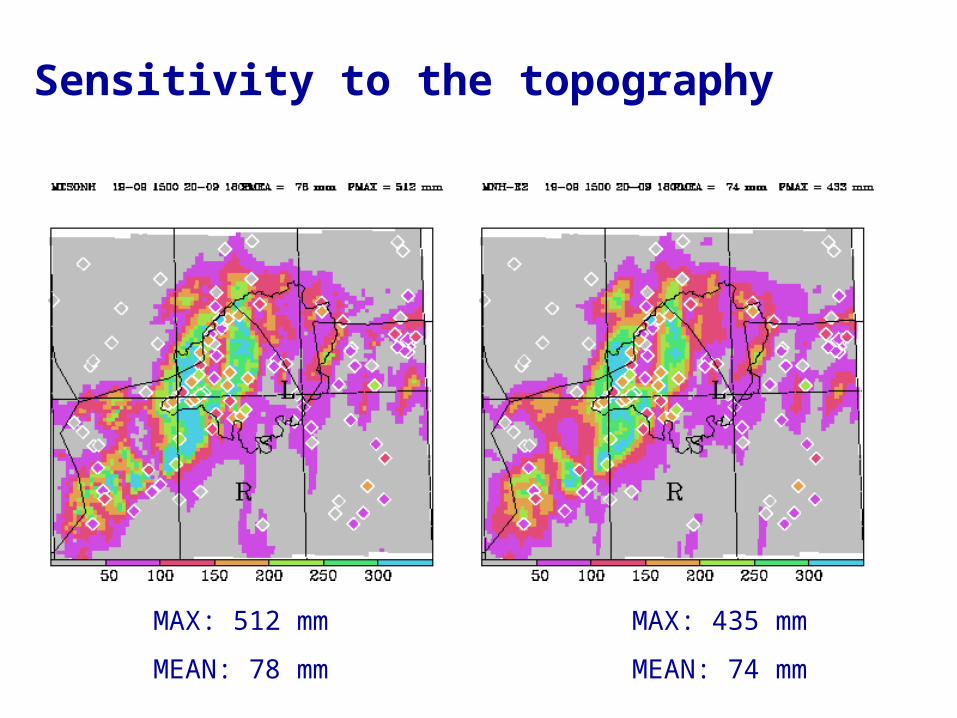
Sensitivity to the topography
MAX: 512 mm MAX: 435 mm
MEAN: 78 mm MEAN: 74 mm
Heidke skill scores as a function of precip. class
1h precip. 27h precip.
Sensitivity to the topography

Sensitivity to the analysis
ECMWF Op. Analysis MAP Reanalysis
Max: 512 mm Max: 482 mm Mean: 78 mm Mean: 87 mm
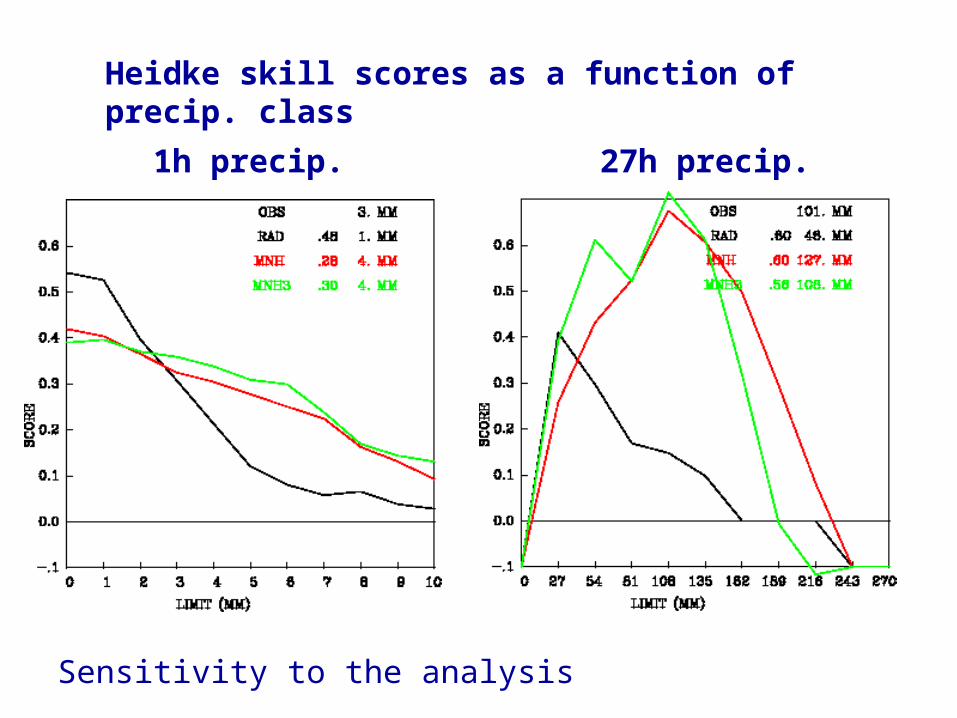
Heidke skill scores as a function of precip. class
1h precip. 27h precip.
Sensitivity to the analysis

Time evolution of the correlation coeffecient (wrt rain gauges)
MM5 experiments

Time evolution of the correlation coeffecient (wrt rain gauges)
MM5 experiments

MM5 experiments


![A [simple] land cover change intercomparison](https://img.dokumen.tips/doc/110x75/56814f92550346895dbd4da4/a-simple-land-cover-change-intercomparison.jpg)