Embed Size (px)
Citation preview
1
Evaluation of HACCP Inspection
Models Project (HIMP)
United States Department of Agriculture
Food Safety and Inspection Service
August 2011
2
Table of Contents
SUMMARY .................................................................................................................................... 5
1.0 INTRODUCTION .................................................................................................................... 8
2.0 DESCRIPTION OF HIMP AND NON-HIMP ESTABLISHMENTS ................................... 10
2.1 Inspection in HIMP and Non-HIMP Establishments.......................................................... 10
2.2 Line Speed Estimation ........................................................................................................ 11
2.3 Selection of Non-HIMP Comparison Establishments ........................................................ 11
3.0 RESULTS ............................................................................................................................... 14
3.1 Inspection of Each Carcass by Online FSIS Inspectors to Determine Whether the Carcass
is Not Adulterated and therefore Eligible to Bear the Mark of Inspection ............................... 14
3.2 Verification by Offline Inspectors of the Establishment Executing its HIMP Process
Control Plan under which Establishment Employees Sort Acceptable and Unacceptable
Carcasses and Parts ................................................................................................................... 15
3.2.1 Offline Inspection Procedures per Establishment ........................................................ 15
3.2.2 FSIS Condemnation Rates and HIMP Establishment Sorting Rates ........................... 17
3.3 Verification of the Establishment Executing its Sanitation SOPs and its HACCP System
under 9 CFR parts 416 and 417 ................................................................................................ 19
3.3.1 Offline Inspection Procedures Performed .................................................................... 19
3.3.2 Public Health Non-Compliance Rates ......................................................................... 19
3.3.3 Fecal Contamination .................................................................................................... 21
3.4 Verification of the Outcomes of the Establishment Process Control Plan, both
Organoleptic and Microbiologic ............................................................................................... 22
3.4.1 Food Safety Performance Standards ............................................................................ 22
3.4.2 Other Consumer Protection Performance Standards ................................................... 24
3.4.3 Salmonella Positive Rates ............................................................................................ 26
4.0 DISCUSSION ......................................................................................................................... 27
4.1 Previous Evaluations of HIMP Performance ...................................................................... 27
4.2 Food Safety Performance Standards ................................................................................... 29
4.3 Other Consumer Protection (OCP) Standards .................................................................... 30
4.4 Offline Inspection Procedures ............................................................................................. 32
4.5 Salmonella Positive Rates ................................................................................................... 32
4.6 Carcass-By-Carcass Inspection ........................................................................................... 33
5.0 CONCLUSION ....................................................................................................................... 35
6.0 REFERENCES ....................................................................................................................... 37
7.0 APPENDICES ........................................................................................................................ 38
Appendix A - History of HIMP ................................................................................................ 38
Appendix B - Line Speed Methodology ................................................................................... 42
Appendix C- W3NR Non-Compliance Rates ........................................................................... 44
Appendix D - Fecal NR Rate Regression ................................................................................. 55
Appendix E - Line Speed Analysis ........................................................................................... 58
Appendix F - Salmonella Positive Rates .................................................................................. 62
Appendix G – Sorting and Condemnation Rates For HIMP and Non-HIMP .......................... 64
3
List of Figures and Tables Figure 2- 1 Flowchart for HIMP Inspection System .................................................................... 10
Figure 2- 2 Flowchart for Traditional (Non-HIMP) Inspection Systems ..................................... 11
Figure 3- 1 Annual Number of 03J Inspections as a Function of Volume for HIMP and Non-
HIMP Comparison Establishments ............................................................................................... 17
Table 2- 1 Characteristics of Comparison Young Chicken Slaughter Establishments ................. 12
Table 2- 2 Geographical Distribution of HIMP and Comparison Non-HIMP Establishments .... 13
Table 3- 1 Comparison of Sep/Tox Detection Rates for Carcass and Verification Inspectors ..... 15
Table 3- 2 Comparison of Fecal Detection Rates for Carcass and Verification Inspectors ......... 15
Table 3- 3 Ratios of Inspection Procedures per Establishment in HIMP to Non-HIMP for
CY2010 ......................................................................................................................................... 16
Table 3- 4 Sorting and Condemnation Rates for HIMP and Non-HIMP Broiler Establishments 18
Table 3- 5 Health-Related Noncompliance Rates for HIMP and Non-HIMP Broiler
Establishments .............................................................................................................................. 20
Table 3- 6 Five Year Average Health-Related NR Rates for HIMP and Non-HIMP Broiler
Establishments .............................................................................................................................. 21
Table 3- 7 Fecal NR Rates at HIMP and Non-HIMP Comparison Establishments ..................... 21
Table 3- 8 HIMP Achievement of Food Safety Performance Standards at Young Chicken
Establishments .............................................................................................................................. 22
Table 3- 9 Comparison of Sep/Tox Detection Rates for Carcass and Verification Inspectors ..... 23
Table 3- 10 Comparison of Fecal Detection Rates for Carcass and Verification Inspectors ....... 24
Table 3- 11 HIMP Achievement of OCP Performance Standards at Young Chicken
Establishments .............................................................................................................................. 24
Table 3- 12 Salmonella Percent Positive Rates for HIMP and Non-HIMP Broiler Establishments
....................................................................................................................................................... 26
Table 4- 1 Performance Metrics for Comparing HIMP and Non-HIMP Establishments ............. 28
Table 4- 2 HIMP Achievement of Food Safety Performance Standards ...................................... 29
Table 4- 3 Septicemia/Toxemia Rates in HIMP and Non-HIMP Establishments ........................ 30
Table 4- 4 HIMP Achievement of OCP Performance Standards ................................................. 31
Table B- 1 Example Data Used to Compute Slaughter Rates ...................................................... 43
Table B-2 Summary of Line Speeds for HIMP and Non-HIMP Establishments ......................... 43
Table C- 1 Procedure Code Description ....................................................................................... 44
Table C- 2 W3NR Rates for Each Procedure Code by Year ........................................................ 47
Table C- 3 W3NR Rates by Procedure Code for the 5 years of Combined CY2006 to CY2010 52
Table C- 4 Regression Statistics for Number of W3NRs by Process Code for 5 Years of
Combined Data ............................................................................................................................. 53

4
Table G- 1 Sorting and Condemnation Rates for HIMP and All Non-HIMP Establishments in
CY2010 ......................................................................................................................................... 64
Table G- 2 Sorting and Condemnation Rates for HIMP and All Non-HIMP Establishments in
CY2009 ......................................................................................................................................... 64
Table G- 3 Sorting and Condemnation Rates for HIMP and All Non-HIMP Establishments in
CY2008 ......................................................................................................................................... 64
Table G- 4 Sorting and Condemnation Rates for HIMP and All Non-HIMP Establishments in
CY2007 ......................................................................................................................................... 65
Table G- 5 Sorting and Condemnation Rates for HIMP and All Non-HIMP Establishments in
CY2006 ......................................................................................................................................... 65
5
SUMMARY
The objective of this report is to evaluate Food Safety and Inspection Service (FSIS) inspection
findings in young chicken slaughter establishments participating in the HACCP Inspection
Models Project (HIMP) program and, as appropriate, compare them with established HIMP
performance standards or with a comparison set of 64 non-HIMP establishments comparable
with HIMP establishments with respect to production volume, lines speed, and geographical
distribution. The FSIS inspection findings are assessed across four interrelated inspection
activities:
1. Inspection of each carcass by on line FSIS inspectors to determine whether the carcass is
not adulterated and therefore eligible to bear the mark of inspection
2. Verification, by off line inspectors, of the establishment’s execution of its HIMP process
control plan, under which establishment employees sort acceptable and unacceptable
carcasses and parts
3. Verification of the establishment executing its sanitation standard operating procedures
(Sanitation SOP) and its Hazard Analysis and Critical Control Point (HACCP) system
under 9 CFR Parts 416 and 417.
4. Verification of the outcomes of the establishment HIMP process control plan, both
organoleptic and microbiologic
A summary of results follows:
Inspection of each carcass by on line FSIS inspectors to determine whether the
carcass is not adulterated and therefore eligible to bear the mark of inspection
The data show that as a result of industry practices, such as carcass sorting activities, very
few adulterated poultry carcasses are presented to inspectors stationed at the end of the
slaughter line in HIMP establishments. The number of carcasses with septicemia,
toxemia, or fecal material that arrive at the online carcass inspector location is very low
(less than 8 carcasses with infectious conditions per million carcasses processed and less
than 0.8 carcasses with fecal contamination per 1,000 carcasses). These levels are less
than those found in the baseline non-HIMP plants after carcasses have passed FSIS
carcass inspection. The carcass inspector (CI) in HIMP establishments further reduces the
number of carcasses with septicemia/toxemia or visible fecal contamination.
For septicemia/toxemia, the CI detected affected carcasses at a rate of 0.000004% or 4
per 100 million carcasses slaughtered. For visible fecal contamination, the CI detected
affected carcasses at a rate of 0.0009% or 9 per million carcasses slaughtered. These data
demonstrate that CIs in HIMP establishments detect and condemn carcasses affected with
septicemia and toxemia, as well as carcasses with visible fecal contamination, before
such carcasses enter the chiller.
These findings support that the online inspectors in HIMP establishments are performing
in a manner that enables them to properly inspect each carcass and, therefore, make the
necessary appraisals to adequately identify adulterated carcasses.
6
Verification, by off line inspectors, of the establishment’s execution of its HIMP
process control plan, under which establishment employees sort acceptable and
unacceptable carcasses and parts
FSIS inspectors perform offline inspection procedures in HIMP establishments to verify
that the establishments are executing their HIMP process control plan. Because fewer
inspectors are required to conduct online carcass inspection in HIMP establishments,
FSIS is able to conduct more offline food safety related inspection activities. FSIS
inspectors performed an average of 14,136 offline verification inspections per HIMP
establishment in CY2010 versus an average of 8,724 offline verification inspections per
non-HIMP establishment. Overall, FSIS inspectors perform 1.6 times more offline
verification inspection procedures in HIMP establishments than in non-HIMP
establishments and 3.2 times more HACCP verification inspection procedures. This
increased level of inspection insures that HIMP establishments continuously satisfy food
safety performance standards and HACCP regulations and are maintaining OCP- and
food safety defects at levels that are less than in non-HIMP establishments and thereby
producing a safer product.
Verification of the establishment executing its sanitation standard operating
procedures (SSOP) and its hazard analysis and critical control point (HACCP)
system under Code of Federal Regulations 9 CFR 416 and 417
FSIS inspectors conduct offline inspection procedures in HIMP establishments to monitor
for food safety and OCP defects, pathogen levels, and for compliance with federal
sanitation and HACCP regulations. In CY2010 FSIS inspectors performed about 2.8
times more SSOP and HIMP inspection procedures in HIMP establishments than in non-
HIMP establishments and find that over a 5 year period the health-related non-
compliance rates for SSOP and HACCP are about 1.4 times lower in HIMP
establishments than in non-HIMP establishments.
In CY2010, FSIS inspectors in HIMP establishments performed 3.4 more 03J01
procedures than inspectors in non-HIMP establishments. The inspection activities under
the 03J01 procedures include among other things, verification of food safety standards
and all slaughter HACCP requirements. The majority of these activities involve verifying
an establishment’s compliance with FSIS’s zero tolerance for visible fecal contamination.
The rate of 03J01 health-related non-compliances over a 5 year period is about 1.6 times
lower in HIMP establishments than in non-HIMP establishments
The rate of visible fecal material contamination in HIMP establishments is about half that
in non-HIMP establishments. Since fecal contamination of carcasses is the primary
avenue for contamination by pathogens in slaughter establishments, HIMP establishments
should have lower public health impacts than non-HIMP establishments.
7
Verification of the outcomes of the establishment process control plan, both
organoleptic and microbiologic
Toxemia and septicemia food safety conditions in HIMP establishments are below 8 per
million carcasses, which is 125 times less than HIMP performance standards.
Salmonella positive rates in HIMP establishments average about 80% those in non-HIMP
establishments. FSIS believes that lower Salmonella positive rates result in fewer public
health impacts (FSIS 2011). Salmonella positive rates at HIMP establishments were not
found to be related to line speed.
Fecal contamination levels are below 8 per ten thousand carcasses, which is about 19
times less than HIMP performance standards. FSIS believes that lower fecal
contamination levels and Salmonella positive rates result in fewer public health impacts.
These data indicate that compared to inspection on non-HIMP establishments, HIMP has
improved the safety of poultry products and increased overall consumer protection.
FSIS concludes that an inspection system based on the HIMP system in which establishments are
responsible for sorting and identifying unacceptable carcasses and parts before an online FSIS
inspector performs a visual carcass-by-carcass inspection will ensure an equivalent, if not better,
level of food safety and other consumer protection than that provided by the existing poultry
slaughter inspection systems.
Given the low numbers of adulterated poultry carcasses presented to the inspector in HIMP
establishments, the stability of line speeds in the HIMP pilot project, and the ability of the
carcass inspector to personally inspect each and every carcass leaving the slaughter line
sufficiently to identify adulterated carcasses, FSIS has determined that the addition of a second
carcass inspector to each line would not further HIMP project objectives and is not necessary to
meet statutory mandates.
8
1.0 INTRODUCTION
In October 1999, FSIS initiated the HIMP project in volunteer slaughter establishments to
determine whether new government slaughter inspection procedures, along with new plant
responsibilities, could improve food safety and increase consumer protection. Under HIMP
employees of slaughter establishments sort carcasses on the slaughter line before they reach FSIS
on-line inspectors, making an initial determination whether they are unacceptable, allowing the
on-line inspector to focus on any remaining food-safety issues. This approach is consistent with
HACCP where industry rather than federal inspectors is responsible for identifying steps in food
production where food safety hazards are most likely to occur and for establishing controls that
prevent or reduce them. Currently, there are 20 young chicken; 5 young turkey, and 5 market
hog slaughter establishments participating in HIMP. This report focuses on the 20 young
chicken slaughter establishments in HIMP.
FSIS inspectors perform post-mortem inspection on a bird-by-bird basis of every chicken
eviscerated at a HIMP establishment that enters commerce. The purpose of post-mortem
inspection is to insure that any carcasses or parts that are unwholesome or adulterated, and
thereby unfit for human food, do not enter commerce. A short history of HIMP is given in
Appendix A.
Prior to beginning HIMP, Research Triangle Institute (RTI) conducted baseline organoleptic and
microbiological data collection in 16 young chicken slaughter plants that volunteered to
participate in the HIMP program. The baseline data documents the accomplishments of pre-
HIMP slaughter-line inspection systems and provide a measure for comparing performance of
establishments operating under the new HIMP inspection system with those operating under
traditional inspection systems. In March 2000, FSIS held a public meeting to present the HIMP
baseline results and receive comments on proposed HIMP performance standards (FSIS 2000a).
In November, 2000 FSIS published the final HIMP performance standards for two food safety
and five Other Consumer Protection (OCP) concerns. HIMP establishments are expected to
revise their HACCP systems to achieve the food safety standards and to develop process control
plans to achieve OCP standards. Plants are responsible for identifying and removing carcasses
that do not meet these standards. FSIS inspectors are responsible for verifying that plants are
continuously achieving the required outcomes. The National Alliance for Food Safety
determined that food safety performance standards provide a scientifically valid measure by
which performance of HIMP establishments can be evaluated (Hargis et al. 2002).
Following entry of the 16 young chicken slaughter plants into the HIMP program, data was again
collected in order to evaluate the achievements of the new inspection system. RTI conducted an
initial evaluation of the performance of HIMP chicken slaughter establishments in 2001 that
suggested inspection under HIMP was equivalent or superior to that of traditional inspection
(Cates et al. 2001). Subsequent data collection over the time periods Sep 18, 2000 – April 30,
2001, Sep 18, 2000 - Sep 30, 2002 and July 14, 2003 - December 31, 2004 confirmed that HIMP
plants were meeting or exceeding HIMP performance standards (FSIS 2001, 2002b, 2008a).
Organoleptic and microbiological data compared to the performance standards were
Food safety measures
9
o Septicemia/Toxemia rates
o Visible fecal contamination rates
Other Consumer Protection measures
o OCP1 (Animal Diseases, e.g., airsacculitis)
o OCP2 (Miscellaneous Conditions, e.g., bruises, sores, and other processing
defects)
o OCP3 (Digestive Content, e.g., ingesta)
o OCP4 (Dressing Defects- Other, e.g., feathers)
o OCP5 Dressing Defects- Digestive Tract Tissue, e.g., bursa, cloaca)
These studies demonstrated that HIMP young chicken slaughter establishments were performing
as well or better than young chicken slaughter establishments under traditional (non-HIMP)
inspection systems.
The objective of the present analysis is to update these previous evaluations of HIMP
performance and to determine whether the HIMP inspection system results in improved safety of
poultry products and increased overall consumer protection, while ensuring carcass-by-carcass
inspection of each eviscerated carcass. The current evaluation is based on data for the years
CY2006 through CY2010, with exceptions where only more recent data are available. The
evaluation compares the 20 HIMP young chicken establishments with established HIMP
performance standards or with a comparison set of 64 non-HIMP establishments selected to be
comparable with HIMP establishments with respect to production volume, lines speed, and
geographical distribution. The FSIS inspection findings are assessed across four interrelated
inspection activities:
1. Inspection of each carcass by on line FSIS inspectors to determine whether the carcass is
not adulterated and therefore eligible to bear the mark of inspection
2. Verification, by off line inspectors, of the establishment’s execution of its HIMP process
control plan, under which establishment employees sort acceptable and unacceptable
carcasses and parts
3. Verification of the outcomes of the establishment process control plan, both organoleptic
and microbiologic
4. Verification of the establishment executing its SSOP and HACCP systems under Code of
Federal Regulations 9 CFR 416 and 417.
10
2.0 DESCRIPTION OF HIMP AND NON-HIMP
ESTABLISHMENTS
A description of HIMP and non-HIMP inspection systems follows.
2.1 Inspection in HIMP and Non-HIMP Establishments
Under the HIMP inspection system, one online carcass inspector (CI) and one offline verification
inspector (VI) are assigned to each line. The online CI visually inspects every carcass at a fixed
location on the evisceration line immediately prior to the chiller (See Figure 2-1), to insure that
poultry products do not injure human health in any way because they ―consist in whole or part of
any filthy, putrid, or decomposed substance or is for any other reason unsound, unhealthy,
unwholesome, or otherwise unfit for human food; Poultry Products Inspection Act (PPIA) Sec.
453(g)(3)‖ or ―has been prepared, packed, or held under insanitary conditions whereby it may
have become contaminated with filth, or whereby it may have been rendered injurious of human
health; PPIA Sec. 453(g)(4).‖ Carcass inspection is conducted much more efficiently under
HIMP than under the non-HIMP inspection systems because establishment personnel have
already sorted (i.e., removed from the evisceration line), trimmed, and reprocessed the carcasses,
thereby removing most visible defects, before the online carcass inspector appraises them. More
detail on the activities of the online and offline inspectors under HIMP is given in Appendix A.
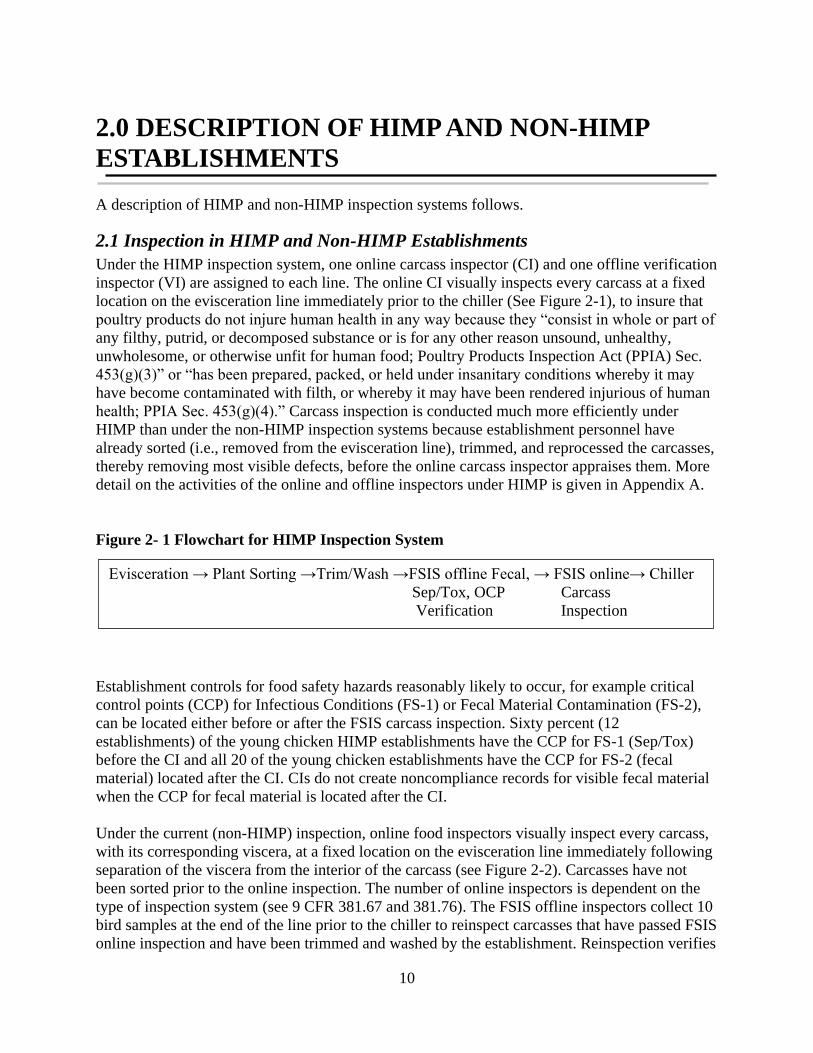
Figure 2- 1 Flowchart for HIMP Inspection System
Establishment controls for food safety hazards reasonably likely to occur, for example critical
control points (CCP) for Infectious Conditions (FS-1) or Fecal Material Contamination (FS-2),
can be located either before or after the FSIS carcass inspection. Sixty percent (12
establishments) of the young chicken HIMP establishments have the CCP for FS-1 (Sep/Tox)
before the CI and all 20 of the young chicken establishments have the CCP for FS-2 (fecal
material) located after the CI. CIs do not create noncompliance records for visible fecal material
when the CCP for fecal material is located after the CI.
Under the current (non-HIMP) inspection, online food inspectors visually inspect every carcass,
with its corresponding viscera, at a fixed location on the evisceration line immediately following
separation of the viscera from the interior of the carcass (see Figure 2-2). Carcasses have not
been sorted prior to the online inspection. The number of online inspectors is dependent on the
type of inspection system (see 9 CFR 381.67 and 381.76). The FSIS offline inspectors collect 10
bird samples at the end of the line prior to the chiller to reinspect carcasses that have passed FSIS
online inspection and have been trimmed and washed by the establishment. Reinspection verifies
Evisceration → Plant Sorting →Trim/Wash →FSIS offline Fecal, → FSIS online→ Chiller
Sep/Tox, OCP Carcass
Verification Inspection
11
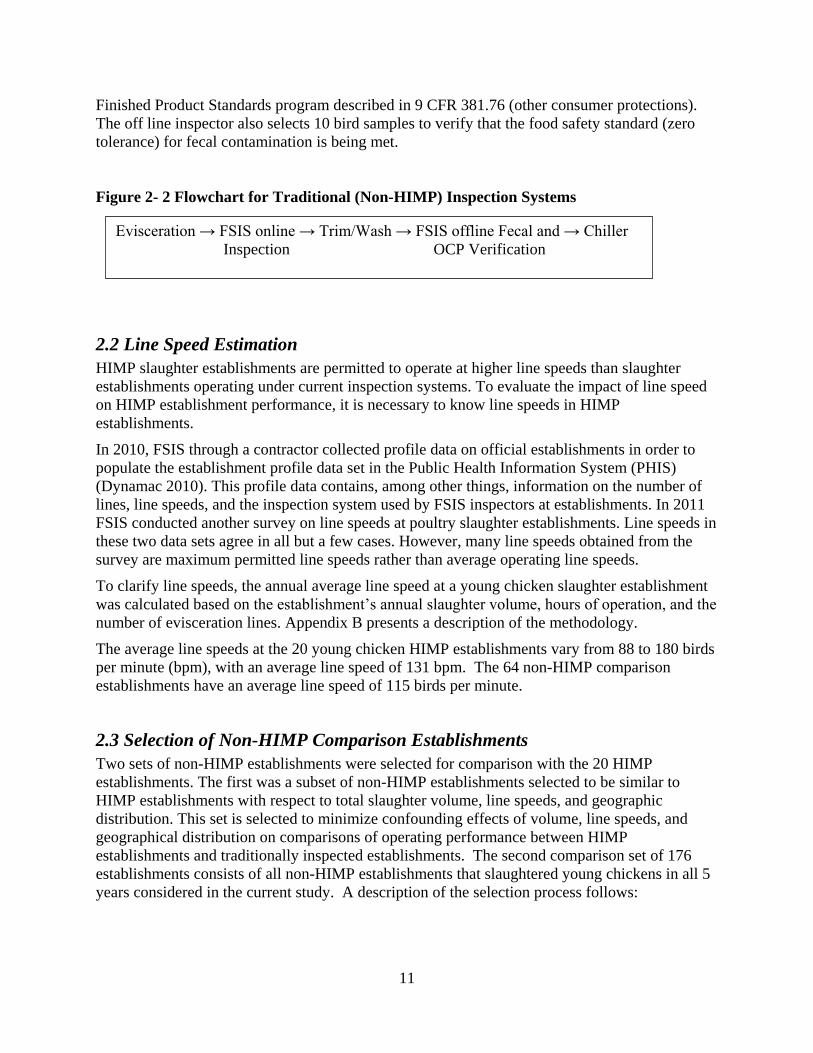
Finished Product Standards program described in 9 CFR 381.76 (other consumer protections).
The off line inspector also selects 10 bird samples to verify that the food safety standard (zero
tolerance) for fecal contamination is being met.
Figure 2- 2 Flowchart for Traditional (Non-HIMP) Inspection Systems
2.2 Line Speed Estimation
HIMP slaughter establishments are permitted to operate at higher line speeds than slaughter
establishments operating under current inspection systems. To evaluate the impact of line speed
on HIMP establishment performance, it is necessary to know line speeds in HIMP
establishments.
In 2010, FSIS through a contractor collected profile data on official establishments in order to
populate the establishment profile data set in the Public Health Information System (PHIS)
(Dynamac 2010). This profile data contains, among other things, information on the number of
lines, line speeds, and the inspection system used by FSIS inspectors at establishments. In 2011
FSIS conducted another survey on line speeds at poultry slaughter establishments. Line speeds in
these two data sets agree in all but a few cases. However, many line speeds obtained from the
survey are maximum permitted line speeds rather than average operating line speeds.
To clarify line speeds, the annual average line speed at a young chicken slaughter establishment
was calculated based on the establishment’s annual slaughter volume, hours of operation, and the
number of evisceration lines. Appendix B presents a description of the methodology.
The average line speeds at the 20 young chicken HIMP establishments vary from 88 to 180 birds
per minute (bpm), with an average line speed of 131 bpm. The 64 non-HIMP comparison
establishments have an average line speed of 115 birds per minute.
2.3 Selection of Non-HIMP Comparison Establishments
Two sets of non-HIMP establishments were selected for comparison with the 20 HIMP
establishments. The first was a subset of non-HIMP establishments selected to be similar to
HIMP establishments with respect to total slaughter volume, line speeds, and geographic
distribution. This set is selected to minimize confounding effects of volume, line speeds, and
geographical distribution on comparisons of operating performance between HIMP
establishments and traditionally inspected establishments. The second comparison set of 176
establishments consists of all non-HIMP establishments that slaughtered young chickens in all 5
years considered in the current study. A description of the selection process follows:
Evisceration → FSIS online → Trim/Wash → FSIS offline Fecal and → Chiller
Inspection OCP Verification
12
Control Set of 64 Non-HIMP Establishments
o A set of all non-HIMP establishments with similar operating characteristics as
HIMP establishments were selected. These are all non-HIMP establishments that
operated in all 5 years of the study, had CY2010 production volumes greater than
40 million head per year, had average lines speeds greater than 80 bpm, and
operated in the same 7 districts as HIMP establishments. Note that the average
lines speeds of the 64 non-HIMP comparison set do not completely overlap with
those of HIMP establishments since line speeds in non-HIMP establishments are
limited to 140 bpm, while HIMP establishments have line speeds up to 180 bpm.
Comparison Set of 176 All Non-HIMP Establishments
o All non-HIMP slaughter establishments that slaughtered young chickens at some
time in each of the years CY2006 to CY2010 were selected for the all non-HIMP
comparison set. There are 176 establishments in the all non-HIMP comparison
set.
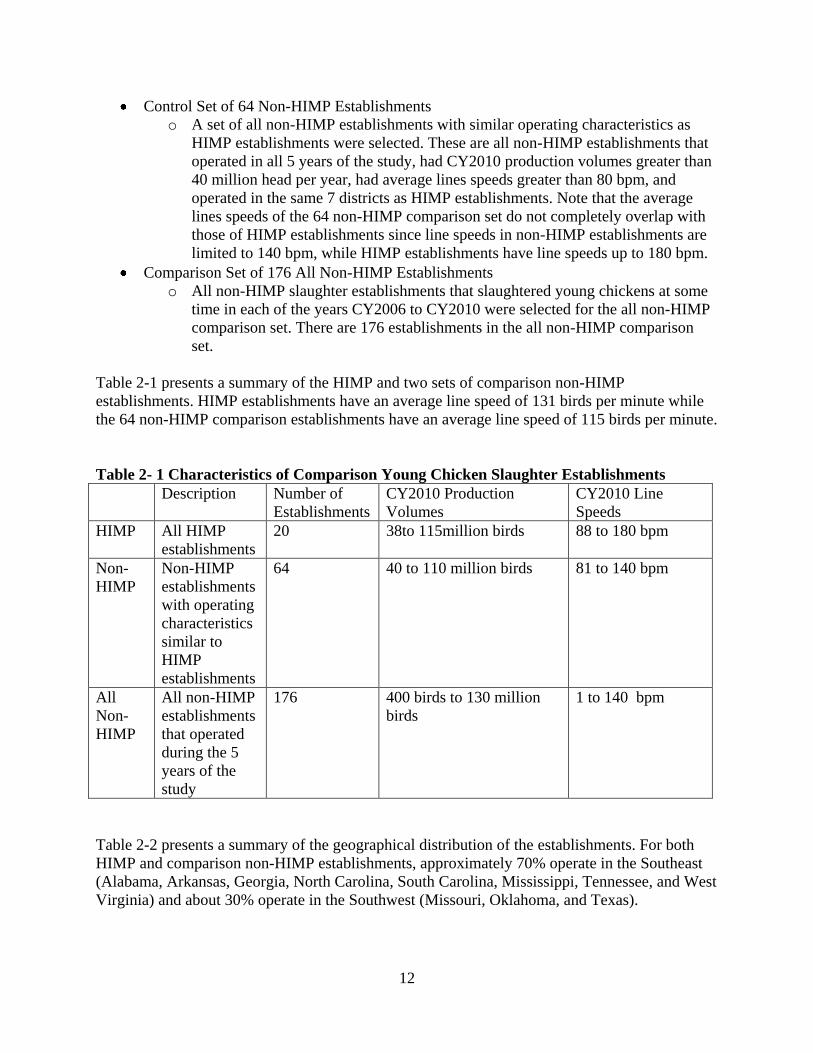
Table 2-1 presents a summary of the HIMP and two sets of comparison non-HIMP
establishments. HIMP establishments have an average line speed of 131 birds per minute while
the 64 non-HIMP comparison establishments have an average line speed of 115 birds per minute.
Table 2- 1 Characteristics of Comparison Young Chicken Slaughter Establishments
Description Number of
Establishments
CY2010 Production
Volumes
CY2010 Line
Speeds
HIMP All HIMP
establishments
20 38to 115million birds 88 to 180 bpm
Non-
HIMP
Non-HIMP
establishments
with operating
characteristics
similar to
HIMP
establishments
64 40 to 110 million birds 81 to 140 bpm
All
Non-
HIMP
All non-HIMP
establishments
that operated
during the 5
years of the
study
176 400 birds to 130 million
birds
1 to 140 bpm
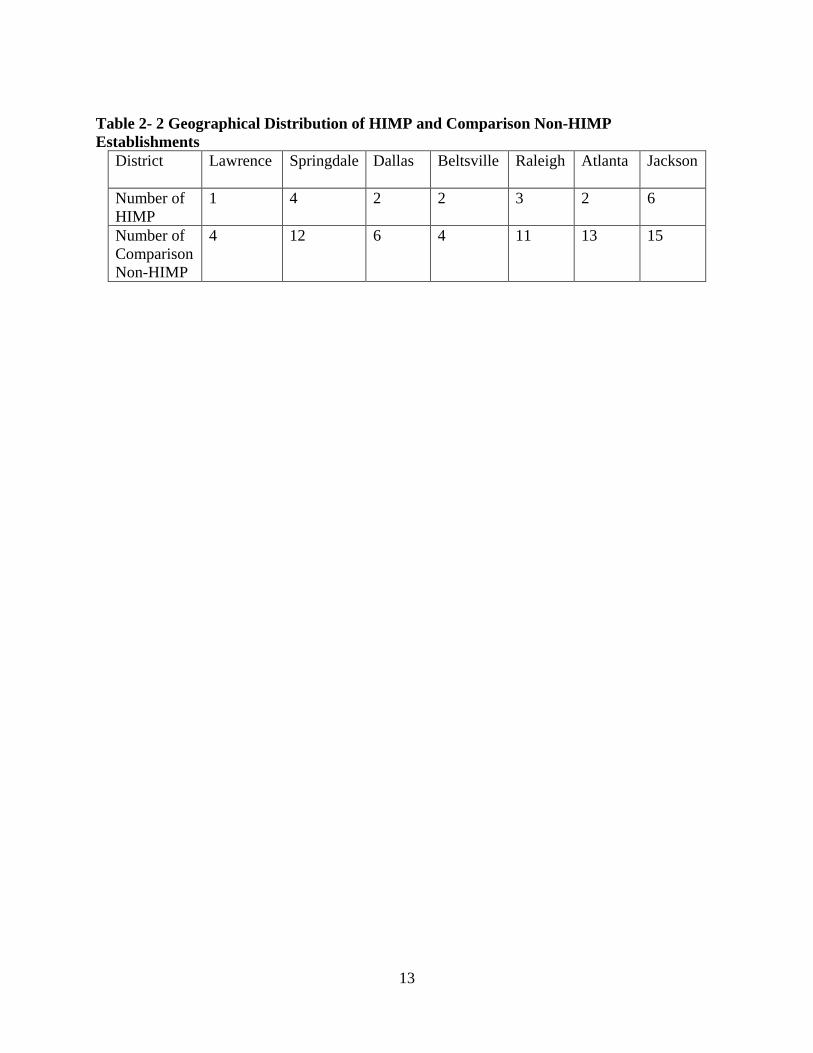
Table 2-2 presents a summary of the geographical distribution of the establishments. For both
HIMP and comparison non-HIMP establishments, approximately 70% operate in the Southeast
(Alabama, Arkansas, Georgia, North Carolina, South Carolina, Mississippi, Tennessee, and West
Virginia) and about 30% operate in the Southwest (Missouri, Oklahoma, and Texas).
13
Table 2- 2 Geographical Distribution of HIMP and Comparison Non-HIMP
Establishments
District Lawrence
Springdale
Dallas
Beltsville
Raleigh
Atlanta
Jackson
Number of
HIMP
1 4 2 2 3 2 6
Number of
Comparison
Non-HIMP
4 12 6 4 11 13 15
14
3.0 RESULTS
This section presents a summary of FSIS inspection findings in HIMP establishments and
compares them to inspection findings in a comparison set of 64 non-HIMP establishments or
with FSIS HIMP performance standards, as appropriate. The findings are organized around the
following four interrelated inspection activities:
1. Inspection of each carcass by on line FSIS inspectors to determine whether the carcass is
not adulterated and therefore eligible to bear the mark of inspection
2. Verification, by off line inspectors, of the establishment’s execution of its HIMP process
control plan, under which establishment employees sort acceptable and unacceptable
carcasses and parts
3. Verification of the establishment executing its sanitation standard operating procedures
(Sanitation SOP) and its Hazard Analysis and Critical Control Point (HACCP) system
under 9 CFR Parts 416 and 417.
4. Verification of the outcomes of the establishment process control plan, both organoleptic
and microbiologic
3.1 Inspection of Each Carcass by Online FSIS Inspectors to Determine
Whether the Carcass is Not Adulterated and therefore Eligible to Bear the Mark
of Inspection
An important issue that this HIMP report addresses is whether FSIS inspectors in young chicken
slaughter establishments operating under HIMP are able to make a determination as to whether
each carcass in not adulterated and therefore eligible to bear the mark of inspection. To address
this issue, the HIMP report evaluates the ability of the FSIS online carcass inspector (CI) to
detect carcasses affected with septicemia/toxemia and visible fecal contamination before the
chiller.
Data collected from April 1, 2009, to March 31, 2011, show that the CI in HIMP establishments
found 125 carcasses affected with Septicemia/Toxemia and 26,815 carcasses with visible fecal
contamination (see Tables 3-1 and 3-2). This data demonstrates that the CI in HIMP
establishments is able to identify carcasses affected with Septicemia/Toxemia and visible fecal
contamination.
The findings of FSIS off-line verification inspector (VI) checks show that fewer than 8 per 1
million carcasses (0.0008%) processed in HIMP establishments have septicemia/toxemia and
that fewer than 8 per ten thousand carcasses (0.08%) processed in HIMP establishments have
visible fecal contamination (Tables 3-1 and 3-2). These rates are lower than in the RTI baseline
non-HIMP establishments. As the data above show, the CI in HIMP establishments further
reduces the number of carcasses with septicemia/toxemia or visible fecal contamination. These
data demonstrate the HIMP inspection system improves young chicken product food safety.

15
Table 3-1 below compares the rate at which CIs and VIs in HIMP establishments detect
carcasses affected with Septicemia/Toxemia conditions. Table 3-2 compares the rate at which
CIs and VIs detected carcasses with visible fecal contamination.
Table 3- 1 Comparison of Sep/Tox Detection Rates for Carcass and Verification Inspectors
Number Sep/tox
findings detected
CY2009-CY2010
Carcasses Inspected Sep/tox detection rate
Carcasses Inspectors 125 2.97E+09 0.000004%
Verification
Inspectors
32 3.82E+06 0.0008%
Table 3- 2 Comparison of Fecal Detection Rates for Carcass and Verification Inspectors
Number fecal
contaminations
detected CY2009-
CY2010
Carcasses Inspected Fecal detection rate
Carcasses Inspectors 26,815 2.97E+09 0.0009%
Verification
Inspectors
2,994 3.822E+06 0.08%
These data demonstrate that, although CIs in HIMP establishments are presented with an
extremely low rate of adulterated carcasses, they do detect and condemn carcasses affected with
septicemia and toxemia, as well as carcasses with visible fecal contamination, before such
carcasses enter the chiller, thereby reducing food safety defects to levels lower than found in the
RTI baseline non-HIMP establishments.
3.2 Verification by Offline Inspectors of the Establishment Executing its HIMP
Process Control Plan under which Establishment Employees Sort Acceptable
and Unacceptable Carcasses and Parts
Under HIMP, employees of slaughter establishments sort carcasses on the slaughter line before
they reach FSIS on-line inspectors. The sorted carcasses are expected to meet food safety and
OCP performance standards. FSIS inspectors verify that plants are continuously achieving the
required outcomes. This section address inspection activities in HIMP establishments related to
verification by offline inspectors of the establishment executing its HIMP process control plan
under which establishment employees sort acceptable and unacceptable carcasses and parts to
achieve performance standards.
3.2.1 Offline Inspection Procedures per Establishment
FSIS inspectors conduct offline inspection procedures in HIMP establishments to monitor for
food safety and OCP defects, pathogen levels, and for compliance with federal sanitation and
HACCP regulations. It is expected that the number of offline inspection procedures will be
higher in HIMP than non-HIMP establishments and that the noncompliance rates will be lower.
This will increase the confidence that HIMP establishments are complying with all federal
regulations and are producing a safe and wholesome product.
16
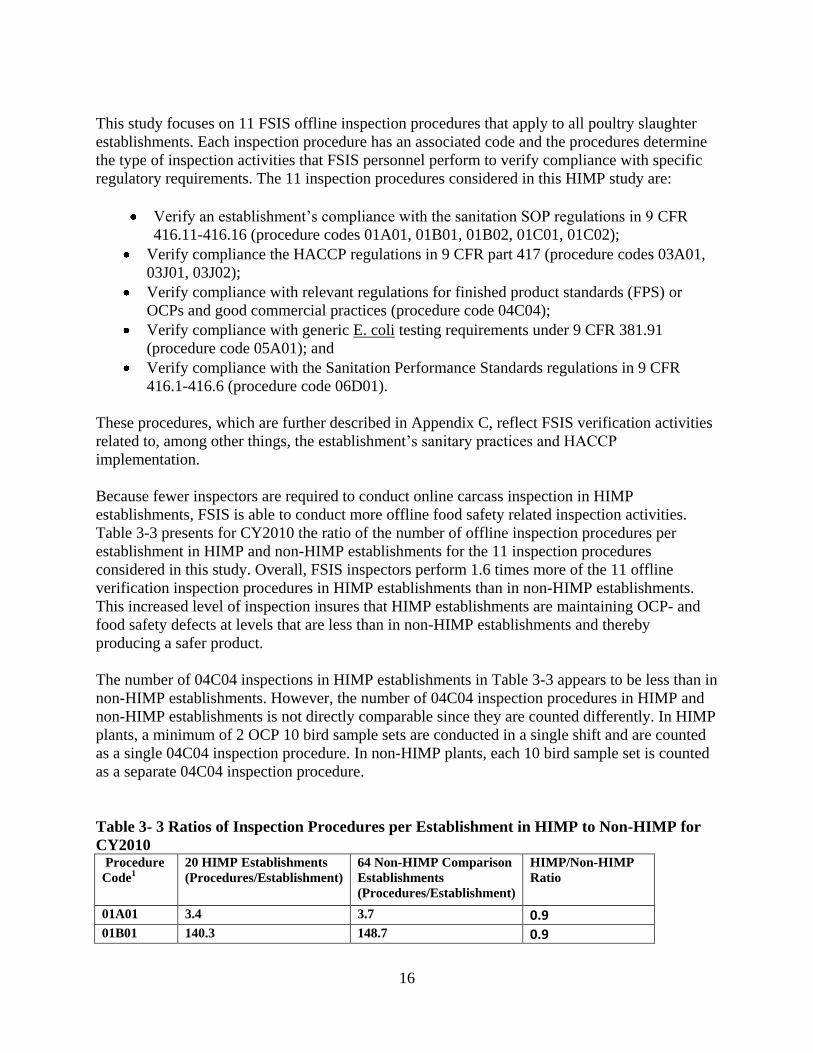
This study focuses on 11 FSIS offline inspection procedures that apply to all poultry slaughter
establishments. Each inspection procedure has an associated code and the procedures determine
the type of inspection activities that FSIS personnel perform to verify compliance with specific
regulatory requirements. The 11 inspection procedures considered in this HIMP study are:
Verify an establishment’s compliance with the sanitation SOP regulations in 9 CFR
416.11-416.16 (procedure codes 01A01, 01B01, 01B02, 01C01, 01C02);
Verify compliance the HACCP regulations in 9 CFR part 417 (procedure codes 03A01,
03J01, 03J02);
Verify compliance with relevant regulations for finished product standards (FPS) or
OCPs and good commercial practices (procedure code 04C04);
Verify compliance with generic E. coli testing requirements under 9 CFR 381.91
(procedure code 05A01); and
Verify compliance with the Sanitation Performance Standards regulations in 9 CFR
416.1-416.6 (procedure code 06D01).
These procedures, which are further described in Appendix C, reflect FSIS verification activities
related to, among other things, the establishment’s sanitary practices and HACCP
implementation.
Because fewer inspectors are required to conduct online carcass inspection in HIMP
establishments, FSIS is able to conduct more offline food safety related inspection activities.
Table 3-3 presents for CY2010 the ratio of the number of offline inspection procedures per
establishment in HIMP and non-HIMP establishments for the 11 inspection procedures
considered in this study. Overall, FSIS inspectors perform 1.6 times more of the 11 offline
verification inspection procedures in HIMP establishments than in non-HIMP establishments.
This increased level of inspection insures that HIMP establishments are maintaining OCP- and
food safety defects at levels that are less than in non-HIMP establishments and thereby
producing a safer product.
The number of 04C04 inspections in HIMP establishments in Table 3-3 appears to be less than in
non-HIMP establishments. However, the number of 04C04 inspection procedures in HIMP and
non-HIMP establishments is not directly comparable since they are counted differently. In HIMP
plants, a minimum of 2 OCP 10 bird sample sets are conducted in a single shift and are counted
as a single 04C04 inspection procedure. In non-HIMP plants, each 10 bird sample set is counted
as a separate 04C04 inspection procedure.
Table 3- 3 Ratios of Inspection Procedures per Establishment in HIMP to Non-HIMP for
CY2010 Procedure
Code1
20 HIMP Establishments
(Procedures/Establishment)
64 Non-HIMP Comparison
Establishments
(Procedures/Establishment)
HIMP/Non-HIMP
Ratio
01A01 3.4 3.7 0.9 01B01 140.3 148.7 0.9
17
01B02 98.0 110.9 0.9 01C01 259.2 272.5 1.0 01C02 294.8 299.0 1.0 03A01 2.5 1.9 1.3 03J01 10296.1 3027.5 3.4 03J02 287.0 259.4 1.1 04C04 2612.3 4447.4 0.6 05A01 0.2 1.3 0.2 06D01 142.2 151.5 0.9 Total for all
11
Procedures
14135.9 8723.7 1.6
1. See Appendix C for description of inspection procedure codes
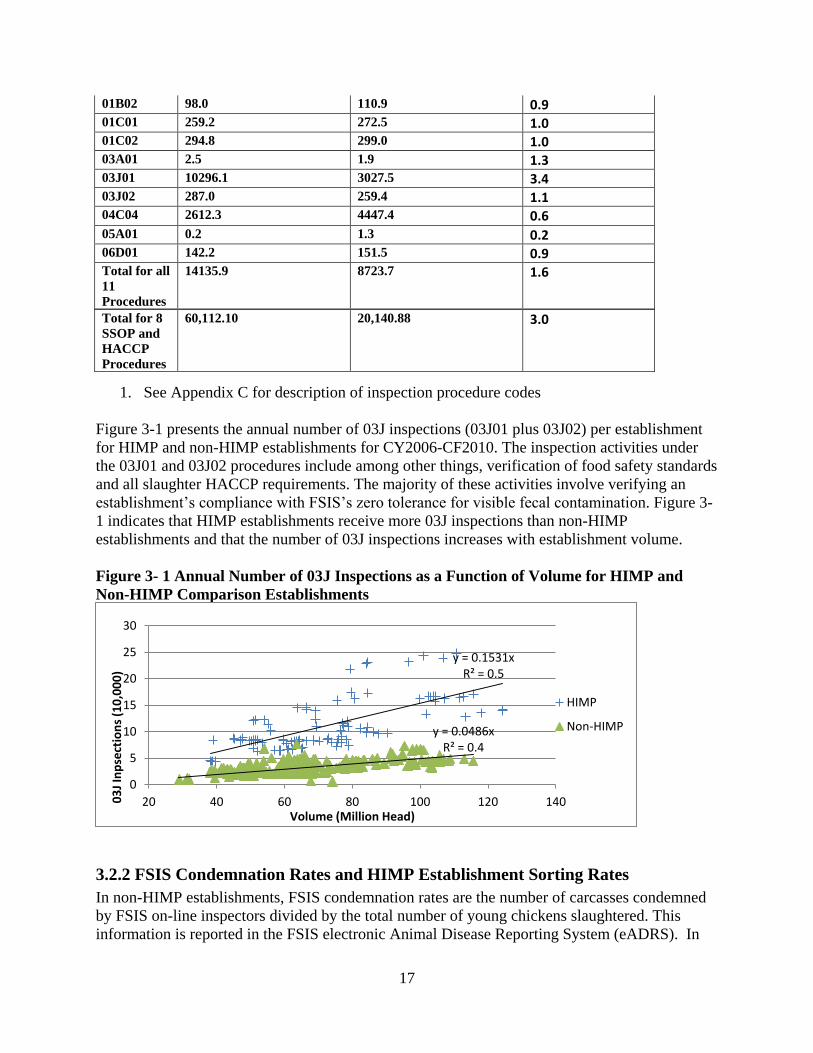
Figure 3-1 presents the annual number of 03J inspections (03J01 plus 03J02) per establishment
for HIMP and non-HIMP establishments for CY2006-CF2010. The inspection activities under
the 03J01 and 03J02 procedures include among other things, verification of food safety standards
and all slaughter HACCP requirements. The majority of these activities involve verifying an
establishment’s compliance with FSIS’s zero tolerance for visible fecal contamination. Figure 3-
1 indicates that HIMP establishments receive more 03J inspections than non-HIMP
establishments and that the number of 03J inspections increases with establishment volume.
Figure 3- 1 Annual Number of 03J Inspections as a Function of Volume for HIMP and
Non-HIMP Comparison Establishments
3.2.2 FSIS Condemnation Rates and HIMP Establishment Sorting Rates
In non-HIMP establishments, FSIS condemnation rates are the number of carcasses condemned
by FSIS on-line inspectors divided by the total number of young chickens slaughtered. This
information is reported in the FSIS electronic Animal Disease Reporting System (eADRS). In
y = 0.1531x R² = 0.5
y = 0.0486x R² = 0.4
0
5
10
15
20
25
30
20 40 60 80 100 120 140 03
J In
pse
ctio
ns
(10
,00
0)
Volume (Million Head)
HIMP
Non-HIMP
Total for 8
SSOP and
HACCP
Procedures
60,112.10 20,140.88 3.0
18
the current non-HIMP inspection system, establishment employees are not allowed to proactively
dispose of adulterated carcasses, since FSIS assumed this activity when federal inspection was
first provided to the poultry industry.
Under HIMP, employees of slaughter establishments assume their responsibility to produce safe
and wholesome products by sorting and disposing of non-complying carcasses before they reach
the FSIS online carcass inspector positioned at the end of line to inspect each carcass. HIMP
establishment employees dispose of non-complying carcasses at many locations both prior to and
after the establishment sorting station. The number of carcasses disposed of at the sorting station
is reported in the eADRS. However, carcasses disposed at other locations are not recorded.
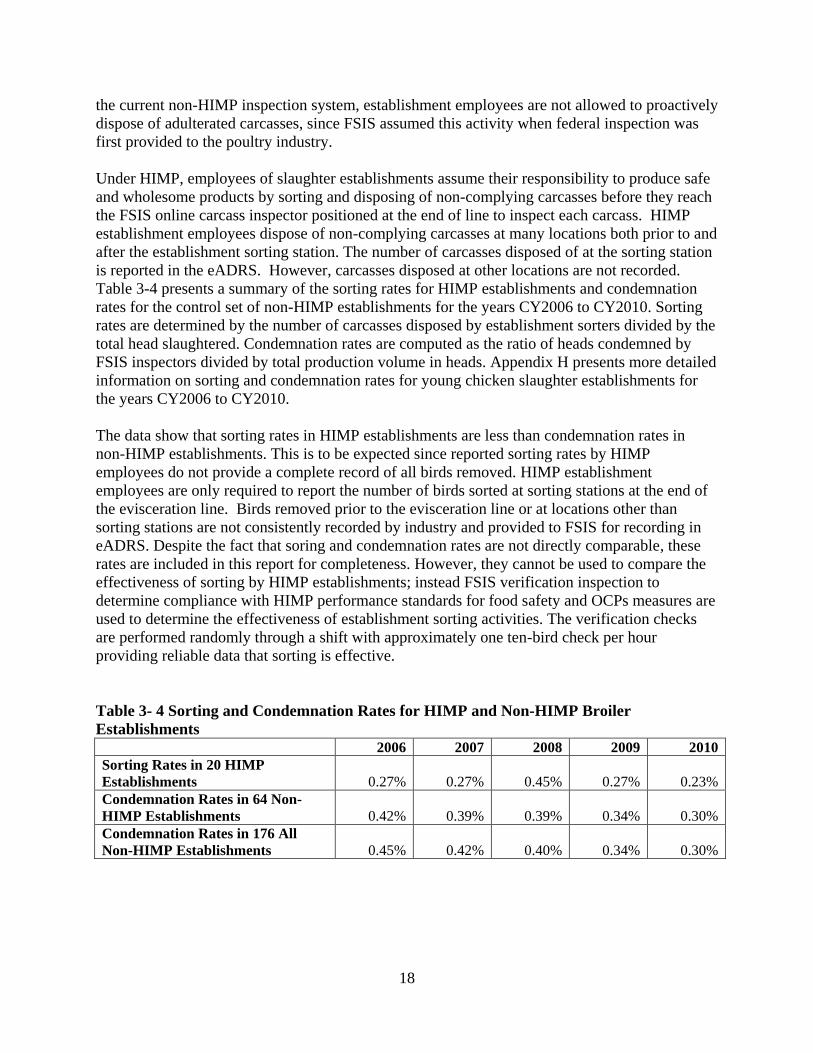
Table 3-4 presents a summary of the sorting rates for HIMP establishments and condemnation
rates for the control set of non-HIMP establishments for the years CY2006 to CY2010. Sorting
rates are determined by the number of carcasses disposed by establishment sorters divided by the
total head slaughtered. Condemnation rates are computed as the ratio of heads condemned by
FSIS inspectors divided by total production volume in heads. Appendix H presents more detailed
information on sorting and condemnation rates for young chicken slaughter establishments for
the years CY2006 to CY2010.
The data show that sorting rates in HIMP establishments are less than condemnation rates in
non-HIMP establishments. This is to be expected since reported sorting rates by HIMP
employees do not provide a complete record of all birds removed. HIMP establishment
employees are only required to report the number of birds sorted at sorting stations at the end of
the evisceration line. Birds removed prior to the evisceration line or at locations other than
sorting stations are not consistently recorded by industry and provided to FSIS for recording in
eADRS. Despite the fact that soring and condemnation rates are not directly comparable, these
rates are included in this report for completeness. However, they cannot be used to compare the
effectiveness of sorting by HIMP establishments; instead FSIS verification inspection to
determine compliance with HIMP performance standards for food safety and OCPs measures are
used to determine the effectiveness of establishment sorting activities. The verification checks
are performed randomly through a shift with approximately one ten-bird check per hour
providing reliable data that sorting is effective.
Table 3- 4 Sorting and Condemnation Rates for HIMP and Non-HIMP Broiler
Establishments 2006 2007 2008 2009 2010
Sorting Rates in 20 HIMP
Establishments 0.27% 0.27% 0.45% 0.27% 0.23%
Condemnation Rates in 64 Non-
HIMP Establishments 0.42% 0.39% 0.39% 0.34% 0.30%
Condemnation Rates in 176 All
Non-HIMP Establishments 0.45% 0.42% 0.40% 0.34% 0.30%
19
3.3 Verification of the Establishment Executing its Sanitation SOPs and its
HACCP System under 9 CFR parts 416 and 417
This section addresses FSIS inspection activities related to verification that the HIMP
establishment is executing its sanitation standard operating procedures (SSOP) and its hazard
analysis and critical control point (HACCP) system under Code of Federal Regulations 9 CFR
416 and 417.
3.3.1 Offline Inspection Procedures Performed
The sanitation SOP regulations in 9 CFR 416 and the HACCP regulation in 9 CFR 417 are
among the regulations most strongly related to public health. Sanitation standard operating
procedures are written procedures than an establishment develops to prevent contamination or
direct contamination of product. The establishment must maintain daily records sufficient to
document implementation and monitoring of sanitation SOPs and any corrective actions taken.
There are eight inspection procedure associated with activities that FSIS inspectors perform to
verify compliance with the sanitation SOP and HACCP regulations. These are 01A01, 01B01,
01B02, 01C01, 01C02, 03A01, 03J01, and 03J02. In CY2010, FSIS inspectors performed
approximately 2.8 more offline procedures to verify compliance with sanitation SOP and
HACCP regulatory requirements in HIMP than in non-HIMP establishments. FSIS inspectors
also performed 3.4 more 03J01 procedures in CT2010 in HIMP than in non-HIMP
establishments (see Table 3-3 above). 03J01 procedures verify food safety standards and
HACCP requirements in slaughter establishments.
Thus, FSIS verification inspectors are performing more verification of slaughter HACCP
requirements including food safety (infectious and fecal) verification checks in HIMP than in
non-HIMP establishments. This insures that HIMP establishments continuously meet food safety
performance standards and HACCP regulations. Under HIMP, FSIS inspectors are able to spend
more time on HACCP prevention-oriented inspections and better protect the public from
foodborne diseases.
3.3.2 Public Health Non-Compliance Rates
FSIS inspection program personnel perform inspection procedures in federally-inspected
establishments each day to verify that the establishments are executing their SSOP and HACCP
system under 9 CFR 416 and 417. A noncompliance record (NR) is a written record that
documents noncompliance with FSIS regulations. It is expected that noncompliance rates will be
lower in HIMP than non-HIMP establishments since establishments assume more responsibility
for their production processes. This will increase the confidence that HIMP establishments are
complying with all federal regulations and are producing a safe and wholesome product.
In 2007 FSIS categorized its regulations according to potential public health significance and
identified 61 out of 565 possible regulations most strongly related to public health (FSIS 2007).
NRs documenting noncompliance with these regulations are referred to as health-related or
―W3NRs.‖ For purposes of this report, the terminology ―health-related‖ will be used. The rate at
which an establishment fails to meet these health-related requirements and receives a health-
related noncompliance is considered by FSIS to be an indication of the establishment’s inability
to control its production process and risk.
20
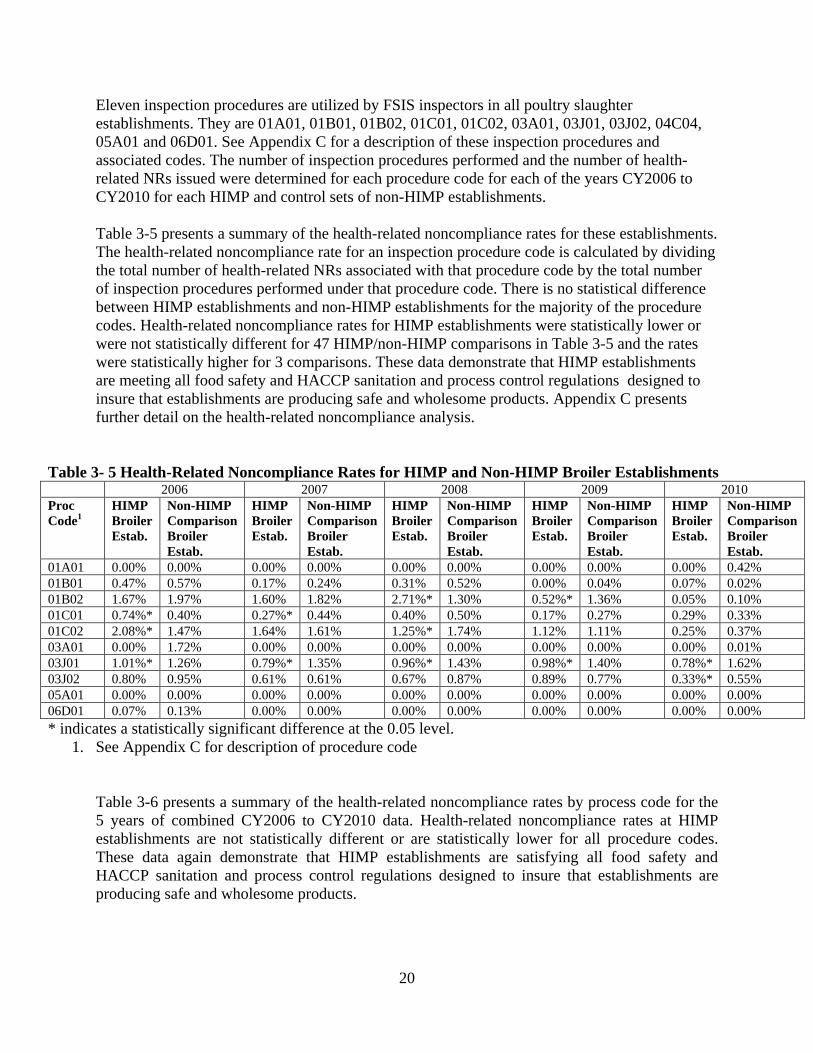
Eleven inspection procedures are utilized by FSIS inspectors in all poultry slaughter
establishments. They are 01A01, 01B01, 01B02, 01C01, 01C02, 03A01, 03J01, 03J02, 04C04,
05A01 and 06D01. See Appendix C for a description of these inspection procedures and
associated codes. The number of inspection procedures performed and the number of health-
related NRs issued were determined for each procedure code for each of the years CY2006 to
CY2010 for each HIMP and control sets of non-HIMP establishments.
Table 3-5 presents a summary of the health-related noncompliance rates for these establishments.
The health-related noncompliance rate for an inspection procedure code is calculated by dividing
the total number of health-related NRs associated with that procedure code by the total number
of inspection procedures performed under that procedure code. There is no statistical difference
between HIMP establishments and non-HIMP establishments for the majority of the procedure
codes. Health-related noncompliance rates for HIMP establishments were statistically lower or
were not statistically different for 47 HIMP/non-HIMP comparisons in Table 3-5 and the rates
were statistically higher for 3 comparisons. These data demonstrate that HIMP establishments
are meeting all food safety and HACCP sanitation and process control regulations designed to
insure that establishments are producing safe and wholesome products. Appendix C presents
further detail on the health-related noncompliance analysis.
Table 3- 5 Health-Related Noncompliance Rates for HIMP and Non-HIMP Broiler Establishments 2006 2007 2008 2009 2010
Proc
Code1
HIMP
Broiler
Estab.
Non-HIMP
Comparison
Broiler
Estab.
HIMP
Broiler
Estab.
Non-HIMP
Comparison
Broiler
Estab.
HIMP
Broiler
Estab.
Non-HIMP
Comparison
Broiler
Estab.
HIMP
Broiler
Estab.
Non-HIMP
Comparison
Broiler
Estab.
HIMP
Broiler
Estab.
Non-HIMP
Comparison
Broiler
Estab.
01A01 0.00% 0.00% 0.00% 0.00% 0.00% 0.00% 0.00% 0.00% 0.00% 0.42%
01B01 0.47% 0.57% 0.17% 0.24% 0.31% 0.52% 0.00% 0.04% 0.07% 0.02%
01B02 1.67% 1.97% 1.60% 1.82% 2.71%* 1.30% 0.52%* 1.36% 0.05% 0.10%
01C01 0.74%* 0.40% 0.27%* 0.44% 0.40% 0.50% 0.17% 0.27% 0.29% 0.33%
01C02 2.08%* 1.47% 1.64% 1.61% 1.25%* 1.74% 1.12% 1.11% 0.25% 0.37%
03A01 0.00% 1.72% 0.00% 0.00% 0.00% 0.00% 0.00% 0.00% 0.00% 0.01%
03J01 1.01%* 1.26% 0.79%* 1.35% 0.96%* 1.43% 0.98%* 1.40% 0.78%* 1.62%
03J02 0.80% 0.95% 0.61% 0.61% 0.67% 0.87% 0.89% 0.77% 0.33%* 0.55%
05A01 0.00% 0.00% 0.00% 0.00% 0.00% 0.00% 0.00% 0.00% 0.00% 0.00%
06D01 0.07% 0.13% 0.00% 0.00% 0.00% 0.00% 0.00% 0.00% 0.00% 0.00%
* indicates a statistically significant difference at the 0.05 level.
1. See Appendix C for description of procedure code
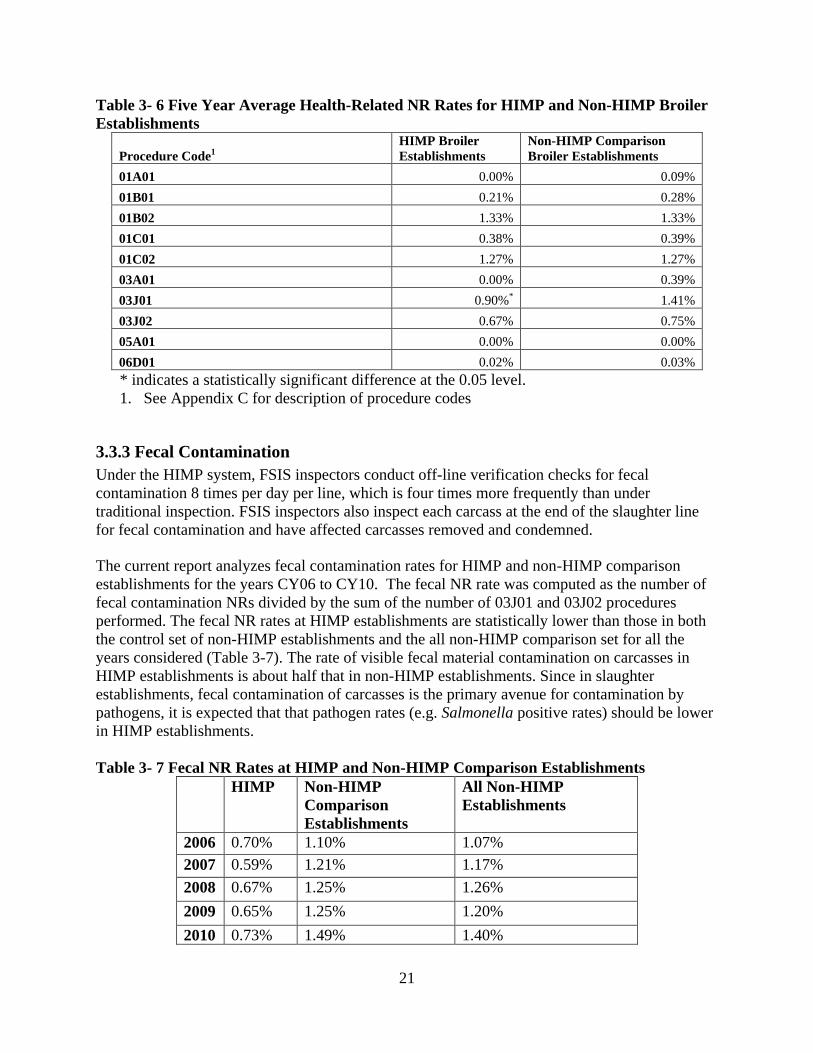
Table 3-6 presents a summary of the health-related noncompliance rates by process code for the
5 years of combined CY2006 to CY2010 data. Health-related noncompliance rates at HIMP
establishments are not statistically different or are statistically lower for all procedure codes.
These data again demonstrate that HIMP establishments are satisfying all food safety and
HACCP sanitation and process control regulations designed to insure that establishments are
producing safe and wholesome products.
21
Table 3- 6 Five Year Average Health-Related NR Rates for HIMP and Non-HIMP Broiler
Establishments
Procedure Code1
HIMP Broiler
Establishments
Non-HIMP Comparison
Broiler Establishments
01A01 0.00% 0.09%
01B01 0.21% 0.28%
01B02 1.33% 1.33%
01C01 0.38% 0.39%
01C02 1.27% 1.27%
03A01 0.00% 0.39%
03J01 0.90%* 1.41%
03J02 0.67% 0.75%
05A01 0.00% 0.00%
06D01 0.02% 0.03%
* indicates a statistically significant difference at the 0.05 level.
1. See Appendix C for description of procedure codes
3.3.3 Fecal Contamination
Under the HIMP system, FSIS inspectors conduct off-line verification checks for fecal
contamination 8 times per day per line, which is four times more frequently than under
traditional inspection. FSIS inspectors also inspect each carcass at the end of the slaughter line
for fecal contamination and have affected carcasses removed and condemned.
The current report analyzes fecal contamination rates for HIMP and non-HIMP comparison
establishments for the years CY06 to CY10. The fecal NR rate was computed as the number of
fecal contamination NRs divided by the sum of the number of 03J01 and 03J02 procedures
performed. The fecal NR rates at HIMP establishments are statistically lower than those in both
the control set of non-HIMP establishments and the all non-HIMP comparison set for all the
years considered (Table 3-7). The rate of visible fecal material contamination on carcasses in
HIMP establishments is about half that in non-HIMP establishments. Since in slaughter
establishments, fecal contamination of carcasses is the primary avenue for contamination by
pathogens, it is expected that that pathogen rates (e.g. Salmonella positive rates) should be lower
in HIMP establishments.
Table 3- 7 Fecal NR Rates at HIMP and Non-HIMP Comparison Establishments
HIMP Non-HIMP
Comparison
Establishments
All Non-HIMP
Establishments
2006 0.70% 1.10% 1.07%
2007 0.59% 1.21% 1.17%
2008 0.67% 1.25% 1.26%
2009 0.65% 1.25% 1.20%
2010 0.73% 1.49% 1.40%
22
To further analyze the fecal NR rates in HIMP and non-HIMP establishments, the number of
fecal NRs was regressed against the HIMP dummy variable (denoting whether an establishment
is HIMP or control non-HIMP), production volume and the number of 03J procedures. The
purpose of the analysis is to determine the influence of production volume and number of 03J
procedures on the number of fecal NRs and fecal NR rates. The analysis shows that (a) there is
not a statistically significant difference between HIMP and non-HIMP with respect to the
number of fecal NRs after adjusting for number of 03J01 and 03J02 procedures performed, (b)
fecal NR rates are statistically significantly lower in HIMP establishments than non-HIMP
establishments after adjusting for production volume, and (c) production volume is not a
statistically significant predictor of fecal NR rates. Appendix D presents the details of the
negative binomial regression for fecal NR rates.
It is expected that the rate of visible fecal contamination on carcasses in HIMP establishments
will not depend on line speeds. To evaluate the effect of line speeds on fecal NR rates, a negative
binomial regression was performed using CY2010 data since that is the only year for which lines
speeds are available. There is no statistical difference in fecal NR rates between establishments
with different line speeds. Appendix E presents the details of the negative binomial regression
for fecal NR rates and line speeds. The analysis indicates that increased line speeds in HIMP
establishments are not having a negative impact on visible fecal contamination rates.
3.4 Verification of the Outcomes of the Establishment Process Control Plan,
both Organoleptic and Microbiologic
This section addresses FSIS inspection activities related to verification of the organoleptic and
microbiologic outcomes of the establishment process control plan.
3.4.1 Food Safety Performance Standards
FSIS has a zero tolerance policy for food safety conditions involving infectious conditions (e.g.,
Septicemia/Toxemia) and fecal material contamination. FSIS developed food safety performance
standards (FS-1 and FS-2) for these conditions set at the 75th percentile of what was achieved
under the Research Triangle Institute (RTI) baseline study (see Appendix A for discussion of
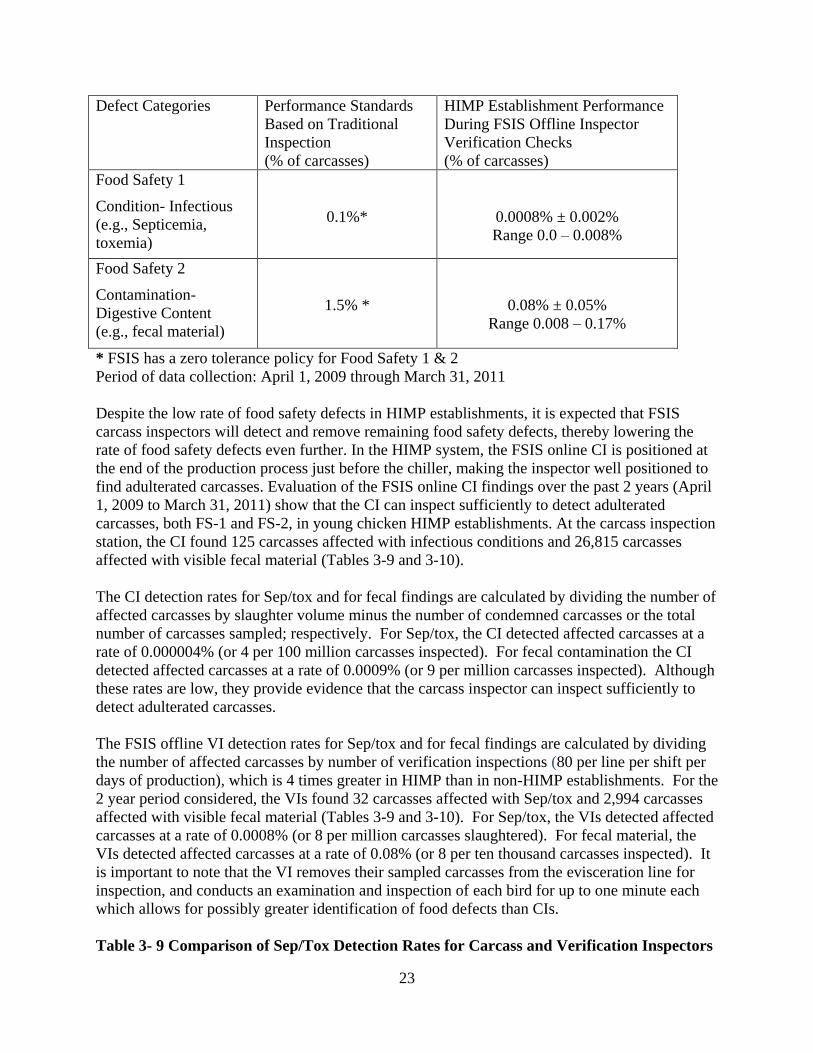
performance standards). A comparison of young chicken HIMP establishment performance with
HIMP food safety performance standards is given in Table 3-8. The analysis is based on FSIS
food safety inspection findings for the 2 year period April 1, 2009 to March 31, 2011.
Performance standards for HIMP establishments provide a scientifically valid measure by which
changes in food safety data can be assessed (Hargis et al. 2002).
Septicemia/Toxemia food safety conditions in HIMP establishments are below 8 per million
carcasses, which is 125 times less than the HIMP performance standard (Table 3-8). Fecal
material contamination levels are below 8 per ten thousand carcasses, which is about 19 times
less than HIMP performance standards.
Table 3- 8 HIMP Achievement of Food Safety Performance Standards at Young Chicken
Establishments
23
Defect Categories Performance Standards
Based on Traditional
Inspection
(% of carcasses)
HIMP Establishment Performance
During FSIS Offline Inspector
Verification Checks
(% of carcasses)
Food Safety 1
Condition- Infectious
(e.g., Septicemia,
toxemia)
0.1%*
0.0008% ± 0.002%
Range 0.0 – 0.008%
Food Safety 2
Contamination-
Digestive Content
(e.g., fecal material)
1.5% *
0.08% ± 0.05%
Range 0.008 – 0.17%
* FSIS has a zero tolerance policy for Food Safety 1 & 2
Period of data collection: April 1, 2009 through March 31, 2011
Despite the low rate of food safety defects in HIMP establishments, it is expected that FSIS
carcass inspectors will detect and remove remaining food safety defects, thereby lowering the
rate of food safety defects even further. In the HIMP system, the FSIS online CI is positioned at
the end of the production process just before the chiller, making the inspector well positioned to
find adulterated carcasses. Evaluation of the FSIS online CI findings over the past 2 years (April
1, 2009 to March 31, 2011) show that the CI can inspect sufficiently to detect adulterated
carcasses, both FS-1 and FS-2, in young chicken HIMP establishments. At the carcass inspection
station, the CI found 125 carcasses affected with infectious conditions and 26,815 carcasses
affected with visible fecal material (Tables 3-9 and 3-10).
The CI detection rates for Sep/tox and for fecal findings are calculated by dividing the number of
affected carcasses by slaughter volume minus the number of condemned carcasses or the total
number of carcasses sampled; respectively. For Sep/tox, the CI detected affected carcasses at a
rate of 0.000004% (or 4 per 100 million carcasses inspected). For fecal contamination the CI
detected affected carcasses at a rate of 0.0009% (or 9 per million carcasses inspected). Although
these rates are low, they provide evidence that the carcass inspector can inspect sufficiently to
detect adulterated carcasses.
The FSIS offline VI detection rates for Sep/tox and for fecal findings are calculated by dividing
the number of affected carcasses by number of verification inspections (80 per line per shift per
days of production), which is 4 times greater in HIMP than in non-HIMP establishments. For the
2 year period considered, the VIs found 32 carcasses affected with Sep/tox and 2,994 carcasses
affected with visible fecal material (Tables 3-9 and 3-10). For Sep/tox, the VIs detected affected
carcasses at a rate of 0.0008% (or 8 per million carcasses slaughtered). For fecal material, the
VIs detected affected carcasses at a rate of 0.08% (or 8 per ten thousand carcasses inspected). It
is important to note that the VI removes their sampled carcasses from the evisceration line for
inspection, and conducts an examination and inspection of each bird for up to one minute each
which allows for possibly greater identification of food defects than CIs.
Table 3- 9 Comparison of Sep/Tox Detection Rates for Carcass and Verification Inspectors
24
Number Sep/tox
findings detected
CY2009-CY2010
Carcasses Inspected Sep/tox detection
rate
Carcasses Inspectors 125 2.97E+09 0.000004%
Verification
Inspectors
32 3.82E+06 0.0008%
Table 3- 10 Comparison of Fecal Detection Rates for Carcass and Verification Inspectors
Number fecal
contaminations
detected CY2009-
CY2010
Carcasses Inspected Fecal detection rate
Carcasses Inspectors 26,815 2.97E+09 0.0009%
Verification
Inspectors
2,994 3.822E+06 0.08%
The data demonstrate that while fewer adulterated poultry carcasses are presented to the
inspector in HIMP establishments, FSIS carcasses inspectors can inspect sufficiently to detect
adulterated carcasses.
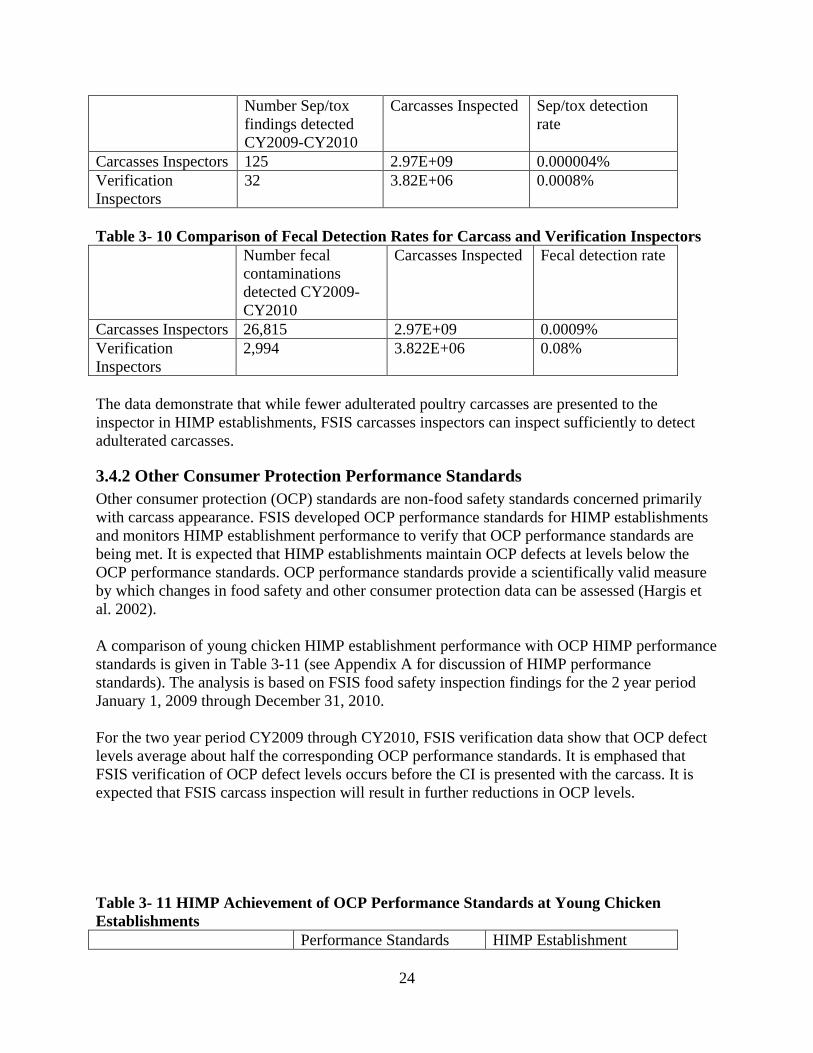
3.4.2 Other Consumer Protection Performance Standards
Other consumer protection (OCP) standards are non-food safety standards concerned primarily
with carcass appearance. FSIS developed OCP performance standards for HIMP establishments
and monitors HIMP establishment performance to verify that OCP performance standards are
being met. It is expected that HIMP establishments maintain OCP defects at levels below the
OCP performance standards. OCP performance standards provide a scientifically valid measure
by which changes in food safety and other consumer protection data can be assessed (Hargis et
al. 2002).
A comparison of young chicken HIMP establishment performance with OCP HIMP performance
standards is given in Table 3-11 (see Appendix A for discussion of HIMP performance
standards). The analysis is based on FSIS food safety inspection findings for the 2 year period
January 1, 2009 through December 31, 2010.
For the two year period CY2009 through CY2010, FSIS verification data show that OCP defect
levels average about half the corresponding OCP performance standards. It is emphased that
FSIS verification of OCP defect levels occurs before the CI is presented with the carcass. It is
expected that FSIS carcass inspection will result in further reductions in OCP levels.
Table 3- 11 HIMP Achievement of OCP Performance Standards at Young Chicken
Establishments
Performance Standards HIMP Establishment

25
Based on Non-HIMP
Inspection (% of carcasses)
Performance During FSIS
Inspector Verification
Checks (% of carcasses ±
one standard deviation)
OCP 1
Condition-Animal Diseases
(e.g., airsacculitis)
1.7% 0.38% ± 0.36%
Range 0.0-1.25%
OCP 2
Condition- Miscellaneous
(e.g., bruises, sores, and other
processing defects)
52.5% 34.1% ± 9.3%
Range 18.2- 49.9%
OCP 3
Contamination-Digestive
Content
(e.g., ingesta)
18.6% 6.3% ± 4.3%
Range 0.25 – 15.2%
OCP 4
Dressing Defects- Other
(e.g., feathers)
80.0% 66.4% ± 10.4%
Range 41.2 – 80.2%
OCP 5
Dressing Defects- Digestive
Tract Tissue
(e.g., bursa, cloaca)
20.8% 9.8% ± 4.0%
Range 3.2 – 15.8%
Period of data collection: CY2009 through CY2010
It is expected that the increased line speeds in HIMP establishments will not result in an increase
rate of OCP defects on carcasses. Poisson and negative binomial regressions were evaluated for
utility in analyzing OCP rates versus line speeds. It was decided to use negative binomial
regression. The analysis shows that there is no statistically significant difference in OCP2 –
OCP5 rates between HIMP establishments with different line speeds. OCP1 rates do show a
positive correlation with line speeds, but the model with line speed does not fit significantly
better than random chance (i.e., the null model without line speeds). The analysis suggests that
increased line speeds in HIMP establishments are not having a negative impact of OCP defect
levels.
One OCP condition that is difficult for online carcass inspectors to identify is avian leucosis, a
viral disease that affects chickens. Avian leukosis is not transmissible to humans and does not
present a human health concern. However, it may render poultry carcasses and viscera
unwholesome (as do other OCPs). Therefore, it is important to identify its presence in poultry
intended to receive the USDA official inspection legend. Avian visceral leukosis cannot be
identified through a carcass inspection alone, but rather is detected by observing the viscera.
Accordingly, in the young chicken HIMP establishments a FSIS offline inspector observes the
carcass and corresponding viscera of the first 300 birds slaughtered of each flock to evaluate the
leukosis status of the flock.
It is common commercial practice to vaccinate each flock of chickens for viral leukosis. On rare
occasions, the vaccine is not effective. If it is not, visceral leukosis is present throughout the
26
entire flock. In the young chicken HIMP establishments, the first 300 birds slaughtered of each
flock are observed to evaluate the leukosis status of the flock. Based on this analysis, the
Inspector in Charge (IIC) or Supervisory Public Health Veterinarian (SPHV) decides whether a
flock is designated as positive for leukosis and may expand the sample size, if necessary. If a
flock is found to be positive, a FSIS offline inspector inspects each viscera for visceral leukosis
only at a location where it can be identified with the carcass until all carcasses in the flock have
been slaughtered. It is FSIS experience that when a flock has avian visceral leukosis, 10 to 15
percent of the birds in the flock have detectable leukosis lesions. For a flock in which 10% of the
birds have detectable avian leukosis, a 300 bird sample provides a greater than 95% probability
of detecting 22 or greater birds with visible leukosis lesions. Thus a 300 bird sample is adequate
to detect avian leucosis in a flock.
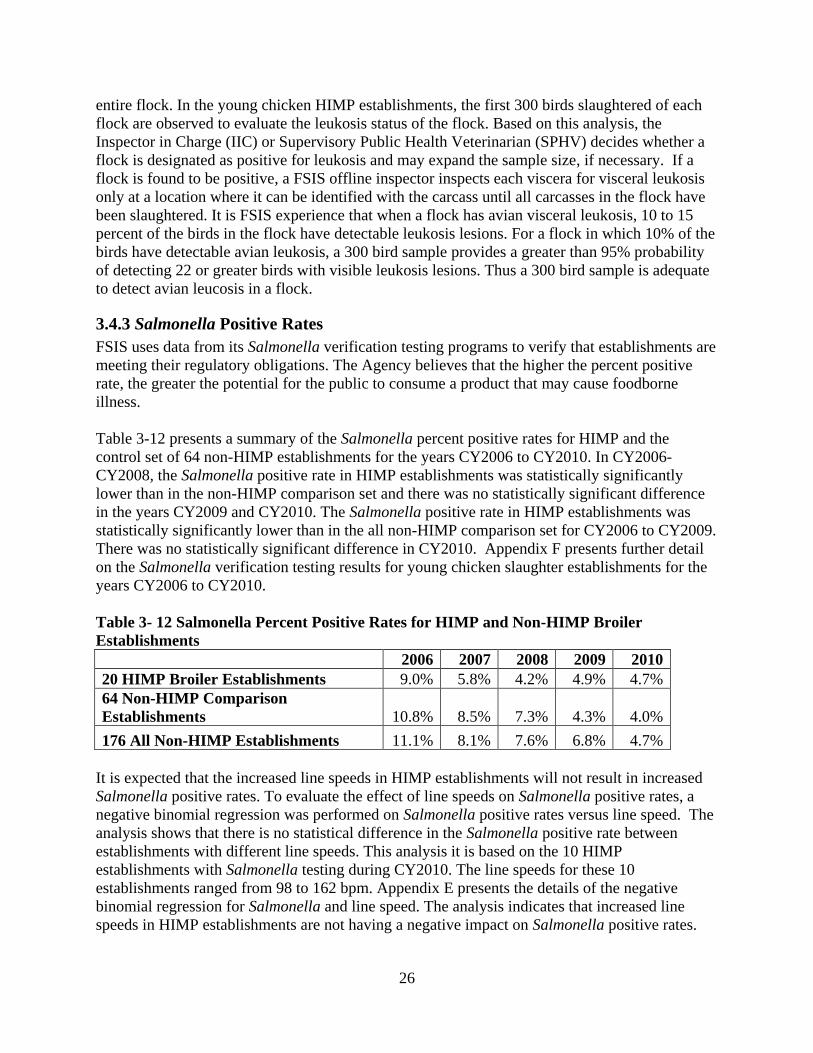
3.4.3 Salmonella Positive Rates
FSIS uses data from its Salmonella verification testing programs to verify that establishments are
meeting their regulatory obligations. The Agency believes that the higher the percent positive
rate, the greater the potential for the public to consume a product that may cause foodborne
illness.
Table 3-12 presents a summary of the Salmonella percent positive rates for HIMP and the
control set of 64 non-HIMP establishments for the years CY2006 to CY2010. In CY2006-
CY2008, the Salmonella positive rate in HIMP establishments was statistically significantly
lower than in the non-HIMP comparison set and there was no statistically significant difference
in the years CY2009 and CY2010. The Salmonella positive rate in HIMP establishments was
statistically significantly lower than in the all non-HIMP comparison set for CY2006 to CY2009.
There was no statistically significant difference in CY2010. Appendix F presents further detail
on the Salmonella verification testing results for young chicken slaughter establishments for the
years CY2006 to CY2010.
Table 3- 12 Salmonella Percent Positive Rates for HIMP and Non-HIMP Broiler
Establishments
2006 2007 2008 2009 2010
20 HIMP Broiler Establishments 9.0% 5.8% 4.2% 4.9% 4.7%
64 Non-HIMP Comparison
Establishments 10.8% 8.5% 7.3% 4.3% 4.0%
176 All Non-HIMP Establishments 11.1% 8.1% 7.6% 6.8% 4.7%
It is expected that the increased line speeds in HIMP establishments will not result in increased
Salmonella positive rates. To evaluate the effect of line speeds on Salmonella positive rates, a
negative binomial regression was performed on Salmonella positive rates versus line speed. The
analysis shows that there is no statistical difference in the Salmonella positive rate between
establishments with different line speeds. This analysis it is based on the 10 HIMP
establishments with Salmonella testing during CY2010. The line speeds for these 10
establishments ranged from 98 to 162 bpm. Appendix E presents the details of the negative
binomial regression for Salmonella and line speed. The analysis indicates that increased line
speeds in HIMP establishments are not having a negative impact on Salmonella positive rates.
27
4.0 DISCUSSION
In October 1999, FSIS began the HIMP project to determine whether new government slaughter
inspection procedures, in conjunction with new plant responsibilities, could improve food safety
in slaughter establishments. Under HIMP, employees of slaughter establishments sort carcasses
before they reach FSIS on-line inspectors, making an initial determination whether they are
unacceptable, allowing the on-line inspector to focus on fewer food-safety issues. This approach
is consistent with HACCP where industry rather than federal inspectors is responsible for
identifying steps in food production where food safety hazards are most likely to occur and for
establishing controls that prevent or reduce them. Currently, there are 20 young chicken; 5 young
turkey, and 5 market hog slaughter establishments participating in HIMP. This report focuses on
the 20 young chicken slaughter establishments in HIMP.
4.1 Previous Evaluations of HIMP Performance
Prior to implementing the HIMP program, Research Triangle Institute (RTI) established a
baseline level of performance in traditional (non-HIMP) young chicken slaughter establishments.
RTI collected thousands of samples from 16 young chicken slaughter establishments operating
under existing inspection systems. The sampled birds had already passed FSIS online inspection,
undergone trimming by establishment personnel to remove visible defects, and been determined
by FSIS offline inspectors to be in compliance with FSIS Finished Product Standards. Based on
this baseline level of performance, FSIS developed HIMP performance standards for two food
safety and five Other Consumer Protection (OCP) non-food safety defects.
The HIMP performance standards were set at the 75th percentile of what the 16 young chicken
slaughter establishments were achieving under traditional inspection before they entered the
HIMP program. To meet the HIMP performance standards, food safety and OCP defects at
HIMP establishments, after establishment employee sorting, will have to be 25 percent lower
before FSIS carcass inspection than the corresponding levels in non-HIMP establishments after
FSIS carcass inspection.
To meet HIMP performance standards, HIMP establishments must reduce food safety
(Septicemia/Toxemia and fecal) and OCP defects in carcasses to levels less than found in the
RTI baseline non-HIMP plants after carcasses have passed FSIS carcass inspection. And these
lower levels of carcass defects must be achieved before the FSIS carcass inspector in HIMP
establishments inspects the carcasses. To verify that FSIS carcass inspectors are being presented
with carcasses satisfying the HIMP performance standards, FSIS verification inspectors check 80
birds per line per shift for food safety defects and between 20 and 50 birds per line per shift for
OCP defects each day.
RTI conducted an initial evaluation of the performance of HIMP chicken slaughter
establishments in 2001 (Cates et al. 2002). That evaluation found that young chicken slaughter
establishments under HIMP performed as well as or better than they did before beginning the
HIMP program. Subsequent verifications over the time periods Sep 18, 2000 – April 30, 2001,
28
Sep 18, 2000 - Sep 30, 2002 and July 14, 2003 - December 31, 2004 confirmed that HIMP plants
were meeting HIMP performance standards (FSIS 2001, 2002, 2008a). These studies
demonstrated that HIMP young chicken slaughter establishments were performing as well or
better than young chicken slaughter establishments under traditional inspection systems.
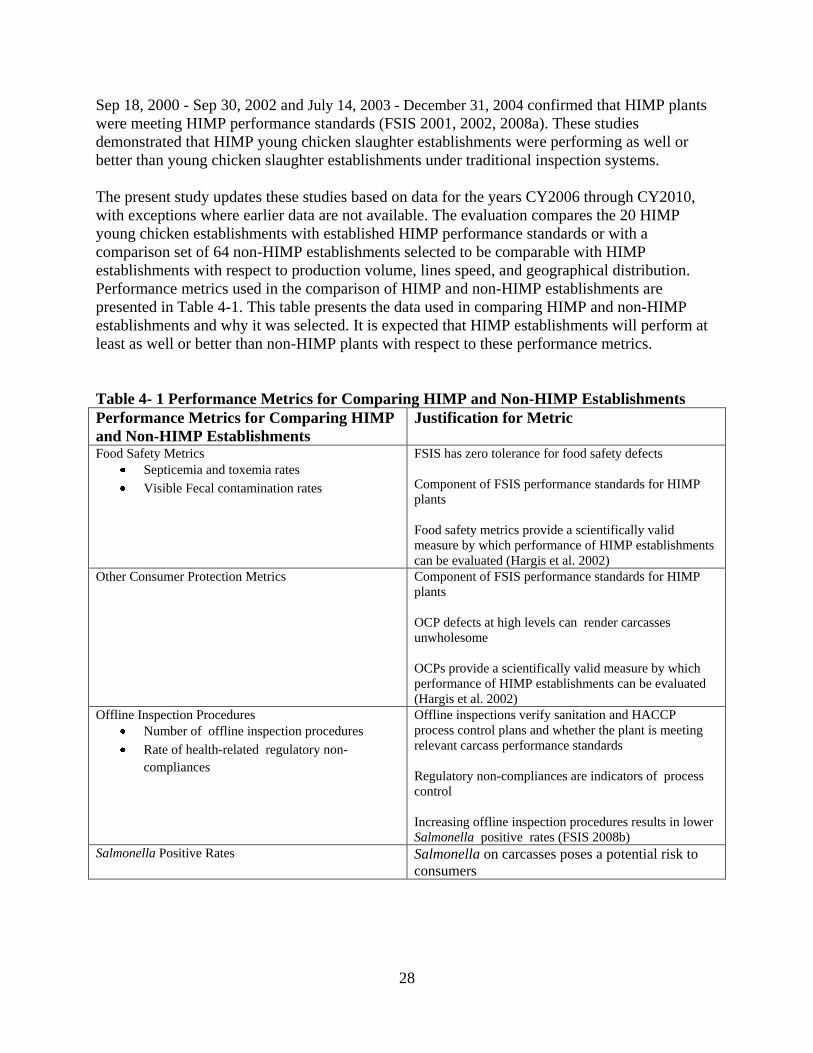
The present study updates these studies based on data for the years CY2006 through CY2010,
with exceptions where earlier data are not available. The evaluation compares the 20 HIMP
young chicken establishments with established HIMP performance standards or with a
comparison set of 64 non-HIMP establishments selected to be comparable with HIMP
establishments with respect to production volume, lines speed, and geographical distribution.
Performance metrics used in the comparison of HIMP and non-HIMP establishments are
presented in Table 4-1. This table presents the data used in comparing HIMP and non-HIMP
establishments and why it was selected. It is expected that HIMP establishments will perform at
least as well or better than non-HIMP plants with respect to these performance metrics.
Table 4- 1 Performance Metrics for Comparing HIMP and Non-HIMP Establishments
Performance Metrics for Comparing HIMP
and Non-HIMP Establishments
Justification for Metric
Food Safety Metrics
Septicemia and toxemia rates
Visible Fecal contamination rates
FSIS has zero tolerance for food safety defects
Component of FSIS performance standards for HIMP
plants
Food safety metrics provide a scientifically valid
measure by which performance of HIMP establishments
can be evaluated (Hargis et al. 2002)
Other Consumer Protection Metrics Component of FSIS performance standards for HIMP
plants
OCP defects at high levels can render carcasses
unwholesome
OCPs provide a scientifically valid measure by which
performance of HIMP establishments can be evaluated
(Hargis et al. 2002)
Offline Inspection Procedures
Number of offline inspection procedures
Rate of health-related regulatory non-
compliances
Offline inspections verify sanitation and HACCP
process control plans and whether the plant is meeting
relevant carcass performance standards
Regulatory non-compliances are indicators of process
control
Increasing offline inspection procedures results in lower
Salmonella positive rates (FSIS 2008b)
Salmonella Positive Rates Salmonella on carcasses poses a potential risk to
consumers
29
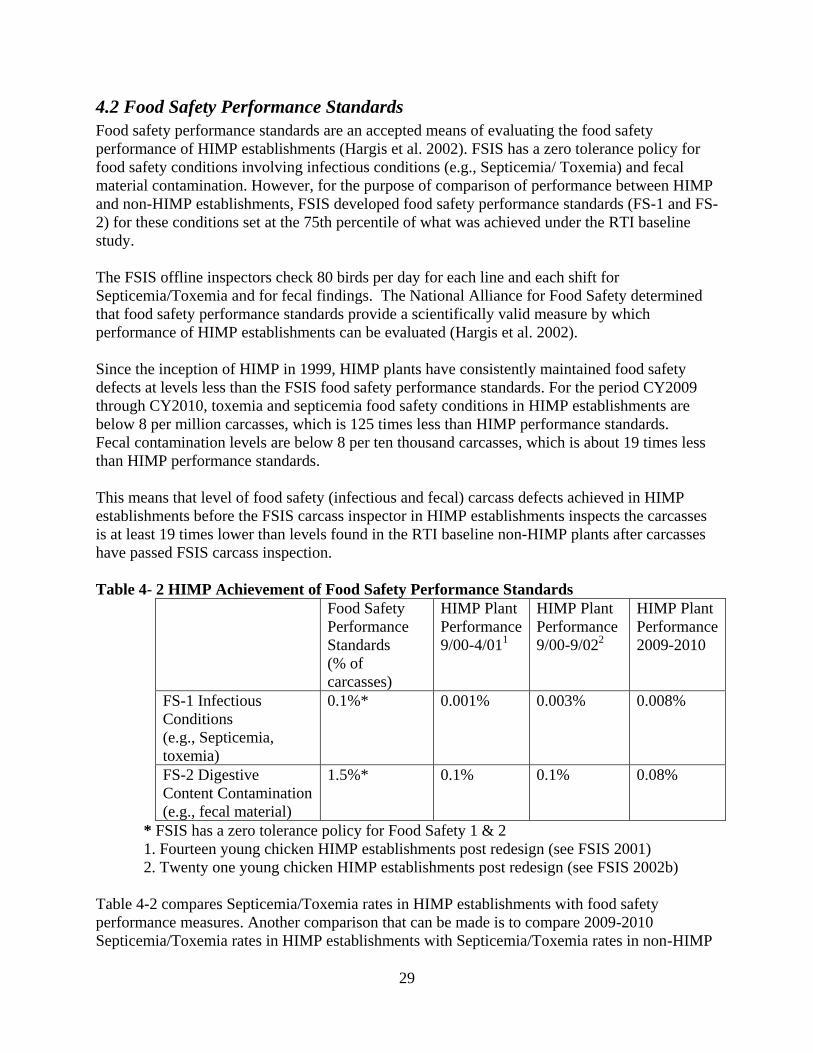
4.2 Food Safety Performance Standards
Food safety performance standards are an accepted means of evaluating the food safety
performance of HIMP establishments (Hargis et al. 2002). FSIS has a zero tolerance policy for
food safety conditions involving infectious conditions (e.g., Septicemia/ Toxemia) and fecal
material contamination. However, for the purpose of comparison of performance between HIMP
and non-HIMP establishments, FSIS developed food safety performance standards (FS-1 and FS-
2) for these conditions set at the 75th percentile of what was achieved under the RTI baseline
study.
The FSIS offline inspectors check 80 birds per day for each line and each shift for
Septicemia/Toxemia and for fecal findings. The National Alliance for Food Safety determined
that food safety performance standards provide a scientifically valid measure by which
performance of HIMP establishments can be evaluated (Hargis et al. 2002).
Since the inception of HIMP in 1999, HIMP plants have consistently maintained food safety
defects at levels less than the FSIS food safety performance standards. For the period CY2009
through CY2010, toxemia and septicemia food safety conditions in HIMP establishments are
below 8 per million carcasses, which is 125 times less than HIMP performance standards.
Fecal contamination levels are below 8 per ten thousand carcasses, which is about 19 times less
than HIMP performance standards.
This means that level of food safety (infectious and fecal) carcass defects achieved in HIMP
establishments before the FSIS carcass inspector in HIMP establishments inspects the carcasses
is at least 19 times lower than levels found in the RTI baseline non-HIMP plants after carcasses
have passed FSIS carcass inspection.
Table 4- 2 HIMP Achievement of Food Safety Performance Standards
Food Safety
Performance
Standards
(% of
carcasses)
HIMP Plant
Performance
9/00-4/011
HIMP Plant
Performance
9/00-9/022
HIMP Plant
Performance
2009-2010
FS-1 Infectious
Conditions
(e.g., Septicemia,
toxemia)
0.1%* 0.001% 0.003% 0.008%
FS-2 Digestive
Content Contamination
(e.g., fecal material)
1.5%* 0.1% 0.1% 0.08%
* FSIS has a zero tolerance policy for Food Safety 1 & 2
1. Fourteen young chicken HIMP establishments post redesign (see FSIS 2001)
2. Twenty one young chicken HIMP establishments post redesign (see FSIS 2002b)
Table 4-2 compares Septicemia/Toxemia rates in HIMP establishments with food safety
performance measures. Another comparison that can be made is to compare 2009-2010
Septicemia/Toxemia rates in HIMP establishments with Septicemia/Toxemia rates in non-HIMP

30
establishments in the same time period. Table 4-3 presents Septicemia/Toxemia rates in non-
HIMP plants for the years 2006 to 2010. While Septicemia/Toxemia detection rates in non-
HIMP establishments have declined over time, they are still higher than the performance
standards for Septicemia/Toxemia in HIMP establishments (see Table 4-2). The rate at which
FSIS offline verification inspectors detect Septicemia/Toxemia defects in HIMP establishments
is about 14 times less than FSIS inspectors detect Septicemia/Toxemia in non-HIMP
establishments.
Assuming that the incoming rate of Septicemia/Toxemia defects on birds is about the same in
both HIMP and non-HIMP establishments, this indicates that HIMP establishment employees are
effective at removing (sorting) birds with Septicemia/Toxemia defects before they are presented
to FSIS carcass and offline inspectors.
Table 4- 3 Septicemia/Toxemia Rates in HIMP and Non-HIMP Establishments
2006 2007 2008 2009 2010
20 HIMP Broiler Establishments 0.008%
64 Non-HIMP Comparison Broiler
Establishments 0.17% 0.14% 0.13% 0.12% 0.11%
167 All Non-HIMP Broiler
Establishments 0.19% 0.17% 0.15% 0.13% 0.12%
In addition to comparing fecal contamination rates in HIMP establishments with performance
standards, fecal noncompliances in HIMP establishments can be compared with those in non-
HIMP establishments. In slaughter establishments, fecal contamination of carcasses is the
primary avenue for contamination by pathogens. Therefore, FSIS enforces a ―zero tolerance‖
standard for visible fecal material on poultry carcasses.
Over the time period CY06 to CY10, the rates of visible fecal contamination on young chicken
carcasses at HIMP establishments average about 50 percent lower than those in both the control
set of non-HIMP establishments and the all non-HIMP comparison set (Table 3-7).
This analysis confirms that HIMP establishments are meeting all food safety performance
standards and have statistically significantly less visible fecal contamination on carcasses than do
non-HIMP establishments.
4.3 Other Consumer Protection (OCP) Standards
FSIS established five performance standards for OCP non-food safety concerns in HIMP
establishments. Non-compliance with OCP concerns does not constitute a food safety issue, but
it may result in unwholesome product. The National Alliance for Food Safety determined that
OCP performance standards provide a scientifically valid measure by which performance of
HIMP establishments could be evaluated (Hargis et al. 2002).
Since the inception of HIMP, HIMP plants have consistently maintained OCP defect levels less
than FSIS OCP performance standards. For the two year period CY2009 through CY2010,
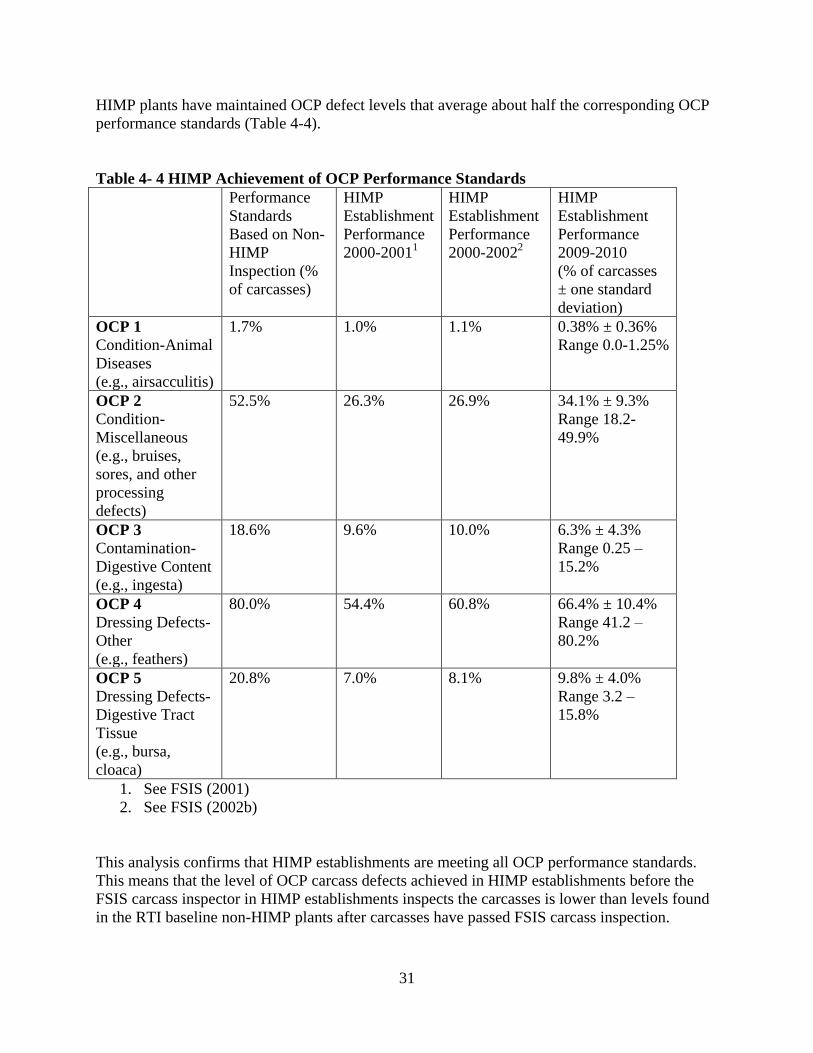
31
HIMP plants have maintained OCP defect levels that average about half the corresponding OCP
performance standards (Table 4-4).
Table 4- 4 HIMP Achievement of OCP Performance Standards
Performance
Standards
Based on Non-
HIMP
Inspection (%
of carcasses)
HIMP
Establishment
Performance
2000-20011
HIMP
Establishment
Performance
2000-20022
HIMP
Establishment
Performance
2009-2010
(% of carcasses
± one standard
deviation)
OCP 1
Condition-Animal
Diseases
(e.g., airsacculitis)
1.7% 1.0% 1.1% 0.38% ± 0.36%
Range 0.0-1.25%
OCP 2
Condition-
Miscellaneous
(e.g., bruises,
sores, and other
processing
defects)
52.5% 26.3% 26.9% 34.1% ± 9.3%
Range 18.2-
49.9%
OCP 3
Contamination-
Digestive Content
(e.g., ingesta)
18.6% 9.6% 10.0% 6.3% ± 4.3%
Range 0.25 –
15.2%
OCP 4
Dressing Defects-
Other
(e.g., feathers)
80.0% 54.4% 60.8% 66.4% ± 10.4%
Range 41.2 –
80.2%
OCP 5
Dressing Defects-
Digestive Tract
Tissue
(e.g., bursa,
cloaca)
20.8% 7.0% 8.1% 9.8% ± 4.0%
Range 3.2 –
15.8%
1. See FSIS (2001)
2. See FSIS (2002b)
This analysis confirms that HIMP establishments are meeting all OCP performance standards.
This means that the level of OCP carcass defects achieved in HIMP establishments before the
FSIS carcass inspector in HIMP establishments inspects the carcasses is lower than levels found
in the RTI baseline non-HIMP plants after carcasses have passed FSIS carcass inspection.
32
4.4 Offline Inspection Procedures
FSIS inspectors conduct offline inspection procedures in HIMP establishments to ensure
compliance with mandatory food safety standards and federal regulations. These inspection
procedures include monitoring for food safety and OCP defects, pathogen levels, and for
compliance with federal sanitation and HACCP regulations. It is expected that the number of
offline inspection procedures will be higher in HIMP than non-HIMP establishments and that the
noncompliance rates will be lower. This will increase the confidence that HIMP establishments
are complying with all federal regulations and are producing a safe and wholesome product.
The FSIS risk assessment on poultry slaughter inspection (FSIS 2008b) found that increasing the
number of offline inspection procedures, especially sanitation, HACCP, and sampling
procedures, should reduce Salmonella positive levels in establishments. Because fewer
inspectors are required to conduct online carcass inspection under HIMP, FSIS is able to conduct
more offline inspection activities.
Overall, FSIS inspectors perform 1.6 times more total offline verification inspection procedures
and 3 times more sanitation and HACCP inspection procedures in HIMP establishments than in
non-HIMP establishments (see Table 3-3). These procedures include verifying compliance with
both OCP- and food safety-related regulations.
Since FSIS inspectors perform more offline verification inspection procedures in HIMP plants,
the FSIS poultry slaughter risk assessment predicts that Salmonella positive rates should be
lower in HIMP plants. The data indicate that Salmonella positive rates in HIMP establishments
average about 80% those in non-HIMP establishments (see below and Table 3-12).
Health-related non-compliance rates provide an indication of the effectiveness of establishment
process control. When considered over CY2006 to CY2010, health-related non-compliance rates
at HIMP plants are not statistically different or are statistically lower for all comparable
procedure codes.
This analysis confirms that HIMP establishments are complying with federal regulations as well
or better than non-HIMP establishments. Since the majority of offline inspection procedures in
young chicken slaughter establishments involve verifying sanitation and HACCP regulations,
HIMP plants are complying with federal sanitation and HACCP regulations as well as or better
than non-HIMP plants.
4.5 Salmonella Positive Rates
Salmonella in raw product is not an adulterant, but however does pose a potential health risk to
consumers. FSIS estimates that Salmonella on young chicken carcasses causes about 170,000
illnesses each year (FSIS 2011). The principal effect of verifying Salmonella levels on young
chicken carcasses is to encourage industry to produce a safer product.
Salmonella positive rates in HIMP establishments average about 80% those in non-HIMP
establishments. Salmonella positive rates at HIMP establishments were not found to be related to
33
line speed. FSIS believes that lower Salmonella positive rates result in fewer public health
impacts (FSIS 2011).
This analysis confirms that HIMP establishments have equal or lower Salmonella positive rates
than non-HIMP establishments.
4.6 Carcass-By-Carcass Inspection
A key issue that this report addresses is whether FSIS inspectors in young chicken slaughter
establishments operating under the HIMP inspection system are able to make a determination as
to whether each carcass is not adulterated and therefore eligible to bear the mark of inspection.
The data show that as a result of industry practices, such as carcass sorting activities, very few
adulterated poultry carcasses are presented to inspectors stationed at the end of the slaughter line
in HIMP establishments (see Tables 4-2 and 4-4). The number of carcasses with septicemia or
toxemia that arrive at the online carcass inspector location is very low (less than 8 carcasses with
infectious conditions per million carcasses processed), as is the number of carcasses with visible
fecal contamination (less than 8 carcasses with fecal contamination per 10,000 carcasses). The
low rate at which adulterated carcasses are presented for inspection under HIMP allows FSIS
inspectors to inspect sufficiently to determine whether each carcass is not adulterated.
If the frequency of defects exceeds the carcass inspector’s ability to inspect each carcass, he or
she can request the Inspector in Charge to perform addition food safety verification checks and
or reduce the line speed. Under traditional (non-HIMP) carcass inspection, the inspector visually
inspects each carcass, its corresponding viscera, and physically touches each carcass to look
inside. HIMP establishment carcass inspection is a visual carcass inspection of the carcass of
each bird that eliminates the time required for the hand motion associated with touching the
carcass. Carcass inspection under HIMP takes less time than under traditional inspection.
Evaluation of carcass inspector food safety findings for the most recent 2 year period (April 2009
to April 2011) shows that HIMP carcass inspectors can inspect sufficiently to detect both
infectious conditions (FS-1) and visible fecal material (FS-2) adulterated carcasses in young
chicken HIMP establishments. Although defect levels presented to the carcass inspector are low
(125 and 19 times less than HIMP performance standards for sep/tox and fecal contamination,
respectively), the HIMP carcass inspector detects carcasses with infectious conditions at a rate of
4 per 100 million carcasses slaughtered and visible fecal contamination at a rate of 9 per million
carcasses slaughtered. The FSIS carcass inspectors can inspect sufficiently to detect adulterated
carcasses.
Because under the HIMP system, the online inspector is positioned at the end of the slaughter
line and just before the immersion chiller, he or she is well-positioned to prevent carcasses with
fecal contamination from entering the chiller and to protect consumers from adulterated
products. They see birds after the establishment’s interventions have been applied to verify that
the carcasses are free of food safety defects.
34
Before implementing the HIMP program, FSIS established food safety and non-food safety
performance standards as a means for measuring the performance of slaughter establishments
operating under the new HIMP inspection procedures (see Appendix A). Performance standards
provide a scientifically valid measure by which changes in food safety and OCP data can be
assessed (Hargis et al. 2002). HIMP establishments have consistently maintained food safety
defect levels at least a factor of 10 less than the performance standards and OCP finding levels
that average about half the corresponding OCP performance standards.
Under the HIMP system, FSIS inspectors conduct off-line verification checks for fecal
contamination four times more frequently than under traditional inspection. FSIS online
inspectors also inspect each carcass at the end of the slaughter line for fecal contamination and
have affected carcasses removed and condemned. Evaluation of carcass inspector food safety
findings data from April 2009 to April 2011 shows that the HIMP FSIS inspectors find and
remove carcasses with visible fecal material. In addition, fecal positive rates in HIMP
establishments average about half those in non-HIMP establishments.
As part of a Government Accountability Office (GAO) review of the HIMP models project
(GAO 2001), 210 USDA inspectors and veterinarians were surveyed as to whether product
safety was the same or better under HIMP system as compared to the traditional system.
Seventy one percent of USDA inspectors and veterinarians surveyed indicated that product
safety was the same or better under HIMP system as compared to the traditional system, and
57% indicated that product quality was the same or improved. The National Alliance for Food
Safety review (Hargis et al. 2002) agreed that the data indicated that the safety and quality of
young chickens inspected under the HIMP system is either the same or improved as compared to
the traditional system. The CY2009 to CY2010 data analyzed in the current report show that all
HIMP establishments are meeting the food safety and OCP performance standards for HIMP.
In aggregate, these findings support that the on line inspectors in HIMP establishments are
performing in a manner that enables them to properly inspect each carcass and, therefore, make
the inspection to identify adulterated carcasses. The data demonstrate that while fewer
adulterated poultry carcasses are presented to the inspector in HIMP establishments, FSIS
carcasses inspectors can inspect sufficiently to find adulterated carcasses.
35
5.0 CONCLUSION
This final report contains an evaluation of FSIS inspection findings in HIMP establishments and,
as appropriate, compares those with established HIMP performance standards or with a
comparison set of 64 non-HIMP establishments selected to be comparable with HIMP
establishments with respect to production volume, lines speed, and geographical distribution.
The evaluation confirms, in agreement with previous evaluations, that HIMP establishments are
meeting all food safety and OCP HIMP performance standards. The HIMP performance
standards are a stringent metric. To meet HIMP performance standards, HIMP establishments
must reduce food safety (infectious and fecal) and OCP defects in carcasses to levels less than
found in the RTI baseline non-HIMP plants after carcasses have passed FSIS carcass inspection.
And these lower levels of carcass defects must be achieved before the FSIS carcass inspector in
HIMP establishments inspects the carcasses. Compliance with HIMP performance standard
means that HIMP establishments are reducing food safety and OCP defects in carcasses to levels
less than or equal to levels in non-HIMP establishments.
Fecal contamination rates and Salmonella positive rates are lower in HIMP than in non-HIMP
establishments. FSIS believes that lower Salmonella positive rates result in fewer public health
impacts (FSIS 2011).
Because fewer inspectors are required to conduct online carcass inspection in HIMP
establishments, FSIS is able to conduct more offline food safety related inspection activities.
HIMP establishments have higher compliance with SSOP and HACCP prevention practice
regulations and lower levels of non-food safety defects, fecal defect rates, and Salmonella
verification testing positive rates than non-HIMP establishments. These data indicate that HIMP
inspection provides improvements in food safety and other consumer protections.
A summary of results follows:
Toxemia/septicemia food safety conditions in HIMP establishments are below 8 per
million carcasses, which is 125 times less than HIMP performance standards.
Toxemia/septicemia defect rates are about 14 times lower in HIMP than non-HIMP
establishments.
Fecal contamination levels are below 8 per ten thousand carcasses, which is about 19
times less than HIMP performance standards.
OCP conditions in HIMP establishments average about half the corresponding OCP
performance standards.
SSOP and HACCP systems in HIMP establishments function statistically better or not
statistically different than comparison non-HIMP establishments for all comparable
slaughter-related procedure codes. The rate of HACCP 03J01 health-related
noncompliances in HIMP establishments is 1.6 times lower than in non-HIMP
establishments.
The fecal NR rates at HIMP establishments are about half than those in non-HIMP
establishments. Fecal NR rates are not found to be related to line speed.
36
Salmonella positive rates in HIMP establishments average about 80% those in non-HIMP
establishments. Salmonella positive rates at HIMP establishments were not found to be
related to line speed.
In aggregate, the findings support that the online inspectors in HIMP establishments are
performing in a manner that enables them to properly inspect each carcass and, therefore, make
the appraisals sufficient to identify adulterated carcasses. The data demonstrate that fewer
adulterated poultry carcasses are presented to the inspector in HIMP establishments and that the
FSIS carcasses inspector can perform in a manner that that enables them to properly inspect each
carcass.
Given the low numbers of adulterated poultry carcasses presented to the inspector in HIMP
establishments, the stability of line speeds in the HIMP pilot project, and the ability of the
carcass inspector to personally inspect each and every carcass leaving the slaughter line, FSIS
has determined that the addition of a second carcass inspector to each line would not further
HIMP project objectives and is not necessary to meet statutory mandates.
37
6.0 REFERENCES
1. Cates SC, Anderson DW, Karns SA, Brown PA. Traditional versus hazard
analysis and critical control point-based inspection: results from a poultry
slaughter project. J Food Prot. 2001 64 (6):826-32.
2. Dynamac 2010, Establishment Profile Data Collection for PHIS, Dynamac
Corporation, Rockville, MD, data collected in 2009 and 2010.
3. Federal Register 1997, Vol 62(111, HACCP-Based Meat and Poultry Inspection
Concepts. http://www.fsis.usda.gov/oa/fr/96-008N.htm
4. Food Safety Inspection Service (FSIS) 2011, Potential Public Health Impact of
Salmonella and Campylobacter Performance Guidance for Young Chickens and
Turkeys
http://www.fsis.usda.gov/PDF/Potential_Public_Health_Impact_Sal_Campy_Perf
ormance_Guidance_Broilers_Turkeys_2011.pdf
5. Food Safety Inspection Service (FSIS) 2008a, Improvements for Poultry
Slaughter Inspection: Appendix G – Other Consumer Protection Performance
Standards
http://www.fsis.usda.gov/OPPDE/NACMPI/Feb2008/Slaughter_Appendix_G.pdf
6. Food Safety Inspection Service (FSIS) 2008b, FSIS Risk Assessment for Guiding
Public Health-Based Poultry Slaughter Inspection
http://www.fsis.usda.gov/PDF/Poultry_Slaughter_Risk_Assess_Jan2008.pdf
7. Food Safety Inspection Service (FSIS) 2007, Ranking of Non-Compliance Records
(NR) Based on Public Health Significance.
http://www.fsis.usda.gov/PDF/RBI_Ranking_of_NR.pdf
8. Food Safety Inspection Service (FSIS) 2002a, HACCP-Based Inspection Models
Project: Baseline Results for Young Chickens.
http://www.fsis.usda.gov/Frame/FrameRedirect.asp?main=http://www.fsis.usda.g
ov/oa/haccp/baseline_broilers/index.htm Food Safety Inspection Service (FSIS)
2002b, HIMP Redesign: Achievement of Performance Standards Young Chicken
Plants http://www.fsis.usda.gov/Science/HIMP_Data/index.asp
9. Food Safety Inspection Service (FSIS) 2001, Redesign Achievement of
Performance Standards in Young Chicken Plants
http://www.fsis.usda.gov/oa/haccp/himp_update5.htm
10. General Accounting Office (GAO), 2001, FOOD SAFETY: Weaknesses in Meat
and Poultry Inspection Pilot Should Be Addressed Before Implementation
http://www.gao.gov/new.items/d0259.pdf
11. Hargis,
BM., Curtis PA, Johnson
MG, and Williams JD 2002 Review of the
HACCP-Based Inspection Models Project by the National Alliance for Food
Safety Technical Team
http://www.fsis.usda.gov/OPPDE/nacmpi/Nov2002/Papers/NAFS97.pdf
38
7.0 APPENDICES
Appendix A - History of HIMP
HIMP was developed by FSIS to test inspection models that produce a more flexible and
efficient inspection system. A key element of HIMP is that establishment personnel are required
to conduct carcass sorting activities before FSIS conducts online carcass inspection so that only
carcasses that the establishment deems likely to pass inspection are presented to the carcass
inspector. HIMP allows FSIS carcass inspectors to perform a carcass-by carcass inspection more
efficiently and in less time than is the case where establishments have not sorted and trimmed
carcasses before they are inspected. As a result, under HIMP, a single online carcass inspector is
able to conduct an effective carcass-by-carcass inspection at higher line speeds, subject to the
establishment’s ability to maintain continuous process control. Because fewer inspectors are
required to conduct online carcass inspection, FSIS is able to conduct more offline food safety
related inspection activities.
A-1 HIMP Inspection activities
Every HIMP establishment has an online CI and an offline VI. The online carcass inspector
conducts a carcass-by-carcass appraisal before the carcasses enter the chiller. If the online
carcass inspector observes any food safety hazards on any of the carcasses, such as the presence
of septicemic or toxemic animal disease or fecal material, he or she stops the line to prevent the
contaminated carcass from entering the chiller.
In addition to the online carcass inspector, one offline verification inspector is assigned for each
evisceration line in HIMP establishments. The HIMP offline inspectors focus their attention on
food safety related inspection activities, such as conducting HACCP and sanitation verification
procedures and collecting samples for pathogen testing. The offline VI also verifies and
evaluates the HACCP and OCP process control plans and determines whether the establishment
is meeting relevant regulatory requirements and performance standards.
The duties of the CI include:
Visually inspects each carcass on the line including the exterior of the carcasses as they
are presented to see if they are adulterated
Identifies FS-1 or FS-2 affected carcasses defects
o If the CI is before the CCPs for Sep/Tox and fecal contamination and the CI
identifies an FS-1 or FS-2 defect, he or she stops the evisceration line and has
the carcass removed and documents each finding on a tally sheet, but does not
write a NR.
o If the CI is after the CCPs for Sep/Tox and fecal contamination and the CI
identifies an FS-1 or FS-2 defect, he or she stops the evisceration line and has
the carcass removed, and writes an NR.
Condemns carcasses with OCP defects that clearly exhibit condemnable conditions
The duties of the VI include:
39
Conduct scheduled and unscheduled sampling by examining carcasses, selected in 10 bird
sets before the CI position, to determine if the establishment is complying with relevant
performance standards.
Conduct eight 10-bird-sample sets per line for shift for FS-1 and FS-2 defects. If the VI finds
a food safety defect (FS-1 or FS-2), he or she will document the noncompliance on a NR.
Conduct OCP verification activities. The minimum number of OCP sample sets per line is
two sets (20 birds) and the minimum number of birds per shift is 50. The VI writes an NR to
document the failure of OCP-1 maximum limits.
Issue an NR, if at any point within the 25-day period the 25-day limit for OCP performance is
exceeded for any OCP category.
Assess the overall design and execution of all the establishment processes under its HACCP
and process control procedures.
Verify HACCP and process control plans and whether the plant is meeting relevant
carcass performance standards.
A-2 HIMP Performance Standards
Under HIMP, FSIS has established performance standards for food safety (FS) and non-food
safety defects (also known as OCP) found in young chickens, hogs, and turkeys. The food safety
performance standards are set at zero to protect consumers from conditions that may be harmful.
The OCP performance standards are set at the 75th percentile of what was achieved under the
Research Triangle Institute (RTI) baseline study; thus, 25 percent of the establishments entering
HIMP have to improve upon their baseline results in order to meet the more stringent standards.
To develop the OCP performance standards, RTI collected thousands of samples from 16 young
chicken slaughter establishments operating under the existing inspection systems. The sampled
birds had already passed FSIS online inspection, undergone trimming by establishment personnel
to remove visible defects, and been determined by FSIS offline inspectors to be in compliance
with FSIS Finished Product Standards (FPS). Then, FSIS ranked the 16 establishments based on
their performance under each of the five OCP categories. The performance standard for each
OCP category was then established based on the performance level of the establishment
representing the 75th
percentile for that category (i.e., the performance level of the fourth-best
performing establishment of each category). Thus, the OCP performance standards represent a
reduction from the highest prevalence of defects found in product that had passed the FPS.
Participating establishments must revise their HACCP systems to meet these food safety
performance standards and establish process control systems to address the OCP concerns.
No food safety or non-food safety defects are acceptable to FSIS. HIMP is an effort to reduce
and eliminate defects that pass through traditional inspection. Under HIMP inspection, FSIS
inspectors check for fecal contamination and other organoleptic food safety defects four times
more frequently than under the traditional system to ensure that performance standards are met.
A-3 HIMP Pilot Project Litigation
In June 1997 FSIS sought public comment on the proposed HIMP inspection model project.
Under the HIMP inspection system proposed at that time, FSIS did not plan to have fixed FSIS
inspection stations on slaughter lines. Instead, FSIS inspectors would provide oversight at the
slaughter lines and verification that establishments were properly implementing HACCP, among
other things.
40
In April 1998, the FSIS inspectors’ union filed suit in the United States District Court to enjoin
the USDA from proceeding with the pilot project, on the grounds that it violated the Federal
Meat Inspection Act, 21 U.S.C. section 604, and the Poultry Products Inspection Act, 21 U.S.C.
section 455, by not requiring federal government officials to perform carcass-by-carcass
postmortem inspections.
In September 1999, U.S, District Court ruled the proposed HIMP pilot project did not violate the
requirements of the federal meat and poultry inspection statutes. In June 2000, the United States
Court of Appeals for the District of Columbia Circuit ruled that delegating the task of inspecting
carcasses to establishment employees violated the acts because both statutes require that federal
inspectors, rather than private employees, determine whether a product is adulterated.
As a result of this ruling, in September 2000, FSIS redesigned the pilot project and placed at
least one FSIS inspector back at a fixed location on each slaughter line to inspect each carcass
and determine whether it is adulterated. In January 2001, the United States Court of Appeals ruled
that the redesigned HIMP pilot project satisfied the requirements of the federal meat and poultry
inspection statutes.
A-4 Research Triangle Institute Study
The purpose of the HIMP pilot study was to determine if HIMP establishments could provide a
level of safety and quality equal to or better than traditionally inspected slaughter establishments.
To obtain data with which to evaluate the performance of HIMP establishments, FSIS contracted
with Research Triangle Institute (RTI) to gather baseline data on the performance of traditional
young chicken slaughter establishments. Between 1998 and 2000 and prior to young chicken
slaughter establishments beginning to operate under HIMP, RTI conducted a study of 16 young
chicken establishments to establish baseline organoleptic and microbial levels at traditional
young chicken slaughter establishments. Based on baseline information, FSIS developed and
published performance standards on November 2, 2000 that allow for evaluation of HIMP
establishment food safety and other consumer protection performance relative to traditional
inspection systems.
After the HIMP program began and during the period September of 2000 to December of 2001,
RTI collected microbial and organoleptic data in the 16 young chicken establishments in the
HIMP pilot study to determine their performance relative to the performance standards
established in November 2000. HIMP establishment performance for FS-1 or FS-2 was less
than 0.003% and 0.1% for carcasses with defects for FS-1 and FS-2, respectively, compared to
the performance standards of 0.1% and 1.5%, respectively, which are based on performance at
non-HIMP establishments. HIMP establishment OCP performance was also consistently below
OCP performance standards.
The RTI study concluded that inspection under the new models is equivalent and in some ways
superior to that of traditional inspection (Cates et al. 2001). The pilot project suggested that the
HIMP inspection system can maintain or improve food safety and other consumer protection
conditions relative to traditional hands-on inspection methods.
41
A-5 National Alliance for Food Safety Review
In 2002 a technical review team selected by the National Alliance for Food Safety under contract
with FSIS reviewed results of the RTI study. The review team consisted of nationally and
internationally recognized experts in the area of poultry microbiology, food safety, poultry
health, poultry processing, and statistical evaluation. The results of the National Alliance for
Food Safety review were published in Hargis et.al. (2002). The review team determined that the
overall design and methodology of the RTI study were generally appropriate, and were perhaps
the best available options to allow for comparison of organoleptic data between the traditional
and HIMP systems. The Hargis et al. (2002) report found that the RTI data showed marked
improvement in the organoleptic defect scores of carcasses processed under the HIMP model
system as compared to the baseline data collected under the traditional system.
42
Appendix B - Line Speed Methodology
It is possible to calculate annual average line speed at young chicken slaughter establishments
from an establishment’s annual slaughter volume, hours of operation, and the number of
evisceration lines as follows:
The annual slaughter volume and total annual hours of operation for each shift and
weekday of operation are obtained from the electronic Animal Disease Reporting System
(eADRS). For each shift and weekday of operation, the total heads slaughtered per
minute can be calculated by dividing the annual heads slaughtered by the annual duration
of operation in minutes.
Average heads slaughtered per minute is calculated by averaging the above, usually 10,
numbers (5 days and 2 shifts). Saturdays and Sundays are excluded since they generally
have smaller volumes.
An average line speed is computed by dividing the heads slaughtered per minute by the
number of lines obtained from the PHIS establishment profile dataset (Dynamac 2010).
The calculated line speed is compared with lines speeds from the 2011 line speed survey
and the PHIS establishment profile to provide a reality check.
The data presented in Table B-1 can be used to illustrate the process (This is data for a single
establishment). The table gives the annual heads slaughtered as a function of the day of the week
(2= Monday and 7= Saturday) and shift. The table also gives the start and end time of each
weekday of operation, from which the duration of slaughter operations can be calculated. In most
cases, slaughter establishments work an 8.5 hour shift that includes two 15 minute breaks. Thus,
most slaughter establishments actually slaughter 8 hours per shift. The 8 hours of slaughter time
is converted to 480 minutes. Sometimes the night shift operates on slightly different hours. The
actual hours of operation for each establishment are used in the calculation of slaughter rates for
that establishment.
To obtain the slaughter rate for a given shift and day of the week, the annual heads slaughtered
for each shift/day of the week combination is divided by the days per year of slaughter
operations to yield heads slaughtered per shift per day. This is then divided by the slaughter time
in minutes (480 in example Table A-1) for that shift/day of the week to obtain the heads
slaughtered per minute for a given shift/day of the week. The slaughter rates on Saturdays are not
calculated because of the lack of data on hours of operation and the low slaughter volumes on
Saturdays. The 10 slaughter rates for each of the 2 shifts and 5 days of the week are then
averaged to obtain an average slaughter rate in heads per minute.
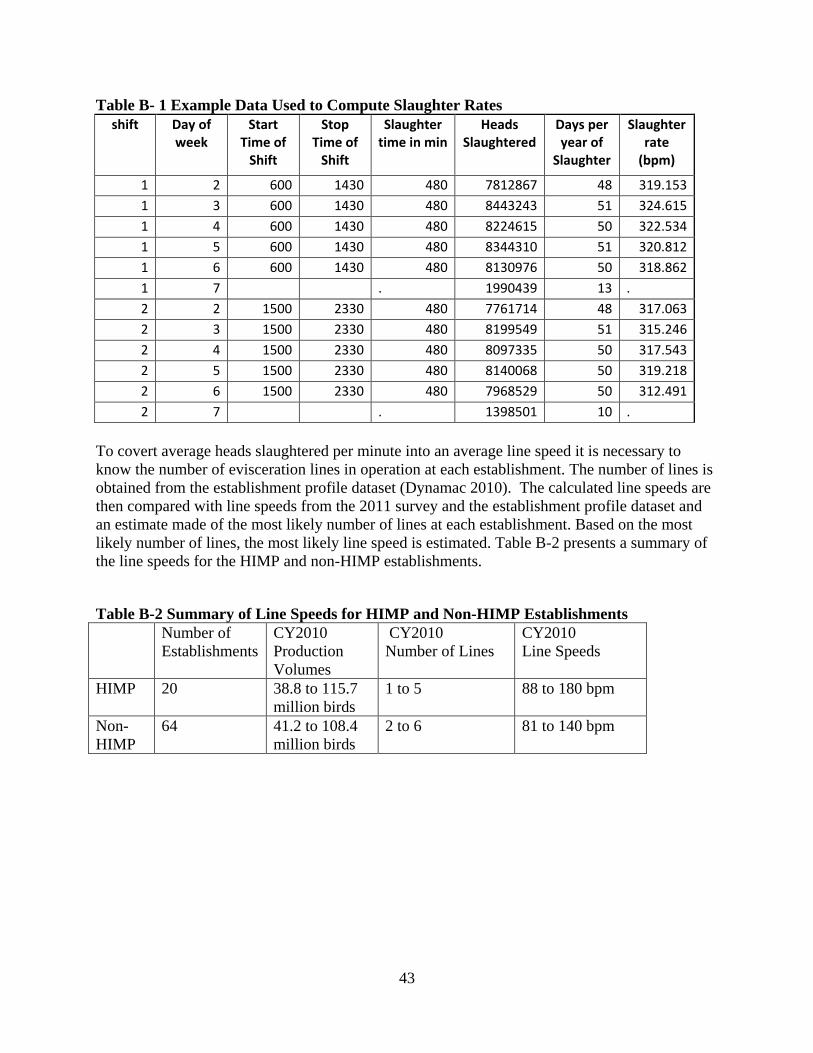
43
Table B- 1 Example Data Used to Compute Slaughter Rates
shift Day of week
Start Time of
Shift
Stop Time of
Shift
Slaughter time in min
Heads Slaughtered
Days per year of
Slaughter
Slaughter rate
(bpm)
1 2 600 1430 480 7812867 48 319.153
1 3 600 1430 480 8443243 51 324.615
1 4 600 1430 480 8224615 50 322.534
1 5 600 1430 480 8344310 51 320.812
1 6 600 1430 480 8130976 50 318.862
1 7 . 1990439 13 .
2 2 1500 2330 480 7761714 48 317.063
2 3 1500 2330 480 8199549 51 315.246
2 4 1500 2330 480 8097335 50 317.543
2 5 1500 2330 480 8140068 50 319.218
2 6 1500 2330 480 7968529 50 312.491
2 7 . 1398501 10 .
To covert average heads slaughtered per minute into an average line speed it is necessary to
know the number of evisceration lines in operation at each establishment. The number of lines is
obtained from the establishment profile dataset (Dynamac 2010). The calculated line speeds are
then compared with line speeds from the 2011 survey and the establishment profile dataset and
an estimate made of the most likely number of lines at each establishment. Based on the most
likely number of lines, the most likely line speed is estimated. Table B-2 presents a summary of
the line speeds for the HIMP and non-HIMP establishments.
Table B-2 Summary of Line Speeds for HIMP and Non-HIMP Establishments
Number of
Establishments
CY2010
Production
Volumes
CY2010
Number of Lines
CY2010
Line Speeds
HIMP 20 38.8 to 115.7
million birds
1 to 5 88 to 180 bpm
Non-
HIMP
64 41.2 to 108.4
million birds
2 to 6 81 to 140 bpm
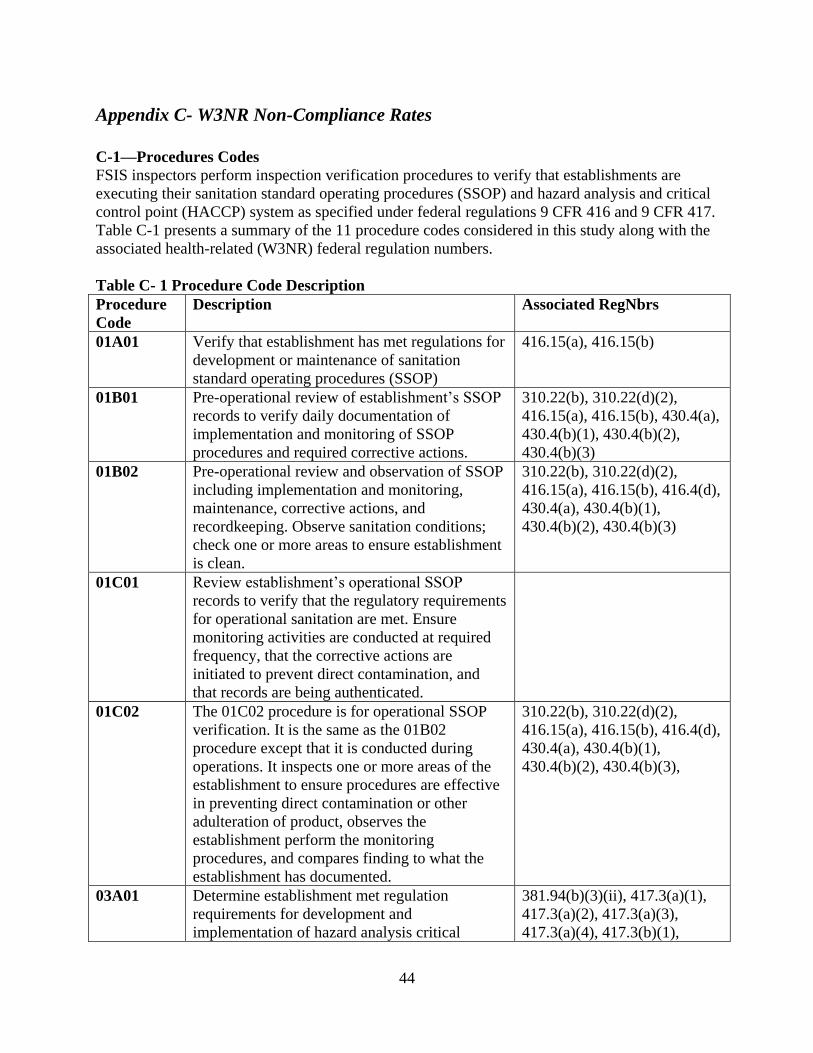
44
Appendix C- W3NR Non-Compliance Rates
C-1—Procedures Codes
FSIS inspectors perform inspection verification procedures to verify that establishments are
executing their sanitation standard operating procedures (SSOP) and hazard analysis and critical
control point (HACCP) system as specified under federal regulations 9 CFR 416 and 9 CFR 417.
Table C-1 presents a summary of the 11 procedure codes considered in this study along with the
associated health-related (W3NR) federal regulation numbers.
Table C- 1 Procedure Code Description
Procedure
Code
Description Associated RegNbrs
01A01 Verify that establishment has met regulations for
development or maintenance of sanitation
standard operating procedures (SSOP)
416.15(a), 416.15(b)
01B01 Pre-operational review of establishment’s SSOP
records to verify daily documentation of
implementation and monitoring of SSOP
procedures and required corrective actions.
310.22(b), 310.22(d)(2),
416.15(a), 416.15(b), 430.4(a),
430.4(b)(1), 430.4(b)(2),
430.4(b)(3)
01B02 Pre-operational review and observation of SSOP
including implementation and monitoring,
maintenance, corrective actions, and
recordkeeping. Observe sanitation conditions;
check one or more areas to ensure establishment
is clean.
310.22(b), 310.22(d)(2),
416.15(a), 416.15(b), 416.4(d),
430.4(a), 430.4(b)(1),
430.4(b)(2), 430.4(b)(3)
01C01 Review establishment’s operational SSOP
records to verify that the regulatory requirements
for operational sanitation are met. Ensure
monitoring activities are conducted at required
frequency, that the corrective actions are
initiated to prevent direct contamination, and
that records are being authenticated.
01C02 The 01C02 procedure is for operational SSOP
verification. It is the same as the 01B02
procedure except that it is conducted during
operations. It inspects one or more areas of the
establishment to ensure procedures are effective
in preventing direct contamination or other
adulteration of product, observes the
establishment perform the monitoring
procedures, and compares finding to what the
establishment has documented.
310.22(b), 310.22(d)(2),
416.15(a), 416.15(b), 416.4(d),
430.4(a), 430.4(b)(1),
430.4(b)(2), 430.4(b)(3),
03A01 Determine establishment met regulation
requirements for development and
implementation of hazard analysis critical
381.94(b)(3)(ii), 417.3(a)(1),
417.3(a)(2), 417.3(a)(3),
417.3(a)(4), 417.3(b)(1),
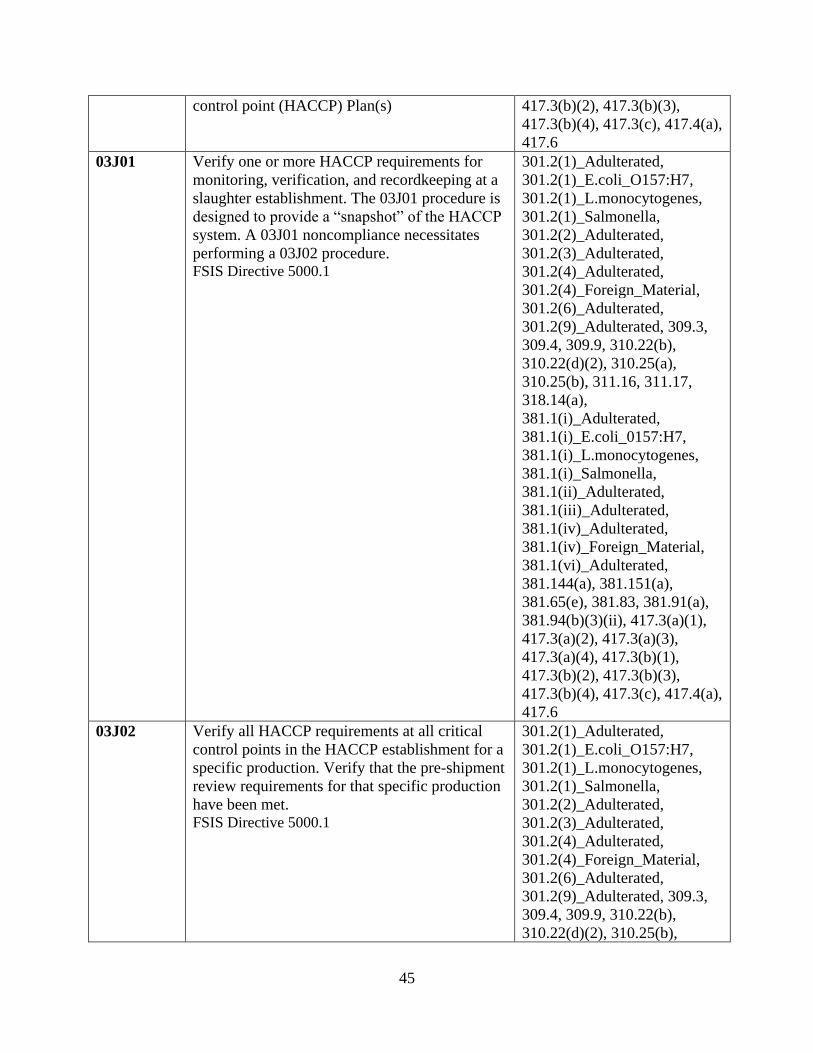
45
control point (HACCP) Plan(s) 417.3(b)(2), 417.3(b)(3),
417.3(b)(4), 417.3(c), 417.4(a),
417.6
03J01 Verify one or more HACCP requirements for
monitoring, verification, and recordkeeping at a
slaughter establishment. The 03J01 procedure is
designed to provide a ―snapshot‖ of the HACCP
system. A 03J01 noncompliance necessitates
performing a 03J02 procedure. FSIS Directive 5000.1
301.2(1)_Adulterated,
301.2(1)_E.coli_O157:H7,
301.2(1)_L.monocytogenes,
301.2(1)_Salmonella,
301.2(2)_Adulterated,
301.2(3)_Adulterated,
301.2(4)_Adulterated,
301.2(4)_Foreign_Material,
301.2(6)_Adulterated,
301.2(9)_Adulterated, 309.3,
309.4, 309.9, 310.22(b),
310.22(d)(2), 310.25(a),
310.25(b), 311.16, 311.17,
318.14(a),
381.1(i)_Adulterated,
381.1(i)_E.coli_0157:H7,
381.1(i)_L.monocytogenes,
381.1(i)_Salmonella,
381.1(ii)_Adulterated,
381.1(iii)_Adulterated,
381.1(iv)_Adulterated,
381.1(iv)_Foreign_Material,
381.1(vi)_Adulterated,
381.144(a), 381.151(a),
381.65(e), 381.83, 381.91(a),
381.94(b)(3)(ii), 417.3(a)(1),
417.3(a)(2), 417.3(a)(3),
417.3(a)(4), 417.3(b)(1),
417.3(b)(2), 417.3(b)(3),
417.3(b)(4), 417.3(c), 417.4(a),
417.6
03J02 Verify all HACCP requirements at all critical
control points in the HACCP establishment for a
specific production. Verify that the pre-shipment
review requirements for that specific production
have been met. FSIS Directive 5000.1
301.2(1)_Adulterated,
301.2(1)_E.coli_O157:H7,
301.2(1)_L.monocytogenes,
301.2(1)_Salmonella,
301.2(2)_Adulterated,
301.2(3)_Adulterated,
301.2(4)_Adulterated,
301.2(4)_Foreign_Material,
301.2(6)_Adulterated,
301.2(9)_Adulterated, 309.3,
309.4, 309.9, 310.22(b),
310.22(d)(2), 310.25(b),

46
311.16, 311.17, 318.14(a),
381.1(i)_Adulterated,
381.1(i)_E.coli_0157:H7,
381.1(i)_L.monocytogenes,
381.1(i)_Salmonella,
381.1(ii)_Adulterated,
381.1(iii)_Adulterated,
381.1(iv)_Adulterated,
381.1(iv)_Foreign_Material,
381.1(vi)_Adulterated,
381.144(a), 381.151(a),
381.65(e), 381.83, 381.91(a),
381.94(b)(3)(ii), 417.3(a)(1),
417.3(a)(2), 417.3(a)(3),
417.3(a)(4), 417.3(b)(1),
417.3(b)(2), 417.3(b)(3),
417.3(b)(4), 417.3(c), 417.4(a),
417.6
04C04 Verify that poultry slaughter establishments
comply with the relevant regulations for poultry
finished product standards and good commercial
practices for poultry slaughter
381.1(i)_Adulterated,
381.1(i)_E.coli_0157:H7,
381.1(i)_L.monocytogenes,
381.1(i)_Salmonella,
381.1(ii)_Adulterated,
381.1(iii)_Adulterated,
381.1(iv)_Adulterated,
381.1(iv)_Foreign_Material,
381.1(vi)_Adulterated, 381.78,
381.91(a)
05A01 Review establishment E. Coli records to
determine maintained accuracy in accord with
regulation—verifies compliance with the basic
regulatory requirements for E. coli testing in
slaughter establishments.
310.25(a), 310.25(b),
381.91(a)
06D01 Verify compliance with Sanitation Performance
Standards requirements -- addresses the manner
in which establishments must be operated and
maintained to prevent the creation of insanitary
conditions, thereby ensuring that insanitary
conditions are not created, and that product is
not adulterated.
310.22(b), 310.22(d)(2), 416.1,
416.4(d)
C-2—W3NR Rate Year by Year Analysis
This appendix presents the W3NR rates for eleven (11) procedure codes and the fecal
contamination regulation 381.65(e) W3NR rate for young chicken slaughter establishments for
each of the years CY2006 to CY2010. There is no statistical difference between HIMP
establishments and Non-HIMP establishments for the majority of the process codes. W3NR rates
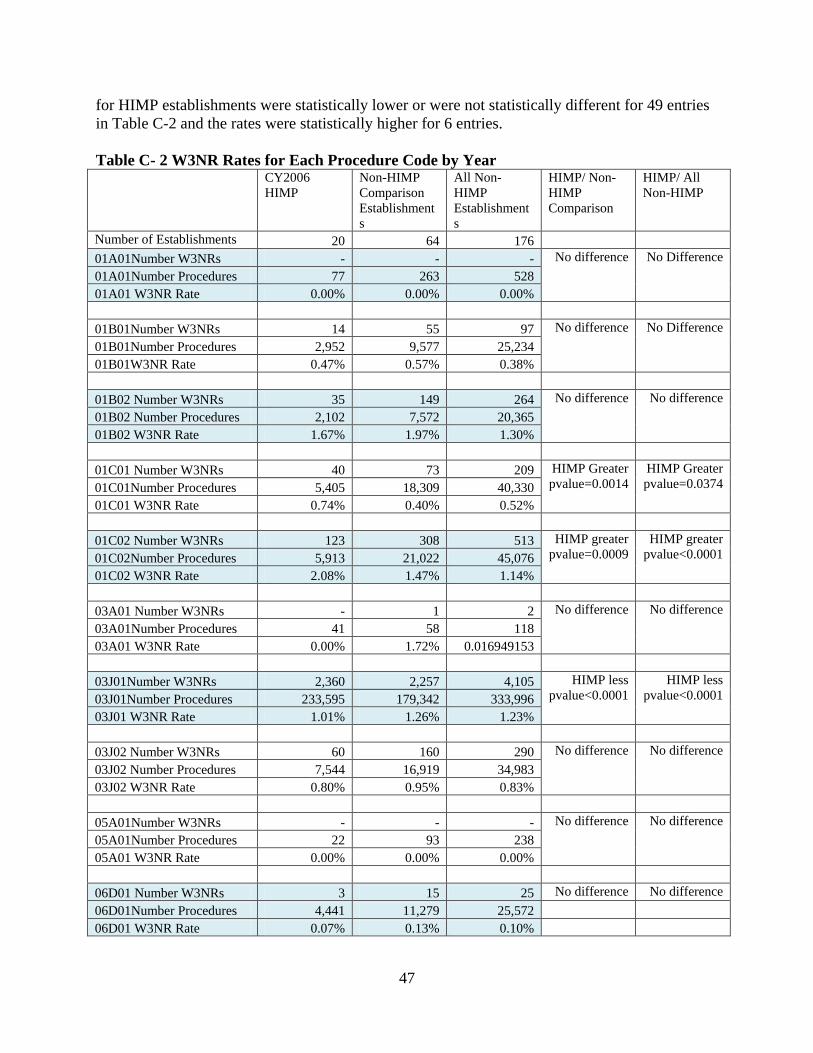
47
for HIMP establishments were statistically lower or were not statistically different for 49 entries
in Table C-2 and the rates were statistically higher for 6 entries.
Table C- 2 W3NR Rates for Each Procedure Code by Year CY2006
HIMP
Non-HIMP
Comparison
Establishment
s
All Non-
HIMP
Establishment
s
HIMP/ Non-
HIMP
Comparison
HIMP/ All
Non-HIMP
Number of Establishments 20 64 176
01A01Number W3NRs - - - No difference No Difference
01A01Number Procedures 77 263 528
01A01 W3NR Rate 0.00% 0.00% 0.00%
01B01Number W3NRs 14 55 97 No difference No Difference
01B01Number Procedures 2,952 9,577 25,234
01B01W3NR Rate 0.47% 0.57% 0.38%
01B02 Number W3NRs 35 149 264 No difference No difference
01B02 Number Procedures 2,102 7,572 20,365
01B02 W3NR Rate 1.67% 1.97% 1.30%
01C01 Number W3NRs 40 73 209 HIMP Greater
pvalue=0.0014
HIMP Greater
pvalue=0.0374 01C01Number Procedures 5,405 18,309 40,330
01C01 W3NR Rate 0.74% 0.40% 0.52%
01C02 Number W3NRs 123 308 513 HIMP greater
pvalue=0.0009
HIMP greater
pvalue<0.0001 01C02Number Procedures 5,913 21,022 45,076
01C02 W3NR Rate 2.08% 1.47% 1.14%
03A01 Number W3NRs - 1 2 No difference No difference
03A01Number Procedures 41 58 118
03A01 W3NR Rate 0.00% 1.72% 0.016949153
03J01Number W3NRs 2,360 2,257 4,105 HIMP less
pvalue<0.0001
HIMP less
pvalue<0.0001 03J01Number Procedures 233,595 179,342 333,996
03J01 W3NR Rate 1.01% 1.26% 1.23%
03J02 Number W3NRs 60 160 290 No difference No difference
03J02 Number Procedures 7,544 16,919 34,983
03J02 W3NR Rate 0.80% 0.95% 0.83%
05A01Number W3NRs - - - No difference No difference
05A01Number Procedures 22 93 238
05A01 W3NR Rate 0.00% 0.00% 0.00%
06D01 Number W3NRs 3 15 25 No difference No difference
06D01Number Procedures 4,441 11,279 25,572
06D01 W3NR Rate 0.07% 0.13% 0.10%
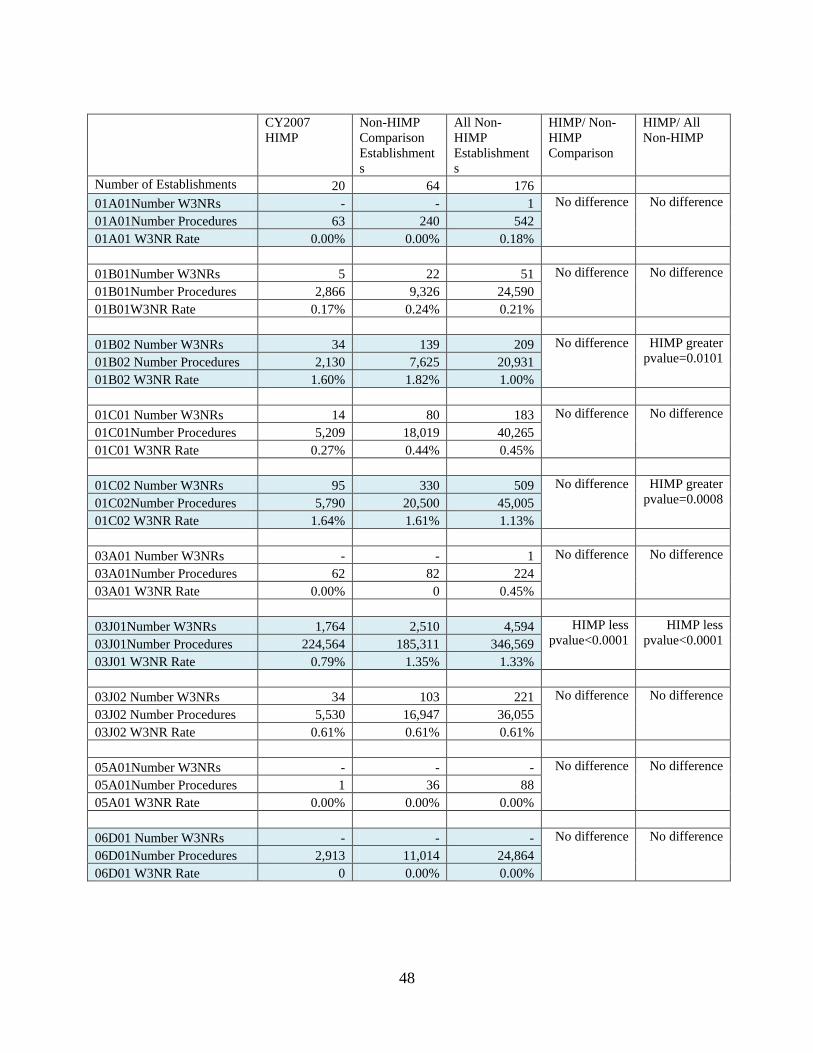
48
CY2007
HIMP
Non-HIMP
Comparison
Establishment
s
All Non-
HIMP
Establishment
s
HIMP/ Non-
HIMP
Comparison
HIMP/ All
Non-HIMP
Number of Establishments 20 64 176
01A01Number W3NRs - - 1 No difference No difference
01A01Number Procedures 63 240 542
01A01 W3NR Rate 0.00% 0.00% 0.18%
01B01Number W3NRs 5 22 51 No difference No difference
01B01Number Procedures 2,866 9,326 24,590
01B01W3NR Rate 0.17% 0.24% 0.21%
01B02 Number W3NRs 34 139 209 No difference HIMP greater
pvalue=0.0101 01B02 Number Procedures 2,130 7,625 20,931
01B02 W3NR Rate 1.60% 1.82% 1.00%
01C01 Number W3NRs 14 80 183 No difference No difference
01C01Number Procedures 5,209 18,019 40,265
01C01 W3NR Rate 0.27% 0.44% 0.45%
01C02 Number W3NRs 95 330 509 No difference HIMP greater
pvalue=0.0008 01C02Number Procedures 5,790 20,500 45,005
01C02 W3NR Rate 1.64% 1.61% 1.13%
03A01 Number W3NRs - - 1 No difference No difference
03A01Number Procedures 62 82 224
03A01 W3NR Rate 0.00% 0 0.45%
03J01Number W3NRs 1,764 2,510 4,594 HIMP less
pvalue<0.0001
HIMP less
pvalue<0.0001 03J01Number Procedures 224,564 185,311 346,569
03J01 W3NR Rate 0.79% 1.35% 1.33%
03J02 Number W3NRs 34 103 221 No difference No difference
03J02 Number Procedures 5,530 16,947 36,055
03J02 W3NR Rate 0.61% 0.61% 0.61%
05A01Number W3NRs - - - No difference No difference
05A01Number Procedures 1 36 88
05A01 W3NR Rate 0.00% 0.00% 0.00%
06D01 Number W3NRs - - - No difference No difference
06D01Number Procedures 2,913 11,014 24,864
06D01 W3NR Rate 0 0.00% 0.00%
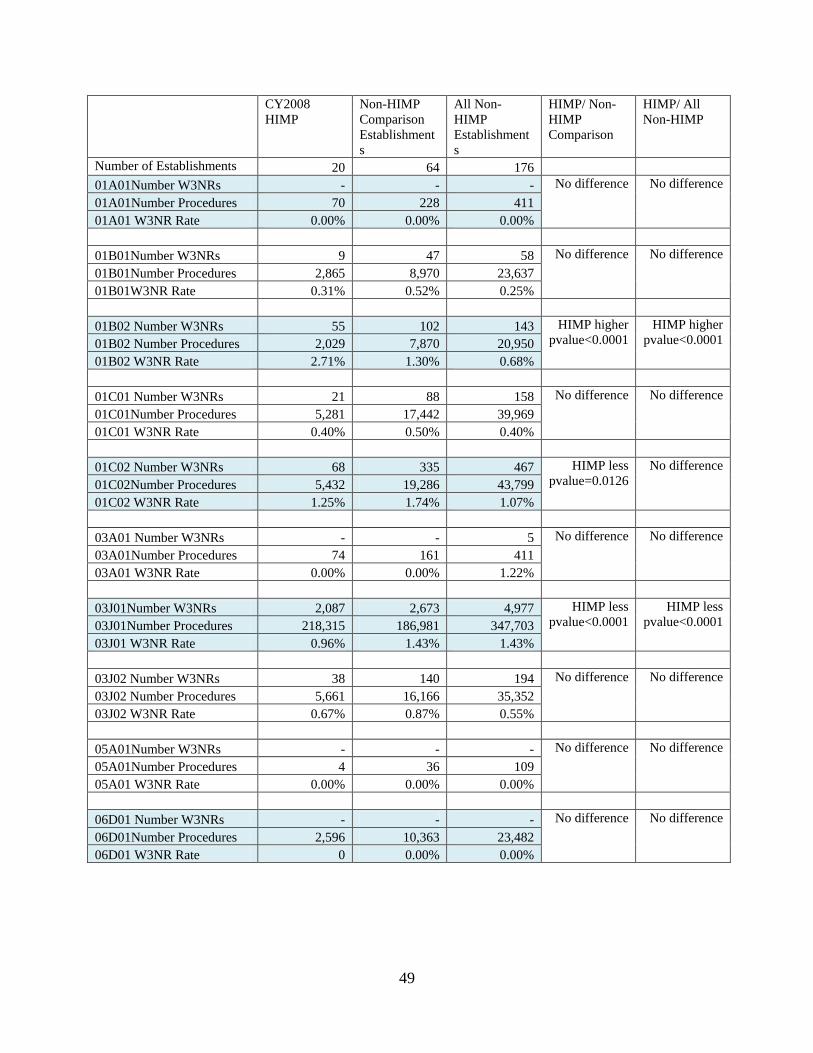
49
CY2008
HIMP
Non-HIMP
Comparison
Establishment
s
All Non-
HIMP
Establishment
s
HIMP/ Non-
HIMP
Comparison
HIMP/ All
Non-HIMP
Number of Establishments 20 64 176
01A01Number W3NRs - - - No difference No difference
01A01Number Procedures 70 228 411
01A01 W3NR Rate 0.00% 0.00% 0.00%
01B01Number W3NRs 9 47 58 No difference No difference
01B01Number Procedures 2,865 8,970 23,637
01B01W3NR Rate 0.31% 0.52% 0.25%
01B02 Number W3NRs 55 102 143 HIMP higher
pvalue<0.0001
HIMP higher
pvalue<0.0001 01B02 Number Procedures 2,029 7,870 20,950
01B02 W3NR Rate 2.71% 1.30% 0.68%
01C01 Number W3NRs 21 88 158 No difference No difference
01C01Number Procedures 5,281 17,442 39,969
01C01 W3NR Rate 0.40% 0.50% 0.40%
01C02 Number W3NRs 68 335 467 HIMP less
pvalue=0.0126
No difference
01C02Number Procedures 5,432 19,286 43,799
01C02 W3NR Rate 1.25% 1.74% 1.07%
03A01 Number W3NRs - - 5 No difference No difference
03A01Number Procedures 74 161 411
03A01 W3NR Rate 0.00% 0.00% 1.22%
03J01Number W3NRs 2,087 2,673 4,977 HIMP less
pvalue<0.0001
HIMP less
pvalue<0.0001 03J01Number Procedures 218,315 186,981 347,703
03J01 W3NR Rate 0.96% 1.43% 1.43%
03J02 Number W3NRs 38 140 194 No difference No difference
03J02 Number Procedures 5,661 16,166 35,352
03J02 W3NR Rate 0.67% 0.87% 0.55%
05A01Number W3NRs - - - No difference No difference
05A01Number Procedures 4 36 109
05A01 W3NR Rate 0.00% 0.00% 0.00%
06D01 Number W3NRs - - - No difference No difference
06D01Number Procedures 2,596 10,363 23,482
06D01 W3NR Rate 0 0.00% 0.00%
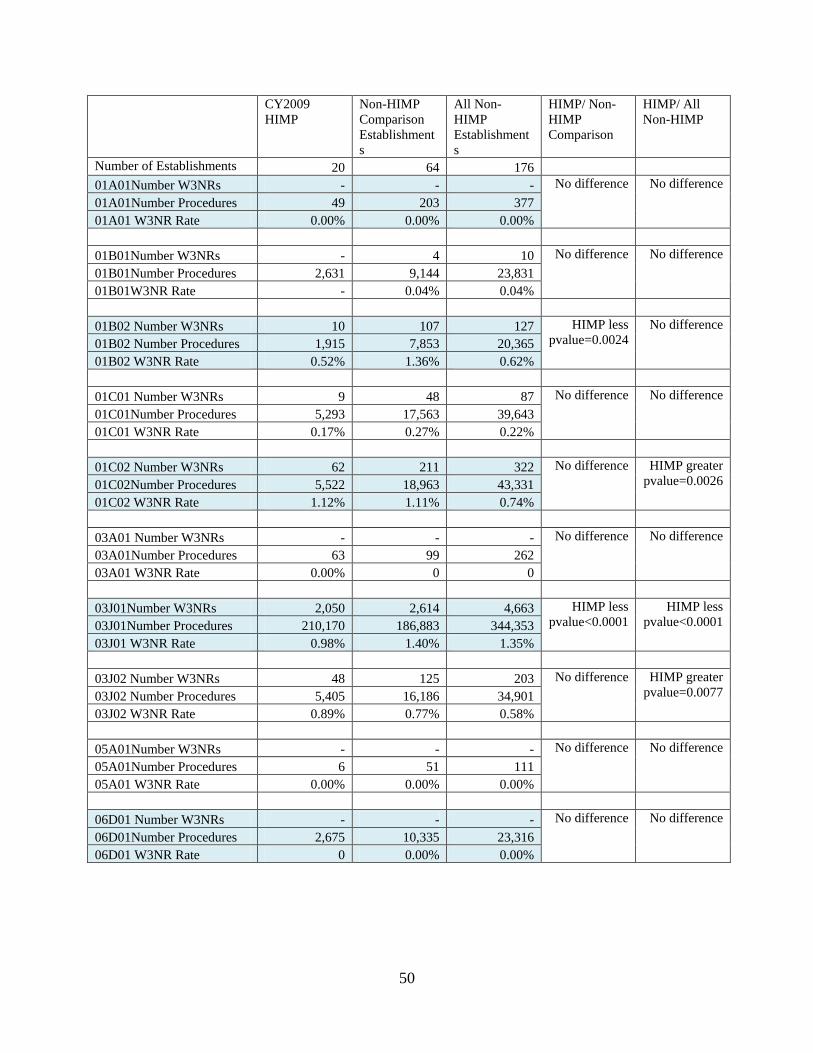
50
CY2009
HIMP
Non-HIMP
Comparison
Establishment
s
All Non-
HIMP
Establishment
s
HIMP/ Non-
HIMP
Comparison
HIMP/ All
Non-HIMP
Number of Establishments 20 64 176
01A01Number W3NRs - - - No difference No difference
01A01Number Procedures 49 203 377
01A01 W3NR Rate 0.00% 0.00% 0.00%
01B01Number W3NRs - 4 10 No difference No difference
01B01Number Procedures 2,631 9,144 23,831
01B01W3NR Rate - 0.04% 0.04%
01B02 Number W3NRs 10 107 127 HIMP less
pvalue=0.0024
No difference
01B02 Number Procedures 1,915 7,853 20,365
01B02 W3NR Rate 0.52% 1.36% 0.62%
01C01 Number W3NRs 9 48 87 No difference No difference
01C01Number Procedures 5,293 17,563 39,643
01C01 W3NR Rate 0.17% 0.27% 0.22%
01C02 Number W3NRs 62 211 322 No difference HIMP greater
pvalue=0.0026 01C02Number Procedures 5,522 18,963 43,331
01C02 W3NR Rate 1.12% 1.11% 0.74%
03A01 Number W3NRs - - - No difference No difference
03A01Number Procedures 63 99 262
03A01 W3NR Rate 0.00% 0 0
03J01Number W3NRs 2,050 2,614 4,663 HIMP less
pvalue<0.0001
HIMP less
pvalue<0.0001 03J01Number Procedures 210,170 186,883 344,353
03J01 W3NR Rate 0.98% 1.40% 1.35%
03J02 Number W3NRs 48 125 203 No difference HIMP greater
pvalue=0.0077 03J02 Number Procedures 5,405 16,186 34,901
03J02 W3NR Rate 0.89% 0.77% 0.58%
05A01Number W3NRs - - - No difference No difference
05A01Number Procedures 6 51 111
05A01 W3NR Rate 0.00% 0.00% 0.00%
06D01 Number W3NRs - - - No difference No difference
06D01Number Procedures 2,675 10,335 23,316
06D01 W3NR Rate 0 0.00% 0.00%
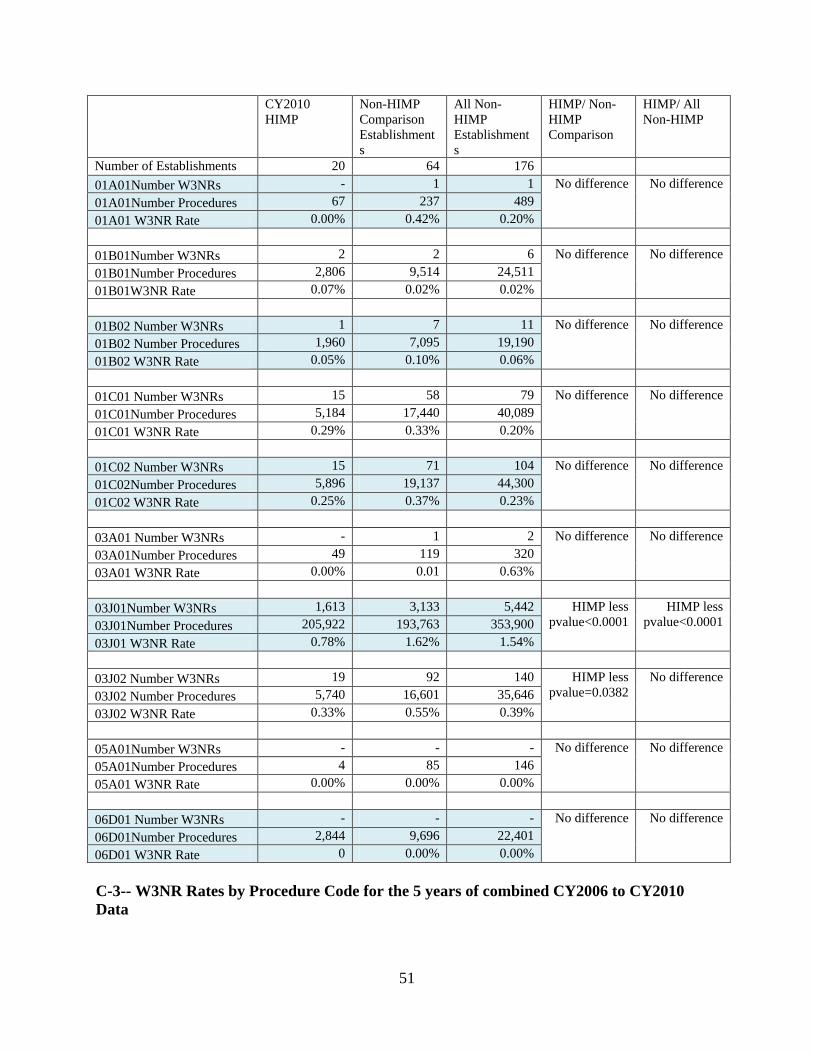
51
CY2010
HIMP
Non-HIMP
Comparison
Establishment
s
All Non-
HIMP
Establishment
s
HIMP/ Non-
HIMP
Comparison
HIMP/ All
Non-HIMP
Number of Establishments 20 64 176
01A01Number W3NRs - 1 1 No difference No difference
01A01Number Procedures 67 237 489
01A01 W3NR Rate 0.00% 0.42% 0.20%
01B01Number W3NRs 2 2 6 No difference No difference
01B01Number Procedures 2,806 9,514 24,511
01B01W3NR Rate 0.07% 0.02% 0.02%
01B02 Number W3NRs 1 7 11 No difference No difference
01B02 Number Procedures 1,960 7,095 19,190
01B02 W3NR Rate 0.05% 0.10% 0.06%
01C01 Number W3NRs 15 58 79 No difference No difference
01C01Number Procedures 5,184 17,440 40,089
01C01 W3NR Rate 0.29% 0.33% 0.20%
01C02 Number W3NRs 15 71 104 No difference No difference
01C02Number Procedures 5,896 19,137 44,300
01C02 W3NR Rate 0.25% 0.37% 0.23%
03A01 Number W3NRs - 1 2 No difference No difference
03A01Number Procedures 49 119 320
03A01 W3NR Rate 0.00% 0.01 0.63%
03J01Number W3NRs 1,613 3,133 5,442 HIMP less
pvalue<0.0001
HIMP less
pvalue<0.0001 03J01Number Procedures 205,922 193,763 353,900
03J01 W3NR Rate 0.78% 1.62% 1.54%
03J02 Number W3NRs 19 92 140 HIMP less
pvalue=0.0382
No difference
03J02 Number Procedures 5,740 16,601 35,646
03J02 W3NR Rate 0.33% 0.55% 0.39%
05A01Number W3NRs - - - No difference No difference
05A01Number Procedures 4 85 146
05A01 W3NR Rate 0.00% 0.00% 0.00%
06D01 Number W3NRs - - - No difference No difference
06D01Number Procedures 2,844 9,696 22,401
06D01 W3NR Rate 0 0.00% 0.00%
C-3-- W3NR Rates by Procedure Code for the 5 years of combined CY2006 to CY2010
Data
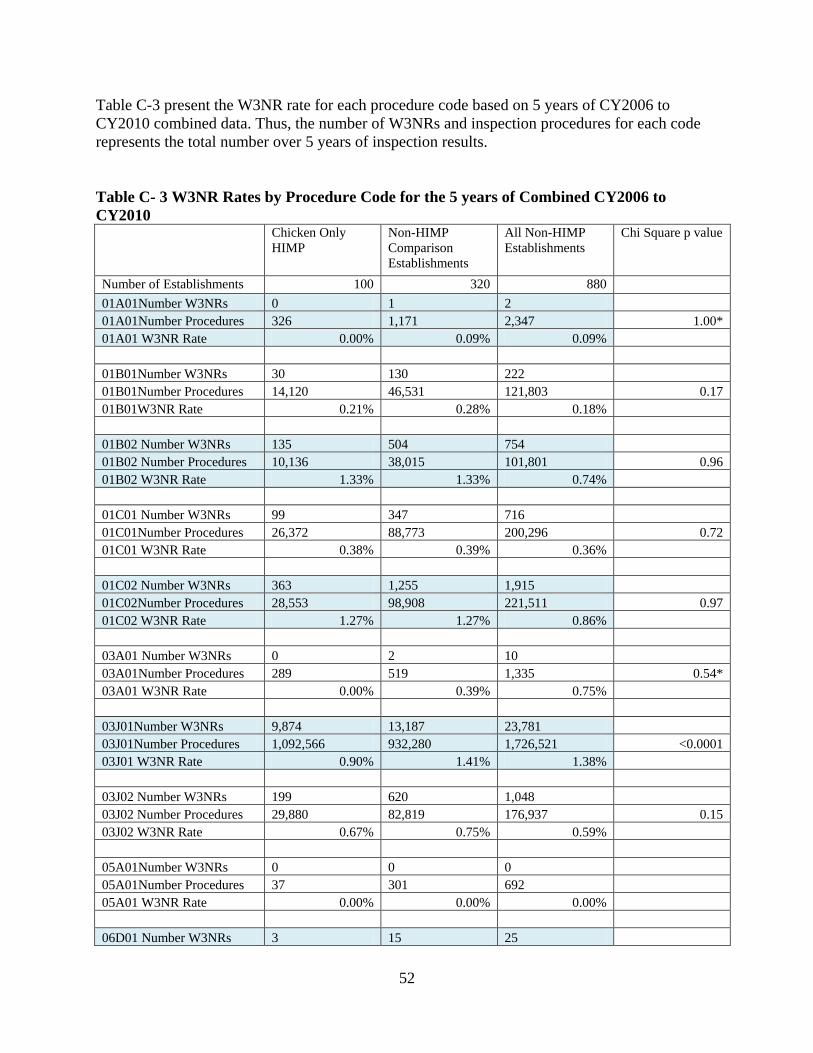
52
Table C-3 present the W3NR rate for each procedure code based on 5 years of CY2006 to
CY2010 combined data. Thus, the number of W3NRs and inspection procedures for each code
represents the total number over 5 years of inspection results.
Table C- 3 W3NR Rates by Procedure Code for the 5 years of Combined CY2006 to
CY2010 Chicken Only
HIMP
Non-HIMP
Comparison
Establishments
All Non-HIMP
Establishments
Chi Square p value
Number of Establishments 100 320 880
01A01Number W3NRs 0 1 2
01A01Number Procedures 326 1,171 2,347 1.00*
01A01 W3NR Rate 0.00% 0.09% 0.09%
01B01Number W3NRs 30 130 222
01B01Number Procedures 14,120 46,531 121,803 0.17
01B01W3NR Rate 0.21% 0.28% 0.18%
01B02 Number W3NRs 135 504 754
01B02 Number Procedures 10,136 38,015 101,801 0.96
01B02 W3NR Rate 1.33% 1.33% 0.74%
01C01 Number W3NRs 99 347 716
01C01Number Procedures 26,372 88,773 200,296 0.72
01C01 W3NR Rate 0.38% 0.39% 0.36%
01C02 Number W3NRs 363 1,255 1,915
01C02Number Procedures 28,553 98,908 221,511 0.97
01C02 W3NR Rate 1.27% 1.27% 0.86%
03A01 Number W3NRs 0 2 10
03A01Number Procedures 289 519 1,335 0.54*
03A01 W3NR Rate 0.00% 0.39% 0.75%
03J01Number W3NRs 9,874 13,187 23,781
03J01Number Procedures 1,092,566 932,280 1,726,521 <0.0001
03J01 W3NR Rate 0.90% 1.41% 1.38%
03J02 Number W3NRs 199 620 1,048
03J02 Number Procedures 29,880 82,819 176,937 0.15
03J02 W3NR Rate 0.67% 0.75% 0.59%
05A01Number W3NRs 0 0 0
05A01Number Procedures 37 301 692
05A01 W3NR Rate 0.00% 0.00% 0.00%
06D01 Number W3NRs 3 15 25
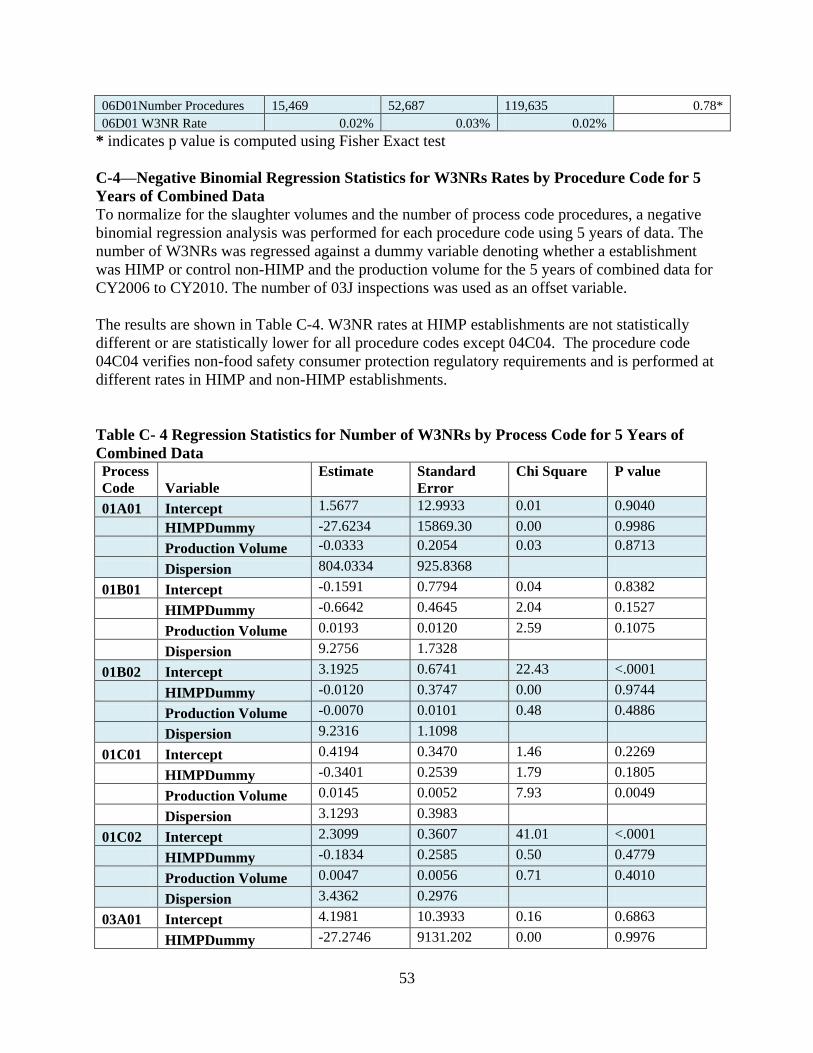
53
06D01Number Procedures 15,469 52,687 119,635 0.78*
06D01 W3NR Rate 0.02% 0.03% 0.02%
* indicates p value is computed using Fisher Exact test
C-4—Negative Binomial Regression Statistics for W3NRs Rates by Procedure Code for 5
Years of Combined Data
To normalize for the slaughter volumes and the number of process code procedures, a negative
binomial regression analysis was performed for each procedure code using 5 years of data. The
number of W3NRs was regressed against a dummy variable denoting whether a establishment
was HIMP or control non-HIMP and the production volume for the 5 years of combined data for
CY2006 to CY2010. The number of 03J inspections was used as an offset variable.
The results are shown in Table C-4. W3NR rates at HIMP establishments are not statistically
different or are statistically lower for all procedure codes except 04C04. The procedure code
04C04 verifies non-food safety consumer protection regulatory requirements and is performed at
different rates in HIMP and non-HIMP establishments.
Table C- 4 Regression Statistics for Number of W3NRs by Process Code for 5 Years of
Combined Data Process
Code Variable
Estimate Standard
Error
Chi Square P value
01A01 Intercept 1.5677 12.9933 0.01 0.9040
HIMPDummy -27.6234 15869.30 0.00 0.9986
Production Volume -0.0333 0.2054 0.03 0.8713
Dispersion 804.0334 925.8368
01B01 Intercept -0.1591 0.7794 0.04 0.8382
HIMPDummy -0.6642 0.4645 2.04 0.1527
Production Volume 0.0193 0.0120 2.59 0.1075
Dispersion 9.2756 1.7328
01B02 Intercept 3.1925 0.6741 22.43 <.0001
HIMPDummy -0.0120 0.3747 0.00 0.9744
Production Volume -0.0070 0.0101 0.48 0.4886
Dispersion 9.2316 1.1098
01C01 Intercept 0.4194 0.3470 1.46 0.2269
HIMPDummy -0.3401 0.2539 1.79 0.1805
Production Volume 0.0145 0.0052 7.93 0.0049
Dispersion 3.1293 0.3983
01C02 Intercept 2.3099 0.3607 41.01 <.0001
HIMPDummy -0.1834 0.2585 0.50 0.4779
Production Volume 0.0047 0.0056 0.71 0.4010
Dispersion 3.4362 0.2976
03A01 Intercept 4.1981 10.3933 0.16 0.6863
HIMPDummy -27.2746 9131.202 0.00 0.9976
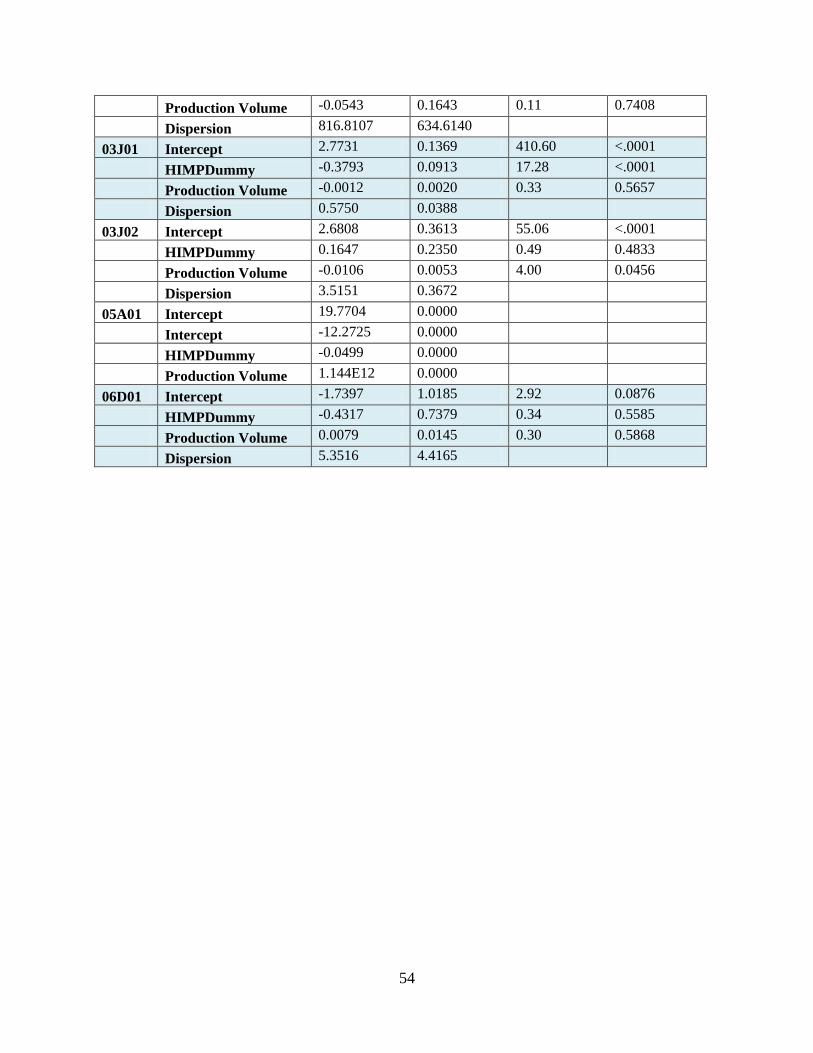
54
Production Volume -0.0543 0.1643 0.11 0.7408
Dispersion 816.8107 634.6140
03J01 Intercept 2.7731 0.1369 410.60 <.0001
HIMPDummy -0.3793 0.0913 17.28 <.0001
Production Volume -0.0012 0.0020 0.33 0.5657
Dispersion 0.5750 0.0388
03J02 Intercept 2.6808 0.3613 55.06 <.0001
HIMPDummy 0.1647 0.2350 0.49 0.4833
Production Volume -0.0106 0.0053 4.00 0.0456
Dispersion 3.5151 0.3672
05A01 Intercept 19.7704 0.0000
Intercept -12.2725 0.0000
HIMPDummy -0.0499 0.0000
Production Volume 1.144E12 0.0000
06D01 Intercept -1.7397 1.0185 2.92 0.0876
HIMPDummy -0.4317 0.7379 0.34 0.5585
Production Volume 0.0079 0.0145 0.30 0.5868
Dispersion 5.3516 4.4165
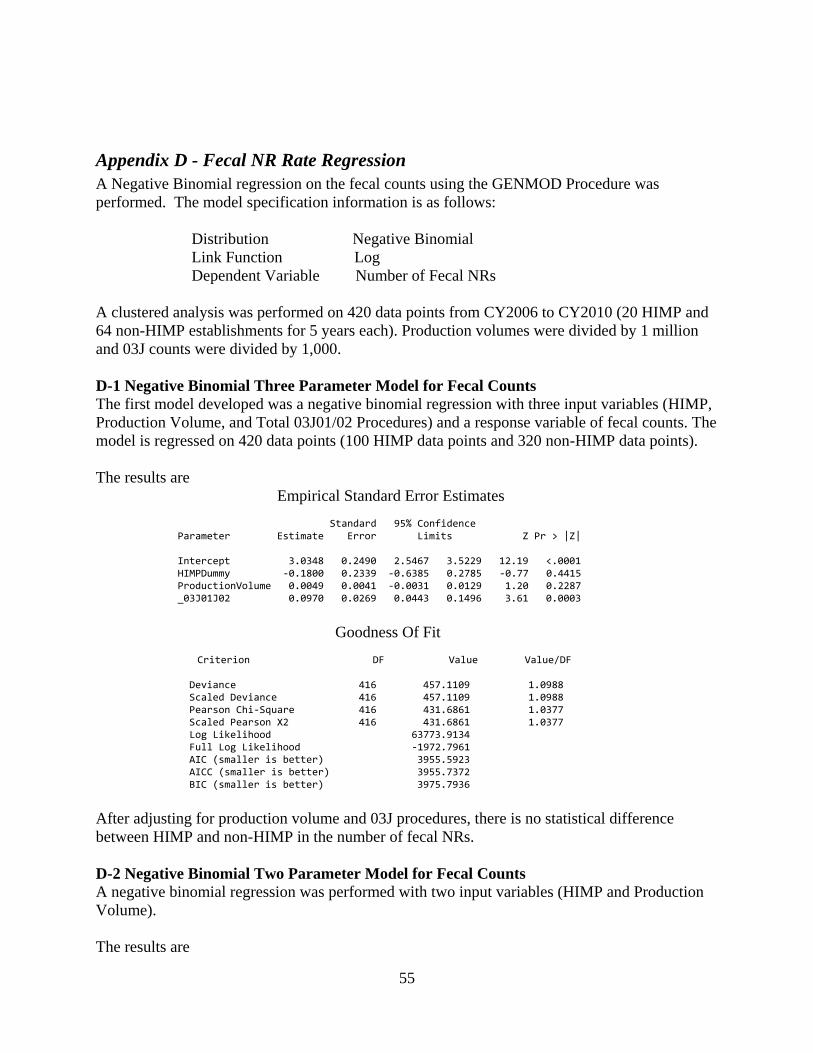
55
Appendix D - Fecal NR Rate Regression
A Negative Binomial regression on the fecal counts using the GENMOD Procedure was
performed. The model specification information is as follows:
Distribution Negative Binomial
Link Function Log
Dependent Variable Number of Fecal NRs
A clustered analysis was performed on 420 data points from CY2006 to CY2010 (20 HIMP and
64 non-HIMP establishments for 5 years each). Production volumes were divided by 1 million
and 03J counts were divided by 1,000.
D-1 Negative Binomial Three Parameter Model for Fecal Counts
The first model developed was a negative binomial regression with three input variables (HIMP,
Production Volume, and Total 03J01/02 Procedures) and a response variable of fecal counts. The
model is regressed on 420 data points (100 HIMP data points and 320 non-HIMP data points).
The results are
Empirical Standard Error Estimates Standard 95% Confidence Parameter Estimate Error Limits Z Pr > |Z| Intercept 3.0348 0.2490 2.5467 3.5229 12.19 <.0001 HIMPDummy -0.1800 0.2339 -0.6385 0.2785 -0.77 0.4415 ProductionVolume 0.0049 0.0041 -0.0031 0.0129 1.20 0.2287 _03J01J02 0.0970 0.0269 0.0443 0.1496 3.61 0.0003
Goodness Of Fit
Criterion DF Value Value/DF Deviance 416 457.1109 1.0988 Scaled Deviance 416 457.1109 1.0988 Pearson Chi-Square 416 431.6861 1.0377 Scaled Pearson X2 416 431.6861 1.0377 Log Likelihood 63773.9134 Full Log Likelihood -1972.7961 AIC (smaller is better) 3955.5923 AICC (smaller is better) 3955.7372 BIC (smaller is better) 3975.7936
After adjusting for production volume and 03J procedures, there is no statistical difference
between HIMP and non-HIMP in the number of fecal NRs.
D-2 Negative Binomial Two Parameter Model for Fecal Counts
A negative binomial regression was performed with two input variables (HIMP and Production
Volume).
The results are
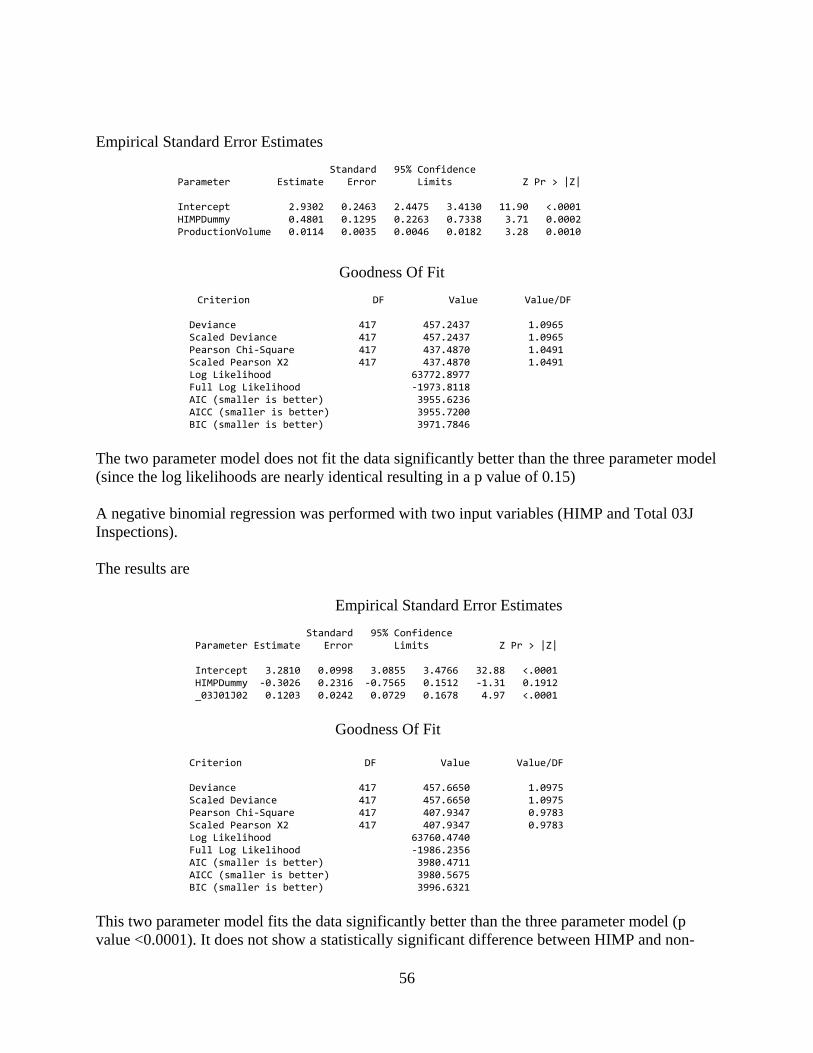
56
Empirical Standard Error Estimates Standard 95% Confidence Parameter Estimate Error Limits Z Pr > |Z| Intercept 2.9302 0.2463 2.4475 3.4130 11.90 <.0001 HIMPDummy 0.4801 0.1295 0.2263 0.7338 3.71 0.0002 ProductionVolume 0.0114 0.0035 0.0046 0.0182 3.28 0.0010
Goodness Of Fit
Criterion DF Value Value/DF Deviance 417 457.2437 1.0965 Scaled Deviance 417 457.2437 1.0965 Pearson Chi-Square 417 437.4870 1.0491 Scaled Pearson X2 417 437.4870 1.0491 Log Likelihood 63772.8977 Full Log Likelihood -1973.8118 AIC (smaller is better) 3955.6236 AICC (smaller is better) 3955.7200 BIC (smaller is better) 3971.7846
The two parameter model does not fit the data significantly better than the three parameter model
(since the log likelihoods are nearly identical resulting in a p value of 0.15)
A negative binomial regression was performed with two input variables (HIMP and Total 03J
Inspections).
The results are
Empirical Standard Error Estimates Standard 95% Confidence Parameter Estimate Error Limits Z Pr > |Z| Intercept 3.2810 0.0998 3.0855 3.4766 32.88 <.0001 HIMPDummy -0.3026 0.2316 -0.7565 0.1512 -1.31 0.1912 _03J01J02 0.1203 0.0242 0.0729 0.1678 4.97 <.0001
Goodness Of Fit
Criterion DF Value Value/DF Deviance 417 457.6650 1.0975 Scaled Deviance 417 457.6650 1.0975 Pearson Chi-Square 417 407.9347 0.9783 Scaled Pearson X2 417 407.9347 0.9783 Log Likelihood 63760.4740 Full Log Likelihood -1986.2356 AIC (smaller is better) 3980.4711 AICC (smaller is better) 3980.5675 BIC (smaller is better) 3996.6321
This two parameter model fits the data significantly better than the three parameter model (p
value <0.0001). It does not show a statistically significant difference between HIMP and non-

57
HIMP with respect to the number of fecal NRs after adjusting for number of 03J inspections.
D-3 Negative Binomial Two Parameter Model for Fecal Counts with Offset for Number of
03J Procedures
To determine the impact of production volume on the fecal NR rate, a negative binomial
regression on fecal counts using the GENMOD Procedure with an offset for the number of 03J
procedures was performed. The use of the offset for the number of 03J01 procedures is
equivalent to regressing fecal NR rate on production volume. The model specification
information is as follows:
Distribution Negative Binomial
Link Function Log
Dependent Variable Number of Fecal NRs
Offset Variable Log_03J01J02
Empirical Standard Error Estimates Standard 95% Confidence Parameter Estimate Error Limits Z Pr > |Z| Intercept 2.6390 0.2714 2.1071 3.1709 9.72 <.0001 HIMPDummy -0.5989 0.1341 -0.8617 -0.3360 -4.47 <.0001 ProductionVolume -0.0011 0.0038 -0.0086 0.0063 -0.30 0.7620
Goodness Of Fit Criterion DF Value Value/DF
Deviance 417 456.6893 1.0952 Scaled Deviance 417 456.6893 1.0952 Pearson Chi-Square 417 417.5443 1.0013 Scaled Pearson X2 417 417.5443 1.0013 Log Likelihood 63770.2476 Full Log Likelihood -1976.4619 AIC (smaller is better) 3960.9239 AICC (smaller is better) 3961.0203 BIC (smaller is better) 3977.0849
Production volume is not a statistically significant predictor of fecal NR rates. After adjusting for
production volume, the rate of fecal NRs in HIMP establishments is statistically less than in non-
HIMP establishments.
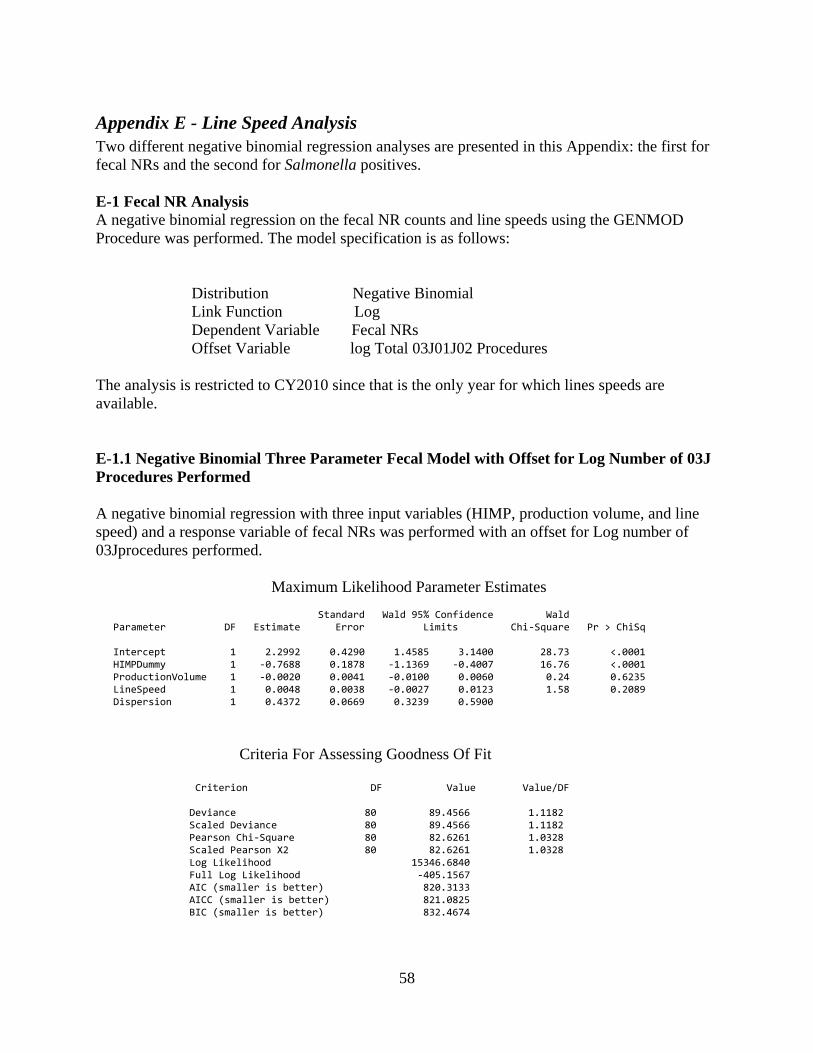
58
Appendix E - Line Speed Analysis
Two different negative binomial regression analyses are presented in this Appendix: the first for
fecal NRs and the second for Salmonella positives.
E-1 Fecal NR Analysis
A negative binomial regression on the fecal NR counts and line speeds using the GENMOD
Procedure was performed. The model specification is as follows:
Distribution Negative Binomial
Link Function Log
Dependent Variable Fecal NRs
Offset Variable log Total 03J01J02 Procedures
The analysis is restricted to CY2010 since that is the only year for which lines speeds are
available.
E-1.1 Negative Binomial Three Parameter Fecal Model with Offset for Log Number of 03J
Procedures Performed
A negative binomial regression with three input variables (HIMP, production volume, and line
speed) and a response variable of fecal NRs was performed with an offset for Log number of
03Jprocedures performed.
Maximum Likelihood Parameter Estimates Standard Wald 95% Confidence Wald Parameter DF Estimate Error Limits Chi-Square Pr > ChiSq Intercept 1 2.2992 0.4290 1.4585 3.1400 28.73 <.0001 HIMPDummy 1 -0.7688 0.1878 -1.1369 -0.4007 16.76 <.0001 ProductionVolume 1 -0.0020 0.0041 -0.0100 0.0060 0.24 0.6235 LineSpeed 1 0.0048 0.0038 -0.0027 0.0123 1.58 0.2089 Dispersion 1 0.4372 0.0669 0.3239 0.5900
Criteria For Assessing Goodness Of Fit
Criterion DF Value Value/DF Deviance 80 89.4566 1.1182 Scaled Deviance 80 89.4566 1.1182 Pearson Chi-Square 80 82.6261 1.0328 Scaled Pearson X2 80 82.6261 1.0328 Log Likelihood 15346.6840 Full Log Likelihood -405.1567 AIC (smaller is better) 820.3133 AICC (smaller is better) 821.0825 BIC (smaller is better) 832.4674
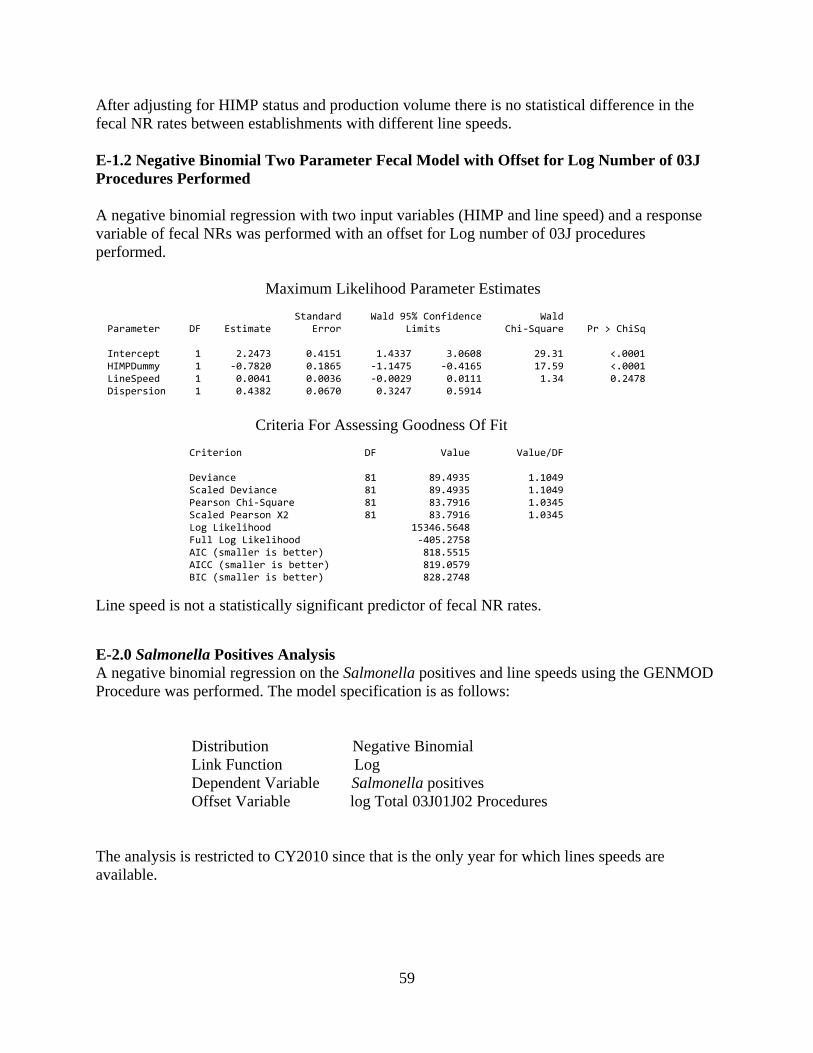
59
After adjusting for HIMP status and production volume there is no statistical difference in the
fecal NR rates between establishments with different line speeds.
E-1.2 Negative Binomial Two Parameter Fecal Model with Offset for Log Number of 03J
Procedures Performed
A negative binomial regression with two input variables (HIMP and line speed) and a response
variable of fecal NRs was performed with an offset for Log number of 03J procedures
performed.
Maximum Likelihood Parameter Estimates Standard Wald 95% Confidence Wald Parameter DF Estimate Error Limits Chi-Square Pr > ChiSq Intercept 1 2.2473 0.4151 1.4337 3.0608 29.31 <.0001 HIMPDummy 1 -0.7820 0.1865 -1.1475 -0.4165 17.59 <.0001 LineSpeed 1 0.0041 0.0036 -0.0029 0.0111 1.34 0.2478 Dispersion 1 0.4382 0.0670 0.3247 0.5914
Criteria For Assessing Goodness Of Fit Criterion DF Value Value/DF Deviance 81 89.4935 1.1049 Scaled Deviance 81 89.4935 1.1049 Pearson Chi-Square 81 83.7916 1.0345 Scaled Pearson X2 81 83.7916 1.0345 Log Likelihood 15346.5648 Full Log Likelihood -405.2758 AIC (smaller is better) 818.5515 AICC (smaller is better) 819.0579 BIC (smaller is better) 828.2748
Line speed is not a statistically significant predictor of fecal NR rates.
E-2.0 Salmonella Positives Analysis
A negative binomial regression on the Salmonella positives and line speeds using the GENMOD
Procedure was performed. The model specification is as follows:
Distribution Negative Binomial
Link Function Log
Dependent Variable Salmonella positives
Offset Variable log Total 03J01J02 Procedures
The analysis is restricted to CY2010 since that is the only year for which lines speeds are
available.
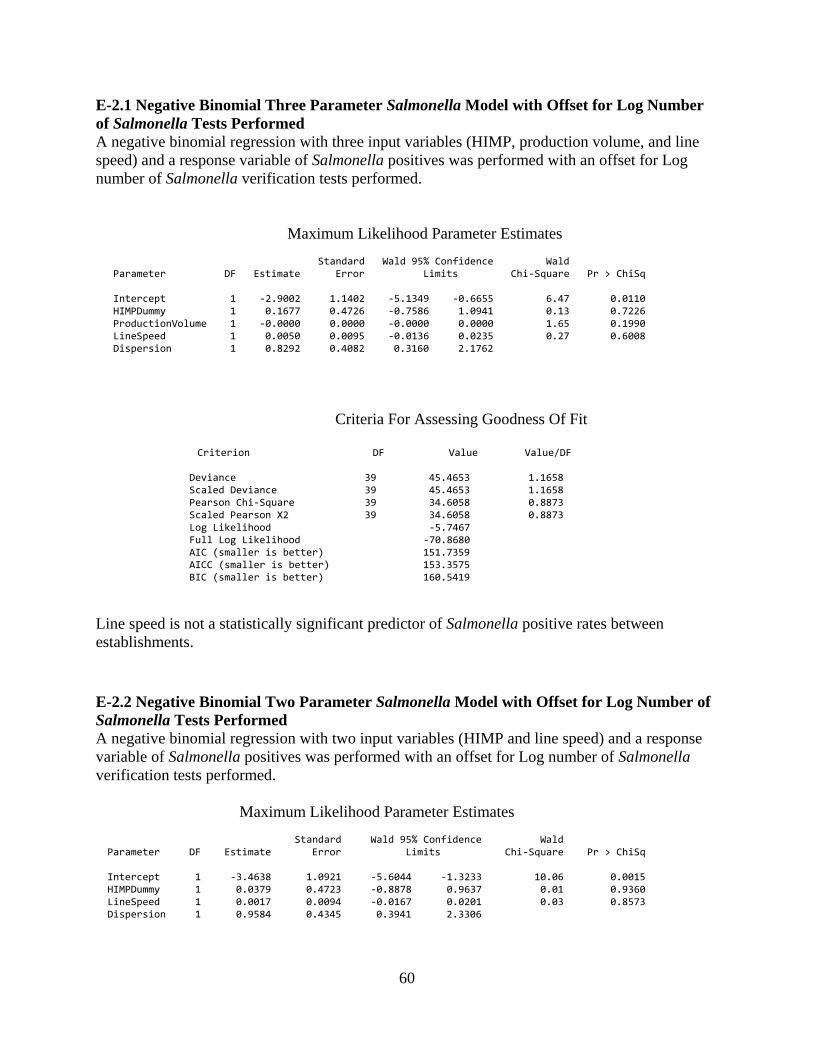
60
E-2.1 Negative Binomial Three Parameter Salmonella Model with Offset for Log Number
of Salmonella Tests Performed
A negative binomial regression with three input variables (HIMP, production volume, and line
speed) and a response variable of Salmonella positives was performed with an offset for Log
number of Salmonella verification tests performed.
Maximum Likelihood Parameter Estimates Standard Wald 95% Confidence Wald Parameter DF Estimate Error Limits Chi-Square Pr > ChiSq Intercept 1 -2.9002 1.1402 -5.1349 -0.6655 6.47 0.0110 HIMPDummy 1 0.1677 0.4726 -0.7586 1.0941 0.13 0.7226 ProductionVolume 1 -0.0000 0.0000 -0.0000 0.0000 1.65 0.1990 LineSpeed 1 0.0050 0.0095 -0.0136 0.0235 0.27 0.6008 Dispersion 1 0.8292 0.4082 0.3160 2.1762
Criteria For Assessing Goodness Of Fit
Criterion DF Value Value/DF
Deviance 39 45.4653 1.1658 Scaled Deviance 39 45.4653 1.1658 Pearson Chi-Square 39 34.6058 0.8873 Scaled Pearson X2 39 34.6058 0.8873 Log Likelihood -5.7467 Full Log Likelihood -70.8680 AIC (smaller is better) 151.7359 AICC (smaller is better) 153.3575 BIC (smaller is better) 160.5419
Line speed is not a statistically significant predictor of Salmonella positive rates between
establishments.
E-2.2 Negative Binomial Two Parameter Salmonella Model with Offset for Log Number of
Salmonella Tests Performed
A negative binomial regression with two input variables (HIMP and line speed) and a response
variable of Salmonella positives was performed with an offset for Log number of Salmonella
verification tests performed.
Maximum Likelihood Parameter Estimates Standard Wald 95% Confidence Wald Parameter DF Estimate Error Limits Chi-Square Pr > ChiSq Intercept 1 -3.4638 1.0921 -5.6044 -1.3233 10.06 0.0015 HIMPDummy 1 0.0379 0.4723 -0.8878 0.9637 0.01 0.9360 LineSpeed 1 0.0017 0.0094 -0.0167 0.0201 0.03 0.8573 Dispersion 1 0.9584 0.4345 0.3941 2.3306
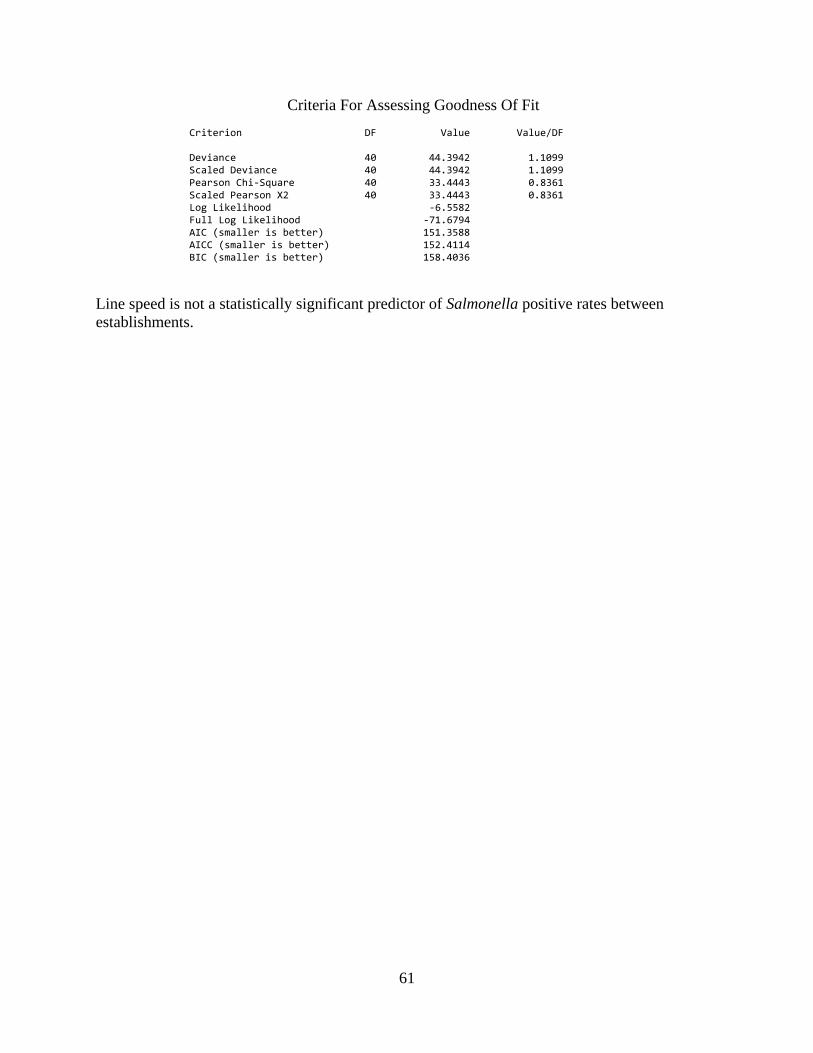
61
Criteria For Assessing Goodness Of Fit Criterion DF Value Value/DF Deviance 40 44.3942 1.1099 Scaled Deviance 40 44.3942 1.1099 Pearson Chi-Square 40 33.4443 0.8361 Scaled Pearson X2 40 33.4443 0.8361 Log Likelihood -6.5582 Full Log Likelihood -71.6794 AIC (smaller is better) 151.3588 AICC (smaller is better) 152.4114 BIC (smaller is better) 158.4036
Line speed is not a statistically significant predictor of Salmonella positive rates between
establishments.
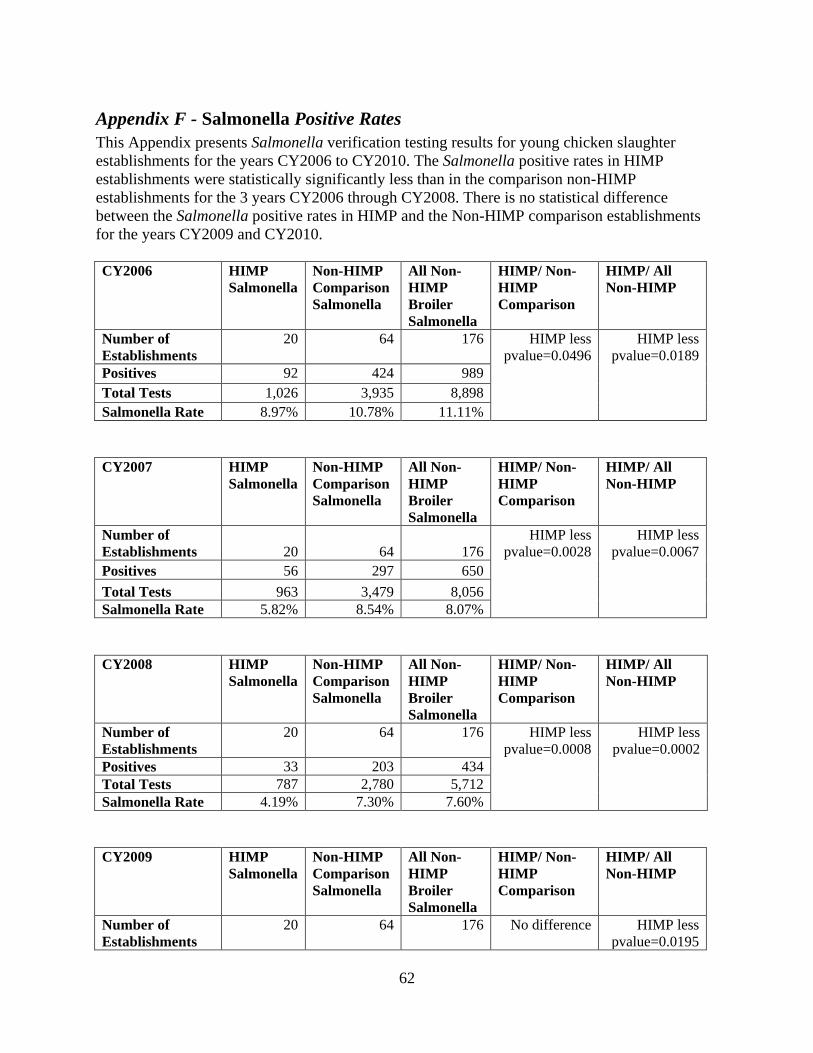
62
Appendix F - Salmonella Positive Rates
This Appendix presents Salmonella verification testing results for young chicken slaughter
establishments for the years CY2006 to CY2010. The Salmonella positive rates in HIMP
establishments were statistically significantly less than in the comparison non-HIMP
establishments for the 3 years CY2006 through CY2008. There is no statistical difference
between the Salmonella positive rates in HIMP and the Non-HIMP comparison establishments
for the years CY2009 and CY2010.
CY2006 HIMP
Salmonella
Non-HIMP
Comparison
Salmonella
All Non-
HIMP
Broiler
Salmonella
HIMP/ Non-
HIMP
Comparison
HIMP/ All
Non-HIMP
Number of
Establishments
20 64 176 HIMP less
pvalue=0.0496
HIMP less
pvalue=0.0189
Positives 92 424 989
Total Tests 1,026 3,935 8,898
Salmonella Rate 8.97% 10.78% 11.11%
CY2007 HIMP
Salmonella
Non-HIMP
Comparison
Salmonella
All Non-
HIMP
Broiler
Salmonella
HIMP/ Non-
HIMP
Comparison
HIMP/ All
Non-HIMP
Number of
Establishments 20 64 176
HIMP less
pvalue=0.0028
HIMP less
pvalue=0.0067
Positives 56 297 650
Total Tests 963 3,479 8,056
Salmonella Rate 5.82% 8.54% 8.07%
CY2008 HIMP
Salmonella
Non-HIMP
Comparison
Salmonella
All Non-
HIMP
Broiler
Salmonella
HIMP/ Non-
HIMP
Comparison
HIMP/ All
Non-HIMP
Number of
Establishments
20 64 176 HIMP less
pvalue=0.0008
HIMP less
pvalue=0.0002
Positives 33 203 434
Total Tests 787 2,780 5,712
Salmonella Rate 4.19% 7.30% 7.60%
CY2009 HIMP
Salmonella
Non-HIMP
Comparison
Salmonella
All Non-
HIMP
Broiler
Salmonella
HIMP/ Non-
HIMP
Comparison
HIMP/ All
Non-HIMP
Number of
Establishments
20 64 176 No difference HIMP less
pvalue=0.0195
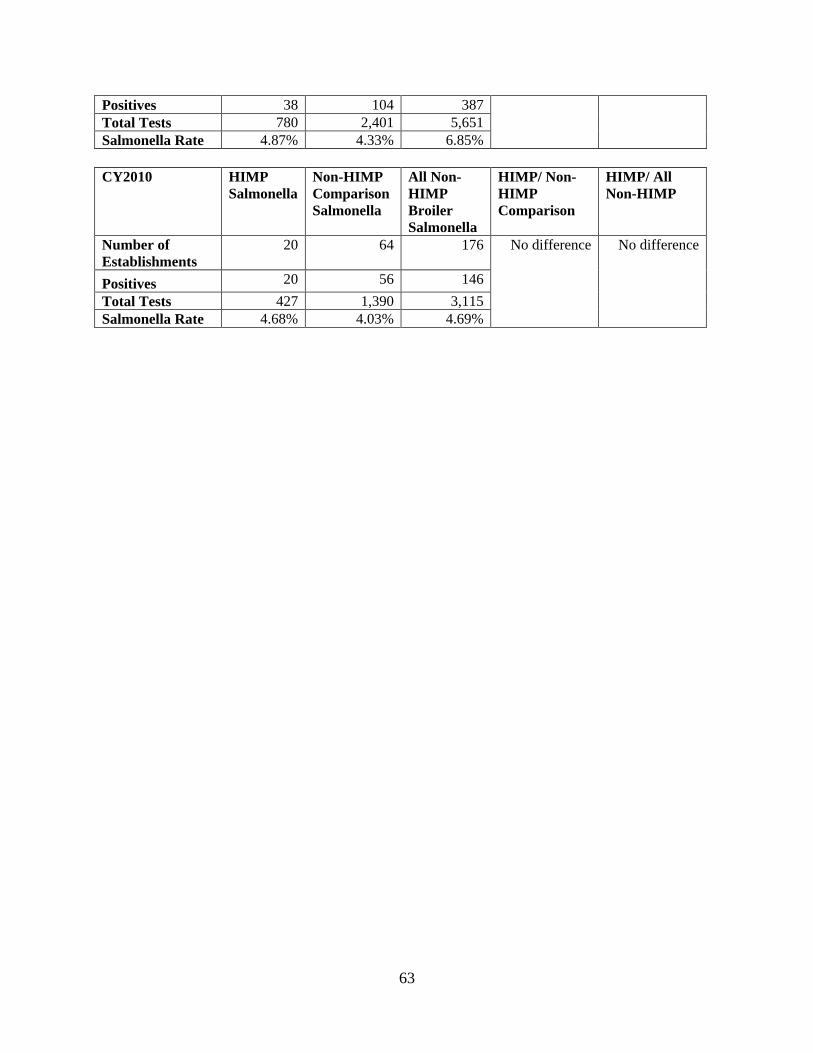
63
Positives 38 104 387
Total Tests 780 2,401 5,651
Salmonella Rate 4.87% 4.33% 6.85%
CY2010 HIMP
Salmonella
Non-HIMP
Comparison
Salmonella
All Non-
HIMP
Broiler
Salmonella
HIMP/ Non-
HIMP
Comparison
HIMP/ All
Non-HIMP
Number of
Establishments
20 64 176 No difference No difference
Positives 20 56 146
Total Tests 427 1,390 3,115
Salmonella Rate 4.68% 4.03% 4.69%
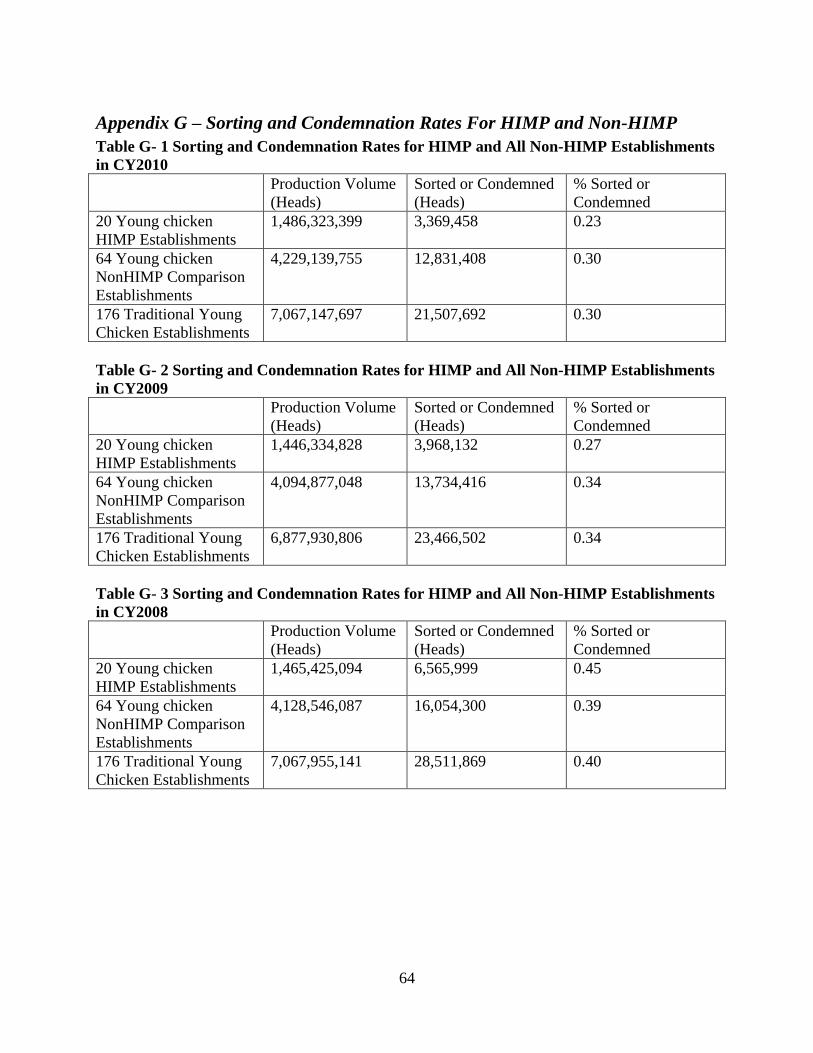
64
Appendix G – Sorting and Condemnation Rates For HIMP and Non-HIMP
Table G- 1 Sorting and Condemnation Rates for HIMP and All Non-HIMP Establishments
in CY2010
Production Volume
(Heads)
Sorted or Condemned
(Heads)
% Sorted or
Condemned
20 Young chicken
HIMP Establishments
1,486,323,399 3,369,458 0.23
64 Young chicken
NonHIMP Comparison
Establishments
4,229,139,755 12,831,408 0.30
176 Traditional Young
Chicken Establishments
7,067,147,697 21,507,692 0.30
Table G- 2 Sorting and Condemnation Rates for HIMP and All Non-HIMP Establishments
in CY2009
Production Volume
(Heads)
Sorted or Condemned
(Heads)
% Sorted or
Condemned
20 Young chicken
HIMP Establishments
1,446,334,828 3,968,132 0.27
64 Young chicken
NonHIMP Comparison
Establishments
4,094,877,048 13,734,416 0.34
176 Traditional Young
Chicken Establishments
6,877,930,806 23,466,502 0.34
Table G- 3 Sorting and Condemnation Rates for HIMP and All Non-HIMP Establishments
in CY2008
Production Volume
(Heads)
Sorted or Condemned
(Heads)
% Sorted or
Condemned
20 Young chicken
HIMP Establishments
1,465,425,094 6,565,999 0.45
64 Young chicken
NonHIMP Comparison
Establishments
4,128,546,087 16,054,300 0.39
176 Traditional Young
Chicken Establishments
7,067,955,141 28,511,869 0.40
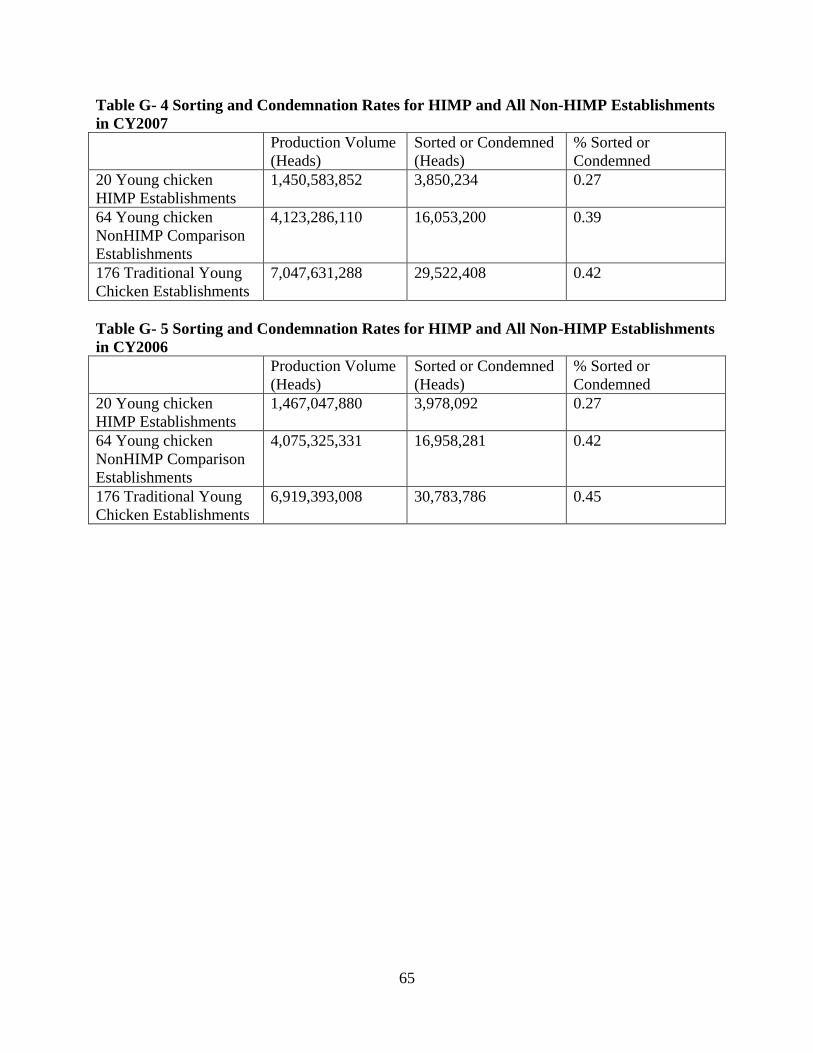
65
Table G- 4 Sorting and Condemnation Rates for HIMP and All Non-HIMP Establishments
in CY2007
Production Volume
(Heads)
Sorted or Condemned
(Heads)
% Sorted or
Condemned
20 Young chicken
HIMP Establishments
1,450,583,852 3,850,234 0.27
64 Young chicken
NonHIMP Comparison
Establishments
4,123,286,110 16,053,200 0.39
176 Traditional Young
Chicken Establishments
7,047,631,288 29,522,408 0.42
Table G- 5 Sorting and Condemnation Rates for HIMP and All Non-HIMP Establishments
in CY2006
Production Volume
(Heads)
Sorted or Condemned
(Heads)
% Sorted or
Condemned
20 Young chicken
HIMP Establishments
1,467,047,880 3,978,092 0.27
64 Young chicken
NonHIMP Comparison
Establishments
4,075,325,331 16,958,281 0.42
176 Traditional Young
Chicken Establishments
6,919,393,008 30,783,786 0.45
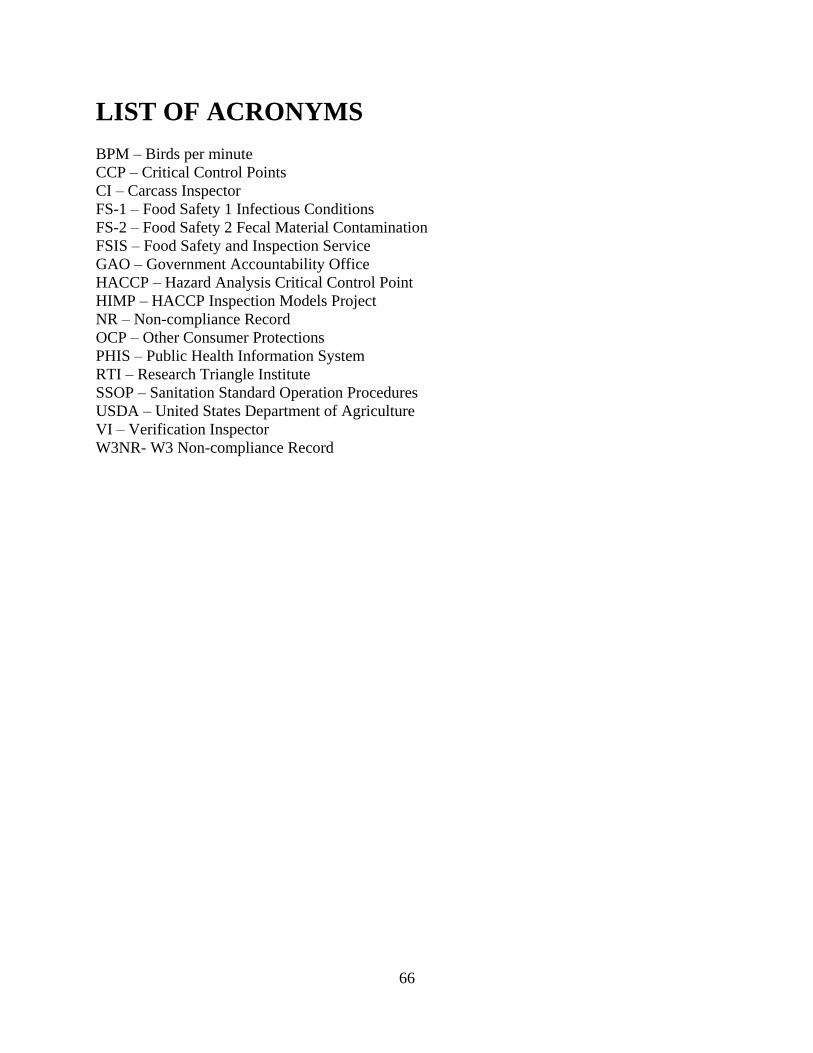
66
LIST OF ACRONYMS
BPM – Birds per minute
CCP – Critical Control Points
CI – Carcass Inspector
FS-1 – Food Safety 1 Infectious Conditions
FS-2 – Food Safety 2 Fecal Material Contamination
FSIS – Food Safety and Inspection Service
GAO – Government Accountability Office
HACCP – Hazard Analysis Critical Control Point
HIMP – HACCP Inspection Models Project
NR – Non-compliance Record
OCP – Other Consumer Protections
PHIS – Public Health Information System
RTI – Research Triangle Institute
SSOP – Sanitation Standard Operation Procedures
USDA – United States Department of Agriculture
VI – Verification Inspector
W3NR- W3 Non-compliance Record

![1 HACCP+— HACCP HACCP 13 Z HACCP HACCP HACCP ...SOP ssop @ HACCP 73 HACCP HACCP HACCP 1 HACCp _ 46 CODEXDHACCP+JIÞI 5 1 Y IN] HACCP HACCP HACCP E HACCP HACCP C 1 HACCP O HACCP O](https://img.dokumen.tips/doc/110x75/60cce456a98ce108300bd375/1-haccpa-haccp-haccp-13-z-haccp-haccp-haccp-sop-ssop-haccp-73-haccp-haccp.jpg)