Embed Size (px)
Citation preview
1
Evaluation of Groundwater Nitrate Contamination in Public
Water Systems and Major and Minor Aquifers in Texas
Robert C. Reedy and Bridget R. Scanlon
Final Contract Report prepared for Texas Commission on Environmental Quality
August, 2017
Project Manager: Michael Chadwick
Bureau of Economic Geology, Jackson School of Geosciences, University of Texas at Austin

2
Executive Summary
Nitrate is the most widespread groundwater contaminant in Texas and in the U.S. There are many
potential adverse health implications of elevated groundwater nitrate, including methemoglobinemia and
cancer risks. Sources of nitrate include natural sources, inorganic and organic fertilizers (manure), output
from concentrated animal feeding operations (CAFOs), septic tanks, and leaking sewer systems. Natural
sources result from nitrogen fixation by legumes, mineralization of organic matter (nitrification), and
natural geologic sources.
Many previous studies have been conducted on groundwater nitrate contamination in Texas. The early
studies focused on source identification using nitrogen isotopes, mainly distinguishing between nitrate
from fertilizers and septic tanks. Groundwater nitrate levels were expected to be high in the Ogallala
Aquifer beneath playas adjacent to concentrated animal feeding operations; however, many studies
showed that nitrate levels were reduced by denitrification attributed to high levels of organic matter. A
recent study suggested that nitrate contamination has been increasing in the state over the past several
decades and identified the Seymour aquifer in the Rolling Plains as a hotspot of groundwater nitrate
contamination. A study evaluated controls on groundwater nitrate contamination using logistic
regression, indicating that precipitation, percent of agricultural land, low density residential land, and soil
organic matter were the dominant explanatory variables. Unsaturated zone sampling was used to link
land surface processes to groundwater nitrate levels and suggested that much of the elevated nitrate
levels in the Ogallala and Seymour aquifers could be attributed to high levels of natural nitrate prior to
cultivation that was oxidized during cultivation and mobilized into the underlying aquifer.
The current study examined groundwater nitrate contamination in public water systems (PWS) and also
in the major and minor aquifers in the state to better understand the spatial distribution of nitrate levels.
The vast majority of PWS systems (99.13%) and people served by PWS systems (99.96%) in Texas are
compliant with respect to nitrate-N, with nitrate-N levels less than the EPA maximum contaminant level
(MCL) of 10 mg/L nitrate-N. A total of 60 PWS systems serving ~10,000 people were identified as having
nitrate-N in excess of the 10 mg/L MCL entering at least one system entry point. Most of these systems
(45, 75%) source their groundwater from one of the major aquifers. Almost 50% (28 systems) of these
PWS systems are sourced in the Ogallala Aquifer. Of the remaining systems, six are sourced in the Seymour
Aquifer, five in the Edwards-Trinity Plateau Aquifer, four the Gulf Coast Aquifer, and two in the Trinity
Aquifer. The remaining 15 noncompliant PWS systems are sourced in various minor or local aquifers. The

3
distribution of non-compliant PWS systems is consistent with ambient levels of groundwater nitrate-N
based on analysis of the Texas Water Development Board (TWDB) database.
The distribution of groundwater nitrate-N in major and minor aquifers in the state provides context to
better understand nitrate contamination in PWS systems. A total of ~8,800 analyses from major aquifers
and ~1,800 analyses from minor aquifers were evaluated. Approximately 70% of the samples in the major
and minor aquifers exceed the detection levels for nitrate-N. The majority of the samples are from rural
domestic and irrigation wells. A total of 5.5% of the samples from the major aquifers exceed the MCL,
with the highest level of contamination in the Seymour Aquifer (63% of samples > MCL), followed by the
Pecos Valley Aquifer (13%), Ogallala Aquifer (9%), Edwards-Trinity Aquifer (6%), and the remaining major
aquifers < 2%.
A total of 6.9% of the samples from the minor aquifers exceed the MCL, with the highest level of
contamination in the Lipan Aquifer (59% of samples > MCL), followed by the Blaine (19%), Bone Spring-
Victoria Peak (15%), Brazos River Alluvium (12%), and Dockum and Hickory (10%). The number of analyses
from many of the minor aquifers is limited, reducing confidence in the nitrate contamination assessment.
The results from the major and minor aquifers are consistent with the nitrate hotspot in the Seymour and
nearby Lipan aquifers, both located in the Rolling Plains.
A variety of factors can influence groundwater nitrate-N contamination, including nitrate-N input, soil
types affecting transport from the land surface to underlying aquifers, unconfined versus confined aquifer
systems, and water table depths in unconfined aquifers. The highest nitrogen loading does not necessarily
correspond to the hot spots of groundwater nitrate contamination. The general lack of correspondence
between nitrate loading and groundwater nitrate contamination suggests that soil texture, aquifer status
(confined vs unconfined), and water table depths are more important factors controlling nitrate
contamination. High levels of groundwater nitrate, particularly in the Seymour, Lipan, and southern
Ogallala aquifers are attributed to natural sources and fertilizer inputs, coarse soils, unconfined aquifers,
and shallow water tables.
Although it is difficult to assess temporal variations in groundwater nitrate-N contamination because of
differing degrees of sampling over past decades, the hotspots of groundwater nitrate-N levels have been
known for decades because the attributes of the system that lead to nitrate contamination are not
changing. The regional distribution of high nitrate levels adjacent to the noncompliant PWS systems, with
most occurring in rural areas, makes it difficult to mitigate nitrate contamination in these PWS. Future
studies should involve a more in depth evaluation of groundwater nitrate levels to delineate sources of

4
contamination in these hotspots, assess processes (mitigation etc), and evaluate temporal trends from
frequently sampled wells.
Introduction
Nitrate is the most widespread contaminant in groundwater in Texas and in the U.S. (Nolan et al., 2002).
Adverse health impacts of elevated nitrate levels include methemoglobinemia in infants (blue baby
syndrome), which is potentially fatal and results in low blood oxygen levels (Spalding and Exner, 1993).
The Centers for Disease Control (1996) also suggested that eight spontaneous abortions in women in
Indiana (1991 – 1994) may be linked to high nitrate-N levels (19 – 29 mg/L) in domestic well water in rural
regions of Indiana. Increased risk of non-Hodgkin’s lymphoma has also been linked to nitrate-N levels
exceeding 4 mg/L in community water supply wells in Nebraska (Ward et al., 1996). Previous studies
indicate that groundwater NO3-N levels exceeding 2 mg/L are thought to be affected by humans (Mueller
and Helsel, 1996).
Sources of groundwater nitrate include atmospheric deposition, natural sources, inorganic and organic
fertilizers (manure), concentrated animal feeding operations (CAFO) output, septic tanks, and leaking
sewer systems. Natural sources include nitrogen fixation by legumes, organic matter mineralization
(nitrification), and natural geologic sources. Data on fertilizer applications, including inorganic and organic
fertilizer applications, are available from county level fertilizer sales from National Agricultural Statistics
Service (www.nass.usda.gov). Previous research has examined source attribution for groundwater nitrate
contamination. GIS overlay analyses and logistic regression have been used to assess different sources
and controls on nitrate contamination on regional and national scales (Nolan et al., 1997; 2002; Squillace
et al., 2002). Nitrogen and oxygen isotopes of nitrate have been used at regional and local scales to relate
groundwater nitrate to fertilizer and human and animal waste sources (Kreitler, 1975; Fogg et al., 1998;
Bohlke et al., 2002).
Recent Studies of Nitrate Levels in Texas Aquifers
Many studies have been conducted on nitrate in soils and groundwater in different parts of Texas. The
spatiotemporal variability in groundwater nitrate levels in Texas was examined in a recent study on a
county basis, focusing primarily on the Texas Rolling Plains (TRP), based on nitrate analyses between 1960
and 2010 (Chaudhuri et al., 2012). This study indicated that NO3 levels in many aquifers increased
significantly in many counties since the 1960s, with NO3-N levels exceeding the nitrate-N MCL in >30% of
the observations in 25 counties in the 2000s versus 8 counties in the 1960s. MCL exceedances were
highest in the Texas Rolling Plains (Haskell and Knox counties) with all analyses greater than the MCL in
5
2000. Increasing nitrate-N levels are positively correlated cropland areas, fertilized croplands, and
irrigated croplands linking agriculture to groundwater nitrate levels. This study noted a large reduction in
groundwater sampling over time with limited recent observations, making it difficult to assess temporal
trends. The results of this study indicate a marked deterioration in groundwater quality by nitrate
attributed to agriculture, underscoring the need for more intensive spatial sampling in the future.
We conducted a study at the Bureau of Economic Geology to evaluate controls on nitrate contamination
in major porous media aquifers in the state by comparing groundwater nitrate levels with nitrogen loading
and aquifer susceptibility parameters (Scanlon et al., 2004). Nitrogen loading included atmospheric
deposition, inorganic and organic fertilizers, land use, proxies for sewage and septic input, population
density, precipitation, and irrigation. Aquifer vulnerability to contamination was based on percent land
surface slope, percent well drained soils, clay content, and organic matter content. Multivariate logistic
regression was used to relate the probability of nitrate concentrations in shallow wells (≤ 30 m) exceeding
a pre-specified threshold value of 4 mg/L nitrate-N with potential explanatory variables representing
nitrogen loading and aquifer susceptibility. The final regression model included precipitation, percent
agricultural land, low density residential land, and soil organic matter. Observed and predicted
probabilities of elevated nitrate concentrations were highly correlated in calibration and validation data
sets (R2, 0.96; 0.98). The inverse relationship between precipitation and nitrate concentration may be
related to dilution in high precipitation areas and possibly evapoconcentration in low precipitation areas.
Although nitrate loading is not explicitly represented in the final model, percent agricultural land may be
considered a proxy for nitrogen loading from agricultural sources and low density residential land use may
be considered a proxy for septic tank effluent. Percent organic matter may reflect the influence of
denitrification in some regions. This GIS and logistic regression analysis described in this study provides
valuable insights into controls on the distribution of nitrate concentrations in groundwater.
We also conducted studies sampling several unsaturated zone profiles and measuring nitrate-N in soil
water to link land surface processes and potential groundwater contamination (Olyphant, 2009; Scanlon
et al., 2008). The objective of the studies was to quantify nitrate-N reservoirs beneath various ecosystems,
including natural rangelands and irrigated and rainfed agricultural ecosystems in regions of high
groundwater nitrate-N levels in the Seymour, southern High Plains, and southern Gulf Coast aquifers. We
drilled profiles beneath natural (24), and irrigated (22) and nonirrigated (44) ecosystems in these regions.
The studies found that nitrate-N levels beneath natural rangeland ecosystems are generally low in the
different aquifer regions; however, nitrate-N accumulations are much higher at depth beneath cultivated
areas which were attributed to pre-cultivation rangeland conditions. These results indicate that NO3-N
6
accumulations under current rangeland conditions may not reflect those beneath rangeland conditions
prior to cultivation. Accumulations of NO3-N beneath rainfed agriculture are moderate, attributed to
generally low to moderate fertilizer application rates in addition to pristine precipitation. However,
nitrate-N levels beneath irrigated agriculture are generally high. In the Southern High Plains, high nitrate-
N levels beneath irrigated areas are attributed to deficit irrigation and lack of flushing and may result in
soil salinisation. Evidence suggests that high groundwater levels in the Seymour aquifer may be related to
natural nitrate sources prior to irrigation and to irrigation recycling because of (1) high levels of
groundwater nitrate contamination prior to fertilization and irrigation, (2) low to moderate fertilizer
application rates, and (3) low to moderate unsaturated zone nitrate accumulations (Bartolino et al., 1994).
High levels of groundwater nitrate contamination in the High Plains are focused in the southern part of
the southern High Plains and are attributed to the shallow water table (~82 ft) and low saturated thickness
(~45 ft). Nitrate loading is moderate to high in this region and nitrate reservoirs in the unsaturated zone
are high in deep soil profiles representing rangeland conditions prior to cultivation. Large nitrate
reservoirs in soil zones beneath irrigated areas are attributed to evapotranspirative concentration related
to deficit irrigation. Groundwater nitrate contamination may increase in the future if these nitrate
reservoirs are mobilized and reach the underlying water tables.
Public Water Supply Systems and Nitrate Compliance
The procedure for dealing with PWS that are noncompliant is as follows:
When a PWS system reports exceeding an MCL, a Notice of Violation is given to the PWS system that
requires mandatory public notification of the violation. Violations are added up and accumulate points
(based on the constituent or action). Once an entity accumulates 11 points, they are then sent to internal
TCEQ review, who may then send them to enforcement or to legal. The point system is ranked on the risk
to public health, with acute and non-acute constituents ranked as follows:
Nitrate - 10 points
Arsenic - 5 points
Fluoride and Radionuclides - 5 points each
Chlorine - 10 points
Missing a sample for nitrate - 5 points
The higher number of points for nitrate relative to arsenic or fluoride is related to the acute issues related
to methemoglobinemia from elevated nitrate-N levels. This ranking system is for each sampling point. For
example, two sampling points in the system exceeding nitrate-N MCL would result in a doubling of the
points to a total of 20 points.

7
Data Sources and Analyses
Groundwater nitrate concentrations were obtained from the TCEQ Public Water Supply (PWS) database
for water quality specifically related to public water supply systems. PWS systems routinely sample water
at system entry points and following any treatment processes to be analyzed for an array of potential
contaminants of concern, including nitrate-N. For this study, we focused on PWS systems that obtain their
water either entirely or in part from groundwater sources and further restricted our analysis to the
operational entry points of those systems, disregarding entry points used for other purposes, such as
inactive, non-drinking water, or emergency sources. The PWS database contains nitrate-N concentration
information for samples from 6,933 public drinking water systems. Of these, 6,005 systems (86%) obtain
at least part of their water supply from groundwater. Of these groundwater-reliant systems, 87% (5,218
systems) rely on one of the major aquifers and 13% (787 systems) rely on one of the minor aquifers (Table
1).
Only the latest water sample analysis was used for each entry point and for systems with more than one
entry point, the highest concentration of any entry point samples for each respective system was used
characterize the violation status. The latest sample dates for 96% of systems ranged between 2015 and
2017 and the oldest sample of the remaining systems was analyzed in 2005. Detection limits for nitrate-
N in the TCEQ database range somewhat lower overall as compared to the TWDB database, with a
maximum value of <0.05 mg/L nitrate-N, with 81% of non-detects with concentrations <0.01 mg/L nitrate-
N. PWS systems that exceed the EPA nitrate-N MCL of 10 mg/L were compiled (Table 2, Figure 1). The
aquifers associated with these non-compliant PWS systems were also examined.
Groundwater nitrate concentrations were also obtained from the TWDB database on ambient
groundwater quality. All nitrate concentrations in this study are reported as elemental nitrogen (nitrate-
N). The detection limit for nitrate-N in the database is 0.1 mg/L. The TWDB database includes information
on the well location and depth, drill date, primary water use (domestic, irrigation industrial, commercial),
water quality sampling time, and major ion chemistry. To avoid overrepresentation of wells that were
sampled multiple times, the TWDB database was screened for the most recent water quality sample
between 1992 and 2017. This time period was used to provide the greatest number of records and
because no time trends were obvious from the data. The resultant set of sampled wells contained 10,602
records. A map of Texas major aquifers is shown in Figure 2 and nitrate-N levels in the major aquifers is
shown in Figure 3. Corresponding maps of the minor aquifers are shown in Figure 4 and Figure 5,
respectively. The data set includes 8,779 samples from major aquifers (Table 3) and 1,823 samples from
minor aquifers (Table 4). The majority of samples for the major aquifers are from the PWS category (35%),
8
followed by rural domestic wells (27%), irrigation (14%), stock (12%) and other (Error! Reference source
not found.). The representation of wells in the minor aquifers is slightly different with the dominant
category being rural domestic wells (33%), followed by stock (21%), PWS systems (18%), irrigation (13%)
and other (Error! Reference source not found.).
The Net Anthropogenic Nitrogen Input (NANI) program produces national reports at the county-level of
estimates of the net sum of annual nitrogen loading accounting for various components of that loading,
including fertilizers, human and livestock wastes, and net imports and exports of nitrogen in various forms,
such as food products (Hong et al., 2011). These estimates are based primarily on data from the USDA
Census of Agriculture conducted every 5 years and additionally on data provide by the US Bureau of
Census and the National Atmospheric Deposition Program (NADP). The primary risks of nitrate
contamination from the groundwater perspective that were examined for this study include the
potentially mobile forms of nitrogen in fertilizers, human and animal waste products, and atmospheric
deposition.
Probability maps of nitrate-N exceeding two different nitrate-N threshold concentrations were developed
using indictor kriging methods for all nine major aquifers. The 18 minor aquifers generally do not have
sufficient spatial data to confidently map these probabilities. The two concentration threshold values
were 1) 2 mg/L nitrate-N, which approximates background concentrations for areas that have not been
significantly impacted by human activity, and 2) 10 mg/L, representing the US EPA MCL drinking water
standard. The spatial distributions of probabilities were subdivided into five general classes: probability <
10% (extremely low), 10 – 40% (low), 40 – 60% (moderate), 60 – 90% (high), and ≥90% (extremely high).
While ordinary kriging methods, which require actual or log-transformed concentration values, result in
maps that estimate the spatial distribution of concentrations and assume that the data are normally
distributed, actual concentrations of many MCL constituents in groundwater samples are frequently
below analytical detection limits and are reported as non-detect or “less than” values and additionally are
not normally or log-normally distributed. Ordinary kriging methods cannot incorporate non-detect values.
In contrast, indicator kriging uses cut-off transformed values to produce maps that estimate the
probability of exceeding a selected cut-off or threshold value. Indicator kriging requires no a priori
assumption regarding the normality of the data distribution and can incorporate non-detect values that
are less than or equal to the selected threshold concentration. Concentration values that exceed a given
threshold value are assigned a value of “1” and concentrations that do not exceed the threshold are
assigned a value of “0”.

9
Results and Discussion
Public Water Systems
The number of operational PWS systems in Texas totaled 6,933 (Figure 1). These systems serve ~26 million
people through ~9.4 million connections. This accounts for most of the population in the state (27.9
million in 2016). Of the 6,933 systems, 5,200 systems (75%) rely totally on groundwater and provide water
to ~5 million people (~20% of the population). A further 444 systems (6%) rely in part on groundwater
providing water to a further ~9 million people (35% of the population). The vast majority of systems
(99.1%) and people served (99.96%) in Texas are compliant with respect to nitrate-N (i.e. have nitrate-N
concentrations less than the 10 mg/L U.S. EPA MCL).
A total of 60 systems serving ~10,000 people were identified as having nitrate-N in excess of the 10 mg/L
MCL in at least one system entry point (Table 2; Figure 6). Most of these systems (45 systems, 75% of the
total number) source their groundwater from one of the major aquifers (Table 2). Almost 50% (28
systems) of these systems are sourced in the Ogallala aquifer (Figure 6b). Of the remaining systems, six
are sourced the Seymour Aquifer, five in the Edwards-Trinity Plateau Aquifer, four the Gulf Coast Aquifer,
and two the Trinity Aquifer. The remaining 15 source their groundwater from various minor or local
aquifers. The distribution of nitrate-N concentrations in all of the 6,933 PWS systems is shown in Figure 1
for context. Approximately 96% of the samples were obtained during the period 2015-2017 and none
were obtained prior to 2005. The number of people impacted by non-compliant PWS systems is provided
in Table 1 with county population data based on 2010 census shown in Figure 7 for background. Most of
the non-compliant systems are in rural areas with low population densities.
Groundwater Nitrate Concentrations in Major Aquifers
Nitrate-N concentrations exceed detection limits in ~70% of the samples from the major aquifers (Table
3, Figure 3). Nitrate-N concentrations exceed the MCL of 10 mg/L in 5.5% of all samples (8,779) evaluated
in major aquifers (Table 3). The Seymour Aquifer has the highest level of exceedances, with 63% of the
samples exceeding the MCL, followed by the Pecos Valley (13%), Ogallala (9%), and the Edwards-Trinity
Plateau (6%) aquifers. The remaining major aquifers have MCL exceedances < 3% of the samples analyzed
in each of the aquifers (Carrizo-Wilcox, Edwards [Balcones Fault Zone, BFZ], Gulf Coast, Hueco-Mesilla
Bolson, and Trinity aquifers). These results are consistent with previous studies which show highest levels
of nitrate in the Seymour Aquifer in the Rolling Plains region, attributed to the shallow water table, coarse
textured soils, and intensive agriculture (Chaudhuri et al., 2012; Scanlon et al., 2004). Similar attributes
are found in the Pecos Valley and Southern Ogallala aquifers. The median nitrate concentration is highest
10
in the Seymour Aquifer (13.1 mg/L), followed by the Ogallala Aquifer (2.0 mg/L), the Edwards Trinity
Plateau (2.0 mg/L), and the Pecos Valley Aquifer (1.6 mg/L). The remaining aquifers have median nitrate
concentrations generally < ~ 1.5 mg/L.
Approximately 30% of the groundwater samples from the major aquifers exceed 2 mg/L nitrate-N (Table
3), which is considered the background level for nitrate-N. The percentage of samples exceeding 5 mg/L
nitrate-N follows a similar trend to those exceeding the MCL of 10 mg/L, with the Seymour Aquifer ranked
highest (81% of samples), followed by the Pecos Valley Aquifer (27%), Ogallala Aquifer (19%), and the
Edwards Trinity Plateau Aquifer (18%). The remaining major aquifers have < 8% of samples exceeding 5
mg/L. A similar pattern was found for nitrate-N concentrations exceeding 2 mg/L. Major aquifers with the
lowest levels of nitrate-N have the highest percentages of non-detects, with 71% of the samples
registering as non-detects in the Carrizo Wilcox Aquifer, following by the Gulf Coast Aquifer (50%), Trinity
Aquifer (43%), and the remaining aquifers having < 12% non-detects.
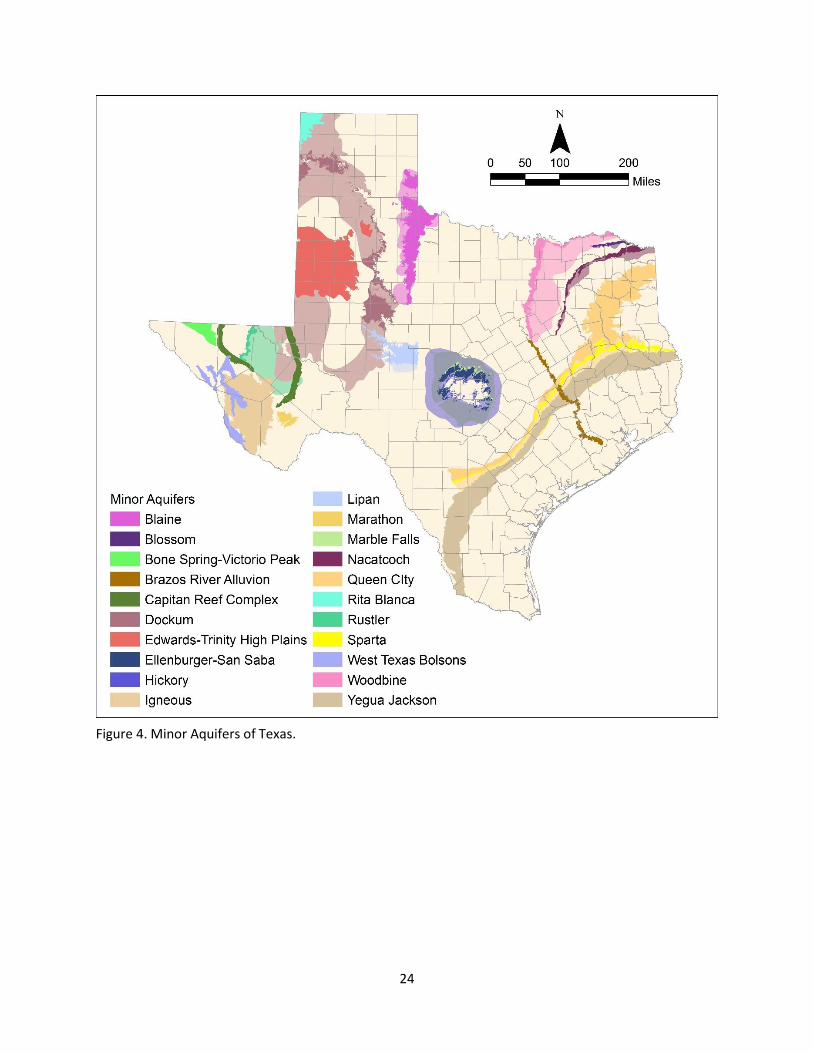
Groundwater Nitrate Concentrations in Minor Aquifers
The analysis of groundwater nitrate concentrations in minor aquifers included ~ 1,800 analyses (Table 4,
Figure 5). The aquifers with the most analyses include the Dockum (298 analyses), Queen City (227),
Woodbine (168), Ellenburger-San Saba (135), Yegua-Jackson (139), Hickory (120), Sparta (131), and West
Texas Bolson (107). All other minor aquifers had less than ~ 100 analyses. Approximately 30% of the
analyses were non-detects with detection limits ranging from 0.002 to 0.5 mg/L nitrate-N (Table 4). A total
of 7% of the analyses exceeded the nitrate MCL and 14% of the analyses exceeded 5 mg/L nitrate-N, and
26% exceed 2 mg/L. The minor aquifers with the highest level of nitrate MCL exceedances are ranked as
follows: Lipan (59%>10 mg/L), Blaine (19%), Bone Springs-Victoria Peak (15%), Brazos River Alluvium
(12%), and the Dockum and Hickory (10% each) with the remaining aquifers < 10%. Percentages exceeding
background levels of ~ 2 mg/L nitrate-N generally follow a similar order to the ranking of aquifers
exceeding MCLs, with the Lipan having the highest percentage (89%), followed by the Blaine (73%), Bone
Springs-Victoria Peak (70%), and the Edwards-Trinity (High Plains) (50%).
A map of the spatial distribution of nitrate concentrations in the minor aquifers is shown in Figure 5. The
median nitrate concentration is highest in the Lipan Aquifer (17.7 mg/L), followed by the Blaine Aquifer
(4.2 mg/L), the Bone-Springs Victoria Peak (4.0 mg/L), and the Edwards Trinity High Plains aquifer (2.0
mg/L). The remaining aquifers have median nitrate concentrations generally < ~ 1.6 mg/L.
11
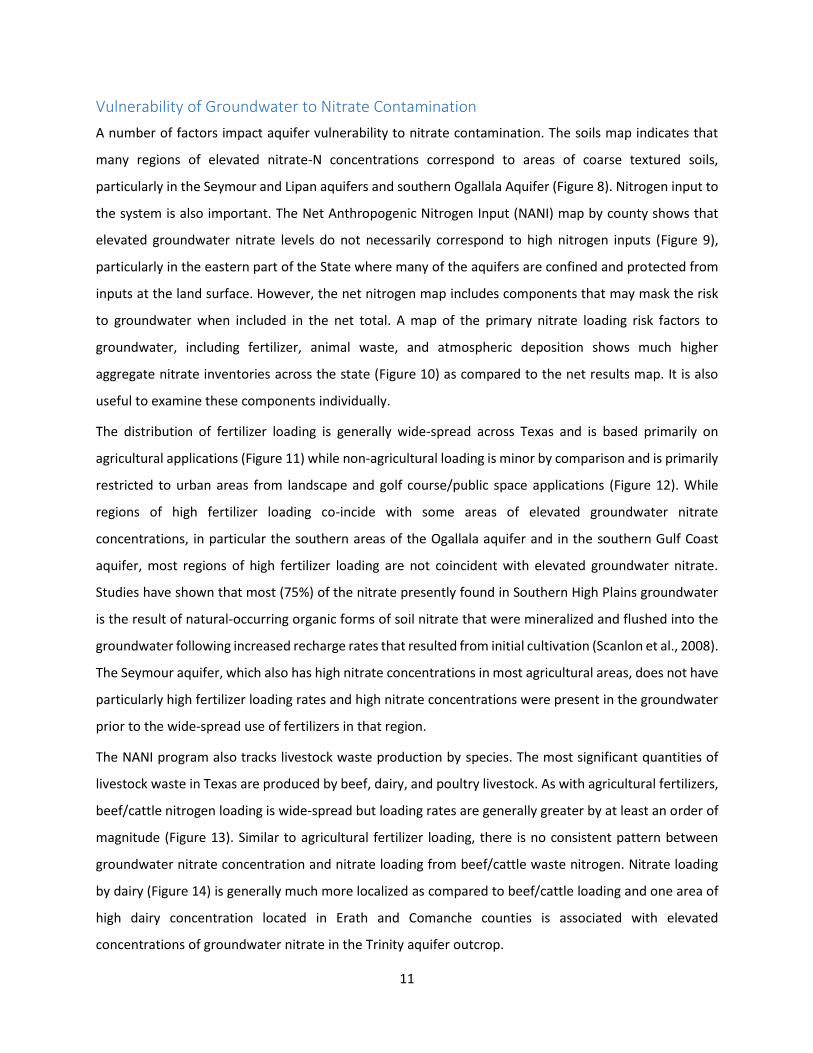
Vulnerability of Groundwater to Nitrate Contamination
A number of factors impact aquifer vulnerability to nitrate contamination. The soils map indicates that
many regions of elevated nitrate-N concentrations correspond to areas of coarse textured soils,
particularly in the Seymour and Lipan aquifers and southern Ogallala Aquifer (Figure 8). Nitrogen input to
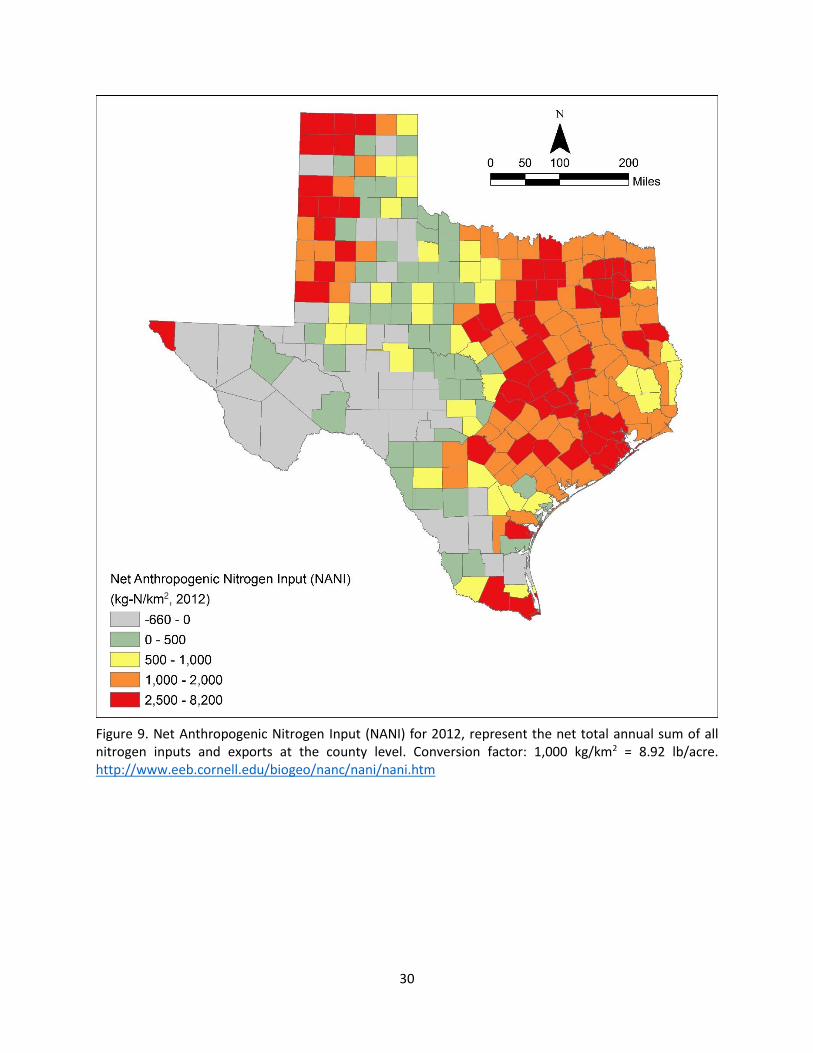
the system is also important. The Net Anthropogenic Nitrogen Input (NANI) map by county shows that
elevated groundwater nitrate levels do not necessarily correspond to high nitrogen inputs (Figure 9),
particularly in the eastern part of the State where many of the aquifers are confined and protected from
inputs at the land surface. However, the net nitrogen map includes components that may mask the risk
to groundwater when included in the net total. A map of the primary nitrate loading risk factors to
groundwater, including fertilizer, animal waste, and atmospheric deposition shows much higher
aggregate nitrate inventories across the state (Figure 10) as compared to the net results map. It is also
useful to examine these components individually.
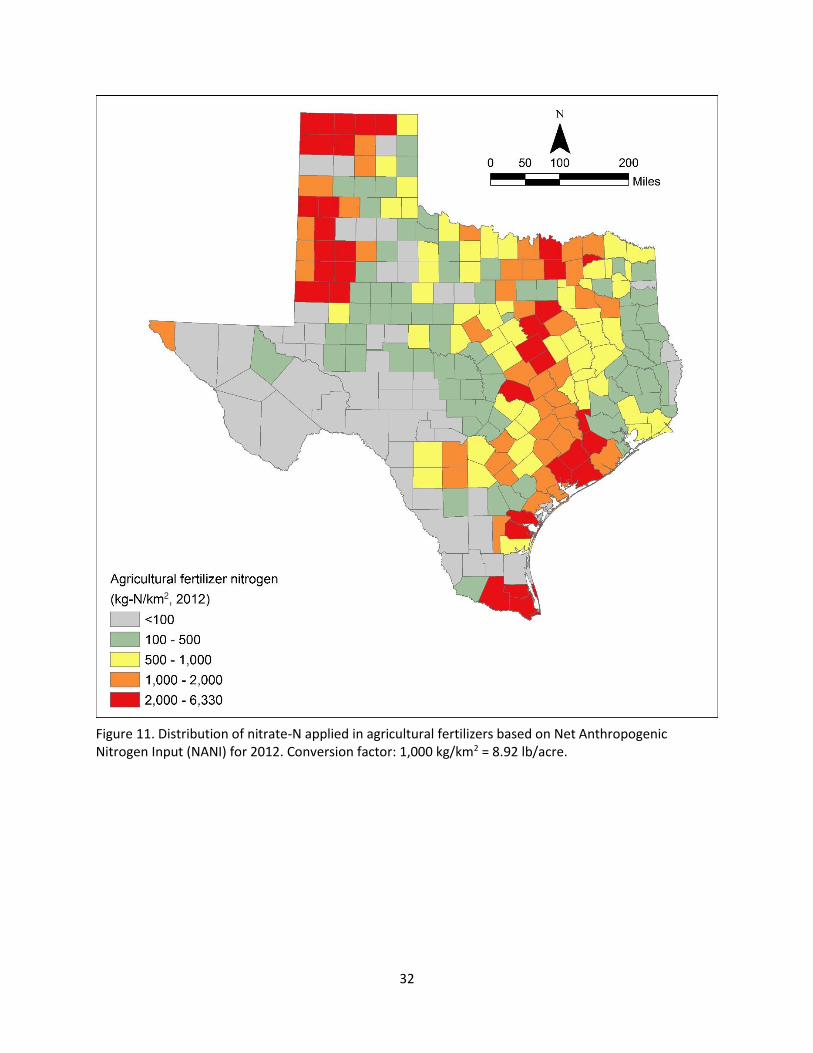
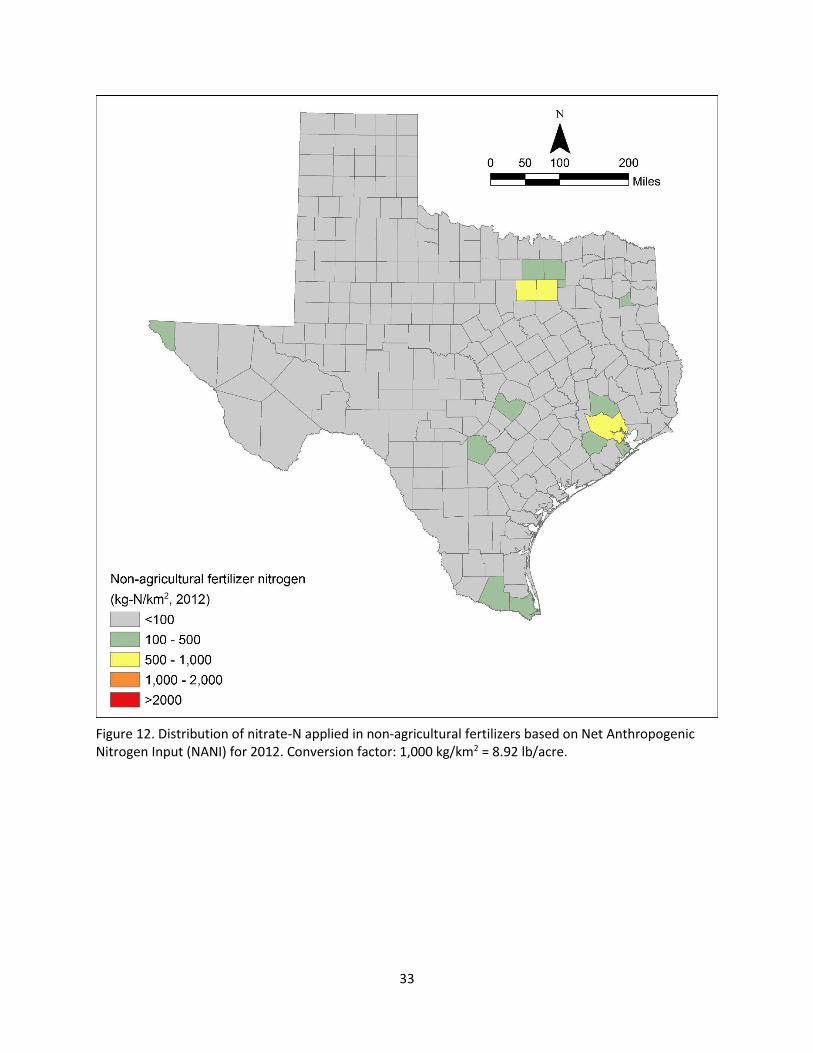
The distribution of fertilizer loading is generally wide-spread across Texas and is based primarily on
agricultural applications (Figure 11) while non-agricultural loading is minor by comparison and is primarily
restricted to urban areas from landscape and golf course/public space applications (Figure 12). While
regions of high fertilizer loading co-incide with some areas of elevated groundwater nitrate
concentrations, in particular the southern areas of the Ogallala aquifer and in the southern Gulf Coast
aquifer, most regions of high fertilizer loading are not coincident with elevated groundwater nitrate.
Studies have shown that most (75%) of the nitrate presently found in Southern High Plains groundwater
is the result of natural-occurring organic forms of soil nitrate that were mineralized and flushed into the
groundwater following increased recharge rates that resulted from initial cultivation (Scanlon et al., 2008).
The Seymour aquifer, which also has high nitrate concentrations in most agricultural areas, does not have
particularly high fertilizer loading rates and high nitrate concentrations were present in the groundwater
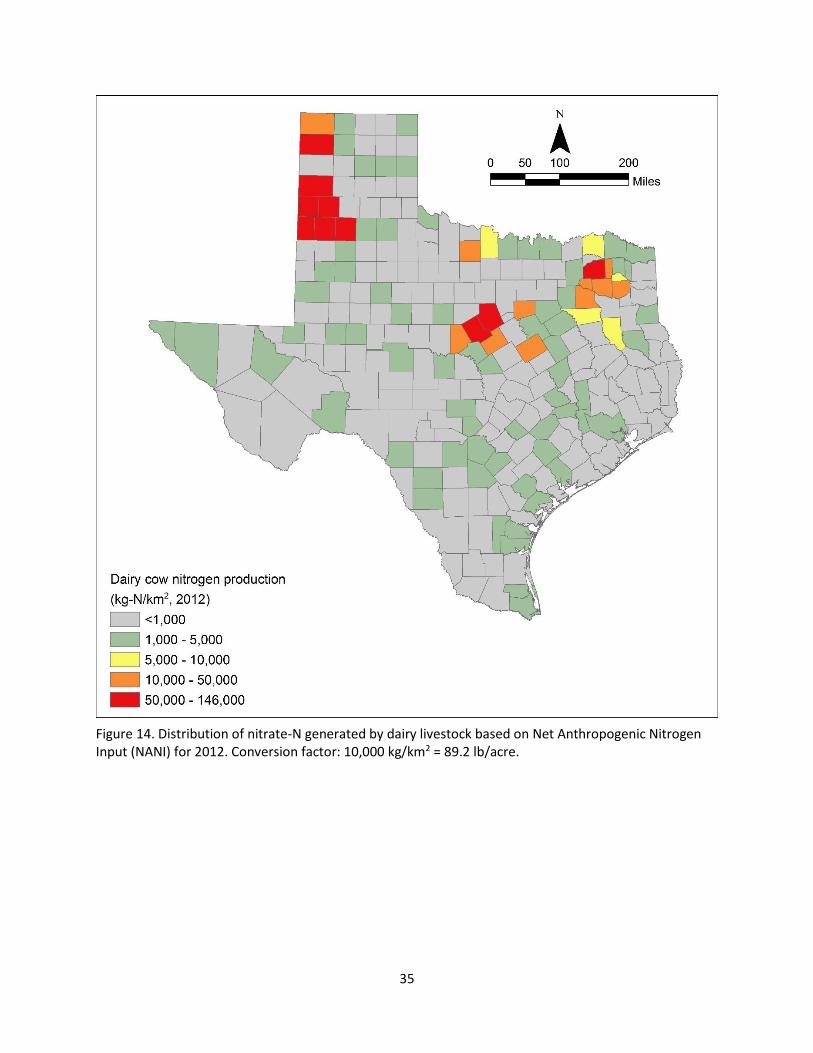
prior to the wide-spread use of fertilizers in that region.
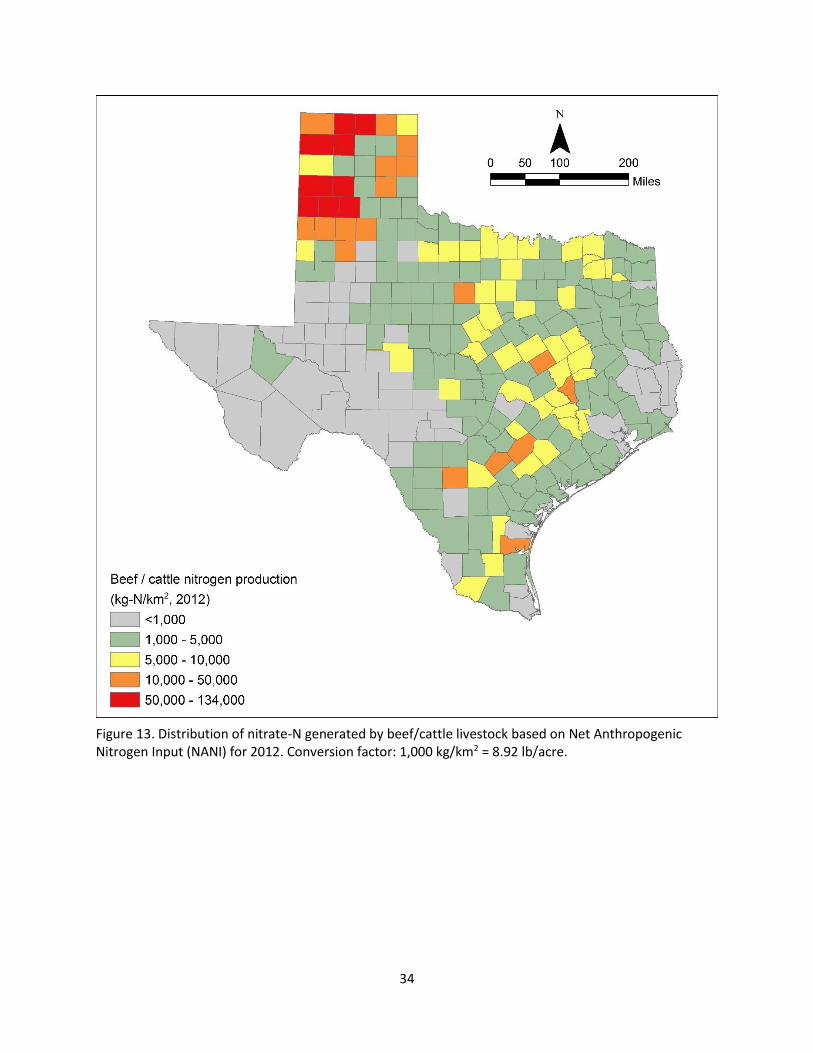
The NANI program also tracks livestock waste production by species. The most significant quantities of
livestock waste in Texas are produced by beef, dairy, and poultry livestock. As with agricultural fertilizers,
beef/cattle nitrogen loading is wide-spread but loading rates are generally greater by at least an order of
magnitude (Figure 13). Similar to agricultural fertilizer loading, there is no consistent pattern between
groundwater nitrate concentration and nitrate loading from beef/cattle waste nitrogen. Nitrate loading
by dairy (Figure 14) is generally much more localized as compared to beef/cattle loading and one area of
high dairy concentration located in Erath and Comanche counties is associated with elevated
concentrations of groundwater nitrate in the Trinity aquifer outcrop.

12
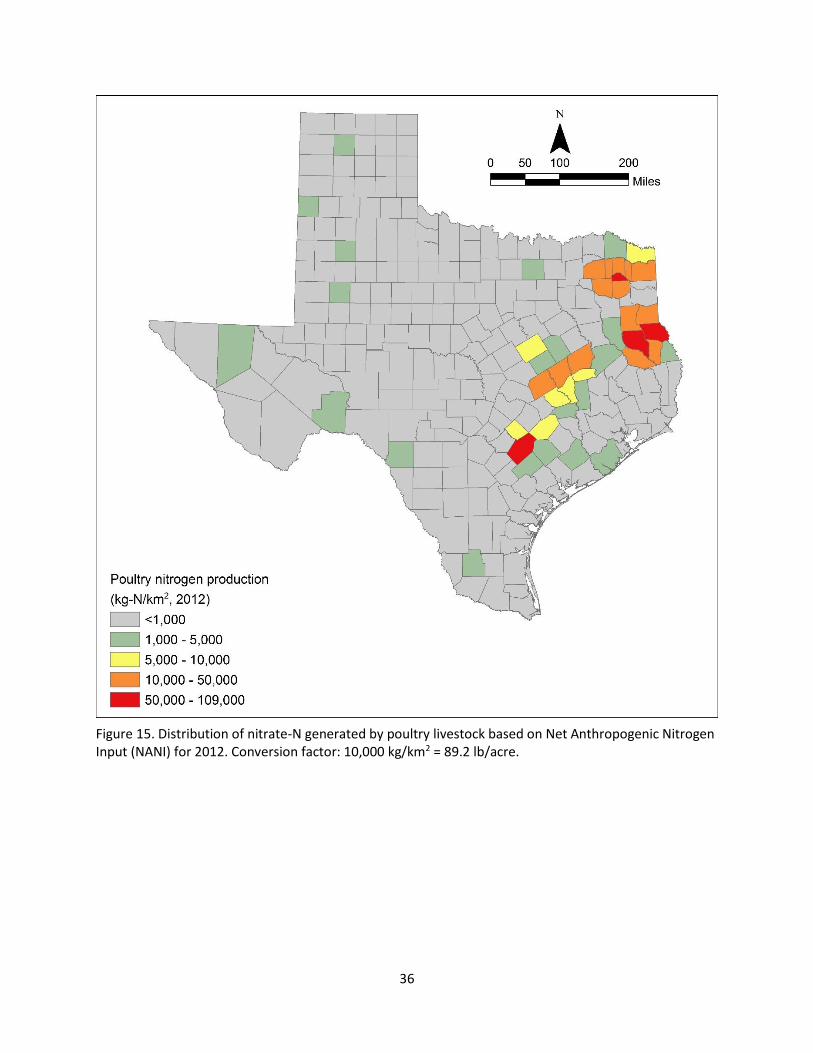
Poultry operations are generally located in the eastern regions of Texas and while nitrate loading rates
are very high and similar to those of agricultural fertilizers, beef, and dairy (Figure 15), there do not appear
to be any generalized impacts from poultry operations on groundwater nitrate concentrations in those
areas. There may be localized impacts in the eastern Carrizo-Wilcox outcrop area in Shelby and
Nacogdoches counties. High nitrate loading from poultry in Gonzales County is located above confined
areas of the Carrizo-Wilcox and there are no impacts to groundwater nitrate there.
Atmospheric deposition is generally of similar magnitude to fertilizer application rates but shows a
generalized eastward increase in loading rates and the highest rates are located primarily near the major
urban centers of Dallas/Ft Worth, Houston, San Antonio, and Austin (Figure 16).
Probability Maps of Nitrate-N Exceedances in Major Aquifers
Point maps of groundwater nitrate-N levels are shown for each of the major aquifers (Figure 17– Figure
25). In addition, probability maps of exceeding background nitrate-N levels (~ 2 mg/L) and the EPA MCL
(10 mg/L) are also shown. Nitrate-N levels in the Carrizo-Wilcox Aquifer are generally low because much
of the aquifer is confined (Figure 17a). Exceedance probabilities relative to background and MCL levels
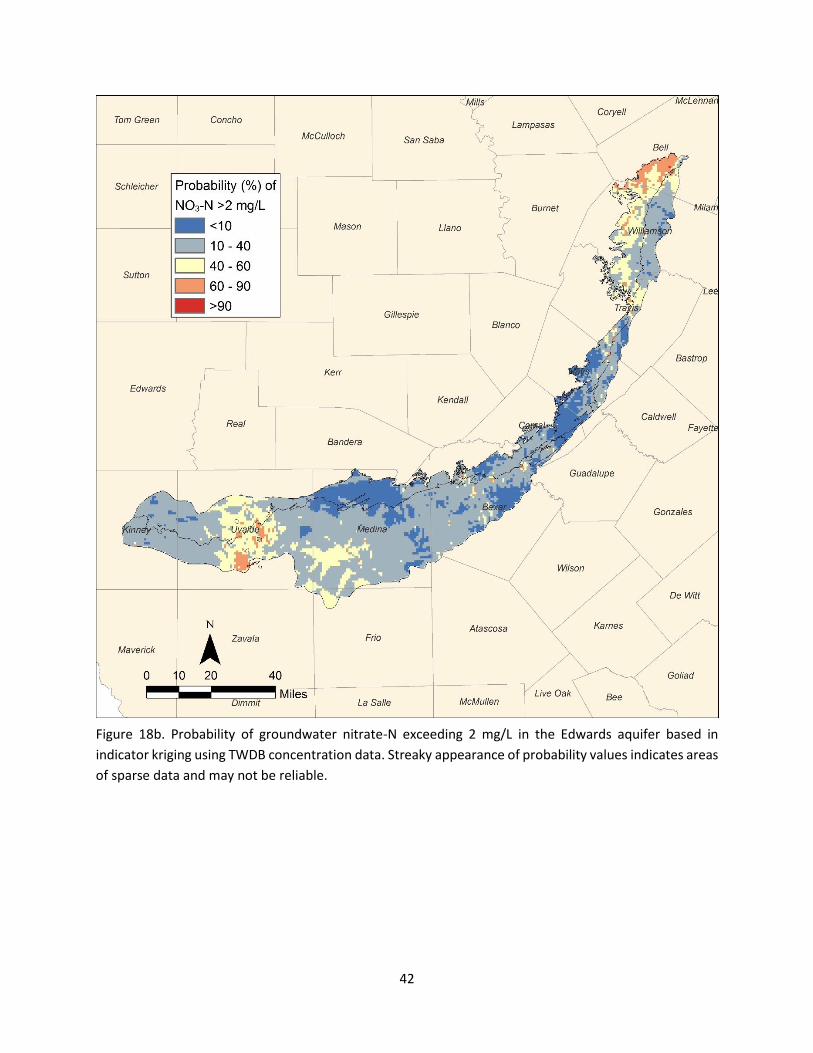
are also low (Figure 17b, c). Nitrate-N levels are also generally low in the Edwards (BFZ) Aquifer with some
localized areas exceeding background concentrations and a few hotspots with high probabilities of nitrate-
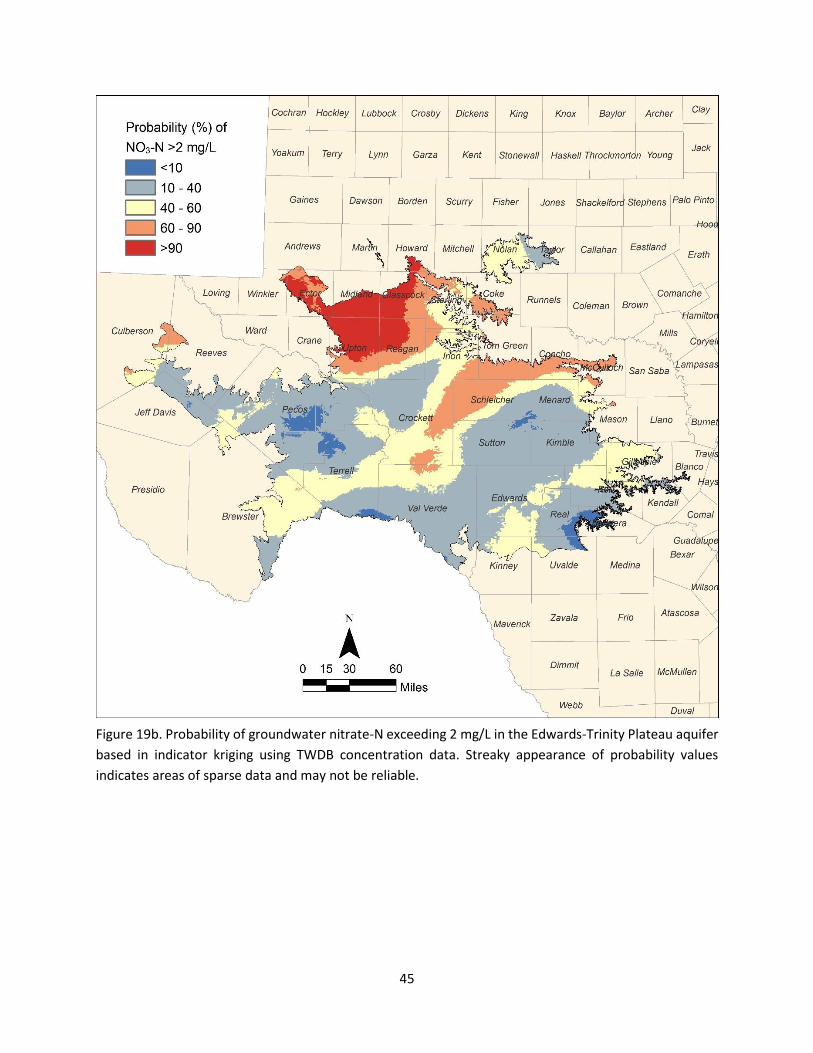
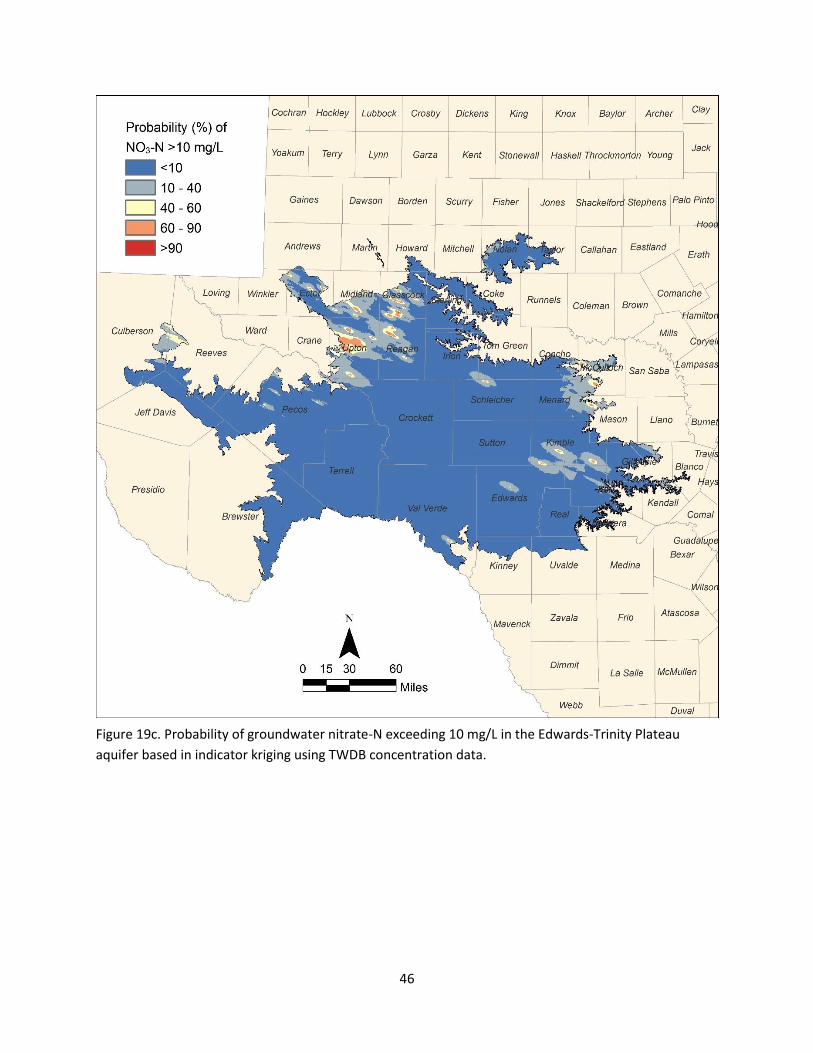
N MCL exceedances (Figure 18a, b, and c). The Edwards-Trinity Plateau Aquifer has an area of elevated
nitrate-N levels, mostly in counties in the northern portion of the aquifer (e.g. Ector, Midland, Glasscock,
Upton and Reagan counties) (Figure 19a). The exceedance probability maps are consistent with the point
maps, showing > 90% probability of exceeding background levels but still low levels 10 – 40% of exceeding
the MCL in this northern region (Figure 19b, c). The Gulf Coast Aquifer is generally characterized by low
nitrate-N levels, except in the southwestern region (Figure 20a). Probabilities of exceeding background
nitrate-N levels are high in this region but only moderate for MCL exceedances (Figure 20b, c). The number
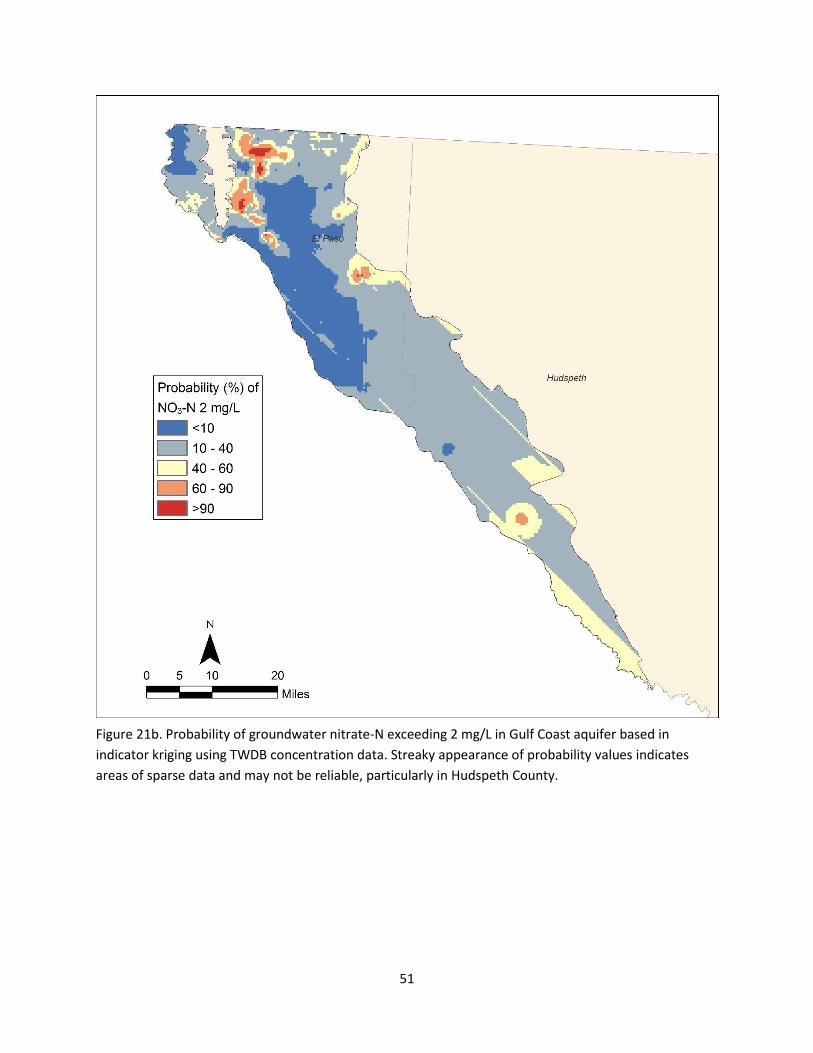
of analyses for nitrate-N for the Hueco-Mesilla Bolson aquifers is limited, reducing confidence in the
spatial distribution of nitrate-N concentrations. A hot spot of elevated nitrate-N is found in the vicinity of
El Paso where nitrate levels exceed background levels but not MCLs (Figure 21a, b, and c).
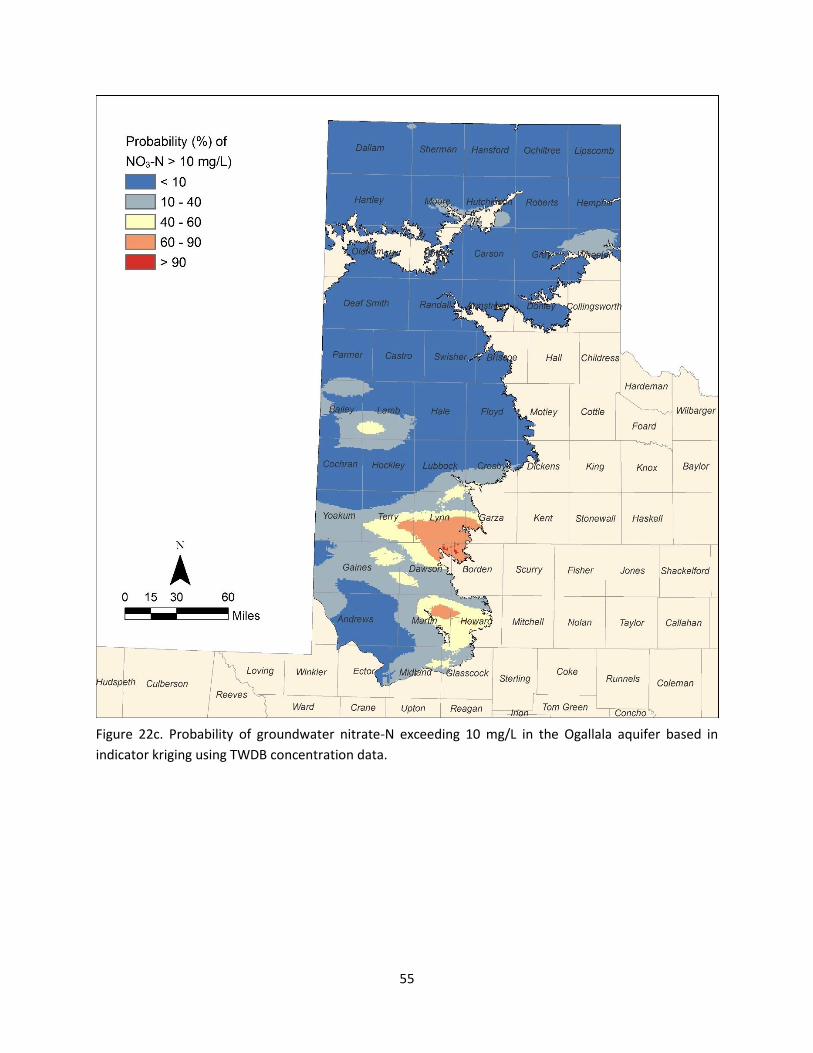
The Ogallala Aquifer shows high percentages of primary MCL exceedances for nitrate-N in the southern
part of the southern Ogallala Aquifer (Figure 22a, b, c). High levels of nitrate-N in this region may be
related to the fact that the aquifer is thin (median thickness 50 feet) relative to the northern part of the
southern Ogallala in Texas (median thickness 150 feet), and nitrate-N levels are not as readily diluted.
High nitrate contamination is related to cropland. Unsaturated zone profiles show that much of the high
nitrate could be attributed to conversion of soil organic nitrogen under rangeland vegetation to nitrate

13
with oxidation during initial cultivation (Scanlon et al., 2008). In addition to mineralization of soil organic
nitrogen, fertilizer application also results in groundwater nitrate contamination because nitrate is readily
leached through the soil profile. Nitrate-N exceedances are likely to continue to increase on the basis of
mobilization of large nitrate inventories measured in unsaturated zone profiles. Finer grained soils in the
northern part of the southern High Plains and the Central High Plains (Pullman clay loam and equivalent
soils) also restrict water movement from the land surface and minimize nitrate loading to the underlying
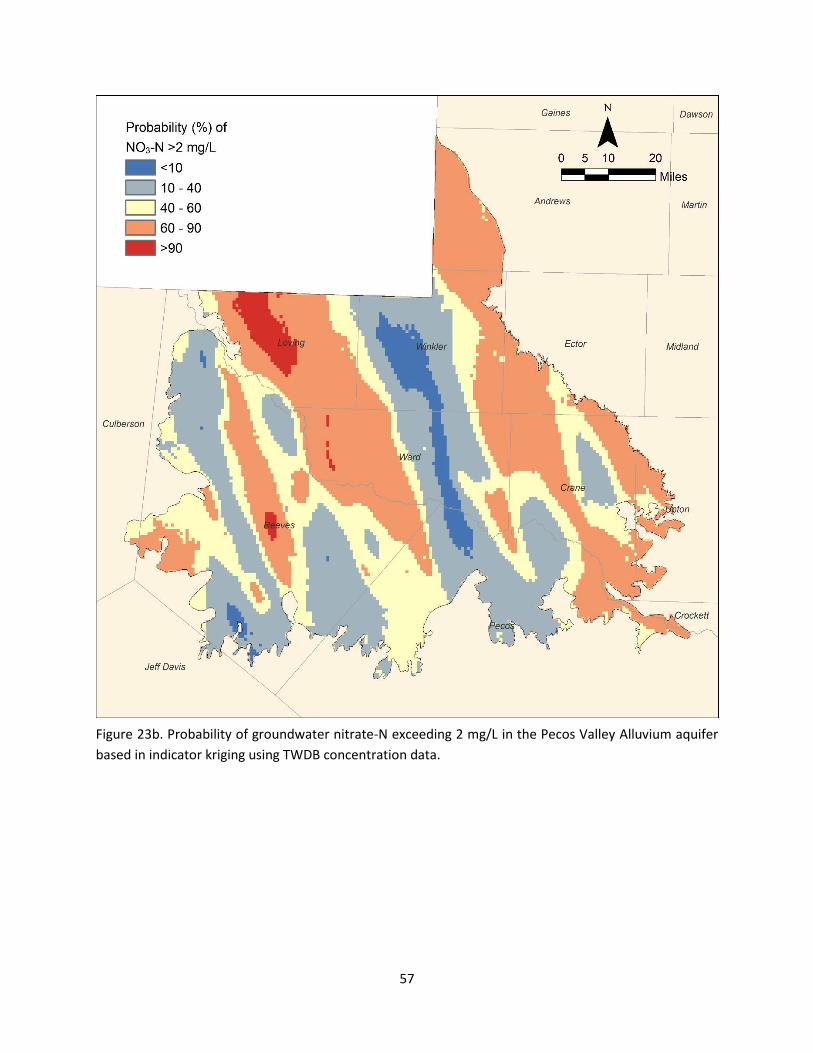
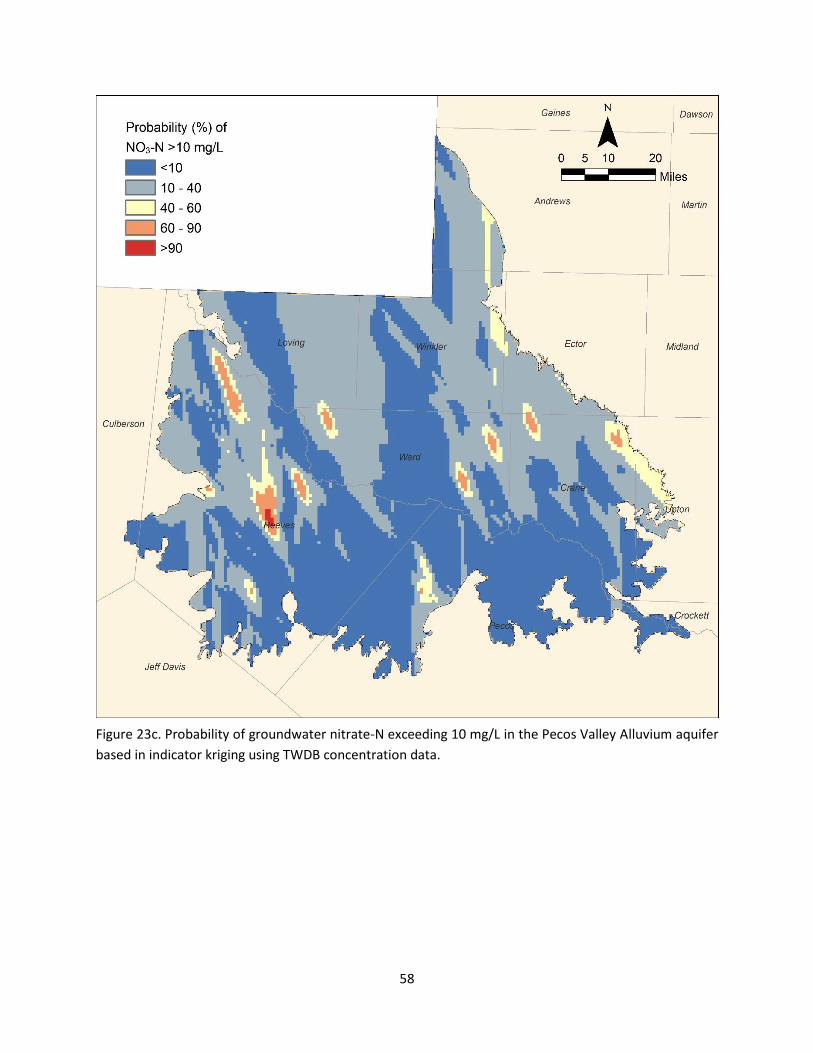
aquifer in these regions. The Pecos Valley Aquifer is divided into two troughs formed by subsidence caused
by evaporite dissolution: Monument Draw trough to the east and Pecos Valley trough to the west (Figure
23a, b, and c). The probability of exceeding nitrate-N MCL based on relatively sparse and locally variable
data is generally estimated as highest in the part of aquifer lying east of the Pecos River while there is a
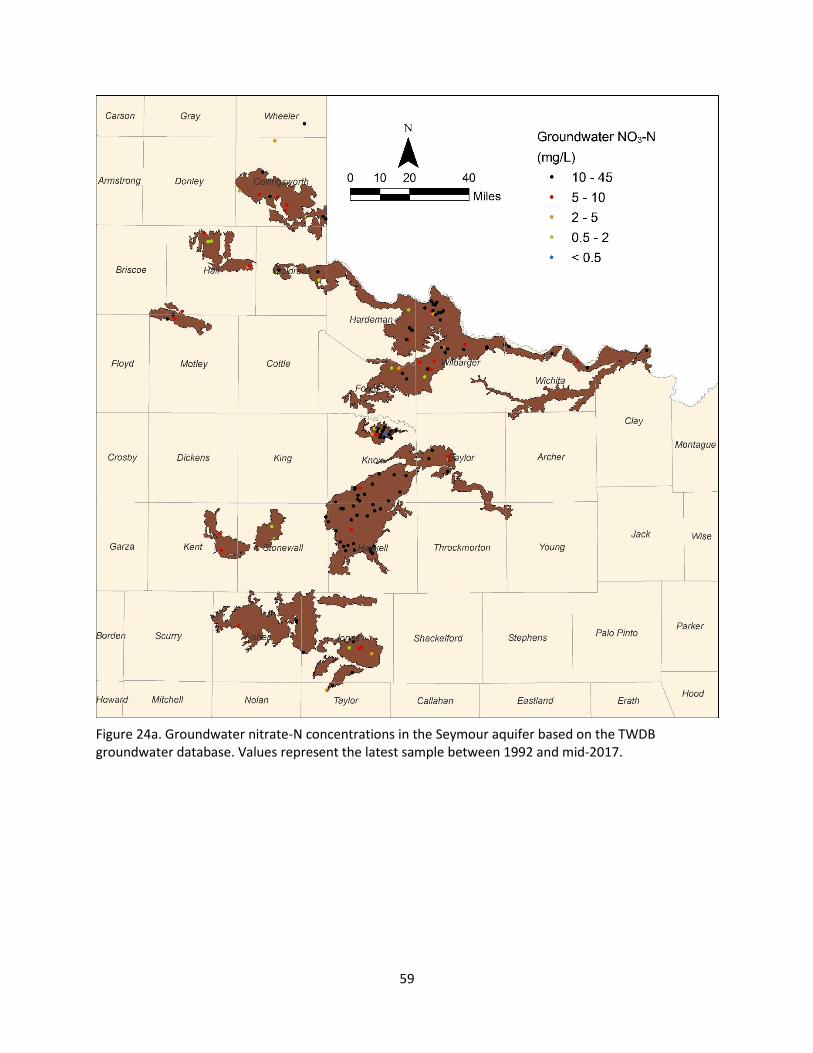
cluster of high nitrate in central Reeves County west of the Pecos River. Groundwater in the Seymour
Aquifer is dominated by nitrate-N MCL percent exceedances, attributed to oxidation of soil organic
nitrogen during initial cultivation followed by leaching of fertilizers (Figure 24a, b, and c) (Olyphant, 2009).
The aquifer generally has a low saturated thickness. Probabilities of exceeding nitrate-N MCL are
uniformly highest in the Haskell-Knox counties pod of the aquifer. The Trinity Aquifer mostly has low
nitrate-N levels except for a zone in the vicinity of Erath County in the western outcrop zone where dairies
are concentrated (Figure 25a, b, and c). Probabilities of exceeding background levels are high in this region
but probabilities of exceeding nitrate-N MCLs are low.
Management of Nitrate Contamination in Public Water Systems
Various approaches can be used to treat groundwater nitrate levels. Examples of systems with nitrate
removal include the City of Seymour which uses a reverse osmosis treatment system
(http://cityofseymour.org/utilities/reverse-osmosis-water-treatment-plant/). The City of Wheeler also
operates a reverse osmosis treatment plant (http://www.team-psc.com/engineering/wheeler-ro-wtp/).
A more in depth evaluation of treatment options should be conducted in the future.
Summary Analysis of groundwater nitrate contamination in public water systems (PWS) also in the major and minor
aquifers in Texas provides a comprehensive understanding of the spatial variability of groundwater nitrate
levels in the State. Most PWS systems (99.13%) and people served by PWS systems (99.96%) in Texas are
compliant with EPA nitrate-N MCL of 10 mg/L. A total of 60 PWS systems serving ~10,000 people have
nitrate-N exceeding the MCL in at least one system entry point. The majority of these systems (45, 75%)
source their groundwater from one of the major aquifers, with ~ 50% from the Ogallala Aquifer with the

14
remaining systems sourced in the Seymour, Edwards-Trinity Plateau, Gulf Coast, and Trinity aquifers. The
distribution of non-compliant PWS systems is consistent with groundwater nitrate-N levels from the Texas
Water Development Board (TWDB) database.
Groundwater nitrate-N levels in major and minor aquifers is based on evaluation of ~8,800 analyses from
major aquifers and ~1,800 analyses from minor aquifers. Approximately 70% of the samples in the major
and minor aquifers exceed the detection levels for nitrate-N. Most samples are from rural domestic and
irrigation wells. A total of 5.5% of the samples from the major aquifers exceed the MCL. MCL exceedances
are highest in the Seymour Aquifer (63% of samples > MCL), followed by the Pecos Valley Aquifer (13%),
Ogallala Aquifer (9%), Edwards-Trinity Aquifer (6%), and the remaining major aquifers < 2%.
A total of 6.9% of analyses from the minor aquifers exceed the MCL. MCL exceedances are highest in the
Lipan Aquifer (59% of samples > MCL), followed by the Blaine (19%), Bone Spring-Victoria Peak (15%),
Brazos River Alluvium (12%), and Dockum and Hickory (10%). The results from the major and minor
aquifers are consistent with the nitrate hotspot in the Seymour and nearby Lipan aquifers, both located
in the Rolling Plains.
Evaluation of controls on groundwater nitrate contamination indicates that the dominant factors
impacting nitrate contamination include coarse textured soils and unconfined aquifers, with shallow
water tables. These factors explain elevated nitrate in the Seymour, Lipan, and Southern High Plains
aquifers. Previous studies have showed that nitrogen input to these systems is derived from natural
sources and nitrate fertilizer. The highest nitrogen loading generally does not coincide with these hot
spots of nitrate contamination. One exception is locally high nitrate in the vicinity of Erath County in the
Trinity Aquifer outcrop area coinciding with a high density of dairy farms. These results of this study
suggest limited opportunities for mitigating nitrate contamination by reducing loading to the system.
Information from a limited number of PWS systems indicates that nitrate in some municipalities is being
mitigated by reverse osmosis systems. Future studies should examine groundwater nitrate mitigation
strategies in more detail.

15
References
Bartolino, J. R. (1994), Source of nitrate nitrogen in the Seymour Aquifer, Knox County, Texas, AGU Abs. with Programs, Spring Meeting, May 23-27, Baltimore, Maryland, H22A-2.
Chaudhuri, S., S. Ale, P. DeLaune, and N. Rajan (2012), Spatio-temporal variability of groundwater nitrate concentration in Texas: 1960 to 2010, Journal of Environmental Quality, 41(6), 1806-1817.
Kreitler, C. W. (1975), Determining the source of nitrate in groundwater by nitrogen isotope studies, Bureau of Economic Geology, Univ. Texas at Austin, Rept. Inv. No. 83, 57 p.
Mueller, D. K., and D. R. Helsel (1996), Nutrients in the Nation's waters - too much of a good thing?, U.S. Geological Survey Circular 1136.
Nolan, B. T., K. J. Hitt, and B. C. Ruddy (2002), Probability of nitrate contamination of recently recharged groundwaters in the conterminous United States, Environmental Science & Technology, 36(10), 2138-2145.
Olyphant, J. J. (2009), Creation and degradation of an aquifer caused by land use change: Seymour aquifer, Rolling Plains, Texas M.Sc. Thesis, The University of Texas at Austin, .
Center for Disease Control (CDC) (1996), Spontaneous abortions possibly related to ingestion of nitrate-contaminated well water -- LaGrange County, Indiana, 1991-1994, Morbidity and Mortality Weekly Report, 45(569-572).
Scanlon, B. R., R. C. Reedy, and K. B. Kier (2004), Evaluation of nitrate contamination in major porous media aquifers in Texas, Final Contract Report to the Texas Commission on Environmental Quality, 48 p.
Scanlon, B. R., R. C. Reedy, and K. F. Bronson (2008), Impacts of land use change on nitrogen cycling archived in semiarid unsaturated zone nitrate profiles, southern High Plains, Texas, Env. Sci. & Tech., 42(20), 7566-7572.
Spalding, R. F., and M. E. Exner (1993), Occurrence of nitrate in groundwater - a review, J. Env. Qual., 22, 391-402.
Squillace, P. J., J. C. Scott, M. J. Moran, B. T. Nolan, and D. W. Kolpin (2002), VOCs, pesticides, nitrate, and their mixtures in groundwater used for drinking water in the United States, Environ. Sci. Technol., 36, 1923-1930.
Ward, M. H., S. D. Mark, K. P. Cantor, D. D. Weisenburger, A. Correa-Villasenor, and S. H. Zahm (1996), Drinking water nitrate and risk of non-Hodgkin's lymphoma, Epidemiology, 7, 465-471.

16
Table 1. Numbers of Public Water Supply systems by Aquifer.
Aquifer Number of
PWS Systems
All Major Aquifers 5,218
Carrizo-Wilcox 598
Edwards 189
Edwards-Trinity Plateau 162
Hueco-Mesilla Bolson 37
Gulf Coast 2,736
Ogallala 314
Pecos Valley 16
Seymour 31
Trinity 1,135
All Minor Aquifers 787
Blaine 5
Blossom 2
Bone Spring-Victorio Peak 4
Brazos River Alluvium 1
Dockum 62
Edwards-Trinity (High Plains) 1
Ellenburger-San Saba 32
Hickory 26
Igneous 19
Lipan 7
Marathon 2
Marble Falls 1
Nacatoch 26
Queen City 30
Sparta 18
West Texas Bolson 6
Yegua-Jackson 111
Other/Unknown Aquifers 434

17
Table 2. Public Water Supply (PWS) systems with current entry point samples that exceed the MCL for nitrate-N (>10 mg/L NO3-N)
PWS ID PWS Name County Aquifer Sample
date # of
samples Nitrate-N
(mg/L)
0130018 BLUEBERRY HILLS WATERWORKS Bee Gulf Coast 01/11/16 5 10.2
0230002 CITY OF QUITAQUE Briscoe Other 04/18/17 1 13.5
0440001 WELLINGTON MUNICIPAL WATER SYSTEM Collingsworth Blaine 05/16/17 1 10.3
0440002 CITY OF DODSON Collingsworth Seymour 05/16/17 1 18.9
0450043 LONE STAR INN Colorado Gulf Coast 06/01/17 2 22.01
0470019 SIDNEY ISD Comanche Trinity 07/10/17 1 25.4
0480011 EOLA WSC Concho Lipan 05/17/17 1 38
0580011 CITY OF ACKERLY Dawson Ogallala 07/11/17 1 12.3
0580013 WELCH WSC Dawson Ogallala 06/15/17 1 13.7
0580025 KLONDIKE ISD Dawson Ogallala 07/11/17 2 18.9
0680013 NORTHGATE MOBILE HOME PARK 1 Ector Dockum 04/19/17 5 13.8
0680051 CANYON DAM MOBILE HOME PARK Ector Edwards-Trinity Plateau 06/08/17 1 14.8
0680210 JUDY K S KOUNTRY KITCHEN Ector Edwards-Trinity Plateau 07/13/17 1 11.1
0730023 FOREST GLEN SPRINGS Falls Alluvial 05/24/17 1 10.4
0830018 GAINES COUNTY PARK Gaines Ogallala 04/03/17 1 14.9
0940089 RIVER RIDGE APARTMENTS Guadalupe Alluvial 03/16/16 1 11.6
0960003 TURKEY MUNICIPAL WATER SYSTEM Hall Alluvial 04/18/17 1 17.2
0960014 LAKEVIEW WSC Hall Seymour 04/18/17 1 10.9
1080147 LAZY PALMS RANCH Hidalgo Gulf Coast 07/10/17 1 18.6
1080238 SOL Y MAR Hidalgo Unknown 04/12/17 1 15.2
1100011 WHITHARRAL WSC Hockley Ogallala 04/26/17 1 19.9
1100034 WAYNEBOS STORE Hockley Ogallala 01/19/17 1 14.6
1280015 BROWNS CORNER RV Karnes Yegua-Jackson 05/09/17 1 13.5
1350001 RRA GUTHRIE DUMONT WATER SYSTEM King Other 05/23/17 1 14.8
1380006 RRA TRUSCOTT GILLILAND WATER SYSTEM Knox Seymour 05/23/17 1 12.1
1400010 SPADE WSC Lamb Ogallala 04/11/17 1 10.7
1500023 CAMP LONG MOUNTAIN ON LAKE LBJ Llano Alluvial 04/12/17 2 13.5
1520046 WILDWOOD MOBILE HOME VILLAGE Lubbock Ogallala 07/12/17 3 10.4
1520080 FRANKLIN WATER SYSTEMS 3 Lubbock Ogallala 06/07/17 6 17.8
1520123 ROOSEVELT ISD Lubbock Ogallala 02/02/17 4 21.9
18
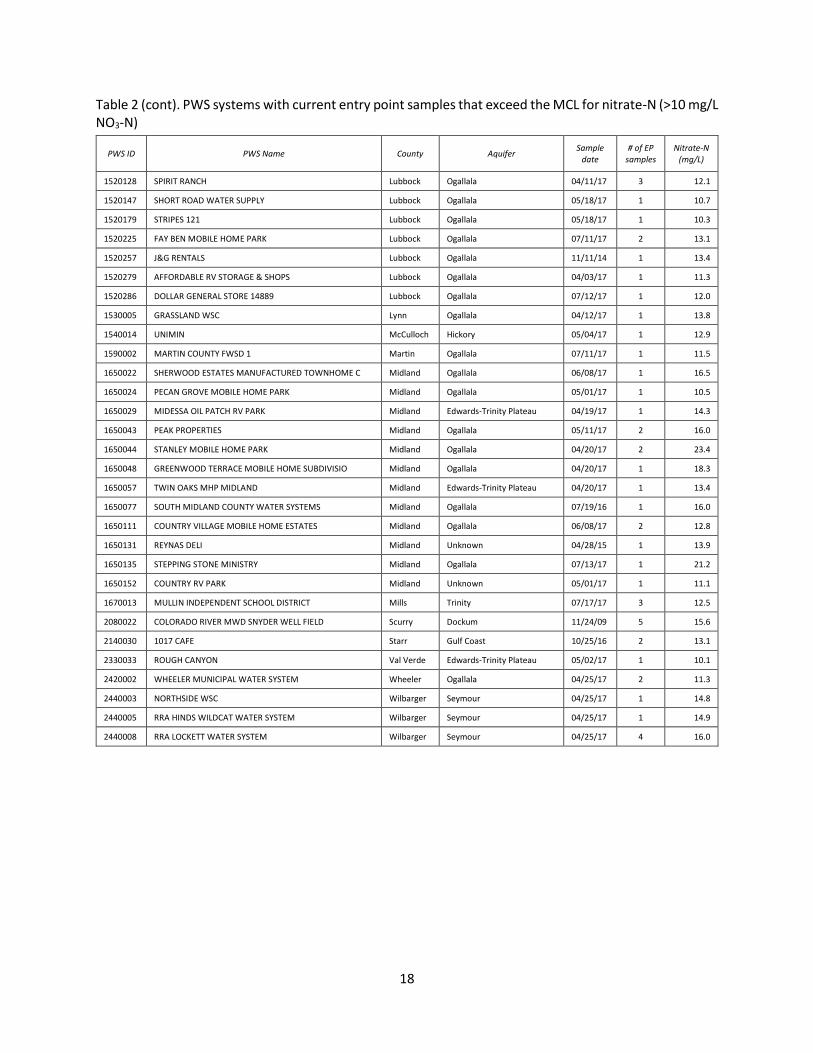
Table 2 (cont). PWS systems with current entry point samples that exceed the MCL for nitrate-N (>10 mg/L NO3-N)
PWS ID PWS Name County Aquifer Sample
date # of EP
samples Nitrate-N
(mg/L)
1520128 SPIRIT RANCH Lubbock Ogallala 04/11/17 3 12.1
1520147 SHORT ROAD WATER SUPPLY Lubbock Ogallala 05/18/17 1 10.7
1520179 STRIPES 121 Lubbock Ogallala 05/18/17 1 10.3
1520225 FAY BEN MOBILE HOME PARK Lubbock Ogallala 07/11/17 2 13.1
1520257 J&G RENTALS Lubbock Ogallala 11/11/14 1 13.4
1520279 AFFORDABLE RV STORAGE & SHOPS Lubbock Ogallala 04/03/17 1 11.3
1520286 DOLLAR GENERAL STORE 14889 Lubbock Ogallala 07/12/17 1 12.0
1530005 GRASSLAND WSC Lynn Ogallala 04/12/17 1 13.8
1540014 UNIMIN McCulloch Hickory 05/04/17 1 12.9
1590002 MARTIN COUNTY FWSD 1 Martin Ogallala 07/11/17 1 11.5
1650022 SHERWOOD ESTATES MANUFACTURED TOWNHOME C Midland Ogallala 06/08/17 1 16.5
1650024 PECAN GROVE MOBILE HOME PARK Midland Ogallala 05/01/17 1 10.5
1650029 MIDESSA OIL PATCH RV PARK Midland Edwards-Trinity Plateau 04/19/17 1 14.3
1650043 PEAK PROPERTIES Midland Ogallala 05/11/17 2 16.0
1650044 STANLEY MOBILE HOME PARK Midland Ogallala 04/20/17 2 23.4
1650048 GREENWOOD TERRACE MOBILE HOME SUBDIVISIO Midland Ogallala 04/20/17 1 18.3
1650057 TWIN OAKS MHP MIDLAND Midland Edwards-Trinity Plateau 04/20/17 1 13.4
1650077 SOUTH MIDLAND COUNTY WATER SYSTEMS Midland Ogallala 07/19/16 1 16.0
1650111 COUNTRY VILLAGE MOBILE HOME ESTATES Midland Ogallala 06/08/17 2 12.8
1650131 REYNAS DELI Midland Unknown 04/28/15 1 13.9
1650135 STEPPING STONE MINISTRY Midland Ogallala 07/13/17 1 21.2
1650152 COUNTRY RV PARK Midland Unknown 05/01/17 1 11.1
1670013 MULLIN INDEPENDENT SCHOOL DISTRICT Mills Trinity 07/17/17 3 12.5
2080022 COLORADO RIVER MWD SNYDER WELL FIELD Scurry Dockum 11/24/09 5 15.6
2140030 1017 CAFE Starr Gulf Coast 10/25/16 2 13.1
2330033 ROUGH CANYON Val Verde Edwards-Trinity Plateau 05/02/17 1 10.1
2420002 WHEELER MUNICIPAL WATER SYSTEM Wheeler Ogallala 04/25/17 2 11.3
2440003 NORTHSIDE WSC Wilbarger Seymour 04/25/17 1 14.8
2440005 RRA HINDS WILDCAT WATER SYSTEM Wilbarger Seymour 04/25/17 1 14.9
2440008 RRA LOCKETT WATER SYSTEM Wilbarger Seymour 04/25/17 4 16.0
19
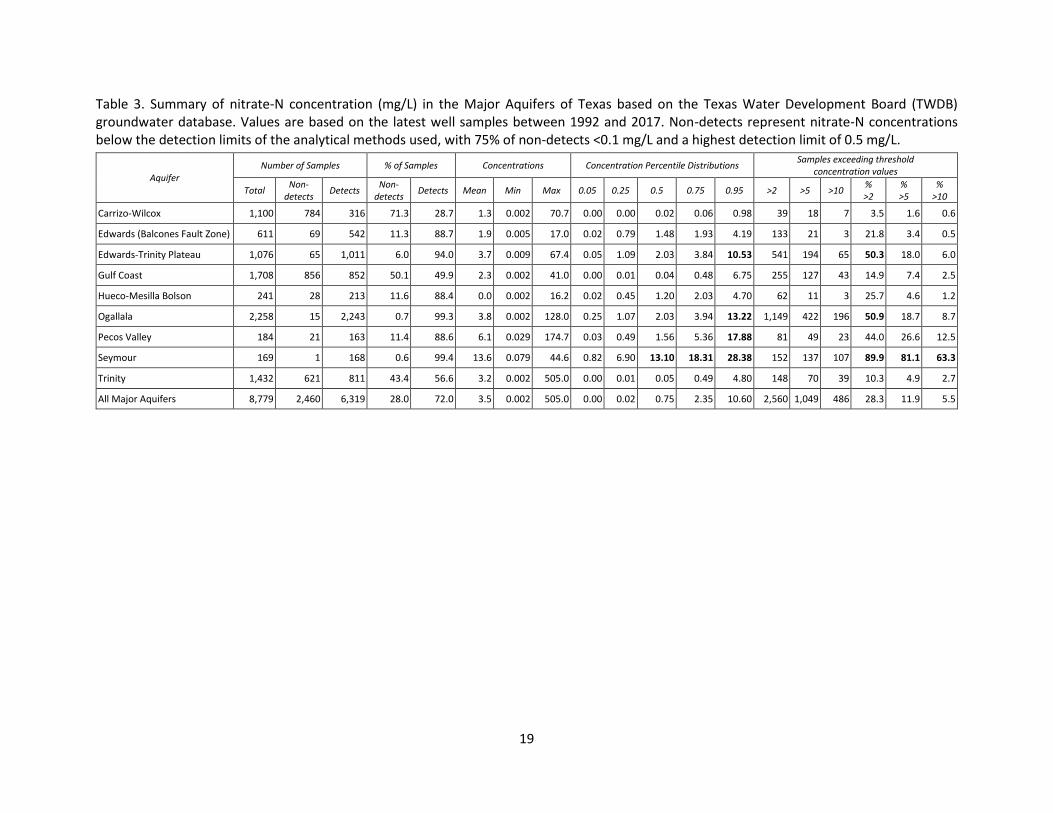
Table 3. Summary of nitrate-N concentration (mg/L) in the Major Aquifers of Texas based on the Texas Water Development Board (TWDB) groundwater database. Values are based on the latest well samples between 1992 and 2017. Non-detects represent nitrate-N concentrations below the detection limits of the analytical methods used, with 75% of non-detects <0.1 mg/L and a highest detection limit of 0.5 mg/L.
Aquifer Number of Samples % of Samples Concentrations Concentration Percentile Distributions
Samples exceeding threshold concentration values
Total Non-
detects Detects
Non- detects
Detects Mean Min Max 0.05 0.25 0.5 0.75 0.95 >2 >5 >10 % >2
% >5
% >10
Carrizo-Wilcox 1,100 784 316 71.3 28.7 1.3 0.002 70.7 0.00 0.00 0.02 0.06 0.98 39 18 7 3.5 1.6 0.6
Edwards (Balcones Fault Zone) 611 69 542 11.3 88.7 1.9 0.005 17.0 0.02 0.79 1.48 1.93 4.19 133 21 3 21.8 3.4 0.5
Edwards-Trinity Plateau 1,076 65 1,011 6.0 94.0 3.7 0.009 67.4 0.05 1.09 2.03 3.84 10.53 541 194 65 50.3 18.0 6.0
Gulf Coast 1,708 856 852 50.1 49.9 2.3 0.002 41.0 0.00 0.01 0.04 0.48 6.75 255 127 43 14.9 7.4 2.5
Hueco-Mesilla Bolson 241 28 213 11.6 88.4 0.0 0.002 16.2 0.02 0.45 1.20 2.03 4.70 62 11 3 25.7 4.6 1.2
Ogallala 2,258 15 2,243 0.7 99.3 3.8 0.002 128.0 0.25 1.07 2.03 3.94 13.22 1,149 422 196 50.9 18.7 8.7
Pecos Valley 184 21 163 11.4 88.6 6.1 0.029 174.7 0.03 0.49 1.56 5.36 17.88 81 49 23 44.0 26.6 12.5
Seymour 169 1 168 0.6 99.4 13.6 0.079 44.6 0.82 6.90 13.10 18.31 28.38 152 137 107 89.9 81.1 63.3
Trinity 1,432 621 811 43.4 56.6 3.2 0.002 505.0 0.00 0.01 0.05 0.49 4.80 148 70 39 10.3 4.9 2.7
All Major Aquifers 8,779 2,460 6,319 28.0 72.0 3.5 0.002 505.0 0.00 0.02 0.75 2.35 10.60 2,560 1,049 486 28.3 11.9 5.5

20
Table 4. Summary of nitrate-N concentration (mg/L) in the Minor Aquifers of Texas based on the Texas Water Development Board (TWDB) groundwater database. Values are based on the latest well samples between 1992 and 2017. Non-detects represent nitrate-N concentrations below the detection limits of the analytical methods used, with 75% of non-detects <0.1 mg/L and a highest detection limit of 0.5 mg/L.
Aquifer Number of Samples % of Samples Concentrations Concentration Percentile Distributions
Samples exceeding threshold concentration values
Total Non-
detects Detects
Non- detects
Detects Mean Min Max 0.05 0.25 0.5 0.75 0.95 >2 >5 >10 % >2 % >5 % >10
Blaine 75 2 73 2.7 97.3 6.1 0.041 27.2 0.19 1.91 4.22 7.89 18.36 55 33 14 73.3 44.0 18.7
Blossom 22 15 7 68.2 31.8 2.8 0.063 11.3 0.01 0.07 0.10 0.18 5.11 2 2 1 9.1 9.1 4.5
Bone Spring-Victorio Peak 47 0 47 0.0 100.0 5.7 0.201 30.2 0.57 1.60 4.04 7.12 18.21 33 18 7 70.2 38.3 14.9
Brazos River Alluvium 43 9 34 20.9 79.1 6.2 0.020 105.0 0.01 0.04 0.40 3.14 14.66 12 9 5 27.9 20.9 11.6
Capitan Reef Complex 35 14 21 40.0 60.0 2.0 0.036 12.2 0.01 0.03 0.40 0.87 5.63 5 2 1 14.3 5.7 2.9
Dockum 298 61 237 20.5 79.5 4.7 0.012 54.4 0.01 0.06 1.16 4.10 17.17 117 67 30 39.3 22.5 10.1
Edwards-Trinity (High Plains) 18 4 14 22.2 77.8 4.0 0.360 16.0 0.01 0.41 1.96 4.34 9.17 9 4 1 50.0 22.2 5.6
Ellenburger-San Saba 135 19 116 14.1 85.9 2.2 0.002 15.2 0.00 0.21 1.05 2.05 8.93 34 11 5 25.2 8.1 3.7
Hickory 120 36 84 30.0 70.0 4.0 0.002 42.5 0.00 0.03 0.40 2.15 16.14 33 19 12 27.5 15.8 10.0
Igneous 77 2 75 2.6 97.4 1.3 0.007 5.3 0.07 0.42 1.03 1.82 3.35 14 1 0 18.2 1.3 0.0
Lipan 61 1 60 1.6 98.4 21.5 0.009 85.3 0.06 5.77 17.70 33.20 57.40 54 47 36 88.5 77.0 59.0
Marathon 24 3 21 12.5 87.5 2.4 0.025 14.5 0.00 0.10 0.43 2.26 11.22 7 2 2 29.2 8.3 8.3
Marble Falls 16 3 13 18.8 81.3 1.6 0.090 5.1 0.01 0.10 0.99 1.55 4.21 3 1 0 18.8 6.3 0.0
Nacatoch 38 24 14 63.2 36.8 0.4 0.009 2.2 0.00 0.01 0.02 0.10 1.10 1 0 0 2.6 0.0 0.0
Queen City 227 100 127 44.1 55.9 1.4 0.002 33.5 0.00 0.02 0.05 0.50 3.65 22 7 3 9.7 3.1 1.3
Rita Blanca 14 0 14 0.0 100.0 0.9 0.034 2.8 0.04 0.28 0.54 1.35 2.52 2 0 0 14.3 0.0 0.0
Rustler 28 9 19 32.1 67.9 3.7 0.002 15.1 0.00 0.01 0.03 4.21 7.17 12 6 1 42.9 21.4 3.6
Sparta 131 63 68 48.1 51.9 0.8 0.009 11.2 0.00 0.01 0.04 0.13 3.29 9 5 1 6.9 3.8 0.8
West Texas Bolson 107 5 102 4.7 95.3 2.3 0.002 18.2 0.02 0.49 1.60 2.53 6.28 40 6 4 37.4 5.6 3.7
Woodbine 168 98 70 58.3 41.7 1.1 0.002 23.0 0.00 0.01 0.03 0.06 1.46 7 5 1 4.2 3.0 0.6
Yegua-Jackson 139 76 63 54.7 45.3 0.5 0.009 14.3 0.00 0.02 0.02 0.07 0.44 2 2 1 1.4 1.4 0.7
All Minor Aquifers 1,823 544 1,279 29.8 70.2 3.8 0.002 105.0 0.00 0.02 0.35 2.11 12.69 473 247 125 25.9 13.5 6.9

21
Figure 1. Entry point (EP) sample nitrate-N concentrations for Public Water Supply (PWS) systems in Texas based on the Texas Commission on Environmental Quality PWS water quality database. Each of the 6,933 PWS systems is represented by a single point located at the average latitude and longitude coordinate of all entry points for a given system. Only entry points that were listed as operational in 2017 were used and only the latest sample concentration for each entry point was used. Systems with multiple entry points are represented by the maximum concentration of all entry point samples for that system. Approximately 96% of the samples were obtained during the period 2015-2017 and none were obtained prior to 2005.

22
Figure 2. Major Aquifers of Texas.

23
Figure 3. Nitrate-N concentrations in Texas Major Aquifer groundwater based on the Texas Water Development Board (TWDB) groundwater database. Samples represent the latest sample for each well between 1992 and 2017. All non-detects (samples with nitrate-N concentrations below the analytical detection limit concentration) are represented in the <0.5 mg/L category, which also includes detected concentrations in this range.
24
Figure 4. Minor Aquifers of Texas.

25
Figure 5. Nitrate-N concentrations in Texas Minor Aquifer groundwater based on the Texas Water Development Board (TWDB) groundwater database. Samples represent the latest sample for each well between 1992 and 2017. All non-detects (samples with nitrate-N concentrations below the analytical detection limit concentration) are represented in the <0.5 mg/L category, which also includes detected concentrations in this range.

26
Figure 6a. PWS systems with nitrate-N violations based on the latest entry point sample analyses. Major aquifer outcrop and subcrop areas are shown for reference. See separate detail Figure 6b for systems in the southern Ogallala region.

27
Figure 6b. PWS systems with nitrate-N violations based on the latest entry point sample analyses in the
southern Ogallala region. Major aquifer outcrop and subcrop areas are shown for reference.

28
Figure 7. Texas county populations based on 2010 U.S. Census data.

29
Figure 8 . Soil clay content based on STATSGO.
https://www.nrcs.usda.gov/wps/portal/nrcs/detail/soils/survey/geo/?cid=nrcs142p2_053629
30
Figure 9. Net Anthropogenic Nitrogen Input (NANI) for 2012, represent the net total annual sum of all nitrogen inputs and exports at the county level. Conversion factor: 1,000 kg/km2 = 8.92 lb/acre. http://www.eeb.cornell.edu/biogeo/nanc/nani/nani.htm

31
Figure 10. Net Anthropogenic Nitrogen Input (NANI) for 2012, representing the primary risks to groundwater contamination at the county level, including fertilizers, animal waste, and atmospheric deposition. Conversion factor: 10,000 kg/km2 = 89.2 lb/acre.
http://www.eeb.cornell.edu/biogeo/nanc/nani/nani.htm
32
Figure 11. Distribution of nitrate-N applied in agricultural fertilizers based on Net Anthropogenic Nitrogen Input (NANI) for 2012. Conversion factor: 1,000 kg/km2 = 8.92 lb/acre.
33
Figure 12. Distribution of nitrate-N applied in non-agricultural fertilizers based on Net Anthropogenic Nitrogen Input (NANI) for 2012. Conversion factor: 1,000 kg/km2 = 8.92 lb/acre.
34
Figure 13. Distribution of nitrate-N generated by beef/cattle livestock based on Net Anthropogenic Nitrogen Input (NANI) for 2012. Conversion factor: 1,000 kg/km2 = 8.92 lb/acre.
35
Figure 14. Distribution of nitrate-N generated by dairy livestock based on Net Anthropogenic Nitrogen Input (NANI) for 2012. Conversion factor: 10,000 kg/km2 = 89.2 lb/acre.
36
Figure 15. Distribution of nitrate-N generated by poultry livestock based on Net Anthropogenic Nitrogen Input (NANI) for 2012. Conversion factor: 10,000 kg/km2 = 89.2 lb/acre.

37
Figure 16. Distribution of nitrate-N atmospheric deposition based on Net Anthropogenic Nitrogen Input (NANI) for 2012 (in turn based on National Atmospheric Deposition Program, NADP, data from 2008). Conversion factor: 1,000 kg/km2 = 8.92 lb/acre.

38
Figure 17a. Groundwater nitrate-N concentrations in the Carrizo-Wilcox aquifer based on the TWDB groundwater database. Values represent the latest sample between 1992 and mid-2017. Darker shaded area represents the aquifer outcrop and lighter shaded area represents the aquifer subcrop.

39
Figure 17b. Probability of groundwater nitrate-N exceeding 2 mg/L in the Carrizo-Wilcox aquifer based in
indicator kriging using TWDB concentration data.

40
Figure 17c. Probability of groundwater nitrate-N exceeding 10 mg/L in the Carrizo-Wilcox aquifer based
in indicator kriging using TWDB concentration data.

41
Figure 18a. Groundwater nitrate-N concentrations in the Edwards aquifer based on the TWDB groundwater database. Values represent the latest sample between 1992 and mid-2017. Darker shaded area represents the aquifer outcrop and lighter shaded area represents the aquifer subcrop.
42
Figure 18b. Probability of groundwater nitrate-N exceeding 2 mg/L in the Edwards aquifer based in
indicator kriging using TWDB concentration data. Streaky appearance of probability values indicates areas
of sparse data and may not be reliable.

43
Figure 18c. Probability of groundwater nitrate-N exceeding 10 mg/L in the Edwards aquifer based in
indicator kriging using TWDB concentration data. Darker shaded area represents the aquifer outcrop
and lighter shaded area represents the aquifer subcrop.

44
Figure 19a. Groundwater nitrate-N concentrations in the Edwards-Trinity Plateau aquifer based on the TWDB groundwater database. Values represent the latest sample between 1992 and mid-2017.
45
Figure 19b. Probability of groundwater nitrate-N exceeding 2 mg/L in the Edwards-Trinity Plateau aquifer
based in indicator kriging using TWDB concentration data. Streaky appearance of probability values
indicates areas of sparse data and may not be reliable.
46
Figure 19c. Probability of groundwater nitrate-N exceeding 10 mg/L in the Edwards-Trinity Plateau
aquifer based in indicator kriging using TWDB concentration data.

47
Figure 20a. Groundwater nitrate-N concentrations in the Gulf Coast aquifer based on the TWDB groundwater database. Values represent the latest sample between 1992 and mid-2017.

48
Figure 20b. Probability of groundwater nitrate-N exceeding 2 mg/L in the Gulf Coast aquifer based in
indicator kriging using TWDB concentration data.

49
Figure 20c. Probability of groundwater nitrate-N exceeding 10 mg/L in the Gulf Coast aquifer based in
indicator kriging using TWDB concentration data.

50
Figure 21a. Groundwater nitrate-N concentrations in the Hueco-Mesilla Bolson aquifer based on the TWDB groundwater database. Values represent the latest sample between 1992 and mid-2017.
51
Figure 21b. Probability of groundwater nitrate-N exceeding 2 mg/L in Gulf Coast aquifer based in
indicator kriging using TWDB concentration data. Streaky appearance of probability values indicates
areas of sparse data and may not be reliable, particularly in Hudspeth County.

52
Figure 21c. Probability of groundwater nitrate-N exceeding 10 mg/L in Gulf Coast aquifer based in
indicator kriging using TWDB concentration data.

53
Figure 22a. Groundwater nitrate-N concentrations in the Ogallala aquifer based on the TWDB groundwater database. Values represent the latest sample between 1992 and mid-2017.

54
Figure 22b. Probability of groundwater nitrate-N exceeding 2 mg/L in the Ogallala aquifer based in
indicator kriging using TWDB concentration data.
55
Figure 22c. Probability of groundwater nitrate-N exceeding 10 mg/L in the Ogallala aquifer based in
indicator kriging using TWDB concentration data.

56
Figure 23a. Groundwater nitrate-N concentrations in the Pecos Valley Alluvium aquifer based on the TWDB groundwater database. Values represent the latest sample between 1992 and mid-2017.
57
Figure 23b. Probability of groundwater nitrate-N exceeding 2 mg/L in the Pecos Valley Alluvium aquifer
based in indicator kriging using TWDB concentration data.
58
Figure 23c. Probability of groundwater nitrate-N exceeding 10 mg/L in the Pecos Valley Alluvium aquifer
based in indicator kriging using TWDB concentration data.
59
Figure 24a. Groundwater nitrate-N concentrations in the Seymour aquifer based on the TWDB groundwater database. Values represent the latest sample between 1992 and mid-2017.

60
Figure 24b. Probability of groundwater nitrate-N exceeding 2 mg/L in the Seymour aquifer based in
indicator kriging using TWDB concentration data. Some areas of little to no data and the probabilities
shown may not be accurate.

61
Figure 24c. Probability of groundwater nitrate-N exceeding 10 mg/L in the Seymour aquifer based in
indicator kriging using TWDB concentration data. Some areas of little to no data and the probabilities
shown may not be accurate.

62
Figure 25a. Groundwater nitrate-N concentrations in the Trinity aquifer based on the TWDB groundwater database. Values represent the latest sample between 1992 and mid-2017. Darker shaded area represents the aquifer outcrop and lighter shaded area represents the aquifer subcrop.

63
Figure 25b. Probability of groundwater nitrate-N exceeding 2 mg/L in the Seymour aquifer based in
indicator kriging using TWDB concentration data. Streaky appearance of probability values indicates areas
of sparse data and may not be reliable.

64
Figure 25c. Probability of groundwater nitrate-N exceeding 10 mg/L in the Seymour aquifer based in
indicator kriging using TWDB concentration data. Streaky appearance of probability values indicates areas
of sparse data and may not be reliable.