Embed Size (px)
Citation preview

_____________________________________________________________________________________________________ *Corresponding author: Email: [email protected];
Asian Journal of Geological Research
2(3): 1-13, 2019; Article no.AJOGER.51709
Evaluation of Groundwater Level Using Combined Electrical Resistivity Log with Gamma (Elgg) around
Ikeja, Lagos State, Southwestern Nigeria
S. O. Ilugbo1*, H. O. Edunjobi2, T. O. Alabi3, A. F. Ogabi2, K. O. Olomo4, O. A. Ojo5 and K. A. Adeleke1
1Department of Applied Geophysics, Federal University of Technology, Akure, Ondo State, Nigeria.
2Department of Physics, Federal University of Agriculture Abeokuta, Nigeria. 3Southwest Drilling, Borehole House Km 14 Ojoo-Iwo Road Express Way Ibadan, Oyo State, Nigeria.
4Department of Earth Sciences, Adekunle Ajasin University, Akungba Akoko, Nigeria. 5Department of Geology, Obafemi Awolowo University, Ile-Ife, Osun State, Nigeria.
Authors’ contributions
This work was carried out in collaboration among all authors. Author SOI designed the study,
performed the statistical analysis, wrote the protocol and wrote the first draft of the manuscript. Authors HOE, TOA, AFO, KOO and OAO managed the analyses of the study. Author KAA managed
the literature searches. All authors read and approved the final manuscript.
Article Information
Editor(s): (1) Dr. Mohamed M. El Nady, Department of Exploration, Egyptian Petroleum Research Institute, Nasr City, Cairo, Egypt.
Reviewers: (1) Wahome Caroline Nyawira, Kenyatta University, Kenya.
(2) R. D. Mavunda, University of Johannesburg, South Africa. Complete Peer review History: http://www.sdiarticle4.com/review-history/51709
Received 20 July 2019 Accepted 25 September 2019
Published 14 October 2019
ABSTRACT
This study has been able to demarcate the subsurface geologic units based on the lithologic characters. The subsurface geology of Lagos Main land is made up of complex lithologies of an alternating sequence of clay and sand deposits. The borehole lithologic correlation shows that the subsurface geologic sequence is composed of alternations of sand, clay, lenses of clayey sand and sandy clay. All the boreholes correlated were located within the Ikeja, Lagos State. The borehole depths vary from 119 m to 127 m and the sand and clay though variable show lateral continuity across the section. Four major fresh water sand aquifer layers were delineated within the upper 127 m of the subsurface sequence. The first aquifer layers were located at depth ranging from 61 m to 71 m below the ground level and thickness of 10 m with the resistivity varying from
Original Research Article

Ilugbo et al.; AJOGER, 2(3): 1-13, 2019; Article no.AJOGER.51709
2
190 Ωm to 320 Ωm. The second aquifer layers were located at depth ranging from 79 m to 87 m below the ground level and thickness of 8 m with the resistivity varying from 500 Ωm to 700 Ωm. The third aquifer layers were located at depth ranging from 85 m to 92 m below the ground level and thickness of 7 m with the resistivity varying from 300 Ωm to 590 Ωm while the fourth aquifer layers were located at depth ranging from 82 m to 89 m below the ground level. It has a thickness of 7 m with the resistivity varying from 300 Ωm to 610 Ωm. The aquifers were very heterogeneous as indicated by wide range of aquifer characteristics. Due to the occurrence of the sand formations in the study area, the aquifer level is between the depths of 61 m to 92 m. Hence, if there is a need for industrial purpose the aquifer should be tapped at the depth between 61 m to 89 m, and also screened for water supply. Relatively higher resistivity indicates significant formation fluid.
Keywords: Resistivity log; gamma log; lithology; aquifer level.
1. INTRODUCTION
Water is essential to humans and plays a major role virtually in every aspect of human life. Most rocks contain numerous open spaces called interstices in which water may be stored and through which water can move. Subsurface water above the zone of saturation is called vadose water, while subsurface water in interstices completely saturated with water is called Groundwater [1]. Groundwater is available only when the rocks in the zone of saturation are permeable enough to transmit sufficient water to wells, springs or streams [2]. Drilling of borehole comprises the action of breaking, crushing, cutting or dislodging the formation materials, clearing out the cuttings from the hole and stabilizing the wall of the hole for completion [3]. Geophysical well logging also called borehole geophysical log, includes all techniques of lowering sensing devices (Sonde or probe) in a borehole and recording physical parameter that may be interpreted in terms of the rock, that contained in the rocks and the construction of the well [4,5,6]. Geophysical logs can be interpreted to determine the lithology, geometry, resistivity, formation resistivity factor, bulk density, porosity, permeability, moisture content and specific water-bearing rocks [7] and to define the source, movement, chemical and physical characteristics of water [6,8,9]. Geophysical well logging can provide continuous and objective recording values that are consistent from well to well and from time to time, if the equipment is properly calibrated and standardized [10]. The most widespread uses of logs in groundwater hydrology are to define the lithology and geometry of aquifer systems and to estimate the quality of contained water [12]. The resistivity of a material is that property which characterizes its opposition to the electrical current. The electrical resistivity of a formation is directly related to the nature, quantity, quality, and distribution of the
formation water. In as much as these factors vary appreciably from one formation to another, resistivity measurements made in a borehole can be used to determine formation boundaries and to obtain information on the nature of the beds traversed by the drill [13]. Resistivity logging devices measure the electrical resistivity of a known or assumed volume of earth materials under the direct application of an electric current or an induced electric current. The resistivity curve is obtained by lowering either one or several electrodes into the borehole and making appropriate electrical measurements [14]. These measurements are plotted in terms of depth and the resulting graph is called a resistivity curve. The gamma ray log (natural gamma ray log) is one of the radiation logs which involve the measurement of fundamental particles emitted from unstable radioactive isotopes. It is a measurement of the natural gamma radioactivity of the formations. In sedimentary formations, the gamma ray log normally reflects the shale (clay) content of the formations. The advantage of radiation logs over most others is that they may be recorded in either cased or open holes filled with any fluid, because the radioactive elements tend to concentrate in clays and shale. The main objective of carrying out borehole logging was to optimize the performance of the borehole in a cost effective way by appreciably correlating the groundwater aquifer level in Ikeja. In addition, the quality of contained water will be determined by identifying the fresh water aquifers relative to depth using combined electrical resistivity log with gamma (ELGG).
1.1 Site Description and Geology of the Study Area
The study area falls entirely in the Dahomey Basin, ikeja, Lagos State. The geology of the area is underlain by sedimentary rocks with no basement outcrop (Fig. 1). The Dahomey Basin

Ilugbo et al.; AJOGER, 2(3): 1-13, 2019; Article no.AJOGER.51709
3
was formed following the break-up of the African and South American Plates [15] and is partially separated from the Niger Delta and the Eastern Nigeria sedimentary basin by a Ridge of crystalline rocks. The earliest sediments in the area were deposited as a result of the first major marine transgression in South Western Nigeria [16]. The upper sediments in the Dahomey Basin
are recent. This is underlain by Coastal Plain Sands of the Quaternary Age. Basically the geologic sequence in the Dahomey Basin extends from Precambrian to Recent. Three distinct sequences, which are closely related to the geology of the sediments, are identified from past studies of South-Western Nigeria [17].
Fig. 1. Geological map of lagos showing the study area

Ilugbo et al.; AJOGER, 2(3): 1-13, 2019; Article no.AJOGER.51709
4
2. METHODOLOGY
Four composite geophysical well logs were obtained from four borehole locations in Ikeja, Lagos state (Fig. 2). The composite log consists of the resistivity and gamma ray measurements. The GPS coordinates were gotten in UTM units showing the northing, easting and elevation of the location above sea level. The cutting were collected at an interval of 3 meters in the well bore, washed and bagged. In this study, one lithology detection log (gamma ray log) and one fluid detection log (resistivity) were employed in interpreting the subsurface deposition of the wells. The subsurface layers (sand and clay) were delineated and correlated stratigraphically. Delineation into aquifer horizons was done from well to well by the use of lithologic logs and supplemented by geophysical logs. The interpretation of well logs involves choosing best models from the given data so as to obtain results which are geologically plausible.
Well log interpretations are often quantitative and qualitative, but only the qualitative technique was employed for facies analysis. The qualitative interpretation involved the use of models which represent the characteristic log response to the formation parameters. The qualitative interpretations involve identification of sand units
from chosen top sand to the last water bearing sand using gamma ray log, classification of the sand that contain aquifer of relevant geological formation that juxtaposed it, identification of water-bearing sand from resistivity log and identification of fresh water sand. A baseline is drawn on the gamma log, which is midway between the maximum and minimum gamma signals. All signals to the left of the baseline were regarded as sand while all signals to the right of the baseline are taken as clay. Based on the available data on the ditch cuttings, lithology was prepared. The motive of the resistivity log was used to determine the sandy formation. Formation fluid of high resistivity indicates sand while low resistivity indicates clay. A deflection of the resistivity curve to the right indicates sand (fresh water). On the other hand, a deflection towards the resistivity curve to the left indicates clay. Resistivity of rock units and fluid are measured directly on the geophysical log [17]. Intervals of logs from different wells were matched for similarity or for characteristic log responses to lithological markers. The borehole lithologic logs of the study area were correlated along one direction. The subsurface layers were correlated and delineated stratigraphically along the aforementioned directions and aquifer levels were delineated.
Fig. 2. Satellite imagery of the study area showing the point of Borehole logs

Ilugbo et al.; AJOGER, 2(3): 1-13, 2019; Article no.AJOGER.51709
5
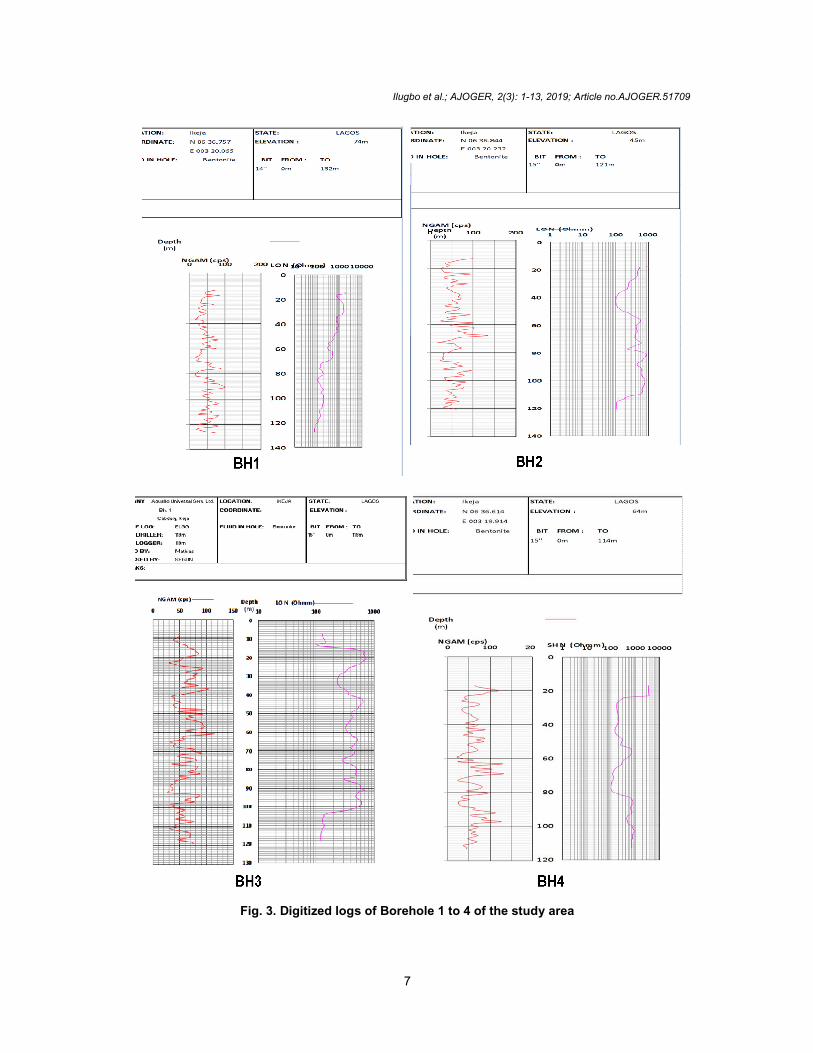
3. RESULTS AND DISCUSSION
The data obtained from four representative wells of the study area were presented in a digitized form. Fig. 3 displays the digitized logs borehole one (1) to four (4) with well drilled to the depth of 132 meters. The lithology of the borehole consists entirely of alternating layers of sand, clay, sandy clay and clayey sand. The sand layers are significantly thick, uniform and continuous with intercalations of clayey sand, sandy clay and clay layers. The lithology of the borehole was deduced from the Natural Gamma Log which goes along with the resistivity log.
Table 1. The lithology of Borehole 1 in respect to depth and corresponding
formation description
Depth(m) Lithologic
description From To
15 17 Sand
17 19 Clay
19 25 Sand
25 26 Clay
26 50 Sand
50 55 Clay, sandy
55 57 Sand
57 61 Sand, clayey
61 71 Sand/medium
71 77 Clay
77 83 Sand
83 87 Clay, sandy
87 93 Clay
93 101 Sand, clayey
101 105 Clay
105 112 Sand, clayey
112
116
121
122.5
116
121
122.5
126
Clay
Sand, clayey
Clay
Sand
3.1 Geophysical Correlation of Boreholes Each of the boreholes is discussed based on their lithology and formation resistivity from the available logs (Figs. 4 to 7). Generally the lithology of the boreholes formations consist of cylcothems of sand, clay, clayey sand and sandy clay. Sometimes, the sand occurs as lenses within the clay formation. Interpretation of gamma ray and resistivity logs of water wells in the study area also reveal the existence of aquifer bearing sand. Identification of the major
aquifers for each of the wells of the study has been made. All the wells were made up of multilayer aquifer systems but were reduced to major ones. Lithology is derived from the gamma ray log and the corresponding saturating fluid is gotten from the resistivity log. Lithology of the formations is tabulated in respect to depth and corresponding formation description (Tables 1 to 4). Table 5 illustrates the summary of water bearing sands depth in the study area with Bh1 varies from 26 to 50 m, 55 to 57 m, 61 to 71 m and 77 to 83 m while Bh2 ranges from 15 to 23 m, 25.5 to 28 m, 33 to 36 m, 71 to 74 m, 79 to 87 m and 97 to 100m. Bh3 varies from 22 to 25 m, 64 to 68 m, 85 to 92 m, 98 to 102 m and 107 to 112 m while Bh4 ranges from 23 to 27 m, 30 to 34 m, 56 to 60.5 m, 71 to 74 m and 82 to 89 m.
Table 2. The lithology of Bh2 in respect to
depth and corresponding formation description
Depth (m) Lithologic
description From To 13 15 Clay 15 23 Sand 23 25.5 Clay 25.5 28 Sand 28 33 Clay sandy 33 36 Sand 36 46 Clay 46 47.5 Sand 47.5 51 Clay 51 52 Sand 52 61 Clay Sandy 61 71 Clay 71 74 Sand 74 79 Clay 79 87 Sand 87 91 Clay 91 92 Sand 92 97.5 Clay 97.5 100 Sand 100 107 Clay 107 121 Sand clayey
3.2 Correlation of Lithological Logs Lithostratigraphic sections and resistivity correlations are relevant in aquifer development because they give us an insight into the general subsurface stratification and fluid characteristics. Table 6 shows the lithostratigraphic and resistivity correlations of the main land region studied in the aforementioned directions. Fig. 8 illustrates the correlation of lithological logs showing the fresh water bearing sand of each

Ilugbo et al.; AJOGER, 2(3): 1-13, 2019; Article no.AJOGER.51709
6
well in the study area. All the boreholes correlated are located within the coastal plain sands. The borehole depths vary from 119m to 127m. The stratigraphic section is composed of alternations of sands and clays. The sands and clays, though variable, show lateral continuity across the section. Table 7 show the four major fresh water sand aquifer layers that were delineated within the upper 127m of the subsurface sequence. The first aquifer layers were located at depth ranging from 61m to 71m below the ground level. It has a thickness of 10m with the resistivity varying from 190 Ωm to 320
Ωm. The second aquifer layers were located at depth ranging from 79 m to 8 m below the ground level. It has a thickness of 8m with the resistivity varying from 500 Ωm to 700 Ωm. The third aquifer layers were located at depth ranging from 85 m to 92 m below the ground level. It has a thickness of 7m with the resistivity varying from 300 Ωm to 590 Ωm while the fourth aquifer layers were located at depth ranging from 82 m to 89 m below the ground level. It has a thickness of 7 m with the resistivity varying from 300 Ωm to 610 Ωm.
Table 3. The lithology of Bh3 in respect to depth and corresponding formation description
Depth (m) Lithologic description From To 8 12 Sand 12 22 Clay 22 25 Sand 25 40 Clay 40 47 Sand, clayey 47 49 Clay, sandy 49 64 Clay 64 68 Sand 68 72 Clay 72 78 Clay, sandy 78 85 Clay 85 92 Sand 92 98 Clay 98 101 Sand 101 106 Clay, sandy 106 109 Clay 109 112
112 119
Sand Clay, sandy
Table 4. The lithology of Bh4 in respect to depth and corresponding formation description
Depth(m) Lithologic description
From To 17 23 Clay 23 27 Sand 27 30 Clay 30 34 Sand 34 38 Clay 38 47 Clay, sandy 47 56 Clay 56 60.5 Sand 60.5 62 Sand/medium, clayey 62 71 Clay 71 74 Sand 74 82 Clay, sandy 82 89 Sand 89 102 Clay 102 113 Clay, sandy
Ilugbo et al.; AJOGER, 2(3): 1-13, 2019; Article no.AJOGER.51709
7
Fig. 3. Digitized logs of Borehole 1 to 4 of the study area

Ilugbo et al.; AJOGER, 2(3): 1-13, 2019; Article no.AJOGER.51709
8
Fig. 4. Geophysical correlation of Borehole1

Ilugbo et al.; AJOGER, 2(3): 1-13, 2019; Article no.AJOGER.51709
9
Fig. 5. Geophysical correlation of Borehole 2
Table 5. Summary of the water bearing sands depth in the study area
water bearing sands S/N location/area water bearing sands depth (m) 1 Bh1 26-50 55-57 61-71 77-83 2 Bh2 15-23 25.5-28 33-36 71-74 79-87 97-100 3 Bh3 22-25 64-68 85-92 98-102 107-112 4 Bh4 23-27 30-34 56-60.5 71-74 82-89

Ilugbo et al.; AJOGER, 2(3): 1-13, 2019; Article no.AJOGER.51709
10
Fig. 6. Geophysical correlation of borehole3
Table 6. showing fresh water saturated and their resistivity values
S/N Aquifers Depth[m] Thickness[m] Resistivity[Ωm] Borerhole1 A 26-50 24 500-1700
B 55-57 2 320-380 C 61-71 10 190-320 D 73-83 10 130-150
Borerhole 2 A 15-23 8 500-1000 B 25.5-28 2.5 280-450 C 33-36 3 180-220 D 71-74 3 400-600 E 79-87 8 500-700 F 97-100 3 790-800
Borehole3 A 22-25 3 410-600 B 64-68 4 390-500 C 85-92 7 300-600 D 98-102 4 130-600 E 107-112

Ilugbo et al.; AJOGER, 2(3): 1-13, 2019; Article no.AJOGER.51709
11
S/N Aquifers Depth[m] Thickness[m] Resistivity[Ωm] Borerhole4 A 23-27 4 190-1100
B 30-34 4 180-190 C 56-60.5 4.5 400-700 D 71-74 3 110-140 E 82-89 7 300-610
Fig. 7. Geophysical correlation of borehole4

Ilugbo et al.; AJOGER, 2(3): 1-13, 2019; Article no.AJOGER.51709
12
Fig. 8. Lithological log correlation of the aquifer
Table 7. Show the major depth of aquifers in the four boreholes
S/N Aquifers Depth[m] Thickness[m] Resistivity[Ωm] Borehole1 C 61-71 10 190-320 Borehole2 E 79-87 8 500-700 Borehole3 D 85-92 7 300-590 Borehole4 E 82-89 7 300-610
4. CONCLUSION
The subsurface geologic units have been demarcated in this study based on the lithologic characters. The borehole lithologic correlation shows that the subsurface geologic sequence is composed of alternations of sands and clays. Lenses of clayey sand, sandy clay and silty clay occur in places. The geophysical log and Lithology log were correlated from the Bh1, Bh2, Bh3 and Bh4. All the boreholes correlated were located within the coastal plain sands. The borehole depths vary from 119 m to 127 m. The stratigraphic section is composed of alternations of sands and clays. Four major fresh water sand aquifer layers that were delineated within the upper 127 m of the subsurface sequence. The first aquifer layers were located at depth ranging from 61m to 71 m below the ground level. It has a thickness of 10 m with the resistivity varying from 190 Ωm to 320 Ωm. The second aquifer layers were located at depth ranging from 79 m to 87 m below the ground level. It has a thickness of 8m with the resistivity varying from
500 Ωm to 700 Ωm. The third aquifer layers were located at depth ranging from 85 m to 92 m below the ground level. It has a thickness of 7m with the resistivity varying from 300 Ωm to 590Ωm while the fourth aquifer layers were located at depth ranging from 82 m to 89m below the ground level. It has a thickness of 7m with the resistivity varying from 300 Ωm to 610 Ωm. The subsurface geology of Lagos Main land is made up of complex lithologies of an alternating sequence of clay and sand deposits. The data available allows for delineation of subsurface into four aquifer horizons. Sand and gravel constitute the materials in the aquifer of recent sediments and Coastal Plain Sands. Four major fresh water bearing sand aquifers layers suggests that the deposits could be of fluvial usually estuarine deposits. The aquifers are very heterogeneous, as indicated by wide range of aquifer characteristics. In light of this information, it is recommended that due to the occurrence of the coastal plain sand in the study area the aquifer level is between the depths of 61m to 92m. Hence, if there is a need for industrial purpose,
Ilugbo et al.; AJOGER, 2(3): 1-13, 2019; Article no.AJOGER.51709
13
the aquifer should be tapped at the depth between 61m to 89m, and also screened for water supply. Relatively higher resistivity indicates significant formation fluid.
COMPETING INTERESTS Authors have declared that no competing interests exist.
REFERENCES
1. Ilugbo SO, Adebo BA, Olomo KO, Adebiyi AD. Application of Gis and multi criteriadecision analysis to geoelectric parameters for modeling of groundwater potential around Ilesha, Southwestern Nigeria. European Journal of Academic Essays. 2018;5(5):105-123.
2. Ilugbo SO, Adebiyi AD. Intersection of lineaments for groundwater prospect analysis using satellite remotely sensed and aeromagnetic dataset around Ibodi, Southwestern Nigeria. Int. J. of Phys Sci. 2017;12(23):329-353.
3. Gass TE. A comparison of Earth resistivity and electromagnetic survey methods. Water Well Journa. 1987;43-47.
4. Guyod H. Electrical detective; investigation of groundwater supplies with electric logs, Water Well Journal. 1957;8.
5. Keller GV, Frischknecht FC. Electrical methods in geophysical prospecting. New York Pergamon Press. 1966;519.
6. Keith B. The use of geophysical well logging as an aid to well construction and rehabilitation. Robertson Geologging Limited, UK; 1998.
7. Peart RJ. Surface geophysical techniques applied to groundwater exploration in Hydrogeology. Commonwealth Africa. 1975;11:45-102.
8. Keys WS, MacCary LM. Application of borehole geophysics to water resources investigation of the USGS. 1971;Chapter 2, Book 5:126.
9. Oteri AU. Interpretation of electric logs in aquifer of Dahomey Basin Nigeria, African. Journal of Science and Technology. 1986; 2(Series B):54-61.
10. Oteri AU. Electric log interpretation for the evaluation of salt water in the eastern Niger Delta. Hydrological Sciences Journal. 1988;33(1-2):19-30.
11. Schlumberger well log corporation, Schlumberger log interpretation. 1972;1: 110.
12. Zohdy AAR, Eaton GP, Mabey DR. Application of surface geophysics to geophysics to groundwater investigation. Techniques of water resources investigation of the USGS. 1974;Chapter D1:5-62.
13. Ilugbo SO, Ozegin KO. Significances of deep seated lineament in groundwater studies around Ilesha, Southwestern Nigeria. Asian Journal of Geological Research. 2018;1(1):1-16.
14. Burke K, Dessauvagie TFJ, Whiteman AJ. Opening of the Gulf of Guinea and geological history of the Benue depression and Niger delta. Nature Phys. Sci. 1971; 233:51-55.
15. Kogbe CA. The upper cretaceous abeokuta formation of south-western Nigeria. Nigerian Field. 1974;4:4.
16. Kampsax K, Sshwed A. Hydrogeology of lagos metropolis. A report submitted to the Lagos State Ministry of Works and Planning; 1977.
17. Oteri AU. Interpretation of electric logs in aquifer of Dahomey Basin Nigeria. African Journal of Science and Technology. 1986; 2(Series B):54-61.
© 2019 Ilugbo et al.; This is an Open Access article distributed under the terms of the Creative Commons Attribution License (http://creativecommons.org/licenses/by/4.0), which permits unrestricted use, distribution, and reproduction in any medium, provided the original work is properly cited.
Peer-review history: The peer review history for this paper can be accessed here:
http://www.sdiarticle4.com/review-history/51709