Embed Size (px)
Citation preview
Graduate Theses, Dissertations, and Problem Reports
2020
Evaluation of Fitts’ Throughput as a Possible Performance Evaluation of Fitts’ Throughput as a Possible Performance
Measure for Manual Assembly Tasks Measure for Manual Assembly Tasks
Pradyumna Bettagere Jagadish West Virginia University, [email protected]
Follow this and additional works at: https://researchrepository.wvu.edu/etd
Part of the Ergonomics Commons, and the Industrial Engineering Commons
Recommended Citation Recommended Citation Bettagere Jagadish, Pradyumna, "Evaluation of Fitts’ Throughput as a Possible Performance Measure for Manual Assembly Tasks" (2020). Graduate Theses, Dissertations, and Problem Reports. 7919. https://researchrepository.wvu.edu/etd/7919
This Thesis is protected by copyright and/or related rights. It has been brought to you by the The Research Repository @ WVU with permission from the rights-holder(s). You are free to use this Thesis in any way that is permitted by the copyright and related rights legislation that applies to your use. For other uses you must obtain permission from the rights-holder(s) directly, unless additional rights are indicated by a Creative Commons license in the record and/ or on the work itself. This Thesis has been accepted for inclusion in WVU Graduate Theses, Dissertations, and Problem Reports collection by an authorized administrator of The Research Repository @ WVU. For more information, please contact [email protected].

i
Evaluation of Fitts’ Throughput as a Possible Performance Measure
for Manual Assembly Tasks
Pradyumna Bettagere Jagadish
Thesis submitted to the Benjamin M. Statler College of
Engineering and Mineral Resources at
West Virginia University in partial fulfillment
of the requirements for the degree of
Master of Science
in
Industrial Engineering
Ashish Nimbarte, Ph.D., Chair
Bhaskaran Gopalakrishnan, Ph.D.
Feng Yang, Ph.D.
Department of Industrial and Management Systems Engineering
Morgantown, West Virginia
November 2020
Keywords: Fitts’ Law, Throughput, Assembly Time, HTDT, Gloves
Copyright 2020 Pradyumna Bettagere Jagadish

ii
ABSTRACT
Evaluation of Fitts’ Throughput as a Possible Performance Measure for
Manual Assembly Tasks
Pradyumna Bettagere Jagadish
Assembly lines are the backbone of the manufacturing sector. Workers at the assembly lines are
expected to perform fast pace hand-arm exertions with precision and accuracy. To protect the
workers from injuries, OSHA mandates the use of personal protective equipment (PPE) including
gloves. Certain assembly operations require the use of special gloves. Some of these gloves can
inhibit hand performance, further increasing the task difficulty. The Index of Difficulty (ID) is a
metric measured in ‘bits’ quantifies task difficulty through the quotient of target width and target
motion, i.e., distance travelled. The time required to complete the target motion is the Movement
time (MT). The ratio of ID and MT was defined by Fitts as ‘throughput’ and is measured in bits/s.
This study aims to evaluate Fitts’ throughput as a possible performance measure for gloves used
in the manual assembly tasks. An experimental study was performed using fifteen healthy
participants with three types of gloves which were evaluated using two tests, Fitts’ throughput test
and a hand tool dexterity test (HTDT). The Fitts’ throughput test was designed using ISO 9241-
411 standard and involved a series of target transfer tasks with varying ID levels. In the HTDT
test, participants performed a simulated assembly task with different glove conditions. Statistical
analysis revealed that the effect of glove condition was significant for both throughput and
assembly time. The mean throughput of 3.91 bits/s for bare hand was higher compared to the three
glove conditions. Among the three glove conditions, Glove 2 was found to have a higher
throughput of 3.72 bits/s followed by Glove 1 with 3.51 bits/s, and Glove 3 with 3.47 bits/s. The
mean assembly times for Gloves 2, 1, 3 were 462.52 sec, 501.88 sec and 558.48 sec, respectively.
In general, an inverse relationship between throughput and assembly time was observed, indicating
that a glove with higher throughput produces lower assembly time. Thus, the study findings seem
to indicate that Fitts’ throughput can serve as a possible performance measure for manual assembly
tasks.

iii
DEDICATION
To my beloved family, Jagadish, Nalini, Prajwal and my grandparents for their endless
compassion, support and guidance.

iv
ACKNOWLEDGEMENT
I take this opportunity to thank all the people who have been instrumental in the endeavor
of completing my master’s degree. Firstly, I would like to extend my sincere gratitude to my
advisor, Dr. Ashish Nimbarte, for providing me an opportunity to work under him. His inspiration,
timely suggestions, and enthusiasm have enabled me to complete my research work. His constant
guidance, encouragement and support throughout the course of my graduate degree have helped
me achieve this feat.
I owe my deepest gratitude to Dr. Bhaskaran Gopalakrishnan who has played a pivotal role
in the betterment of my professional career. Along with my coursework, I have had the privilege
of working under his guidance in the field of energy efficiency that has increased my spectrum of
knowledge.
I would also like to thank Dr. Feng Yang for being a part of my research committee and
providing the necessary guidance for the successful completion of my thesis.
I am indebted to all the participants who volunteered to participate in this study. I would
like to thank my colleagues for their continued support and understanding during my term at the
Industrial Assessment Centre. I would also like to take this opportunity to thank Ms. Marie Owen
and Mr. Howard Franks for their constant assistance during my stay here at West Virginia
University.
I am profoundly grateful to all my family members, and friends for their moral support and
encouragement throughout the course of my academic endeavors.

v
Table of Contents
ABSTRACT ............................................................................................................ II
LIST OF TABLES ...............................................................................................VII
LIST OF FIGURES ........................................................................................... VIII
CHAPTER 1: INTRODUCTION ........................................................................... 1
CHAPTER 2: LITERATURE REVIEW .............................................................. 4
2.1 EFFECT OF GLOVES ON HAND PERFORMANCE ......................................................................... 4
2.2 USE OF GLOVES WHILE PERFORMING ASSEMBLY WITH HAND-TOOLS ...................................... 6
2.3 FITTS’ LAW ............................................................................................................................ 7
2.4 MANUAL HAND DEXTERITY .................................................................................................. 9
CHAPTER 3: STUDY RATIONALE ..................................................................11
CHAPTER 4: METHODOLOGY .......................................................................13
4.1 APPROACH ........................................................................................................................... 13
4.2 PARTICIPANTS ...................................................................................................................... 13
4.3 EQUIPMENT .......................................................................................................................... 14
4.4 EXPERIMENTAL DESIGN ....................................................................................................... 21
4.5 DATA COLLECTION PROCEDURE .......................................................................................... 21
4.6 DATA PROCESSING ............................................................................................................... 26
CHAPTER 5: RESULTS ......................................................................................29
5.1 INDEX OF DIFFICULTY .......................................................................................................... 29
5.2 EFFECT OF GLOVE CONDITION ON THROUGHPUT ................................................................. 31
5.3 EFFECT OF GLOVE CONDITION ON ASSEMBLY TIME ............................................................ 33
5.4 RELATIONSHIP BETWEEN THROUGHPUT AND ASSEMBLY TIME ............................................ 34
5.5 PERCEIVED DISCOMFORT ..................................................................................................... 37
5.6 SUBJECTIVE ASSESSMENT OF PARTICIPANTS........................................................................ 39
CHAPTER 6: DISCUSSION AND CONCLUSION ..........................................41

vi
6.1 SUMMARY ............................................................................................................................ 41
6.2 LIMITATIONS ........................................................................................................................ 45
6.3 PRACTICAL IMPLICATIONS ................................................................................................... 46
6.4 CONCLUSIONS ...................................................................................................................... 47
BIBLIOGRAPHY ..................................................................................................48
APPENDIX I: IRB PROTOCOL .........................................................................52
APPENDIX II: GLOVE SIZING .........................................................................54
1. GLOVE SIZE GUIDE USED FOR GLOVE 1 .................................................................................. 54
2. GLOVE SIZE GUIDE USED FOR GLOVE 2 .................................................................................. 55
3. GLOVE SIZE GUIDE USED FOR GLOVE 3 .................................................................................. 56
APPENDIX III: HAND TOOL DEXTERITY TEST SCORES .......................57
APPENDIX IV: TEST FOR NORMALITY AND EQUALITY OF
VARIANCE OF THROUGHPUT .......................................................................60
APPENDIX V: EXPERIMENT DATA ...............................................................61

vii
List of Tables
Table 1: Anthropometric Measurements of Participants .............................................................. 13
Table 2: Statistical power of test for different sample sizes ......................................................... 14
Table 3: Target acquisition plate layout and ID values ................................................................ 17
Table 4: Target transfer sequence ................................................................................................. 23
Table 5: Subjective questionnaire based on 5-point Likert scale ................................................. 25
Table 6: Discomfort ratings based on Borg CR-10 scale ............................................................. 25
Table 7: Summary Statistics for Effective Index of Difficulty ..................................................... 30
Table 8: Summary of Fit – Glove Condition v/s Throughput ....................................................... 32
Table 9: ANOVA and Mean Pairwise Comparison of Throughput ............................................. 32
Table 10: Summary of Fit – Glove Condition v/s Assembly Time .............................................. 33
Table 11: ANOVA and Mean Pairwise Comparison of Assembly Time ..................................... 33
Table 12: Descriptive Statistics for Assembly Time .................................................................... 34
Table 13: Correlation Analysis between Throughput and Assembly Time .................................. 36
Table 14: ANOVA for Perceived Discomfort Ratings ................................................................. 38
Table 15: Summary of Fit – Glove Condition v/s Perceived Discomfort..................................... 39
Table 16: Response for Subjective Questionnaire based on a 5-point scale*............................... 40
Table 17: Test for equality of variance ......................................................................................... 60

viii
List of Figures
Figure 1: Glove 1 .......................................................................................................................... 15
Figure 2: Glove 2 .......................................................................................................................... 15
Figure 3: Glove 3 .......................................................................................................................... 16
Figure 4: Physical Layout of Target Transfer Task Plate ............................................................. 16
Figure 5: Hexagonal Bolts used as Targets in Test-1 ................................................................... 17
Figure 6: Microscribe Digitizer .................................................................................................... 17
Figure 7: Rhinoceros 3D Screenshot ............................................................................................ 18
Figure 8: Target transfer task plates .............................................................................................. 19
Figure 9: Experimental Setup (1: Target acquisition task plate, 2: Microsribe Digitizer, 3: HTDT,
4: Laptop with Rhino 3D Software, 5: Scissor Lift) ..................................................................... 19
Figure 10: Hand Tool Dexterity Test Apparatus .......................................................................... 20
Figure 11: Position and posture of participants during the study (1: Participant, 2: Gloves 3:
Target Transfer Task Plate, 4: Hex Bolts) .................................................................................... 22
Figure 12: Participant posture while performing the HTDT ........................................................ 24
Figure 13: Geometry for a Target Transfer Task .......................................................................... 27
Figure 14: Linear fit of effective index of difficulty (IDe) with movement time (MT) ............... 30
Figure 15: Linear fit of effective index of difficulty (IDe) with normalized movement time ...... 31
Figure 16: 95% Confidence Interval of Throughput for all Glove Conditions ............................. 32
Figure 17: 95% Confidence Interval of Assembly Time for all Glove Conditions ...................... 34
Figure 18: Linear fit of assembly time with throughput (TP) ....................................................... 35
Figure 19: Linear fit of assembly time with throughput (TP) without Glove 3 ............................ 36
Figure 20: Correlation analysis of throughput (TP), assembly time, and normalized assembly
time ............................................................................................................................................... 37
Figure 21: Summary of discomfort ratings of all participants ...................................................... 38
Figure 22: 95% Confidence Interval of Discomfort Rating for all Glove Conditions .................. 39
Figure 23: Normal quantile plot of conditional residuals of throughput ...................................... 60

1
Chapter 1: Introduction
Routine exercises and working activities require high coordination of hand muscles to
execute grasping activities. Assembly line workers, mechanics, construction workers, and many
others are occupationally required to perform activities that entail repetitive motions of their hands.
Additionally, workers who are involved in the operation of hand-held power tools are exposed to
continuous vibrations over the course of their work. Working activities that are hand intensive
often lead to health risks such as swelling, pain, and limited movement in the affected muscles.
Repetitive or overuse injuries occur from repeated microtrauma that exceeds the tissues’
ability to adapt. Such Repetitive injuries have been a major obstacle in production assembly lines
all over the world. These injuries often result in symptomatic regional problems, such as carpal
tunnel syndrome, epicondylitis, myofascial pain disorders, bursitis, and stenosing tenosynovitis
which have greatly reduced the production efficiency of assembly plants and also negatively
affected human health. Repetitive tasks may aggravate naturally occurring disorders like
osteoarthritis, rheumatoid arthritis, ganglion formation, etc. But in such disorders, overuse is not
the primary cause.
Approximately, 20% of reported workplace injuries are to the hands and fingers, ranking
second in lost workdays [1]. In 2017, over 120,000 workers reported hand injuries, resulting in a
median of 5 days away from work. Among all the reported hand injuries, 70% were caused by not
wearing any type of hand protection, and 30% were due to wearing the wrong type of glove [2].
Not only do workers suffer the pain of these injuries, but companies experience financial losses
and a decrease in productivity. It is estimated that lacerations, punctures, fractures, and crushing
injuries cost $40,000, $47,700, $101,800, and $118,700, per year, per incident, respectively [2].
In addition to these injury costs, workers’ overall health and task efficiency is
compromised, which leads to a significant decrease in production. Many companies are closing,
and jobs are being lost for which one factor often cited is the cost of worker compensation. The
human body can be considered as a complex system with mechanisms involving joints and links

2
controlled by a central nervous system. These mechanisms are naturally subject to stress, strain,
fatigue, and failure as any other piece of industrial machinery undergoes over its life cycle.
To inhibit the effects caused using hand-held tools and other physical work performed by
workers, industries enforce the use of PPE (personal protective equipment) for workers while on
the job. Gloves are worn for a wide variety of assembly tasks. Hence, it is important to consider
the effect of working with hand-held tools while wearing gloves. Manual dexterity (or fine motor
skills) is defined as the ability to coordinate hand and finger movements to grasp and manipulate
objects using muscular, skeletal, and neurological functions. It is a fundamental developmental
skill that involves the cognitive ability to plan and execute tasks, beginning with gross motor
movements, and proceeding with fine motor movements [3].
The human hand represents a mechanism of the most intricate fashioning and one of great
complexity and utility. The complex interaction of biological, neurological, and mechanical
features enables quick movement and dexterous manipulation. The human hand is made up of a
total of 27 individual bones: 8 carpal bones, 5 metacarpal bones and 14 "finger bones" (also called
phalanges) are connected by joints and ligaments. As a result of this complex structure, once
damaged, the human hands are very difficult to repair. Post repair, the hands may not function as
well as they did originally.
Research indicates that various factors may impede manual hand dexterity, including the
use of gloves. Literature states that the use of gloves influences the dexterity of the human hands
and concluded that material, thickness, weight, and composition of a glove are the key factors
causing it. Although gloves provide personal protection from hand injuries, it is to be noted that
working with bare hands yields greater dexterity. Additionally, hand movement and dexterity
involve a cognitive aspect, which is the mental process and actions related to the manipulation of
information, leading to the preparation, control, and execution of movement.
In this study the relationship between Fitts’ throughput and assembly time has been
examined with a goal of evaluating Fitts’ throughput as a possible performance measure of tasks
that need both speed and accuracy. Fitts’ law states that the time required to rapidly move to a
3
target area is a function of the ratio between the distance to the target and the width of the target.
Fitts also proposed an index of performance, also known as throughput, that combines a tasks’
index of difficulty (ID) with the movement time (MT) in selecting a target. Literature states that
throughput is independent of the speed-accuracy tradeoff [4]. In 1966, Fitts’s and Radford’s
experiment concluded that the performance measured in information rate is almost identical in all
cases for movements of immediate difficulty executed under all three instructional sets for speed
vs accuracy [5].
Human motor control is a skill developed throughout one’s life. The use of gloves usually
hinders this process, as the best fitting gloves should imitate the anatomy of the hand, like an
extension of the skin. The ergonomic properties of gloves are currently assessed by methods of
manual dexterity tests such as picking up objects of different sizes within a specified time span to
determine dexterity of fingertips. Researchers have developed several tests to measure the
dexterity of workers in a lab setting or a simulated environment. The Hand Tool Dexterity Test
(HTDT) is one such test that consists of a series of nuts, bolts, and washers of different sizes
fastened into a ‘U’ shaped wooden frame with the nuts on the inner side of the frame. The test
requires participants to loosen and disassemble parts using hand and tools combination and
reassemble the parts on the other side of the frame using the same hand and tool combination
within a specified time span following which it is scored based on the test’s standardized scoring
system.
The existing manual dexterity tests, such as HTDT, are quite time consuming and subjected
to errors due to interindividual differences such as experience, training, learning effects etc. Fitts’s
throughput test, once standardized, can be completed within a few minutes and is independent of
factors such as experience or training as it only involves very basic target transfer tasks. Therefore,
in this study an attempt was made to compare Fitts’s throughput test, which is designed based on
the ISO 9241-411 standard, with manual dexterity test. The results of this study could further help
ergonomists, glove manufacturers, and personnel from industries to make recommendations and
improvements on future industrial assembly glove designs.

4
Chapter 2: Literature Review
The use of gloves is recommended to protect the hands from hazards, provided that the use
of tools is effective and consistent. Most of the existing literature on the effect of gloves on human
attributes such as dexterity, grip, fatigue, and a range of other hand movements deals with the total
task completion time and force exertion.
2.1 Effect of gloves on hand performance
Industrial assemblers, machinists, medical doctors, farmers, and construction workers use
gloves in different workplaces to protect their arms and hands from chemicals, heat, cold, and
physical harm such as cuts, blisters, and other fatal injuries [6] [7] [8]. However, the use of gloves
affects various aspects of hand performance. The effect of glove use on hand performance has
been investigated in previous studies. Schoenmarklin and Sudhakar [8] concluded that a certain
amount of muscle force was lost while performing activities wearing gloves based on the
measurement of normalized peak and mean muscular activities taken from isometric contractions.
Fleming et al. concluded that glove type and hand grip contraction had an effect on physiological
fatigue and the subjective perception of fatigue [9].
To determine the ability to distinguish between various weights while wearing different
types of gloves (rubber, nylon, cotton, leather, Kevlar and surgical) Wang and Shih conducted an
experiment where participants were asked to lift weights ranging from 0.25 to 8.2kg
simultaneously with both their hands. The authors concluded that there was no effect of the type
of glove used on the ability of the fingers to differentiate between the different weights. The
authors further proposed that for the type of task the participants performed, the heaviness of the
weights lifted by the participants may have been perceived through hand and arm motor activity
instead of the fingers alone [10].
Mittal and Nelson conducted a similar experiment in 1995 to compare the effect of glove
thickness on the tactile sensitivity and dexterity while lifting objects with different textures. The

5
authors concluded that the glove thickness had infinitesimal effect on the ability of participants to
identify and grasp the size and texture of objects. Additionally, the authors also found that the type
of gloves did not affect the time required to use scissors to cut a specified shape [11].
However, in 1994, Bishu et al investigated the effect of various types of gloves on hand
performance while performing the Jebsen’s test. The authors concluded that the gloves resulted in
motor impairments. The authors found that while performing tasks such as flipping cards, stacking
checkers, picking up and moving small objects, the latex gloves had a better performance in
comparison to other gloves with greater thickness [5]. Similarly, Phillips et al. concluded that
tactile performance with multiple latex gloves in comparison to a single or no glove condition
resulted in the deterioration of sensory performance. Additionally, motor performance was also
found to be deteriorated while wearing multiple latex gloves in comparison to a single or no glove
condition. However, it was concluded that the motor performance was affected to a lesser extent
in comparison to that of sensory performance [12].
While there is some agreement that dexterity and control capacity are diminished with
glove use, the creation of power in general is found to be unaffected. While some studies have
shown that the use of gloves deteriorate the performance of hands, there are others which conclude
that there are no motor impairments. A possibility for this result could be the presence of haptic
input in motor performance. Nelson, Mittal and Phillips concluded that there is an evident effect
of gloves on the motor performance. There could be other reasons for the variety of results obtained
in the relationship between the use of gloves and motor performance. One such variation may be
related to the testing method for motor performance. In all the above experiments conducted by
the authors, the result was solely examined and used as the basis for conclusions. However, the
experimental results did not include the process through which these conclusions were obtained.
Only in Bronkema’s et al. study was the actual force produced by the hands during the process
was measured.

6
2.2 Use of gloves while performing assembly with hand-tools
Assembly mostly involves the use of intensive hand tools to assist workers finish their tasks
efficiently [13]. Although power hand tools are used widely in industries, manual hand tools are
still used on a routine basis. Screw drivers are widely used in a number of occupations, such as
electronics and automobile assembly, maintenance and repair activities and construction work.
Screwdrivers can be used either with a precision grip for fine tasks or with a power grip for torque
exertion [14]. It is to be noted that a considerable force is required to maintain a firm grip of the
hands during a torsional use of the screwdriver. Additionally, an intricate use of both dexterity and
tactile feedback are necessary for optimal operation. In some screwdriver operations, workers are
required to wear gloves for protection. In some cases, gloves may be used for comfort when
screwdrivers are used intensively over long shifts. The effect of screwdrivers on the various aspects
of hand performance have been examined by various researchers over the past years.
It is important to consider the effect of the usage of gloves while working with hand tools.
There have been studies in the past that investigated the effects of gloves on characteristics of hand
performance. A study by Mittal et al, that used electromyographic (EMG) measures to investigate
the level of muscle activation did not report on any significant effect of gloves on muscle activity
levels. However, similar studies by Lariviere et al [16] and Wells et al [17] found an increase in
muscle activity while performing tasks using gloves. A study by O’Hara concluded that gloves
may interfere with finger and joint extension movements.
Furthermore, research by Cochran et al, Tsaousidis and Freivalds, Kovacs et al, Chang and
Shig, Wimer et al, have shown that gloves are likely to reduce grip strength. The change in tactile
sensitivity can be attributed to the additional thickness of the glove material due to which the
ability to detect changes in touch can be inhibited [15] [16] [17]. Another reason for losing the
sense of touch is the result of adaptation to a task. This could be because of persistent use of hands
and arms to perform a task with repeated arm extensions of the same amplitude leading to loss of
sensation [16].

7
Although gloves are worn to protect the hand from possible injuries, they may also be worn
for comfort while using hand tools that cause discomfort (Bishu et al, Chang et al, Berger et al).
In addition to improving the safety of workers, gloves possibly have effects on hand performance.
The material of gloves is chosen based on the type of task performed by workers. Research shows
that cotton and nylon are the two most common types of gloves used for assembly tasks (Chang et
al). Riley and Cochran recommended the use of light weight gloves made of rubber, plastic or
leather to improve dexterity and sensitivity.
In another study by Plummer et al, it was concluded that glove types had a significant effect
on the time required to complete the hand tool dexterity test (HTDT) [17]. The authors investigated
nine glove combinations on manual dexterity. Subjects performed the HTDT using single and
double glove combinations to evaluate the effect of gloves in handling hazardous materials.
2.3 Fitts’ Law
Fitts’ Law is a predictive model of human movement primarily used in human-computer
interaction and ergonomics [21]. The law predicts that the time required to rapidly move to a target
area is a function of the ratio between the distance to the target and the width of the target [4].
Nonetheless, Fitts’ Law is mainly focused on human-computer interaction for simulated tasks
rather than human improvements. It has widely been known to quantify performance in tasks
involving pointing and target acquisition. The difficulty of performing these target acquisition
tasks was quantified as the Index of Difficulty using the information metric bits. Based on
Shannon’s theorem [18], the ID for human movement during tasks involving target selection was
estimated as follows:
𝐼𝐷 = 𝑙𝑜𝑔2 (𝐴
𝑊+ 1) Equation 2.1
With the log-term in equation 1, the units for ID are in bits as the units within parenthesis
are dimensionless and the log is taken to the 2nd base. Furthermore, Fitts’ termed the rate of

8
transmission of information as throughput and mathematically expressed as the ratio of ID and
movement time for a sequence of a task and expressed as bits/s [4].
Most studies involving Fitts’ law involve simulated tasks created on a computer or a virtual
reality display. Literature states that most authors in the past have focused on evaluating the design
of pointing devices in a digital setting. Although the methodology in previous studies focus on the
user to drive displacement over varying distance to targets of different widths, the target
boundaries specify the amount of tolerable endpoint variability [19]. Researchers in the past have
applied Fitts’ Law as a predictive model and as a part of the comparison and evaluation of pointing
devices. As a predictive model, Fitts’ law can be used to predict the time required to move a
pointing device in a graphical interface and select a particular point on it. Previous studies of the
predictive model include the study of cursors, study of an eye tracker as a computer input device
[20], and the study of trajectory-based movement in a human-computer interface [21]. Literature
indicates that a logarithmic relationship exists between movement time and width of the target.
Whereas trajectory-based movements had a linear relationship between movement time and width.
Each of these studies involved subjects performing a task where they were required to move the
cursor to point a target on the screen. In the above case, the width of the targets and the distance
between the targets were considered as independent variables.
Similar studies have been performed in a digital setting by MacKenzie et al. to evaluate the
throughput of a joystick, touchpad, trackball, and a mouse based on Fitts’ throughput ISO standard
[22]. The authors claimed that the performance of the mouse was the best compared to other
devices. Johnsgard compared the movement of the virtual Mattle Power Glove with a mouse [23].
The author observed a lower movement time of the glove compared to the mouse. He concluded
that rather than using the glove, it was more beneficial to rest one’s arm while using a mouse.
Fitts’ throughput can be defined as the ratio of the index of difficulty and the movement
time. MacKenzie et al. (2008) demonstrated a relationship between speed, accuracy, and
throughput. The authors produced an equation for throughput which combined speed and accuracy
in a single measure computed over repeated trials and came up with the following equation:
9
𝑇𝑃 =𝑙𝑜𝑔2(
𝐴𝑒4.133 𝑥 𝑆𝐷𝑥
+1)
𝑀𝑇 Equation 2.2
The numerator is the “effective index of difficulty” and includes 𝐴𝑒 as the distance or amplitude
of movements [24]. The authors used the traditional Fitts’ law’s tapping task with a nominal Index
of Difficulty (ID) of 4.24 bits. However, the authors performed the task in a digital setting using a
red cross controlled by a mouse. At the end of the experiment, it was concluded that there was a
highly significant effect of cognitive set on movement time. There was also a significant effect of
cognitive set on accuracy. The study concluded that there is no significant effect of cognitive set
on throughput. This further implied that throughput is independent of the speed-accuracy tradeoff.
2.4 Manual Hand Dexterity
Manual dexterity is defined as “the ability to make coordinated hand and finger movements
to grasp and manipulate objects” [3]. Over the past years, a few manual dexterity tests have been
created and tested. These testing strategies center around evaluating the manual dexterity of
individuals, primarily for pre-screening workers for positions that require fine motor abilities,
finger, hand, and arm coordination.
The hand tool dexterity test (HTDT) developed by Lafayette instruments aims to measure
the proficiency of workers with the use of common mechanical tools. The test also measures gross
movement of fingers, hands, and arms. Subjects are required to loosen, transfer, and tighten nut-
and-bolt assembly. Millard and Vaughan performed a study to assess protective gloves used with
air-fed suits [25]. The study consisted of 15 participants that performed a combination of manual
dexterity tests to assess two types of gloves worn with air-fed suits. Participants performed five
manual dexterity tests: first, the nine-hole peg test. This test measured gross movement of fingers,
hands, and arms. It consists of a large cup with nine nylon pegs, and a square array of sockets.
Subjects had to place pegs in the pegboard in a specified order and the time was recorded. The
second test was a Pin Test form European standard (EN 420 pin test). This test consisted of five
steel pins (length 40 mm) with diameters of 11, 9.5, 8, 6.5, and 5mm. The experimenters also
added two smaller pins (3.5 mm and 2 mm) to the test. Subject were required to pick up each pin

10
in a decreasing diameter order, pinching it between the thumb and index finger, three times within
30 seconds. If the subject was successful, they would move on to the next pin, otherwise the test
was concluded. The third test was The Purdue Pegboard Test. For this test, subjects were required
to pick up as many pins as possible and place them in in the pegboard within 30 seconds. The
fourth test performed was The Minnesota Turning Test, which includes a board with 60 holes
containing discs. Subjects were required to pick up the discs and turn them over with one hand,
and then placing it back in the same hole with the other hand. The time it took to complete the test
was recorded to analyze rapid-hand co-ordination and arm-hand dexterity. The last test was the
Hand Tool Dexterity Test which consisted of a wooden frame with holes to fit three different sizes
of washers and bolts towards the inside of the frame. Subjects had to use tools to tighten the bolts
and scored based on the time it took to remove and replace all the bolts. From this study, the
authors concluded that wearing any one of the tested gloves reduced the performance of dexterity
compared with bare hands.
Past studies have tried to evaluate subjects’ ability to perform complex adaptive skills using
two complex manual tests [26]. Crawford Small Parts Dexterity Test and the Bennett Hand-Tool
Dexterity tests are two examples of complex manual hand dexterity tests that require complex
coordination and control. The Crawford Small Parts Dexterity Test evaluates the ability of users
using a small pair of tweezers and screwdrivers to manipulate pins, collars, and small screws. The
Bennett Hand-Tool Dexterity Test on the other hand evaluates users based on their ability to
continuously use tools to fasten and loosen larger nuts and bolts. The Hand-Tool Dexterity Test
requires skills that are used in a wide variety of jobs not limited to the industrial scenario, but also
for homes and offices. Hence this test has been used in this study to simulate an assembly task an
evaluate individual participant performance in terms of Fitts’ throughput.
11
Chapter 3: Study Rationale
Hand injuries account for over 20% of reported workplace injuries. They constitute the
highest number of preventable injuries in terms of lost workdays [2]. In addition to causing
discomfort and pain, these injuries cost a lot to companies and workers in terms of medical
expenses. All manufacturing scenarios where workers’ hands are exposed to hazards pose a risk
of losing on productive workdays and labor costs [26]. Basic personal protective equipment (PPE)
such as gloves minimize the risk of hand injuries. The use of PPE helps protect workers from
workplace hazards such as machines, work procedures, and hazardous substances that can cause
injuries [27], but also reduce hand performance significantly [17].
Previous studies have indicated that use of gloves affect hand and finger dexterity, which
lead to a decrease in work performance compared to bare hands. Glove material, thickness, and
weight, although highly effective against hand injury, are among the factors that could contribute
to the reduction of dexterity. Although previous studies have investigated the effects of various
types of protective gloves on dexterity, the relationship between Fitts’ throughput (as a
performance measure) and assembly time using gloves is not known. Fitts’ throughput combines
speed and accuracy during a target transfer task into one performance measure. Thus, knowing a
relationship between Fitts’s throughput and assembly time may be useful in having a new
performance measure (in terms of throughput) for evaluating and comparing gloves that are used
in assembly tasks with speed and accuracy requirements. Therefore, this study focuses on
identifying a relationship between Fitts’ throughput and assembly time.
The objectives of this study are:
i. To measure Fitts’ throughput using an experimental setup based on ISO 9241-411 standard
for different glove conditions
ii. To measure manual assembly time using HTDT for different glove conditions
iii. To examine the relationship between Fitts’ throughput and assembly time for different
glove conditions

12
The following hypotheses were examined in this study:
i. Null Hypothesis H01: Glove condition will have no effect on the throughput and assembly
time.
ii. Alternative Hypothesis HA1: Glove condition will have an effect on the throughput and
assembly time.
iii. Null Hypothesis H02: Fitts’ throughput will have no relationship with assembly time.
iv. Alternative Hypothesis HA2: Fitts’ throughput will have a linear relationship with assembly
time.

13
Chapter 4: Methodology
4.1 Approach
A laboratory-based study consisting of two independent manual experiments (Test 1 and
Test 2) was performed to evaluate the relationship between Fitts’ throughput and assembly time
considering the effect of gloves (with and without gloves). For Test 1, a target acquisition task
(based on ISO 9241-411) was performed to estimate the throughput for different glove conditions.
For Test 2, the manual hand-tool dexterity test (HTDT) was used to measure assembly time for
different glove conditions.
4.2 Participants
A total of 15 subjects (approximately 67% male and 33% female) were recruited to
participate in this study. Participants were all students attending West Virginia University and free
from any injury or pain to the hands and fingers, as well as musculoskeletal and neurological
disorders. All participants were consented using a form approved by West Virginia University
Institutional Review Board (IRB). Table 1 summarizes the age and anthropometric measurements
of participants.
Table 1: Anthropometric Measurements of Participants
Variable Mean Standard Deviation
Age (year) 25.73 2.63
Weight (kg) 69.15 18.04
Height (cm) 166.72 10.36
Knuckle Width (cm) 7.72 0.86

14
4.2.1 Determination of Sample Size and Analysis of Statistical Power
Operating Characteristic (OC) Curves were used to select the appropriate sample size and
determine the statistical power of the test. The following formula was used to perform calculations
[33].
Φ2=nD2
2aσ2
Equation 4.1
Where,
Φ2: non-centrality parameter
n: sample size or number of participants
D: minimum difference between treatment means beyond which null hypothesis should be rejected
a: number of levels of treatment factor
σ2: variance estimate
Based on literature review, value of D equal to 1 bps and value of σ2 equal to 0.5 was
chosen. The significance level of the test was set at α = 0.5. Table 3-2 shows the statistical power
values corresponding to different sample sizes. The results suggest that for sample size of 15,
power of the test will be 93%.
Table 2: Statistical power of test for different sample sizes
n Φ2 Φ a-1 a(n-1) β Power = (1-β)
9 3.00 1.73 2 24 0.30 0.70
11 3.67 1.91 2 30 0.19 0.81
13 4.33 2.08 2 36 0.15 0.85
15 5.00 2.24 2 42 0.07 0.93
4.3 Equipment
4.3.1 Assembly Gloves
Three types of industrial assembly gloves were tested in this experiment. Additionally,
baseline data was collected using bare handed (no glove) condition. The gloves were selected such
that they have different mechanical characteristics (material, overall design, weight etc.).

15
1. Glove 1 (Figure 1) is a composite-knit glove that is ideal for moderate cut applications such
as handling metal stamping, glass and sharp materials. It consists of a rubberized coating
that provides superior grip in wet and dry conditions. The glove is ideal for assembly,
construction, inspection, material handling, etc.
Figure 1: Glove 1
2. Glove 2 (Figure 2) is a made of a soft and durable mesh fabric optimal for comfort and
flexibility. The glove consists of synthetic leather around the palm area, protecting
vulnerable wear and tear zones. The glove is ideal to be used for automotive, engineering,
food processing, manufacturing, and other similar tasks.
Figure 2: Glove 2
3. Glove 3 (Figure 3) is a synthetic leather glove that has reinforcements around the tips of
fingers. The crotch area in between the index and the thumb fingers are reinforced to

16
prevent punctures. The glove is ideal to be used for assembly, engineering, food processing,
automotive, and other similar tasks.
Figure 3: Glove 3
4.3.2 Target Acquisition Task
The setup for Target Acquisition Task consists of 2.5 mm steel task plates, a micro scribe
digitizer, and a scissor lift table (Figure 9). The target transfer task plate was placed on a scissor
lift and the height of scissor lift was approximately adjusted to the participants’ waist height.
The steel plates were affixed with printed hexagonal pattern. The pattern consists of 12
hexagons (to mimic hex-bolts) in circular layouts (Figure 4,8). Four task plates were used. Table
3 provides the values of amplitudes (A) and target widths (W) used in the plates.
Figure 4: Physical Layout of Target Transfer Task Plate
Amplitude (A)
Width (W)
17
Table 3: Target acquisition plate layout and ID values
Target Acquisition
Plate number
Amplitude (mm)
(A)
Target width (mm)
(W)
Index of Difficulty
(ID)
1 279.40 38.10 3.06
2 406.40 38.10 3.54
3 381 19.05 4.39
4 533.40 12.70 5.43
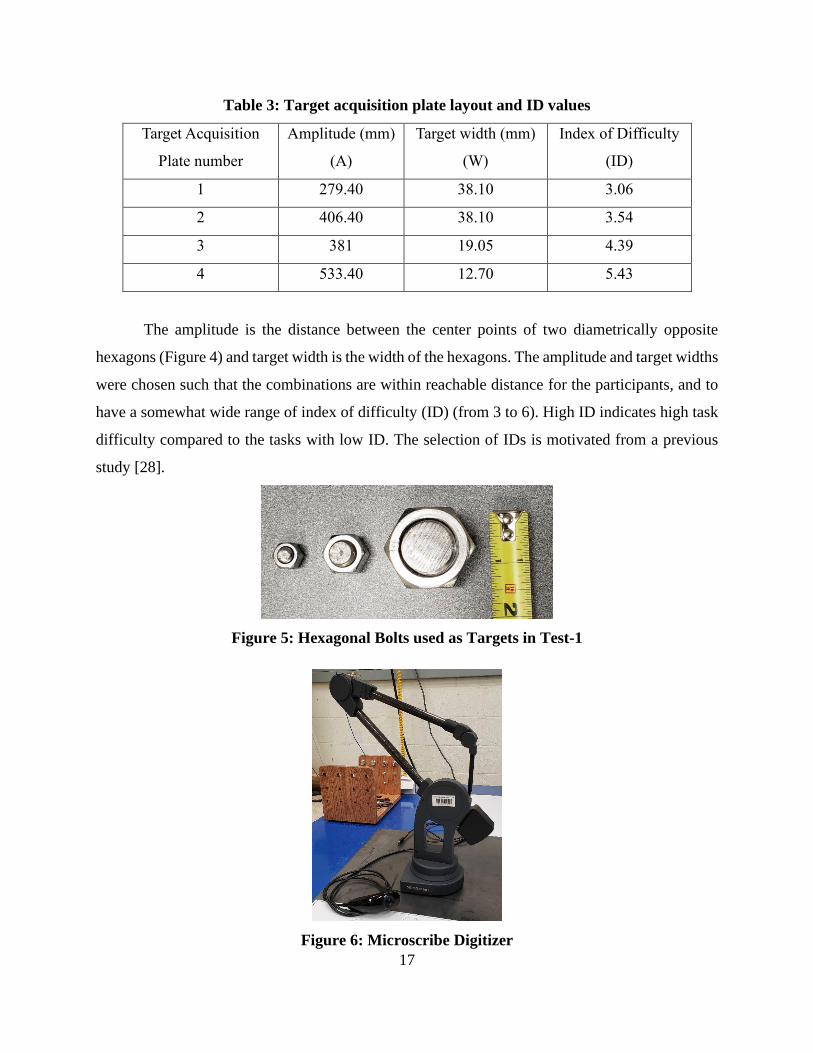
The amplitude is the distance between the center points of two diametrically opposite
hexagons (Figure 4) and target width is the width of the hexagons. The amplitude and target widths
were chosen such that the combinations are within reachable distance for the participants, and to
have a somewhat wide range of index of difficulty (ID) (from 3 to 6). High ID indicates high task
difficulty compared to the tasks with low ID. The selection of IDs is motivated from a previous
study [28].
Figure 5: Hexagonal Bolts used as Targets in Test-1
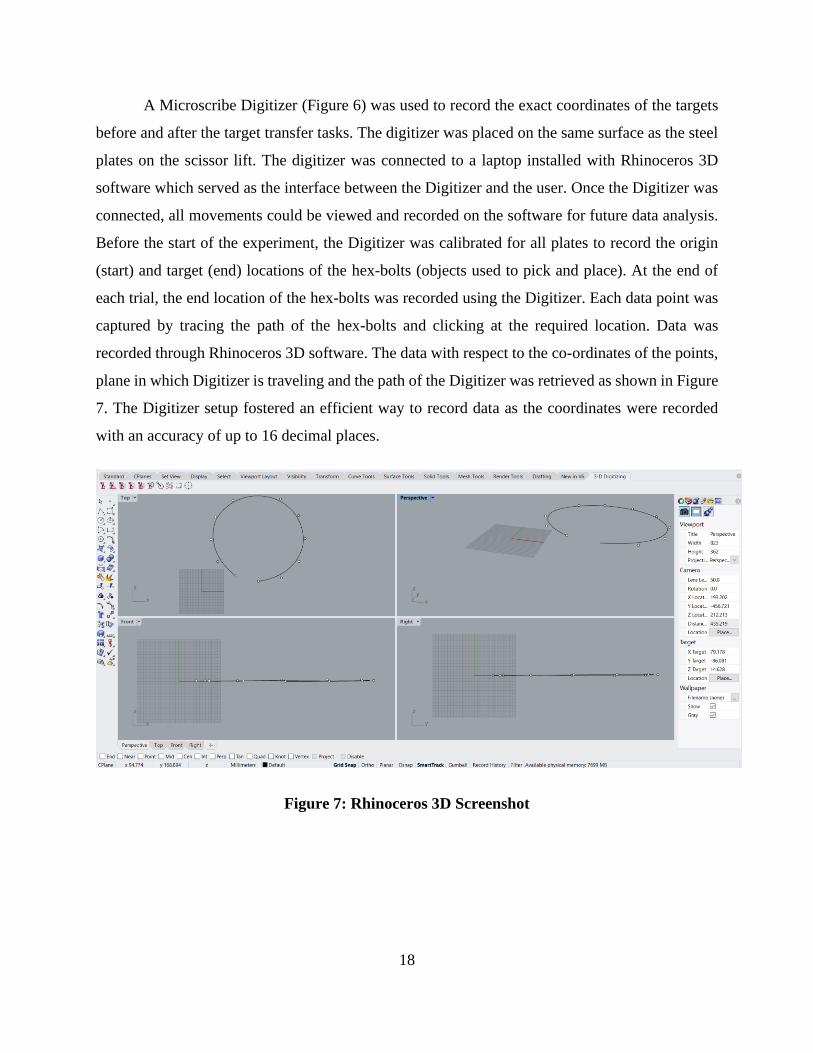
Figure 6: Microscribe Digitizer
18
A Microscribe Digitizer (Figure 6) was used to record the exact coordinates of the targets
before and after the target transfer tasks. The digitizer was placed on the same surface as the steel
plates on the scissor lift. The digitizer was connected to a laptop installed with Rhinoceros 3D
software which served as the interface between the Digitizer and the user. Once the Digitizer was
connected, all movements could be viewed and recorded on the software for future data analysis.
Before the start of the experiment, the Digitizer was calibrated for all plates to record the origin
(start) and target (end) locations of the hex-bolts (objects used to pick and place). At the end of
each trial, the end location of the hex-bolts was recorded using the Digitizer. Each data point was
captured by tracing the path of the hex-bolts and clicking at the required location. Data was
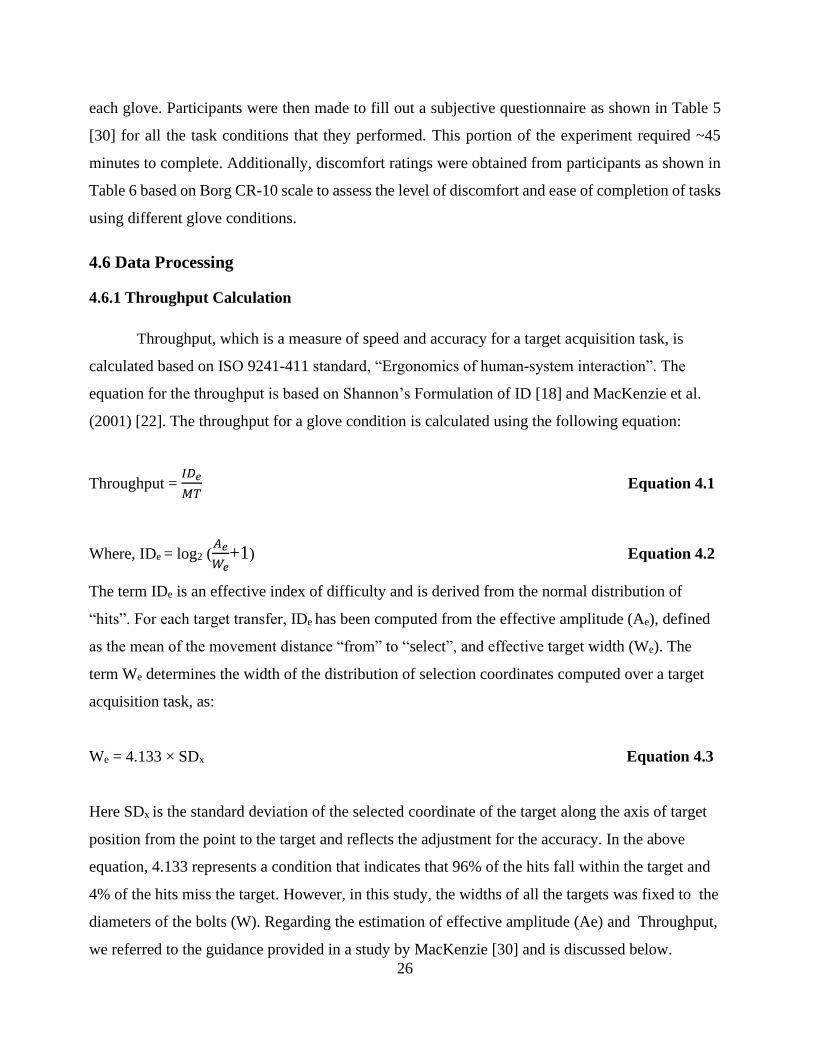
recorded through Rhinoceros 3D software. The data with respect to the co-ordinates of the points,
plane in which Digitizer is traveling and the path of the Digitizer was retrieved as shown in Figure
7. The Digitizer setup fostered an efficient way to record data as the coordinates were recorded
with an accuracy of up to 16 decimal places.
Figure 7: Rhinoceros 3D Screenshot

19
Plate 1: ID – 3.06 Plate 2: ID – 3.54 Plate 3: ID – 4.39 Plate 4: ID – 5.43
Figure 8: Target transfer task plates
Figure 9: Experimental Setup (1: Target acquisition task plate, 2: Microsribe Digitizer, 3: HTDT, 4: Laptop with Rhino 3D
Software, 5: Scissor Lift)
1
4
2
5
3

20
4.3.3 Hand Tool Dexterity Test
The Hand-Tool Dexterity Test (HTDT) provides a measure of proficiency in using ordinary
hand-tools. The participants performed the task in standing position such that their point of view
was parallel to the HTDT apparatus and the worktable was adjusted to the participants’ waist height
from the ground level. The HTDT uses a ‘U’ shaped wooden frame (Figure 10) whose ends contain
three rows of different holes into which bolts are inserted along with a washer and nut that are
positioned and tightened on the other end of the bolt. The HTDT uses three sizes of nuts, washers,
and bolts. Each bolt size matches the size of one row of the drilled holes and each row consists of
four holes making it twelve holes on each side of the ‘U’ shaped frame. This task required the
participants to disassemble and assemble twelve bolts. The tools which the participants used to
loosen and tighten the nuts and bolts were of two sizes: two open-end wrenches, one adjustable
wrench and a screwdriver. The participants were instructed to use a specific set of tools for each of
the three different size nuts and bolts. The bolt sizes were of 1/2-inch diameter by 2 ¾ inches long,
5/16-inch diameter by 2 5/8 inches long and 1/4-inch diameter by 2 1/8 inches long. The 1/4-inch
diameter bolt has a slotted head and required the use of a screwdriver.
Figure 10: Hand Tool Dexterity Test Apparatus
A standardized scoring system for this test has been developed by Lafayette Instruments, the
company that developed the HTDT. The scoring on this test is based on the amount of time that it
takes the participants to remove the nuts and bolts from the left upright and mount them on the right

21
upright of the assembly plates. The time was recorded by starting the clock as soon as the
participants picked up the first wrench and stopped the clock when the last bolt was tightened.
4.4 Experimental Design
The experiment consisted of two tests: target acquisition (Fitts’s throughput) test and
HTDT test. Throughput is the dependent variable for the target acquisition test. Assembly time is
the dependent variable for the HTDT. The glove condition is the independent variable for both tests
and is treated at 4 levels (a) No glove, (b) Glove 1, (c) Glove 2, and (d) Glove 3. For the target
acquisition test, 48 trials were completed (4 IDs × 4 glove conditions × 3 repetitions) for an
individual participant in a random order. For HTDT, 4 trials were completed for an individual
participant in a random order. The order of the tests was also randomized between the participants.
Participants took an average of 2 hours to complete the experiment: 1.25 hours for target acquisition
test and 0.75 hours for HTDT.
4.5 Data Collection Procedure
Upon arrival, participants were briefed about the rationale of the study, the experimental
apparatus, data collection procedure, and the tasks they would perform over the course of the
experiment. Participants were then asked to read through the IRB consent form and were requested
to sign at the end of it. A set of anthropometric measurements with respect to height, body weight,
age, and hand measurements were recorded for each participant. Based on the participants’ palm
measurements, gloves were assigned based on the guidance from the glove manufacturer’s size
chart. The size charts for all the gloves used in this study are provided in Appendix II.
4.5.1 Target Acquisition Task Setup
For target acquisition test, the participants were instructed to stand parallel to the target
acquisition task plates placed on a scissor lift such that their point of view was midway to either
edges of the task plates as shown in Figure 11. Participants were advised to maintain a set distance
from the worktable such that their hips do not come in contact with the worktable and were asked

22
to perform the tasks while standing behind a marked line on the floor. The task was required to be
completed using the dominant hand of the participants and they were insisted to grasp targets using
only their thumb, index, and middle fingers. Each participant was allowed to perform practice trials
to familiarize themselves with the task.
Figure 11: Position and posture of participants during the study (1: Participant, 2: Gloves 3:
Target Transfer Task Plate, 4: Hex Bolts)
Each target transfer task for a plate consists of 12 target transfers (pick and drop). A target
transfer involves moving the object from the starting position to the target position. The standard
procedure for the participants was to complete one set of transfers as accurately as possible while
minimizing the time taken. Participants were further bound to strictly pick and place objects in a
straight path without dragging it on the surface of the target transfer plates.
For all the tasks, the top left corner of the circular layout of targets was considered as origin
and target locations were recorded based on an XY 2-dimensional co-ordinate system. Each
sequence began at the top of the circular layout and was followed by reversing the targets such that
for the second half of the sequence, the trail-end position of the first half was used as start location.
This setup was chosen as it was previously used my Makenzie et al. [26]. Each sequence as
approximately 1 minute long with a 30 second break in between sequences. All participants were
mandated to rest for 2 minutes between two target transfer plates to minimize fatigue. The
1
2
3 4

23
approximate data collection time for each participant was around 1.25 hours (~45 to 60 minutes of
the experimental task, ~10 minutes of rest period, and ~5 minutes of preparation time)
The participants performed the tasks using 4 glove conditions. Hexagonal bolts were used
as targets during this phase of the experiment. Each target transfer task was performed in two phases.
The first phase of the task involved participants moving targets (hex-bolts) “from” (1-6) positions
to “to” (7-12) positions. The second phase of the task followed the reverse of the first phase where
participants moved back targets to their original positions. Participants were instructed to complete
the tasks as quickly as possible without dropping or dragging the targets while moving. Each task
plate’s “from” and “to” co-ordinates numbered from 1 to 12 are prerecorded before the start of the
experiment to maintain uniformity to all participants. During the experiment itself, the trail-end co-
ordinates (actual positions where participants place targets) were recorded using the Microscribe
Digitizer. Additionally, the entire experiment was recorded on video to capture the movement time
required to complete each target transfer task which was further used in data analysis.
Table 4: Target transfer sequence
Trail Position for Phase-1 Trail Position for Phase-2
“From” “To” “From” “To”
1 7 7 1
2 8 8 2
3 9 9 3
4 10 10 4
5 11 11 5
6 12 12 6
4.5.2 Assembly Task Setup
The task consists of a worktable (scissor lift) setup similar to Test 1 where participants were
required to complete the test in a standing position. A standardized test called the ‘Hand Tool
Dexterity Test’ (HTDT) was used for this phase of the experiment. Participants were asked to
complete the HTDT as quickly as possible using both hands. Participants were required to stand
parallel to the HTDT apparatus such that their point of view was midway to the ‘U’ shaped wooden
frame. Similar to Test 1, participants were advised to maintain a set distance from the worktable
such that their hips did not come in contact with the worktable and were asked to perform the tasks

24
while standing behind a marked line on the floor. Participants required to use a combination of both
their hands to effectively complete the HTDT. The participants were shown a demonstration of the
HTDT and were allowed to perform practice trials to familiarize themselves with the test.
Figure 12: Participant posture while performing the HTDT
Participants performed the test using 4 glove conditions. Each trial of the test required the
participants to first disassemble a set of 12 bolts from one side of the ‘U’ shaped wooden frame
followed by re-assembly of the 12 bolts on the other side of the ‘U’ shaped frame. Participants used
a combination of basic hand-tools such as an adjustable crescent wrench, two 5/16-inch and 1/2-
inch open end wrenches, and a flat head screwdriver to loosen the bolts and screws from the frame.
Once the bolts were loosened, participants used their hands to further unscrew the nuts from the
bolts, remove the bolt, nut and washer combination from the frame and place it aside. Once
participants completed disassembling the 12th bolt, they were required to reassemble it on the other
side of the ‘U’ shaped frame. Participants used both their hands to place the bolt, washer, and nut
combination in each hole of the frame and screw the thread to the far end of the bolt. Once
participants completed assembling a row of bolts, they were required to tighten the assembly using
the corresponding size of wrench or flat head screwdriver as required. Participants were required to
follow the bolt – washer – nut combination throughout the test to be considered a valid trial. The
entire test was recorded on video and the time required by the participants to complete each trial
was recorded.

25
Table 5: Subjective questionnaire based on 5-point Likert scale
Question Strongly
Disagree Disagree Neutral Agree
Strongly
Agree
Have used basic hand-tools before 1 2 3 4 5
HTDT tools are easy to use 1 2 3 4 5
Gloves fit hands 1 2 3 4 5
Gloves have good force transmission 1 2 3 4 5
Gloves enhance comfort 1 2 3 4 5
Gloves offer higher task performance 1 2 3 4 5
Gloves reduce hand grip force supply 1 2 3 4 5
Gloves have a good friction between hand and tools 1 2 3 4 5
Gloves cause peak pressure on the hand 1 2 3 4 5
Gloves feel clammy 1 2 3 4 5
Gloves cause numbness and lack tactile feeling 1 2 3 4 5
Gloves cause cramped muscles 1 2 3 4 5
Table 6: Discomfort ratings based on Borg CR-10 scale
Score Discomfort Bare
Hand Glove 1 Glove 2 Glove 3
0 Nothing at all
0.5 Extremely weak
1 Very weak
2 Weak
3 Moderate
4
5 Strong
6
7
Very strong 8
9
10 Extremely strong
A rest time of 30 seconds between each test condition was given to avoid fatigue. The test
was repeated for all four glove conditions to establish the time required to complete the task using
26
each glove. Participants were then made to fill out a subjective questionnaire as shown in Table 5
[30] for all the task conditions that they performed. This portion of the experiment required ~45
minutes to complete. Additionally, discomfort ratings were obtained from participants as shown in
Table 6 based on Borg CR-10 scale to assess the level of discomfort and ease of completion of tasks
using different glove conditions.
4.6 Data Processing
4.6.1 Throughput Calculation
Throughput, which is a measure of speed and accuracy for a target acquisition task, is
calculated based on ISO 9241-411 standard, “Ergonomics of human-system interaction”. The
equation for the throughput is based on Shannon’s Formulation of ID [18] and MacKenzie et al.
(2001) [22]. The throughput for a glove condition is calculated using the following equation:
Throughput = 𝐼𝐷𝑒
𝑀𝑇 Equation 4.1
Where, IDe = log2 (𝐴𝑒
𝑊𝑒+1) Equation 4.2
The term IDe is an effective index of difficulty and is derived from the normal distribution of
“hits”. For each target transfer, IDe has been computed from the effective amplitude (Ae), defined
as the mean of the movement distance “from” to “select”, and effective target width (We). The
term We determines the width of the distribution of selection coordinates computed over a target
acquisition task, as:
We = 4.133 × SDx Equation 4.3
Here SDx is the standard deviation of the selected coordinate of the target along the axis of target
position from the point to the target and reflects the adjustment for the accuracy. In the above
equation, 4.133 represents a condition that indicates that 96% of the hits fall within the target and
4% of the hits miss the target. However, in this study, the widths of all the targets was fixed to the
diameters of the bolts (W). Regarding the estimation of effective amplitude (Ae) and Throughput,
we referred to the guidance provided in a study by MacKenzie [30] and is discussed below.

27
Let (x1, y1), (x2, y2), and (x, y) be the coordinate positions of the “from”, “to”, and “select” point
respectively. Here, the “from” point represents starting position (original/starting position of a
bolt), and “to” point represents target position (position where a bolt is expected to be placed) and
“select” point represents the final position (position where a bolt is actually placed). Using the
coordinate data, distances a, b, and c were estimated using the following equations:
Figure 13: Geometry for a Target Transfer Task
a = (x1-x2)2 + (y1-y2)
2 Equation 4.4
b = (x-x2)2 + (y-y2)
2 Equation 4.5
c = (x1-x)2 + (y1-y)2 Equation 4.6
Given the length of sides, dx is calculated to determine ae as:
dx = (c2- b2-a2)/2a Equation 4.7
ae = a + dx Equation 4.8
Here, ae is effective target amplitude for a single movement. The effective target amplitude
(Ae) for a task plate is the average of all ae values, i.e., 12 movements for that plate. SDx is the
standard deviation of all dx values obtained for a plate.
For each sequence, MTi is the movement for the ith plate from starting point to target distance for a
target acquisition task. Each layout combination in the study consists of 12 target transfer tasks,
thus for a sequence:
MTi = Total movement time / No. of movements (=12, in the study) Equation 4.9

28
Finally, Throughput for a glove condition is calculated using the following equation:
TP = =𝟏
𝒏∑
𝑰𝑫𝒊
𝑴𝑻𝒊
𝒏
𝒊=𝟏 Equation 4.10
Where, n = number of participants × number of task plates
IDi = effective index of difficulty for a task plate.
4.6.2 Statistical Analysis
The effects of independent variables on the dependent variables in this study were
investigated using Linear Analysis of Variance (ANOVA) [34]. To test the effect of the index of
difficulty (ID) on the effective index of difficulty (IDe), ID was treated as the fixed factor with 4
levels (3.06, 3.54, 4.39, 5.43) corresponding to 4 target transfer plates, and the participant was
treated as a random factor. To test the effect of different glove conditions on throughput, assembly
time, and subject discomfort ratings, glove condition was treated as a fixed factor with 4 levels (Bare
hand, Glove 1, Glove 2, Glove 3) and participant was treated as random factor. The data were tested
for normality and equality of variance prior to performing the analysis of variance. The throughput
and assembly time data met the normality and equality of variance assumptions of ANOVA (data
and the test findings are presented in Appendix IV). Significance level was set to 5% for all
statistical analysis. Furthermore, significant effects were evaluated by conducting a comparison
between means using Tukey’s Honestly Significant Difference (HSD) test for all pair-wise
comparisons. JMP 15 Software from SAS Institute Inc., was used to perform the statistical analyses.

29
Chapter 5: Results
Fitts’ Law predicts that the time required to rapidly move to a target area is a function of the
ratio between the distance to the target and the width of the target [4]. Essentially, there exists an
inverse relationship between speed and accuracy which Fitts refers to as the speed-accuracy trade-
off. The data obtained from this study conforms to Fitts’ law where the movement time lowers as
the Index of Difficulty (ID) increases.
5.1 Index of Difficulty
Descriptive statistics for the Effective Index of Difficulty (IDe) is shown in Table 7. A close
similarity was observed between the ID and IDe. IDe values ranged from 1.84 to 5.49 with a mean
of 3.72. Figure 14 describes the relationship between the Effective Index of Difficulty (IDe) and
Movement Time (MT). Initially when the data was fitted with a linear model, lower values of
correlation coefficients were obtained between 0.24 and 0.44. The spread of MT across participants
and individual skillset between participants could be the reason for low correlation coefficients.
Additionally, the level of ID between plate 1 and 2 were close to each other, i.e, 3.06 bits and 3.54
bits respectively. Since these two task plates were not significantly different, the corresponding IDe
values from participants were found to be close to each other.
To improve the statistical fit between IDe and MT, the MT for individual participants was
normalized based on the maximum MT for each participant. Furthermore, as mentioned earlier, to
differentiate between the plates, plate 2 was removed from the analysis. Figure 15 describes the
relationship between IDe and Normalized MT. Data analysis shows that the correlation coefficients
for this data set has improved. Except for the bare hand condition, the correlation coefficient for all
the other glove conditions have improved; Glove 1: 0.368 to 0.64, Glove 2: 0.321 to 0.547, Glove
3: 0.44 to 0.778. Statistically, the effect ID on IDe was found to be significant (p<0.001). The
measured IDe data for all plate is presented in Appendix V.

30
Table 7: Summary Statistics for Effective Index of Difficulty
Mean 3.72 Variance 1.83
Std Dev 1.35 Minimum 1.84
Std Err Mean 0.08 Maximum 5.49
Upper 95% Mean 3.89 Median 3.76
Lower 95% Mean 3.55 Range 3.65
N 240
Figure 14: Linear fit of effective index of difficulty (IDe) with movement time (MT)

31
Figure 15: Linear fit of effective index of difficulty (IDe) with normalized movement time
5.2 Effect of Glove Condition on Throughput
Descriptive statistics for throughput are shown in Tables 8 & 9. The effect of glove condition
on the throughput was found to be statistically significant (p<0.001). Throughput for bare hand (3.91
bits/s) was higher compared to the three glove conditions. Among the three glove conditions Glove
2 was found to have a higher throughput of 3.72 bits/s followed by Glove 1 with 3.51 bits/s, and
Glove 3 with 3.47 bits/s.
Tukey-HSD pairwise comparison revealed that the throughput for bare hand was similar to
that of Glove 2. This could be because of the physical characteristics of Glove 2 that had a better fit
to the hands of all participants compared to other glove conditions. Whereas when glove conditions
were compared with each other, Glove 2 was found to be similar to Glove 1, and Glove 1 was found
to be similar to Glove 3. However, Glove 2 and Glove 3 were found to be significantly different
from each other. The throughput data for all experimental conditions are presented in Appendix V.

32
Table 8: Summary of Fit – Glove Condition v/s Throughput
Rsquare 0.41
Adj Rsquare 0.39
Root Mean Square Error 0.49
Mean of Response 3.65
Observations (or Sum Wgts) 240
Table 9: ANOVA and Mean Pairwise Comparison of Throughput
Main Effect Level** Significance Mean SD
Glove Condition <.0001
Bare HandA 3.91 0.69
Glove 2AB 3.72 0.62
Glove 1BC 3.51 0.57
Glove 3CX 3.47 0.54 **Levels that do not share same letter are significantly different.
Figure 16: 95% Confidence Interval of Throughput for all Glove Conditions

33
5.3 Effect of Glove Condition on Assembly Time
Descriptive statistics for assembly time are shown in Tables 10 & 11. The effect of glove
condition on the assembly time was found to be statistically significant (p<0.001). The mean
assembly time for the bare hand (394.24 sec) was the least compared to the three glove conditions.
Among the three glove conditions Glove 3 was found to have the highest mean assembly time of
558.48 sec followed by Glove 1 with 501.88 sec and Glove 2 with 462.52 sec.
Tukey-HSD pairwise comparison revealed that the assembly time for bare hand (394.24 sec)
was significantly different from all the glove conditions. Whereas when glove conditions were
compared with each other, Glove 3 (558.48 sec) was found to be similar to Glove 1 (501.88 sec),
and Glove 1 was found to be similar to Glove 2 (462.52 sec). However, Glove 2 and Glove 3 were
found to be significantly different from each other. The assembly time data for all experimental
conditions are presented in Appendix V.
Table 10: Summary of Fit – Glove Condition v/s Assembly Time
Rsquare 0.20
Adj Rsquare 0.18
Root Mean Square Error 120.81
Mean of Response 479.28
Observations (or Sum Wgts) 240
Table 11: ANOVA and Mean Pairwise Comparison of Assembly Time
Main Effect Level** Significance Mean SD
Glove Condition <.0001
Glove 3AX 558.48 0.69
Glove 1AB 501.88 0.62
Glove 2BX 462.52 0.57
Bare HandC 394.24 0.54 **Levels that do not share same letter are significantly different.

34
Figure 17: 95% Confidence Interval of Assembly Time for all Glove Conditions
5.4 Relationship between Throughput and Assembly Time
Descriptive statistics for assembly time are shown in Table 12. The overall mean assembly
time was found to be 479.28 sec with an SD of 133.95 sec. With a range of 711.6 sec, assembly
times were found to vary from 250.8 sec to 962.4 sec. Each participant’s familiarity with basic hand
tools and assembly tasks played a key role in assembly time data. The correlation coefficient was
found to be low with 0.03 indicating that there is a weak relationship between throughput and
assembly time.
Table 12: Descriptive Statistics for Assembly Time
Glove
Condition N Mean
Standard
Dev. Minimum Maximum
Bare Hand 60 394.24 85.25 250.8 614.4
Glove 1 60 501.88 101.44 361.8 692.4
Glove 2 60 462.52 97.27 304.8 627.6
Glove 3 60 558.48 176.15 364.8 962.4

35
To establish a better fit between throughput and assembly time, the assembly time data was
normalized with respect to the maximum time spent by each participant to complete the assembly
task with all the glove conditions. This would reduce variability as some participants were found to
consume much lesser time compared to the others. Figure 18 shows the fit between throughput and
normalized assembly times. The F-test revealed that the effect of throughput on assembly time is
statistically significant (p<0.001). The correlation coefficient did not improve significantly and was
found to be 0.092.
Figure 18: Linear fit of assembly time with throughput (TP)

36
Figure 19: Linear fit of assembly time with throughput (TP) without Glove 3
Additionally, as the mean throughput of Glove 1 (3.51 bits/s) and Glove 3 (3.47 bits/s) was
found to be close to each other, further analysis was performed by removing Glove 3 from the data
set. A linear fit between normalized assembly time and throughput without Glove 3 improved the
correlation coefficient to 0.127 as shown in Figure 19.
Table 13: Correlation Analysis between Throughput and Assembly Time
TP Assembly Time Normalized
Assembly Time
TP 1.0000 -0.2267 -0.3241
Assembly Time -0.2267 1.0000 0.2056
Normalized Assembly Time -0.3241 0.2056 1.0000
The correlations are estimated by Row-wise method.

37
Figure 20: Correlation analysis of throughput (TP), assembly time, and normalized assembly
time
The correlation matrix between throughput, assembly time and normalized assembly time is
shown in Table 13 and Figure 10. An inverse relationship was observed between throughput and
assembly time. This relationship means that for a higher throughput, participants required lesser
time to complete the assembly task and vice versa. Although the correlation coefficient is found to
be low with -0.2267 for assembly time and -0.3241 for normalized assembly time, there is a
possibility that this would increase if there was a larger sample size (current N = 15).
5.5 Perceived Discomfort
Discomfort ratings were obtained from participants after the completion of both the tasks.
Based on Borg CR-10 scale, Figure 21 shows the spread of discomfort ratings obtained from all
participants. It can be observed that bare hand has the least level of discomfort. Among the glove
conditions, Glove 3 was found to have the highest level of discomfort. Our throughput data lines up

38
with these discomfort ratings where bare hand has the highest mean throughput and Glove 3 has the
least mean throughput.
Figure 21: Summary of discomfort ratings of all participants
To further evaluate this theory, ANOVA was performed on the discomfort rating data as
shown in Table 14. The effect of glove condition on perceived discomfort was found to be
statistically significant (p<0.0001). Bare hand was found to have the lease mean discomfort rating
of 0.7 followed by Glove 2 with 2.9, Glove 1 with 3.7 and Glove 3 with 5.8. Tukey-HSD pairwise
comparison of means reveled identical results to that of the effect of gloves on assembly time. The
discomfort ratings for bare hand was significantly different from all the glove conditions. Whereas
when glove conditions were compared with each other, Glove 3 was found to be similar to Glove 1,
and Glove 1 was found to be similar to Glove 2. However, Glove 2 and Glove 3 were found to be
significantly different from each other.
Table 14: ANOVA for Perceived Discomfort Ratings
Main Effect Level** Significance Mean SD
Glove Condition <.0001
Glove 3AX 5.80 1.97
Glove 1AB 3.76 2.25
Glove 2BX 2.90 2.70
Bare HandC 0.70 1.27 **Levels that do not share same letter are significantly different.
0
1
2
3
4
5
6
7
8
9
10
1 3 5 7 9 11 13 15
Borg
CR
-10
sca
le
Participant
Bare Hand Glove 1 Glove 2 Glove 3

39
Table 15: Summary of Fit – Glove Condition v/s Perceived Discomfort
Rsquare 0.44
Adj Rsquare 0.41
Root Mean Square Error 2.11
Mean of Response 3.29
Observations (or Sum Wgts) 60
Figure 22: 95% Confidence Interval of Discomfort Rating for all Glove Conditions
5.6 Subjective Assessment of Participants
At the end of the study, in addition to the discomfort ratings, a subjective questionnaire was
completed by all participants. Participants were required to answer qualitative questions on a 5-point
scale where 1 meant to strongly disagree, 3 meant neutral and 5 meant strongly agree. A summary
of data obtained from participants is shown in Table 16. Each row consists of the percentage of
participants that agree or disagree to a specific question. All the green cells indicate the highest
response received for each question among the 15 participants. The following data was collected to
assess the familiarity of participants with hand tools and their perception of performing the tasks

40
while wearing gloves. Although this data does not directly support our initial results, it does provide
a certain level of insight into the sample population.
Table 16: Response for Subjective Questionnaire based on a 5-point scale*
Question Strongly
Disagree Disagree Neutral Agree
Strongly
Agree
Have used basic hand-tools before 7% 7% 7% 47% 33%
HTDT tools are easy to use 13% 20% 47% 20%
Gloves fit hands 7% 7% 7% 60% 20%
Gloves have good force transmission 7% 27% 7% 53% 7%
Gloves enhance comfort 13% 27% 40% 20%
Gloves offer higher task performance 20% 20% 40% 20%
Gloves reduce hand grip force supply 53% 13% 20% 13%
Gloves have a good friction between hand and
tools 7% 33% 40% 20%
Gloves cause peak pressure on the hand 7% 47% 40% 7%
Gloves feel clammy 33% 20% 47%
Gloves cause numbness and lack tactile feeling 33% 13% 27% 27%
Gloves cause cramped muscles 40% 33% 20% 7%
*Table is to be read row wise where each cell has the percentage of no. of participants who agree/disagree

41
Chapter 6: Discussion and Conclusion
6.1 Summary
Workers in the manufacturing facilities performing assembly operations are required to
complete tasks with high accuracy and under a given period of time to meet production demand and
quality. While performing these tasks, workers are mandated to wear personal protective equipment
(PPE) such as hand gloves. While protecting workers against hand injuries, gloves inhibit task
performance by increasing task completion time. This drives workers to forego wearing PPE and
results in injuries that causes losses in productivity and capital. Previous studies have indicated that
use of gloves affect hand and finger dexterity, which lead to a decrease in work performance
compared to bare hands. Although gloves have a significant effect on productivity levels, the use of
gloves cannot be comprised. Manufacturing facilities encounter hand injuries on a regular basis due
to imprudent workers and supervisors. Hence this study was carried out to come up with a way to
estimate possible process times that involves manual assembly. The objective of this study was to
evaluate the relationship between Fitts’ throughput and assembly time so that a performance
measure could be developed to assess the effect of gloves on assembly time in terms of Fitts’
throughput. Based on the ISO 9241-411 standard, the throughput of different glove conditions on
participants was evaluated using a target acquisition task. This was followed by a simulated
assembly task based on the Hand Tool Dexterity Test where assembly times of all participants were
recorded. The effect of different glove conditions, target layouts, index of difficulties and assembly
times were evaluated and factors that influence the resulting throughput were identified based on
statistical analysis.
Initially, the effective index of difficulty (IDe) was plotted with the movement time (MT) to
check if the data satisfies Fitts’ Law. For the current data set, a linear relationship exists between
IDe and MT with correlation coefficients ranging from 0.24 for bare hand, 0.64 for Glove 1, 0.547
for Glove 2, and 0.778 for Glove 3.The overall effect of IDe on MT was found to be significant
(p<0.001) based on the F-test. The lower value of correlation coefficient for bare hand may be due
to the high variability between participants based on different skill sets. Whereas for all the
remaining glove conditions, the correlation coefficient seems to be consistent from 0.547 to 0.778

42
indicating the effect of gloves on task performance is significant. Our study consisted of ID values
ranging from 3.06 to 5.43 with two task plates that had close ID values of 3.06 (plate 1) and 3.54
(plate 2). The closer range maybe a reason for the lower correlation values of bare hand condition
as it is difficult for participants to differentiate between these tasks given that the tasks used the
same object size, but the overall amplitude varied by 127 mm.
Furthermore, the effect of glove condition on throughput was evaluated. Fitts’ throughput is
essentially the ratio between IDe and MT. Statistical analysis revealed that the effect of glove
condition on throughput was significant (p<0.0001) while the mean throughput ranged from 3.47
bits/s to 3.91 bits/s. Based on the results, we reject the null hypothesis at the 95% confidence level
and conclude that glove condition has an effect on throughput. Throughput for the bare hand (3.91
bits/s) was found to be the highest compared to all the conditions. Among the three glove conditions
Glove 2 was found to have a higher throughput of 3.72 bits/s followed by Glove 1 with 3.51 bits/s,
and Glove 3 with 3.47 bits/s. Based on literature, glove are expected to have an effect on task
performance and completion time [31]. Pairwise comparison of means revealed that Glove 2 was
found to be similar to Glove 1, and Glove 1 was found to be similar to Glove 3. However, Glove 2
and Glove 3 were found to be significantly different from each other and bare hand was significantly
different from all the glove conditions.
A study by MacKenzie et al. (1991) [37] compared the performance of pointing in three
control devices: mouse, tablet and trackball. The throughput observed in this study for the three devices
was 4.5, 4.9 and 3.3, respectively. The authors concluded that the trackball as a poor performer, whereas,
the tablet was considered as the best performer based on the throughput values. In a similar study by
Herring et al. (2010) [39], the authors compared four control devices: touchpad, mouse, mini joystick
and micro joystick. The throughput values were 1.08, 0.91, 1.02 and 1.39, respectively. The authors in
this study recommended the device with the highest throughput i.e. micro joystick for fast and accurate
operation. On the other hand, mini joystick and mouse were ranked as being “difficult” to operate. In
the above studies, although the observed difference between the throughputs of control devices was
small, the device with the lowest throughput was regarded as the low performer and the device with the
highest throughput as the best performer. In a more recent study by Sah et. al. (2019) [40], the authors
concluded that the throughput of bare hand (2.34 bits/s) outperformed glove conditions. Continuing a
similar trend, in a study by Gaut et. al (2020) [41], the authors concluded that the bare hand (3.61 bits/s)

43
outperformed other glove conditions in terms of throughput. A similar analogy can be implied to this
study where although the throughputs between different glove conditions do not have a significant
difference, the bare hand (3.91 bits/s) outperforms other glove conditions. Furthermore, the relationship
between ID and throughput is comparable in all the above studies. It can also be observed that the use
of gloves reduces the throughput values.
The evaluation of the effect of gloves on assembly time was another objective of this study.
To simulate an assembly task, participants were asked to complete the Hand Tool Dexterity Test
(HTDT), and assembly times for each glove conditions was recorded. Statistical analysis revealed
that the effect of glove condition was significant (p<0.0001). The overall average time required by
participants to complete the task with bare hands was found to be 394.24 sec. Among the three glove
conditions Glove 3 was found to have the highest mean assembly time of 558.48 sec followed by
Glove 1 with 501.88 sec and Glove 2 with 462.52 sec. Pairwise comparison of means revealed that
the assembly time for bare hand was similar to that of Glove 1. Whereas when glove conditions
were compared with each other, Glove 1 was found to be similar to Glove 2, and Glove 2 was found
to be similar to Glove 3. However, Glove 2 and Glove 3 were found to be significantly different
from each other. Therefore, at the 95% confidence level, we reject the null hypothesis and conclude
that glove condition influences assembly time. By the above analyses we have rejected our first null
hypothesis pertaining to the effect of gloves on throughput and assembly time.
Studies in the past have investigated the effects of gloves on characteristics of hand
performance. Studies by Lariviere et al [16] and Wells et al [17] found an increase in muscle activity
while performing tasks using gloves. A study by O’Hara concluded that gloves may interfere with
finger and joint extension movements. Furthermore, research by Cochran et al [15], Tsaousidis and
Freivalds, Kovacs et al [16], Chang and Shig, Wimer et al [17], have shown that gloves are likely
to reduce grip strength. Gloves can also diminish the tactile sensitivity due to the thickness of glove
material which can further impact the ability of the users to detect changes in touch. Although the
type of glove used plays a role in the extent to which gloves can impede hand performance, in
general a reduced performance is observed in the literature for the gloves independent of the glove
material. Thus, the findings from our study regarding the assembly time are consistent with the
literature.
44
Another objective of this study was to test a relationship between throughput and assembly
time. Data analysis revealed that although the effect of throughput on assembly time is significant
(p<0.0001), the correlation coefficient was found to be low (0.09). To further assess the effect of
throughput on assembly time, correlation analysis was performed between throughput, assembly
time and normalized assembly time. As the maximum and minimum times required by each
participant varied, assembly time data was normalized based on the maximum time consumed by
each participant. Correlation analysis revealed that there is an inverse relationship between
throughput and normalized assembly time with a correlation coefficient of -0.3241. Although the
coefficient value is not large enough to conclude that there is a significant relationship at the 95%
confidence level, we can conclude that the relationship is inverse. This would mean that for a higher
value of throughput, the assembly time required would be lesser. Therefore, we fail to reject the null
hypothesis at the 95% confidence level and conclude that the results obtained in the study are not
significant enough to assume a definite relationship between throughput and assembly time.
Additionally, discomfort ratings obtained from participants supported the throughput and
assembly time data. Studies in the past have concluded that participants faced more discomfort with
gloves compared to bare hands. The results of a study by Dianat et. al (2010) [15] show a significant
effect of glove type on muscle activity, time to complete the pegboard test, number of errors, and
subjective assessments of rating of ease of manipulation and hand and finger discomfort ratings. In
our study also, the effect of gloves was found to be significant on the perceived discomfort reported
by participants. These further strengths the fact that gloves inhibit task performance and supports
the rationale of this study to establish a performance measure to develop a metric to assess the
difficulty level of assembly tasks using gloves.
To elaborate more on the exclusive findings from our study, the inverse relationship between
throughput and assembly time does not exist in current literature. A higher throughput means that
more information is conveyed to the user while performing the task under a certain glove condition.
The findings from this study are on par with studies in the past where throughput of bare hand was
found to be higher than other glove conditions. Additionally, the throughput values lowered as the
characteristics of the gloves in terms of thickness, grip strength and flexibility worsened. A higher

45
throughput also means that the user can perform a given task with ease. This relationship is relevant
as a task can be completed more effectively and efficiently if more information is conveyed to the
user. In this study, information corresponds to the physical feedback from the tools used by the
participants while performing the assembly task. For the bare hand condition, the throughput was
found to be high and the assembly time was low as participants could complete the task without any
impeding factors such the effect of gloves. Tools with higher throughput perform better as there is
no lag in the information conveyed between two entities such as the one between user and tool or
tool and assembly part.
6.2 Limitations
The study focused on establishing a relationship between Fitts’ throughput and assembly
time such that Fitts’ throughput could be used as a possible performance measure for manual
assembly tasks. The Hand Tool Dexterity Test (HTDT) was used to simulate an assembly task and
record the assembly times of participants. In the real-world industrial scenario, assembly tasks
maybe more complex and may involve a larger number of sub-assemblies to complete the operation.
Moreover, assembly tasks in industries may use power tools instead of basic hand tools to fasten
parts into place. It is to be noted that the HTDT was used in this study as it a standardized test used
by vocational training institutes and industries to hire assembly line workers and maintenance
personnel. Furthermore, the types of gloves used in assembly operations may be limitless. Each
industry adapts a certain variety of gloves as per their process requirements. Participant skillset is
another key factor that may affect the results of this study. Since all participants were students whose
age ranged from 21 to 30 years, and not professionals in either assembly work or general
maintenance, the overall throughput and assembly times maybe affected.
The study was completed with 10 male and 5 female participants. An equal number of male
and female participants were not achievable due to the COVID-19 pandemic and uncertainty with
participant involvement under these conditions. However, this study provides a good starting point
for the use of throughput to determine assembly time and is a good preliminary study for further
research in this direction.

46
Additionally, this study used a simple target acquisition task based on the ISO 9241-411
standard to determine throughput of each glove condition for all the participants. In an industrial
scenario, a different process/task may have to be formulated to establish the throughput values for
glove conditions which would in turn be used to estimate assembly time based on an inverse
relationship as mentioned earlier in this study.
6.3 Practical Implications
This study tried to establish a relationship between throughput and assembly time where in
throughput could be used as a possible performance measure for manual assembly tasks. The ISO
9241-411 standard could be used in the real-world scenario to compare task performance of bare
hand with other glove conditions. Based on a study by Gaut et al, a task amplitude of 11” with target
width of 1.5”, and stainless-steel object with a circular shape and 0.88” height could be used as a
standard to compare bare hand exertions with that of glove [32]. The results obtained from this study
could be used as a measure to estimate assembly time of tasks that use different glove conditions.
Based on the individual throughput, manufacturers can select high-performance gloves that would
suit their process requirements. The selection of the right kind of gloves plays a key role in task
performance on a day to day basis. Workers may be less productive while using the wrong kind of
gloves. Shop floor personnel and production supervisors could also use this measure to assign tasks
that require the use of gloves to their workforce based on individual worker skill set. For a
hypothetical scenario, an amateur assembly line worker could be assigned a task that requires the
use of gloves with a higher throughput, meaning the assembly time required for the corresponding
task would be less. This could suffice for professional workers in the opposite case. Future studies
could use a better sample size and population with more closely related assembly backgrounds to
assess the performance of workers.
Based on the findings of this study alone, it is difficult to provide absolute metrics for
improvement. As this is the first study in this direction, there is future scope to develop a relative
scale to compare gloves based on throughput. Additionally, it is to be noted that this study serves as
a quick measure to estimate the performance of a glove. In the real-world scenario, the performance
of a glove or a tool in general is established based on long-term usage. Manufacturing personnel
47
report the performance of a glove or a tool based on their personal experience of using it over a
period of time. Hence this study can serve as a quick method to provide a preliminary relative
comparison of glove performance. With further validation, it may be possible to have an impact
value which would interpret that throughput above a threshold can reduce assembly time by a certain
amount. In order to reach such conclusions, future studies with a larger sample size, wider variety
of gloves, and personnel feedback with continuous validation would be necessary.
6.4 Conclusions
The inferences from the data set collected for this study indicate that gloves have a
significant effect on Fitts’ throughput and assembly time. Additionally, data also indicate that Fitts’
throughput has an inverse relationship with assembly time. Bare hand condition was found to be
significantly different from glove conditions in the tasks involving throughput and assembly time.
However, the glove conditions were not entirely significant from each other except for one of the
three combinations. The findings from this study convey that a higher throughput will result in a
lower assembly time and vice versa. Glove manufacturers, shop floor supervisors and manufacturers
with assembly lines can use these findings to assign gloves to their clients/workforce based on the
assembly tasks they would be required to perform on a routine basis. The choice of gloves will
directly impact the performance of workers on assembly tasks as found in the results of our study.
Gloves with higher throughput are recommended to be used as they increase productivity, reduce
fatigue and maintain safety standards.

48
BIBLIOGRAPHY
[1] Bureau of Labor Statistics, "Case and demographic characteristics for work-related injuries
and illnesses involving days away from work," 2012.
[2] OSHA, "Workplace injury, illness, and fatality statistics," 2013.
[3] B. Makofske, "Manual dexterity," in Encyclopedia of clinical neuropsychology, 2011, pp.
1522-1523.
[4] P. M. Fitts and B. Radford, "The information capacity of the human motor system in
controlling the amplitude of movement," Journal of experimental psychology, pp. 381-391,
1954.
[5] P. M. Fitts and B. Radford, "Information capacity of discrete motor responses under
different cofnitive sets," Journal of Experimental Psychology, pp. 475-482, 1966.
[6] K. Toumi, L. Joly, C. Vleminckx and B. Schiffers , "Risk assessment of florists exposed to
pesticide residues through handling of flowers and preparing bouquets," International
Journal of environmental research and public health, p. 526, 2017.
[7] A. Garus-Pakowska, M. Gorajski and F. Szatko, "Awareness of the risk of exposure to
infectious material and the behaviours of polish paramedics with respect to the hazards from
blood-borne pathogens - A nationwide study," International journal of environmental
research and public health, p. 843, 2017.
[8] M. Z. Ramadan, "The Effects of Industrial Protective Gloves and Hand Skin Temperatures
on Hand Grip Strength and Discomfort Rating," International Journal of Environmental
Research and Public Health, vol. 14, no. 1506, 2017.
[9] L. Sudhakar, R. Schoenmarklin, S. Lavender and W. Marras, "The effects of gloves on grip
strength and muscle activity," Human factors ergonomics society, pp. 674-650, 1988.
[10] S. Fleming, C. Jansen and S. Hasson, "Effect of work glove and type of muscle action on
grip fatigue," Ergonomics, pp. 601-612, 1997.
[11] Y. Shih and M. Wang, "The effects of weight levels and gloves on the ability to discriminate
weight difference," Ergonomics, pp. 792-739, 1996.

49
[12] J. Nelson and A. Mital, "An ergonomic evaluation of dexterity and tactility with increase in
examination of surgical glove thickness," Ergonomics, pp. 723-733, 1995.
[13] R. Bishu and F. Aghezadeh, "Glove evaluation: alesson from impaired hand testing,"
Advances in industrial ergonomics and safety, pp. 619-625, 1994.
[14] D. Cochran and M. Riley, "The effects of handle shape and size on exerted forces," Human
Factors, pp. 253-265, 1986.
[15] I. Dianat, C. M. Haslegrave and A. W. Stedmon, "Short and longer duration effects of
protective gloves on hand performance capabilities and subjective assessments in a screw
driving task," Ergonomics, pp. 1468-1483, 2010.
[16] C. P. A. L. J. T. C. B. J. D. A. Larivière, "Biomechanical assessment of gloves. A study of
the sensitivity and reliability of electromyographic parameters used to measure the activation
and fatigue of different forearm muscles," Journal of Industrial Ergonomics, vol. 34, pp.
101-106, 2004.
[17] R. Wells, S. Hunt, K. Hurley and P. Rosati, "Laboratory assessment of the effect of heavy
rubber glove thickness and sizing on effort, performance and comfort," International
Journal of Industrial Ergonomics, pp. 574-583, 2010.
[18] D. Buhman, J. Cherry, L. Bronkema-Orr and R. Bishu, "Effects of glove, orientationm
pressurem loadm and handle on submaximal grasp force," International Journal of
Industrial Ergonomics, pp. 247-256, 2000.
[19] K. Kovacs, R. Splittstoesser, A. Maronitis and Marras W.S, "Grip force and muscle activity
differences due to glove type," American Industrial Hygiene Association, pp. 269-274, 2002.
[20] N. Tsaousidis and A. Freivalds, "Effects of gloves on maximal force and the rate of force
development in pinch, wrist flexion and grip," International Journal of Ergonomics, pp.
353-390, 1998.
[21] E. Gardner and J. Martin, "Coding of Sensory Information," in Principles of Neural Science,
New York, McGraw-Hill, 2000, pp. 430-450.
[22] R. Plummer, T. Stobbe, R. Ronk, W. Myers, H. Kim and M. Jaraiedi, "Manual dexterity
evaluation of gloves used in handling hazardous materials," in Proceedings of the Human
Factors Society, 1985.

50
[23] W. Contributors, "Fitts's Law," 2020. [Online]. Available:
https://en.wikipedia.org/w/index.php?title=Fitts%27s_law&oldid=987177240. [Accessed 10
11 2020].
[24] C. Shannon and W. Weaver, The mathematical theory of communication, Urbana, IL, 1949.
[25] J. Accot and S. Zhai, "Beyond Fitts’ Law: Models for Trajectory-Based HCI Tasks," in ACM
CHI 97 Human Factors in Computing Systems Conference.
[26] C. Chang and Y. Shih, "The effects of glove thickness and work load on female hand
performance and fatigue during a infrequent high intensity gripping task," Applied
Ergonomics, pp. 317-324, 2007.
[27] L. Claudon, "Influence on grip of knife handle surface characteristics and wearing protective
gloves," Applied Ergonomics, pp. 729-735, 2006.
[28] I. MacKenzie, T. Kauppinen and M. Silfverberg, "Accuracy measures for evaluating
computer pointing devices," Human factors in computing systems, 2001.
[29] T. Johnsgard, "Fitts' Law with a virtual reality glove and a mouse: Effects of gain. In
Graphics interface," Canadian Information Processing Society, 1994.
[30] S. I. MacKenzie and P. Isokoski, "Fitts' throughput and the speed-accuracy tradeoff," in
CHI, Florence, Italy, 2008.
[31] C. Millard and N. Vaughan, "Assessment of Protective Gloves for Use with Airfed Suits,"
Annuals of Occupational Hygiene, pp. 1022-1033, 2015.
[32] J. Bear-Lehman and B. C. Abreu, "Evaluating the Hand: Issues in Reliability and Validity,"
Physical Therapy, vol. 69, no. 12, pp. 1025-1033, 1989.
[33] Bureau of Labor Statistics, "Hand, back, and hand injuries resulting in days away from work
or job transfer of restriction," 2018. [Online]. Available:
https://www.bls.gov/opub/ted/2018/head-back-and-hand-injuries-resulting-in-days-away-
from-work-or-job-transfer-or-restriction.
[34] OSHA, "osha.gov," [Online].
[35] D. C. Montegomery, Design and Analysis of Experiments, New York: Wiley, 2019.

51
[36] R. Soukoreff and I. McKenzie, "Towards a standard for pointing device evalutation,
perspectives on 27 years of Fitts' law research in HCI," International journal of human-
computer studies, pp. 751-789, 2004.
[37] G. Harih and B. Dolsak, "Comparison of subjective comfpr ratings between anatomically
shaped and cylindrical handles," Applied Ergonomics, vol. 45, 2013.
[38] I. Makenzie, "Fitts' Law," in Handbook of Human-Computer Interaction,, Hoboken, NJ,
Wiley, 2018.
[39] I. MacKenzie, A. Sellen and W. Buxton, "A comparison of input devices in element pointing
and dragging tasks," Human Factors in Computing Systems, 1991.
[40] S. R. T. A. E. &. H. M. S. Herring, "Evaluation of four cursor control devices during a target
acquisition task for laparoscopic tool control," vol. 41, no. 1, pp. 47-57, 2010.
[41] S. Sah and A. D. Nimbarte, "Can Fitts' Throughput Be A Predictor Of Muscle Fatigue – A
Study Based On Metacarpal Gloves?," West Virginia Univeristy, 2019.
[42] I. Gaut and A. D. Nimbarte, "Evaluation of object attributes to study speed-accuracy trade-
off of glove using ISO 9241-11 standard," West Virginia University, Morgantown, WV,
2020.

APPENDIX I: IRB Protocol
Approval of Human Research
Protocol
10/12/2020
To: Ashish Nimbarte
From: WVU Human Research Protection Program
Protocol Type: Expedited Approval Date: 10/31/2020
Submission Type: Initial Expiration Date: 10/30/2022
Funding: N/A
WVU Protocol #: 2009120383
Protocol Title: Evaluation of Fitts' Throughput as a Possible Performance Measure for Manual
Assembly Tasks
The West Virginia University Institutional Review Board has reviewed and granted your request for
approval of Expedited protocol 2009120383, in accordance with the Federal regulations 45 CFR 46,
21 CFR 50, and 21 CFR 56 (when applicable). Additional details concerning the review are below:
• Category 4. Collection of data through noninvasive procedures (not involving general anesthesia
or sedation) routinely employed in clinical practice, excluding procedures involving x-rays or
microwaves. Where medical devices are employed, they must be cleared/approved for
marketing. (Studies intended to evaluate the safety and effectiveness of the medical device are
not generally eligible for expedited review, including studies of cleared medical devices for
new indications.) Examples: (a) physical sensors that are applied either to the surface of the
body or at a distance and do not involve input of significant amounts of energy into the subject
or an invasion of the subjects privacy; (b) weighing or testing sensory acuity; (c) magnetic
resonance imaging; (d) electrocardiography, electroencephalography, thermography, detection
of naturally occurring
radioactivity, electroretinography, ultrasound, diagnostic infrared imaging, doppler blood flow,
and echocardiography; (e) moderate exercise, muscular strength testing, body composition
assessment, and flexibility testing where appropriate given the age, weight, and health of the

individual. • No latex gloves will be used for this study.
The following documents were reviewed and approved for use as part of this submission. Only the
documents listed below may be used in the research. Please access and print the files in the Notes &
Attachments section of your approved protocol.
• Informed Consent for Research - Pradyumna.pdf
WVU IRB approval of protocol 2009120383 will expire on 10/30/2022.
If any study related activities are to continue beyond the expiration date, a renewal application should be
submitted no later than four (4) weeks prior to the expiration date. It is your responsibility to submit your
protocol for continuing review.
Once you begin your human subjects research, the following regulations apply:
1. Unanticipated, serious adverse events and/or side effect(s) encountered at WVU or an affiliate site that are
related to the research must be reported to the WVU IRB within five (5) days using the Notify IRB action
in WVU+kc.
2. Any Unanticipated Problem or UPIRTSO or other research related event resulting in new or increased risk of
harm to study subjects, occurring at WVU or an affiliate site, must be reported to the WVU IRB within five
(5) days using the Notify IRB action in WVU+kc.
3. Any modifications to the protocol or informed consent form must be reviewed and approved by the IRB
prior to implementation. These modifications should be submitted as an amendment.
4. You may not use a modified informed consent form until it has been reviewed and approved by the WVU
IRB. Only consent forms with the WVU+kc watermark may be used to obtain informed consent
from participants.
The WVU Human Research Protection Program will be glad to provide assistance to you
throughout the research process. Please feel free to contact us by phone at 304.293.7073 or by
email at [email protected].
Sincerely,

APPENDIX II: Glove Sizing
1. Glove size guide used for Glove 1

2. Glove size guide used for Glove 2

3. Glove size guide used for Glove 3

APPENDIX III: Hand Tool Dexterity Test Scores


APPENDIX IV: Test for normality and equality of variance of throughput
Figure 23: Normal quantile plot of conditional residuals of throughput
Table 17: Test for equality of variance
Test F Ratio DFNum DFDen Prob > F
O'Brien[.5] 1.7624 3 176 0.1561
Brown-Forsythe 1.2365 3 176 0.2980
Levene 1.3908 3 176 0.2472
Bartlett 1.0743 3 . 0.3585

APPENDIX V: Experiment Data
Participant Glove
Condition
Task
Plate ID IDe MT TP
Assembly
Time
Normalized
MT
Normalized
Assembly Time
1 Bare Hand P1 3.06 3.06 0.86 3.58 301.2 0.53 0.53
1 Bare Hand P2 3.54 1.88 0.97 1.95 301.2 0.60 0.53
1 Bare Hand P3 4.39 4.42 0.89 4.96 301.2 0.56 0.53
1 Bare Hand P4 5.43 5.47 1.23 4.43 301.2 0.77 0.53
1 Glove 1 P1 3.06 3.06 0.89 3.43 442.8 0.56 0.78
1 Glove 1 P2 3.54 1.85 0.98 1.88 442.8 0.61 0.78
1 Glove 1 P3 4.39 4.42 1.03 4.30 442.8 0.64 0.78
1 Glove 1 P4 5.43 5.48 1.38 3.97 442.8 0.86 0.78
1 Glove 2 P1 3.06 3.07 0.88 3.51 436.2 0.55 0.77
1 Glove 2 P2 3.54 1.84 1.03 1.79 436.2 0.64 0.77
1 Glove 2 P3 4.39 4.41 0.98 4.53 436.2 0.61 0.77
1 Glove 2 P4 5.43 5.47 1.27 4.32 436.2 0.79 0.77
1 Glove 3 P1 3.06 3.06 0.83 3.69 569.4 0.52 1.00
1 Glove 3 P2 3.54 1.87 0.96 1.96 569.4 0.60 1.00
1 Glove 3 P3 4.39 4.41 1.02 4.33 569.4 0.64 1.00
1 Glove 3 P4 5.43 5.47 1.60 3.41 569.4 1.00 1.00
2 Bare Hand P1 3.06 3.10 1.11 2.80 376.8 0.77 1.00
2 Bare Hand P2 3.54 1.89 1.26 1.49 376.8 0.88 1.00
2 Bare Hand P3 4.39 4.44 1.18 3.76 376.8 0.82 1.00
2 Bare Hand P4 5.43 5.47 1.35 4.05 376.8 0.94 1.00
2 Glove 1 P1 3.06 3.11 1.16 2.69 367.2 0.80 0.97
2 Glove 1 P2 3.54 1.89 1.24 1.52 367.2 0.86 0.97
2 Glove 1 P3 4.39 4.44 1.22 3.65 367.2 0.84 0.97
2 Glove 1 P4 5.43 5.47 1.38 3.97 367.2 0.96 0.97
2 Glove 2 P1 3.06 3.11 1.10 2.82 312.6 0.77 0.83
2 Glove 2 P2 3.54 1.88 1.21 1.56 312.6 0.84 0.83
2 Glove 2 P3 4.39 4.43 1.28 3.46 312.6 0.89 0.83
2 Glove 2 P4 5.43 5.47 1.44 3.80 312.6 1.00 0.83
2 Glove 3 P1 3.06 3.10 1.14 2.71 364.8 0.79 0.97
2 Glove 3 P2 3.54 1.87 1.22 1.54 364.8 0.84 0.97
2 Glove 3 P3 4.39 4.44 1.22 3.63 364.8 0.85 0.97
2 Glove 3 P4 5.43 5.47 1.37 4.00 364.8 0.95 0.97
3 Bare Hand P1 3.06 3.09 0.82 3.75 448.8 0.48 0.48
3 Bare Hand P2 3.54 1.88 0.86 2.18 448.8 0.51 0.48
3 Bare Hand P3 4.39 4.44 0.88 5.04 448.8 0.52 0.48

Participant Glove
Condition
Task
Plate ID IDe MT TP
Assembly
Time
Normalized
MT
Normalized
Assembly Time
3 Bare Hand P4 5.43 5.48 1.20 4.57 448.8 0.70 0.48
3 Glove 1 P1 3.06 3.12 1.00 3.13 668.4 0.59 0.72
3 Glove 1 P2 3.54 1.93 0.94 2.06 668.4 0.55 0.72
3 Glove 1 P3 4.39 4.41 0.97 4.53 668.4 0.57 0.72
3 Glove 1 P4 5.43 5.47 1.35 4.04 668.4 0.79 0.72
3 Glove 2 P1 3.06 3.10 0.91 3.42 563.4 0.53 0.61
3 Glove 2 P2 3.54 1.90 0.83 2.28 563.4 0.49 0.61
3 Glove 2 P3 4.39 4.43 0.89 4.98 563.4 0.52 0.61
3 Glove 2 P4 5.43 5.48 1.22 4.49 563.4 0.72 0.61
3 Glove 3 P1 3.06 3.10 0.88 3.54 926.4 0.51 1.00
3 Glove 3 P2 3.54 1.89 0.93 2.04 926.4 0.54 1.00
3 Glove 3 P3 4.39 4.41 1.00 4.40 926.4 0.59 1.00
3 Glove 3 P4 5.43 5.48 1.70 3.21 926.4 1.00 1.00
4 Bare Hand P1 3.06 3.10 0.97 3.18 385.8 0.49 0.56
4 Bare Hand P2 3.54 1.92 1.02 1.89 385.8 0.51 0.56
4 Bare Hand P3 4.39 4.44 1.16 3.83 385.8 0.58 0.56
4 Bare Hand P4 5.43 5.47 1.64 3.34 385.8 0.83 0.56
4 Glove 1 P1 3.06 3.08 1.02 3.03 609.6 0.51 0.88
4 Glove 1 P2 3.54 1.92 1.21 1.59 609.6 0.61 0.88
4 Glove 1 P3 4.39 4.43 1.58 2.80 609.6 0.80 0.88
4 Glove 1 P4 5.43 5.47 1.98 2.76 609.6 1.00 0.88
4 Glove 2 P1 3.06 3.09 0.97 3.19 514.8 0.49 0.74
4 Glove 2 P2 3.54 1.92 1.10 1.74 514.8 0.56 0.74
4 Glove 2 P3 4.39 4.44 1.44 3.09 514.8 0.72 0.74
4 Glove 2 P4 5.43 5.47 1.81 3.02 514.8 0.92 0.74
4 Glove 3 P1 3.06 3.10 1.17 2.65 693.6 0.59 1.00
4 Glove 3 P2 3.54 1.91 1.22 1.57 693.6 0.61 1.00
4 Glove 3 P3 4.39 4.44 1.55 2.87 693.6 0.78 1.00
4 Glove 3 P4 5.43 5.47 1.96 2.79 693.6 0.99 1.00
5 Bare Hand P1 3.06 3.10 1.09 2.85 435.0 0.61 0.71
5 Bare Hand P2 3.54 1.92 1.03 1.86 435.0 0.58 0.71
5 Bare Hand P3 4.39 4.44 1.06 4.19 435.0 0.60 0.71
5 Bare Hand P4 5.43 5.48 1.30 4.21 435.0 0.73 0.71
5 Glove 1 P1 3.06 3.10 1.15 2.68 556.2 0.65 0.91
5 Glove 1 P2 3.54 1.92 1.24 1.55 556.2 0.70 0.91
5 Glove 1 P3 4.39 4.58 1.30 3.51 556.2 0.73 0.91
5 Glove 1 P4 5.43 5.47 1.69 3.24 556.2 0.95 0.91

Participant Glove
Condition
Task
Plate ID IDe MT TP
Assembly
Time
Normalized
MT
Normalized
Assembly Time
5 Glove 2 P1 3.06 3.10 1.17 2.64 573.0 0.66 0.94
5 Glove 2 P2 3.54 1.89 1.20 1.57 573.0 0.67 0.94
5 Glove 2 P3 4.39 4.44 1.29 3.45 573.0 0.72 0.94
5 Glove 2 P4 5.43 5.47 1.32 4.14 573.0 0.74 0.94
5 Glove 3 P1 3.06 3.10 1.22 2.55 612.6 0.69 1.00
5 Glove 3 P2 3.54 1.92 1.28 1.50 612.6 0.72 1.00
5 Glove 3 P3 4.39 4.43 1.28 3.46 612.6 0.72 1.00
5 Glove 3 P4 5.43 5.47 1.78 3.08 612.6 1.00 1.00
6 Bare Hand P1 3.06 3.09 0.92 3.36 250.8 0.61 0.65
6 Bare Hand P2 3.54 1.90 1.05 1.81 250.8 0.70 0.65
6 Bare Hand P3 4.39 4.44 1.03 4.31 250.8 0.68 0.65
6 Bare Hand P4 5.43 5.47 1.24 4.42 250.8 0.82 0.65
6 Glove 1 P1 3.06 3.10 0.99 3.13 361.8 0.66 0.94
6 Glove 1 P2 3.54 1.89 1.08 1.75 361.8 0.72 0.94
6 Glove 1 P3 4.39 4.43 1.16 3.81 361.8 0.77 0.94
6 Glove 1 P4 5.43 5.47 1.38 3.97 361.8 0.92 0.94
6 Glove 2 P1 3.06 3.08 0.95 3.26 304.8 0.63 0.79
6 Glove 2 P2 3.54 1.92 0.93 2.07 304.8 0.62 0.79
6 Glove 2 P3 4.39 4.43 1.12 3.96 304.8 0.75 0.79
6 Glove 2 P4 5.43 5.47 1.40 3.91 304.8 0.93 0.79
6 Glove 3 P1 3.06 3.10 0.97 3.20 384.0 0.64 1.00
6 Glove 3 P2 3.54 1.92 1.00 1.92 384.0 0.67 1.00
6 Glove 3 P3 4.39 4.43 1.07 4.13 384.0 0.71 1.00
6 Glove 3 P4 5.43 5.47 1.50 3.64 384.0 1.00 1.00
7 Bare Hand P1 3.06 3.09 1.07 2.88 318.0 0.65 0.71
7 Bare Hand P2 3.54 1.88 1.22 1.54 318.0 0.74 0.71
7 Bare Hand P3 4.39 4.44 1.26 3.52 318.0 0.77 0.71
7 Bare Hand P4 5.43 5.48 1.36 4.03 318.0 0.83 0.71
7 Glove 1 P1 3.06 3.10 1.11 2.79 445.8 0.67 1.00
7 Glove 1 P2 3.54 1.89 1.24 1.53 445.8 0.75 1.00
7 Glove 1 P3 4.39 4.44 1.46 3.04 445.8 0.89 1.00
7 Glove 1 P4 5.43 5.48 1.64 3.33 445.8 1.00 1.00
7 Glove 2 P1 3.06 3.09 1.09 2.84 447.0 0.66 1.00
7 Glove 2 P2 3.54 1.89 1.16 1.64 447.0 0.70 1.00
7 Glove 2 P3 4.39 4.43 1.29 3.44 447.0 0.78 1.00
7 Glove 2 P4 5.43 5.48 1.45 3.77 447.0 0.88 1.00
7 Glove 3 P1 3.06 3.09 1.11 2.77 435.6 0.68 0.97

Participant Glove
Condition
Task
Plate ID IDe MT TP
Assembly
Time
Normalized
MT
Normalized
Assembly Time
7 Glove 3 P2 3.54 1.90 1.22 1.55 435.6 0.74 0.97
7 Glove 3 P3 4.39 4.43 1.36 3.26 435.6 0.83 0.97
7 Glove 3 P4 5.43 5.48 1.65 3.33 435.6 1.00 0.97
8 Bare Hand P1 3.06 3.10 0.84 3.68 483.6 0.64 0.98
8 Bare Hand P2 3.54 1.92 0.98 1.96 483.6 0.74 0.98
8 Bare Hand P3 4.39 4.45 0.95 4.70 483.6 0.72 0.98
8 Bare Hand P4 5.43 5.47 1.24 4.41 483.6 0.94 0.98
8 Glove 1 P1 3.06 3.10 0.94 3.31 447.0 0.71 0.91
8 Glove 1 P2 3.54 1.87 1.01 1.86 447.0 0.76 0.91
8 Glove 1 P3 4.39 4.45 1.08 4.13 447.0 0.82 0.91
8 Glove 1 P4 5.43 5.46 1.24 4.39 447.0 0.94 0.91
8 Glove 2 P1 3.06 3.10 0.89 3.48 426.0 0.68 0.86
8 Glove 2 P2 3.54 1.89 0.97 1.94 426.0 0.74 0.86
8 Glove 2 P3 4.39 4.44 0.99 4.49 426.0 0.75 0.86
8 Glove 2 P4 5.43 5.47 1.27 4.29 426.0 0.97 0.86
8 Glove 3 P1 3.06 3.09 0.87 3.55 493.2 0.66 1.00
8 Glove 3 P2 3.54 1.88 0.95 1.98 493.2 0.72 1.00
8 Glove 3 P3 4.39 4.45 1.09 4.07 493.2 0.83 1.00
8 Glove 3 P4 5.43 5.46 1.32 4.14 493.2 1.00 1.00
9 Bare Hand P1 3.06 3.10 1.11 2.79 384.6 0.60 0.61
9 Bare Hand P2 3.54 1.91 1.12 1.70 384.6 0.60 0.61
9 Bare Hand P3 4.39 4.44 1.15 3.86 384.6 0.62 0.61
9 Bare Hand P4 5.43 5.48 1.26 4.34 384.6 0.68 0.61
9 Glove 1 P1 3.06 3.09 1.11 2.79 514.8 0.60 0.82
9 Glove 1 P2 3.54 1.89 1.17 1.61 514.8 0.63 0.82
9 Glove 1 P3 4.39 4.43 1.42 3.12 514.8 0.77 0.82
9 Glove 1 P4 5.43 5.47 1.52 3.61 514.8 0.82 0.82
9 Glove 2 P1 3.06 3.11 1.09 2.84 627.6 0.59 1.00
9 Glove 2 P2 3.54 1.89 1.16 1.64 627.6 0.62 1.00
9 Glove 2 P3 4.39 4.44 1.15 3.87 627.6 0.62 1.00
9 Glove 2 P4 5.43 5.47 1.58 3.47 627.6 0.85 1.00
9 Glove 3 P1 3.06 3.10 1.09 2.84 561.0 0.59 0.89
9 Glove 3 P2 3.54 1.92 1.22 1.57 561.0 0.66 0.89
9 Glove 3 P3 4.39 4.43 1.37 3.23 561.0 0.74 0.89
9 Glove 3 P4 5.43 5.47 1.86 2.94 561.0 1.00 0.89
10 Bare Hand P1 3.06 3.10 1.28 2.43 614.4 0.68 1.00
10 Bare Hand P2 3.54 1.88 1.22 1.54 614.4 0.65 1.00

Participant Glove
Condition
Task
Plate ID IDe MT TP
Assembly
Time
Normalized
MT
Normalized
Assembly Time
10 Bare Hand P3 4.39 4.44 1.10 4.05 614.4 0.58 1.00
10 Bare Hand P4 5.43 5.49 1.88 2.91 614.4 1.00 1.00
10 Glove 1 P1 3.06 3.10 1.44 2.15 561.0 0.77 0.91
10 Glove 1 P2 3.54 1.86 1.27 1.46 561.0 0.67 0.91
10 Glove 1 P3 4.39 4.43 1.28 3.47 561.0 0.68 0.91
10 Glove 1 P4 5.43 5.48 1.66 3.31 561.0 0.88 0.91
10 Glove 2 P1 3.06 3.10 1.29 2.40 439.8 0.69 0.72
10 Glove 2 P2 3.54 1.90 1.25 1.52 439.8 0.66 0.72
10 Glove 2 P3 4.39 4.43 1.11 3.99 439.8 0.59 0.72
10 Glove 2 P4 5.43 5.48 1.63 3.36 439.8 0.87 0.72
10 Glove 3 P1 3.06 3.10 1.21 2.57 513.6 0.64 0.84
10 Glove 3 P2 3.54 1.90 1.28 1.49 513.6 0.68 0.84
10 Glove 3 P3 4.39 4.43 1.26 3.53 513.6 0.67 0.84
10 Glove 3 P4 5.43 5.48 1.88 2.91 513.6 1.00 0.84
11 Bare Hand P1 3.06 3.08 0.81 3.78 361.2 0.58 0.72
11 Bare Hand P2 3.54 1.87 0.77 2.44 361.2 0.55 0.72
11 Bare Hand P3 4.39 4.43 0.98 4.52 361.2 0.70 0.72
11 Bare Hand P4 5.43 5.47 1.10 4.97 361.2 0.79 0.72
11 Glove 1 P1 3.06 3.07 0.86 3.57 438.0 0.62 0.88
11 Glove 1 P2 3.54 1.85 0.86 2.16 438.0 0.62 0.88
11 Glove 1 P3 4.39 4.45 1.17 3.81 438.0 0.84 0.88
11 Glove 1 P4 5.43 5.47 1.33 4.13 438.0 0.95 0.88
11 Glove 2 P1 3.06 3.07 0.82 3.77 429.6 0.59 0.86
11 Glove 2 P2 3.54 1.87 0.80 2.34 429.6 0.57 0.86
11 Glove 2 P3 4.39 4.45 1.01 4.41 429.6 0.72 0.86
11 Glove 2 P4 5.43 5.48 1.21 4.53 429.6 0.87 0.86
11 Glove 3 P1 3.06 3.08 0.88 3.49 500.4 0.63 1.00
11 Glove 3 P2 3.54 1.87 0.87 2.16 500.4 0.62 1.00
11 Glove 3 P3 4.39 4.43 1.03 4.30 500.4 0.74 1.00
11 Glove 3 P4 5.43 5.48 1.39 3.93 500.4 1.00 1.00
12 Bare Hand P1 3.06 3.10 0.86 3.62 313.2 0.53 0.83
12 Bare Hand P2 3.54 1.90 0.97 1.97 313.2 0.60 0.83
12 Bare Hand P3 4.39 4.44 0.89 4.99 313.2 0.56 0.83
12 Bare Hand P4 5.43 5.47 1.23 4.43 313.2 0.77 0.83
12 Glove 1 P1 3.06 3.10 0.89 3.48 377.4 0.56 1.00
12 Glove 1 P2 3.54 1.92 0.98 1.95 377.4 0.61 1.00
12 Glove 1 P3 4.39 4.42 1.03 4.30 377.4 0.64 1.00

Participant Glove
Condition
Task
Plate ID IDe MT TP
Assembly
Time
Normalized
MT
Normalized
Assembly Time
12 Glove 1 P4 5.43 5.48 1.38 3.97 377.4 0.86 1.00
12 Glove 2 P1 3.06 3.10 0.88 3.54 321.6 0.55 0.85
12 Glove 2 P2 3.54 1.89 1.03 1.84 321.6 0.64 0.85
12 Glove 2 P3 4.39 4.43 0.98 4.54 321.6 0.61 0.85
12 Glove 2 P4 5.43 5.48 1.27 4.33 321.6 0.79 0.85
12 Glove 3 P1 3.06 3.10 0.83 3.74 365.4 0.52 0.97
12 Glove 3 P2 3.54 1.91 0.96 1.99 365.4 0.60 0.97
12 Glove 3 P3 4.39 4.43 1.02 4.35 365.4 0.64 0.97
12 Glove 3 P4 5.43 5.48 1.60 3.42 365.4 1.00 0.97
13 Bare Hand P1 3.06 3.10 1.17 2.66 427.8 0.71 0.77
13 Bare Hand P2 3.54 1.87 1.24 1.50 427.8 0.75 0.77
13 Bare Hand P3 4.39 4.44 1.26 3.53 427.8 0.76 0.77
13 Bare Hand P4 5.43 5.47 1.47 3.73 427.8 0.89 0.77
13 Glove 1 P1 3.06 3.10 1.15 2.69 493.8 0.70 0.89
13 Glove 1 P2 3.54 1.88 1.32 1.43 493.8 0.80 0.89
13 Glove 1 P3 4.39 4.44 1.41 3.16 493.8 0.85 0.89
13 Glove 1 P4 5.43 5.48 1.62 3.39 493.8 0.98 0.89
13 Glove 2 P1 3.06 3.09 1.19 2.61 554.4 0.72 1.00
13 Glove 2 P2 3.54 1.89 1.31 1.44 554.4 0.79 1.00
13 Glove 2 P3 4.39 4.44 1.29 3.44 554.4 0.78 1.00
13 Glove 2 P4 5.43 5.47 1.55 3.54 554.4 0.93 1.00
13 Glove 3 P1 3.06 3.08 1.13 2.72 483.0 0.69 0.87
13 Glove 3 P2 3.54 1.89 1.35 1.40 483.0 0.82 0.87
13 Glove 3 P3 4.39 4.44 1.35 3.28 483.0 0.82 0.87
13 Glove 3 P4 5.43 5.47 1.66 3.30 483.0 1.00 0.87
14 Bare Hand P1 3.06 3.10 0.86 3.63 378.6 0.53 0.69
14 Bare Hand P2 3.54 1.90 0.97 1.96 378.6 0.60 0.69
14 Bare Hand P3 4.39 4.44 0.89 4.98 378.6 0.56 0.69
14 Bare Hand P4 5.43 5.47 1.23 4.43 378.6 0.77 0.69
14 Glove 1 P1 3.06 3.10 0.89 3.47 552.0 0.56 1.00
14 Glove 1 P2 3.54 1.89 0.98 1.92 552.0 0.61 1.00
14 Glove 1 P3 4.39 4.43 1.03 4.32 552.0 0.64 1.00
14 Glove 1 P4 5.43 5.46 1.38 3.96 552.0 0.86 1.00
14 Glove 2 P1 3.06 3.09 0.88 3.53 439.8 0.55 0.80
14 Glove 2 P2 3.54 1.90 1.03 1.85 439.8 0.64 0.80
14 Glove 2 P3 4.39 4.43 0.98 4.55 439.8 0.61 0.80
14 Glove 2 P4 5.43 5.47 1.27 4.32 439.8 0.79 0.80

Participant Glove
Condition
Task
Plate ID IDe MT TP
Assembly
Time
Normalized
MT
Normalized
Assembly Time
14 Glove 3 P1 3.06 3.11 0.83 3.75 511.8 0.52 0.93
14 Glove 3 P2 3.54 1.88 0.96 1.96 511.8 0.60 0.93
14 Glove 3 P3 4.39 4.44 1.02 4.35 511.8 0.64 0.93
14 Glove 3 P4 5.43 5.47 1.60 3.42 511.8 1.00 0.93
15 Bare Hand P1 3.06 3.09 0.84 3.68 433.8 0.64 0.57
15 Bare Hand P2 3.54 1.88 0.98 1.92 433.8 0.74 0.57
15 Bare Hand P3 4.39 4.44 0.95 4.68 433.8 0.72 0.57
15 Bare Hand P4 5.43 5.48 1.24 4.42 433.8 0.94 0.57
15 Glove 1 P1 3.06 3.12 0.94 3.33 692.4 0.71 0.91
15 Glove 1 P2 3.54 1.93 1.01 1.91 692.4 0.76 0.91
15 Glove 1 P3 4.39 4.41 1.08 4.09 692.4 0.82 0.91
15 Glove 1 P4 5.43 5.47 1.24 4.40 692.4 0.94 0.91
15 Glove 2 P1 3.06 3.10 0.89 3.49 547.2 0.68 0.72
15 Glove 2 P2 3.54 1.90 0.97 1.96 547.2 0.74 0.72
15 Glove 2 P3 4.39 4.43 0.99 4.47 547.2 0.75 0.72
15 Glove 2 P4 5.43 5.48 1.27 4.30 547.2 0.97 0.72
15 Glove 3 P1 3.06 3.10 0.87 3.56 762.2 0.66 1.00
15 Glove 3 P2 3.54 1.89 0.95 1.98 762.2 0.72 1.00
15 Glove 3 P3 4.39 4.41 1.09 4.04 762.2 0.83 1.00
15 Glove 3 P4 5.43 5.48 1.32 4.16 762.2 1.00 1.00


![Sanando a Los Enfermos [Robert Fitts] ~Book](https://img.dokumen.tips/doc/110x75/55cf9969550346d0339d42d3/sanando-a-los-enfermos-robert-fitts-book.jpg)


![Give Me This Mountain [Robert Fitts] ~Book](https://img.dokumen.tips/doc/110x75/577cdaa41a28ab9e78a62298/give-me-this-mountain-robert-fitts-book.jpg)


