Embed Size (px)
Citation preview

SSRG International Journal of Agriculture and Environmental Science Volume 7 Issue 6, 38-54, Nov-Dec 2020
ISSN: 2394 – 2568 /doi:10.14445/23942568/IJAES-V7I6P105 © 2020 Seventh Sense Research Group®
This is an open access article under the CC BY-NC-ND license (http://creativecommons.org/licenses/by-nc-nd/4.0/)
Evaluation of Elite Bread Wheat Selections
from the CIMMYT for Crop Production
Ibrahim Naser*, 1, Emiliano Olbinado1, Abu Kashem Abdul Hakeem2
1Previous Address: Research Dept., TADCO, Tabuk 71421, P O Box 808, Saudi Arabia 2Present Address: Laboratory Unit, TADCO, Tabuk 71421, P O Box 808, Saudi Arabia
*Present Address: Marj Al-Hammam, Amman, Jordan
ABSTRACT
Two years field trials on 29 bread wheat entries/varieties of
the 3rd Elite Bread Wheat from the CIMMYT along with
Yecora Rojo variety were conducted in 2008 – 2010.
Productivity of the entries in 2008 season ranged 6.77 – 9.6
M.T; the yield of Yecora Rojo ranked 7th with 8.19 M.T. /Ha.
Test harvest on ten selected entries/varieties in 2009 season
ranged 9.32 – 10.02 M.T. /Ha. Increased productivity in
2009 season was mainly due to mild weather during the
grains filling period. Production increase lead to less
%crude protein in the grains and the flour samples, but
%starch in the grains was increased. Zeleny number which
measures the quality and quantity of the grains gluten was
less than in 2008, but still high with value 51.67.
Field tests & Lab tests showed four entries/varieties of high
quality and high productivity # 19, 24, 11 and 25; also two
entries/varieties of high productivity # 27, 29 and two
entries/varieties of high quality # 4 and 8. The selected
entries/varieties shown promising results towards the
development of new varieties suitable for the end user.
Summary descriptions of the top three entries/varieties were:
Entry # 19: height 82.2 cm, maturity 145 days, grains color
light red, protein 14.02%, Zeleny number 55.32, %wet gluten
34.68, %ash 1.03, %water absorption 61.97, high yield and
high quality. Entry # 24: height 87.7 cm, maturity 145 days,
grains color white, protein 14.02%, Zeleny number 53.46,
%wet gluten 32.16, %ash 1.11, %water absorption 62.0,
high yield and high quality. Entry # 11: height 94.2 cm,
maturity 145 days, grains color light red, protein 13.28%,
Zeleny number 49.88, %wet gluten 30.16, %ash 1.13,
%water absorption 62.07, high yield and high Quality.
Keywords: Bread Wheat, %Crude Protein, %Wheat Starch,
Zeleny Number, Grain & Flour Analyzer
I. INTRODUCTION
Wheat crop is an important crop worldwide as it provides
more nourishment for humans more than any other food crop
[1]. Due to increased demand for wheat commodity to satisfy
the increased population in Saudi Arabia, they put plans by
the end of 1977 to expand growing this crop under Centre
pivot irrigation system to reach self-sufficiency in the
production of this crop. After testing different bread wheat
varieties including Pro-bread, West-bread and Yecora Rojo,
the Saudi farmers chose Yecora Rojo which became the
dominant bread wheat variety grown under Centre pivot
irrigation system in all agricultural areas in this country [2].
As per TADCO strategy plans to test new varieties of bread
wheat of high productivity and promising technological
characters, the company tested during the period 2000 - 2011
different bread wheat varieties in coordination with the Seeds
Producers Committee (SPC) and the Saudi Ministry of
Agriculture (MOA) in Riyadh to get new varieties of desired
quality by the end user. For this purpose, TADCO research
unit tested in 2001/2002 cropping seasons eight American
bread wheat varieties under code numbers 81470 to 81477 in
addition of five hard white bread wheat varieties from the
MOA: Tia, Kauz, Irena, Parus, HD-2329 . In 2004 – 2006,
the company conducted three years field trials on four
Australian wheat varieties for the purpose of processing good
quality bread, hard pastry and noodles [3]. No final
agreement with the Australian seeds companies was
materialized to localize the cultivation of the selected
varieties. So, TADCO directed their research unit towards
investigating new varieties/entries from the CIMMYT under
the name 3rd Elite bread wheat (3rdEBW). The research unit
conducted trials in 2008 and 2009 cropping seasons on 29
elite bread wheat selections [4]. The seeds samples brought
from the CIMMYT nurseries to TADCO on January 13,
2008 through the Research Department of the Ministry of
Agriculture in Riyadh, Saudi Arabia.
This article is a review of research work carried out at
TADCO by the authors on 29 wheat entries/varieties in
addition of the local variety Yecora Rojo during the period
2008 – 2010. The purpose of this study was to conduct field
trials on these entries/varieties to choose out of them
varieties of high productivity with high quality.
II. MATERIALS & METHODS
Land Preparation: Pre-irrigation of the trials area for two
rounds of irrigation was carried at a speed of 20% with a
total amount of 45 – 50 mm, then wait for two weeks to
encourage weeds germination then irrigate two rounds of
total 12 mm. Plow the soil when it reached proper moisture
conditions by cross chisel plow at a depth of 30 cm in the
opposite direction (45° angle), then one pass of pipe
levelling. Broadcast granular fertilizer 14-38-10 at the trial
area at a rate of 280 kg/Ha before sowing the seeds then

Ibrahim Naser et al. / IJAES, 7(5), 38-54, 2020
39
mixing the fertilizer into the soil surface with shallow
disking before sowing the seeds.
Trials Layout: Two wheat field trials were conducted: The
first trial was conducted on January 21, 2008 relatively late
due to delay in receiving the seeds samples from the supplier.
This trial included 29 entries/varieties in addition to the local
variety Yecora Rojo as control, the trial was arranged into a
randomized complete block design (RCBD) [4]. Each
entry/variety was arranged into three replicated plots, each
plot was five meter length and one meter width with an area
of 5 M2/plot, and the planted area of each entry was 15 M2.
One meter was left between each plot, and three meters
between the blocks, and the total number of plots was 90, see
Figure 1A. The seeds of each entry were sown manually into
the corresponding plot and arranged into five rows at 20 cm
distance and at a depth of sowing 2-3 cm. The seeds were
manually covered by hand rake, and one round of light
irrigation at low pressure 10- 15 psi was carried out on daily
bases until germination was started.
The second trial was conducted on December 29, 2008, and
the seeds source was from the harvest of 2008 wheat trial.
The trial consisted 9 entries/varieties which shown promising
yield and quality in addition to Yecora Rojo; the trial was
arranged into a randomized complete block design (RCBD).
Each entry/variety was arranged into five replicated plots;
each plot was five meter length and four meter width with an
area of 20 M2/plot. One meter was left between each plot,
and three meters was left between the blocks; the total
number of plots was 50, see Figure 1B. The seeds were
broadcasted manually into the corresponding plots then
covered manually by hand rake. One round of light irrigation
At low pressure 10 – 15 psi was carried out on daily bases
until germination was started.
Crop Maintenance: Daily activities for crop maintenance
was carried out by research personnel and involved irrigation
of 9 – 12 mm / day during the hottest period of the weeks
and in winter months irrigation was scheduled for one day on
and one day off; intervals were dependent on the soil
moisture. Injection of soluble fertilizers as per the crop
needs, Broadleaves weeds and grasses infestations were
controlled at the 3-5 leaves stage by spraying mixture of
herbicides Shaheen 10 gram + Bromoxynil 150 ml/100 liter
of water 40 days after sowing.
Trials Methods and Data Recording: To compare the
different entries/cultivars with each other and with the
control variety Yecora Rojo: research personnel were
directed to monitor each trial during the growing season and
collect grains samples after harvest to study the agronomic
and quality characters of the varieties. For the agronomic
characters they recorded the following data: number of
plants/M2, number of tillers/plant, spike length, Plants height,
number of seeds/spike, number of days for 100% heading,
date of maturity, 1000 grains weight (TGW) & estimation of
cultivars productivity M.T./Ha., disease incidence, resistance
to lodging, resistance to shattering, %black point. For the
quality characters of the entries/varieties, grain samples of
each entry of each season, each 2 kg were collected and sent
to the laboratory for grains and flour analysis. Each sample
was analyzed using Grain Analyzer Infratec 1241 for the
following tests: test weight, %crude protein, %moisture
content, %starch, %wet gluten, Zeleny test [5], and manually
conducted TGW, %black point. Another part of the grains
sample of each entry was milled to get flour sample and
conduct the following tests: %crude protein, %moisture
content, %ash, %wet gluten and %water absorption.
Figure 1. A- Layout of 29 bread wheat entries/varieties + Yecora Rojo as control for the 2008 field trial. B- Layout of
ten selected bread wheat entries/varieties for the 2009 field trial.
Figure A Figure B

Ibrahim Naser et al. / IJAES, 7(5), 38-54, 2020
40
Before the final harvest of 2008 trial, test harvest was
conducted by harvesting representative samples; each sample
is one square meter taken from two spots in each plot. To
compare the entries/varieties with each other, the 5M2 plots
of 2008 trial were manually harvested by the 1st of June
2008, and kept separately into labelled jute bags, then
threshing the wheat straw of each bag, cleaned the grains and
kept them into labelled plastic bags for further analysis. The
harvest of 2009 trial was carried out by 1st of June 2009. Due
to the shortage of time and unavailability of labors for
manual harvest of this trial, we conducted test harvest on this
trial in a similar manner of 2008 test harvest. The harvested
samples were processed for further analysis in a similar
manner of 2008 trial. Then we recorded the productivity of
each entry/variety as Kg/M2.
Statistical analysis for the productivity of the wheat
entries/varieties was carried out using Statistics10 to measure
the significance difference between the wheat entries.
III. RESULTS & DISCUSSION
Observations on the 2008 field wheat trial:
A1- Agronomic Characters [3]: The results on the
agronomic characters of the 30 entries/varieties in the 2008
cropping season are presented in Table 1 and Figure 2, we
observed the following:
1- Plant height: All of the varieties were relatively short and
ranged 64.63 – 94.60 cm; Yecora Rojo was the shortest with
64.63 cm followed in ascending order the entries # 19, 18, 5
and 6 with 76.53. 81.60. 82.93. 82.97 centimeter
respectively. It is desired to get a dwarf variety to overcome
lodging problem.
2- Number of days for 100% heading: It is desired to get an
early heading variety to escape hot weather during the grains
filling period, and it ranged 85 – 94 days. We observed the
earliest entry/variety reaching 100% heading in ascending
order was entry # 20, 27, 21. 10, 17, 19 with 85, 86, 87, 88,
88, 88 days respectively, and these entries were earlier than
Yecora Rojo which reached 90 days.
3- Number of days for maturity: It is desired to get an early
maturing variety to save energy & water, and it ranged 119 –
126 days. We observed the earliest maturing variety in
ascending order was entry # 20, 21, 22, 12, 6, 9, with 119,
120, 120, 121, 121, 121 days respectively; Yecora Rojo was
with 121 days.
4- Length of spike: Increased spike length leads to more
seeds/spike as it is an indicator for higher yield, and it ranged
10.38 – 13.63 cm. We observed the following entries in
descending order with long spikes: # 17, 15, 14, 28, 23, 25
with 13.63, 13.36, 13.29, 13.17, 12.96, 12.93 cm
respectively; Yecora Rojo was with 11.23 cm.
5- Number of spikes/ M2: It is an important parameter
affecting the potential yield of a particular variety as it is
desired to get a variety with more spikes / M2, and it ranged
446 – 694 spikes. We observed the following entries in
ascending order for more spikes / M2: # 5, 2, 4, 28, 27 with
446, 513, 526, 531, 532 spikes, and the highest was entry #
18 with 694 spikes; Yecora Rojo was with 625 spikes/ M2.
6- Number of seeds/Spike: It is an important parameter
affecting the potential yield of a particular variety, and it
ranged 56 – 71 seeds/spike. We observed the number of
seeds per spikes in ascending order the entries # 6, 9, 7, 21, 8
with 56, 56, 57, 57, 59 respectively and the highest was entry
# 29 with 71 seeds/spikes; Yecora Rojo was with 56
seeds/spike
7- Specific Weight: It is an important parameter affecting the
potential yield of a particular variety; it was carried out by
the grain analyzer, and it is expressed as test weight kg/hl
and it ranged 79.37 – 84.20 gram/hl. We observed the
highest specific weight on the following entries in
descending order: # 29, 17, 30, 10, 13 with test weight 84.20,
84.00, 83.67, 82.67, 82.47 kg/hl; Yecora Rojo was with
81.40 kg/hl.
7- One Thousand Grains weight (TGW): This is another
measure of specific weight which was carried out manually,
and expressed as weight in grams per 1000 grains. The
results shown TGW ranged 38.74 – 49.48 grams/1000 grains
which was very high. We observed high TGW value on the
following entries/varieties in descending order # 3, 2, 17, 14,
25 and Yecora Rojo with 49.48, 48.05, 46.92, 46,86, 46.64
,46.58 grams respectively. Increased TGW indicates good
grains quality.
9- % Black Point: It is defined as the black color on the
embryo tip of the wheat grains due to late irrigation of the
wheat crop, and it ranged 0.09 – 0.58 %. We observed the
%black point in ascending order on the entries # 9, 11, 28, 8,
29, 15 was 0.08, 0.1, 0.1, 0.12, 0.13, 0.14 respectively;
Yecora Rojo was the lowest with 0.08%.
No serious wheat disease such as rusts, smuts, Septoria etc.
was observed on the third elite bread wheat (3rd EBW)
entries/varieties during the trials period.
B1- Productivity [3]: Data on the mean productivity of each
entry/variety Kg/M2 shown in Table. 1 was calculated as
metric ton per hectare. Entry # 29 produced the highest yield
as it reached 9.6 M.T. /Ha followed by entry # 19 with 9.13
M.T./Ha then entry # 25 with 8.73 M.T./Ha then entry # 11
with 8.65 M.T./Ha then entry # 27 with 8.47 M.T./Ha ;
Yecora Rojo rank 7th with productivity 8.19 M.T./Ha. The
lowest productivity was 6.77 M.T. /Ha for entry # 2, see
Figure 3. Productivity of entry # 29 was the highest due to
high number of spikes/M2 which reached around 672 spikes

Ibrahim Naser et al. / IJAES, 7(5), 38-54, 2020
41
Table 1. Summary for the agronomic characters of the 3rd EBW entries/varieties in 2008 cropping season.
Entry Number
Area
(M2)
Plant
Height in
cm.
No. of
Days at 100%
Heading
No. of Days
for
Maturity
Spike
length
in cm.
No. of
Spike
s per
M2
No. of
Seeds per
Spike
TGW
Specifi
c Weight
Kg/HL
Productio
n Kg/5 M2
Yield
M.T./H
a
Potential
Yield M.T.
/Ha.
%Black
Point by
Weight
Y. R.* 15 64.6 90 121 11.2 625 55.6 41.
8 81.4 12.3 8.2 9.5
0.08
2 15 87.3 92 126 11.2 513 66.6 48.
1 81.0 10.2 6.8 8.0
0.91
3 15 85.1 91 123 10.7 607 66.3 49.
5 80.1 10.2 6.8 8.4
0.56
4 15 89.4 91 124 10.9 526 66.2 46.
5 80.1 11.1 7.4 8.7
0.49
5 15 82.9 92 125 11.5 446 68.9 44.
9 79.4 11.0 7.3 8.8
0.16
6 15 83.0 91 121 10.8 578 55.6 42.
3 82.4 11.6 7.8 9.2
0.18
7 15 92.4 89 124 12.1 564 57.2 48.
6 83.1 11.3 7.5 9.2
0.32
8 15 90.0 89 123 10.3 631 58.8 44.
2 82.0 11.2 7.5 9.2
0.12
9 15 64.6 90 121 11.2 625 55.6 41.
8 81.4 12.3 8.2 9.5
0.09
10 15 86.1 88 124 10.6 599 66.4 44.
1 82.7 12.2 8.1 9.2
0.26
11 15 90.8 89 124 11.4 655 63.0 44.
1 80.6 13.0 8.7 9.7
0.10
12 15 83.4 89 121 10.4 672 60.9 43.
6 81.9 11.6 7.7 8.8
0.15
13 15 95.7 93 125 12.8 592 60.3 46.
4 82.5 11.1 7.4 8.7
0.39
14 15 93.9 94 127 13.3 532 63.4 46.
9 81.7 11.9 7.9 9.1
0.50
15 15 92.7 94 125 13.4 589 67.2 45.
1 82.2 11.7 7.8 8.8
0.14
16 15 92.1 92 125 13.0 607 63.7 43.
1 81.5 12.1 8.0 9.3
0.53
17 15 86.3 88 121 13.6 510 70.9 46.
9 84.0 12.1 8.1 10.0
0.31
18 15 81.6 90 126 11.7 694 69.6 40.
5 81.3 11.0 7.3 8.8
0.22
19 15 76.5 88 121 11.7 630 66.9 39.
1 81.9 13.7 9.1 10.6
0.16
20 15 85.0 85 119 10.9 666 61.1 43.
5 82.1 11.6 7.8 9.5
0.13
21 15 85.5 87 120 11.0 636 56.6 40.
9 79.7 11.3 7.5 9.6
0.50
22 15 94.5 90 120 12.8 623 58.7 47.
1 81.6 12.4 8.3 10.3
0.43
23 15 90.1 89 124 13.0 570 66.3 49.
6 82.2 12.0 8.0 10.4
0.58
24 15 85.9 91 123 12.6 657 59.6 38.
7 81.8 12.1 8.1 9.1
0.47
25 15 92.6 89 125 12.9 590 61.5 46.
6 82.5 13.1 8.7 9.5
0.28

Ibrahim Naser et al. / IJAES, 7(5), 38-54, 2020
42
26 15 86.7 91 123 11.6 596 66.2 43.
9 81.7 12.7 8.5 9.2
0.16
27 15 88.1 86 123 11.6 532 68.8 47.
5 82.1 12.7 8.5 9.7
0.19
28 15 87.5 93 124 13.2 531 69.4 45.
5 82.0 11.2 7.5 9.2
0.10
29 15 94.6 90 124 10.9 672 63.9 41.
4 84.2 14.4 9.6 10.5
0.13
30 15 84.5 91 123 13.9 571 71.1 46.
6 83.7 11.7 7.8 8.5
0.23
* Y. R.: Yecora Rojo
Figure 2, Different wheat plants plots of the entries/varieties of the 3rd EBW on April 11, 2008.
Figure 3, Actual yield and potential yield of the 3rd EBW entries/varieties in 2008 cropping season
per M2 and high test weight which reached 84.20 Kg/hl. The
potential yield of each entry/variety was estimated from the
agronomic data as M.T. /Ha; and it is the product of the
number spikes/M2 multiplied by the number of grains in the
spike times the weight of one thousand grains (grams)
divided by 100000.
Entry # 19 shown high yield potential under favorable
growing conditions as the estimated value reached 10.59
M.T./Ha followed by entry # 29 with 10.51 M.T./Ha then
entry # 23 with estimated value 10.39 M.T./Ha then entry #
22 with estimated value 10.34 M.T./Ha. In comparison the
potential yield for Yecora Rojo was 9.52 M.T. /Ha.
Statistical analysis for productivity kg/5M2 shown no
significant difference between the different entries due to low
number of replicates in the trial. However differences as
0
2
4
6
8
10
12
Y.R
. 2 3 4 5 6 7 8 9
10
11
12
13
14
15
16
17
18
19
20
21
22
23
24
25
26
27
28
29
30
Act. YieldM.T./Ha.
PotentialYieldM.T./Ha.
Pro
du
ctiv
ity
M.T
./H
a
Wheat Entries/Varieties
Ibrahim Naser et al. / IJAES, 7(5), 38-54, 2020
43
percentages shown the productivity of entry # 29 was higher
than Yecora Rojo by %17.22. Also Yecora Rojo productivity
was higher by %17.40 than the lowest productivity of entry #
2.
The following illustrate the detailed statistical analysis for
the entries productivity in 2008 trial as kg/5M2:
Randomized Complete Block AOV Table for Yield kg/5M2
Source DF SS MS F P
Blocks 2 6.3372 3.16858
Variety 29 8.3862 0.28918 0.87 0.6536
Error 58 19.3048 0.33284
Total 89
Grand Mean 3.9518 CV 14.60
Relative Efficiency, RCB 1.19
Means Yield for each entry Kg/5M2
Variety Mean Variety Mean Variety Mean
Y.R. 4.0933 11 4.3233 21 3.7500
2 3.3833 12 3.8533 22 4.1367
3 3.4033 13 3.6933 23 4.0100
4 3.7000 14 3.9500 24 4.0367
5 3.6533 15 3.9100 25 4.3667
6 3.8733 16 4.0200 26 4.2233
7 3.7567 17 4.0300 27 4.2367
8 3.7367 18 3.6633 28 3.7233
9 3.8200 19 4.5633 29 4.8000
10 4.0700 20 3.8767 30 3.8967
Observations per Mean 3
Standard Error of a Mean 0.3331
Std Error (Diff of 2 Means) 0.4711
C1- Grains Quality in 2008 [6], [7]:
The results of the laboratory analysis on the grains samples
of 2008 field trial is presented in Table 2, the results had
shown the following:
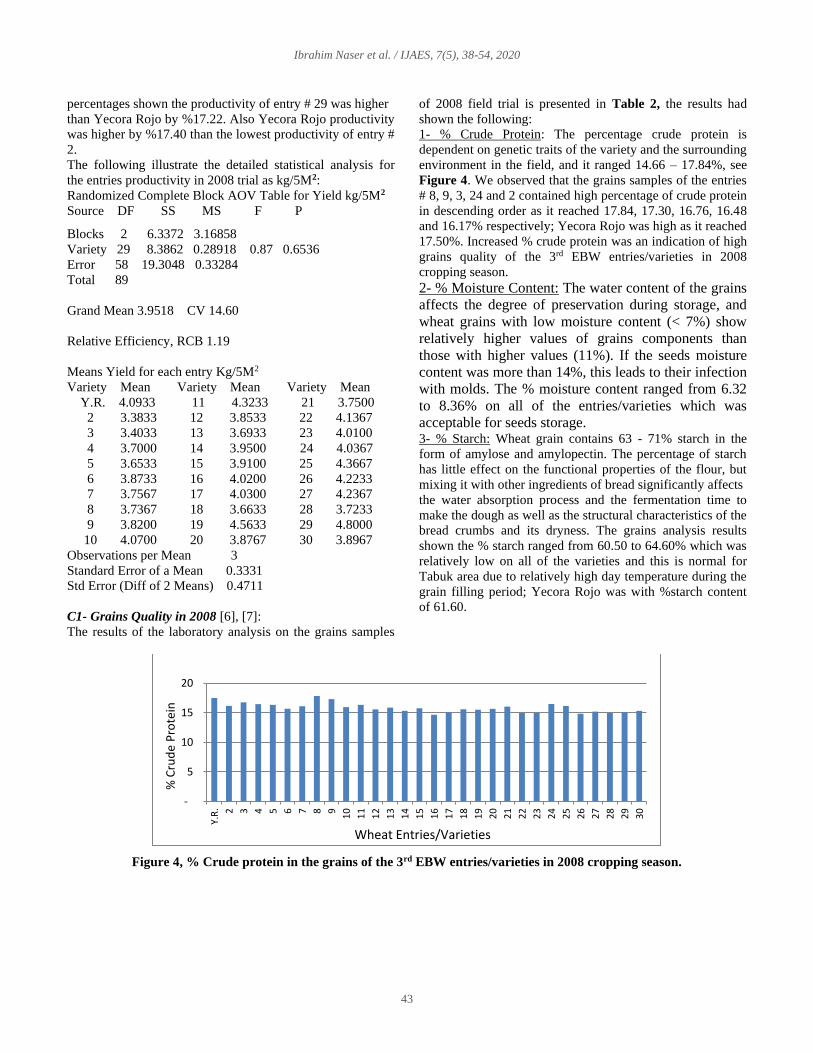
1- % Crude Protein: The percentage crude protein is
dependent on genetic traits of the variety and the surrounding
environment in the field, and it ranged 14.66 – 17.84%, see
Figure 4. We observed that the grains samples of the entries
# 8, 9, 3, 24 and 2 contained high percentage of crude protein
in descending order as it reached 17.84, 17.30, 16.76, 16.48
and 16.17% respectively; Yecora Rojo was high as it reached
17.50%. Increased % crude protein was an indication of high
grains quality of the 3rd EBW entries/varieties in 2008
cropping season.
2- % Moisture Content: The water content of the grains
affects the degree of preservation during storage, and
wheat grains with low moisture content (< 7%) show
relatively higher values of grains components than
those with higher values (11%). If the seeds moisture
content was more than 14%, this leads to their infection
with molds. The % moisture content ranged from 6.32
to 8.36% on all of the entries/varieties which was
acceptable for seeds storage. 3- % Starch: Wheat grain contains 63 - 71% starch in the
form of amylose and amylopectin. The percentage of starch
has little effect on the functional properties of the flour, but
mixing it with other ingredients of bread significantly affects
the water absorption process and the fermentation time to
make the dough as well as the structural characteristics of the
bread crumbs and its dryness. The grains analysis results
shown the % starch ranged from 60.50 to 64.60% which was
relatively low on all of the varieties and this is normal for
Tabuk area due to relatively high day temperature during the
grain filling period; Yecora Rojo was with %starch content
of 61.60.
Figure 4, % Crude protein in the grains of the 3rd EBW entries/varieties in 2008 cropping season.
-
5
10
15
20
Y.R
. 2 3 4 5 6 7 8 9
10
11
12
13
14
15
16
17
18
19
20
21
22
23
24
25
26
27
28
29
30
Wheat Entries/Varieties
% C
rud
e P
rote
in

Ibrahim Naser et al. / IJAES, 7(5), 38-54, 2020
44
Table 2. Laboratory analysis results on the grains samples of the 3rd EBW entries/varieties for 2008 cropping season.
Entry
Number
%Crude
Protein
%Moistur
e Content
%Starc
h
%Wet
Gluten Zeleny
Entry
Number
%Crude
Protein
%Moistur
e Content
%Starc
h
%Wet
Gluten Zeleny
Y.R*. 17.50 7.09 61.60 29.90 62.47 16 14.66 7.06 63.20 31.83 62.10
2 16.17 8.25 60.80 34.27 66.63 17 15.08 6.73 63.00 31.63 63.57
3 16.76 8.36 60.60 34.57 67.77 18 15.61 7.09 62.00 30.97 66.33
4 16.45 7.81 60.50 33.50 67.20 19 15.53 6.61 64.60 32.13 56.50
5 16.32 7.60 61.40 33.63 67.23 20 15.64 6.42 63.00 29.60 66.17
6 15.68 6.90 62.40 38.23 66.70 21 16.04 6.67 62.40 29.37 66.27
7 16.12 7.11 61.90 34.00 67.03 22 14.95 6.32 63.40 31.07 59.33
8 17.84 6.72 61.00 33.30 68.23 23 15.00 6.49 63.30 32.23 60.57
9 17.30 6.89 62.00 35.73 66.57 24 16.48 6.56 61.70 32.30 67.60
10 15.95 6.63 62.90 30.73 66.90 25 16.14 6.89 62.00 32.53 67.57
11 16.32 6.36 62.70 30.33 67.20 26 14.85 6.66 63.50 28.33 61.10
12 15.58 6.44 62.30 32.37 66.07 27 15.18 6.71 63.50 28.93 61.73
13 15.88 7.02 62.90 35.50 65.83 28 14.94 6.84 63.50 29.97 64.23
14 15.33 6.97 62.60 33.27 65.63 29 15.11 6.47 62.90 28.80 64.57
15 15.77 6.69 63.50 32.07 66.63 30 15.33 6.58 62.20 29.33 63.57
4- % Wet Gluten: Gluten is the name of wheat grains protein,
and it ranged 28.33 – 38.23%. We observed that the grains
samples of the entries/varieties # 6, 9, 13, 3, 2 and 7
contained high percentage of wet gluten in descending order
as it reached 38.23, 35.73, 35.50, 34.57, 34.27, 34.00 %
respectively; Yecora Rojo reached 29.60%. Increased %wet
gluten is an indication of good grains quality.
5- Zeleny Number [8]: This parameter measures the quality
and quantity of gluten; the components of wheat gluten are
glutenin and gliadin. High Zeleny value indicates an increase
in the flour content of glutenin at the expense of gliadin, and
thus indicates an increase in the dough strength. We observed
that Zeleny value on the grains samples ranged 56.50 –
68.23, see Figure 5. The grains samples of the entries # 8, 3,
24, 25, 5 were with high Zeleny value in descending order as
they reached 68.23, 67.77, 67.60, 67.57 and 67.23
respectively; the Zeleny value of Yecora Rojo was 62.47.
These results indicate excellent grains quality.
D1- Flour Quality in 2008 [9], [10], [11]:
The results of the laboratory analysis on whole wheat flour
samples after milling the grains samples of 2008 trial is
presented in Table 3, the results had shown the following:
1- % Crude Protein: We observed the percentage protein
content on the flour samples ranged 14.31 - 17.79%. The
flour samples of the entries # 8, 3, 9, 5 contained high
percentage of crude protein in descending order as they
reached 17.79, 17.58, 16.99 and 16.69% respectively; Yecora
contained the highest percentage of crude protein as it
Figure 5, Zeleny number on the grains of the 3rd EBW entries/varieties in 2008 cropping season.
-
10
20
30
40
50
60
70
80
Y.R
. 2 3 4 5 6 7 8 9
10
11
12
13
14
15
16
17
18
19
20
21
22
23
24
25
26
27
28
29
30
Zele
ny
Nu
mb
er
Wheat Entries/Varieties

Ibrahim Naser et al. / IJAES, 7(5), 38-54, 2020
45
Table 3. Laboratory analysis results on the flour samples of the 3rd EBW entries/varieties for 2008 cropping season
Entry
number
%Crude
Protein
%Moistur
e Content %Ash
%Water
Absorptio
n
%Wet
Gluten
Entry
number
%Crud
e
Protein
%Moistu
re
Content
%Ash
%Water
Absorpti
on
%Wet
Gluten
Y.R. 17.86 6.39 1.22 62.44 59.43 16 14.31 6.48 1.08 62.41 37.63
2 16.63 6.77 1.25 62.56 49.26 17 15.35 6.58 1.16 62.43 37.64
3 17.58 6.95 1.23 62.54 51.13 18 14.45 6.13 1.06 62.37 37.95
4 16.66 6.54 1.23 62.48 46.39 19 14.95 6.04 0.93 62.51 36.90
5 16.69 6.24 1.14 62.63 49.02 20 15.18 5.94 1.11 62.41 35.52
6 15.88 6.05 1.18 62.50 39.75 21 16.19 5.92 1.15 62.32 49.77
7 16.55 6.22 1.10 62.58 50.05 22 14.87 5.76 1.06 62.42 34.88
8 17.79 6.11 1.18 62.63 59.21 23 14.88 5.98 1.05 62.54 36.90
9 16.99 5.97 1.11 62.57 55.74 24 16.13 5.87 1.20 62.56 48.16
10 15.58 5.89 1.04 62.60 43.13 25 15.50 6.30 1.05 62.47 43.64
11 16.70 5.80 1.13 62.60 46.38 26 15.12 5.65 1.11 62.29 43.73
12 16.09 6.07 1.13 62.54 46.80 27 14.66 6.05 1.05 62.36 36.22
13 14.90 6.43 1.10 62.46 40.19 28 14.42 5.97 1.10 62.06 32.11
14 15.46 6.36 1.13 62.52 41.73 29 15.14 5.73 1.10 62.50 40.61
15 14.97 5.90 1.12 62.35 38.03 30 15.63 5.84 1.04 62.60 44.65
reached 17.86%. Increased % crude protein in the flour
samples is an indication of high wheat flour quality.
2- % Wet Gluten: We observed that the percentage wet
gluten on the flour samples ranged 32.11 – 59.21%. The
flour samples of the entries # 8 ,9 ,3 ,7 , 21 contained high
percentage of wet gluten in descending order as they reached
59.21, 55.74, 51.13, 50.05, 49.77% respectively; Yecora
Rojo was the highest as it reached 59.43%. Increased % wet
gluten is an indication of high flour quality, see Figure 6.
3- % Moisture Content: The percentage moisture content on
the flour samples ranged 5.65 – 6.95% which is relatively
very low, and it was acceptable for flour storage; the
moisture content of Yecora Rojo flour was within that range
with 6.39%. Low moisture content was due to dry grains at
the time of harvest in summer.
4- % Ash: This represents the percentage of mineral
elements in the flour. The percentage ash content on the
flour samples ranged 0.93 – 1.25%, and the acceptable
level for whole wheat flour is < 1.3%. We observed
that the flour of the entries # 19, 10, 30, 23, 25 and 27
contained low level of ash in ascending order as it
reached 0.93, 1.04, 1.04, 1.05.1.05,1.05 and 1.05%
respectively; Yecora Rojo flour samples contained
1.22%. Low % Ash is desired in the wheat flour as the
flour color appears whiter, while flour with high % Ash
appears with less white color.
5- % Water Absorption: Water absorption in the
different flour samples of the entries/varieties ranged
from 62.06 – 62.63% and it was acceptable. Normal
value for the relative water absorption in bread wheat
flour range is 60 – 66%, and high value is desired in
bread wheat. Increased relative %water absorption of
the flour is desired by the bakeries as it produces more
bread quantity.
Observations on the 2009 field wheat trial:
A2: Agronomic characters [3]: Ten entries/varieties
were selected in 2009 trial based on high productivity
of entries/varieties # 29, 19, 25, 27, 11 and high quality
of entries/varieties # 8, 3, 24, 4 of 2008 trial, and in
addition Yecora Rojo as control. The results are
presented in Table 4 and Figure 7, we observed the
following: 1- Plant height: All of the varieties were relatively short and
ranged 82.2 – 94.2 cm; Yecora Rojo was the shortest with
67.6 cm followed in ascending order of height by the entries
19, 27, 24, 29 with 82, 87.4, 87.7, 90 cm respectively; Entry
# 11 was the highest with 94.2 cm.
2- Number of days for 100% heading: We observed Yecora
Rojo was the earliest variety for 100% heading with 99.6
days followed in ascending order the entries # 25, 27, 8, 24
with 99.8, 100.2, 100.4, 100.4 days respectively. entry # 4
was the latest with 106.2 days.
3- Number of days for maturity: The number of days for
maturity ranged 137– 146 days; Yecora Rojo was the earliest
maturing variety with 137 days followed in ascending order
for maturity entries/varieties # 25, 27, 8, 24, 29 and 19 with
139 , 140, 145, 145, 145 days respectively; entry # 4 was the
latest with 146 days.
4- Length of spike: The spike length ranged 9.2 – 11.3 cm.
We observed the following entries/varieties in descending
order have long spikes # 25, 27, 24, 19 & 11 with 11.3, 10.8,
10.7, 10.7, 10.4 respectively; Yecora Rojo was with spike

Ibrahim Naser et al. / IJAES, 7(5), 38-54, 2020
46
length 9.6 cm.
5- Number of spikes/M2: The number of spikes/M2 ranged
556 – 657. We observed the following entries in descending
order for more spikes / M2: # 29, 11, 24, 4, 8, 3 with 657,
633. 633, 622, 619, 617 respectively; Yecora Rojo was with
591 spike/ M2.
6- Number of seeds/spike: We observed that the highest
number of seeds per spike in descending order the
entries/varieties # 27, 24, 4, 19 then Yecora Rojo with70, 64,
63, 62 respectively.
7- Specific Weight (Kg/hl): We observed the highest specific
weight on the following entries/varieties in descending order:
# 29, 8, 24, Y.R., 27 and 25 with 83.68, 83.24, 83, 16, 82.68,
82.64, 82.44 kg/hl respectively. Increased test weight
indicates good grains quality.
8- One Thousand Grains weight (TGW): The results in 2009
Figure 6, %Wet gluten on the flour samples of the 3rd EBW entries/varieties in 2008 cropping season
Table 4. Agronomic characters of ten selected bread wheat entries/varieties of 2009 trial.
Entry/
Variety
Area
(M2)
Plant
Height
(cm)
Days at
100%
Heading
No. for
Days
for
Maturit
y
Spike
length
(cm)
No. of
Spikes
Per M2
No. of
Seeds
per
Spike
TGW
Specific
Density
Kg/hl
Test
Harvest
Kg/ M2
Potential
Yield
M.T. /Ha.
29-A 100 90 107 144.6 10.2 656.8 59 43.1 83.68 1.02 10.2
19-B 100 82.2 101 145.2 10.7 555.6 62 44.4 82.04 0.98 9.8
25-C 100 93.7 99.8 138.6 11.3 570 56 45.5 82.44 0.93 9.3
27-D 100 87.4 100.2 140 10.8 557.2 70 47.7 82.64 0.94 9.4
11-E 100 94.2 105 145.2 10.4 642.4 56 42.9 80.38 1.02 10.2
8-F 100 91.8 102.4 144.6 9.5 618.8 57 43.6 83.24 0.93 9.3
3-G 100 90.5 100.4 145.4 9.2 617.2 62 45.1 81.16 0.97 9.7
24-H 100 87.7 100.4 144.8 10.7 633.2 64 36.4 83.16 0.97 9.7
4-I 100 89.8 106.2 145.6 10.1 622 63 41.4 81.14 0.98 9.8
Y.R...* 100 67.6 99.6 137.4 9.6 591.2 62 45.2 82.68 0.94 9.4
* Y. R.: Yecora Rojo
Figure 7, Different wheat plants entries/varieties plots of the 3rd EBW on April 14, 2009.
-
20
40
60
80
Y.R. 3 5 7 9 11 13 15 17 19 21 23 25 27 29
%WetGluten
Entries/Varietie
%W
et G
lute
n

Ibrahim Naser et al. / IJAES, 7(5), 38-54, 2020
47
showed TGW ranged 36.4 – 47.7 grams which was very
high. We observed high TGW value on the following
entries/varieties in descending order # 27, 25, Y.R., 3, 19, 8
and 29 with TGW value 47.7, 45.5, 45.2, 45.1, 44.4, 43.6,
43.1 grams respectively. Increased TGW indicates good
grains quality.
B2- Productivity [3]: Data on the test harvest of each
entry/variety kg/M2 shown in Table 4 was calculated as
metric ton per hectare and is represented in Table 5 for
comparison with previous season. Entry/variety # 11
produced the highest yield as it reached 10.024 M.T. /Ha
followed by Entry # 29 with 10.018 M.T. /Ha then entry # 19
with 9.84 M.T. /Ha then entry # 4 with 9.76 M.T. /Ha.
It is clear from Table 5 that the highest producing entry in
2008 & 2009 trials was entry # 29 as it reached an average 0f
10.264 M.T/ Ha followed by entry # 19 with an average
10.215 then entry # 11 with an average 9.847 then entry # 27
with an average 9.545. In comparison Yecora Rojo variety
rank was the tenth with an average 8.97 M.T. /Ha. In 2009
results, we observed that entry # 29 produced high number of
spikes /M2 as it reached 657 spikes/M2, also its test weight
was the highest and it reached weight reached 83.68 kg/hl
and this explains the reasons for high productivity of this
entry/variety among the other entries.
Statistical analysis for the productivity in 2009 season
showed no significant difference between the entries.
However, we found the difference in the productivity
between the highest producing entry # 11 and Yecora Rojo
variety is 8.94% followed by entry # 29 with the difference
8.29% from Yecora Rojo. Also the difference between
Yecora Rojo and the lowest producing entry # 8 equals
0.85%.
The following illustrate the detailed statistical analysis for the
entries productivity in 2009 trial estimated as kg/M2
Randomized Complete Block AOV Table for Yield Kg/M2
Source DF SS MS F P
Blocks 4 0.03353 0.00838
Variety 9 0.05116 0.00568 0.81 0.6087
Error 36 0.25211 0.00700
Total 49
Note: SS are marginal (type III) sums of squares
Grand Mean 0.9686 CV 8.64
Tukey's 1 Degree of Freedom Test for Nonadditivity
Source DF SS MS F P
Nonadditivity 1 0.00475 0.00475 0.67 0.4179
Remainder 35 0.24736 0.00707
Relative Efficiency, RCB 1.02
Means of Yield Kg/M2 for each Variety
Variety Mean
29-A 1.0180
19-B 0.9840
25-C 0.9340
27-D 0.9360
11-E 1.0240
8-F 0.9320
3-G 0.9700
24-H 0.9720
4-I 0.9760
Y.R. 0.9400
Observations per Mean 5
Standard Error of a Mean 0.0374
Std Error (Diff of 2 Means) 0.0529
Table 5: Summary of the Productivity expressed as M.T. /Ha in the 2008 & 2009 seasons.
Variety Actual Productivity
2008 Test Harvest 2008
Test Harvest
2009
Average of Test
Harvest
29-A 9.600 10.510 10.018 10.264
19-B 9.130 10.590 9.840 10.215
25-C 8.730 9.460 9.340 9.400
27-D 8.470 9.730 9.360 9.545
11-E 8.650 9.670 10.024 9.847
8-F 7.470 9.150 9.320 9.235
3-G 6.810 8.410 9.700 9.055
24-H 8.070 9.110 9.720 9.415
4-I 7.400 8.740 9.760 9.250
Y.R*.-J 7.790 8.540 9.400 8.970
* Y. R.: Yecora Rojo

Ibrahim Naser et al. / IJAES, 7(5), 38-54, 2020
48
Figure 8, Comparison of actual yield of 2008 season with the test yield of 2008 and 2009 of the selected ten
entries/varieties.
C2- Grains quality in 2009 [6], [7]:
Analysis results on the grains samples of the 2009 field trial
are presented Table 6; the results had shown the following:
1- % Crude Protein: The grains analysis results shown the %
crude protein ranged from 12.84 - 15.02% which was
relatively less than the results in 2008 which ranged 14.66 –
17.84%. Increased productivity in 2009 season compared to
2008 season caused a decrease on the grains crude protein
content. The grains samples of the entries/varieties # 8, 25,
19, 24, 11 contained higher percentage of crude protein in
descending order as they reached 14.22, 14.04, 14.02, 14.02,
13.28% respectively; Yecora Rojo was the highest as it
reached 15.02%; increased % crude protein is an indication
of high quality of the grains.
2- % Moisture Content: The % moisture content on the
grains samples ranged from 9.0 – 9.9 which were relatively
high in comparison of the analysis results in 2008 which
ranged 6.32 – 8.36%, and these results were acceptable for
grains storage.
3- % Starch: The grains samples analysis results shown the
% starch ranged from 68.40 to 70.60% which was relatively
high on all of the varieties in comparison of the results in
2008 which ranged 60.5 – 64.60%; Yecora Rojo in 2009 was
with %starch content 70.10. High %starch in the grains was
due to the weather temperatures in 2009 season was
relatively with less minimum and maximum day
temperatures in comparison with 2008; in addition of longer
growing period in 2009 compared to 2008 which was late
planted. We observed during the period April 11 to May 11,
2009 relatively low temperatures which correspond to the
stages of anthesis until the hard dough stage on most of the
days and in particular the grains filling period, see Figure 10.
This affected the crop productivity and the grains
components of the ten entries/varieties of 2009. Research
reports on spring wheat shown that higher temperature in the
range 25 - 35oC after anthesis and during the grain-filling
period was an important yield limiting factor for wheat crop,
and reductions in grain weight was caused by the reduced
deposition of starch [12], [13].
Table 6. Summary analysis results on the grains samples of the 2009 wheat trial.
Varieties %Crude
Protein
Moisture
Content
%Wet Gluten %Starch Zeleny Number
29 - A 12.90 9.60 28.92 70.60 46.06
19 - B 14.02 9.90 34.68 70.60 55.32
25 - C 14.04 9.40 33.40 69.50 54.56
27 - D 13.04 9.30 31.30 73.20 47.52
11 - E 13.28 9.50 30.16 70.00 49.88
8 - F 14.22 9.70 31.58 69.20 53.84
3 - G 12.84 9.70 29.62 68.40 46.74
24 - H 14.02 9.80 32.16 69.70 53.46
4 - I 13.10 9.10 29.58 70.00 48.74
Y.R*. 15.02 9.00 37.30 70.10 60.58
Mean 13.65 9.5 31.87 70.13 51.67
* Y. R.: Yecora Rojo
0
2
4
6
8
10
12
29 19-B 25 27 11 8 3 24 4 Y.R.
Yield2008
Test Yield2008
Test Yield2009
Pro
du
ctiv
ity
M.T
./H
a
Entry/Variety

Ibrahim Naser et al. / IJAES, 7(5), 38-54, 2020
49
Figure 9. % Crude protein on the grains of ten entries/varieties of the 3rd EBW in the 2009 cropping season
Figure 10. Comparison of maximum day temperature in 2008 season(blue) vs 2009 season (red) during the period April 11
until May 11, 2009.
Figure 11. % Zeleny number on the grains of ten entries/varieties of the 3rd EBW in the 2009 cropping season
4- % Wet Gluten: We observed that the grains samples of the
entries/varieties # 19, 25, 24, 8, 27 contained high
percentage of wet gluten in descending order as they reached
34.68, 33.40, 32.16, 31.58, 31.30% respectively; Yecora
Rojo was the highest as it reached 37.30%. Increased % wet
gluten is an indication of high quality of the grains.
5- Zeleny Number [7]: This measures the quality and
quantity of gluten and in particular the glutenin which
controls the dough strength. Increased Zeleny number is an
indication of more dough strength which is desired in good
quality of wheat flour. We observed that the grains of the
entries/varieties # 19, 25, 8, 24, 11 were with high Zeleny
number in descending order 55.32, 54.56, 53.84, 43.46,
49.88; Yecora Rojo was the highest with 60.58, see Figure
11
D2- Flour quality in 2009 [9], [10], [11]:
Results on the analysis of the whole wheat flour samples are
presented in Table 7 had shown the following:
1- % Crude Protein: We observed that the wheat flour
samples of the entries/varieties # 8, 25, 19, 24,11 contained
high percentage of crude protein in descending order as it
reached 14.13, 13.83, 13.67, 13.67,13.50%; Yecora Rojo was
the highest as it reached 15.03%. Increased % crude protein
is an indication of high flour quality.
2- % Wet Gluten: We observed that the flour samples of the
entries/varieties # 25, 24, 8, 19 contained medium percentage
of wet gluten in descending order as it reached 31.23, 30.27,
29.07, 28.53%. Yecora Rojo reached 33.33%. Increased
11
12
13
14
15
16
29 19 25 27 11 8 3 24 4 Y.R.
%CrudeProtein
%C
rud
e P
rote
in
Entries/Varieties
0
10
20
30
40
42 43 44 45 46 47 48 49 50 51 52 53 54 55 56 57 58 59 60 61 62 63 64 65 66 67 68 69 70 71 72Day
Tem
per
ature
Days after March 1, 2009
0
10
20
30
40
50
60
70
29 19 25 27 11 8 3 24 4 Y.R.
ZelenyNumber
Zele
ny
Nu
mb
er
Entries/Varieties

Ibrahim Naser et al. / IJAES, 7(5), 38-54, 2020
50
percentage of wet gluten is an indication of high flour
quality.
3- % Moisture Content: The percentage moisture content in
the flour samples range was 9.0 – 9.9%, which is relatively
very high in comparison of the results in 2008 cropping
season; the moisture content of Yecora Rojo flour sample
was high and it reached 9.0%. Increased relatively high
%moisture content was due to testing fresh harvested
samples before the onset of high summer temperature.
4- % Ash: We observed that the flour samples of the entries #
19, 29, 25, 27 contained low level of ash in ascending order
as they contained 1.03, 1.08, 1.11, 1.11% respectively in
comparison with Yecora Rojo which reached 1.17%. Low %
Ash is desired in the wheat flour as the flour color appears
whiter, while high % Ash in the flour appears less white
color.
5- % Water Absorption: Water absorption in the different
samples of the entries/varieties ranged from 61.30 – 62.20%,
and it was acceptable. Normal value for water absorption in
bread wheat range is 60-66%, and high value is desired in the
flour of bread wheat. Increased relative % water absorption
of the flour is desired by the bakeries as it produces more
bread quantity.
Table 7. Summary analysis results of the flour samples of the 2009 wheat trial.
Varieties %Crude
Protein
Moisture
Content
%Ash %Water
Absorption
%Wet Gluten
29 - A 12.47 9.6 1.08 61.3 23.13
19 - B 13.67 9.9 1.03 61.97 28.53
25 - C 13.83 9.4 1.11 62 31.23
27 - D 13.53 9.3 1.11 61.8 27.67
11 - E 13.5 9.5 1.13 62.07 27.77
8 - F 14.13 9.7 1.08 62.2 29.07
3 - G 12.97 9.7 1.12 61.97 24.67
24 - H 13.67 9.8 1.11 62 30.27
4 - I 12.87 9.1 1.11 62.1 22.5
Y.R 15.03 9 1.17 61.57 33.33
Mean 13.40 9.5 1.10 61.90 27.82
Figure 11. % Crude protein on the flour samples of ten entries/varieties of the 3rd EBW in the 2009 cropping season.
Figure 12. % Wet Gluten on the flour samples of ten entries/varieties of the 3rd EBW in the 2009 cropping season.
0
5
10
15
20
29 19 25 27 11 8 3 24 4 Y.R.
%CrudeProtein
Entries/varieties
%C
rud
eP
rote
in
0
10
20
30
40
29 19 25 27 11 8 3 24 4 Y.R.
%WetGluten
%W
et G
lute
n
Entries/Varieties

Ibrahim Naser et al. / IJAES, 7(5), 38-54, 2020
51
Summary for the evaluation on the third elite bread wheat entries/varieties are presented in the following Table 8 [4], [15]:
Entry/
Varieties
Pedigree as
per CIMMYT Entry/ Variety Foliage Entry/ Variety Seeds Character
24
WAXWIN
G*2/KIRIT
ATI
Height 87.7 cm, Maturity 145
days, White grains color. Protein 14.02%, Zeleny
number 53.46, %Wet Gluten
32.16, %Ash 1.11, %Water
absorption 62.0, High yield and
High Quality
19
PFAU/WE
AVER*2//
KIRITATI
Height 82.2 cm, Maturity 145
days, Light red grains color.
Protein 14.02%, Zeleny
number 55.32, %Wet Gluten
34.68, %Ash 1.03, %Water
absorption 61.97, High yield
and High Quality.
11
SERI.1B*2
/3/KAUZ*
2/BOW//K
AUZ/4/PB
W343*2/K
UKUNA
Height 94.2 cm, Maturity 145
days, Light red grains color.
Protein 13.28%, Zeleny
number 49.88, %Wet Gluten
30.16, %Ash 1.13, %Water
absorption 62.07, High yield and
High Quality.
25
WAXWIN
G*2/4/SNI/
TRAP#1/3/
KAUZ*2/T
RAP//KAU
Z
Height 93.7 cm, Maturity 139
days, White grains color, Protein 14.04%, Zeleny
number 54.56, %Wet Gluten
33.40, %Ash 1.11,%Water
absorption 62.0, High yield and
High Quality.
27 WBLL1*2/
KIRITATI
Height 87.4 cm, Maturity
140 days, White grains
color, Protein 13.04%,
Zeleny number 47.52,
%Wet Gluten 31.30, %Ash
1.11, %Water absorption
61.8, High Yield.
29
WAXWIN
G*2/KIRIT
ATI
Height 90 cm, Maturity 145
days, Light red grains color,
Protein 12.90%, Zeleny
number 46.06, %Wet Gluten
28.92, %Ash 1.08, %Water
absorption 61.3, High yield.
8
PBW343*2
/KUKUNA
//KIRITAT
I
Height 91.8 cm, Maturity 145
days, Light red grains color,
Protein 14.22%, Zeleny
number 53.84, %Wet Gluten
31.58, %Ash 1.08, %Water
absorption 62.2, High Quality.

Ibrahim Naser et al. / IJAES, 7(5), 38-54, 2020
52
3
KIRITATI/
/2*PBW65/
2*SERI.1B
Height 90.5 cm, Maturity 145
days, Maturity 145 days, Red
grains color, Protein 12.84%,
Zeleny number 46.74, %Wet
Gluten 29.62, %Ash 1.12,
%Water absorption 61.97, High
yield.
Y.R.
Cross of
(Ciano X
Sonora 64-
Klien
Rendidor)
X 8156
Height 67.6 cm, Maturity
137 days, Red grains color,
Protein 15.02%, Zeleny
number 60.58, %Wet
Gluten 37.30, %Ash 1.17,
%Water absorption 61.57, High yield.
Additional observations on the 3rd elite bread wheat trials: As per the final results, we planned in 2010 season to propagate
selected four entries/varieties shown high productivity and high quality in 2009 season for the purpose of future bread wheat
varietal development. The selections were the entries # 19, 24, 25 and 29. We succeeded to produce seeds quantities shown in
the following Table 9:
Entry/Variety # Description Seeds Quantity
(Kg)
19 - B High productivity and high quality 1220
24 - H High productivity and high quality 1060
25 - C High productivity and high quality 1120
29 - A High productivity 1220
Furthermore, we milled 50 kg of each entry/variety of # 19 and 24 in a local mill to test the toast bread of each using household
sieve for flour extraction. The results of baking shown the outer color of the toast loaf was light brown and the inner bread
color was golden yellow; the bread taste was excellent and melts in the mouth, see Figure 13.
Figure 13. Wheat bread toast loaf of two entries/varieties number 19 and 24.
IV. CONCLUSION
1- Two years field trials on 29 bread wheat entries/varieties
of the 3rdEBW from the CIMMYT nurseries shown
promising results towards the development of new varieties
suitable for the end user in the middle east countries.
2- Results in 2008 field trial shown the productivity [3] of
the entry/variety # 29 was the highest with 9.6 M.T. /Ha
followed by the entry # 25 with 8.73 M.T. /Ha then entry #
11 with 8.65 M.T. /Ha then entry # 27 with 8.47 M.T. /Ha.
Yecora Rojo productivity ranked 8th with 8.19 M.T. /Ha, and
it was less than the productivity of entry # 29 by 17.22%.
Entry # 29 yield was the highest due to high number of
spikes/M2 which reached 672 combined with high test
weight which reached 84.20 kg/hl. The potential yield of
entry/variety # 19 reached 10.59 M.T./Ha followed by entry
# 23 with 10.39 M.T./Ha then entry # 22 with 10.34
M.T./Ha; the potential yield of Yecora Rojo reached 9.52
M.T./Ha. Comparison of agronomic characters in 2008
shown Yecora Rojo was the shortest variety with height 64.6
cm followed in ascending order entries/varieties # 19, 18, 5,
6 with height 76.5, 81.6, 82.9, 82.9 cm respectively; it is
desired to get a dwarf wheat variety to overcome lodging
Entry # 19 Entry # 24
Entry # 24
Entry # 19

Ibrahim Naser et al. / IJAES, 7(5), 38-54, 2020
53
problem and secure good quality. Entries/varieties # 20, 21,
22, 12, 6, 9 were with early maturity as they ranged 119 –
121 days similar to Yecora Rojo with 121 days.; it is a
desired character to get an early maturing variety to save
energy and water.
3- Results in 2009 field trial shown the productivity [3] of
the entries/varieties # 29, 11 were the highest, and both were
with 10.02 M.T./Ha followed by entry # 19 with 9.84
M.T./Ha then entry # 4 with 9.76 M.T./Ha; Yecora Rojo
productivity ranked 7th with 9.40 M.T./Ha. The yield of
entry/variety # 29 was the highest due to high number of
spikes/M2 which reached 657 combined with high test
weight which reached 83.68 kg/hl. Comparison of agronomic
characters in 2009 shown Yecora Rojo was the shortest
variety with height 67.6 cm followed in ascending order
entries/varieties # 19, 27, 24 and 29 with height 82.2, 87.4,
87.7, 87.7 cm respectively. entries/varieties # 25, 27, 8, 24,
29 and 19 were with early maturity as they reached maturity
stage after 139, 140, 145, 145, 145 days which was slightly
longer than Yecora Rojo with 137 days.
4- The analysis results of the grains samples [6], [7] in 2008
season shown that the entries/varieties # 8, Y.R, 9, 3, 4 and 2
were with high protein content and it ranged 16.17 – 17.48%;
also the %wet gluten of the entries/varieties # 6, 9, 13, 3, 2, 7
were higher than on other entries/varieties and it ranged 34 –
38.23%. Zeleny number, which measures the quality and
quantity of gluten, was higher on the entries # 8, 3, 24, 2, 5
than on other entries, and it ranged 67.33 – 68.23%.
Increased values of %crude protein, %wet gluten and Zeleny
number are indicators of good grains quality as they indicate
an increase in the dough strength. In comparison Yecora
Rojo was with medium wet gluten content of 32.07% and
with high Zeleny number of 66.63. The %Moisture content
of the grains samples in 2008 ranged 6.42 – 8.36% which
was acceptable for the seeds storage, and the %Starch of the
grains samples ranged 60.60 – 64.60% which was relatively
low, and it was acceptable.
5- The analysis results of the grains samples in 2009 season
[6], [7] shown that the entries/varieties # 8, 25, 19, 24, 11
were with higher protein content than on other entries and it
ranged 13.28 – 14.22%; also the %wet gluten of the
entries/varieties # 19, 25, 24, 8, 27 was higher than on other
entries/varieties and it ranged 31.58 – 34.68%. Zeleny
number was higher on the entries 19, 25, 8, 24, 11 than on
other entries, and it ranged 49.88 – 55.32%. In comparison
Yecora Rojo was with higher %crude protein, %wet gluten
and Zeleny number of the values 15.02%, 37.30%, 60.58
respectively. The %Moisture content on the grains samples
in 2009 ranged 9.0 – 9.9%, and it was acceptable for seeds
storage, and the %Starch of the grains samples ranged 68.40
– 70.60% which was high, and it was acceptable.
6- The analysis results of the flours samples in 2008 season
[9], [10], ([11] shown the entries/varieties # 8, 3, 9, 5 were
with high %crude protein content and it ranged 17.48 –
17.79%; also the %wet gluten of the entries/varieties # 8, 9,
3, 7, 21 were higher than on other entries/varieties and it
ranged 49.77 – 59.21%. Increased values of %crude protein,
%wet gluten are indicators of good flour quality as they
indicate an increase in the dough strength. In comparison
Yecora Rojo was with higher % crude protein, and higher
%wet gluten of the values 17.86%, 59.43% respectively. The
analysis results of the flours samples in 2009 season shown
the entries/varieties # 8, 25, 19, 24, 11 were with higher
%crude protein content and it ranged 13.50 – 14.13%; also
the %wet gluten of the entries/varieties # 25, 24, 8, 19 were
higher than on other entries/varieties and it ranged 28.56 –
31.23%. In comparison Yecora Rojo was with higher %
crude protein, and higher %wet gluten of the values 15.03%,
33.33% respectively.
7- Comparative analysis results of 2008 and 2009 on the
grains and flour samples shown changes on the grains
components due to increased productivity in 2009 cropping
season in comparison of 2008 cropping season. The day and
night temperature during the period April 11 and May 11 in
2008 was higher than in 2009; also there was delay in the
date of sowing in 2008. These factors affected the crop
productivity and the grains components of the ten
entries/varieties of 2009. Research reports shown that higher
temperature in the range 25 - 35oC after anthesis and during
the grain-filling period was an important yield limiting factor
for wheat crop, and reductions in grain weight was caused by
the reduced deposition of starch [12], [13].
For the grains samples, the mean %crude protein of the ten
entries in 2009 was less than 2008 by 2.68%, and the mean
Zeleny number in 2009 was less than 2008 by 13.31 due to
increased yield in 2009. The mean %starch in 2009 season
was 70.18%, and this was higher than in 2008 season by
around 8.1% due to increased productivity in 2009; also the
mean %moisture content of the grains in 2009 season was
higher than in 2008 by around 2.5% due to mild weather in
2009. No significant change on the grains wet gluten.
For the flour samples, the mean %crude protein in the
samples of 2009 was less than in 2008 by 2.3% and the mean
%wet gluten in 2009 was less than 2008 by 18.7% due to
increased yield in 2009. The mean %moisture content in
2009 was higher than in 2008 by 3.3% due to mild weather
in 2009 season. Little changes were observed in the %ash
content and %water absorption in the flour samples
8- The overall results in 2008 shown three entries/varieties of
high quality and high productivity # 11, 19, 25 and four
entries/varieties of high quality # 3, 4, 8, 24; and two
entries/varieties of high productivity # 27, 29. In conclusion
of 2008 and 2009 cropping seasons results: entries/varieties
with high yield and high productivity were # 11, 19, 24 and
25; entries with high yield were # 27 , 29 and entries with
high quality were # 4 and 8,
9- As per the Saudi government policy in 2008, they started
reducing wheat purchases from local farming by an annual

Ibrahim Naser et al. / IJAES, 7(5), 38-54, 2020
54
rate of 12.5% to save underground water, and this
significantly affected the cultivated area of wheat crop [16],
[17]. So, no further research activities were directed to the
wheat varieties. These results are of valuable importance in
other wheat growing countries in the middle east who are
looking for excellent bread wheat varieties. The author kept
small samples of the entries as a reference.
ACKNOWLEDGMENT
The authors wish to thank TADCO CEO, Eng’r Saad Al
Swat, and Dr. Abdul Monim Ali CBDO for their continuous
support during this study. The authors wish to thank the lab
unit head Mr. Conrad Angeles and his staff. Special thanks to
the Administrative Assistant Mr. Isaac Obra for drawing
trials lay out and for printing the Lab reports for the grains
and flours analysis at TADCO.
REFERENCE
[1] Curtis B.C. Wheat in the world in the book entitled: Bread Wheat, FAO Plant Production and Protection Series, No 30. FAO 2002.
http://www.fao.org/3/Y4011E/y4011e04.htm#bm04 [2] Al Tamimi, S.A. (1988). Wheat production under Centre pivot
irrigation system in the kingdom of Saudi Arabia. Research Dept.,
MOA, Riyadh, Saudi Arabia. [3] Naser I. et al (2020). Evaluation of four Australian Bread Wheat
Varieties Grown Under Centre Pivot Irrigation System. Volume 7
Issue 6, 2020, pp 1-17 www.internationaljournalssrg.org/IJAES/index.html
[4] CIMMYT 2007. 3RD ELITE BREAD WHEAT YT, Global Wheat
Program & Wheat Improvement, Nursery name 3EBWYT. https://www.cimmyt.com
[5] Foss Co (2016). Grain Analyzer Infratec 1241
https://www.fossanalytics.com/products/infratec-1241 [6] Description of wheat quality factors, California Wheat Commission
http://cawheat.org/milling/description-of-wheat-quality-factors/
[7] Kernel Analysis https://www.ndsu.edu/faculty/simsek/wheat/kernel-analysis.html
[8] Pena, R.J. (2002). Wheat for bread and other foods in the book
entitled: Bread Wheat Improvement and Production, FAO Plant Production and Protection Series, No 30. FAO 2002.
http://www.fao.org/3/y4011e0w.htm#bm32
[9] Wheat and Flour Testing Methods: A Guide to Understanding Wheat and Flour Quality: Version 2.
https://webdoc.agsci.colostate.edu/wheat/linksfiles/WheatFlour.pdf
[10] Flour Analysis https://www.ndsu.edu/faculty/simsek/wheat/flour.html
[11] Sorenson, B.K. (2013). What is wheat quality and why it matters.
NDSU Extension service, North Dakota, USA. https://wenku.baidu.com/view/9f258e6bcaaedd3383c4d3a9.html
[12] Wardlaw, I.F., Dawson, I.A., Munibi, P., and Fewster, R. (1989b).
The tolerance of wheat to high temperatures during reproductive
growth. I. Survey procedures and general response patterns.
Australian Journal of Agricultural Research 40, 1-13.
[13] Jenner, C.F. (1994). Starch synthesis in the kernel of wheat under high temperature condition, Aust.J.Plant Physiol.Vol. 21, pp791 –
806. https://www.researchgate.net/publication/262995039
[14] Bhullar, S.S., and Jenner, C.F. (1985). Differential responses to high temperatures of starch and nitrogen accumulation in the grain of four
cultivars of wheat. Australian Journal of Plant Physiology 12, 363-375. https://www.researchgate.net/publication/262994732/
[15] Calvin O. Qualset, H.E. Vogt, NE Boriaug (1985). Registration of
‘Yecora Rojo’ Wheat, Crop Science. Vol. 25 (6), pp 1129 – 1130. https://www.researchgate.net/publication/250113725_Registration_of
_'Yecora_Rojo'_Wheat
[16] Anonymous. Saudi Arabia to stop wheat production by 2016 https://english.alarabiya.net/en/business/economy/2014/12/11/KSA-
to-stop-wheat-production-by-2016
[17] Arab News. Kingdom to halt wheat production by 2016, Arab news, April 2013. https://www.arabnews.com/news/448070