Embed Size (px)
Citation preview
Evaluation of Draft Technical Report for Tentative Cleanup and Abatement Order No. R9-2011-0001 for the NASSCO Shipyard Sediment Site Expert Report of Thomas C. Ginn, Ph.D.
Doc. no. PH10719.000 0201 0311 TG11
Evaluation of Draft Technical Report for Tentative Cleanup and Abatement Order No. R9-2011-0001 for the NASSCO Shipyard Sediment Site Prepared for Latham and Watkins 601 West Broadway Suite 1800 San Diego, CA 92101-3375 Prepared by
Thomas C. Ginn, Ph.D. Exponent 1040 East Park Ridge Drive Sedona, AZ 86336 March 11, 2011 Exponent, Inc.

March 11, 2011
ii
Contents
Page
List of Figures iv
List of Photographs iv
List of Tables v
Acronyms and Abbreviations vi
Introduction 7
Qualifications 9
Technical Assessment of Available Information on Aquatic Life and Aquatic-Dependent Wildlife 11
Summary of Available Information 11
Aquatic Life Assessment 12 Reference Conditions 16 Sediment Chemistry 18 Sediment Toxicity Tests 19 Benthic Macroinvertebrate Communities 27 Fish Histopathology 41 Triad MLOE Assessment 42
Aquatic-Dependent Wildlife Assessment 57 Failure to Consider Actual Habitat Use 59 Regulatory Guidance and Standards for AUF Application 61 Selection of TRVs 65 Hazard Quotient Interpretation and Risk Characterization 65 Summary of Risk Assessment for Aquatic-Dependent Wildlife 74
Human Health Risk Assessment 76
Introduction 76
Available Information 76
Flaws of the DTR Tier I Screening Level Assessment 77
Flaws in the DTR Tier II Risk Assessment 79 Unrealistic Exposure Assumptions in the Risk Assessment 81

March 11, 2011
iii
Failure to Adequately Interpret Results of the Type II Risk Assessment 94 Quantitative Estimates of Risk 94 Comparison of NASSCO Exposure Point Concentrations and Reference Conditions 97
Summary 99
Evaluation of Proposed Remedial Footprint 101
Aquatic Life Beneficial Uses 102 Triad Chemistry LOE 102 Triad Toxicity LOE 103 Triad Benthic Macroinvertebrate LOE 104 Triad MLOE Station Score 105 Additional Assessment of Non-Triad Stations 105
Aquatic-Dependent Wildlife Beneficial Uses 108
Human Health Beneficial Uses 109
Summary 109
References 112 Appendix A Resume of Thomas C. Ginn, Ph.D.

March 11, 2011
iv
List of Figures
Page
Figure 1. Amphipod survival versus copper in shipyard sediment 23
Figure 2. Locations of Phase 1 Triad stations 30
Figure 3. Benthic community characteristics—number of species and organisms 34
Figure 4. Comparison of benthic community characteristics between the NASSCO footprint stations and reference areas 35
Figure 5. Distribution of benthic macroinvertebrate successional stages 38
Figure 6. Bay and Weisberg (2008) framework for using BPJ to assess California sediment sites. Arrows indicate sequence of classification. 55
Figure 7. Map of San Diego Bay showing fishing areas 93
List of Photographs
Photograph 1. Eohaustorius esuarius 20
Photograph 2. Strongylocentrotus purpuratus 21
Photograph 3. Mytilus galloprovincialis 21
Photograph 4. Larvae of Mytilus galloprovincialis 22

March 11, 2011
v
List of Tables
Page
Table 1. Comparison of NASSCO toxicity data to the reference pool 95 percent lower prediction limit (LPL) 24
Table 2. Results of the sediment quality triad approach using the reference condition (adapted from Table 18-1 of the DTR) 27
Table 3. Relative abundance of the 20 most abundant benthic macroinvertebrate taxa at the reference stations and shipyard sites 36
Table 4. Excerpt from DTR Table 18-14 48
Table 5. Corrected results of the sediment quality triad analysis 56
Table 6. Dependence of hazard quotient on habitat usage 61
Table 7. Tier II hazard quotients using geometric mean toxicity reference values 68
Table 8. NOAEL hazard quotients for lead using ecologically relevant toxicity reference value 73
Table 9. Fractional intakes protective of human cancer risk 83
Table 10. Human health cancer risks for PCBs and arsenic from the DTR 95
Table 11. PCBs and arsenic in spotted sand bass fillets 98
Table 12 PCBs and arsenic in edible lobster 99
Table 13. Sediment chemistry line-of-evidence results 102
Table 14. Comparison of the toxicity data from the Shipyard sediment site stations to the reference pool 95 percent lower predictive limit 103
Table 15. Comparison of the benthic community metrics data from the Shipyard sediment site stations to the reference pool 95 percent predictive limits 104

March 11, 2011
vi
Acronyms and Abbreviations
ARL acceptable risk level ATL advisory tissue level AUF area use factor BaP benzo[a]pyrene BPJ best professional judgment BRI-E benthic response index for southern California embayments BTAG Biological Technical Assistance Group CAO Cleanup and Abatement Order No R9-2011-0001 COCs chemicals of concern DFG California Department of Fish and Game DSI detailed sediment investigation DTR Draft Technical Report DTSC California Department of Toxic Substances Control EPA U.S. Environmental Protection Agency ERA ecological risk assessment ERAGS Ecological Risk Assessment Guidance for Superfund ERMs Effects-Range Medians HSI habitat suitability indices LAET lowest apparent effect threshold LOAEL lowest-observed-adverse-effect level LPL lower prediction limit MLOE multiple lines of evidence NASSCO National Steel and Shipbuilding Company NOAEL no-observed-adverse-effect level NRDA natural resource damage assessment PAHs polycyclic aromatic hydrocarbons RWQCB Regional Water Quality Control Board SQGs sediment quality guidelines SQVs sediment quality values SSMEQ surface sediment mean effects quotient Staff Staff at the California Regional Water Quality Control Board, San Diego
Region SWAC surface-weighted average concentration TMDLs total maximum daily loads Triad sediment quality triad TRVs toxicity reference values UPLs upper prediction limits WOE weight-of-evidence

March 11, 2011
7
Introduction
This report presents my opinions concerning information presented in the Draft Technical
Report (DTR) for Tentative Cleanup and Abatement Order No R9-2011-0001 (CAO) as it
pertains to the shipyard sediment site for National Steel and Shipbuilding Company (NASSCO).
The DTR was released in September 2010 and was prepared by the staff of the California
Regional Water Quality Control Board (Staff). Specifically, I have been requested to evaluate
the DTR and other relevant information concerning sediment conditions at the NASSCO site
and to determine whether the conclusions reached therein represent a scientifically sound
assessment of the need for active remediation of sediments. My opinions are based on my
education and experience as a scientist, and also based on my past involvement at the site since
2001, including the direction of scientific studies conducted by Exponent and on information
gained through several visits to the site.
The opinions expressed herein are concerned with three kinds of potential impacts on beneficial
uses of the site:
1. Aquatic Life, which includes benthic macroinvertebrates and fish
2. Aquatic-Dependent Wildlife, which includes various birds and sea turtles that
may forage on other species living at the site
3. Human Health, which includes risk assessments for recreational and
subsistence anglers.
The DTR addresses studies conducted at two individual shipyards (NASSCO and BAE
Systems) that comprise the Shipyard Sediment Site in San Diego Bay. Although my
assessments of the general approach used in the DTR would pertain to all parts of the shipyard
site, my opinions concerning specific data interpretations and the need for active remediation of
sediments apply only to the NASSCO shipyard.

March 11, 2011
8
The remainder of this report is divided into several sections, with the following subject areas:
• Summary of my qualifications as an expert in the relevant scientific disciplines for
assessments of sediment quality.
• A detailed technical assessment of the DTR with my opinions on the scientific validity
of the Staff’s assessments, my reanalysis of the data, and my opinions concerning the
scientific interpretations of the data regarding sediment quality at the NASSCO
shipyard.
• My evaluation of the proposed remedial footprint and the need for active remediation at
the NASSCO site.
March 11, 2011
9
Qualifications
I am a Principal Scientist in the EcoSciences practice at Exponent, a scientific and engineering
consulting firm headquartered in Menlo Park, California. I am associated with Exponent’s
Phoenix, Arizona office. I have held the position of Principal Scientist at Exponent since 1997.
From 1987 to 1997, I held the positions of Vice President and Principal at PTI Environmental
Services, which was acquired by Exponent. As a Principal of the firm, I provide program
management and expert consulting services, with primary expertise in the areas of ecological
risk assessment (ERA) and natural resource damage assessment (NRDA).
My education is in the fields of biology and fisheries. I received a Ph.D. in biology, with a
specialty in estuarine ecology, from New York University in 1977, an M.S. in biological
sciences (specializing in marine biology) from Oregon State University in 1971, and a B.S. in
fisheries science from Oregon State University in 1968.
I am a member of the American Chemical Society, the Society of Environmental Toxicology
and Chemistry, and the American Institute of Fishery Research Biologists. I am a Certified
Fisheries Professional by the American Fisheries Society, Certificate No. 2844.
My consulting experience has focused on the effects of hazardous substances on aquatic and
terrestrial organisms. I have conducted studies of the effects of inorganic and organic chemicals
on biological communities at many sediment sites nationwide. I have specialized expertise in
assessing the fate, exposure, and effects of substances such as arsenic, cadmium, chromium,
copper, lead, mercury, zinc, polychlorinated biphenyls, polycyclic aromatic hydrocarbons
(PAHs), and dioxins/furans. I have directed investigations of the biological effects of chemicals
in aquatic sediments at many sites. These investigations have included the design of sampling
studies and the scientific interpretation of study results.
Under contract to the U.S. Environmental Protection Agency (EPA), I have assessed sediment
quality conditions at marine and estuarine sites and I have participated in the development of
guidance documents on the sampling and interpretation of marine sediment quality data. I have

March 11, 2011
10
authored peer-reviewed articles on sediment toxicity test methods, use of sediment quality
values, bioaccumulation in urbanized embayments, and general assessment methods in the
marine environment. Since 1983, I have served as co-author for an annual review of important
studies in the area of marine pollution published by the Water Environment Federation. I have
also served as an expert witness at sediment sites, including U.S. v. City of San Diego, where I
testified at trial concerning effects of the marine sewage discharge on benthic
macroinvertebrates and demersal fishes.
I have served on scientific advisory committees for several federal government programs
concerning issues of biological effects of chemicals in sediments. The dates and committees are
as follows:
1988–1991. Member of the Technical Advisory Committee for the U.S. Environmental
Protection Agency’s Puget Sound Estuary Program.
1993–1995. Member of the Technical Advisory Group for the Long Term Management
Strategy, a multi-agency program for San Francisco Bay.
1994–1996. Member of the Benthic Resource Assessment Group, a scientific advisory
committee for the U.S. Army Corps of Engineers for New York/New Jersey Harbor.
Further information on my qualifications, publications, and prior testimony is provided in
Appendix A.

March 11, 2011
11
Technical Assessment of Available Information on Aquatic Life and Aquatic-Dependent Wildlife
Summary of Available Information
As is documented in the DTR and the detailed sediment investigation (DSI; Exponent 2003), the
studies conducted at the shipyards produced a large and complex, but comprehensive, data set
associated with sediment chemistry, sediment toxicity, benthic macroinvertebrate communities,
bioaccumulation in fishes and invertebrates, and the health of fish. The collection of these kinds
of chemical and biological data represents a state-of-the-art sediment assessment and is
consistent with the “ideal assessment methodology” described by EPA in the National Sediment
Quality Survey (U.S. EPA 2004).
The report for the investigation conducted at the shipyards not only contains the appropriate
kinds of data, but the intensity of sampling stations is very high for such a small area (only
43 acres for the aquatic portion of the NASSCO leasehold). For example, in addition to the five
reference areas sampled, a total of 15 sediment quality Triad stations were located within the
NASSCO leasehold. For each of these sampling stations, synoptic measurements were made of
sediment chemistry, sediment toxicity (using three different toxicity tests), and the structure of
BMI communities (using five replicate samples at each station). In addition, bioaccumulation
was measured in invertebrates and fishes that are prey to aquatic-dependent wildlife. Fish
health was evaluated by collection of 100 spotted sand bass within and near the NASSCO
leasehold, and by detailed assessment of fish condition (weight, length, and age) and
microscopic evaluation of livers, gonads, kidneys, and gills for the presence of lesions and other
abnormalities. Thus, the DSI is rich with site-specific empirical data that can be used to make
risk-based regulatory decisions. In my experience in conducting sediment assessments for more
than 25 years, it is one of the most extensive data sets for a single facility (or two adjacent
facilities) that I have seen. Moreover, because of the extensive nature of the site-specific data
collected at the shipyards, there is no need for theoretical and uncertain assessments such as
comparisons with sediment quality values (SQVs). SQVs are used in risk assessment to infer

March 11, 2011
12
probability of biological effects, when direct measurements of those effects are unavailable. In
this case, the extensive site data on sediment toxicity and benthic macroinvertebrates speak for
themselves, and should supersede inferences about risk drawn from SQV comparisons.
Risks to aquatic-dependent wildlife were assessed by using risk models that are based on the
measured concentrations of bioaccumulative substances in prey tissue and various assumptions
concerning the exposure of target receptors to those substances. Although the concentrations of
bioaccumulative substances in prey organisms are well documented, the results of such risk
models are highly dependent on the exposure assumptions of the model (e.g., amount of prey
consumed at the site versus other areas of the Bay). Therefore, the overall reliability of risk
models for predicting risks is strongly influenced by the reliability and accuracy of these
underlying assumptions.
In summary, the scientific investigations conducted at the shipyards represent a comprehensive
data set for assessment of sediment chemistry and biological effects using multiple independent
indicators. The resultant data set contains all of the information needed to reach a scientifically
sound decision using multiple lines of evidence (MLOE) concerning the need for any sediment
remedial activities.
Aquatic Life Assessment
For the purposes of the Shipyard site assessment, risks to aquatic life are addressed by sampling
and assessment methodologies associated with two groups of organisms: benthic
macroinvertebrates and fish. Risks to benthic macroinvertebrates are then assessed using a
Triad1
1 The Triad approach involves the synoptic collection of data on sediment chemistry, sediment toxicity, and the structure of benthic macroinvertebrate communities.
approach which is interpreted in a weight-of-evidence (WOE) framework to determine
the likelihood of adverse effects on these sediment-dwelling organisms. Risks to fish are
addressed directly by comparing the health of fish living near the shipyards with the fish living
in a reference area for San Diego Bay.
March 11, 2011
13
Before I discuss my specific criticisms of the Staff’s approach and present my interpretation of
the available data, it must be emphasized that a WOE approach in general represents an
appropriate assessment strategy and is consistent with standards of practice and EPA policy for
sediment assessments. WOE assessments have been conducted at sediment sites throughout the
U.S. since the early 1980s. Although WOE approaches are common, they vary widely based on
the overall decision framework, how the lines of evidence are integrated, and how the final
decisions are made. As will be demonstrated in subsequent sections of this report, the WOE
approach described in the DTR appears to be an unconventional assessment method developed
specifically for this case, which bears little resemblance to the standards of practice for sediment
quality assessments. Little or no scientific basis is provided by the Staff to justify their
deviation from standard data interpretation methods, resulting ultimately in arbitrary cleanup
levels with no risk basis.
A fundamental problem with the Staff’s WOE approach is the framework that concludes that
adverse effects on benthic macroinvertebrates are “possible” when there is no significant
sediment toxicity and no adverse effects on benthic macroinvertebrates (see Table 18-14 of
DTR). In these cases, the conclusion of “possible” effects is driven by the characterization of
“high” for sediment chemistry. In such cases where chemical and biological indicators disagree,
rather than prematurely concluding that effects on benthic macroinvertebrates are “possible,”
the investigator should evaluate the reason for the difference between chemical and biological
indicators of effect, especially because this situation may result from low bioavailability of
sediment chemicals The Staff even recognizes this situation in Section 15.1 of the DTR: “For
example, sediment chemistry provides unambiguous measurements of pollutant levels in marine
sediment, but provides inadequate information to predict biological impact.” In Section 16 of
the DTR, a citation to Long (1989) is provided which states: “Although the sediment chemistry,
toxicity, and benthic community data should be complementary, the degree of impairment
implied by each line of evidence may not be in complete agreement because they measure
different properties of the surficial sediment.” Notwithstanding these explicit
acknowledgements at a theoretical level, the DTR assessment places an unwarranted emphasis
on sediment chemistry data in the WOE approach.

March 11, 2011
14
Section 15.2 of the DTR, recognizes that a WOE approach necessarily involves the use of best
professional judgment (BPJ) to integrate the lines of evidence and assess the quality, extent, and
congruence of data. As described in that section, “BPJ comprises the use of expert opinion and
judgment based on available data and site-situation specific conditions to determine, for
example, environmental status or risk.” Although I agree with this statement, the identity or
qualifications of any experts who are exercising BPJ is unclear in the DTR.
A recent study of the consistency of BPJ in the interpretation of Triad data was published by
Bay et al. (2007b). In this study, the authors relied on a panel of six individuals whom they
considered to be sediment experts. This panel independently evaluated Triad data from 25
California embayment sites and categorized each site according to the environmental condition
(likely unimpacted, possibly impacted, likely impacted, etc.). The results showed considerable
inconsistencies in the categorical assignments of the various sites among panel members, and
the differences among panel members were associated primarily with different approaches to
weighting of the three lines of evidence. However, overall the panel members placed the
greatest weight on the benthic community leg of the Triad. As will be shown in subsequent
sections of this report, the DTR WOE approach tends to place a greater weight on the chemistry
and toxicity legs of the Triad. In noting the variability in sediment quality categories that can
arise from different putative experts with considerable experience in sediment assessments, Bay
et al. (2007b) note that:
…the expertise of personnel at state and local agencies responsible for
conducting or interpreting sediment quality assessments is highly variable and
can lead to different interpretations of the same data set.
The use of WOE approaches for assessing ecological impairment has been reviewed by Burton
et al. (2002a). The authors recognize the value of WOE approaches, but caution that they need
to provide a sound, transparent process that is clearly understood by all stakeholders. They also
note that decisions may be flawed if they are based on unreasonable assumptions or
manipulations of the individual lines of evidence used in the decision framework.

March 11, 2011
15
In addition to studies of biological effects, the shipyard studies, as described in the DSI,
included the collection of information specifically designed to assess the bioavailability of
sediment chemicals. This kind of information has been recognized for more than 20 years as
being very important in sediment assessments. When sediment data are assessed in a WOE
framework, it is important to evaluate causal relationships and to document causality in
accordance with field measurements (Chapman et al. 2002). A significant error in the Staff’s
WOE approach is the absence of an evaluation of the chemical bioavailability information in
their decision framework. This omission is unscientific and is inconsistent with the current
standards of practice for sediment assessments that recognize the importance of bioavailability
in determining whether a given concentration of a chemical substance will cause adverse
effects. For example, U.S. EPA (2004) states: “The collection of data to measure chemical
bioavailability is critical to the success of weight-of-evidence assessments.” U.S. EPA (2004)
also states: “sediment chemistry can indicate the presence of contaminants but cannot
definitively indicate an adverse effect.” Despite this general knowledge and available guidance,
the DTR does not address bioavailability. Instead, it places an inordinate emphasis on the
concentrations of substances in sediments as indicating the potential for adverse effects, while
downplaying the important contradictory information showing that adverse effects on benthic
communities are absent and sediment toxicity is minimal or absent.
As is demonstrated in the following sections of this report, there are many important
deficiencies in the Staff’s WOE approach that lead to inappropriate conclusions concerning the
likelihood of adverse effects in indigenous biota and the need for sediment remediation at the
NASSCO site. Stated simply, the Staff is concluding that sediments require remediation at the
NASSCO shipyard when:
1. Sediment toxicity is either absent (i.e., not different from reference) or low
(only one of the three tests is different from reference)
2. Measurement of four indices of benthic macroinvertebrates communities are
not different from reference conditions
3. Fish (spotted sand bass) are healthy, with no elevation in significant liver
lesions or other abnormalities related to chemical exposures at the site

March 11, 2011
16
4. The ecological risk assessment shows that predicted exposures of aquatic-
dependent wildlife fall below the thresholds for which adverse effects are
expected.
Therefore, the DTR reaches a conclusion regarding the need for sediment remediation when
site-specific risk-based information indicates that aquatic life beneficial uses are not impaired at
the NASSCO site. The remainder of this report provides specific discussions of the available
scientific information concerning biological conditions at the NASSCO shipyard and the need
for remediation of sediments based on those results.
Reference Conditions
Triad data are compared in the DTR with a group reference station data collected as part of three
separate investigations (Chollas/Paleta Creek, Exponent Shipyard Study, and the Bight ’98
study). A total of 18 individual stations were selected to form what is referred to as the 2005
Final Reference Pool. In the DTR, the rationale for this reference pool is presented and it is
characterized, when compared to alternative reference pools, as “…most closely represents the
current sediment quality condition that would exist at the Shipyard Sediment Site absent the
waste discharges.” In other words, the group of stations is intended to represent current ambient
background levels for contaminant concentrations.
The use of a reference pool with multiple stations to characterize the natural range of conditions
at the assessment area is an established approach in marine ecological investigations. However,
it can be difficult to select an appropriate pool of stations to represent reference conditions. The
selection of a reference station pool is a fundamental aspect of the overall study design and the
use of inappropriate reference stations can bias the subsequent conclusions concerning
impairments to beneficial uses in the assessment area. Chapman et al. (2002) states that the
reference comparisons are a critical element of a sediment WOE assessment.
Evaluation of the 2005 reference pool indicates that it includes stations located throughout San
Diego Bay. All stations selected for the 2005 reference pool have concentrations of sediment

March 11, 2011
17
chemicals below their respective Effects-Range Medians (ERMs) for metals and consensus
sediment guideline values for PAHs and PCBs. Thresholds for sediment toxicity and benthic
communities were not used in the station-selection process.
The 2005 reference pool represents a significant improvement when compared to the five
stations originally designated for biological comparisons in the Exponent study or the 2003
reference pool established by the Staff. However, the 2005 reference pool may not represent the
chemical and biological conditions at the shipyards in the absence of any site-related discharges
because:
1. The reference stations tend to be located away from the shoreline and would
not be reflective of any point or nonpoint sources at the shoreline or localized
hydrologic conditions that may affect the shipyard site.
2. The reference stations were selected based on chemical data being lower than
available sediment quality values. Although these stations may be
representative of some of the lowest sediment contaminant levels in the Bay,
generalized sources of contaminants away from the shipyards may cause
localized chemical concentrations in the vicinity of the shipyards that exceed
these thresholds.
3. The shipyards may be affected by discharges from Chollas Creek, which is
located immediately south of the site.
4. The reference pool stations contain coarser sediments than are included in the
Triad stations sampled at NASSCO. The concentrations of many
contaminants and the structure of benthic macroinvertebrate communities are
influenced by sediment particle size. Therefore the reference stations may
have characteristics that are naturally different from shipyard sediments.
These potential deficiencies in the 2005 reference pool may result in invalid comparisons in the
MLOE framework and can lead to erroneous conclusions concerning adverse effects when the
full range of sediment conditions at the assessment site are not encompassed in the reference

March 11, 2011
18
pool range. In reviewing the use of reference sites in sediment assessments, Burton et al.
(2002b) conclude that “reference sites must represent the full range of conditions expected to
occur naturally at all other sites to be assessed.”
In summary, I support the concept of using a robust set of stations for reference comparisons,
especially when the toxicity and benthic community data are not used as selection criteria.
However, based on the information presented in the DTR, I am not convinced that the reference
data set would represent chemical, toxicological, and benthic characteristics at the shipyards but
for any discharges at the shipyards. Therefore, some of the apparent effects detected in toxicity
tests and benthic community analyses may be artifacts of the reference pool selection rather than
actual effects of shipyard discharges.
Sediment Chemistry
In the DTR, the sediment chemistry leg of the Triad is characterized by comparisons with
various sediment quality guidelines (SQGs) and the 95 percent upper prediction limits (UPLs)
for each chemical as measured in the reference pool. Using this approach, chemical
concentrations at two of the stations at the NASSCO shipyard site are characterized as “high”,
12 stations are characterized as “moderate”, and one station is classified as “low”.
For Triad studies, the assessment of sediment chemistry has a simple purpose: to determine
whether the concentrations of substances at the site are significantly elevated beyond reference
conditions. The DTR uses a rather complex series of comparisons with SQGs and reference
conditions to assess this condition. However, examination of the sediment chemistry data
indicates that one or more substances are significantly elevated above reference ranges at the
NASSCO sediment stations (Exponent 2003). It is also apparent that the higher concentrations
generally occur near shore and decline in an offshore direction. The sediments collected during
the shipyard study also had a finer particle size than the reference sediments for that study,
likely contributing to the higher bulk concentrations of chemicals near the shipyards.

March 11, 2011
19
Comparisons with SQGs provide little relevant information because SQGs are intended to
provide a theoretical prediction of the likelihood of adverse effects on benthic
macroinvertebrates. If detailed evaluations of sediment toxicity and indigenous benthic
macroinvertebrates are also included in the study, as they were for the shipyards, the theoretical
prediction of effects should have little bearing on the overall assessment relative to site-specific
toxicological and biological information. Given the study results, the characterization of
sediment chemistry as being either “high” or “moderate” has little real meaning from a risk
standpoint. The bottom line is that sediment chemical concentrations at the NASSCO site are
elevated relative to reference conditions. The important part of the assessment is to determine,
using the other two legs of the Triad, whether those elevated chemical concentrations result in
adverse effects on benthic macroinvertebrates. As is demonstrated in subsequent sections of
this report, the Staff’s own analyses of sediment toxicity and benthic macroinvertebrates show
only minor indications of sediment toxicity at a minority of stations at NASSCO. For most
sediment stations at NASSCO, there was neither significant sediment toxicity nor significant
effects on benthic macroinvertebrates.
Sediment Toxicity Tests
Sediments collected at the 15 Triad stations at NASSCO were subjected to three kinds of
toxicity tests: amphipod survival, sea urchin fertilization, and bivalve larval development. The
use of these three distinct tests provides a comprehensive view of sediment toxicity because the
sediments are evaluated for:
• Effects on survival of a sensitive species
• Effects on reproduction
• Effects on early larval development.
These three toxicity tests are not necessarily equivalent concerning sensitivity, reliability, and
relevance of the endpoint. Of the three tests, the amphipod toxicity test is the most widely used
for marine testing in the U.S. (Wenning et al. 2005). Amphipods are small crustacean that are
March 11, 2011
20
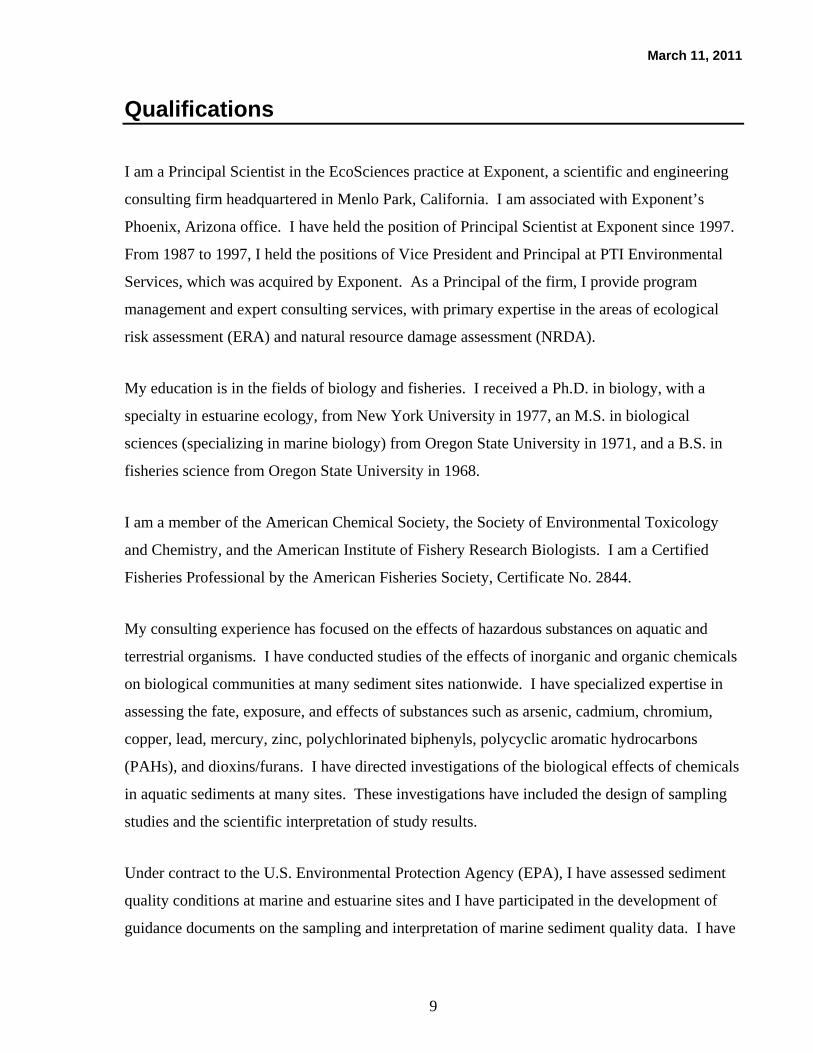
directly exposed to sediments in test chambers, thus simulating the exposure of benthic
macroinvertebrates to chemicals in sediments in situ. The test species of amphipod used for the
shipyard investigations is Eohaustorius esuarius (Photograph 1). Amphipods are placed into
chambers with sediments and survival is determined after 10 days. The sea urchin test involves
exposure of gametes of Strongylocentrotus purpuratus (Photograph 2) to sediment pore water
samples. In this test, pore water is extracted from intact sediments and sea urchin eggs and
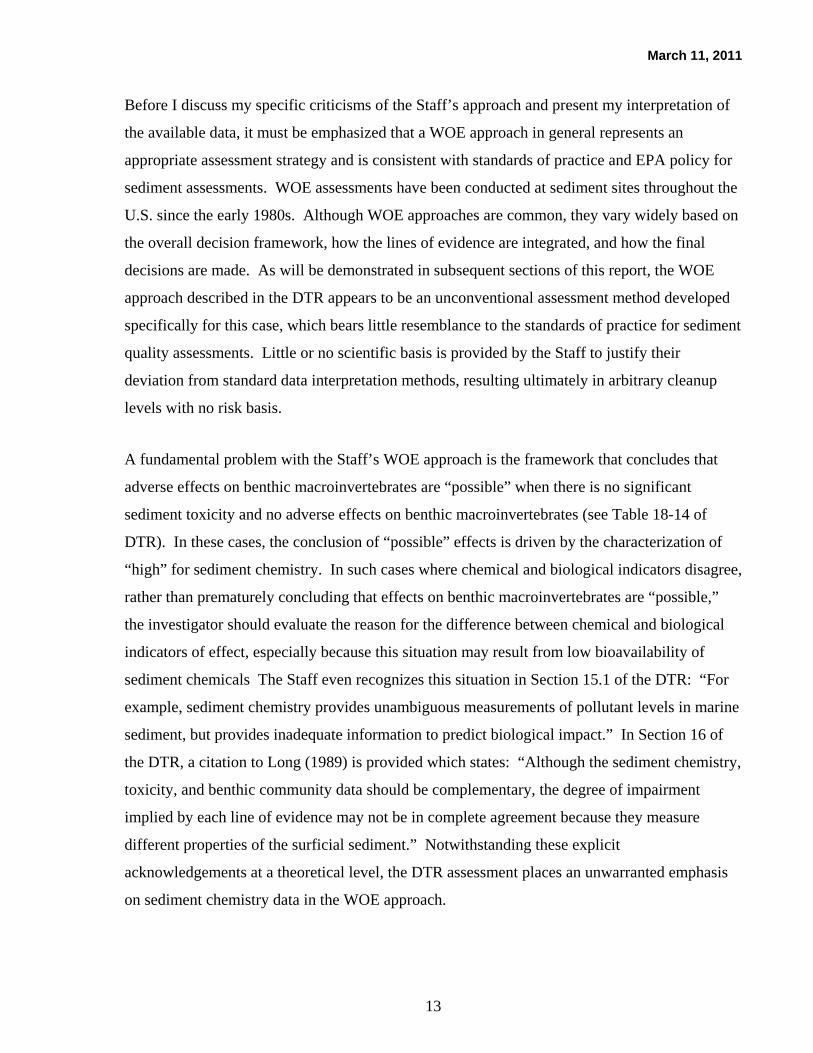
larvae are introduced into the chamber and evaluated for successful fertilization. The bivalve
larvae test is based on the blue mussel, Mytilus galloprovincialis (Photographs 3 and 4). The
test is conducted by exposing larvae to water above the sediment-water interface in the test
chamber. The larvae are then monitored for normal development and the presence of any
abnormal shell configurations.
Photograph 1. Eohaustorius esuarius

March 11, 2011
21
Photograph 2. Strongylocentrotus purpuratus
Photograph 3. Mytilus galloprovincialis
March 11, 2011
22
Photograph 4. Larvae of Mytilus galloprovincialis
Overall, there was little or no statistically significant correlation between the results of the
toxicity tests and concentrations of sediment chemicals. For the amphipod and sea urchin tests,
the low correlations with sediment chemicals are the consequence of the low toxicity responses
at the site (i.e., most areas are nontoxic). In other words, there was not enough toxic response at
the shipyard to develop any significant relationship with sediment chemistry, a finding that
should be interpreted to indicate that chemical toxicity is not significant over the concentration
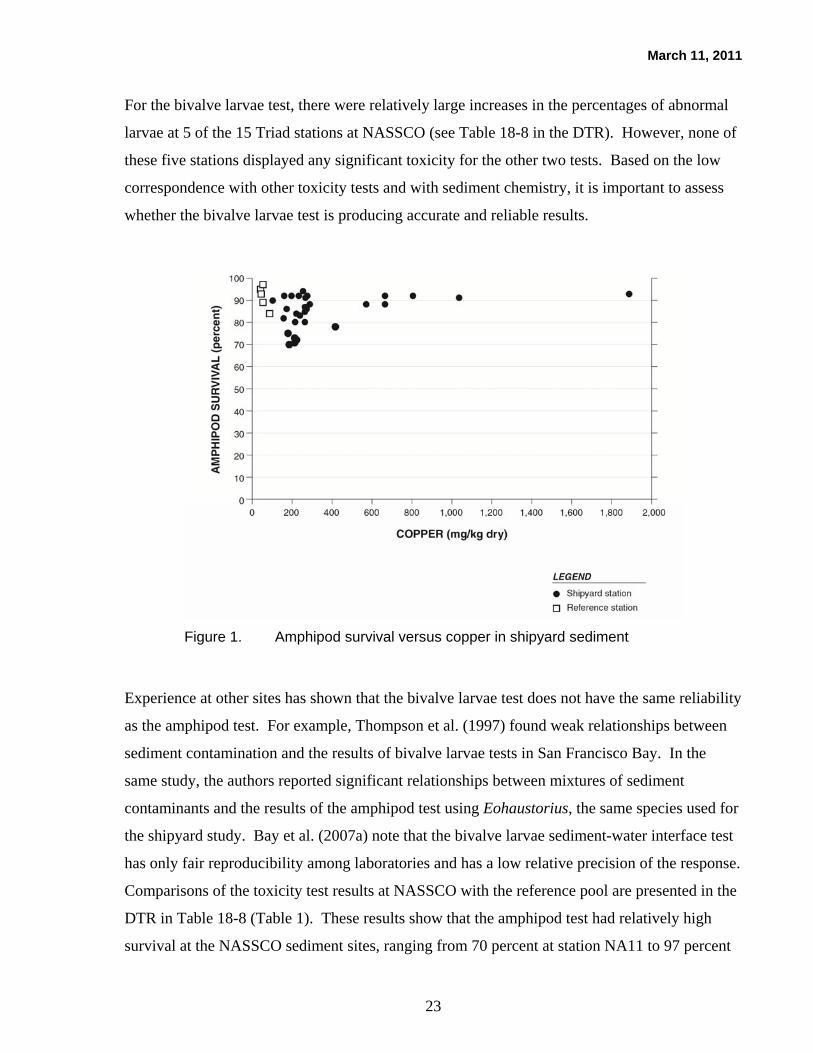
ranges tested. Figure 1 shows the lack of a correlation between bulk copper levels in shipyard
sediments and amphipod survival. Not only are the sediments with the highest copper
concentrations nontoxic, relative to reference sediments, but the sediments with the highest
toxicity contain copper at the low end of the concentration range tested. This is distinct from
the case where sediment toxicity tests track with chemical contamination, a finding that is
typically interpreted to indicate adverse effects from chemical exposure.
March 11, 2011
23
For the bivalve larvae test, there were relatively large increases in the percentages of abnormal
larvae at 5 of the 15 Triad stations at NASSCO (see Table 18-8 in the DTR). However, none of
these five stations displayed any significant toxicity for the other two tests. Based on the low
correspondence with other toxicity tests and with sediment chemistry, it is important to assess
whether the bivalve larvae test is producing accurate and reliable results.
Figure 1. Amphipod survival versus copper in shipyard sediment
Experience at other sites has shown that the bivalve larvae test does not have the same reliability
as the amphipod test. For example, Thompson et al. (1997) found weak relationships between
sediment contamination and the results of bivalve larvae tests in San Francisco Bay. In the
same study, the authors reported significant relationships between mixtures of sediment
contaminants and the results of the amphipod test using Eohaustorius, the same species used for
the shipyard study. Bay et al. (2007a) note that the bivalve larvae sediment-water interface test
has only fair reproducibility among laboratories and has a low relative precision of the response.
Comparisons of the toxicity test results at NASSCO with the reference pool are presented in the
DTR in Table 18-8 (Table 1). These results show that the amphipod test had relatively high
survival at the NASSCO sediment sites, ranging from 70 percent at station NA11 to 97 percent

March 11, 2011
24
at station NA15. The mean amphipod survival at all NASSCO stations was 85.4 percent, which
is well above the 95 percent lower prediction limit (LPL) of 73 percent for the reference pool
designated in the DTR. The only station at NASSCO that had amphipod survival significantly
less than the reference pool was Station NA11, where the survival was 70 percent.
Table 1. Comparison of NASSCO toxicity data to the reference pool 95 percent lower prediction limit (LPL)
Site Station Amphipod Survival
95% LPL = 73%
Urchin Fertilization
95% LPL = 42%
Bivalve Development
95% LPL = 37%
NASSCO NA01 80 86 49
NA03 84 84 94
NA04 80 88 84
NA05 89 95 94
NA06 78 103 74
NA07 74 102 88
NA09 88 99 1
NA11 70 101 80
NA12 82 89 15
NA15 97 88 93
NA16 90 84 3
NA17 95 88 80
NA19 89 72 2
NA20 90 78 80
NA22 95 111 2
Note: Toxicity values less than the 95percent lower prediction limit values are boxed and bold faced.
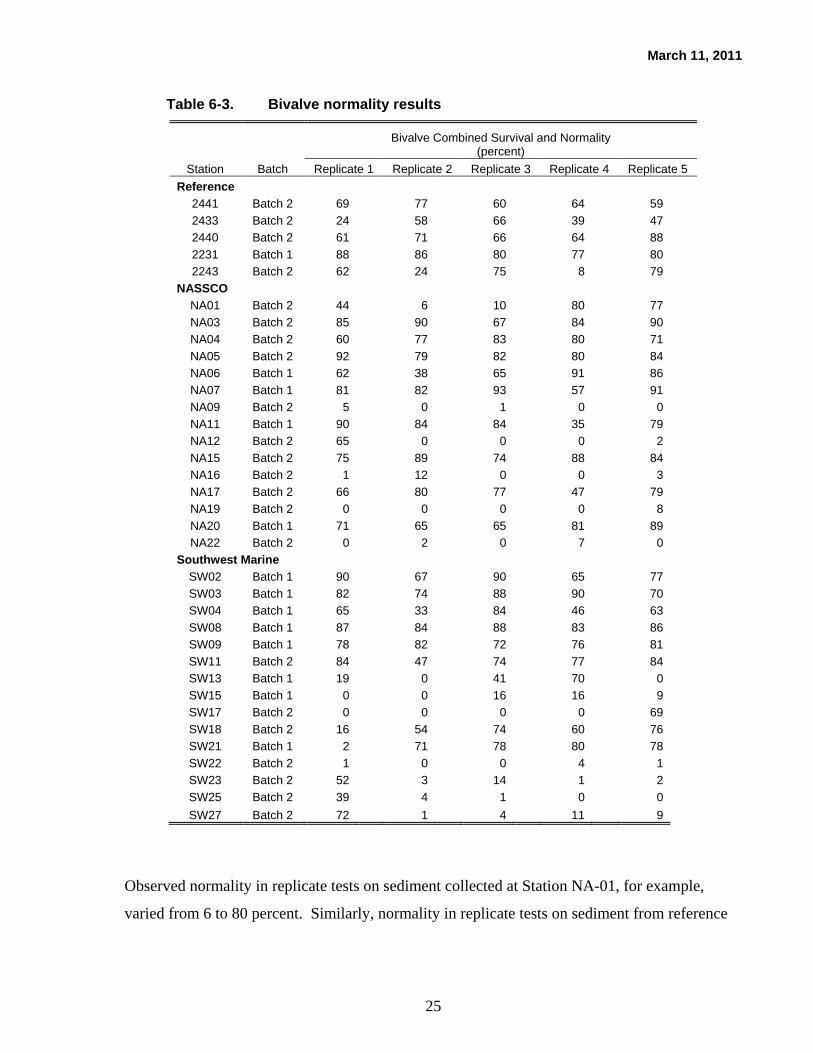
A review of the results of replicate toxicity tests at individual Shipyard Triad and reference
stations reveals the variability in the performance of the bivalve larval development test. Table
6-3 from the Detailed Sediment Investigation Report (Exponent 2003) is reproduced below.
March 11, 2011
25
Table 6-3. Bivalve normality results
Bivalve Combined Survival and Normality
(percent) Station Batch Replicate 1 Replicate 2 Replicate 3 Replicate 4 Replicate 5
Reference 2441 Batch 2 69
77
60
64
59
2433 Batch 2 24
58
66
39
47 2440 Batch 2 61
71
66
64
88
2231 Batch 1 88
86
80
77
80 2243 Batch 2 62
24
75
8
79
NASSCO NA01 Batch 2 44
6
10
80
77
NA03 Batch 2 85
90
67
84
90 NA04 Batch 2 60
77
83
80
71
NA05 Batch 2 92
79
82
80
84 NA06 Batch 1 62
38
65
91
86
NA07 Batch 1 81
82
93
57
91 NA09 Batch 2 5
0
1
0
0
NA11 Batch 1 90
84
84
35
79 NA12 Batch 2 65
0
0
0
2
NA15 Batch 2 75
89
74
88
84 NA16 Batch 2 1
12
0
0
3
NA17 Batch 2 66
80
77
47
79 NA19 Batch 2 0
0
0
0
8
NA20 Batch 1 71
65
65
81
89 NA22 Batch 2 0
2
0
7
0
Southwest Marine SW02 Batch 1 90
67
90
65
77
SW03 Batch 1 82
74
88
90
70 SW04 Batch 1 65
33
84
46
63
SW08 Batch 1 87
84
88
83
86 SW09 Batch 1 78
82
72
76
81
SW11 Batch 2 84
47
74
77
84 SW13 Batch 1 19
0
41
70
0
SW15 Batch 1 0
0
16
16
9 SW17 Batch 2 0
0
0
0
69
SW18 Batch 2 16
54
74
60
76 SW21 Batch 1 2
71
78
80
78
SW22 Batch 2 1
0
0
4
1 SW23 Batch 2 52
3
14
1
2
SW25 Batch 2 39
4
1
0
0 SW27 Batch 2 72 1 4 11 9
Observed normality in replicate tests on sediment collected at Station NA-01, for example,
varied from 6 to 80 percent. Similarly, normality in replicate tests on sediment from reference

March 11, 2011
26
location 2243 varied from 8 to 79 percent. Order of magnitude or greater variability between
replicate tests was observed at 10 of the 30 Shipyard Triad stations tested.
All of the NASSCO stations had a high level of fertilization in the sea urchin test. None of the
stations had a significantly lower fertilization than the reference pool. Moreover, the lowest
fertilization measured at NASSCO was 72 percent, well above the reference 95 percent LPL of
41.9 percent. For the bivalve development test, 10 of the 15 NASSCO stations had relatively
high percentages of normal larvae, well above the reference range. The remaining 5 stations
had levels of bivalve larvae development that were below the reference range.
In summary, the preponderance of results from sediment toxicity tests conducted for the
NASSCO site indicate a finding that sediments are nontoxic, when compared with the reference
pool. For a total of 45 toxicity tests using three endpoints, 39 were nontoxic at the NASSCO
site. The remaining six tests were below the statistical limits of the reference pool and five of
those were results from the inconsistent bivalve larvae test. The most reliable and widely-used
sediment toxicity test, amphipod survival, demonstrated that only one station (of 15) at
NASSCO was slightly below the reference range (70 percent survival at Station NA11 versus 73
percent for the reference LPL). Taken together, these results demonstrate that the sediments at
NASSCO have “low” toxicity, if any, based on the three test endpoints. The subsequent
incorporation of the toxicity test results into the Triad decision framework in Section 18 of the
DTR is therefore misleading. In Table 18-1 of the DTR (Table 2), the toxicity for nine of the
NASSCO stations with no significant toxicity for any of the three tests is characterized as
“low.” The DTR should have included a category of “no” or “nontoxic” for the toxicity test
results. In this regard, the DTR is notably inconsistent with the State of California Part 1
Sediment Quality Objectives (SQOs) which include a sediment toxicity category of “nontoxic”
as well as a category for “low” toxicity (CA State Water Resources Control Board 2009).
The absence of a nontoxic category in the DTR framework is a misrepresentation of the toxicity
results and the actual characterization for stations that are not different from reference should be
“none.” For the remaining six stations, only one of the three tests had results that were
statistically outside of the reference range. In Table 18-1, those samples are misrepresented as
having “moderate” toxicity. Given that two of the three tests showed no toxicity for these

March 11, 2011
27
samples and all but one were driven by the apparent toxicity in the bivalve larvae test, it is
appropriate to characterize these six samples as having “low” toxicity. The conclusions reached
by the Staff regarding sediment toxicity tests are consistently biased high in this manner,
relative to the typical way in which sediment toxicity testing is interpreted. In fact, empirical
evidence should always trump prediction of effects (Pearson and Rosenberg 1978).
Table 2. Results of the sediment quality triad approach using the reference condition (adapted from Table 18-1 of the DTR)
Site Station Sediment
Chemistrya Toxicityb Benthic
Communityc Weight-of-Evidence
Categoryd
NASSCO NA01 Moderate Low Low Unlikely NA03 Moderate Low Low Unlikely NA04 Moderate Low Low Unlikely NA05 Moderate Low Low Unlikely NA06 Moderate Low Low Unlikely NA07 Moderate Low Low Unlikely NA09 Moderate Moderate Low Possible NA11 Moderate Moderate Low Possible NA12 Moderate Moderate Low Possible NA15 Moderate Low Low Unlikely NA16 Moderate Moderate Low Possible NA17 High Low Low Possible NA19 High Moderate Low Possible NA20 Low Low Moderate Unlikely NA22 Moderate Moderate Moderate Likely
a Relative likelihood that the chemicals present in the sediment is adversely impacting organisms living in or on the sediment (i.e., benthic community).
b Relative likelihood of toxic effects based on the combined toxic response from three tests: amphipod survival, sea urchin fertilization, and bivalve development.
c Relative likelihood of benthic community degradation based on four metrics: total abundance, total number of species, Shannon-Wiener Diversity Index, and the Benthic Response Index.
d Relative likelihood (likely, possible, or unlikely) that the health of the benthic community is adversely impacted based on the three lines of evidence: sediment chemistry, toxicity, and benthic community.
Benthic Macroinvertebrate Communities
Benthic macroinvertebrates are small organisms (generally less than 1 cm in length) that live in
or on the sediments. They are a vital food source for many species. The communities of these
organisms are sensitive to effects of sediment disturbances, including the presence of toxic
chemicals, because of their intimate contact with the sediments. Moreover, many of these
species feed directly on sediment materials and therefore may ingest any associated chemicals.
Because of their small size, limited mobility, high abundances, and importance as fish prey
March 11, 2011
28
items, benthic macroinvertebrates are commonly sampled to evaluate the effects of pollution in
the marine environment. Scientific techniques for sampling, analysis, and interpretation of
benthic macroinvertebrate communities have been well established for decades. For these
reasons, Exponent conducted a detailed investigation of macroinvertebrate communities at the
shipyards and at reference sites in San Diego Bay.
Of the three Triad components, the biological assessment of naturally-occurring benthic
communities forms a very important assessment because it is the one LOE that addresses the
actual responses of organisms living in or on the sediments at the site. Alternatively, the
chemistry data represent the potential exposures existing at the site and the laboratory toxicity
tests represent potential responses of test organisms under laboratory conditions. Burton et al.
(2002b) conclude that “The biologically based LOE are the most important, since they are direct
measures of what is being protected.”
As described in the detailed sediment investigation report for the shipyards (Exponent 2003),
samples for benthic macroinvertebrates were collected at 5 reference stations and at the 15 Triad
stations near the NASSCO shipyard (Figure 2). Five replicate samples were collected at each
station and detailed taxonomic analyses were conducted to the lowest practicable level, which
was usually the species level. This survey represented a rich data set that was used to evaluate
the condition of benthic macroinvertebrates near the NASSCO facility. At each sampling
station, synoptic samples were collected for sediment chemistry and sediment toxicity testing.
The integrated assessment of these three kinds of information is referred to as the Sediment
Quality Triad or the Triad approach, and has been used for more than 20 years at many sites
worldwide (Long and Chapman 1985; Chapman 1990).
The CAO does not discuss or summarize the specific results of the study of benthic
macroinvertebrates conducted at the shipyards. Alternatively, the CAO simply summarizes the
results of the integrated assessment of Triad data (chemistry, toxicity, and benthic
macroinvertebrates) and concludes that 2 of the 15 Triad stations at the NASSCO Site have
sediment pollutant levels “likely” to adversely affect the health of the benthic community (Table
18-1, DTR). The two NASSCO stations designated as likely impacted are NA19 and NA22.
For the purposes of determining whether there are actually adverse effects on benthic
March 11, 2011
29
macroinvertebrates at NASSCO, it is important to look into the background of this assessment
and the various theoretical determinations that were made to determine this “likelihood” of
effects on the benthic community. This is important because the impacts to the benthic
community at station NA19 was characterized as “low”, as were 13 of the 15 Triad stations at
NASSCO.

March 11, 2011
30
Figure 2. Locations of Phase 1 Triad stations
The purpose of this section is to look exclusively at the benthic macroinvertebrate community
near the NASSCO site and to determine whether data indicate the presence of adverse effects, as
suggested by the characterizations described above. This is important because the interpretation
of the Triad results presented in the CAO and DTR are based on a “weight-of-evidence”

March 11, 2011
31
analysis framework developed by Staff that places a high weight on sediment chemistry in
determining the likelihood of benthic macroinvertebrate impairment. Integrated assessment of
Triad results is discussed in articles such as Chapman et al. (2002). However, the overall intent
of the Triad approach is to provide a coherent and plausible indication of the likelihood of
benthic effects. As is the case for any integrative decision framework, it is important to evaluate
and interpret the correspondence between the different metrics (i.e., are they all saying the same
thing, or do they present different results?). In other words, and as is discussed in Chapman et
al. (2002), it is always important to use BPJ to determine if the decision framework and the
underlying Triad results make sense from a causal perspective. If the independent metrics do
not correspond, it is important to look at all possible causes, using all available information, not
just that collected as part of the Triad study.
In the DTR, the Staff’s summary analysis of benthic macroinvertebrates at NASSCO and the
reference areas is presented in Table 18-12. This table presents the results of comparisons of
four benthic macroinvertebrate metrics at the NASSCO site with the 95 percent prediction limits
for the reference pool selected by the Staff in the DTR. The four benthic macroinvertebrate
metrics evaluated are the benthic response index for southern California embayments (BRI-E),
total abundance, number of taxa, and Shannon Wiener Diversity. Notably, of the 60 individual
comparisons with reference conditions (15 stations and 4 metrics), there are only three
significant differences from the reference pool. All three of those differences are associated
with sediment stations NA20 (number of taxa) and NA22 (abundance and number of taxa). The
analyses conducted by Exponent (2003) used a different statistical approach and reference pool,
but the overall results for the NASSCO site were similar to those presented in the DTR. For
both total abundance and number of taxa, there were very few significant differences from
reference, and one of the sites displaying significant differences in both metrics was station
NA22. Thus, two different and independent assessments of the NASSCO data set have shown
that the benthic macroinvertebrates are generally similar to reference conditions and that any
adverse effects are confined to two locations that are near the mouth of Chollas Creek.
In the DTR, the various benthic macroinvertebrate metrics are then combined for an overall
“Line of Evidence” for results when compared to reference conditions (see Table 18-13 from
March 11, 2011
32
the DTR). In this table, all of the NASSCO stations except for NA20 and NA22 have a “no”
designation for all four individual metrics, indicating that there was no significant difference
from the reference 95 percent confidence interval. The results for the individual benthic
macroinvertebrate metrics are then combined into a single overall assessment of the status of the
benthic macroinvertebrate community at each station. Because of the aforementioned effects
detected at stations NA20 and NA22, both of these stations are given a “moderate” designation
for overall effects to the benthic macroinvertebrates. Inexplicably, all other stations are given
an overall designation of “low” despite the fact that there are no significant differences from
reference conditions for any of the four individual metrics. Based on these results, all stations
other than NA20 and NA22 should have been classified in the DTR as “no” or “none” rather
than “low” because the results showed no statistical evidence for adverse effects for multiple
benthic macroinvertebrate variables. It is relevant to note that the DTR, in a later section
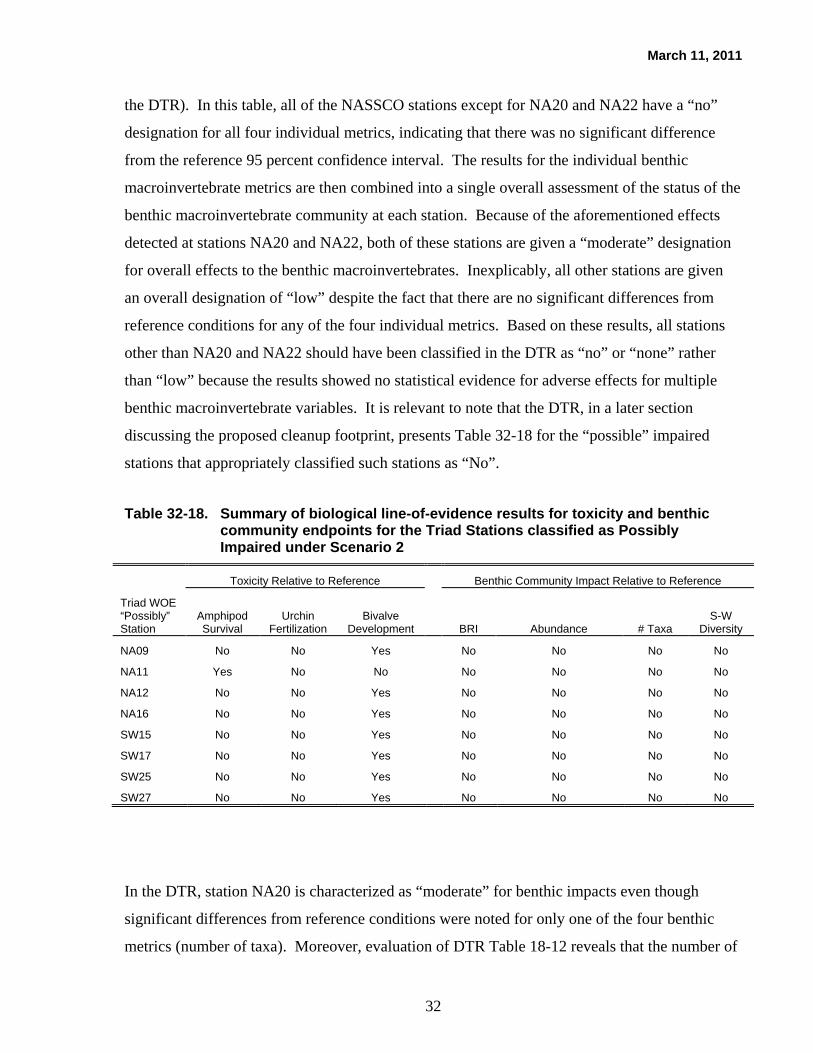
discussing the proposed cleanup footprint, presents Table 32-18 for the “possible” impaired
stations that appropriately classified such stations as “No”.
Table 32-18. Summary of biological line-of-evidence results for toxicity and benthic community endpoints for the Triad Stations classified as Possibly Impaired under Scenario 2
Toxicity Relative to Reference Benthic Community Impact Relative to Reference
Triad WOE “Possibly” Station
Amphipod Survival
Urchin Fertilization
Bivalve Development
BRI Abundance # Taxa S-W
Diversity
NA09 No No Yes No No No No
NA11 Yes No No No No No No
NA12 No No Yes No No No No
NA16 No No Yes No No No No
SW15 No No Yes No No No No
SW17 No No Yes No No No No
SW25 No No Yes No No No No
SW27 No No Yes No No No No
In the DTR, station NA20 is characterized as “moderate” for benthic impacts even though
significant differences from reference conditions were noted for only one of the four benthic
metrics (number of taxa). Moreover, evaluation of DTR Table 18-12 reveals that the number of

March 11, 2011
33
benthic taxa at Station NA20 was 22, which is the same value as the 95 percent LPL of the
reference pool. Therefore, the number of taxa at station NA20 was within the reference range as
indicated by the LPL and should not be classified as significantly different. This appropriate
characterization of station NA20 is also consistent with the DTR characterization of this station
for chemistry and toxicity as “low”. Thus station NA22, located directly off the mouth of
Chollas Creek, is the only Triad station at NASSCO with significant effects on benthic
communities.
Evaluation of the overall benthic macroinvertebrate assemblage at all NASSCO sampling
stations, including NA22, shows a high degree of similarity with the reference stations. At the
NASSCO site, 68 percent of the benthic macroinvertebrate community abundance is polychaete
worms compared with 69 percent polychaetes at the reference sites (Figure 3). Crustaceans, a
group generally considered to be sensitive to sediment pollutants, comprise 12 percent of the
benthic macroinvertebrate communities at both NASSCO and the reference stations. There is
also a remarkable similarity in taxa numbers between the NASSCO site and the reference areas
(Figure 3). For the total benthic macroinvertebrate assemblage, the percent of the taxa that are
polychaetes are 38 percent and 37 percent for NASSCO and the reference areas, respectively.
Similarly, 25 percent of the total taxa are crustacean at NASSCO and 23 percent are crustacean
at the reference areas. The overall abundances of benthic macroinvertebrates at reference areas
and the NASSCO site are also very similar and not statistically different (Figure 4).

March 11, 2011
34
Figure 3. Benthic community characteristics—number of species
and organisms

March 11, 2011
35
Figure 4. Comparison of benthic community characteristics between the NASSCO footprint stations and reference areas
Examination of individual species also reveals the similarity of benthic macroinvertebrate
communities at the NASSCO site and at the reference areas. For both areas, the two dominant
species are the same: the polychaetes Lumbrineris sp. and Exogone lourei (Table 3). Moreover,
six of the ten most abundant species at each area are the same. At both reference and NASSCO
areas, the top ten species comprise 65 percent and 72 percent of the total individuals,
respectively. Therefore, these are very similar assemblages and this qualitative evaluation
supports the other assessments that there are no overall significant adverse effects on benthic
macroinvertebrate communities at the NASSCO site.

March 11, 2011
36
Table 3. Relative abundance of the 20 most abundant benthic macroinvertebrate taxa at the reference stations and shipyard sites
Reference Stations NASSCO Site
Taxon
Relative Abundance (percent) Taxon
Relative Abundance (percent)
Lumbrineris sp. 22.0 Exogone lourei 17.9
Exogone lourei 9.5 Lumbrineris sp. 17.8
Leitoscoloplos pugettensis 7.2 Musculista senhousia 10.6
Diplocirrus sp. SD1 6.0 Pseudopolydora paucibranchiata 6.4
Mediomastus sp. 5.0 Pista alata 5.4
Pista alata 4.8 Leitoscoloplos pugettensis 4.5
Nematoda 2.9 Scyphoproctus oculatus 2.8
Edwardsia californica 2.7 Theora lubrica 2.6
Paracerceis sculpta 2.4 Mediomastus sp. 2.3
Scyphoproctus oculatus 2.3 Prionospio heterobranchia 1.8 Total 64.8 Total 72.0
Because adverse effects on benthic macroinvertebrates were detected in the DTR assessment at
Stations NA20 and NA22, it is important to evaluate the locations of those stations relative to
NASSCO shipyard operations and other potential causal factors. As demonstrated in Figure 2,
both of those stations are located near the southeast end of the NASSCO leasehold. Station
NA22 is located about 100 m directly off the mouth of Chollas Creek. Station NA20 is located
in the vicinity of Berths 5 and 6, with active piers on both sides. Causal relationships can be
evaluated for these stations using two approaches:
1. Comparison of the concentrations of sediment chemicals at the two stations
relative to concentrations at other NASSCO locations
2. Evaluation of alternative sources of sediment chemicals or other factors that
may be influencing the sediment environment at those locations.
First, it should be noted that the concentrations of sediment chemicals at these two stations are
generally substantially lower than at other locations near the active shipyard operations at
NASSCO. For example, in the Exponent study the concentration of copper in surface sediments
at Stations NA20 and NA22 was 96 and 150 mg/kg dry weight, respectively. Both of these

March 11, 2011
37
concentrations are well below the Staff’s alternative cleanup level for copper of 200 mg/kg, and
far below the maximum copper concentrations measured at other NASSCO sites (e.g.,
>300 mg/kg) for which there were no measurable effects on benthic macroinvertebrates.
Second, any effects at these sites can be attributed to other sources and stressors on benthic
communities. Natural variables and non-chemical physical stressors may have important
influences on benthic communities and should not be overlooked when interpreting sediment
data (Burton et al. 2002a; Wenning et al. 2005). As noted in a detailed study of Chollas Creek
(SCCWRP and U.S. Navy 2005), two stations located offshore of the mouth of the creek
showed effects on benthic macroinvertebrate assemblages that the report indicates may have
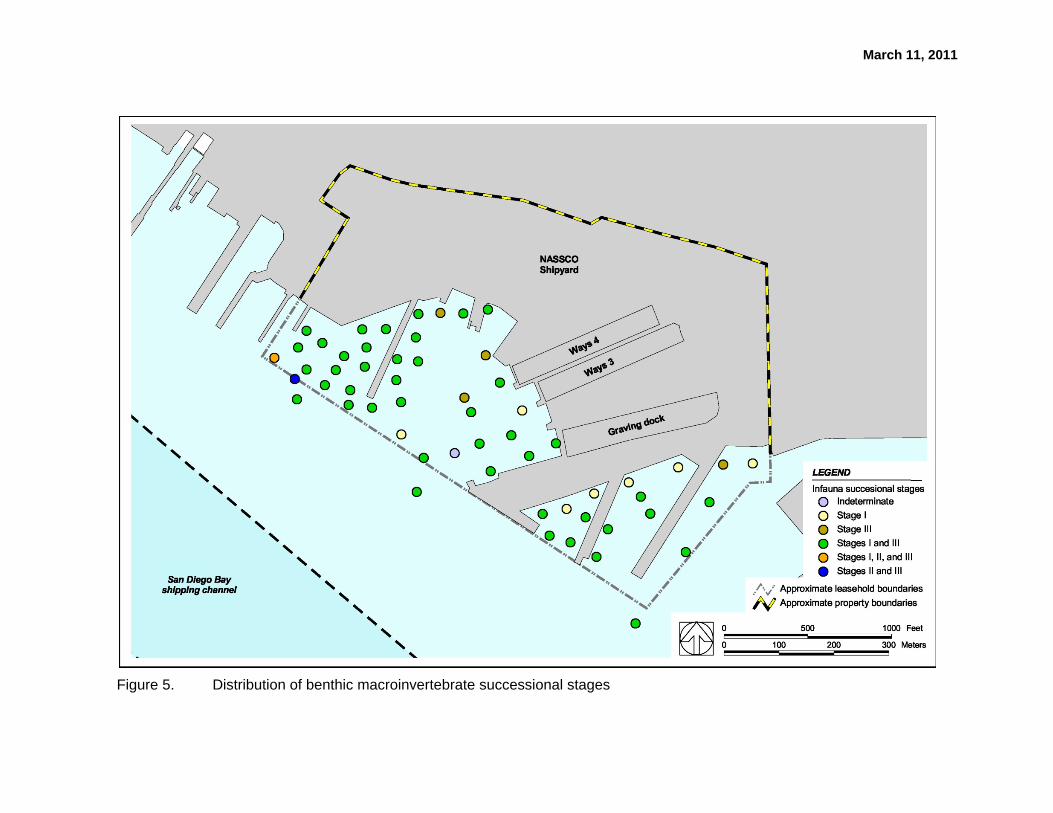
resulted from engine tests conducted by NASSCO at the southern pier location. Studies
performed by Exponent using sediment profile imaging also indicated that benthic
macroinvertebrate communities along this area were in successional Stage I, which is dominated
by early colonizers that can occur after the sediment is physically disturbed (Figure 5).
According to NASSCO, this area is used to test ship engines and there is considerable potential
for sediment disturbance when the engines are increased in power while the vessel is secured to
the pier.
Chollas Creek (see Figure 2) is also a documented source of pesticides such as DDT and
chlordane, which may contribute to adverse effects in that area, possibly impacting both stations
NA20 and NA22. Chollas Creek, including the mouth area, is currently being evaluated by the
Regional Board for total maximum daily loads (TMDLs) for several substances. As part of this
evaluation, the U.S. Navy has conducted Triad studies in Chollas Creek and in San Diego Bay
immediately offshore of the mouth of the creek. A presentation of these results indicates that
sampling stations in the vicinity of station NA22 were characterized as possibly or likely
impaired and that the chemicals of concern included chlordane and DDT (U.S. Navy 2005).
Therefore, any benthic impacts at Station NA22 may be the result of discharges from Chollas
Creek. It is important to note that all of the other benthic macroinvertebrate samples collected at
the NASSCO site had no statistically significant effects on BMI when compared with the
reference pool.
March 11, 2011
Figure 5. Distribution of benthic macroinvertebrate successional stages

March 11, 2011
39
Notwithstanding the apparent healthy condition of the benthic community in general, sediment
data collected during the Site investigation indicate some physical disturbance in some areas of
the NASSCO leasehold, resulting from vessel traffic and shipyard operations (such as engine
testing). This physical disturbance is expected to affect the benthic community, potentially
altering both the absolute abundance and the species composition of the community at some
station locations.
Two types of measurements made at the NASSCO site indicate that physical disturbance is
present in the shipyard sediments. These are the sediment profile imaging results and the grain
size profiles in sediment cores. Evaluation of the sediment profile images collected in 2001
(Exponent 2003) indicates that the benthic invertebrates at many locations within the NASSCO
leasehold consist of a combination of: 1) a mature benthic community represented by deep-
dwelling deposit feeders (successional stage III), and 2) a community of colonizers of disturbed
sediment at the surface (successional stage I). Sediment conditions at the shipyard are clearly
able to support a mature benthic community, as indicated by the presence of stage III fauna, but
the presence of stage I fauna at the surface suggests that surface sediments were disturbed prior
to the sampling in 2001. The prevalence of such an indicator of disturbance at the NASSCO
shipyard suggests that such disturbance of surface sediments is widespread and ongoing.
Sediments that are deposited under relatively quiescent conditions, and subsequently subject to
processing by benthic macroinvertebrates, typically exhibit a sorted profile of grain size, with
finer (and typically organic-rich) particles near the surface and coarser particles at greater
depths. Sediments that have been disturbed typically exhibit a more haphazard and unsorted
profile of sediment grain size. Cores collected inside and outside the shipyard leaseholds in
2002 were evaluated to determine whether they exhibit sorted or unsorted grain size profiles
(Exponent 2003). Six of the ten core stations inside the NASSCO leasehold exhibited a grain
size profile characteristic of disturbed sediments; 14 of the 15 core stations offshore of the
shipyard showed an undisturbed profile. This contrast suggests that physical disturbance of the
sediment is common within the operational area of the shipyard leasehold.
The presence of physical sediment disturbance within the NASSCO leasehold can be expected
to lead to alterations in the macrobenthic community that are unrelated to hazardous substances.

March 11, 2011
40
This effect must be considered when interpreting the benthic macroinvertebrate leg of the Triad.
The conclusions regarding physical disturbance based on the analysis of core profiles were used
by Staff in their evaluation of the dates of historical contaminant releases at the shipyards. The
existence of physical sediment disturbance is also acknowledged by Staff in their critiques of
natural recovery and subaqueous capping as remedial alternatives. However, despite the clear
recognition by the Staff of the presence and effect of sediment disturbance, Staff did not account
for the impact of physical disturbance in the analysis of Triad data: The DTR relies solely on a
comparison of various metrics between site and reference locations, without consideration of the
effects of physical disturbance or the actual benthic communities present at the site. Therefore,
although the benthic community line of evidence results in a designation of a “low” effect
category for 13 of 15 NASSCO stations (which should actually be noted as “none” for 14 of the
stations, as described previously), the method used to reach the conclusion that two stations
were “moderate” was flawed because it failed to consider all the relevant evidence.
In summary, with the exception of two stations located near the mouth of Chollas Creek, all of
the benthic macroinvertebrate sampling stations at NASSCO show no adverse effects when
compared with reference conditions based on the DTR assessment. As noted previously, one of
these stations (NA20) was inappropriately classified as impacted based on one metric.
Therefore, with the exception of one station at the mouth of Chollas Creek, the benthic
macroinvertebrates at NASSCO are similar to reference communities based on multiple metrics,
including BRI-E, abundance, taxa number, and diversity. These healthy benthic communities
exist in sediments at the NASSCO shipyard notwithstanding the effects of physical disturbance
associated with an active industrial facility. As is shown in the section of my report dealing
with the Triad analyses, the conclusion in the DTR that some of the areas at NASSCO have
“likely” effects on benthic macroinvertebrates and some of the areas have “possible” effects on
benthic macroinvertebrates are erroneous and inconsistent with the standard of practice for
interpretation of Triad studies. The direct assessment of benthic macroinvertebrate communities
at NASSCO demonstrates conclusively that these predictions in the DTR are incorrect.
March 11, 2011
41
Fish Histopathology
In evaluating fish histopathology at the shipyards, the draft CAO and technical report indicates
that the Staff evaluated the data set for the shipyards and concluded: “the fish histopathology
data does not indicate that the fish lesions observed in the data set can be conclusively attributed
to contaminant exposure at the Shipyard Sediment Site.” (DTR, Appendix 15). Although I
agree with this statement, the brief discussion in the draft CAO does not present the complete
story regarding fish histopathology at the shipyards and may be interpreted as suggesting that
some adverse effects are present but without conclusive evidence to support their association
with the shipyards. Therefore, I wish to clarify the interpretation of the fish histopathology data
and present a summary of the complete results.
First, it is important to note that the study conducted at the shipyards was one of the most
comprehensive fish pathology studies conducted for any particular site in the U.S. For this
study, 253 spotted sand bass (Paralabrax maculatofasciatus) were collected and examined by
an experienced fish pathologist for the presence of 70 lesions and other abnormality categories
in the liver, gonads, kidneys, and gills. Collected fish were also aged, measured, and weighed
so that the general health of the fish could be compared with reference conditions. The overall
study design ensured that the resultant statistical analysis would be sufficiently powerful to
detect any adverse effects if they were present at the shipyards.
The important results of this study were:
• Of the 70 lesions evaluated, the incidence of only 4 was considered as being
significantly elevated near the shipyards, whereas incidence of 6 of the
lesions was significantly elevated in the reference area when compared with
one or more shipyard sites
• Most of the lesions described were categorized by the pathologist as being
“mild”
March 11, 2011
42
• No serious liver lesions that are commonly found in fishes collected at
contaminated sites in the U.S. (e.g., liver carcinoma or adenoma) were found
in fishes collected at the shipyards
• The growth and condition of spotted sand bass near the shipyards were not
different from the reference area.
Therefore, this comprehensive study of fish health at the shipyards demonstrated that an
important fish species in San Diego Bay, the spotted sand bass, was not adversely affected by
chemicals present in the sediments, water, or prey items at the NASSCO site.
Triad MLOE Assessment
The DTR relies on an MLOE assessment to characterize potential risks to aquatic life from
sediment contamination. Specifically, a sediment quality triad (Triad) approach is used, which
evaluates sediment chemistry, benthic macroinvertebrate community data, and toxicity testing
data from co-located samples collected for this purpose in 2001, during Phase I of the sediment
investigation. In the CAO, 2 of the 15 Triad stations within the NASSCO leasehold were
judged “likely” to have adverse effects on benthic community health, with adverse effects at the
remainder judged to be “possible” or “unlikely” (RWQCB 2010, Table 18-1).
Since the original description of the Triad approach, various decision frameworks have been
proposed to use the information in an MLOE assessment (Burton et al. 2002a; Chapman et al.
2002; Grapentine et al. 2002). The structure and characterizations used in such a decision
framework are key parts of the overall Triad approach because the end result is usually an
overall narrative description of relative risks for that location. The individual tests of
significance for Triad endpoints are usually quantitative comparisons, frequently using
statistical comparisons with reference area data for sediment toxicity and benthic community
characteristics. These are, therefore, objective results that can be characterized as either being
significantly different from reference or not significantly different from reference. However,
the characterization of these results in the decision framework and the method of combining the

March 11, 2011
43
results in an overall assessment frequently involve subjective decisions, and may have a major
effect on how a given data set is interpreted.
The first requirement for a rational, technically defensible MLOE assessment is for individual
LOEs to be interpreted independently and correctly. Each leg of the Triad must be evaluated by
objective, not subjective criteria (Chapman 1996). Errors and biases in the Staff’s interpretation
of data from each of the three Triad LOEs are discussed in previous sections. After individual
LOEs have been evaluated, the biggest challenge in any MLOE approach to risk assessment is
how to combine independent findings into a coherent characterization of risk, particularly when
the indications of individual LOEs do not all agree, which is commonly the case. A technically
defensible MLOE conclusion requires a systematic, rational, and technically justifiable
approach to combine multiple findings. It cannot be reliably generated by opinion or simple
professional judgment. The MLOE approach used in the DTR is fundamentally flawed by
inappropriate interpretation of data, and their weighting of individual endpoints is biased and
unscientific. It is also inconsistent with accepted and published practices for interpreting Triad
data. The DTR Triad assessment therefore does not lead to a rational, technically defensible
conclusion about risk to benthic aquatic life from sediment contamination.
Interpretation of Chemistry LOE
In the DTR, the sediment chemistry data are interpreted to indicate “moderate” likelihood of
adverse effects on benthic organisms at 12 of 15 NASSCO stations, with the two stations
(NA17 and NA19) classified as “high” and NA20 as “low” risk (RWQCB 2010, Table 18-1).
These findings were primarily driven by comparison of concentration data to selected sediment
quality guidelines. The sediment chemistry LOE is clearly the risk-driving leg of the Triad at
most stations, and appears to have influenced the Staff’s interpretation of the remaining two legs
of the Triad: benthic macroinvertebrate community and toxicity LOEs (see below).
March 11, 2011
44
Interpretation of Benthic Macroinvertebrate LOE
Benthic macroinvertebrate community data are interpreted in the DTR to indicate “low”
likelihood of adverse effects at 13 of 15 NASSCO stations, with the remaining two stations
(NA20 and NA22) classified as having “moderate” likelihood of adverse effects. As discussed
previously, the “low” designation was assigned even though none of the benthic
macroinvertebrate metrics evaluated indicated any significant differences between those
13 NASSCO stations and reference conditions, a finding that should have resulted in a
likelihood of “none” for adverse effects in an independent and unbiased evaluation of the
benthic macroinvertebrate LOE. The DTR claims to characterize the “relative likelihood of
benthic degradation” using terms such as “low”. However, when a particular index is not
statistically different from reference conditions, there is no measureable likelihood that the
benthic conditions are degraded. The DTR seems to acknowledge this relationship with the
statement that:
Low Degree of Benthic Community Degradation: Benthic community degradation at each station is classified as none or a low if the BRI RL is less than 2 and when abundance, number of taxa, and the Shannon-Weiner Diversity Index are all statistically similar to the Reference Condition. (See Section 18.4 of the DTR)
Although this statement is made in the text, all of the DTR tables use the descriptor “low” when
conditions are not significantly different from reference values.
In addition, as noted previously, Station NA20 was erroneously classified as “moderate” in the
DTR. A correct interpretation of the benthic community results when compared with reference
conditions would result in a classification of “low” for this station. Therefore, the only benthic
communities at the NASSCO shipyard that are different from reference conditions are at Station
NA22, located directly off the mouth of Chollas Creek in an area that has been documented to
have likely impacts on benthic communities based on TMDL studies (see Figure 33-2 of DTR).
The final Triad characterization in the DTR is therefore biased high as a result of the biases
incorporated into the benthic community LOE. This is a fundamental problem with the
approach used in the DTR. The reason for running statistical comparisons is to test whether

March 11, 2011
45
there are any significant differences between the shipyard stations and the reference station
pool. When the results presented in the DTR clearly indicate that there are no statistical
differences from reference conditions at 13 of the 15 NASSCO stations, those stations should be
characterized as “no” likelihood of adverse effects, rather than “low.” The Staff’s use of the
descriptor “low” when all results for that metric are nonsignificant is a clear bias and misleads
the reader into believing that the results show some level of effect.
Interpretation of Toxicity Data
The Staff interpreted sediment toxicity data to indicate “low” likelihood of adverse effects at
9 of 15 NASSCO stations, with the remaining six stations classified as “moderate” risk
(RWQCB 2010, Table 18-1). As with the benthic macroinvertebrate LOE, the DTR
interpretation of the toxicity LOE is biased high, because the objective and statistical analysis of
toxicity data in the DTR demonstrated that there is no significant toxicity at the majority of
NASSCO sediment stations when compared to reference conditions for San Diego Bay.
Furthermore, at the remaining six NASSCO stations, only one of the three toxicity tests was
significantly different from reference toxicity. At those sites, the stations should have been
designated as “low” toxicity, rather than “moderate” because two of the three independent
metrics, including the most sensitive and reliable test (amphipod), were not different from
reference.
Weight of Evidence Framework
Interpretation of disparate indicators always involves application of professional judgment to
arrive at a conclusion that is scientifically supported by the “weight of evidence.” In order to
assure consistency and objectivity, a framework is needed to combine individual LOEs. The
validity and defensibility of the MLOE conclusion is determined by the validity and
defensibility of the evaluation framework that generates it. The weight of evidence framework
used in the DTR is discussed and shown in Section 18.5 and Table 18-14 of the DTR.
March 11, 2011
46
The text of Section 18.5 says that the framework is based on the following four key elements
(verbatim from the DTR):
• Level of confidence or weight given to the individual line of evidence
• Whether the line of evidence indicates there is an effect
• Magnitude or consistency of the effect
• Concurrence among the various lines of evidence.
The DTR does not provide any more specific description of what these four key elements mean,
nor how they were applied to derive the evaluation framework shown in Table 18-14.
A specific description of the meaning of these four elements is needed because, as written, they
are ambiguous and it is consequently unclear how, or even if, the Staff have interpreted and
applied them to develop the weight of evidence matrix. A specific description of the ways in
which these elements were used is needed because the matrix (Table 18-1) is inconsistent with
recommended application of the Triad, and is inconsistent with results of the detailed sediment
investigation. It should also be noted that the DTR provides no independent justification or
citation from the scientific literature for the decision framework used.
The four key elements listed above are ambiguous because some of the elements depend on
others. The first of the elements (level of confidence or weight given to individual lines of
evidence) should be based on the other elements (existence of an effect, magnitude or
consistency of the effect, and concurrence among lines of evidence). The second and third
elements are interrelated, because a determination of whether or not there is an effect (the
second element) must consider the magnitude or consistency of any possible effect (the third
element). As they stand, therefore, these elements are not clearly independent, and the DTR
does not adequately explain exactly what these elements mean or how they were interpreted and
applied to develop the WOE matrix in Table 18-14.
March 11, 2011
47
It is recognized that the interpretation of Triad data can be difficult and that such interpretations
are not straightforward, especially for complex industrial sites with a variety of potential
stressors that may influence chemical, toxicological, and biological endpoints. For such sites,
an assumption that relatively high levels of sediment chemistry necessarily indicate potential
adverse effects may be inappropriate. For example, the data and statistical analyses presented in
the 2003 DSI demonstrate that there is not a good relationship between chemical concentrations
and biological effects at the shipyard site. The reason that this assumption does not apply is the
limited bioavailability of metals in the sediment of the shipyard. This situation can occur in
Triad assessments and has been recognized for some time as a possible outcome for the
chemistry data.
Chapman and others have recognized that such conditions can lead to conflicting Triad data,
requiring interpretation of additional data to understand the reasons behind the conflicting
outcome. For example, Chapman (1996) describes eight possible outcomes, relative to
reference conditions, for the three kinds of Triad data, and describes possible conclusions for
each outcome. For the situation where contamination is elevated but there are no significant
differences from reference conditions for toxicity or benthic biological conditions, the outcome
is listed as “contaminants are not bioavailable. No actions necessary”. Moreover, Chapman
(1996) describes the situation where contamination is elevated and there is significant toxicity
but no effects on benthic organisms. For this situation he concludes that the benthic analyses
should be re-checked and if the re-check indicates no benthic alteration, the appropriate action
would be to minimize or reduce pollutant inputs to prevent future alteration. Finally, the State
of California SQOs for enclosed bays and estuaries also include a decision framework for Triad
data (CA State Water Resources Control Board 2009). In the SQO framework, a situation of
“high” chemistry, “reference” benthic communities, and “nontoxic” or “low” sediment toxicity
receives a station assessment of “likely unimpacted” in the MLOE framework.
In contrast to the recommended approach of relying on biological lines of evidence to assess
biological impacts, the approach embodied in Table 18-14 of the DTR instead relies principally
on chemical measurements, despite the fact that there is little or no relationship between
chemical and biological measurements at the shipyard site. The overemphasis on chemical data

March 11, 2011
48
is represented by all the rules in Table 18-14, and can be seen clearly by examining only a few
rows of the table, which are shown here in Table 4.
Table 4. Excerpt from DTR Table 18-14
Line of Evidence Assessed likelihood of benthic community
impairment Chemistry Toxicity Benthic community
High Low Moderate Likely High Moderate Low Likely High Low Low Possible Low High High Unlikely
The chemistry line of evidence clearly dominates the others: when chemistry is “high,” benthic
community impairment is assessed to be likely, or possible, even when the two biological lines
of evidence indicate otherwise. (Note that the “low” category for the biological lines of
evidence means that they are equivalent to reference locations, and therefore meet the protected
condition and should be classified as “none.”) Conversely, when chemistry is “low,” benthic
community impairment is assessed to be unlikely, even when the two biological lines of
evidence indicate otherwise. As these examples illustrate, the weight of evidence scheme
presented in Table 18-14 of the DTR is skewed toward primary reliance on sediment chemistry
data, in contravention to the recommendations of experts in the development and application of
the sediment quality Triad. Through the use of this weight of evidence scheme, the DTR draws
conclusions about conditions at the shipyard site that are not technically justified.
After an initial application of any decision framework, the investigator should step back and
determine whether the results are consistent and coherent from a scientific perspective before
making ultimate decisions concerning overall interpretation of the results. In the DTR and
CAO, it appears that this final scientific step was not conducted. Even using the Staff’s
inappropriate characterizations of “low” for sediment toxicity and benthic community effects,
the Staff should have noted a fundamental inconsistency between the sediment chemistry results
and the site-specific biological data. The obvious scientific question is “How can there be
elevated sediment chemistry and yet sediment toxicity is low and there are no effects on benthic
macroinvertebrates?” The identification of this logical question then leads the investigator to
March 11, 2011
49
look for alternative explanations for the results. Rather than follow this line of scientific
investigative thinking, the staff apparently blindly imposed their decision framework and
concluded that effects on benthic communities were either possible or likely.
From early integrated assessments of sediment contamination, it has been recognized that
situations may exist where there are elevated levels of chemicals in sediments but no significant
sediment toxicity or adverse effects on benthic macroinvertebrates. For example, in describing
the interpretation of Triad data, Chapman et al. (1992) indicates that when contamination is
elevated, but toxicity and benthic macroinvertebrates are not different from reference
conditions, the conclusion is “contaminants are not bioavailable.” The consequence of the
RWQCB staff’s failure to adequately explain or apply the four key framework elements, and of
not following recommended interpretation methods for sediment quality Triad data, is a major
distortion of the conclusions regarding biological condition in the sediment of the shipyard site.
The direct measurements of biological conditions (Tables 18-13 and 18-8 of the DTR) show the
following:
• Benthic communities are equivalent to reference conditions at 14 of
15 stations in the NASSCO leasehold. (The one station with a moderately
impacted benthic community is located off the mouth of Chollas Creek.)
• Toxicity to amphipods was found at only one of 15 stations in the NASSCO
leasehold. At this single station, amphipod survival was 70 percent, which is
only 3 percent below the statistical reference range.
• Toxicity to sea urchins was not found at any of the 15 stations in the
NASSCO leasehold.
• Toxicity to bivalves was found at 5 of 15 stations in the NASSCO leasehold.
This toxicity test, however, used an experimental method and produced
highly inconsistent results, even among replicates of individual samples and
even for reference area samples (Exponent 2003). The DTR weights this
toxicity test equal to the others, despite the fact that if the first of the four key

March 11, 2011
50
elements listed above were actually applied, this toxicity test would be given
less weight than the others.
In contrast to these results, which show that only a minor fraction of the stations in the
NASSCO leasehold do not meet the reference condition, the skewed weight of evidence scheme
represented by Table 18-14 in the DTR leads to an erroneous conclusion that five stations have
“Possible” impacts to benthic macroinvertebrates and two stations have “Likely” impacts.
(Table 18-1).
Multiple Comparisons with the Reference Pool
In the DTR, it is stated that “Although multiple comparisons were made to the Reference Pool
prediction limits, the San Diego Water Board made a decision to not correct for multiple
comparisons so that the Shipyard Site/Reference comparisons would remain conservative and
more protective.” This statement indicates that the Staff understood the statistical issues
associated with multiple comparisons and made an apparent policy decision to not make such
corrections. However, other than this statement, the DTR does not discuss the implications of
this decision or the degree of conservatism or protectiveness that is introduced by the decision.
For the toxicity and benthic macroinvertebrate legs of the Triad, comparisons with the
95 percent prediction limits of the reference pool forms a key component of the analysis
presented in the DTR. All categorical classifications of toxicity and benthic macroinvertebrate
metrics are based on these comparisons with the reference pool. Each statistical comparison for
the 30 Triad stations (15 NASSCO Triad stations) was conducted at the 95 percent confidence
level (i.e., with a 5 percent error rate). Thus, the DTR analyses conducted multiple comparisons
for the shipyard results using a 95 percent limit for each comparison. This situation presents a
classical problem in statistics that involves the experiment-wise Type I error rate (i.e., false
positives) when multiple comparisons are made. The essence of this problem is that the
experiment-wise error Type I rate can be substantially higher than 0.05 when multiple
comparisons are made, each with an individual error rate of 0.05.

March 11, 2011
51
Statistical texts (e.g., Zar 1996) provide a method to adjust the Type I error rate for individual
comparisons so that the experiment-wise error rate will equal a nominal value such as 0.05. The
simplest method is referred to as the Bonferroni correction, where the probability level for each
individual comparison is simply the experiment-wise error rate divided by the number of
comparisons. A related question is concerned with the probability of making a Type I error
involving multiple comparisons, each conducted at the 0.05 level. In other words, this is the
probability of incorrectly concluding that a significant difference exists when the result is
simply a result of random chance. The following equation can be used to answer this question
for individual comparisons at the 0.05 level:
P (at least one significant result) = 1 – (1 – 0.05)n
where n = number of individual comparisons
In the case of the 15 comparisons made for each toxicity and benthic macroinvertebrate metric
at NASSCO, the resultant probability is 0.54. In other words, using the approach in the DTR,
there is a 54 percent probability that at least one apparently significant result will occur as a
result of chance alone (i.e., a false positive error). This is an important result because, as noted
previously, there was only one station at NASSCO that had a marginally significant result for
the amphipod toxicity test. Therefore, there is a substantial probability that the apparently
significant result at station NA11 results from chance alone. Moreover, there is also a
substantial probability that at least one of the four apparently significant bivalve larvae tests
(i.e., other than station NA22) resulted from a similar situation.
In summary, the DTR’s failure to correct for multiple statistical comparisons introduces a
substantial level of conservatism into the results. It is my opinion that this level of conservatism
is excessive because of the high probability of false-positive errors that are introduced into the
results. Therefore, some of the apparently significant results for toxicity and benthic community
comparisons that are presented in the DTR may be erroneous.

March 11, 2011
52
Summary of Triad Assessment
A critical step in Triad assessments is the final integration of the three LOEs into a single
assessment of sediment quality at a sampling station. In the relatively rare case where all
individual LOEs indicate the same condition, MLOE interpretation is straightforward. The
difficulty and primary challenge of MLOE assessments is interpreting differences in individual
LOE indicators. The challenge with weight of evidence approaches then becomes how much
weight to give which evidence. Longstanding EPA guidance on sediment assessment explicitly
recognizes this fact: “The use of complementary assessment methods can provide a kind of
independent verification of the degree of sediment contamination if the conclusions of the
different approaches agree. If the conclusions differ, that difference indicates a need for caution
in interpreting the data since some unusual site-specific circumstances may be at work” (U.S.
EPA 1992).
The analyses presented here demonstrate that the Staff has not adequately considered what
circumstances may exist at NASSCO that lead to divergent Triad LOEs. Rather, they appear to
be operating under the assumption that elevated sediment chemistry is always indicative of risk,
regardless of what the site-specific biological indicators show. Elevated chemistry is typically
the trigger for a Triad investigation, and is therefore present at virtually all sites where Triad
data are collected. Sediment chemistry is the most readily measurable attribute of
contamination and possible risk, but it can be used only to infer the potential for risk, not
demonstrate it. It is relevant to risk only in that Triad studies are ordinarily performed only
where chemical concentrations are believed to be predictive of exposure, and measurement of
the chemical concentrations can provide confirmation and explanation of any adverse effects
observed in the biological legs of the Triad. Biological indicators, including toxicity tests and
community data, directly measure the important attributes that chemical concentrations are
assumed to be responsible for. According to regulatory guidance, when biological and chemical
indicators diverge, greater weight should be placed on the biological over the chemical LOEs:
“some legs of the SQT [sediment quality triad] are given more weight than others. In general,
toxicity/benthos are given a higher weight than sediment ….” (U.S. EPA 1992). In this case, the
Staff has inappropriately chosen to weight chemistry and some marginal toxicity results over
biology.

March 11, 2011
53
The need for independent evaluation of Triad LOEs is explicitly recognized in the DTR, even if
it is not apparent in their decision framework. “As noted by U.S. EPA (1992a), there is no
single method that will measure all contaminated sediment effects at all times and to all
biological organisms. For example, sediment chemistry provides unambiguous measurements
of pollutant levels in marine sediment, but provides inadequate information to predict biological
impact” (RWQCB 2010, section 15.1). The DTR acknowledges that the benthic
macroinvertebrate data are important in confirming whether there are adverse effects in situ:
“This benthic data provides confirmatory evidence concerning the potential impacts that
contaminated sediment is having on the resident benthic community” (RWQCB 2010, section
16.1), but does not appear to use benthic macroinvertebrate data as a primary LOE in the
assessment. The report goes on to conclude that effects on benthic macroinvertebrates are
“likely” or “possible” when the Staff’s own analyses of the NASSCO data show no adverse
effects on benthic macroinvertebrates beyond the two stations near the mouth of Chollas Creek.
Therefore, the benthic macroinvertebrate data were not confirmatory of the sediment chemistry
data, but rather showed that benthic macroinvertebrates were not adversely affected by the
elevated chemical concentrations for all but one small part of the shipyard near Chollas Creek.
The benthic macroinvertebrate data were confirmatory, however, for most of the sediment
toxicity data, especially the ecologically-relevant and sensitive amphipod test. Given these
results, the Staff should have questioned the interpretation of the sediment chemistry data and
looked for causal explanations for the Triad results. Based on the presentations in the DTR,
they apparently did not conduct such an evaluation, but continued to apply their biased
framework to erroneously conclude that impairment of benthic macroinvertebrate communities
was “likely” at stations NA19 and NA22 (see Table 2).
Since development of the Triad approach, many authors have presented logical decision
frameworks for the interpretation of Triad results. Recently Bay and Weisberg (2008) presented
a framework for using BPJ to assess sediment sites in California (Figure 6). Their framework is
much more detailed than the simplified decision framework used in the DTR (Table 18-14) and
represents a considerable advancement over the simplified DTR approach. Although I do not
agree with all of the decision endpoints specified in Bay and Weisberg (2008), their framework
is much more logical for certain MLOE results. For example, the DTR characterizes a station

March 11, 2011
54
with “high” chemistry and no significant toxicity or benthic effects as Possible, while Bay and
Weisberg (2008) show that these results are inconclusive. Similarly, the DTR characterizes a
station with “moderate” chemistry, “moderate” toxicity, and no benthic effects as Possibly
Impacted, while Bay and Weisberg (2008) would characterize this station as Likely
Unimpacted. As discussed previously, the SQOs for enclosed bays and estuaries characterize a
station as likely unimpacted with “high” chemistry, “reference” benthic community conditions
and “low” sediment toxicity. Therefore, the DTR decision framework consistently biases the
interpretive framework in the direction of impacts by overemphasizing elevated chemistry even
though toxicity or benthic effects may be minimal or comparable to reference conditions.
Moreover, the DTR decision framework is clearly inconsistent with other published
frameworks, including the Part 1 SQOs for California enclosed bays and estuaries.

March 11, 2011
55
Figure 6. Bay and Weisberg (2008) framework for using BPJ to assess California
sediment sites. Arrows indicate sequence of classification.
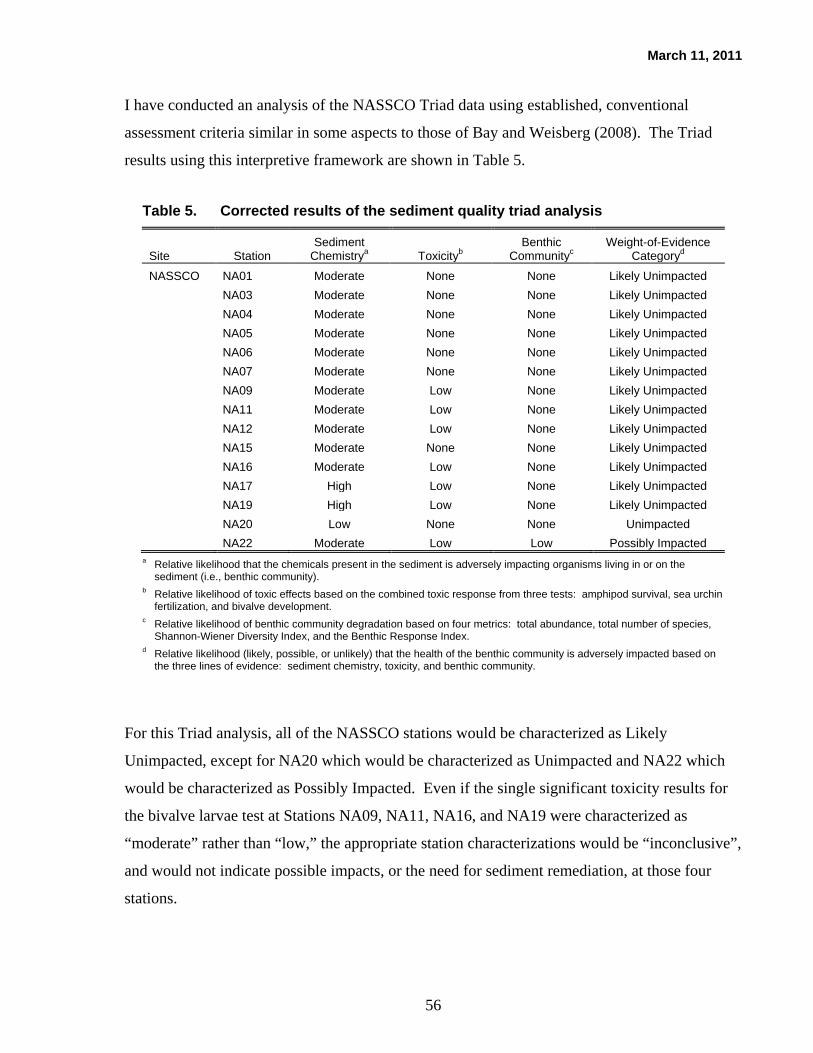
March 11, 2011
56
I have conducted an analysis of the NASSCO Triad data using established, conventional
assessment criteria similar in some aspects to those of Bay and Weisberg (2008). The Triad
results using this interpretive framework are shown in Table 5.
Table 5. Corrected results of the sediment quality triad analysis
Site Station Sediment
Chemistrya Toxicityb Benthic
Communityc Weight-of-Evidence
Categoryd
NASSCO NA01 Moderate None None Likely Unimpacted NA03 Moderate None None Likely Unimpacted NA04 Moderate None None Likely Unimpacted NA05 Moderate None None Likely Unimpacted NA06 Moderate None None Likely Unimpacted NA07 Moderate None None Likely Unimpacted NA09 Moderate Low None Likely Unimpacted NA11 Moderate Low None Likely Unimpacted NA12 Moderate Low None Likely Unimpacted NA15 Moderate None None Likely Unimpacted NA16 Moderate Low None Likely Unimpacted NA17 High Low None Likely Unimpacted NA19 High Low None Likely Unimpacted NA20 Low None None Unimpacted NA22 Moderate Low Low Possibly Impacted
a Relative likelihood that the chemicals present in the sediment is adversely impacting organisms living in or on the sediment (i.e., benthic community).
b Relative likelihood of toxic effects based on the combined toxic response from three tests: amphipod survival, sea urchin fertilization, and bivalve development.
c Relative likelihood of benthic community degradation based on four metrics: total abundance, total number of species, Shannon-Wiener Diversity Index, and the Benthic Response Index.
d Relative likelihood (likely, possible, or unlikely) that the health of the benthic community is adversely impacted based on the three lines of evidence: sediment chemistry, toxicity, and benthic community.
For this Triad analysis, all of the NASSCO stations would be characterized as Likely
Unimpacted, except for NA20 which would be characterized as Unimpacted and NA22 which
would be characterized as Possibly Impacted. Even if the single significant toxicity results for
the bivalve larvae test at Stations NA09, NA11, NA16, and NA19 were characterized as
“moderate” rather than “low,” the appropriate station characterizations would be “inconclusive”,
and would not indicate possible impacts, or the need for sediment remediation, at those four
stations.

March 11, 2011
57
In summary, the MLOE Triad assessment of data from the NASSCO shipyard site indicate the
presence of healthy benthic communities at all areas of the site except at station NA22 off the
mouth of Chollas Creek. The area encompassing station NA22 is directly influenced by
sediments discharged from the creek and is being assessed as part of the TMDL process.
Aquatic-Dependent Wildlife Assessment
The tentative CAO (RWQCB 2010) states that aquatic-dependent wildlife are presently
“adversely affected” and that beneficial uses of San Diego Bay by wildlife are “impaired” as a
result of sediment contamination associated with NASSCO leasehold activities (Findings 21 and
24, RWQCB 2010). This contention, which is a significant basis for DTR’s conclusion that
widespread dredging should be required, is based on an ecological risk assessment (ERA) that is
described as a “Tier II” or “baseline” ERA, compliant with both federal and state guidance. In
fact, the ERA does not comply with relevant guidance, and deviates in such a way as to
dramatically overstate potential risks.
The text of the CAO states (RWQCB 2010, p. 22-1):
A two-tiered approach was used to evaluate potential risks to aquatic-dependent wildlife from chemical pollutants present at the Shipyard Sediment Site. Tier I was a screening level risk assessment that uses conservative exposure and effects assumptions to support risk management decisions. Tier II was a comprehensive risk assessment (i.e., baseline risk assessment) that more accurately characterizes potential risk to receptors of concern primarily by replacing the conservative assumptions required by Tier I with site-specific exposure parameters.
The approach used in Tiers I and II was conducted in accordance with U.S. EPA’s “Ecological Risk Assessment Guidance for Superfund: Process for Designing and Conducting Ecological Risk Assessments (Interim Final)” (U.S. EPA, 1997) and with DTSC’s “Guidance for Ecological Risk Assessment at Hazardous Waste Sites and Permitted Facilities” (DTSC, 1996).
The sole line of evidence (LOE) in the Tier II ERA is a series of dietary exposure models that
predict exposure of representative wildlife species to sediment contaminants using measured
tissue concentrations in fish, shellfish, and eelgrass. Average chemical concentrations for these
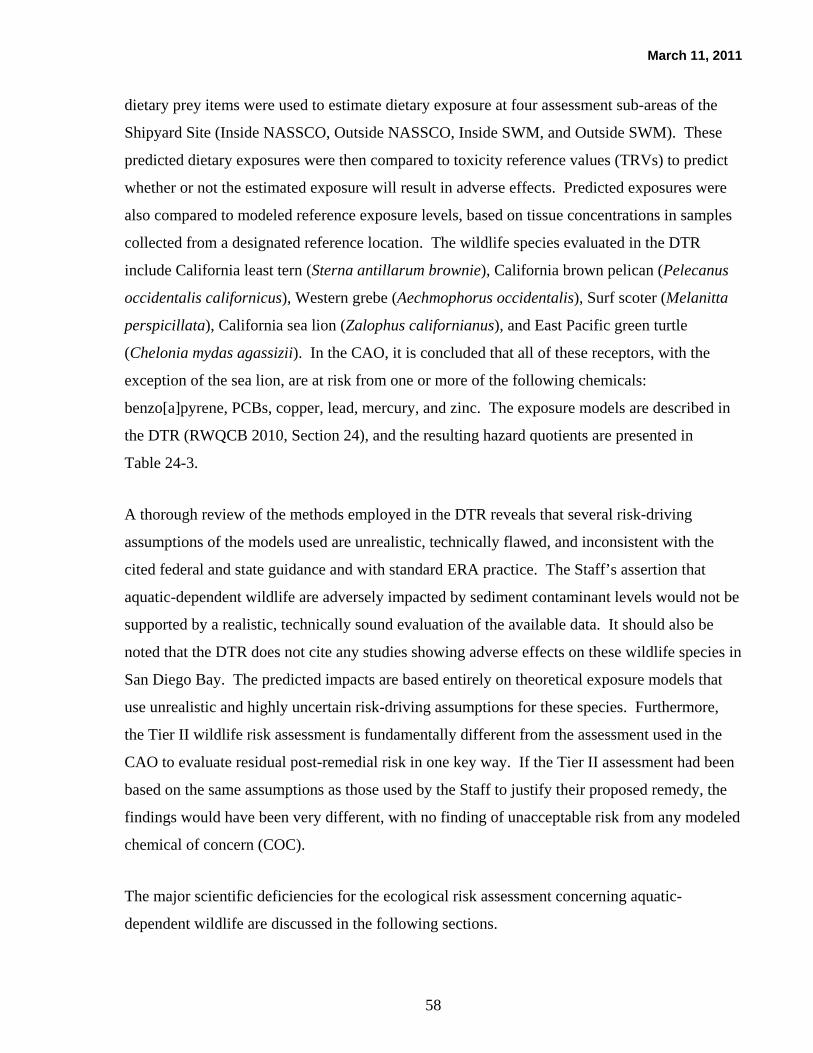
March 11, 2011
58
dietary prey items were used to estimate dietary exposure at four assessment sub-areas of the
Shipyard Site (Inside NASSCO, Outside NASSCO, Inside SWM, and Outside SWM). These
predicted dietary exposures were then compared to toxicity reference values (TRVs) to predict
whether or not the estimated exposure will result in adverse effects. Predicted exposures were
also compared to modeled reference exposure levels, based on tissue concentrations in samples
collected from a designated reference location. The wildlife species evaluated in the DTR
include California least tern (Sterna antillarum brownie), California brown pelican (Pelecanus
occidentalis californicus), Western grebe (Aechmophorus occidentalis), Surf scoter (Melanitta
perspicillata), California sea lion (Zalophus californianus), and East Pacific green turtle
(Chelonia mydas agassizii). In the CAO, it is concluded that all of these receptors, with the
exception of the sea lion, are at risk from one or more of the following chemicals:
benzo[a]pyrene, PCBs, copper, lead, mercury, and zinc. The exposure models are described in
the DTR (RWQCB 2010, Section 24), and the resulting hazard quotients are presented in
Table 24-3.
A thorough review of the methods employed in the DTR reveals that several risk-driving
assumptions of the models used are unrealistic, technically flawed, and inconsistent with the
cited federal and state guidance and with standard ERA practice. The Staff’s assertion that
aquatic-dependent wildlife are adversely impacted by sediment contaminant levels would not be
supported by a realistic, technically sound evaluation of the available data. It should also be
noted that the DTR does not cite any studies showing adverse effects on these wildlife species in
San Diego Bay. The predicted impacts are based entirely on theoretical exposure models that
use unrealistic and highly uncertain risk-driving assumptions for these species. Furthermore,
the Tier II wildlife risk assessment is fundamentally different from the assessment used in the
CAO to evaluate residual post-remedial risk in one key way. If the Tier II assessment had been
based on the same assumptions as those used by the Staff to justify their proposed remedy, the
findings would have been very different, with no finding of unacceptable risk from any modeled
chemical of concern (COC).
The major scientific deficiencies for the ecological risk assessment concerning aquatic-
dependent wildlife are discussed in the following sections.

March 11, 2011
59
Failure to Consider Actual Habitat Use
One of the primary risk-driving assumptions made by the Staff in their exposure assessment is
selection of an area use factor (AUF) of 1.0 for all receptors. In other words, for purposes of
risk evaluation, it is assumed by the Staff that all modeled receptors obtain 100 percent of their
diet from within the confines of the NASSCO leasehold, and that prey items sampled at
NASSCO stations are therefore representative of the entire diet for each receptor. This
assumption is clearly unrealistic, and the resulting conclusions based on this model are an
inaccurate representation of actual wildlife exposure and risk.
As described in the DSI (Exponent 2003), the NASSCO leasehold is far too small to serve as the
sole foraging habitat of any of the modeled receptor species. Based on an examination of the
habitat present throughout San Diego Bay and the best available scientific literature on the
foraging preferences and behavior of the modeled species, the tern, pelican, grebe, scoter, and
sea lion are all estimated to obtain at most 0.4 percent of their diet from the area of the
NASSCO leasehold. The green turtle is estimated to obtain no more than 1.1 percent of its diet
from the NASSCO leasehold (Exponent 2003). These estimates should actually be considered
as maximum area use estimates because it is assumed in their derivation that the shipyard would
be as attractive to these species as the rest of San Diego Bay. In fact, the heavy industrial
activities at the shipyard would most likely deter birds and other species from foraging at the
shipyard, thus reducing their actual area uses below these conservative (i.e., protective)
estimates.
The Staff acknowledges the uncertainties associated with wildlife area use in the DTR (Section
24.2.6). Yet they make no attempt to estimate realistic area use values for incorporation into
their exposure and risk estimates. Rather than estimating AUF based on scientific evidence, as
is standard practice in ERA, the Staff assumes a theoretical maximum exposure of 100 percent.
No justification for this extreme assumption is provided.
In effect, the Staff is asserting an arbitrary policy that site-specific habitat usage by wildlife is
irrelevant to exposure assessment, and by extension to the decision on sediment cleanup

March 11, 2011
60
requirements at NASSCO. This policy is neither typical of standard ERA practice at other sites,
nor is it justified in the CAO.
As demonstrated in the 2003 DSI, use of realistic AUFs in food web models for all
representative receptors results in a finding of insignificant risk from dietary exposure, because
the habitat quality within the NASSCO leasehold is low for all representative species (Table 6).
If habitat usage is low, then exposure to sediment contaminants and resultant risk are
correspondingly low. Were the Staff to incorporate realistic habitat usage values into their
assessment, they would conclude that there are not any impaired beneficial uses for aquatic-
dependent wildlife resulting from sediment contamination in the NASSCO leasehold. The
entire assertion of impairment by the Staff for this LOE is therefore driven by a single policy
decision that is not scientifically based and is contrary to regulatory guidance. This policy also
deviates from technical decisions approved by the Staff during the sediment investigation. The
use of an AUF derived for the shipyards was established in the 2001 sediment investigation
work plan (Exponent 2001a), in the work plan revisions issued at the request of Staff later that
year (Exponent 2001b), and again in the 2002 technical memorandum that described receptor
species and receptor parameters for the ERA (Exponent 2002), all of which were reviewed and
approved by the Staff. The Staff has not published any justification for eliminating
consideration of actual habitat use prior to the CAO. As discussed in the following section, this
unrealistic and scientifically unsupportable policy decision is also contrary to relevant ERA
guidance and standards of practice.

March 11, 2011
61
Table 6. Dependence of hazard quotient on habitat usage
Receptor
San Diego Bay Habitat
(acres) Maximum
NASSCO AUFa
Maximum Hazard Quotient for Receptor
DTR AUF = 1.0b
Maximum NASSCO
AUFc
East Pacific green turtle 3,734 0.011 6.8 0.07 California least tern 13,374 0.003 25 0.08 California brown pelican 11,219 0.004 20 0.07 Western grebe 11,219 0.004 25 0.09 Surf scoter 11,375 0.004 50 0.18 California sea lion 10,396 0.004 1.0 0.0039
Note: AUF - area use factor DTR - Detailed Technical Report (RWQCB 2010) a Assumes that entire forage range is limited to habitat in San Diego Bay. Area of aquatic
habitat within NASSCO leasehold is 43 acres. b Value from DTR. c All parameters from DTR, except AUF.
Regulatory Guidance and Standards for AUF Application
Federal Guidance on AUFs
The most comprehensive regulatory guidance for ecological risk assessment is the EPA
Ecological Risk Assessment Guidance for Superfund (ERAGS, U.S. EPA 1997). This multi-
volume manual, which is widely cited and followed in jurisdictions throughout the U.S.,
includes detailed guidance for every aspect of ERA, from preliminary site assessment and
screening to final risk characterization. As noted above, the CAO ERA is stated to be ERAGS-
compliant. ERAGS describes the use of dietary exposure modeling in detail, including
application of AUFs. A clear distinction is made between AUF application in Tier I screening
assessment and Tier II comprehensive risk assessment. ERAGS states:
For the screening level exposure estimate for terrestrial animals, assume that the home range of one or more animals is entirely within the contaminated area, and thus the animals are exposed 100 percent of the time. This is a conservative assumption and, as an assumption, is only applicable to the screening-level phase of the risk assessment. Species- and site-specific home range information would be needed later, in Step 6, to estimate more accurately the percentage of time an animal would use a contaminated area. Also evaluate the possibility that some species might actually focus their activities in contaminated areas of the site. For example, if contamination has reduced emergent vegetation in a pond, the pond

March 11, 2011
62
might be more heavily used for feeding by waterfowl than uncontaminated ponds with little open water. (U.S. EPA 1997, Section 2.2.1: Exposure Parameters).
This tiered approach to consideration of site-specific habitat use is a typical feature cited in
published how-to guides and reviews of standard ERA practice (e.g., Fairbrother 2003; Suter et
al. 2000).
Further details on the application of dietary exposure models and recommended input
assumptions are described in EPA’s Wildlife Exposure Factors Handbook (U.S. EPA 1993).
This widely cited resource also provides the following guidance on the consideration of a
receptor’s home range when conducting exposure assessments:
Home range size can be used to determine the proportion of time that an individual animal is
expected to contact contaminated environmental media. Home range is defined as the
geographic area encompassed by an animal’s activities (except migration) over a specified time.
The risk evaluation relied upon by the Staff in the CAO is clearly not compliant with ERAGS or
other applicable federal guidance with regard to area use consideration. The conclusions of the
Staff’s “Tier II comprehensive risk assessment” are based on highly conservative assumptions
that are appropriate only for Tier I screening assessment, and are not meant to definitively
characterize risk or support remedial decisions. According to federal guidance and standard risk
assessment practice, the DTR approach is unrealistic and inappropriate. Federal risk assessment
policy has long been built on an optimization of protectiveness and reasonableness. As noted in
a 1995 memorandum from EPA Administrator Carol Browner to Regional Administrators,
“While I believe that the American public expects us to err on the side of protection in the face
of scientific uncertainty, I do not want our assessments to be unrealistically conservative. We
cannot lead the fight for environmental protection into the next century unless we use common
sense in all we do” (U.S. EPA 1995).

March 11, 2011
63
California Guidance on AUFs
The California Department of Toxic Substances Control (DTSC) Human and Ecological Risk
Division has published its own ERA guidance (DTSC 1996). The focus of this guidance
document is primarily conceptual, with fewer specific recommendations on calculations or
procedure than the federal ERAGS. However, the equation specified by DTSC for dietary
exposure models is taken directly from the Wildlife Exposure Factors Handbook (U.S. EPA
1993), and is functionally identical to the equation described in ERAGS, including an area use
term, called fractional intake, defined as “[t]he fraction of time spent in contact with
contaminated media. This may generally be approximated as the ratio of the home range area to
the area of the site-specific appropriate habitat” (DTSC 1996, p. 24). DTSC has also issued
supplemental guidance on various ERA technical issues, published as EcoNOTEs. EcoNOTE 4
(DTSC 2000) addresses aspects of dietary exposure modeling. Nothing in this guidance
contradicts the standard practice of employing realistic area use estimates in Tier II ERA. On
the contrary, California ERA guidance recommends that consideration of site-specific area use
take place even at the Tier I level:
EPCs [environmental point concentrations – shorthand for an exposure estimate] are also modified by area-use factors, as appropriate. (DTSC 2000, page 9)
Across the country, agencies charged with protection of wildlife resources, including the
California Department of Fish and Game (DFG) also recommend consideration of habitat
characteristics and probable use in site evaluation, the very approach that was used in the DSI.
The DFG recommends and publishes methods used to characterize habitat suitability using
habitat suitability indices (HSI). HSI and similar habitat quality-related metrics have been
suggested as an appropriate basis for development of a site-specific AUF in the published ERA
literature (Hope 2004; Kaputska et al. 2001).
As with federal guidance, the Staff’s decision to base their dietary exposure estimates for
wildlife on theoretical maximum area use estimates that are unrealistic for all modeled species
contravenes California state guidance and the stated objectives of California regulatory agencies
to base wildlife protection policies on sound science.

March 11, 2011
64
Precedents for Use of Site-specific AUF
At large sites, AUF values of 1.0 in definitive risk assessment may be both realistic and
appropriate, if the site is demonstrably larger than the foraging ranges of the receptor species.
For receptor species with small home ranges, such an assumption may even be appropriate at
sites of modest size. However the use of site-specific AUFs less than 1.0 when receptor home
range is substantially greater than the area of a site is not only prescribed by regulatory
guidance, but is standard practice in ERAs performed at sites throughout the country. Some
recent examples from California include:
• In a 2006 environmental site assessment performed for the City of San Diego
at the Mission Bay Landfill, AUFs were defined in this way:
The AUF is the fraction of time the animal spends in the contaminated area
and was calculated as the size of the MB landfill site (148 acres not including
the urban or developed portion) divided by each species’ home range, with a
maximum value of 1 or 100 percent. (SCS 2006).
This AUF was used as a linear multiplier in the exposure estimates of
selected ecological receptors.
• In a 2005 site assessment for an industrial facility in Ventura County,
California, screening level exposure calculations that included an AUF of 1.0
were refined by developing site-specific AUFs as follows:
Relative exposure at each investigational unit within a Reporting Area will be
calculated with a species-specific adjusted area use factor based on the
percent of foraging habitat provided by each investigational unit divided by
the total foraging habitat provided by all investigational units within a
Reporting Area. (MWH 2005).

March 11, 2011
65
Again, these refined AUFs were applied as linear multipliers in the definitive
estimation of dietary exposure and risk at the site.
The Staff’s lack of adequate consideration of habitat usage is therefore a departure from
standard practice for ERA in California, as well as from available guidance.
Selection of TRVs
When available, the Staff used TRVs developed by the EPA Region 9 Biological Technical
Assistance Group (BTAG). In the case of chemicals for which BTAG has not derived TRVs
(benzo[a]pyrene for birds and chromium for both birds and mammals), the Staff used no-
observed-adverse-effect level (NOAEL) and lowest-observed-adverse-effect level (LOAEL)
values derived in the DSI (Exponent 2003). Avian TRVs were used to assess risk to green
turtle.
Low and high TRVs have been derived by BTAG for each chemical. California ERA guidance,
as set forth in DTSC EcoNOTE 2, describes the relevance of BTAG TRVs:
The numerically low TRV is meant to represent an intake which the developers of the TRVs believed presents a dose unlikely to produce adverse effects. The numerically high TRV is meant to represent an intake which the developers of the TRVs believed presents a dose which would produce adverse population effects (DTSC 1999).
The presumed relevance to toxicity of low and high BTAG TRVs are therefore similar to
NOAEL and LOAEL values, respectively. The actual threshold of toxicity for any chemical can
be expected to occur somewhere between the low and high BTAG TRVs, as it can between a
NOAEL and LOAEL.
Hazard Quotient Interpretation and Risk Characterization
Each modeled dietary exposure for each chemical-receptor combination was compared to the
relevant TRVs selected in the DTR to generate a hazard quotient, the standard quantitative

March 11, 2011
66
metric of ecological risk from dietary chemical exposure. The DTR contains a summary of all
hazard quotients that exceed 1.0 (Table 24-3), but no discussion of the ecological significance of
these hazard quotients. By definition, these two TRVs and their corresponding hazard quotients
have very different meanings with respect to levels of risk predicted, a fact that is acknowledged
in the DTR:
The significance of any HQ [hazard quotient] greater than 1.0 depends in large part on the relevance of the TRV. In this assessment, HQs were calculated for two risk thresholds. The TRVlow is a no-effect level (i.e., a level at which no effects are predicted). The TRVhigh is a demonstrated effect level. The actual threshold of adverse effects is predicted to lie somewhere between these two thresholds. (RWQCB 2010, p. 24-12)
In fact, the only hazard quotients greater than 1.0 were BTAG-low or NOAEL hazard quotients
(see DTR Table 24-3). No BTAG-high or LOAEL hazard quotient for any receptor in the DTR
assessment exceeded 1.0, a highly significant finding that the DTR fails to adequately discuss or
interpret. In and of itself, the exceedance of a NOAEL or BTAG-low hazard quotient cannot be
interpreted as evidence of unacceptable risk, because these exposure “thresholds” are actually
exposure levels at which no adverse effects are expected, and do not constitute evidence of an
impaired beneficial use. Only exceedance of a LOAEL or BTAG-high hazard quotient can be
interpreted as predictive of adverse effects, and that hypothetical finding must still be
interpreted for ecological significance before conclusions about impairment can be reached.
Exposure levels between the no-effect and expected effect thresholds fall into an undefined area
with regard to predicted risk, in which careful interpretation and professional judgment are
required to assess risk.
While not fully discussed in the context of the Tier II wildlife risk assessment, the need to
evaluate an exposure level above the NOAEL threshold for risk characterization is explicitly
acknowledged in the post-remedial residual risk characterization found in Section 32 of the
DTR:
An HQ value less than 1.0 indicates that the chemical is unlikely to cause adverse ecological effects to the receptor of concern. An HQ value greater than 1.0 indicates that the receptor’s exposure to the chemical pollutant has exceeded the TRV, which could indicate that there is a potential that some fraction of the population may experience an adverse effect. HQs for all receptors evaluated at

March 11, 2011
67
the shipyard site had a value less than 1.0 (Table 32-8), indicating that the COCs are unlikely to cause adverse ecological effects and that the post-remedial sediment chemistry conditions are protective of aquatic-dependent wildlife and their associated beneficial uses. (RWQCB 2010, p. 32-15)
Based on the Tier II risk assessment decision tree shown in Figure 24-1, any hazard quotient
(presumably low or high) greater than 1.0 results in a requirement for remedial action if the
modeled exposure is also higher than the reference exposure. The rationale behind such a
decision framework is not explained in the DTR, and is directly contradictory to the
interpretation of high and low TRVs provided in the discussion of alternative cleanup levels,
which clearly states that the protective threshold is some exposure level above the NOAEL.
The biased risk characterization approach of the Tier II ERA is neither justified nor explained in
the CAO, nor is it typical of ERA practice or regulatory guidance.
The exposure threshold used in the DTR to justify the alternative cleanup levels is the geometric
mean of the NOAEL/low and LOAEL/high TRVs:
The toxicity reference values (TRVs) presented in Table 32-7 are based on the geometric mean of the TRVs (BTAG, NOAELs, and LOAELs) presented in Tables 24-7 and 24-8 of Section 24. The geometric mean addresses the region of uncertainty between the NOAEL and LOAEL. At the NOAEL, no effects are observed. At the LOAEL, effects are observed. Between these two values there is often a significant range over which the effects are uncertain because the data do not exist. The uncertainty is handled by taking an intermediate value that is biased toward the NOAEL by using the geometric mean. (RWQCB 2010, p. 32-15).
While the geometric mean TRV is an arbitrary selection within the NOAEL-LOAEL range, it is
protectively biased, in the sense that it is lower than the midpoint of the range, and it has been
recommended as a reasonable preliminary remediation goal by leading ecological risk assessors
at U.S. EPA (Charters and Greenberg 2004, Greenberg and Charters 2005). Had the Staff used
a geometric mean TRV in the Tier II wildlife risk assessment, as they did in the post-remedial
protectiveness evaluation, their conclusions would have been quite different (Table 7). In fact,
the only evaluated chemical for which any hazard quotient for any receptor exceeded 1.0 would
have been lead. Based on this change alone, copper, mercury, HPAHs, PCBs, and TBT would
have been eliminated as risk drivers. This conclusion would have been reached notwithstanding
the highly conservative assumption of an AUF = 1.0.
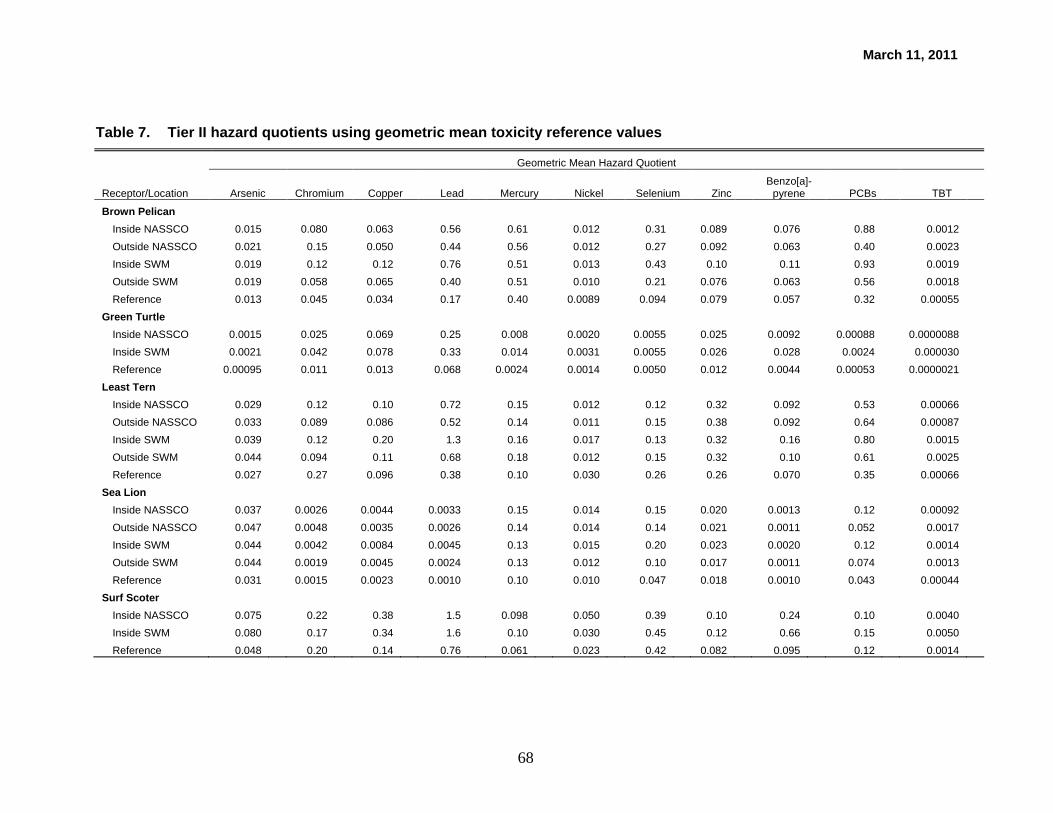
March 11, 2011
68
Table 7. Tier II hazard quotients using geometric mean toxicity reference values
Geometric Mean Hazard Quotient
Receptor/Location Arsenic Chromium Copper Lead Mercury Nickel Selenium Zinc Benzo[a]-
pyrene PCBs TBT
Brown Pelican Inside NASSCO 0.015
0.080
0.063
0.56
0.61
0.012
0.31
0.089
0.076
0.88
0.0012
Outside NASSCO 0.021
0.15
0.050
0.44
0.56
0.012
0.27
0.092
0.063
0.40
0.0023 Inside SWM 0.019
0.12
0.12
0.76
0.51
0.013
0.43
0.10
0.11
0.93
0.0019
Outside SWM 0.019
0.058
0.065
0.40
0.51
0.010
0.21
0.076
0.063
0.56
0.0018 Reference 0.013
0.045
0.034
0.17
0.40
0.0089
0.094
0.079
0.057
0.32
0.00055
Green Turtle Inside NASSCO 0.0015
0.025
0.069
0.25
0.008
0.0020
0.0055
0.025
0.0092
0.00088
0.0000088
Inside SWM 0.0021
0.042
0.078
0.33
0.014
0.0031
0.0055
0.026
0.028
0.0024
0.000030 Reference 0.00095
0.011
0.013
0.068
0.0024
0.0014
0.0050
0.012
0.0044
0.00053
0.0000021
Least Tern Inside NASSCO 0.029
0.12
0.10
0.72
0.15
0.012
0.12
0.32
0.092
0.53
0.00066
Outside NASSCO 0.033
0.089
0.086
0.52
0.14
0.011
0.15
0.38
0.092
0.64
0.00087 Inside SWM 0.039
0.12
0.20
1.3
0.16
0.017
0.13
0.32
0.16
0.80
0.0015
Outside SWM 0.044
0.094
0.11
0.68
0.18
0.012
0.15
0.32
0.10
0.61
0.0025 Reference 0.027
0.27
0.096
0.38
0.10
0.030
0.26
0.26
0.070
0.35
0.00066
Sea Lion Inside NASSCO 0.037
0.0026
0.0044
0.0033
0.15
0.014
0.15
0.020
0.0013
0.12
0.00092
Outside NASSCO 0.047
0.0048
0.0035
0.0026
0.14
0.014
0.14
0.021
0.0011
0.052
0.0017 Inside SWM 0.044
0.0042
0.0084
0.0045
0.13
0.015
0.20
0.023
0.0020
0.12
0.0014
Outside SWM 0.044
0.0019
0.0045
0.0024
0.13
0.012
0.10
0.017
0.0011
0.074
0.0013 Reference 0.031
0.0015
0.0023
0.0010
0.10
0.010
0.047
0.018
0.0010
0.043
0.00044
Surf Scoter Inside NASSCO 0.075
0.22
0.38
1.5
0.098
0.050
0.39
0.10
0.24
0.10
0.0040
Inside SWM 0.080
0.17
0.34
1.6
0.10
0.030
0.45
0.12
0.66
0.15
0.0050 Reference 0.048
0.20
0.14
0.76
0.061
0.023
0.42
0.082
0.095
0.12
0.0014

March 11, 2011
69
Geometric Mean Hazard Quotient
Receptor/Location Arsenic Chromium Copper Lead Mercury Nickel Selenium Zinc Benzo[a]-
pyrene PCBs TBT
Western Grebe Inside NASSCO 0.0036
0.11
0.0034
0.68
0.018
0.00020
0.014
0.015
0.054
0.017
0.0000054
Outside NASSCO 0.016
0.076
0.055
0.48
0.074
0.0069
0.070
0.17
0.047
0.27
0.00040 Inside SWM 0.019
0.11
0.14
1.1
0.093
0.011
0.065
0.16
0.12
0.37
0.00081
Outside SWM 0.020
0.076
0.065
0.56
0.088
0.0072
0.075
0.15
0.051
0.27
0.0011 Reference 0.013 0.14 0.050 0.26 0.047 0.014 0.11 0.12 0.032 0.15 0.00029
Note: The geometric mean TRV was calculated with the high and low TRVs used in the DTR. All exposure assumptions are consistent with the assumptions used in the DTR Tier II assessment.
NASSCO - National Steel and Shipbuilding Company PCB - polychlorinated biphenyl SWM - Southwest Marine TBT - tributyltin

March 11, 2011
70
Furthermore, the lead geometric mean hazard quotient would have exceeded 1.0 only for least
tern inside SWM, and for surf scoter inside NASSCO and inside SWM. Had this more
reasonable approach been employed in the Tier II risk level, the conclusions in the CAO about
potential beneficial use impairment would have been quite different, even if no other risk-driving
assumptions were modified. It should also be noted that lead was not selected as a primary COC
for the shipyard site and no alternative cleanup level for lead is proposed in the DTR.
Regulatory Guidance on Risk Characterization
The federal ERAGS describes the risk characterization process as follows:
Risk characterization integrates the results of the exposure profile and exposure-response analyses, and is the final phase of the risk assessment process. It consists of risk estimation and risk description, which together provide information to help judge the ecological significance of risk estimates in the absence of remedial activities. The risk description also identifies a threshold for effects on the assessment endpoint as a range between contamination levels identified as posing no ecological risk and the lowest contamination levels identified as likely to produce adverse ecological effects. To ensure that the risk characterization is transparent, clear, and reasonable, information regarding the strengths and limitations of the assessment must be identified and described (U.S. EPA 1997).
The approach taken in the DTR fails to fully comply with the regulatory standard for risk
estimation. Risk description, as described by federal ERA guidance, is completely missing from
the Staff’s approach. California guidance for risk characterization is similar: “[r]isk
characterization would include comparison of the estimated exposure via all pathways with the
selected toxicity criteria. In general, this would include an estimate of the range of uncertainty
and the probability of adverse effects at the calculated exposure level” (DTSC 1996). The DTR
Tier II ERA is completely lacking any consideration of probability of adverse effects.
Federal ERA guidance recommends consideration of highly conservative assumptions and
NOAEL effect thresholds only when considered in conjunction with more realistic exposure and
effect scenarios.

March 11, 2011
71
Key outputs of the risk characterization step are contaminant concentrations in each environmental medium that bound the threshold for estimated adverse ecological effects given the uncertainty inherent in the data and models used. The lower bound of the threshold would be based on consistent conservative assumptions and NOAEL toxicity values. The upper bound would be based on observed impacts or predictions that ecological impacts could occur. This upper bound would be developed using consistent assumptions, site-specific data, LOAEL toxicity values, or an impact evaluation (U.S. EPA 1997).
Similarly, California ERA guidance recommends consideration of a range of hazard quotients
with different TRV thresholds and exposure assumptions to properly characterize risk and make
risk management decisions (DTSC 1999). One consistent aspect of state and federal regulatory
guidance on ecological risk characterization is the need for critical examination of predicted risk,
including consideration of alternative exposure and adverse effect threshold assumptions:
“[w]ell-balanced risk characterizations present risk conclusions and information regarding the
strengths and limitations of the assessment for other risk assessors, EPA decision-makers, and
the public” U.S. EPA 1995). The DTR approach fails to comply with this basic requirement.
Risk from Lead
As noted above, the highest hazard quotients in the Tier II wildlife risk assessment, and the only
hazard quotients that would exceed 1.0 using a geometric mean TRV, are those based on the lead
NOAEL for birds (also used to assess risk to green turtle). Lead was the only evaluated chemical
for which a NOAEL TRV was exceeded by a factor greater than 10 in the flawed DTR
assessment. This finding is a result of the use by the RWQCB of an inappropriate and
ecologically irrelevant TRV.
The NOAEL TRV for lead used by the RWQCB (0.014 mg/kg-day) is based on a 10 percent
reduction in egg laying in Japanese quail, as reported by Edens et al. (1976). Extrapolation of
such an endpoint to wild bird species is highly questionable, given that quail have been
selectively bred to have unnaturally high egg production rates. The quail in which egg laying
was judged to be “impacted” in this study were laying 5.4 eggs per week, as opposed to 6 eggs
per week in controls. No wild bird species approaches this rate of continuous egg production,
March 11, 2011
72
and it is highly unlikely that any population level impacts would result from such an exposure
level, given the high egg production in the exposed birds. Furthermore, this TRV was estimated,
not directly calculated from the source study. The 10 percent egg production decrease was
associated with the lowest lead dose tested. The NOAEL TRV value was estimated from this
study by dividing the apparent LOAEL (0.14 mg/kg-day) by 10. In other words, the only lead
TRV exceeded in the DTR ERA was a hypothetical number estimated as one-tenth the value of a
reported LOAEL threshold of highly questionable ecological relevance. Paradoxically, the DTR
LOAEL TRV for lead exposure to birds (and green turtle) was not derived from the Edens et al.
1976) study at all, but taken from a completely different study (Edens and Garlich 1983). This
LOAEL source study reported egg production effects of lead exposure in quail and domestic
chickens. While the endpoint is no more ecologically relevant than that from the NOAEL source
study, the measured LOAEL threshold selected by the Staff (8.75 mg/kg-day) is higher than the
LOAEL used by the Staff to estimate their NOAEL value by a factor of 62 – a dramatic and
unexplained inconsistency. In my opinion, there is no scientific or logical justification for the
avian lead TRVs selected for use in the DTR. They are internally inconsistent and inconsistent
with best risk assessment practices, and they result in a misleading and invalid conclusion about
the potential risk to modeled receptors from lead.
The RWQCB TRV selection also cannot be justified by lack of more relevant data. A much
more relevant study of the effects of lead exposure on a wild bird species has been published.
Pattee (1984) conducted chronic (5- to 7-month) dietary lead exposure studies on American
kestrels, and reported no effects on body weight, food consumption, date of clutch initiation,
interval between eggs, clutch size, fertility, or eggshell thickness at doses up to 3.9 mg/kg-day.
This measured NOAEL, conducted on a species with a natural reproductive cycle, is a factor of
278 greater than the highly leveraged, theoretical NOAEL for a domestic, commercial egg
production species, upon which the DTR TRV is based. Were the NOAEL value reported by
Pattee (1984) used in the Tier II wildlife risk assessment, there would be no lead hazard
quotients approaching 1.0, even at the NOAEL level (Table 8). In my opinion, the high lead
hazard quotients calculated in the DTR are completely an artifact of their flawed TRV selection
and are scientifically unsupportable.

March 11, 2011
73
Table 8. NOAEL hazard quotients for lead using ecologically relevant toxicity reference value
Lead Receptor Location Revised NOAEL HQ Brown Pelican
Inside NASSCO 0.050
Outside NASSCO 0.039
Inside SWM 0.068
Outside SWM 0.036
Reference 0.015
Green Turtle
Inside NASSCO 0.023
Inside SWM 0.030
Reference 0.006
Least Tern
Inside NASSCO 0.065
Outside NASSCO 0.047
Inside SWM 0.118
Outside SWM 0.061
Reference 0.034
Sea Lion
Inside NASSCO 0.00019
Outside NASSCO 0.00015
Inside SWM 0.00025
Outside SWM 0.00014
Reference 0.00005
Surf Scoter
Inside NASSCO 0.136
Inside SWM 0.140
Reference 0.068
Western Grebe
Inside NASSCO 0.061
Outside NASSCO 0.043
Inside SWM 0.097
Outside SWM 0.050
Reference 0.024
Risk from Benzo[a]pyrene
Throughout the CAO, benzo[a]pyrene (BaP) is repeatedly included in the list of sediment
contaminants alleged to pose risk to aquatic-dependent wildlife: “[t]he chemicals in prey tissue
posing a risk include BaP, PCBs, copper, lead, mercury, and zinc” (RWQCB 2010, Finding 24).
In fact, BaP risk estimated using prey and plant tissue samples collected inside the NASSCO

March 11, 2011
74
leasehold did not exceed reference risk levels for any modeled receptor. According to the
decision framework described in the DTR, no cleanup for BaP should be required at NASSCO,
even given the unrealistic exposure assumptions and overly conservative hazard quotient
interpretation. Evaluation of the aquatic-dependent wildlife LOE, therefore, does not support
any determination that a cleanup is needed to reduce sediment BaP levels at NASSCO.
Summary of Risk Assessment for Aquatic-Dependent Wildlife
The Tier II ERA in the DTR is unrealistically biased by the reliance on Tier I (screening level)
assumptions about exposure (e.g., area use). The bias in the exposure estimates is compounded
by reliance on a comparison of exposure estimates to no-effect thresholds for purposes of
characterizing risk, and ultimately the need for remedial action. The inclusion of TRVs and
hazard quotients that are considered predictive of effect levels (e.g., BTAG-low and LOAEL
TRVs) in the assessment by the Staff is disingenuous, because the decision framework used for
risk characterization and determination of impairment apparently did not consider whether or not
these effect levels were exceeded, but was based solely on NOAEL exceedances. The entire
DTR risk characterization is based on a comparison of unrealistically high biased exposure
assumptions to no-effect toxicity levels. This is in stark contrast to the standard for risk
characterization described in ERAGS: “It is U.S. EPA policy that risk characterization should be
consistent with the values of transparency, clarity, consistency, and reasonableness” (U.S. EPA
1997). The Tier II ERA, as described in the DTR, is an inadequate and unscientific basis for a
decision on the need for remedial action in the NASSCO leasehold, because:
1. The ERA uses unrealistic and nonscientific estimates of wildlife use of the
shipyard as foraging habitat. The use of these values in the ERA results in
dramatic overestimates of risk to wildlife.
2. Incorporation of realistic, yet protective, estimates of exposure into the ERA
results in risk estimates far below adverse effect levels.
3. Even using the Staff’s unrealistic overestimates of exposure, the ERA, as
described in the DTR, shows that none of the adverse effect exposure levels

March 11, 2011
75
are exceeded for any of the wildlife receptors when appropriate thresholds of
effect (i.e., valid TRVs above the no-effect level) are substituted for the
inappropriate thresholds used in the DTR.
Therefore, even the Staff’s own unrealistic estimates of exposure, when properly interpreted into
an ERA, do not demonstrate the need for any site remediation to protect aquatic-dependent
wildlife. When the ERA is conducted according to standard scientific practice using
scientifically-supported exposure and effect estimates, the risk to such wildlife species falls far
below any thresholds for adverse effects. It is my opinion that a re-evaluation of the Tier II
wildlife risk assessment using scientifically defensible methods and assumptions clearly
demonstrates that there is no significant risk to the modeled receptors and no evidence of
beneficial use impairment. There is therefore no justification for any remedial action at the
NASSCO shipyard to protect aquatic-dependent wildlife beneficial uses.

March 11, 2011
76
Human Health Risk Assessment
Introduction
The human health risk assessment presented in the DTR uses a putative two-tiered approach,
which involves an initial “tier I screening-level assessment” followed by a “tier II comprehensive
risk assessment.” Although such approaches to risk assessment are appropriate for use at sites
like the NASSCO shipyard (U.S. EPA 1989), the two tiers used in the DTR are, in fact, both
screening-level assessments. As will be demonstrated in the subsequent sections of my report,
the alleged screening-level assessment is irrelevant and invalid for the purpose of making risk
management decisions or for screening of contaminants for further analysis. It is also irrelevant
to any decisions made concerning the structure, substances, or assumptions used in the Tier II
assessment. The Tier II assessment in the DTR is, by its very nature, another screening-level
assessment that should have been followed by a valid baseline (i.e., Tier II) risk assessment.
The remainder of this section of my report discusses specific aspects of the DTR risk assessment
that severely limit its usefulness or validity in making risk management decisions. I also present
my opinions concerning risks to human health at the NASSCO site.
Available Information
In this section of my report, I have relied on the data developed during the risk assessment
contained in the DSI (Exponent 2003) and well as other references cited herein. I have also
reviewed the expert report of Dr. Brent Finley prepared for this matter (Finley 2011).
The studies conducted by Exponent and presented in the DSI (Exponent 2003) provide sufficient
site-specific data to conduct a baseline risk assessment for the NASSCO site. Specifically, the
study collected data on tissue concentrations of a variety of substances in fish (spotted sand bass)
and shellfish (spiny lobster) that could potentially be taken by anglers if they had access to the

March 11, 2011
77
site. These data included concentrations of substances in muscle tissue that is commonly
consumed by anglers as well as whole body chemical analyses that could be used to evaluate the
potential risks associated with a very limited group of anglers who may cook and consume the
entire bodies of harvested fish or shellfish.
Flaws of the DTR Tier I Screening Level Assessment
The Tier I risk assessment presented in the DTR claims to use conservative inputs throughout the
assessment process. The use of conservative inputs is appropriate for a screening-level
assessment. Using such conservative assumptions, the screening process will enable the risk
assessor to focus on those substances, pathways, and exposure scenarios that have a potential for
causing significant human health risks and should be addressed further in the Tier II assessment.
U.S. EPA (1989) guidance on the use of screening level assessments states:
The risk factors developed in this screening procedure are to be used only for potential reduction of the number of chemicals carried through the risk assessment and have no meaning outside of the context of the screening procedure.
Therefore, a screening level assessment is used to guide the baseline risk assessment by focusing
the overall assessment, but it is not intended to be used as an indication of risk per se.
Several of the assumptions used in the Tier I risk assessment are appropriate for a screening-
level assessment (e.g., fractional intake [FI] = 1.0, 30-year exposure, maximum cancer slope
factor, maximum tissue concentration).
However, the use of Macoma nasuta (bent-nosed clam) tissue from laboratory exposures for
screening purposes is not appropriate for a screening level risk assessment. M. nasuta studies
were conducted as part of the DSI strictly for the purposes of evaluating the potential
bioavailability of various sediment contaminants and to determine whether sampling of
indigenous biota was warranted (Exponent 2003). For these tests, non-native clams were
exposed to sediment samples under laboratory conditions. These laboratory exposures and

March 11, 2011
78
subsequent tissue analyses were not intended, nor would they be appropriate, for use as
surrogates for estimating human exposure to chemicals in shellfish or fish in San Diego Bay.
Notwithstanding the uncertainty associated with extrapolating the results of laboratory studies to
indigenous organisms, an appropriate surrogate species should show certain ecological and
physiological similarities to a species that would naturally occur at the site and be harvested by
humans. M. nasuta does not fit these criteria for an appropriate surrogate. This species is
relatively rare at the shipyard site and was never intended to be a surrogate for fish and shellfish
that could theoretically be taken by anglers at the NASSCO site. Although these small clams
may be abundant in some muddy embayments, I am unaware of any recreational harvesting of
M. nasuta in California or elsewhere (Weymouth 1921; Klinger et al. 2006; Griffiths et al. 2006).
I am also unaware of any significant harvest of clams in San Diego Bay, especially anywhere
near the shipyard site.
The DTR concludes that the use of M. nasuta may result in an overestimation of risk because of
its direct exposure to bottom sediments. Notwithstanding this conclusion, the DTR screening
level assessment identified only two substances at NASSCO shipyard stations as posing a
significant risk for either recreational or subsistence anglers: PCBs and benzo[a]pyrene (BAP).
As stated in the DTR, one of the objectives of a screening-level risk assessment is “to identify if
a comprehensive, site-specific risk assessment was warranted (i.e., Tier II baseline risk
assessment)”. Therefore, if the Staff had correctly interpreted the screening level assessment as
intended, they would have conducted a baseline assessment of only these two substances in the
Tier II assessment for NASSCO. However, the Staff apparently ignored the results of the Tier I
risk assessment and conducted a full Tier II assessment for all substances and areas of the
shipyards. As is demonstrated in the next section, the so-called Tier II assessment was in
actuality just another screening-level assessment.
EPA guidance concerning the conduct of screening-level assessments is clear (U.S. EPA 1989).
As stated in that document:

March 11, 2011
79
…it is important to remember that if a screening level approach suggests a potential health concern, the estimates of exposure should be modified to reflect more probable exposure conditions.
Although the DTR states that the baseline risk assessment was conducted in accordance with this
specific EPA guidance document, it is clear that the Staff ignored EPA’s strong recommendation
in this regard. Contrary to this guidance, the Staff conducted another screening-level assessment
using only high-end and unrealistic exposure assumptions, and presented these results as a Tier II
assessment.
Flaws in the DTR Tier II Risk Assessment
The DTR Tier II risk assessment purports to be a more realistic assessment than that performed
under Tier I:
The Tier II comprehensive risk assessment (i.e., baseline risk assessment) more accurately characterized potential risk to receptors of concern primarily by replacing the conservative assumptions required by Tier I with site-specific exposure parameters. (DTR, Vol 2, p. 26-1).
Furthermore, the DTR states that this “baseline risk assessment” was performed in accordance
with applicable federal and state guidance.
In fact, the Tier II assessment relies upon unrealistic exposure assumptions that are appropriate
only for screening level assessments, which result in overly conservative and unreliable
predictions of risk. The DTR also fails to adequately interpret the results of the Tier II
assessment, and presents an incomplete, flawed summary of risks to humans in Findings 25, 26,
and 28. A scientifically valid interpretation of the Tier II assessment demonstrates that there is
no significant risk to humans from Shipyard Site sediment contamination, and that human
beneficial uses are not impaired.

March 11, 2011
80
U.S. EPA (2005) guidance on conducting risk assessments for carcinogens is clear in specifying
that worst-case assumptions may be appropriate for a screening-level risk assessment, but should
not be used in the definitive (or Tier II) assessment. For example, U.S. EPA (2005) states that:
Screening-level assessments may more readily use default parameters, even worst-case assumptions, that would not be appropriate in a full-scale assessment.
It is recognized by EPA that risk assessments should include high-end estimates of risk, but that
such estimates should be discussed and characterized along with central estimates of risks.
Moreover, high-end estimates of risk should be based on upper bounds expressed as confidence
intervals, rather than on maximum concentrations. Such estimates should also represent
plausible upper bound exposures and not be the result of compounding effects of a series of
unrealistic maximum possible assumptions. U.S. EPA (2005) addresses this situation and
advises:
This means that when constructing estimates from a series of factors (e.g., emissions, exposure, and unit risk estimates) not all factors should be set to values that maximize exposure, dose, or effect, since this will almost always lead to an estimate that is above the 99th-percentile confidence level and may be of limited use to decisionmakers.
While it is an appropriate aim to assure protection of health and the environment in the face of scientific uncertainty, common sense, reasonable applications of assumptions and policy, and transparency are essential to avoid unrealistically high estimates.
Under a putative objective of being “conservative,” the DTR has ignored this kind of guidance,
and has presented a risk assessment that is based on a series of high-end, implausible exposure
assumptions that do not involve common sense or reasonableness as described above. The
resultant risk assessment does not provide scientifically valid estimates of risk associated with
the NASSCO site, and is of no value in making risk management decisions for the site.
March 11, 2011
81
Unrealistic Exposure Assumptions in the Risk Assessment
As indicated previously, the overly-conservative assumptions used in the Tier II baseline risk
assessment result in a meaningless and implausible assessment that is constructed under the
guise of being “conservative.” These overly-conservative and unsubstantiated assumptions have
a dramatic effect on the resultant risk calculations. In effect, the DTR is combining a series of
extreme assumptions, which result in a multiplicative effect on the final risk calculations:
1. All of the fish or shellfish tissue consumed each day comes from the shipyard
site (i.e., FI = 1.0)
2. Four percent of the arsenic in seafood is in the inorganic form
3. Risks for subsistence anglers are unrealistic
a. The only species consumed are spotted sand bass and spiny lobster.
b. The theoretical subsistence angler consumes only the whole-bodies of the
fish and invertebrate species
4. Anglers have complete access to the highly-restricted shipyard site.
By using these assumptions, the Staff has constructed a highly-conservative, screening-level
assessment of risk that bears no resemblance to a Tier II baseline risk assessment, which would
incorporate some more realistic, but nonetheless conservative, assumptions. The following
sections of my report discuss each of these unrealistically conservative assumptions and how
they bias the results of the DTR risk assessment.
Fractional Intake (FI) is 1.0
The most unrealistic assumption used in the DTR Tier II assessment is the FI. FI represents the
portion of the seafood diet that an angler would receive directly from the assessment area. In the
DTR, FI is set to 100 percent, the same value used in the Tier I screening-level assessment. In
other words, the baseline risk assessment (and determination of need for remediation) is entirely

March 11, 2011
82
based on the assumption that both recreational and subsistence anglers catch all of the fish or
lobster that they consume within the boundaries of the Shipyard Site. This assumption is clearly
unrealistic and does not reflect actual or potential usage of the Site by recreational or subsistence
anglers. Not only would the size and habitat quality of the Site fail to support the fish or lobster
population required by such an extreme assumption, but security restrictions effectively preclude
anglers from fishing within the Shipyard at all (see review by Finley 2011). Table 9 shows the
maximum FI that would result in a cancer risk of 10−5 or 10−4 if all other DTR exposure
assumptions were kept constant. A rational risk evaluation would conclude that the protective FI
values for recreational fishermen are consistent with any possible site use by anglers, including
future changes in site usage.

March 11, 2011
83
Table 9. Fractional intakes protective of human cancer risk
Reference Station
Inside NASSCO
Outside NASSCO
Scenario DTR Dose
(mg/kg/day)
Protective FI Resulting in 10−5 Cancer
Risk (%)
Protective FI Resulting in 10−4 Cancer
Risk (%)
DTR Dose (mg/kg/day)
Protective FI Resulting in 10−5 Cancer
Risk (%)
Protective FI Resulting in 10−4 Cancer
Risk (%)
DTR Dose (mg/kg/day)
Protective FI Resulting in 10−5 Cancer
Risk (%)
Protective FI Resulting in 10−4 Cancer
Risk
PCBs
Recreational fish 7.07E-06 70.9 100.0
5.91E-06 84.7 100.0
7.33E-06 68.0 100.0
Subsistence fish 5.52E-04 0.9 9.1
2.07E-03 0.2 2.4
5.91E-04 0.8 8.5
Recreational lobster 2.57E-06 100.0 100.0
2.57E-06 100.0 100.0
n/a n/a n/a
Whole lobster 4.04E-05 12.4 100.0
7.49E-05 6.7 66.7
n/a n/a n/a
Arsenic
Recreational fish 2.06E-06 100.0 100.0
2.06E-06 100.0 100.0
2.57E-06 100.0 100.0
Subsistence fish 1.97E-05 33.8 100.0
2.37E-05 28.2 100.0
3.55E-05 18.8 100.0
Recreational lobster 2.26E-05 29.5 100.0
6.69E-05 10.0 100.0
n/a n/a n/a
Whole lobster 2.96E-04 2.3 22.5 1.85E-04 3.6 36.0 n/a n/a n/a
Notes:
Dose values taken from DTR Appendix 28

March 11, 2011
84
For example, at a 10−4 risk level, all recreational scenarios for PCB and arsenic exposure would
be acceptable with an FI = 1.0 (i.e., 100 percent of fish from the site). At this risk level, even
the most extreme subsistence angler scenarios would correspond to FIs of 2.4 percent and
8.5 percent (PCBs in whole fish) for inside and outside NASSCO, respectively. Even at a 10−5
risk level, the exposure assumptions in the DTR would be protective at FIs of 68 to 100 percent
for PCBs in recreationally harvested fish and lobster. Table 9 also demonstrates that, using the
DTRs scenarios, the reference areas do not have substantially different protective FIs when
compared with the NASSCO site. As will be shown in a subsequent section of my report, this
result is not unexpected given the nonsignificant differences between reference and NASSCO
concentrations of PCBs and arsenic in muscle tissue for fish and lobster. Moreover, the DTR
assessment shows that subsistence anglers would have relatively low protective FIs for the
reference conditions. This is an important finding that indicates the unrealistic assumptions of
the DTR assessment, especially when the reference conditions are assumed to represent large
areas of San Diego Bay away from point sources of contaminants. It is much more reasonable
to assume that an angler could obtain a large part of the fish or shellfish diet from reference
areas of San Diego Bay than to obtain a significant part of the diet from a relatively small
industrial area such as NASSCO shipyard.
The previous demonstrations indicate that there is no rational scientific basis for the DTR
conclusion that:
Human health beneficial uses designated for San Diego Bay are impaired due to the elevated levels of pollutants present in the marine sediment at the Shipyard Sediment Site (DTR, Volume2, page 25-1)
Rather, the data presented in the Tier II risk assessment show that no unacceptable cancer risks
to recreational fishermen exist, from PCBs or arsenic in fish or lobster, given the potential use
of the Site for fishing purposes. Furthermore, subsistence fishermen are unlikely to use the Site
for fishing purposes to any significant degree, and cancer risks from PCBs and arsenic are
comparable to those at the reference site. The DTR human health risk assessment does not
indicate human beneficial use impairment, nor does it indicate any need for remediation to
protect human health.
March 11, 2011
85
Assumption on the Amount of Inorganic Arsenic Present in Seafood
It is generally accepted that most arsenic present in seafood is in the form of organic arsenical
compounds which are readily excreted by humans and are not carcinogenic. Any carcinogenic
toxicity of arsenic in seafood is caused by inorganic arsenic. Therefore, if only total arsenic
measurements are available, as is the case for the shipyard studies, it is important to develop a
reliable assumption of the amount of the total arsenic that is in the inorganic form.
The DTR concludes that there are significant risks of arsenic exposure associated with
recreational harvest of edible lobster tissue inside the NASSCO leasehold and recreational
harvest of sand bass fillets outside the NASSCO leasehold (DTR Table 28-1). In reaching these
conclusions, the DTR used the assumption that 4 percent of the arsenic present in fish and
lobster tissue would be in the inorganic form. The same assumption was used in the risk
assessment conducted by Exponent (2003). This proportion of inorganic arsenic is based on the
review of Donahue and Abernathy (1999) who reported that 99 samples of fish and shellfish
rarely exceeded this value. The DTR acknowledges that this assumption is conservative
because some studies of arsenic in marine organisms have reported much smaller percentages of
inorganic arsenic. The DTR further states that the use of this assumption may result in an
overestimation of risk from arsenic exposure.
Because of the uncertainties associated with the speciation of arsenic in seafood organisms and
the implications of making a blanket, conservative assumption of 4 percent inorganic arsenic, it
is important to carefully evaluate the degree of conservatism in this assumption and the
reliability of risk conclusions concerning arsenic in relation to any cleanup of the NASSCO site.
The importance of arsenic speciation has been known since the 1990s (e.g., Edmonds and
Francesconi 1993; Donohue and Abernathy 1999), but generally available methods for arsenic
speciation have been developed only in the last 10 years. At the time of the DSI, methods for
arsenic speciation were not well developed in commercial laboratories and such analyses were
not conducted for fish and lobsters collected at the shipyards, thus necessitating the need for a
conservative assumption for the percentage of inorganic arsenic in the total arsenic

March 11, 2011
86
measurement. Since that time, other studies have been published that demonstrate the relatively
low levels of inorganic arsenic in marine seafood organisms.
Several authors have concluded that arsenic in seafood does not contribute significantly to
carcinogenicity of ingestion of such organisms. These studies have continued to document that
almost all of the arsenic in fishes and crustacea is in the form of arsenobetaine and related
organic compounds. Arsenobetaine is relatively inert, nontoxic, and is excreted by humans
without internal metabolism or transformation (Borak and Hosgood 2007). Moreover, despite
the heavy consumption of seafood organisms in many cultures throughout the world, there have
been no documented poisoning episodes that are attributed to arsenic exposure (Edmonds and
Francesconi 1993).
One of the most relevant studies of arsenic species in marine fishes was conducted by Kirby and
Maher (2002). In this study, chemical species of arsenic were measured in different tissues of
detritivorous, herbivorous, and carnivorous fish. For the carnivorous fish species (i.e., most
marine sport fishes), there was no detectible inorganic arsenic in muscle tissue. For all tissues
of carnivorous fish, the only detectable inorganic arsenic was at 1 percent of total arsenic in the
stomach. Thus, even when eating the entire fish, including the stomach, exposure to inorganic
arsenic would be negligible. If the fish is gutted and then eaten whole, the inorganic arsenic
content would be negligible. Detritivorous and herbivorous fishes contained no detectable
inorganic arsenic in the muscle tissue, but had measureable amounts of inorganic arsenic in the
stomach, intestines, and other internal organs. These results are consistent with the theory that
arsenic exposure in marine organisms is through the diet, especially related to marine algae, so
that carnivorous species have very little exposure to inorganic arsenic because of the
predominance of arsenobetaine in prey species.
Other fish studies have also shown very low levels of inorganic arsenic in fishes. For example
Schoof et al. (1999) reported that saltwater fishes purchased in supermarkets had inorganic
arsenic concentrations less than 0.001 µg/g wet weight when total arsenic concentrations ranged
up to 6.1 µg/g wet weight. A more recent study of inorganic arsenic in a variety of marine fish
species found that inorganic arsenic was undetected (at <0.0006 µg/g wet weight) in all species
except for tuna (Sloth et al. 2005). For these species, total arsenic reached a maximum

March 11, 2011
87
concentration of 44 µg/g wet weight. It is recognized that demersal crustaceans such as crabs
and lobsters may have higher levels of inorganic arsenic in tissue because of potentially
ingesting these forms of arsenic in the diet (e.g., algae, small invertebrates and associated
sediments). In a study of lobster, prawns, and crab, Edmonds and Francesconi (1993) reported
that the percentage of inorganic arsenic in muscle tissue ranged from 0.6 to 1.7. In the Sloth et
al. (2005) survey, the highest inorganic arsenic concentrations in lobster were measured in meat
from the head and thorax (0.037 µg/g wet weight), but this represented only 0.2 percent of the
total arsenic in that tissue (22 µg/g wet weight).
The above studies show that the use of the assumption of 4 percent inorganic arsenic in fish
fillets and edible lobster is most likely overly conservative, and the actual percentage of
inorganic arsenic may be substantially less than this value. Moreover, as was demonstrated in a
previous section of my report, there is no significant difference between the arsenic
concentrations measured in edible lobster at NASSCO and the reference area, or between sand
bass fillets from outside the NASSCO leasehold and the reference area. For the Staff to
conclude in the DTR (Table 28-1) that arsenic risks are higher for recreational anglers
consuming sand bass fillets from outside the NASSCO leasehold, compared to reference, is
especially disingenuous given that the mean arsenic concentrations for those two areas are 0.42
and 0.36 mg/kg, respectively.
In summary, the DTR’s conclusion that inorganic arsenic in seafood theoretically harvested at
the NASSCO site “poses a theoretical increased” cancer risk when compared to reference areas
is not valid, and does not form the basis for concluding that beneficial uses are impaired or that
any active remediation of sediments would be required to reduce arsenic exposure.
Risks for Subsistence Anglers
The DTR includes risk calculations for so-called “subsistence anglers;” however, the definition
of these kinds of anglers is neither specified nor otherwise justified in the DTR. In Table 28-7
of the DTR, the exposure assumptions are provided and indicate that the only difference
between recreational anglers and subsistence anglers is that the latter group has a consumption

March 11, 2011
88
rate of 161 g/day versus 21 g/day. The other significant difference between recreational and
subsistence anglers, as assessed in the DTR, is that subsistence anglers are always assumed to
eat the entire organism, either sand bass or lobster. The DTR provides no justification for this
important assumption.
First, there is no basis for assuming that all anglers of this theoretical category would consume
only whole-body organisms for the entire 30-year period. I would agree that certain ethnic
groups (primarily Asians) may use whole bodies of harvested fish or invertebrates in soups or
stews. The staff should have assumed that a certain proportion of harvested seafood was
prepared in this manner. For the proportion of the diet that was assumed to be consumed as a
whole body, the DTR should have apportioned the species according to expected catch rates.
For example, the DSI included the sampling of smaller species of fish for use in the aquatic-
dependent wildlife risk assessment. These species (e.g., topsmelt, Atherinops affinis) contained
significantly lower concentrations of PCBs in whole bodies when compared with spotted sand
bass. The maximum PCB concentrations in whole-body topsmelt inside the NASSCO area
were less than 20 percent of the corresponding maximum concentrations of PCBs in spotted
sand bass. Moreover, the maximum PCB concentration in topsmelt collected inside NASSCO
was only about 40 percent higher than the reference concentration. This is an important
consideration because:
1. Topsmelt and the closely related jacksmelt (Atherinops californiensis) are
among the most abundant fishes available to shore and pier anglers in
southern California and they make up a large proportion of the sport catch in
such areas (CA DFG 2001)
2. Because of their abundance and ease of catch, topsmelt and jacksmelt would
be much more available to shore or near-shore anglers than the larger sand
bass. If “subsistence” anglers actually could operate at the shipyard site,
these Atherinops species would most likely constitute a significant part of the
catch.
Therefore, by using only spotted sand bass data, the DTR has substantially overestimated the
concentrations of PCBs that may occur in fish species harvested in San Diego Bay.

March 11, 2011
89
Another significant error in the DTR assessment results from the assumption that all subsistence
anglers consume the entire body of harvested fish. Whole body analyses were conducted in the
DSI for use in the wildlife risk assessment because predators such as sea lions and birds
consume the entire fish. The consumption of entire fish by humans, including guts, kidneys,
and livers, is relatively rare. Even if whole fish are added to soups or stews, the fish is typically
gutted, thereby removing the liver and other soft internal organs. For example, in the Santa
Monica Bay seafood consumption study (SCCWRP and MBC 1994), which was the basis for
the DTR consumption rates, only 1 percent of surveyed anglers consumed whole fish that were
not gutted. Even among Hispanic and Asian anglers, only about 1 percent consumed whole fish
that were not gutted. Alternatively, about 33 percent of anglers consumed whole fish that had
been gutted. This is an important distinction because it is well-established that the liver and
other fatty internal organs in fishes contain much higher concentrations of hydrophilic
substances such as PCBs than muscle tissue (OEHHA 2010). Finley (2011) also criticizes the
use of whole-body tissue concentrations for all subsistence anglers and indicates that the DTR
could have assumed a fixed percentage of anglers that consume the entire fish.
Finally, there is simply no basis for the DTR assumption that subsistence anglers could harvest
sufficient lobsters from the shipyard site to maintain a 30-year daily consumption rate of
161 g/day and that all of these lobsters would be eaten whole (i.e., shell, internal organs, and
meat). I have discussed previously the problems associated with DTR exposure assessment for
so-called “subsistence anglers.” In the case of lobsters for which the DTR claims significant
risks from arsenic for recreational anglers but not for subsistence anglers) the exposure
assumptions are overestimated because of the Staff’s failure to consider the degree to which
lobsters could actually be harvested in San Diego Bay. As noted previously, the DTR assumes
that recreational and subsistence anglers would consume 21 and 161 g/day, respectively, of
lobster tissue every year for a lifetime. However, it is important to note that the lobster fishery
in California is highly regulated as to size, numbers, and seasons during which lobsters can be
harvested. The current regulations (CA DFG 2010) specify that lobsters can be harvested only
from October 2, 2010 to March 16, 2011. The same season length occurred in 2009/2010.
Thus, lobsters can be harvested for less than half of the year in California, further invalidating
the overly-conservative exposure assumptions used in the DTR.
March 11, 2011
90
Moreover, fishing for lobsters in California requires a sport fishing license, an ocean
enhancement stamp, and a spiny lobster report card. Each of these must be purchased from
California Department of Fish and Game. Alternatively, an angler fishing for typical marine
fishes from a public pier in California is not required to have a license of any kind. Therefore a
so-called “subsistence” angler would be much more likely to choose fishing from a public pier
rather than investing in the licenses and equipment necessary for continual lobster fishing,
especially given that the season is closed more than half of the year. In the Santa Monica Bay
seafood consumption study, shellfish of all kinds constituted only a small proportion
(5.7 percent) of the total seafood catch (OEHHA 1997).
In summary, the risk scenarios presented in the DTR for subsistence anglers are so unrealistic
and overly conservative that they provide no meaningful information relative to the maintenance
of beneficial uses or the need for sediment remediation at the NASSCO site.
Angler Access to the Shipyard Site
The DTR acknowledges that current access to the shipyard site is highly restricted both on the
upland parts of the site and as a result of a security boom in the Bay that prevents unauthorized
vessels from approaching within 300 ft of the leaseholds. This information was also
acknowledged in the original risk assessment as part of the DSI (Exponent 2003) and was
described in detail in the expert report of Dr. Finley (Finley 2011). Notwithstanding the
common understanding that angler access is nonexistent at the shipyards, the Staff has
proceeded with a baseline risk assessment (by their definition) because of the following alleged
reasons:
1. Shipyard or Navy personnel may fish off of piers, bulkheads, or ships
2. Future site usage may enable access by anglers
3. Sediment pollutants may migrate to areas where angler access is possible
4. The Board has a responsibility to protect current and reasonably anticipated
beneficial uses regardless of current site access.

March 11, 2011
91
Because the DTR acknowledges that any existing public angler access would be nonexistent and
the document provides no substantiation of the highly speculative allegation in Number 1 above,
I will not evaluate the information concerning current conditions. Item Number 3 above is also
unsubstantiated and irrelevant to the DTR risk assessment. Even if it could be shown that site-
related substances have migrated to other areas of San Diego Bay, the resultant risk assessment
should be based on conditions at that area, and not on the conditions at the shipyards.
Therefore, the remaining issue is whether the site ownership and usage may change in the future
and, if the site usage should change, what would be a reasonable exposure scenario for the site.
Dr. Finley has addressed the potential for a change in the site usage and I will not discuss that
issue further. However, even in the highly unlikely event that the current shipyard site may at
some time be developed for recreational use, it is important to consider what exposure
parameters would be appropriate to assess angler risk.
The DTR risk assessment has used two highly conservative (and theoretical) assumptions on
angler exposure that, when used together, result in an inflated estimate of site risk that would be
inappropriate and unreliable even if anglers had access to the site. These two assumptions are:
1. Anglers obtain all of their harvested seafood from the site
2. The consumption rates are equivalent to the estimates developed for Santa
Monica Bay.
The DSI baseline human health risk assessment included RME exposure scenarios for
recreational and subsistence anglers. In the DSI, Exponent (2003) calculated FI values by
comparing shoreline length at the site vs. San Diego Bay (for inside the leaseholds) and site area
vs. area of San Diego Bay (for outside the leaseholds). These calculations assume that the
shipyard sites would be as attractive to anglers as any other area of San Diego Bay. Although
the DTR uses only a value of FI = 1.0 for the risk assessment, the authors conclude that “…the
actual site fractional intake is likely to be less than 100 percent”. I agree with this conclusion in
the DTR and further believe that any fractional intake that may be theoretically possible from
the shipyard site would be far less than 100 percent.
March 11, 2011
92
Based on an assumption that the Shipyard site is neither more nor less attractive to anglers than
other locations in San Diego Bay, the maximum FI developed for NASSCO was 0.5 percent
(see Table 11-6 from DSI). This value was derived quantitatively as the ratio of open water area
at NASSCO relative to the entire bay. Even this value must be considered a highly conservative
assumption, given that an operating shipyard is neither a highly attractive location to fish nor
good habitat in which to find fish, and the calculation assumes that there are no access
restrictions at the shipyard, when in fact access is highly restricted.
When considering the potential for angler use of a particular area of San Diego Bay, it is
important to note that candidate fishing areas are not equally distributed in the Bay. Fish are
attracted to certain habitats based on prey availability, physical structures, and hydrodynamic
conditions. The current fishing chart available for San Diego Bay (Figure 7) shows 27 marked
fishing areas with their GPS coordinates (Baja “Directions,” Inc. 2010). Twenty-three of these
areas are located near the Coronado Bridge or north of the bridge out to the mouth of the bay.
The nearest marked fishing areas to the NASSCO site are located on the west side of the bay
south of the Coronado Bridge, approximately 0.7 miles from the shipyard. This chart shows no
marked fishing areas or important fishing habitats (e.g., clam beds or eel grass beds) anywhere
near the NASSCO shipyard.

March 11, 2011
93
Figure 7. Map of San Diego Bay showing fishing areas

March 11, 2011
94
Given the information presented on this available chart and the absence of an aesthetic fishing
environment near an active industrial site, it is highly improbable that an angler would choose to
fish at the shipyard even if there were theoretical access in the future. It is inconceivable that an
angler would fish 100 percent of the time for 30 years and obtain all seafood at the NASSCO
shipyard site.
In summary, the assumption of complete angler access to the shipyard site and the use of
FI = 1.0 for a baseline risk assessment is unjustifiable from a technical standpoint and results in
a highly unrealistic overestimate of risk. As demonstrated in my report, the use of the other
conservative assumptions specified in the DTR still allows for a very high FI associated with
NASSCO site and the resultant estimated risks do not exceed the 10−5 level.
Failure to Adequately Interpret Results of the Type II Risk Assessment
Quantitative Estimates of Risk
One of the primary failures of the DTR human health risk discussion is that the estimated risks
are never quantitatively discussed. The exposure assumptions are described quantitatively, but
resulting risks are simply screened against reference conditions and a selected benchmark. For
example, cancer risks are characterized as “unacceptable” if they are greater than both 10−6 and
the cancer risk estimated for reference conditions. The calculated risks (for Site or reference
conditions) can only be found in Appendix 28 of the DTR. Table 10 shows the actual cancer
risks calculated in the DTR for PCB and arsenic exposure at NASSCO and reference stations. It
must be emphasized that these risk levels are based on the DTR exposure assumptions,
including that all of the seafood consumed is harvested from the designated area.

March 11, 2011
95
Table 10. Human health cancer risks for PCBs and arsenic from the DTR
Risk Level by Station
Scenario Reference Inside
NASSCO Outside
NASSCO
PCBs
Recreational fish 1.41E-05 1.18E-05 1.47E-05
Subsistence fish 1.10E-03 4.14E-03 1.18E-03
Recreational lobster 5.14E-06 5.14E-06 n/a
Whole lobster 8.08E-05 1.50E-04 n/a
Arsenic Recreational fish 3.09E-06 3.09E-06 3.86E-06
Subsistence fish 2.96E-05 3.55E-05 5.32E-05
Recreational lobster 3.39E-05 1.00E-04 n/a
Whole lobster 4.44E-04 2.78E-04 n/a
Note: All values taken from DTR Appendix 28.
Lobster were not collected outside NASSCO.
Notwithstanding the overly-conservative assumptions employed by the Staff, these results show
that carcinogenic risks greater than 10−4 (i.e., 1 in 10,000) are predicted only for the following
angler groups and substances:
• PCBs, subsistence anglers (fish), inside and outside NASSCO
• PCBs, whole lobster (subsistence), inside NASSCO*
• Arsenic, recreational angler lobster, inside NASSCO*
• Arsenic, whole lobster (subsistence), inside NASSCO.
For these groups, it is important to note that the predicted risks for subsistence harvest of fish
(PCBs) and subsistence harvest of lobster (arsenic) also exceed the 10−4 level at the reference
areas. Therefore, only the two scenarios indicated by * exceed a 10−4 risk level at the NASSCO
site, and not the reference area, as determined in the DTR. These two cases involve important
March 11, 2011
96
issues associated with the inherent exposure assumptions, which will be discussed in following
sections of my report.
Comparison with the 10−4 risk level is appropriate because this level represents the departure
point for risks categorized as acceptable and unacceptable by EPA and OEHHA. For example,
in setting advisory tissue levels (ATLs) for California sport fish consumption, Klasing and
Brodberg (2008) used a 10−4 risk level. OEHHA describes the resultant values as “…conferring
no significant health risk to individuals consuming sport fish in the quantities shown over a
lifetime….” Moreover, in assessing the safety of fish and shellfish consumption in areas
impacted by the M/V Cosco Busan oil spill in San Francisco Bay, OEHHA (2007) also used a
risk level of 10−4, and indicated that this threshold was also consistent with EPA guidance. EPA
used a maximum acceptable risk level (ARL) of 10−4 for use in setting fish advisories (U.S. EPA
2000). It is also important to note that the DTR, using highly unrealistic exposure assumptions,
estimated risks of PCBs to recreational anglers (fish) only slightly exceeding 1 × 10⁻⁵ for
NASSCO and the reference area. OEHHA (2006) has used 10−5 as a “no significant risk level”
(NSRL) for determination of safe harbor levels for carcinogens under Proposition 65. In
summary, there is no policy or regulatory support for the DTR’s conclusion that any risks
exceeding 10−6 are unacceptable and should be the basis for active sediment remediation.
The DTR also evaluates potential noncancer risks to anglers at the NASSCO site. For
recreational anglers using the extreme exposure scenarios, the DTR concludes that there are no
significant risks associated with PCB exposure. The DTR indicates, however, that mercury in
edible lobster tissue from inside NASSCO has a hazard quotient > 1.0 and the risk is greater
than at the reference area. Although the actual data are not presented in the DTR under Finding
28, examination of the results presented in Appendix 28 indicates that the hazard quotient for
mercury in edible lobster tissue was only 1.56. This risk was calculated in the DTR based on
the maximum mercury concentration of 0.52 mg/kg wet weight measured at the NASSCO site.
It is important to note that the average mercury concentration in edible lobster tissue at the
NASSCO site was only 0.25 mg/kg wet weight. Therefore, for the average exposure, even with
an FI = 1.0, mercury does not exceed a hazard quotient of 1.0. It is also interesting to note that
the average mercury concentrations in spotted sand bass at NASSCO were actually lower than

March 11, 2011
97
measured at the reference station. Given that mercury concentrations in sediments at NASSCO
were not substantially elevated above reference levels, these results do not indicate that
noncarcinogenic effects of mercury are a concern for potential recreational harvest of lobsters at
NASSCO. As is the case for carcinogenic effects, any apparent noncancer risks presented in the
DTR for subsistence anglers are driven by the unsupported and implausible assumptions for the
subsistence angler scenario.
Comparison of NASSCO Exposure Point Concentrations and Reference Conditions
The exposure point concentrations that drive all of the DTR human health risk calculations are
measured PCB and arsenic concentrations in fish and lobster. Spotted sand bass were collected
at two Site stations (inside and outside the NASSCO leasehold). Lobster were found to occur
inside the leasehold only. Any interpretation of risk calculations or risk conclusions should
incorporate a quantitative comparison of measured edible fish tissue at the Site with reference
conditions. The DTR assessment incorporated only a qualitative comparison of risks. If risks
calculated at the Site were found to be higher than the unacceptable risk threshold (i.e., 10−6
cancer risk) and higher than reference, then the risk was stated to be a “significant health risk”.
However, the authors of the DTR apparently did not perform any statistical test to determine
whether or not the measured fish and lobster concentrations of chemicals were significantly
higher than reference conditions. They simply calculated risk using maximum measured
concentrations and assumed that any difference between these calculations was significant and
relevant.
Reference and NASSCO data for sand bass fillets and edible lobster are shown in Tables 11
and 12, respectively. All replicate samples at each station are shown, along with mean values
and variance.

March 11, 2011
98
Table 11. PCBs and arsenic in spotted sand bass fillets
Station Sample Number
Survey Station
Field Replicate
Total Arsenic (mg/kg ww)
Total Aroclors® (µg/kg ww)
Reference
BI0043 2240 1 0.40
40
BI0044 2240 2 0.40
20 U
BI0045 2240 3 0.30
31
BI0046 2240 4 0.30
19
BI0047 2240 5 0.40
55
Mean 0.36
33
Variance 0.003
226
Inside NASSCO
BI0013 NAFI01 1 0.40
27
BI0024 NAFI01 2 0.30
34
BI0025 NAFI01 3 0.30
38
BI0026 NAFI01 4 0.40
46
BI0027 NAFI01 5 0.40
18
Mean 0.36
33
Variance 0.003
114
P-value 1.00
0.96
Outside NASSCO
BI0053 NAFI02 1 0.40
57
BI0054 NAFI02 2 0.40
40
BI0055 NAFI02 3 0.40
35
BI0056 NAFI02 4 0.50
27
BI0057 NAFI02 5 0.40
32
Mean 0.42
38
Variance 0.002
133
P-value 0.094
0.56
Notes: U = undetected (detection limit) P-value is for t-test comparison to reference (two tailed), assuming equal variances
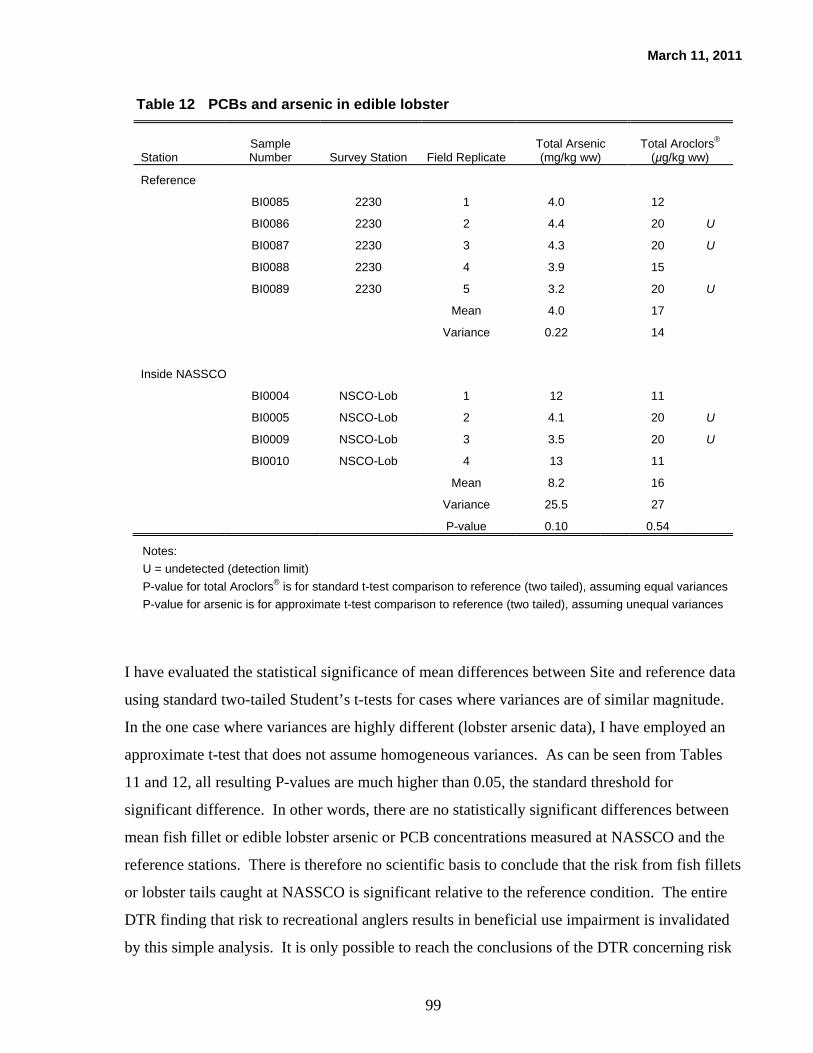
March 11, 2011
99
Table 12 PCBs and arsenic in edible lobster
Station Sample Number Survey Station Field Replicate
Total Arsenic (mg/kg ww)
Total Aroclors® (µg/kg ww)
Reference
BI0085 2230 1 4.0
12
BI0086 2230 2 4.4
20 U
BI0087 2230 3 4.3
20 U
BI0088 2230 4 3.9
15
BI0089 2230 5 3.2
20 U
Mean 4.0
17
Variance 0.22
14
Inside NASSCO
BI0004 NSCO-Lob 1 12
11
BI0005 NSCO-Lob 2 4.1
20 U
BI0009 NSCO-Lob 3 3.5
20 U
BI0010 NSCO-Lob 4 13
11
Mean 8.2
16
Variance 25.5
27
P-value 0.10
0.54
Notes: U = undetected (detection limit) P-value for total Aroclors® is for standard t-test comparison to reference (two tailed), assuming equal variances P-value for arsenic is for approximate t-test comparison to reference (two tailed), assuming unequal variances
I have evaluated the statistical significance of mean differences between Site and reference data
using standard two-tailed Student’s t-tests for cases where variances are of similar magnitude.
In the one case where variances are highly different (lobster arsenic data), I have employed an
approximate t-test that does not assume homogeneous variances. As can be seen from Tables
11 and 12, all resulting P-values are much higher than 0.05, the standard threshold for
significant difference. In other words, there are no statistically significant differences between
mean fish fillet or edible lobster arsenic or PCB concentrations measured at NASSCO and the
reference stations. There is therefore no scientific basis to conclude that the risk from fish fillets
or lobster tails caught at NASSCO is significant relative to the reference condition. The entire
DTR finding that risk to recreational anglers results in beneficial use impairment is invalidated
by this simple analysis. It is only possible to reach the conclusions of the DTR concerning risk
March 11, 2011
100
to recreational anglers if you ignore the fact that measured fish and lobster COC concentrations
are not significantly different from reference, and adopt inappropriate and unrealistic exposure
assumptions (i.e., FI = 100 percent at maximum detected concentrations).
Summary
The Tier II human health risk assessment presented in the DTR is effectively a screening-level
assessment in which exposure assumptions are set at implausibly high levels. These inflated
estimated risks are then compared with a critical risk threshold of 1 × 10⁻⁶, without any cited
regulatory or policy basis for comparison with that risk level. Even when using the unrealistic
exposure estimates in the DTR, the estimated carcinogenic risks associated with PCBs for
recreational anglers are only 5.14 × 10⁻⁶ (lobsters) to 1.47 × 10⁻⁵ (sand bass). These risk levels
are comparable to those estimated for reference areas. In fact, there are no statistically
significant differences (P>0.05) between PCB and arsenic concentrations in fish fillets or edible
lobster tissue between the NASSCO site and reference areas. The Staff apparently failed to
conduct this simple statistical comparison and erroneously concluded that carcinogenic risks to
recreational anglers from PCBs and arsenic were greater at the NASSCO shipyard than at
reference areas.
In estimating the risks for subsistence anglers, the DTR uses even more extreme and implausible
assumptions than were used for recreational anglers. Notably, subsistence anglers are assumed
to obtain an unrealistically high amount of seafood exclusively from the shipyard site every day
for a period of 30 years. These theoretical anglers are then assumed to eat only the whole
bodies, including guts, stomachs, livers, and kidneys, of the harvested organisms. These
assumptions have no scientific basis whatsoever, and render the resultant risk estimates
meaningless.
My evaluation of potential health risks at the NASSCO site, even considering potential angler
access to the site, indicates that risks of fish and shellfish harvest using conservative, but
plausible exposure assumptions are within acceptable ranges as specified by OEHHA and EPA.

March 11, 2011
101
Evaluation of Proposed Remedial Footprint
The remedial footprint proposed in the DTR includes 23 sediment stations at the Shipyards, five
of which are at NASSCO (NA06, NA09, NA15, NA17, and NA19). Part of the polygon area of
station SW28 is also within the NASSCO leasehold. In evaluating the appropriateness of the
proposed remedy, it is instructive to review the data for impairment of beneficial uses at each of
these six stations.
In the DTR, alternative cleanup levels were selected based on an approach using surface-
weighted average concentrations of primary COCs in sediments to evaluate potential impacts to
aquatic-dependent wildlife and human health. An independent evaluation of potential effects to
aquatic life following active remediation was then conducted in the DTR.
The DTR indicates that the remedial footprint was selected on a “worst first” ranking evaluation
of shipyard sampling station polygons. The following factors were apparently included in the
ranking process used to select the target polygons:
• Surface sediment mean effects quotient (SSMEQs) for non-Triad stations
• “Likely” impaired stations based on Triad assessments
• Composite site-wide surface-weighted average concentrations (SWACs) for
the five primary COCs
• Concentrations of primary COCs at individual stations.
It is not clear in the DTR how these various factors entered into the selection of the five
polygons at NASSCO, and partial polygon at station SW28, as part of the remedial footprint.
However, it is apparent that the first two factors clearly relate to potential effects on benthic
macroinvertebrate communities because they are associated with Triad analyses or application
of sediment quality values-based benthic effects. The latter two factors probably relate to the
potential for adverse effects on aquatic-dependent wildlife and human health, as they are
associated entirely with chemical concentrations. Therefore, I will discuss whether remediation
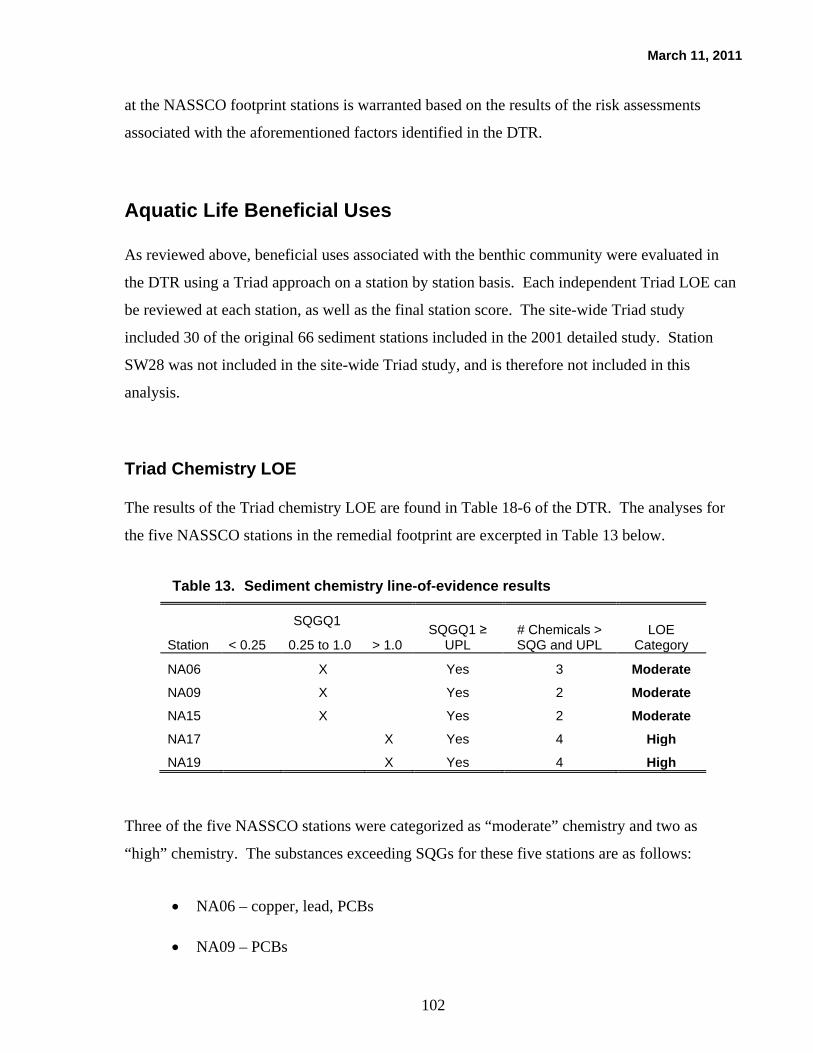
March 11, 2011
102
at the NASSCO footprint stations is warranted based on the results of the risk assessments
associated with the aforementioned factors identified in the DTR.
Aquatic Life Beneficial Uses
As reviewed above, beneficial uses associated with the benthic community were evaluated in
the DTR using a Triad approach on a station by station basis. Each independent Triad LOE can
be reviewed at each station, as well as the final station score. The site-wide Triad study
included 30 of the original 66 sediment stations included in the 2001 detailed study. Station
SW28 was not included in the site-wide Triad study, and is therefore not included in this
analysis.
Triad Chemistry LOE
The results of the Triad chemistry LOE are found in Table 18-6 of the DTR. The analyses for
the five NASSCO stations in the remedial footprint are excerpted in Table 13 below.
Table 13. Sediment chemistry line-of-evidence results
Station
SQGQ1 SQGQ1 ≥
UPL # Chemicals > SQG and UPL
LOE Category < 0.25 0.25 to 1.0 > 1.0
NA06 X Yes 3 Moderate
NA09 X Yes 2 Moderate
NA15 X Yes 2 Moderate
NA17 X Yes 4 High
NA19 X Yes 4 High
Three of the five NASSCO stations were categorized as “moderate” chemistry and two as
“high” chemistry. The substances exceeding SQGs for these five stations are as follows:
• NA06 – copper, lead, PCBs
• NA09 – PCBs

March 11, 2011
103
• NA15 – PCBs
• NA17 – copper, lead, zinc, PCBs
• NA19 – zinc, PCBs.
NA17 and NA19 both have an SQGQ1 (which is a weighted average of SQG quotients) of 1.06,
which is only slightly higher than the 1.0 threshold that puts them into the “high” chemistry
category.
Triad Toxicity LOE
The results of the Triad toxicity LOE are found in Table 18-8 of the DTR. The LOE Categories
are listed in Table 18-9. The analyses for the five NASSCO stations in the remedial footprint
are excerpted in Table 14 below.
Table 14. Comparison of the toxicity data from the Shipyard sediment site stations to the reference pool 95 percent lower predictive limit
Reference Pool 95 Percent LPL
Station
Amphipod Survival Urchin Fertilization Bivalve Development
LOE Category (95% LPL = 73%) (95% LPL = 42%) (95% LPL = 37%)
NA06 78 103 74 Low
NA09 88 99 1 Moderate
NA15 97 88 93 Low
NA17 95 88 80 Low
NA19 89 72 2 Moderate
NOTES: Toxicity values less than the 95 percent lower prediction limit values are bold faced and boxed.
Sediments from three of these stations were found to be nontoxic in all three tests, and were
given a toxicity score of “low” in the DTR (the lowest possible category). Sediments from
stations NA09 and NA19 were found to be toxic in the bivalve larval development test only, and
were given a toxicity score of “moderate” in the DTR. The bivalve study is known to be highly
variable in general, and was much more variable than the other two tests in this study (see

March 11, 2011
104
discussion above). There was no effect on amphipod survival or echinoderm fertilization for
any of the sediments in the DTR NASSCO remedial footprint. For the remedial footprint
stations at NASSCO, amphipod survival ranged from 78 to 97 percent and sea urchin
fertilization ranged from 72 to 103 percent.
Triad Benthic Macroinvertebrate LOE
The results of the Triad benthic macroinvertebrate LOE are found in Table 18-12 of the DTR.
LOE Categories are found in Table 18-9. The analyses for the five NASSCO stations in the
remedial footprint are excerpted in Table 15 below.
Table 15. Comparison of the benthic community metrics data from the Shipyard sediment site stations to the reference pool 95 percent predictive limits
Station BRI
(95% UPL = 57.7) Abundance
(95% LPL = 239) # Taxa
(95% LPL = 22) S-W Diversity
(95% LPL = 1.8) LOE Category
NA06 54.4 611 37 2.7 Low
NA09 51.1 862 44 2.6 Low
NA15 51.0 306 26 2.3 Low
NA17 55.3 418 33 2.7 Low
NA19 46.7 828 43 2.7 Low
None of the five stations were found to exhibit benthic community metrics outside the
95 percent prediction limits of the DTR reference pool. All five stations were given a benthic
macroinvertebrate score of “low” disturbance in the DTR (the lowest possible score). As
discussed previously, these stations would be more accurately characterized as “none”
concerning any adverse impacts to BMI communities. It is also important to note that some of
the remedial footprint stations displayed substantially higher abundances and numbers of taxa
than the reference ranges for these variables. For example, stations NA09 and NA19 had
macroinvertebrate abundances that were approximately 3.5 times as high as the 95 percent LPL.
Similarly, these two remedial footprint stations had almost twice as many benthic taxa as the
lower reference range.

March 11, 2011
105
Comparison of other benthic community characteristics also indicates that the communities in
the areas of the NASSCO shipyard that are proposed for remediation are similar to the final
reference pool communities specified in the DTR. For example, the total abundances and
abundances of major groups of benthic organisms (polychaetes, molluscs, and crustacean) at the
NASSCO stations show remarkable similarity to reference conditions (see Figure 4). Based on
this comparison, the NASSCO remedial footprint stations were even more similar to the
reference stations than were the overall group of NASSCO stations.
Triad MLOE Station Score
The DTR Triad MLOE scores for the five proposed NASSCO remedial areas are as follows:
• NA06 and NA15 – “Unlikely” to be impacted
• NA09 and NA17 – “Possible” impacts
• NA19 – “Likely” to be impacted.
As reviewed above, the DTR MLOE scores are derived in a highly biased manner that
overestimates the actual evidence for impairment, particularly at stations with “moderate” or
“high” chemistry.
Additional Assessment of Non-Triad Stations
It is important to note that two of the proposed remedial areas (NA06 and NA15) are classified
in the DTR as unlikely to be impacted, notwithstanding the biased decision framework in that
document. Both of these stations showed all toxicity and benthic macroinvertebrate metrics to
be within the reference range. Although all five sediment stations in the proposed NASSCO
remedial footprint have “moderate” to “high” chemistry according to the DTR scoring method,
none exhibited toxicity in the acute amphipod or chronic echinoderm toxicity tests, and no
apparent disturbance to the benthic community was measured, relative to the reference
95 percent prediction limits. Of the seven biological endpoints measured at these five stations
March 11, 2011
106
(three toxicity tests and four benthic macroinvertebrate metrics), the only values falling outside
the reference prediction limits were bivalve larval development at stations NA09 and NA19.
Therefore, there is no conclusive evidence of impaired beneficial uses associated with aquatic
life at those stations, and no justification for remediation to protect aquatic life. There is no
biological basis presented in the DTR for describing station NA17 as possibly impacted. It
receives this score solely because of a “high” chemistry LOE score. The remaining stations,
NA09 and NA19, were found to be toxic in the bivalve larval development test only, but were
scored as “possibly impacted” and “likely impacted,” respectively, because of their “moderate”
and “high” chemistry LOE scores. It is inconceivable to me that a station could be classified as
“likely” impaired when 6 of the 7 biological metrics at that station were indistinguishable from
reference conditions and the benthic communities were healthy and abundant. Given the
preponderance of evidence against toxicity in the most reliable bioassays run and the complete
absence of benthic macroinvertebrate metrics indicating an impacted community, it is my
opinion that the bivalve test is insufficient evidence, by itself, to conclude that aquatic life
beneficial uses are impaired, or that remediation is warranted to protect aquatic life at either of
these stations. In fact, a valid scientific analysis of the Triad data presented in the DTR leads to
the conclusion that there is no need to remediate any of the five Triad stations proposed for
cleanup.
A supplemental Triad study was undertaken at the Shipyard Site in 2009 to support the
evaluation of remedial actions and development of a post-remedial monitoring plan. The study
was limited to five stations that had previously been sampled only for sediment chemistry. The
purpose of the study was not to provide additional site characterization per se, but to confirm a
specific hypothesis concerning sediment chemistry thresholds for benthic effects (see below).
The study was undertaken jointly by NASSCO, BAE, the City of San Diego, and San Diego Gas
and Electric. Sediment samples were collected at each station and submitted for synoptic
analysis of sediment chemistry, sediment toxicity, and benthic macroinvertebrate community
status, according to the supplemental Triad study work plan (Exponent 2009). To the extent
possible, sample collection and analytical methods were consistent with those used in the site-
wide Triad study conducted in 2001. The same reference range comparisons were used to
evaluate the 2009 data as those used in the DTR (Section 16).

March 11, 2011
107
The objective of the supplemental Triad study was to verify that site-specific sediment
concentration benchmarks developed by the SDRWQCB Cleanup Team to protect benthic
communities were, in fact, protective. Using surface sediment chemistry data from the site-
wide Triad study, two benchmarks were developed for the five primary COCs (copper, mercury,
PCBs, HPAH, and TBT). These were based on the SSMEQ, a multi-chemical index, and the
lowest apparent effect threshold (LAET) observed in the toxicity data from the Triad study.
Both benchmarks included safety factors to ensure protection of beneficial uses. Surface
sediment data were compared to an SSMEQ of 0.9, as well as 60 percent of the LAET. The
remedy proposed by the Cleanup Team included remediation at all areas (as defined by
Thiessen polygons around the sediment stations) that exceeded the two benchmarks described
above. The hypothesis of the supplemental Triad study was therefore that stations that did not
exceed the sediment chemistry benchmarks would not exhibit significant benthic impacts in a
Triad study. Five stations (NA23, NA24, SW06, SW19, and SW30) were selected for testing,
which shared the following characteristics:
• Not part of the remedial action proposed by the Cleanup Team
• Not previously sampled for toxicity testing or benthic macroinvertebrate
community analysis
• Surface sediment chemistry data in 2001–2002 were at the high end of the
range of stations outside the proposed remedial footprint.
Once the chemistry, toxicity, and benthic community data were received from the laboratories
and validated, the same MLOE analysis described in the DTR was applied to evaluate the five
new Triad stations. The findings were as follows:
• Chemistry—Four of the stations were found to have “moderate” chemistry,
according to the DTR chemistry LOE paradigm. Station SW19 was
classified as having “low” chemistry.

March 11, 2011
108
• Toxicity—All five stations were classified as “low” toxicity. Neither of the
two toxicity tests exhibited significant differences from the 95 percent LPL of
reference samples.
• Benthic Macroinvertebrate Community—Three of the stations were
classified as “low” disturbance. NA23 and NA24 were classified as
“moderate” disturbance, because total abundance was lower than the
reference 95 percent LPL. Given the absence of toxicity at these stations and
the proximity to the NASSCO floating drydock and frequent ship
movements, this finding was interpreted to indicate physical disturbance at
these stations.
• MLOE Score—Three of the stations were classified as “unlikely” to be
impaired, based on the DTR evaluation approach. NA23 and NA24 were
classified as “possible”, because of their “moderate” benthic
macroinvertebrate disturbance scores. Again, this finding is likely caused by
periodic physical disturbance at these locations.
As a result of the analyses described above, the hypothesis was confirmed, and the site-specific
sediment chemistry benchmarks developed by the Cleanup Team were judged to be sufficiently
protective of benthic communities and associated beneficial uses.
Aquatic-Dependent Wildlife Beneficial Uses
As noted above, the evaluation of protectiveness of the proposed remedy for aquatic-dependent
wildlife is based on a comparison of estimated post-remedial exposures to geometric mean
TRVs (geometric mean of NOAEL and LOAEL). The post-remedial exposure estimates are
based on the estimated post-remedial SWAC and biota-sediment accumulation factor ratios for
fish and mussels measured under pre-remedial conditions. The results of this evaluation are
shown in Table 32-8 of the DTR.

March 11, 2011
109
Using a geometric mean TRV as the benchmark for significant risk (as was conducted in the
DTR for evaluation of the proposed remedial footprint), none of the Tier II wildlife risk drivers
is predicted to result in adverse impacts to wildlife, even though other unrealistic assumptions of
the Tier II assessment are left unchanged (i.e., area use of 100 percent). Given that calculated
exposure levels under pre-remedial conditions did not exceed geometric mean TRVs for any
primary COC, this finding is as expected. The projected post-remedial exposure conditions are
clearly protective of the modeled receptors (as are the pre-remedial exposure conditions).
Therefore, there is no scientific basis for remediating any areas of the NASSCO shipyard to
protect aquatic-dependent wildlife.
Human Health Beneficial Uses
The DTR has concluded that there are unacceptable risks to human health at the NASSCO site
based on the use of implausible exposure assumptions that disregard present or future angler
access to the site. The compounding effects of the series of unrealistic assumptions results in a
meaningless risk assessment. Moreover, the resultant risk assessments are then compared with
an unsupported risk threshold of one in one million (1 × 10⁻⁶) for a determination of beneficial
uses. Alternatively, my evaluation of potential health risks at the NASSCO site, even
considering potential angler access to the site, indicates that risks of fish and shellfish harvest
using conservative, but plausible exposure assumptions, are within acceptable ranges as
specified by OEHHA and EPA. Given these results, there is no reasonable basis for concluding
that remediation of the NASSCO site is warranted to protect beneficial uses associated with
human health.
Summary
I have evaluated all three beneficial uses that were identified in the DTR as supporting the need
for active remediation at the NASSCO shipyard. As indicated in the previous sections of my
report, the rationale for any active remediation at NASSCO simply is not supported by the
available data. In the case of aquatic life, three of the five polygons selected in the DTR for

March 11, 2011
110
active remediation have no measurable adverse effects on aquatic life based on seven toxicity
and benthic community metrics. The other two polygons displayed significant toxicity for only
one test that is known to have low reliability. The seven other metrics for toxicity and benthic
communities were not different from reference values. These results are not based on my re-
analysis of the aquatic life data, but are presented herein as they are determined in the DTR. As
a result, the DTR finding that aquatic life and associated beneficial uses are significantly
impacted at the NASSCO Site is unreliable and significantly overstates any actual impacts on
benthic communities from sediment chemicals. Any active remediation of the five NASSCO
polygons identified in the DTR would only cause substantial impacts to existing benthic
communities that are comparable to reference conditions in San Diego Bay.
The aquatic-dependent wildlife assessment, which serves as the basis for the DTR
conclusions about impacts to wildlife and associated beneficial uses, is severely flawed
by the use of inappropriate, highly biased assumptions and benchmarks of effect. The
Tier II wildlife risk assessment models in the DTR are driven by a number of extreme
assumptions that are appropriate only for a Tier I screening assessment, including area
use factors, selection of TRVs, and interpretation of hazard quotients. The Tier II
assessment is inconsistent with federal and California guidance for ecological risk
assessment. As a result, the DTR finding that beneficial uses associated with aquatic-
dependent wildlife at the Site are impacted is unreliable, and significantly overstates
actual impacts on wildlife from sediment chemicals.
Even using the aforementioned extreme assumptions, the Tier II wildlife risk assessment
in the DTR does not indicate the exceedance of any adverse effect threshold presented
therein. Moreover, application of the food web models in the DTR wildlife assessment
using appropriate, scientifically valid assumptions that are consistent with applicable
ecological risk assessment guidance and standard practices, demonstrates that there are
no significant risks to any of the modeled receptors. This conclusion is reached even
though a highly-conservative and unrealistic assumption that AUF = 1.0 is used in the
risk assessment. There is therefore no justification for any remediation of sediments at
the NASSCO shipyard to protect aquatic-dependent wildlife or associated beneficial
uses.

March 11, 2011
111
The human health risk assessment in the DTR is similar to the aquatic-dependent
wildlife assessment in that it is essentially a screening-level assessment with no
reasonable relationship to existing or expected angler use of the site. The DTR risk
calculations are based on a series of implausible assumptions that act together to indicate
risk levels that are unreliable and do not form a defensible basis for active remediation of
sediments. However, even using conservative assumptions that some significant angler
use at the site would be possible (when in fact it is not available to anglers), the data
indicate that risks would not be at unacceptable levels based on state or federal guidance.
In conclusion, the two integrative assessments of beneficial uses (aquatic-dependent
wildlife and human health) provide no reliable justification for a reduction in the current
SWAC for COCs at the NASSCO shipyard. Therefore, there is no justification for
active remediation of sediments at the five NASSCO polygons based on either station-
specific aquatic life studies or on site-wide assessments of risk to ecological or human
receptors.

March 11, 2011
112
References
Baja “Directions,” Inc. 2010. San Diego and Mission Bay – Fishing Chart with Local Knowledge, ISBN 1-929394-28-4.
Bay, S., D. Greenstein, and D. Young. 2007a. Evaluation of methods for measuring sediment toxicity in California bays and estuaries. Southern California Coastal Water Research Project, Technical Report 503.
Bay, S., W. Berry, P. Chapman, R. Fairey, T. Gries, E. Long, D. MacDonald, and S.B. Weisberg. 2007b. Evaluating consistency of best professional judgment in the application of a multiple lines of evidence sediment quality triad. Pp. 259 – 267 In: Weisberg, S.B. and K. Miller (eds.). 2007. Southern California Coastal Water Research Project, Annual Report 2007, December 2007.
Bay, S.M., and S.B. Weisberg. 2008. A framework for interpreting sediment quality triad data. pp. 175–185. In: Southern California Coastal Water Research Project, Annual Report.
Borak, J. and H.D. Hosgood. 2007. Seafood arsenic: Implications for human risk assessment. Reg. Toxicol. Pharmacol. 47:204–212.
Burton Jr., G.A., P.M. Chapman, and E. P. Smith. 2002a. Weight-of-evidence approaches for assessing ecosystem impairment. Hum. Ecol. Risk Assess. 8(7):1657–1673.
Burton Jr., G.A., , G.E. Batley, P.M. Chapman, V.E. Forbes, E.P. Smith, T. Reynoldson, C.E. Schekat, P. J. den Besten, A.J. Bailer, A.S. Green and R. L. Dwyer. 2002b. A weight-of-evidence framework for assessing sediment (or other) contamination: Improving certainty in the decision-making process. Hum. Ecol. Risk Assess. 8(7):1675–1696.
CA DFG. 2001. California’s marine living resources: A status report. 243 pp. California Department of Fish and Game, Sacramento, CA.
CA DFG. 2010. Ocean Sportfishing Regulations, 10-11. Available at: http://www.dfg.ca.gov/marine/pdfs/oceanfish2010.pdf. California Department of Fish and Game, Sacramento, CA.
CA State Water Resources Control Board. 2009. Water quality control plan for enclosed bays and estuaries – Part 1 Sediment quality. California Environmental Protection Agency, 27 pp.
Chapman, P.M. 1990. The sediment quality triad approach to determining pollution-induced degradation. Sci. Total Environ. 97/98:815–825.
Chapman, P.M. 1996. Presentation and interpretation of Sediment Quality Triad data. Ecotoxicology. 5:327–339.
March 11, 2011
113
Chapman, P.M., E.A. Power, G.A. Burton, Jr. 1992. Integrative assessments in aquatic systems. pp. 313–340 In: Sediment Toxicity Assessment. G.A. Burton, Jr. et al. (eds). Lewis Publishers, Boca Raton, FL.
Chapman, P.M., B.G. McDonald, and G.S. Lawrence. 2002. Weight-of-evidence issues and frameworks for sediment quality (and other) assessments. Hum. Ecol. Risk Assess. 8(7):1489–1515.
Charters, D., and M. Greenberg. 2004. The Rule of Five: A novel weight of evidence approach to derive a site specific cleanup goal. Presented at SETAC 2004.
Donohue, J.M. and C.O. Abernathy. 1999. Exposure to inorganic arsenic from fish and shellfish. In: Arsenic Exposure and Health Effects, Chappell, W.R., C.O. Abernathy, and R.L. Calderone (eds), pp. 89–98.
DTSC. 1996. Guidance for ecological risk assessment at hazardous waste sites and permitted facilities. Part A: Overview. State of California, California Environmental Protection Agency, Department of Toxic Substances Control, Human and Ecological Risk Division.
DTSC. 1999. HERD Ecological Risk Assessment Note Number 2. Calculation of a range of intakes for vertebrate receptors in a Phase I Predictive Assessment for use with EPA Region IX BTAG toxicity reference doses (TRVs) to obtain a range of hazard quotients. California Department of Toxic Substances Control, Human and Ecological Risk Division.
DTSC. 2000. HERD ERA Note Number 4. Use of Navy/U.S. Environmental Protection Agency (USEPA) Region 9 biological technical assistance group (BTAG) toxicity reference values (TRVs) for ecological risk assessment.
Edens, F.W., and J.D. Garlich. 1983. Lead-induced egg production in leghorn and Japanese quail hens. Poultry Sci. 62:1757–1763.
Edens, F.W., E. Benton, S.J. Bursian, and G.W. Morgan. 1976. Effect of dietary lead on reproductive performance in Japanese quail, Coturnix coturnix japonica. Toxicol. Appl. Pharmacol. 38:307–314.
Edmonds, J.S. and K.A. Francesconi. 1993. Arsenic in seafoods: Human health aspects and regulations. Mar. Pollut. Bull. 26 (12):665–674.
Exponent. 2001a. Work plan for the NASSCO and Southwest Marine detailed sediment investigation. July 2001. Prepared for NASSCO and Southwest Marine, San Diego, CA. Exponent, Bellevue, WA.
Exponent. 2001b. Work plan for the NASSCO and Southwest Marine detailed sediment investigation. September 2001. Prepared for NASSCO and Southwest Marine, San Diego, CA. Exponent, Bellevue, WA.
Exponent. 2002. Technical memorandum 4: Phase 1 bioaccumulation data, ecological receptor species, and receptor parameters for the NASSCO and Southwest Marine detailed sediment
March 11, 2011
114
investigation. Prepared for NASSCO and Southwest Marine, San Diego, CA. January 16, 2002. Exponent, Bellevue, WA.
Exponent. 2003. NASSCO and Southwest Marine detailed sediment investigation. Volume I. Prepared for NASSCO and Southwest Marine, San Diego, CA. Exponent, Bellevue, WA.
Exponent. 2009. Work plan for supplemental triad study. BAE and NASSCO Shipyards Site. Prepared for NASSCO, BAE, City of San Diego, San Diego Gas and Electric, San Diego, CA. Exponent, Bellevue, WA.
Fairbrother, A. 2003. Lines of evidence in wildlife risk assessments. Hum. Ecol. Risk Assess. 9(6):1475–1491.
Finley, B.L. 2011. Expert Report prepared in regards to the California Regional Water Quality Control Board‘s Draft Technical Report for Tentative Cleanup and Abatement Order No. R9-2011-0001(San Diego Bay). 50 pp + App.
Grapentine, L., J. Anderson, D. Boyd, G.A. Burton, C. DeBarros, G. Johnson, C. Marvin, D. Milani, S. Painter, T. Pascoe, T. Reynoldson, L. Richman, K. Solomon, and P.M. Chapman. 2002. A decision making framework for sediment assessment developed for the Great Lakes. Hum. Ecol. Risk Assess. 8(7):1641–1655.
Greenberg, M., and D. Charters. 2005. Using the Rule of Five to determine ecologically protective clean-up goals at Superfund sites. Presented at SETAC 2005.
Griffiths, J., M.N. Dethier, A. Newsom, J.E. Byers, J.J. Meyer, F. Oyarzun, and H. Lenihan. 2006. Invertebrate community responses to recreational clam digging. Mar. Biol. 149:1489−1497.
Hope, B. 2004. A multi-stressor terrestrial ecological exposure model. pp. 311–323. In: Landscape ecology and wildlife habitat evaluation: Critical information for ecological risk assessment, land-use management activities, and biodiversity enhancement practices. L.A. Kaputska, H. Galbraith, M. Luxon, and G.R. Biddinger (eds). ASTM STP 1458. American Society for Testing and Materials International, West Conshohocken, PA.
Kaputska, L.A., H. Galbraith, and M. Luxon. 2001. Using landscape ecology to focus ecological risk assessment and guide risk management decision-making. Toxicol. Ind. Health 17:236–246.
Kirby, J. and W. Maher. 2002. Tissue accumulation and distribution of arsenic compounds in three marine fish species: relationship to trophic position. Appl. Organomet. Chem. 16:108−115.
Klasing, S. and R. Brodberg. 2008. Development of fish contaminant goals and advisory tissue levels for common contaminants in California sport fish: chlordane, DDTs, dieldrin, methylmercury, PCBs, selenium, and toxaphene. Office of Environmental Health Hazard Assessment, California Environmental Protection Agency. 115 pp

March 11, 2011
115
Klinger, T., D. Fluharty, K. Evans and C. Byron. 2006. Assessment of coastal water resources and watershed conditions at San Juan Island National Historical Park. Technical Report NPS/NRWRD/NRTR-2006/360, U.S. Department of the Interior, 144 pp.
Long, E.R. 1989. The use of the sediment quality triad in classification of sediment contamination. pp. 78–99. In: National Research Council, Commission on Engineering and Technical Systems, Marine Board, Committee on Contaminated Marine Sediments, Report on Contaminated Marine Sediments – Assessment and Remediation. National Academy Press, Washington, DC.
Long, E.R. and P.M. Chapman. 1985. A sediment quality triad: Measures of sediment contamination, toxicity and infaunal community composition in Puget Sound. Mar. Poll. Bull. 16: 405–415.
MWH. 2005. Groundwater comparison data set and comparison concentrations report, Santa Susana Field Laboratory, Ventura County, California. Prepared for The Boeing Company, National Aeronautics and Space Administration, and the U.S. Department of Energy. MWH, Pasadena, CA. Available at: http://www.dtsc.ca.gov/HazardousWaste/Projects/upload/SSFL_SRAM_Vol_7_Appendices_E_to_K.pdf
OEHHA. 1997. Chemicals in fish, Report No. 1 – Consumption of fish and shellfish in California and the United States. Final Draft Report, July 1997. California Environmental Protection Agency, Office of Environmental Health Hazard Assessment, Sacramento, CA. 99 pp.
OEHHA. 2006. Propositon 65 Safe Harbor Levels: No significant risk levels for carcinogens and maximum allowable dose levels for chemicals causing reproductive toxicity. Reproductive and Cancer Hazard Assessment Branch, California Environmental Protection Agency, Office of Environmental Health Hazard Assessment.
OEHHA. 2007. Report on the safety of consuming fish and shellfish from areas impacted by the M/V Cosco Busan oil spill in San Francisco Bay, California. California Environmental Protection Agency, Office of Environmental Health Hazard Assessment. 55 pp.
OEHHA. 2010. PCBs in fish caught in California: Information for people who eat fish. Available at: http://oehha.ca.gov/fish/pcb/index.html. California Environmental Protection Agency, Office of Environmental Health Hazard Assessment.
Pattee, O.H. 1984. Eggshell thickness and reproduction in American kestrels exposed to chronic dietary lead. Arch. Environ. Contam. Toxicol. 13:29−34.
Pearson T.H., and R. Rosenberg. 1978. Macrobenthic succession in relation to organic enrichment and pollution of the marine environment. Oceanogr. Mar. Biol. Ann. Rev. 16:229−311.
RWQCB. 2010. Draft technical report for tentative cleanup and abatement Order No. R9-2011-001, for the shipyard sediment site. Sand Diego Bay, San Diego, CA. California Regional

March 11, 2011
116
Water Quality Control Board, San Diego Region, San Diego, CA. Available at: http://www.waterboards.ca.gov.sandiego.
SCCWRP and MBC. 1994. Santa Monica Bay seafood consumption study, final report. Prepared for Santa Monica Bay Restoration Project. Southern California Water Research Project and MBC Applied Environmental Sciences. 104 pp.
SCCWRP and U.S. Navy. 2005. Sediment assessment study for the mouths of Chollas and Paleta Creek, San Diego. Phase I Final Report. Southern California Coastal Water Research Project, Westminster, CA, and Space and Naval Warfare Systems Center San Diego, U.S. Navy, San Diego, CA.
Schoof, R.A., J. Eickhoff, L.J. Yost, E.A. Crecelius, D.W. Cragin, D.M. Meacher, and D.B. Menzel. 1999. Dietary exposure to inorganic arsenic. In: Arsenic Exposure and Health Effects, Chappell, W.R., C.O. Abernathy, and R.L. Calderone (eds), pp. 81–88.
SCS. 2006. Report on environmental site assessment of the Mission Bay Landfill, San Diego, California. Prepared for the City of San Diego. SCS Engineers, San Diego, CA. Available at: http://www.sandiego.gov/citycouncil/cd6/pdf/crtk/mblfreport060908.pdf.
Sloth, J.J., E.H. Larsen, K. Julshamn. 2005. Survey of inorganic arsenic in marine animals and marine certified reference materials by anion exchange high-performance liquid chromatography-inductively coupled plasma mass spectrometry. J. Agr. Food Chem. 53:6011–6018.
Suter II, G.W., R.A. Efroymson, B.E. Sample, and D.S. Jones. 2000. Ecological risk assessment for contaminated sites. CRC Press LLC, Boca Raton, FL.
Thompson, B., B. Anderson, J. Hunt, K. Taburski, and B. Phillips. 1997. Relationship between sediment toxicity and contamination in San Francisco Bay. San Francisco Estuary Institute, Oakland, CA, RMP Contribution 27.
U.S. EPA. 1989. Risk assessment guidance for Superfund, Vol. 1, Human Health Evaluation Manual (Part A), Interim Final. EPA/540/1-89/002. U.S. Environmental Protection Agency, Office of Emergency and Remedial Response, Washington, DC.
U.S. EPA. 1992. Sediment classification methods compendium. EPA 823-R-92-006. U.S. Environmental Protection Agency, Office of Water, Washington, DC.
U.S. EPA. 1993. Wildlife exposure factors handbook. Volume I. EPA/600/R-93/187a. U.S. Environmental Protection Agency, Office of Research and Development, Washington, DC.
U.S. EPA. 1995. Internal memorandum from C.M. Browner to Assistant Administrators, Associate Administrators, Regional Administrators, General Counsel, and the Inspector General, regarding EPA’s risk characterization program, dated March 21, 1995. U.S. Environmental Protection Agency, Washington, DC.
March 11, 2011
117
U.S. EPA. 1997. Ecological risk assessment guidance for Superfund: Process for designing and conducting ecological risk assessments. EPA 540-R-97-0C5. U.S. Environmental Protection Agency, Office of Solid Waste and Emergency Response, Washington, DC.
U.S. EPA. 2000. Guidance for assessing chemical contaminant data for use in fish advisories. EPA 823-B-00-007. Volume 2. Risk assessment and fish consumption limits. Third edition. U.S. Environmental Protection Agency, Washington, DC.
U.S. EPA. 2004. The incidence and severity of sediment contamination in surface waters of the United States. National Sediment Quality Survey, Second Edition. U.S. Environmental Protection Agency, Office of Science and Technology, Washington, DC.
U.S. EPA. 2005. Guidelines for Carcinogen Risk Assessment. EPA/630/P-03/001F. Risk Assessment Forum, Washington D.C., March 2005.
U.S. Navy. 2005. Background studies for TMDL evaluation – Mouths of Chollas Creek and Paleta Creek. U.S. Navy presentation, October 11, 2005.
Wenning, R.J., G.E. Batley, C.G. Ingersoll, and D.W. Moore (eds.). 2005. Use of sediment quality guidelines (SQGs) and related tools for the assessment of contaminated sediments. Society of Environmental Toxicology and Chemistry. Pensacola, FL.
Weymouth, F.W. 1921. The edible clams, mussels and scallops of California. State of California Fish and Game Commission, Fish Bulletin No. 4.
Zar, J.H. 1996. Biostatistical Analysis. Prentice Hall, New Jersey. 662 pp.
Appendix A Resume of Thomas C. Ginn, Ph.D.
10/10
Thomas C. Ginn, Ph.D. Principal Professional Profile Dr. Thomas Ginn is a Principal Scientist in Exponent’s EcoSciences practice. He specializes in natural resource damage assessment and ecological risk assessment. He has conducted studies of the effects of inorganic and organic chemicals on aquatic and terrestrial organisms at sites nationwide. Dr. Ginn has specialized expertise in assessing the fate, exposure, and effects of substances such as PCBs, PAHs, dioxins, arsenic, cadmium, copper, lead, and mercury. He has provided scientific consultation regarding the design of remedial investigations and development of overall strategy, and he has provided technical support during negotiations with state and federal agencies. Dr. Ginn has provided support to industrial clients for natural resource damage assessments in Alaska, Arizona, California, Idaho, Indiana, Missouri, Montana, Massachusetts, Michigan, Minnesota, New Jersey, New York, Ohio, Oklahoma, South Carolina, Texas, Washington and West Virginia. In these projects, he has worked closely with legal counsel during strategy development and settlement negotiations with state, federal, and tribal trustees. Dr. Ginn has performed detailed technical assessments of injuries to terrestrial and aquatic resources, including fishes, birds, and mammals, and has also developed innovative and cost-effective restoration alternatives. He has provided deposition and trial testimony concerning injury to aquatic and terrestrial resources. Dr. Ginn has evaluated remedial alternative at contaminated sediment sites and has conducted state-of-the-art studies of the sources and distribution of trace metals. He has also developed site-specific sediment quality values based on the empirical relationships of chemical concentrations to biological effects. Dr. Ginn has authored many publications in the area of applied ecology. He has given numerous presentations and CLE seminars on risk assessment and natural resource damage assessment. Since 1983, he has co-authored the annual literature review of marine pollution studies published by the Research Journal of the Water Environment Federation. Dr. Ginn has served as an expert witness concerning the effects of waste discharges and chemicals in sediments on aquatic organisms. He has also served on scientific advisory committees concerning management of contaminated sediments for Puget Sound, San Francisco Bay, and New York/New Jersey Harbor. Dr. Ginn testified to the U.S. House of Representatives, Commerce Committee, concerning the natural resource damage provision of Superfund reauthorization. Academic Credentials and Professional Honors Ph.D., Biology, New York University, 1977 M.S., Biological Sciences, Oregon State University, 1971 B.S., Fisheries Science, Oregon State University, 1968

Thomas C. Ginn, Ph.D. Page 2 10/10
Licenses and Certifications Certified Fisheries Professional, American Fisheries Society, Certificate No. 2844 Publications Mearns AJ, Reish DJ, Oshida PS, Buchman M, Ginn T, Donnelly R. Effects of pollution on marine organisms. Water Environ Res 2009; 81(10):2070–2125. Gala W, Lipton J, Cernera P, Ginn TC, Haddad R, Henning MH, Jahn K, Landis WG, Mancini E, Nicoll J, Peters V, Peterson J. Ecological Risk Assessment (ERA) and Natural Resource Damage Assessment (NRDA): Synthesis of assessment procedures. Integrated Environ Assess Manage 2009; 5(4):515–522. Mearns AJ, Reish DJ, Oshida PS, Buchman M, Ginn T, Donnelly R. Effects of pollution on marine organisms. Water Environ Res 2008; 80(10):1918–1979. Becker DS, Ginn TC. Critical evaluation of the sediment effect concentrations for polychlorinated biphenyls. Integrated Environ Assess Manage 2008; 4(2):156–170. Mearns AJ, Reish DJ, Oshida PS, Buchman M, Ginn TC, Donnelly R. Effects of pollution on marine organisms. Water Environ Res 2007; 79(10):2102–2160. Becker DS, Long ER, Proctor DM, Ginn TC. Evaluation of potential toxicity and bioavailability of chromium in sediments associated with Chromite ore processing residue. Environ Toxicol Chem 2006; 25(10):2576–2583. Mearns AJ, Reish DJ, Oshida PS, Buchman M, Ginn TC. Effects of pollution on marine organisms. Water Environ Res 2006; 78(10):2033−2086. Sampson JR, Sexton JE, Ginn TC, Pastorok RA, Spielman A, Young DR, Taganov I. Content of metals and some organic contaminants in environmental media of Lake Baikal. Proc Russ Geogr Soc 2006; 1:52−58 (in Russian). Nielsen D, Ginn T, Ziccardi L, Boehm P. Study: Proposed offshore gulf LNG terminals will have minor effects on fish populations. Oil Gas J 2006; 104(28), July 28. Reish DJ, Oshida PS, Mearns AJ, Ginn TC, Buchman M. Effects of pollution on marine organisms. Water Environ Res 2005; 77(7):2733−2919. Dunford RW, Ginn TC, Desvousges WH. The use of habitat equivalency analysis in natural resource damage assessments. Ecol Econ 2004; 48(1):49–70. Reish DJ, Oshida PS, Mearns AJ, Ginn TC, Buchman M. Effects of pollution on marine organisms. Water Environ Res 2004; 76(7):2443.

Thomas C. Ginn, Ph.D. Page 3 10/10
Reish DJ, Oshida PS, Mearns AJ, Ginn TC, Buchman M. Effects of pollution on marine organisms. Water Environ Res 2003; 75, 63 pp. Reish DJ, Oshida PS, Mearns AJ, Ginn TC, Buchman M. Effects of pollution on marine organisms. Water Environ Res 2002; 74, 78 pp. Reish DJ, Oshida PS, Mearns AJ, Ginn TC, Buchman M. Effects of pollution on marine organisms. Water Environ Res 2001; 73, 77 pp. Reish DJ, Oshida PS, Mearns AJ, Ginn TC, Buchman M. Effects of pollution on marine organisms. Water Environ Res 2000; 72, 59 pp. Reish DJ, Oshida PS, Mearns AJ, Ginn TC, Buchman M. Effects of pollution on marine organisms. Water Environ Res 1999; 71(5):1100−1115. Reish DJ, Oshida PS, Mearns AJ, Ginn TC, Buchman M. Effects of pollution on saltwater organisms. Water Environ Res 1998; 70(4):931−949. Reish DJ, Oshida PS, Mearns AJ, Ginn TC, Godwin-Saad EM, Buchman M. Effects of pollution on saltwater organisms. Water Environ Res 1997; 69(4):877−892. Reish DJ, Oshida PS, Mearns AJ, Ginn TC. Effects of pollution on saltwater organisms. Water Environ Res 1996; 68(4):784−796. Becker DS, Ginn TC. Effects of storage time on toxicity of sediments from Puget Sound, Washington. Environ Toxicol Chem 1995; 14(5):829–835. La Tier AJ, Mulligan PI, Pastorok RA, Ginn TC. Bioaccumulation of trace elements and reproductive effects in deer mice (Peromyscus maniculatus). Proceedings, 12th Annual National Meeting of the American Society for Surface Mining and Reclamation, Gillette, WY, pp. 3–14, 1995. Pastorok RA, La Tier AJ, Butcher MK, Ginn TC. Mining-related trace elements in riparian food webs of the Upper Clark Fork River Basin. Proceedings, 12th Annual National Meeting of the American Society for Surface Mining and Reclamation, Gillette, WY, pp. 31–51, 1995. Pastorok RA, Butcher MK, Ginn TC. 1995. Thresholds for potential effects of mining-related trace elements on riparian plant communities. Proceedings, 12th Annual National Meeting of the American Society for Surface Mining and Reclamation, Gillette, WY, pp. 15–30, 1995. Reish DJ, Oshida PS, Mearns AJ, Ginn TC. Effects of pollution on saltwater organisms. Water Environ Res 1995; 67(4):718−731. Reish DJ, Oshida PS, Mearns AJ, Ginn TC. Effects of pollution on saltwater organisms. Water Environ Res 1994; 66(4):623−635.
Thomas C. Ginn, Ph.D. Page 4 10/10
Reish DJ, Oshida PS, Mearns AJ, Ginn TC. Effects of pollution on saltwater organisms. Res J Water Pollut Control Fed 1993; 65(4):573−585. Reish DJ, Oshida PS, Mearns AJ, Ginn TC. Effects of pollution on saltwater organisms. Res J Water Pollut Control Fed 1992; 64(4):599−610. Ginn TC, Pastorok RA. Assessment and management of contaminated sediments in Puget Sound. In: Sediment Toxicity Assessment. Burton GA (ed), Lewis Publishers, Inc., Boca Raton, FL, 1992. Johns DM, Pastorok RA, Ginn TC. A sublethal sediment toxicity test using juvenile Neanthes sp. (Polychaeta: Nereidae). In: Aquatic Toxicology and Risk Assessment: Fourteenth Volume. Mays MA, Barron MG (eds), ASTM STP 1124, American Society for Testing and Materials, Philadelphia, PA, pp. 280–283, 1992. Reish DJ, Oshida PS, Mearns AJ, Ginn TC. Fate and effects of pollutants: Effects on saltwater organisms. Res J Water Pollut Control Fed 1992; 62(4):577–593. Reish DJ, Oshida PS, Mearns AJ, Ginn TC. Effects on saltwater organisms. Res J Water Pollut Control Fed 1991; 63(4):696−709. Reish DJ, Oshida PS, Mearns AJ, Ginn TC. Effects on saltwater organisms. Res J Water Pollut Control Fed 1990; 62(4):577−593. Becker DS, Bilyard GR, Ginn TC. Comparisons between sediment bioassays and alterations of benthic macroinvertebrate assemblages at a marine Superfund site: Commencement Bay, Washington. Environ Toxicol Chem 1990; 9(5):669–685. Reish DJ, Oshida PS, Mearns AJ, Ginn TC. Effects on saltwater organisms. J Water Pollut Control Fed 1989; 61(6):1042−1054. Ginn TC. Assessment of contaminated sediments in Commencement Bay (Puget Sound, Washington). In: Contaminated Marine Sediments—Assessment and Remediation. National Academy Press, Washington, DC, pp. 425–439, 1989. Barrick RC, Beller H, Becker DS, Ginn TC. Use of the apparent effects threshold approach (AET) in classifying contaminated sediments. In: Contaminated Marine Sediments—Assessment and Remediation. National Academy Press, Washington, DC, pp. 64–77, 1989. Reish DJ, Oshida PS, Mearns AJ, Ginn TC. Effects on saltwater organisms. J Water Pollut Control Fed 1988; 60(6):1065−1077. Ginn TC, Barrick RC. Bioaccumulation of toxic substances in Puget Sound organisms. In: Oceanic Processes in Marine Pollution, Volume 5. Wolfe DA and O’Connor TP (eds). Robert E. Krieger Pub. Co, Malabar, FL, pp. 157–168, 1988.

Thomas C. Ginn, Ph.D. Page 5 10/10
Barrick RC, Pastorok R, Beller H, Ginn T. Use of sediment quality values to assess sediment contamination and potential remedial actions in Puget Sound. Proceedings, 1st Annual Meeting on Puget Sound Research, Volume 2. Puget Sound Water Quality Authority, Seattle, WA, pp. 667–675, 1988. Becker DS, Ginn TC, Bilyard GR. Field validation of sediment bioassays at a marine Superfund site: Commencement Bay, Washington. In: Superfund ‘88, Proceedings, 9th National Conference, Hazardous Materials Control Research Institute, Silver Spring, MD, pp. 323–328, 1988. Jacobs LA, Barrick R, Ginn T. Application of a mathematical model (SEDCAM) to evaluate the effects of source control or sediment coordination in Commencement Bay. Proceedings, 1st Annual Meeting on Puget Sound Research, Puget Sound Water Quality Authority, Seattle, WA, pp. 677–684, 1988. Reish DJ, Oshida PS, Mearns AJ, Ginn TC. Effects on saltwater organisms. J Water Pollut Control Fed 1987; 59(6):572−586. Becker DS, Ginn TC, Landolt ML. Powell DB. Hepatic lesions in English sole (Parophrys vetulus) from Commencement Bay, Washington (USA). Mar Env Res 1987; 23:153−173. Reish DJ, Oshida PS, Mearns AJ, Ginn TC. Effects on saltwater organisms. J Water Pollut Control Fed 1986; 58(6):671−680. Williams LG, Chapman PM, Ginn TC. A comparative evaluation of marine sediment toxicity using bacterial luminescence, oyster embryo and amphipod sediment bioassays. Mar Env Res 1986; 19:225–249. Reish DJ, Oshida PS, Mearns AJ, Ginn TC, Carr RS, Wilkes FG, Butowski N. Effects on saltwater organisms. J Water Pollut Control Fed 1985; 57(6):699−712. Reish DJ, Oshida PS, Wilkes FG, Mearns AJ, Ginn TC, Carr RS. Effects on saltwater organisms. J Water Pollut Control Fed 1984; 56(6):759−774. Reish DJ, Geesey GG, Wilkes FG, Oshida PS, Mearns AJ, Rossi SS, Ginn TC. Marine and estuarine pollution. J Water Pollut Control Fed 1983; 55(6):767−787. Reish DJ, Geesey GG, Wilkes FG, Oshida PS, Mearns AJ, Rossi SS, Ginn TC. Marine and estuarine pollution. J Water Pollut Control Fed 1982; 54(6):786−812. Poje GV, O’Connor JM, Ginn TC. Physical simulation of power plant condenser tube passage. Water Res 1982; 16(6):921–928. Reish DJ, Geesey GG, Oshida PS, Wilkes FG, Mearns AJ, Rossi SS, Ginn TC. Marine and estuarine pollution. J Water Pollut Control Fed 1981; 53(6):925−949.
Thomas C. Ginn, Ph.D. Page 6 10/10
Grieb TM, Porcella DB, Ginn TC, Lorenzen MW. Classification and analysis of cooling impoundments: an assessment methodology using fish standing crop data. Proceedings, Symposium on Surface Water Impoundments. American Society of Civil Engineering, Washington, DC, pp. 482−494, 1981. Pastorok RA, Lorenzen MW, Ginn TC. Aeration/circulation as a control of algal production. Proceedings, Workshop on Algal Management and Control. Technical Report E-817. U.S. Army Corps of Engineers, Waterways Experiment Station, Vicksburg, MS, pp. 57–97, 1981. Pastorok RA, Ginn TC, Lorenzen MW. Evaluation of aeration/circulation as a lake restoration technique. Ecological Research Series, EPA-600/3-81/014. U.S. Environmental Protection Agency, Corvallis, OR, 1981. Pastorok RA, Ginn TC, Lorenzen MW. Review of aeration/circulation for lake management. In: Restoration of Lakes and Inland Waters. EPA-440/5-81/010. U.S. Environmental Protection Agency, Washington, DC, pp. 124–133, 1980. Ginn TC, O’Connor JM. Response of the estuarine amphipod Gammarus daiberi to chlorinated power plant effluent. Estuarine Coastal Mar Sci 1978; 6(5):459–469. Haven KF, Ginn TC. A mathematical model of the interactions of an aquatic ecosystem and a thermal power station cooling system. Proceedings, 4th National Workshop on Entrainment and Impingement. Jensen LD (ed). E.A. Communications, Melville, NY, pp. 321–344, 1978. Poje GV, Ginn TC, O’Connor JM. Responses of ichthyoplankton to stresses simulating passage through a power plant condenser tube. In: Energy and Environmental Stress in Aquatic Systems. J.H. Thorp and J.W. Gibbons (eds.). U.S. Department of Energy, Technical Information Center, Washington, DC, pp. 794–808, 1978. Ginn TC, Waller WT, Lauer GL. Survival and reproduction of Gammarus spp. (Amphipoda) following short-term exposure to elevated temperature. Chesapeake Sci 1976; 17(1):8–14. Ginn TC, Waller WT, Lauer GL. The effects of power plant condenser cooling water entrainment on the amphipod, Gammarus sp. Water Res 1974; 8(11):937–945. Ginn TC, Bond CE. Occurrence of the cutfin poacher, Xeneretmus leiops, on the continental shelf off the Columbia River mouth. Copeia 1973; 4:814–815. Selected Project Experience Natural Resource Damage Assessments Illinois River and Lake Tenkiller (Oklahoma). Assessment of the status of benthic macroinvertebrates and fishes in the aquatic environment and relationships of biotic characteristics to habitat factors and potential effects of poultry operations. Expert witness in the case.

Thomas C. Ginn, Ph.D. Page 7 10/10
Bayway and Bayonne Refineries (New Jersey). Evaluation of marine, wetland, and terrestrial communities at the refinery sites. Expert witness in the case. Tittabawassee and Saginaw River/Bay (Michigan). Assessment of potential injuries to aquatic and terrestrial resources caused by releases of dioxins/furans and other substances. Negotiations with state, tribal, and federal trustees. Pine Bend Refinery (Minnesota). Key issues involve injuries to groundwater, surface water, and wetland resources resulting from releases of petroleum products. Negotiations with state and federal trustees. FAG Bearing site (Missouri). The claim focused on potential injuries to groundwater resources and federally-listed aquatic species resulting from releases of trichloroethene. Negotiation with trustees and successful settlement. Ohio River (Ohio and West Virginia). Claim related to alleged releases of carbamate-metal complexes from a manganese smelter at Marrietta. Key issues involve the causes of mortalities in populations of freshwater mussels and fishes and restoration alternatives for important species. Negotiations with state and federal trustees and deposition. Ashtabula River/Harbor site (Ohio). Key issues include potential effects of PCBs and PAH on fishes and invertebrates in the harbor ecosystem. White River (Indiana). Alleged injuries included a major fish kill associated with releases of carbamate-metal complexes from an industrial facility. Participant in technical negotiations with state and federal trustees. Koppers site in Charleston Harbor (South Carolina). Assessment of PAH and metals in the estuarine environment and development of restoration alternatives. Negotiations with state and federal trustees. Coeur d’Alene River (Idaho). Provided expert testimony concerning potential injuries caused by metals at deposition and trial (U.S. v. Asarco et al). Saginaw River/Bay (Michigan). Key issues involve bioaccumulation and effects of PCBs in fishes, aquatic birds, and terrestrial wildlife. Participated in settlement negotiations with state and federal trustees. Three industrial sites on the St. Lawrence River (New York). Negotiations with federal, state, and tribal trustees on injuries related to PCBs and PAH and identification of restoration alternatives. Duwamish River (Washington). Claim related to releases of PCBs in the estuarine environment and potential injuries to fish, benthic, and bird resources. Participated in settlement negotiations with state, federal, and tribal trustees.
Thomas C. Ginn, Ph.D. Page 8 10/10
Clark Fork Basin Superfund complex (Montana). Served as technical lead for PRP negotiations with the trustee and developed supporting scientific reports. Provided testimony at trial in areas of water quality, sediments, and ecosystem-level effects of metals for terrestrial environments. SMC Cambridge site (Ohio). Technical review and response to a natural resource damage claim associated with metals injuries to wetland resources. Participated in settlement negotiations with state and federal trustees. Pools Prairie Superfund site (Missouri). Key issues include groundwater injuries and potential effects on a federally listed species. Koppers site in Texarkana (Texas). Assessment of aquatic injuries and developed restoration settlement package for client. Leader of technical negotiations with state and federal trustees. SMC Newfield site (New Jersey). Conducted technical review and response to a natural resource damage claim for groundwater resources at the. Participated in settlement negotiations with the state trustee. Ecological Risk Assessments NASSCO Shipyard (California). Expert and mediation support to resolve sediment remediation issues in response to a cleanup and abatement order. Issues involved the amount of dredging and other remediation required to reduce aquatic and human health risks at the site and the scope of post-remedial monitoring. San Diego Bay Shipyard sites (California). Studies of sediment contamination and ecological risks of metals (e.g., copper, zinc, and butyltins) and organic substances (PAH and PCBs) at two major shipyards. Site-specific studies included sediment triad assessment and sampling of resident biota for bioaccumulation and histopathology analyses. Hudson River (New York). Studies and agency presentations to support ecological risk assessment for the upper Hudson River. Technical leader for studies of the effects of PCBs on fishes, invertebrates, mammals, and birds of the upper Hudson River. National Zinc site (Oklahoma). Participated in agency negotiations on RI/FS implementation. Assessed effects of metals on aquatic and terrestrial biota. Lake Apopka (Florida). Ecotoxicological investigation of large-scale avian mortality at restored wetland habitats near the lake. The specific objective is to determine whether organochlorine pesticides or some other environmental factor was the causal agent of the mortalities. Shelter Island Boatyard (California). Principal investigator for field and laboratory studies and an assessment of sediment cleanup levels for copper, mercury, and butyltin near a commercial marine maintenance operation in San Diego Bay, California.

Thomas C. Ginn, Ph.D. Page 9 10/10
PCB sites in Southeast. Principal-in-charge for ecological risk assessments conducted at several natural gas pipeline compressor stations located throughout the southeastern U.S. Led technical negotiations with EPA concerning the scope and interpretation of studies assessing risk of PCBs to aquatic and terrestrial biota. Clark Fork River (Montana). Managed integrated ecological risk assessment studies at the Clark Fork River, Montana, Superfund site. Assessed the bioavailability and effects of metals in aquatic and terrestrial food chains. Chikaskia River (Oklahoma). Managed field and laboratory studies of the effects of cadmium and the development of site-specific water quality criteria using the water effect ratio approach. Campbell Shipyard (California). Directed an investigation of sediment chemical levels, biological effects, and human health risks at a major shipyard facility in San Diego Bay, California. Commencement Bay Superfund Site (Washington). Managed RI/FS that included extensive field sampling of sediments and biota, assessing effects of toxic substances, assessing health risks, and identifying pollutant sources. Puget Sound Estuary Program (Washington). Managed a multiyear, comprehensive field and laboratory investigation of the effects of chemicals in various sub-areas of Puget Sound. The study included numerous projects involving field and laboratory analyses, assessment of pollutant sources, assessments of human health and ecological risks, and development of sampling and analytical protocols. Sewage Discharges (Alaska). Managed field and laboratory studies of benthic macroinvertebrates, bioaccumulation, and water quality at three sewage outfalls in southeastern Alaska. Bering Sea (Alaska). Conducted study design, statistical analysis, and interpretation of results for a field study investigating the effects of commercial harvesting operations on surf clams and other invertebrates. Poplar River (Montana). Managed a risk assessment for water quality, air quality, and socioeconomic impacts of a coal-fired power plant in the Poplar River basin in Montana. Managed an EIS for river flow apportionment alternatives and atmospheric emissions from the plant. Klamath Lake (Oregon). Managed a project to evaluate water quality effects on fish populations in the Klamath River basin and to develop a modeling approach to assess the effects of flow apportionment alternatives on water quality and fish habitat. Puget Sound (Washington). Project manager for an assessment of potential biological effects caused by the release of dichloromethane from an industrial facility. Prepared expert report for use in litigation.
Thomas C. Ginn, Ph.D. Page 10 10/10
Regulatory Programs Project manager for technical support activities for EPA’s Office of Marine and Estuarine Protection. Supervised data management, development of technical guidance, estuarine program support, monitoring program design, bioaccumulation analyses, and quality assurance reviews. Served as one member of the five-member Technical Review Panel for the Long-Term Management Strategy for San Francisco Bay. The panel provided critical outside technical review of the program’s conceptual approach, scientific rigor, and technical findings. Specifically assigned to sediment toxicology aspects. Manager for a comprehensive review by EPA of sediment toxicity test methods and development of a resource document that is used to select appropriate test methods for use in NPDES monitoring programs at industrial facilities. Served as a member of a six-member Biological Resource Assessment Group for New York Harbor. Specifically assigned as an expert in chemical contaminants in sediments and bioaccumulation. For EPA multi-year project, served as chief biologist for technical evaluation of Clean Water Act Section 301(h) applications for permit modifications at marine sewage discharge sites throughout the United States. Provided technical support to the Oklahoma Water Resources Board for the development of site-specific water quality criteria for metals. For the Army Corps of Engineers, served as principal-in-charge for Puget Sound Dredged Disposal Analysis Phase I and II baseline biological surveys at dredged material disposal sites in Puget Sound, Washington. Served on the Technical Advisory Committee for the Puget Sound Estuary Program. The committee provided technical review and program guidance to the various sponsoring agencies. Other Water Quality Studies Served as principal investigator and expert witness for an assessment of benthic biological effects and sediment chemical levels near the Pt. Loma, California, sewage discharge. Assessment of the effects of offshore LNG terminals in the Gulf of Mexico on fish populations. Evaluated effects of fish egg and larvae entrainment of key species in proposed facilities at various locations. Conducted a comprehensive assessment of bioaccumulation of inorganic and organic substances in marine organisms in the Southern California Bight.

Thomas C. Ginn, Ph.D. Page 11 10/10
Directed a comprehensive review and evaluation of the biological impacts of oil spill cleanup operations on marine ecosystems. Conducted an evaluation of the role of soil and water bioassays for assessing biological effects of hazardous waste sites. Principal investigator to evaluate the biological impacts of ocean disposal of manganese nodule processing wastes. Managed a project to evaluate available cause and effect data and models to predict water quality and biological impacts for Puget Sound, Washington. Developed the biological components of an ecosystem model to evaluate effects of multiple power plant discharges on a single water body. Managed statistical analyses of benthic infauna data collected near the Waterflood Causeway in the Beaufort Sea. Project co-manager and principal investigator for a review and analysis of biological impact data for all currently operating coastal power plants in the United States. Principal scientist to evaluate responses of benthic invertebrates and fishes to lake aeration and circulation projects. Principal scientist for a comprehensive limnological evaluation of the Lafayette Reservoir in California. Evaluated the responses of benthic invertebrates and fishes to lake aeration and circulation programs and developed recommendations for applicable lake restoration techniques. Principal investigator in analyzing water quality conditions at a hypereutrophic lake and conducting public workshops on alternative restoration measures. Developed a method of predicting biological responses of new cooling lakes based on a deterministic ecosystem model and empirical fish production models. Conducted field and laboratory investigations of the effects of power plant entrainment on macroinvertebrates in the Hudson River estuary. Determined relationship of entrainment effects to populations in the lower estuary. Managed laboratory bioassay studies evaluating the combined effects of temperature, chlorine, and physical stress on estuarine ichthyoplankton and zooplankton.

Thomas C. Ginn, Ph.D. Page 12 10/10
Professional Affiliations
• Society of Environmental Toxicology and Chemistry • American Chemical Society • American Institute of Fishery Research Biologists
Depositions The Quapaw Tribe of Oklahoma et al. v. Blue Tee Corp, et al., United States District Court, Northern District of Oklahoma, Case No. 03-CV-0846-CVE-PJC, deposition 2010. Moraine Properties, LLC v. Ethyl Corporation, United States District Court, Southern District of Ohio, Civil Action No. 3:07-cv-00229, deposition 2010. State of Oklahoma et al. v. Tyson Foods, Inc, et al., United States District Court for the Northern District of Oklahoma, Civil Action Number 4:05-CV-00329-TCK-SAJ, deposition 2009. New Jersey Department of Environmental Protection and Administrator, New Jersey Spill Compensation Fund v. Exxon Mobil Corporation, Superior Court of New Jersey, Law Division/Union County, DOCKET NO. L-3026-04, deposition 2008. United States of America, The State of West Virginia, and The State of Ohio v. Elkem Metals Co. L.P., Ferro Invest III Inc., Ferro Invest II Inc., and Eramet Marietta Inc, United States District Court, Southern District of Ohio, Eastern Division, Case No. 2:03 CV 528, deposition 2005. United States of America v. Asarco Incorporated et al., United States District Court for the District of Idaho, Case No. CV-96-0122-N-EVL, deposition, 2000. State of Montana v. Atlantic Richfield Company, United States District Court for the District of Montana, Case No. CV-83-317-HLN-PGH, deposition, 1996. Aluminum Company of America and Northwest Alloys, Inc. v. Accident and Casualty Insurance Company, et al, Superior Court of the State of Washington, King County, Case No. 92-2-28065-5, depositions 1995, 1996. Asarco v. American Home Insurance Company, et al., Superior Court of the State of Washington, King County, Case No. 90-2-23560-2, deposition 1993. U.S. v. City of San Diego, United States District Court, Southern District of California, Case No. 88-1101-B, depositions 1991, 1993.

Thomas C. Ginn, Ph.D. Page 13 10/10
Trials and Arbitrations United States of America v. Asarco Incorporated et al., United States District Court for the District of Idaho, Case No. CV-96-0122-N-EVL, testimony at trial, 2001. State of Montana v. Atlantic Richfield Company, United States District Court for the District of Montana, Case No. CV-83-317-HLN-PGH, testimony at trial 1997 (aquatic and terrestrial phases of the trial). U.S. v. City of San Diego, United States District Court, Southern District of California, Case No. 88-1101-B, deposition, testimony at trial 1991, testimony at motion hearing 1994.