Embed Size (px)
Citation preview
.
Paper Number: 2020_03
Evaluation of Corrosion Status in a Western Canadian Oil Transmission Pipeline
Yliana S. Baron Gavidia, Ph.D.
Engineer-in-Training, APEGS
Saskatoon, SK – Canada
Email: [email protected]
Abstract This paper evaluates the corrosion status of a Western Canadian oil transmission pipeline using 50 Key
Performance Indicators (KPI). The risk score of the pipeline was approximately 40% whereas the
integrity score was approximately 60%. Implementation of additional monitoring techniques will
provide better monitoring of corrosion control strategies and will increase the integrity of the pipeline.
1. INTRODUCTION
According to Natural Resources Canada, the current pipeline inventory in the country is approximately
825,000 km of pipelines; of which approximately 100,000 km are transmission pipelines [1].
Transmission pipelines are used to move crude oil and natural gas across provincial or international
borders [2]. Figure 1 shows the main pipelines carrying oil across Western Canada.
Canadian pipelines are regulated. The federal government regulates most of the large transmission
pipelines (crossing provinces or countries) through the Canada Energy Regulator (CER), formerly
National Energy Board (NEB). The pipelines within a province are regulated provincially.
Pipelines may suffer from internal and external corrosion. Canadian pipelines are externally protected
with plant-applied coating which are applied under controlled conditions, but coatings on field welds
are applied under variable and adverse conditions. Cathodic protection is a common mitigation
technique used to reduce the corrosion rate of coated steel from pipelines [3, 4].
An analysis of the 46 ruptures occurred on the federally regulated pipelines from 1984 to 2003 showed
that external corrosion (some leading to rupture) caused 48% [5]. Data analyzed by the NEB, from the
2000-2008 period, showed that 38% of pipelines failures are associated to stress corrosion cracking,
while 25% of failures are associated to internal/external corrosion [6].

FIGURE 1. Oil pipelines across Western Canada [7]
This paper evaluates corrosion characteristics of an oil transmission pipeline located in Western
Canada using 50 Key Performance Indicators (KPI). The pipeline was constructed in January 2000 and
for the purpose of writing this paper, the analysis was performed on how the pipeline’s corrosion would
need to be managed from June 2020 until December 2025.
Table 1 presents the evaluation criteria on status of implementation of each KPI as well as the
corresponding color code.
Table 1: Status of Implementation
Status of implementation Score Color Code
Analysis is not done Grey
Not relevant 0 Blue
Accounted for adequately 1 Green
Accounted for inadequately 2 Yellowish Green
Accounted for inadequately 3 Yellow
Not adequately accounted for 4 Orange
Not adequately accounted for 5 Red
2. CONTEXT OF CORROSION CONTROL
BC AB SK MB

KPI 1: Segmentation of Infrastructure
For the effects of corrosion management, a fixed superficial area would be considered. The superficial
area of the pipeline considered in this paper is less than 1 km2 (see equation 1), therefore a score of 1 was
assigned for KPI 1 [8].
𝑆𝑢𝑟𝑓𝑎𝑐𝑒 𝑎𝑟𝑒𝑎 = (2𝜋𝑟𝑖𝑛𝑛𝑒𝑟𝐿) + (2𝜋𝑟𝑜𝑢𝑡𝑒𝑟𝐿)
=2𝜋(893.98𝑚𝑚)(161.5𝑘𝑚)
2+
2𝜋(914.4𝑚𝑚)(161.5𝑘𝑚)
2= 0.91𝑘𝑚2 𝐸𝑞. 1
KPI 2: Corrosion Risk
The internal corrosion mechanism and rate was simulated using the iFILMS™ software. The main
findings were a high un-mitigated pitting corrosion rate (1.26mm/y), a small remaining wall thickness
(3.91mm) and 0 years to fail. In this way, the risk of corrosion is high (KPI score 4) unless some
repair/mitigation methods are implemented to extend the lifetime of the pipeline.
KPI 3: Location of Infrastructure
The transmission pipelines run through rich natural environments, across sensitive lands and close to
populated cities [9]. Therefore, the consequence of a failure would be high and a score of 4 was
assigned.
KPI 4: Quantification of risk
The overall risk (KPI 2 times KPI 3) for corrosion is high and the pipeline will fail if no mitigation
techniques are implemented. In this way, a high score (4) was assigned.
KPI 5: Life of Infrastructure
The pipeline is going to be managed from June 2020 to December 2025. In this way, the remaining life
of the pipeline is around 5 years. Therefore, a KPI score of 2 was assigned.
Table 2 summarizes the score assigned to KPIs 1 to 5.
TABLE 2: Summary of KPI for Corrosion Control Context
KPI KPI Name Score Rationale for KPI Score
1 Segmentation of
Infrastructure 1
Segmentation is quantitative, logic, and covers entire
pipeline length
2 Corrosion Risk 4 Corrosion risk is high
3 Location of Infrastructure 4 Consequence of failure is high
4 Overall Corrosion Risk 4 Overall risk from corrosion is high
5 Remaining life of the
Infrastructure 2 Life is between 5 to 10 years

3. INTERNAL CORROSION – MODEL
KPI 6: Materials of Construction
The pipeline was constructed using steel API 5L X70 (Initial pipe diameter was 914.40mm, initial wall
thickness was 10.20mm) that can suffer corrosion when exposed to water and CO2 if not protected,
therefore a KPI score of 3 was assigned.
KPI 7: Corrosion Allowance
According to the iFILMS™ results, the un-mitigated corrosion rate is 1.26mm/y. Then, the un-
mitigated corrosion rate times the anticipated lifetime (5 years) is more than the corrosion allowance or
remaining wall thickness. In this way, mitigation is required.
Several scenarios were analyzed with iFILMS™ and the corrosion rate was estimated for different
mitigation techniques: corrosion inhibitor (99% availability), corrosion inhibitor (99% effectiveness),
batch inhibitor, pigging, and internal coating. Based on the remaining wall thickness (3.91mm) and the
anticipated lifetime, a “maximum” corrosion rate was calculated (0.78mm/y), and a safety factor of 0.5
was applied. Then, all the mitigation techniques with a pitting corrosion rate over 4mm/y were
eliminated as possible candidates, and only 2 viable mitigation methods remain. Both methods include
annual cleaning pigging and the installation of an internal coating as soon as possible, for an 85%
reduction of the corrosion rate (Figure 2). The rate reduction can be extended to 95% when the
proposed mitigation method is combined with monthly batch inhibitor. But in order to reduce costs,
this method was discarded as an option.
In this way, the use of an internal coating plus annual pigging gives the best option for mitigating the
corrosion of the pipeline. The mitigated corrosion rate (0.20 mm/y) times the anticipated life is less
than the corrosion allowance, and therefore a KPI score of 2 was assigned.
FIGURE 2. Best conditions – iFILMS™ scenarios

KPI 8: Normal operating conditions
Operating conditions are expected to be within the range established for the entire duration of the
project. Therefore, the KPI score of 1 was assigned.
KPI 9: Upset Conditions in the Upstream Segment on the Current Sector
Because adequate information was not available a high-risk score of 5 was assigned for this KPI.
KPI 10: Upset Conditions in the Current Sector on the Downstream Sector
Because adequate information was not available a high-risk score of 5 was assigned for this KPI.
KPI 11: Mechanism of Corrosion
The corrosion mechanism affecting the pipeline was stablished using iFILMS™. Top of line corrosion,
microbiologically influenced corrosion (MIC), and under deposit corrosion can occur in critical areas
of the pipeline. These critical areas correspond to a change in the inclination of the pipeline and the
possibility of having bubble flow. In non-critical areas, there is stratified flow and the un-mitigated
corrosion rate is 0mm/y. A low KPI score of 1 was assigned as the corrosion mechanisms are
considered and determined.
KPI 12: Maximum Corrosion Rate
As stated before, the maximum corrosion rate is based on iFILMS. Therefore, a low KPI score of 1 was
assigned.
KPI 14: Installation of Proper Accessories
The selected corrosion control practices were assumed to be supervised by a corrosion professional to
ensure the proper installation of accessories (pig launcher, pig receiver, rectifier, corrosion monitoring
coupons and probes). Therefore, a low KPI score of 1 was assigned.
KPI 39: Internal Corrosion Rate after Maintenance Activities
Based on the information received from the instructor of the course, the pitting corrosion rate after
maintenance of the pipeline is 0.06mm/y in critical areas (lower than before maintenance), thus a low
KPI score of 1 was assigned.
KPI 40: Percentage Difference Between Internal Corrosion Rate Before and After Maintenance
Activities
Based on the information received from the instructor of the course, the corrosion rate is reduced in 90%
after maintenance. Therefore, a low KPI score of 1 was assigned.
Table 3 summarizes the KPIs associated with the internal corrosion model.

TABLE 3. Summary of KPI for Internal Corrosion Model
KPI KPI Name Score Rationale for KPI Score
6 Material of Construction –
Internal 3
Material selection not based on corrosion consideration,
but the material is compatible in the environment with
appropriate corrosion control measures
7 Corrosion Allowance 2 Corrosion allowance is slightly more than mitigated
corrosion rate times anticipated life
8 Normal Operating
Conditions 1
Operating conditions within the range established for
the entire duration of the project
9 Upset Conditions in the
Upstream Segment 5
Potential influence of upset conditions upstream is not
understood and no communication plan is in place to
obtain information on upset conditions
10 Upset Conditions 5
Potential influence of upset conditions on downstream is
not understood and no communication plan is in place to
obtain information on upset conditions
11 Corrosion Damage
Mechanisms 1
All corrosion damage mechanisms are considered and
most prominent ones determined
12 Maximum Internal
Corrosion Rate 1
Maximum corrosion rate is based on all corrosion
damage mechanisms (CDM)
14 Installation of Accessories 1
Corrosion professionals are involved during
construction and the accessories for implementing
mitigation, monitoring, and maintenance activities are
properly installed
15 Commissioning 1
Infrastructure is properly hydrotested and the water used
in the hydrotest properly is completely removed,
baseline conditions (e.g., inline inspection, CP current
demand) are established to ensure that the corrosion rate
is and will remain at the predicted rate, and all data from
the design stage are collected and properly stored in the
database for future use
39 Internal Corrosion Rate
after Maintenance
Activities
1 Corrosion rate after the maintenance activities is lower
than the corrosion rate before maintenance activities
40
Percentage Difference in
Internal Corrosion Rate
Before and After
Maintenance
1 Corrosion rate before the maintenance activities is
within 10% of the corrosion rate established in KPI 27.
4. INTERNAL CORROSION – MITIGATION
KPI 16: Mitigation to Control Internal Corrosion
The use of mitigation strategies to control corrosion is required. After analyzing different scenarios
with iFILMS™, the use of an internal coating plus annual pigging gives the best option for mitigating
the corrosion of the pipeline. Therefore, the KPI score of 3 was assigned.

KPI 17: Mitigation Strategies to Control Internal Corrosion
The mitigation strategies were selected based on the operations of the pipeline and a KPI score of 3 was
assigned.
KPI 18: Mitigated Internal Corrosion Rate
The mitigated internal corrosion rate is based on the assumption that the mitigation practices will keep
the corrosion rate low, as stablished in KPI 12 and KPI 17. Therefor a KPI score of 1 was assigned.
KPI 19: Effectiveness of the Internal Corrosion Mitigation Strategy
It is assumed that the mitigation strategy is available and effective 100% of the time (internal coating),
which is reinforced by yearly pigging to avoid the formation of deposits and minimize MIC. Therefor a
KPI score of 1 was assigned.
Table 4 summarizes KPIs 16 to 19.
TABLE 4. Summary of KPI for Internal Corrosion - Mitigation
KPI KPI Name Score Rationale for KPI Score
16 Internal Corrosion
Mitigation 3
Yes. Based on some analysis performed at the
conceptual and design stages
17
Types of Internal
Corrosion Mitigation
Strategies
3
Mitigation strategy is standardized by trial and error
method under the operating conditions and is proven to
be effective
18 Targeted Mitigated
Internal Corrosion Rate 1
Mitigated corrosion rate is based on baseline corrosion
rate (established as per KPIs 12 and 17) and efficiency
of mitigation strategy
19
Internal Corrosion
Mitigation Strategy
Effectiveness
1
Mitigation practices are implemented (e.g., corrosion
inhibitor is available) slightly more than 99% of the
time
5. INTERNAL CORROSION – MONITORING
KPI 24: Internal Corrosion Monitoring Techniques
It is proposed the use of smart pig (UT) with capability to monitor both internal and external corrosion.
Additionally, the use of coupons to monitor internal corrosion of the pipeline is recommended [10].
Therefor, a low KPI score of 1 was assigned.
KPI 25: Number of probes to monitor internal corrosion
The number of probes is considered to be covering most of the critical areas. Therefore, a KPI score of
3 was assigned.
KPI 26: Internal Corrosion Rates
The corrosion rate from the monitoring technique was not available by the time this report was
produced, so this activity was not analyzed.

KPI 27: Accuracy of Internal Corrosion Monitoring Techniques
This activity was not analyzed.
KPI 32: Frequency of Inspection
This activity was not analyzed.
KPI 33: Percentage difference between internal corrosion rates from monitoring and inspection
techniques
This activity was not analyzed.
Table 5 summarizes the KPIs 24 and 25. KPIs 26, 27, 32 and 33 were not analyzed and are not shown in
the table.
TABLE 5 Summary of KPI for Internal Corrosion - Monitoring
KPI KPI Name Score Rationale for KPI Score
24 Internal Corrosion
Monitoring Techniques 1
Two or slightly more complimentary techniques that
are proven to be effective in monitoring the corrosion
damage mechanism occurring in the segment are used
25 Number of Internal
Corrosion Monitoring
Probes
3 Number of working probes just enough to cover most
critical areas
6. EXTERNAL CORROSION – MITIGATION
KPI 20: Selection of Mitigation to control external corrosion
The pipeline analyzed in this paper was protected with FBE external coating and liquid epoxy applied
over girth welds. The pipeline was analyzed with the software Expedition™ to determine the main
corrosion mechanism and remaining lifetime. The main findings are that the corrosion rate is low
(0.11mm/y) which gives over 30 years of service. The main corrosion damage is weld zone corrosion
and the main coating damage modes includes blistering, disbondment, and dissolution. In this way,
controlling the damage of the coating is a key factor to control corrosion, and adding cathodic
protection would protect the steel substrate in the event that the coating is damaged or degraded.
Therefore, the KPI score assigned was 2.
KPI 21: Implementation of Mitigation strategies to control external corrosion
Cathodic protection is a common mitigation technique used to reduce the corrosion rate of coated steel
from pipelines. When design adequately, it has high effectiveness. But coating disbondment must be
monitored as it reduces the cathodic protection effectiveness [10, 11]. Therefore, the KPI score
assigned was 3.
KPI 22: Mitigated external corrosion rate, target
The mitigated corrosion rate was evaluated using Expedition. Effectiveness of the mitigation strategy
was assumed. Therefore, a low KPI score of 1 was assigned.
KPI 23: Effectiveness of external corrosion mitigation strategy
It is assumed that the mitigation strategy is going to be available more than 99% of the time, thus a low
KPI score of 1 was assigned.

Table 6 summarizes KPIs scores 20 to 23.
TABLE 6 Summary of KPI for External Corrosion - Mitigation
KPI KPI Name Score Rationale for KPI Score
20 External Corrosion –
Mitigation 2
Yes. Based on the analysis performed at the conceptual
and design stages
21 Types of External
Mitigation strategies 3
Mitigation strategy is standardized by trial and error
method under the operating conditions and is proven to
be effective
22 Targeted Mitigated
Corrosion Rate 1
Mitigated corrosion rate is based on baseline corrosion
rate (established as per KPIs 12 and 17) and efficiency
of mitigation strategy
23 External Mitigation
Strategy Effectiveness 1
Mitigation practices are implemented (e.g., Cathodic
protection is available) slightly more than 99% of the
time
7. EXTERNAL CORROSION – MODEL
KPI 6 EC (External corrosion): Material of Construction
The use of a coated steel for the construction of pipelines is based on external corrosion consideration,
then a low KPI score of 1 was assigned.
KPI 7 EC: Corrosion Allowance
According to the scenarios analyzed using Expedition, the corrosion allowance of the coated pipeline
(without cathodic protection) is more than the corrosion rate times the anticipated life of the pipeline,
which gives more than 30 years of remaining life. In this case, the cathodic protection is used to protect
the substrate in case of coating damage. Therefore, the KPI score assigned was 1.
KPI 9 EC: Upset conditions in the upstream segment
See KPI 9 (Internal corrosion).
KPI 10 EC: Upset conditions in the downstream segment
See KPI 10 (Internal corrosion).
KPI 11 EC: Mechanisms of corrosion
According to the Expedition™ results, the main corrosion damage is weld-zone corrosion and the main
coating damage modes includes blistering, disbondment, and dissolution. The probability of corrosion
is low. Therefore, the a low KPI score of 1 was assigned.
KPI 13: Maximum corrosion rate (External surfaces)
The maximum corrosion rate (0.11mm/y, over 30 years of remaining lifetime) is based on simulations
done using Expedition, therefore a low KPI score of 1 was assigned.

KPI 14 EC: Installation of proper accessories
See KPI 14 (Internal corrosion)
KPI 41: External corrosion rate after maintenance activities
According to the information received, the corrosion rate after maintenance is similar to the
unmitigated corrosion rate. Therefore, a KPI score of 2 was assigned.
KPI 42: Percentage difference between external corrosion rate before and after maintenance
activity
According to the information received, the corrosion rate after maintenance was within 10% before
maintenance. Therefore, a KPI score of 1 was assigned.
Table 7 summarizes the KPIs 6, 7, 9 to 11, 13, 14, 41 and 42.
TABLE 7 Summary of KPI for External Corrosion - Model
KPI KPI Name Score Rationale for KPI Score
6 Material of Construction –
External 1
Material selected solely based on corrosion
consideration
7 Corrosion Allowance 1 Corrosion allowance is slightly more than corrosion
rate times anticipated life
9 Upset Conditions in the
Upstream Segment 5
Potential influence of upset conditions upstream is not
understood and no communication plan is in place to
obtain information on upset conditions
10 Upset Conditions 5
Potential influence of upset conditions on downstream
is not understood and no communication plan is in
place to obtain information on upset conditions
11 Corrosion Damage
Mechanisms 1
All corrosion damage mechanisms are considered and
most prominent ones determined
13 Maximum External
Corrosion Rate 1
Maximum corrosion rate is based on model, laboratory
experiment, simulation, or documented lar field
experience
14 Installation of Accessories 1
Corrosion professionals are involved during
construction and the accessories for implementing
mitigation, monitoring, and maintenance activities are
properly installed
41 External Corrosion Rate
after Maintenance
Activities
2 Corrosion rate after the maintenance activities is same
as that before maintenance activities
42
Percentage Difference in
External Corrosion Rate
Before and After
Maintenance
1 Corrosion rate before the maintenance activities is
within 10% of the corrosion rate established in KPI 31

8. EXTERNAL CORROSION – MONITORING
KPI 28: External corrosion monitoring techniques
It is proposed the use of smart pig (UT) with capability to monitor both internal and external corrosion
[12]. But no additional method for monitoring the external technique is in use. Therefore, a KPI score
of 3 was assigned.
KPI 29: Number of probes to monitor external corrosion
This activity was not analyzed.
KPI 30: External corrosion rate from monitoring technique
The corrosion rate from the monitoring technique was not available by the time this paper was
produced, so this activity was not analyzed.
KPI 31: Accuracy of external corrosion monitoring techniques
This activity was not analyzed.
KPI 32 EC: Frequency of inspection
This activity was not analyzed.
KPI 34: Comparison between Inspection and Monitoring for External Corrosion
This activity was not analyzed.
Table 8 summarizes the KPIs applied for the external corrosion monitoring. KPIs 29 to 32 and 34 were
not analyzed.
TABLE 8 Summary of KPI for External Corrosion - Monitoring
KPI KPI Name Score Rationale for KPI Score
28 External Corrosion
Monitoring Techniques 3
Only one type of monitoring technique that is proven
to be effective in monitoring the corrosion type
occurring in the segment is used
9. MEASUREMENT
KPI 35: Measurement data availability
Not all measurement data required for deciding corrosion conditions of the segment are available, and a
high KPI score of 5 was assigned (Table 9).
KPI 36: Validity and utilization of measured data
This activity was not analyzed.
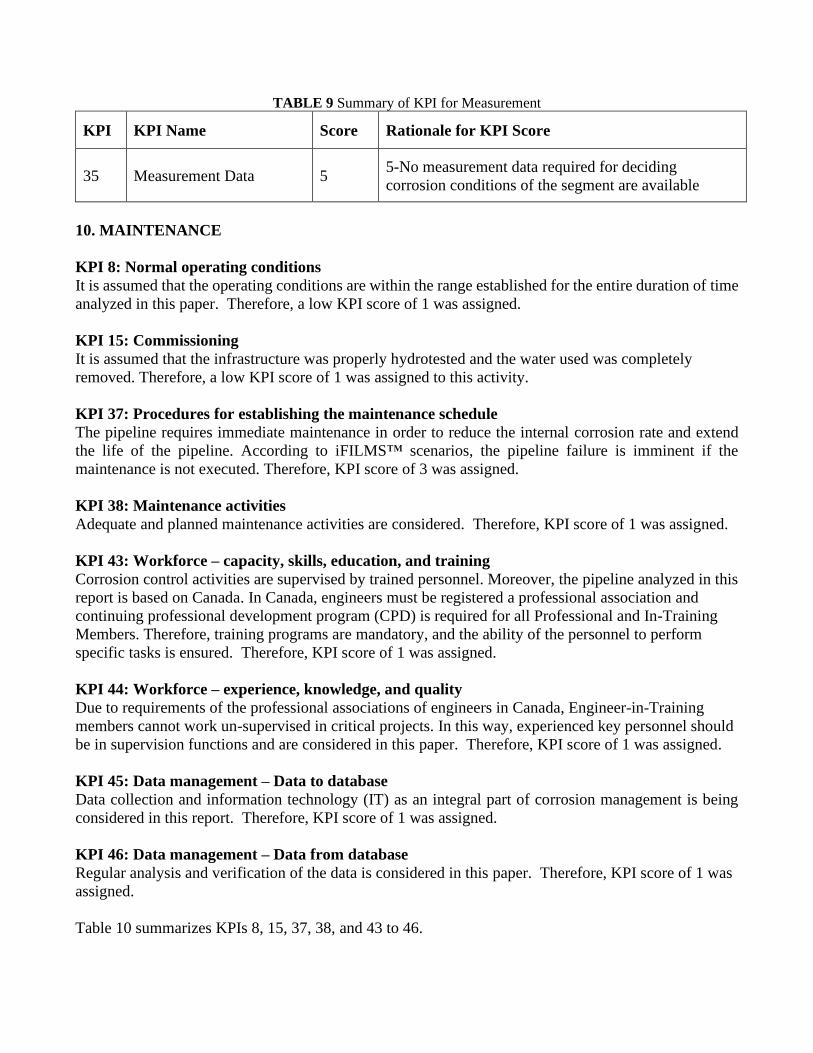
TABLE 9 Summary of KPI for Measurement
KPI KPI Name Score Rationale for KPI Score
35 Measurement Data 5 5-No measurement data required for deciding
corrosion conditions of the segment are available
10. MAINTENANCE
KPI 8: Normal operating conditions
It is assumed that the operating conditions are within the range established for the entire duration of time
analyzed in this paper. Therefore, a low KPI score of 1 was assigned.
KPI 15: Commissioning
It is assumed that the infrastructure was properly hydrotested and the water used was completely
removed. Therefore, a low KPI score of 1 was assigned to this activity.
KPI 37: Procedures for establishing the maintenance schedule
The pipeline requires immediate maintenance in order to reduce the internal corrosion rate and extend
the life of the pipeline. According to iFILMS™ scenarios, the pipeline failure is imminent if the
maintenance is not executed. Therefore, KPI score of 3 was assigned.
KPI 38: Maintenance activities
Adequate and planned maintenance activities are considered. Therefore, KPI score of 1 was assigned.
KPI 43: Workforce – capacity, skills, education, and training
Corrosion control activities are supervised by trained personnel. Moreover, the pipeline analyzed in this
report is based on Canada. In Canada, engineers must be registered a professional association and
continuing professional development program (CPD) is required for all Professional and In-Training
Members. Therefore, training programs are mandatory, and the ability of the personnel to perform
specific tasks is ensured. Therefore, KPI score of 1 was assigned.
KPI 44: Workforce – experience, knowledge, and quality
Due to requirements of the professional associations of engineers in Canada, Engineer-in-Training
members cannot work un-supervised in critical projects. In this way, experienced key personnel should
be in supervision functions and are considered in this paper. Therefore, KPI score of 1 was assigned.
KPI 45: Data management – Data to database
Data collection and information technology (IT) as an integral part of corrosion management is being
considered in this report. Therefore, KPI score of 1 was assigned.
KPI 46: Data management – Data from database
Regular analysis and verification of the data is considered in this paper. Therefore, KPI score of 1 was
assigned.
Table 10 summarizes KPIs 8, 15, 37, 38, and 43 to 46.

TABLE 10 Summary of KPI for Maintenance
KPI KPI Name Score Rationale for KPI Score
8 Normal Operating
Conditions 1
Operating conditions within the range established for
the entire duration of the project
15 Commissioning 1
Infrastructure is properly hydrotested and the water
used in the hydrotest properly is completely removed,
baseline conditions (e.g., inline inspection, CP current
demand) are established to ensure that the corrosion
rate is and will remain at the predicted rate, and all
data from the design stage are collected and properly
stored in the database for future use
37
Procedures for
Establishing Maintenance
Schedule
3
When the risk moves from ALARP to high risk stage,
i.e., when conditions indicate that failure is imminent
if the maintenance is not executed
43
Workforce – Capacity,
Skills, Education, and
Training
1
The number of workers is enough to carry out the
work and all personnel involved have proper education
and formal training to carry out the task
45 Data to Database 1
Data from different activities, measurements are
automatically and systematically transferred to the
database with no or minimal human intervention
38 Maintenance Activities 1
The work is carried out as per planned maintenance
activities with all teams delivering their services as per
schedule
44 Workforce – Experience,
Knowledge, and Quality 1
All personnel involved have at least five years of
experience and knowledge in similar work
46 Data from Database 1
Data is properly verified, systematically stored, and
proactively passed onto appropriate persons or
appropriate persons can retrieve the data in the format
required
11. MANAGEMENT
KPI 47: Internal communication strategy
Bi-weekly internal communications for topics related to corrosion control are being considered.
Therefore, KPI score of 1 was assigned.
KPI 48: External Communication Strategy
Some external communications with external parties are considered. Therefore, KPI score of 2 was
assigned.
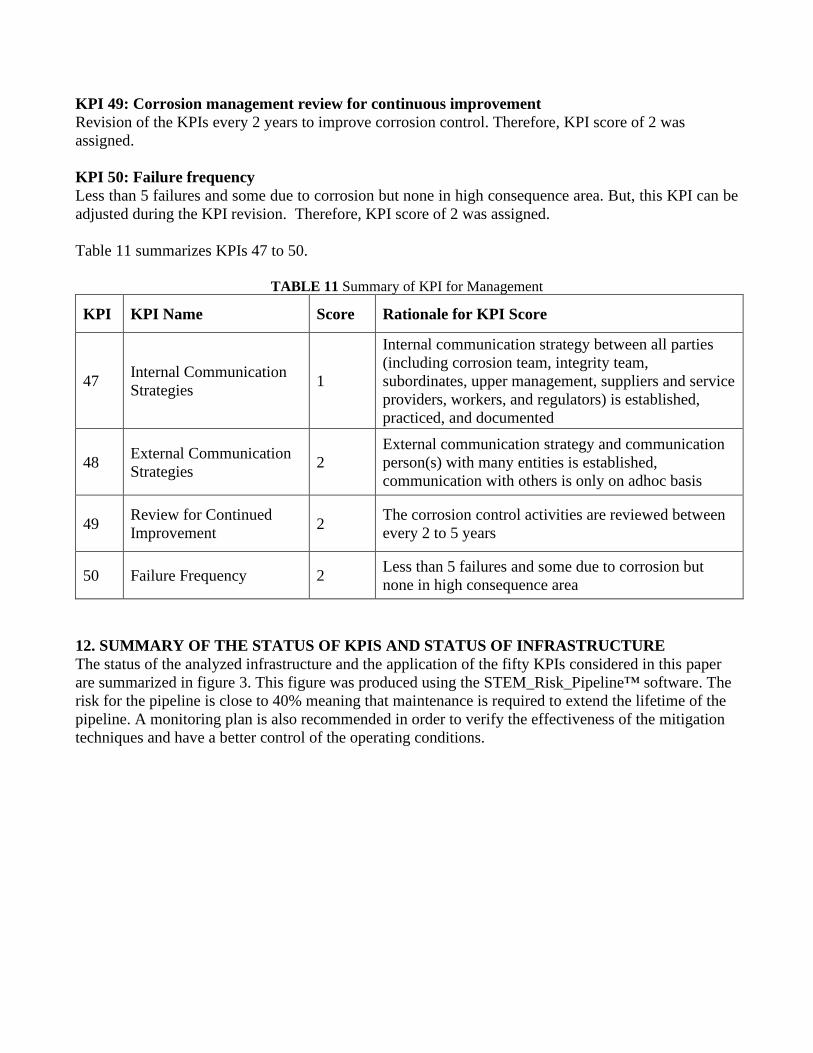
KPI 49: Corrosion management review for continuous improvement
Revision of the KPIs every 2 years to improve corrosion control. Therefore, KPI score of 2 was
assigned.
KPI 50: Failure frequency
Less than 5 failures and some due to corrosion but none in high consequence area. But, this KPI can be
adjusted during the KPI revision. Therefore, KPI score of 2 was assigned.
Table 11 summarizes KPIs 47 to 50.
TABLE 11 Summary of KPI for Management
KPI KPI Name Score Rationale for KPI Score
47 Internal Communication
Strategies 1
Internal communication strategy between all parties
(including corrosion team, integrity team,
subordinates, upper management, suppliers and service
providers, workers, and regulators) is established,
practiced, and documented
48 External Communication
Strategies 2
External communication strategy and communication
person(s) with many entities is established,
communication with others is only on adhoc basis
49 Review for Continued
Improvement 2
The corrosion control activities are reviewed between
every 2 to 5 years
50 Failure Frequency 2 Less than 5 failures and some due to corrosion but
none in high consequence area
12. SUMMARY OF THE STATUS OF KPIS AND STATUS OF INFRASTRUCTURE
The status of the analyzed infrastructure and the application of the fifty KPIs considered in this paper
are summarized in figure 3. This figure was produced using the STEM_Risk_Pipeline™ software. The
risk for the pipeline is close to 40% meaning that maintenance is required to extend the lifetime of the
pipeline. A monitoring plan is also recommended in order to verify the effectiveness of the mitigation
techniques and have a better control of the operating conditions.

FIGURE 3 Summary of the status of KPIs for the analyzed pipeline
13. ADDITIONAL RECOMMENDATIONS
Based on the summary of the KPIs, more emphasis should be put in monitoring the corrosion rate after
maintenance in order to determine the effectiveness of the applied mitigation techniques.
14. CONCLUSIONS
Based on the summary of the KPIs, 27 KPI are adequately implemented, and the corrosion risk is close
to 40%. In order to decrease the corrosion risk, the effect of the upstream segment should be taken into
account. Documenting and reporting the incidents causing deviation from the predicted normal
operations of the pipeline will increase the integrity of the analyzed system. Implementing adequate
monitoring techniques will also increase the integrity of the pipeline and would allow to take
measurements when abnormal values are obtained.

15. REFERENCES
[1] Canada’s Oil & Natural Gas Producers. Best Management Practice: Mitigation of Internal Corrosion
in Carbon Steel Oil Effluent Pipeline Systems, July 2018.
[2] https://www.capp.ca/explore/oil-and-natural-gas-pipelines/. Retrieved on June 06 2020.
[3] R. Draper, Understanding a New Standard, Materials Performance,
https://www.materialsperformance.com/articles/coating-linings/2015/10/understanding-a-new-
standard, retrieved on August 29 2020.
[4] R. Norsworthy. Coatings used in conjunction with cathodic protection – shielding vs non-shielding
pipeline coatings. NACE 2009, paper No 09043
[5] F. Jeglic, Analysis of Ruptures and Trends on Major Canadian Pipeline Systems, National Energy
Board, Calgary, Canada, 2004.
[6] S. Cunha. Comparison and analysis of pipeline failure statistics. Proceedings of the 2012 9th
International Pipeline Conference, IPC2012-90186.
[7] https://memberprojects.aboutpipelines.com/?show=liquids#pipemap1, Retrieved on July 28 2020.
[8] S. Papavinasam. Corrosion Control in the Oil and Gas Industry, Gulf Professional Publishing, 2014.
[9] Pipelines Across Canada. https://www.nrcan.gc.ca/our-natural-resources/energy-sources-
distribution/clean-fossil-fuels/pipelines/pipelines-across-canada/18856. Retrieved on August 29 2020
[10] F. Varela, M.Y.Tan, M. Forsyth. An overview of major methods for inspecting and monitoring
external corrosion of on-shore transportation pipelines. Corrosion Engineering, Science and Technology,
vol 50, 2015, pp 226-235.
[11] M.T. Lilly, S.C. Ihekwoaba, S.O.T. Ogaji, S.D. Probert. Prolonging the lives of buried crude-oil and
natural-gas pipelines by cathodic protection. Applied Energy 84, 2007, pp 958-970.
[12] H.R. Vanaei, A. Eslami, A. Egbewande. A review on pipeline corrosion, in-line inspection (ILI),
and corrosion growth rate models. International Journal of Pressure Vessels and Piping 149, 2017, pp
43-54.