Embed Size (px)
Citation preview
1
Evaluation of Combustion Behavior of Renewable Jet
Fuel in a Combustor Rig: Influence of HEFA and its
Blends on Flame Stability and Emissions Compared to
Aviation Kerosene
Marco Buffi, Agustin Valera-Medina, David Chiaramonti
Giornata di studio sui combustori di turbina a gasUniversità degli Studi di Firenze
Aula Magna del Rettorato
Martedì 6 Novembre, 2018 – Firenze
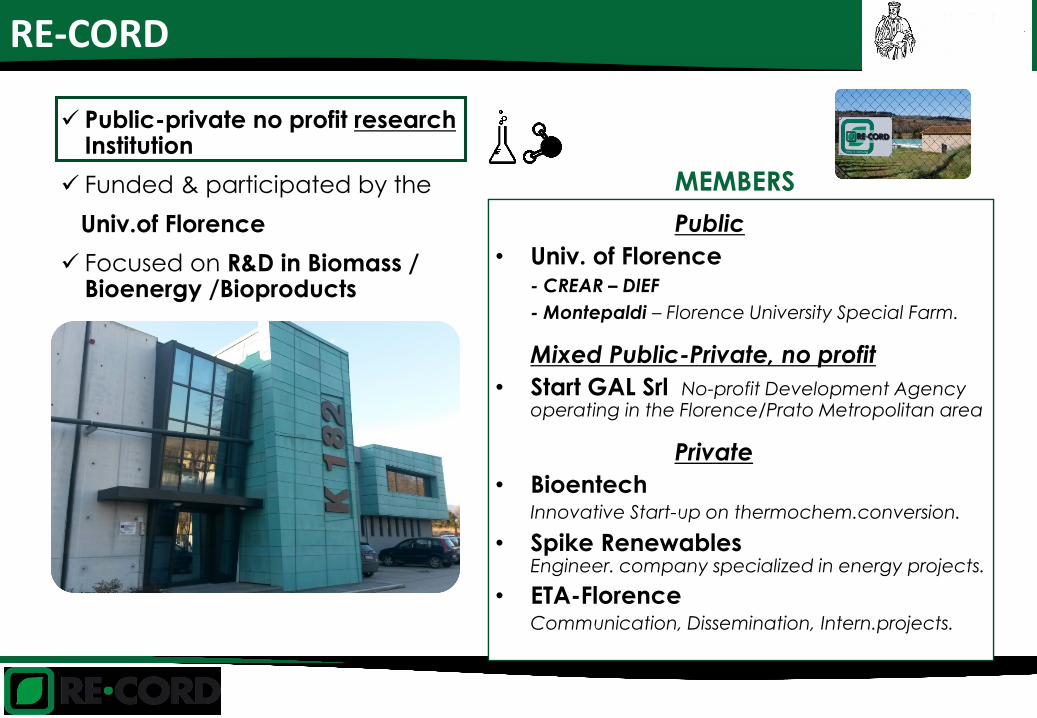
RE-CORD
MEMBERS
Public
• Univ. of Florence - CREAR – DIEF
- Montepaldi – Florence University Special Farm.
Mixed Public-Private, no profit
• Start GAL Srl No-profit Development Agency operating in the Florence/Prato Metropolitan area
Private
• BioentechInnovative Start-up on thermochem.conversion.
• Spike RenewablesEngineer. company specialized in energy projects.
• ETA-FlorenceCommunication, Dissemination, Intern.projects.
Public-private no profit researchInstitution
Funded & participated by the
Univ.of Florence
Focused on R&D in Biomass / Bioenergy /Bioproducts
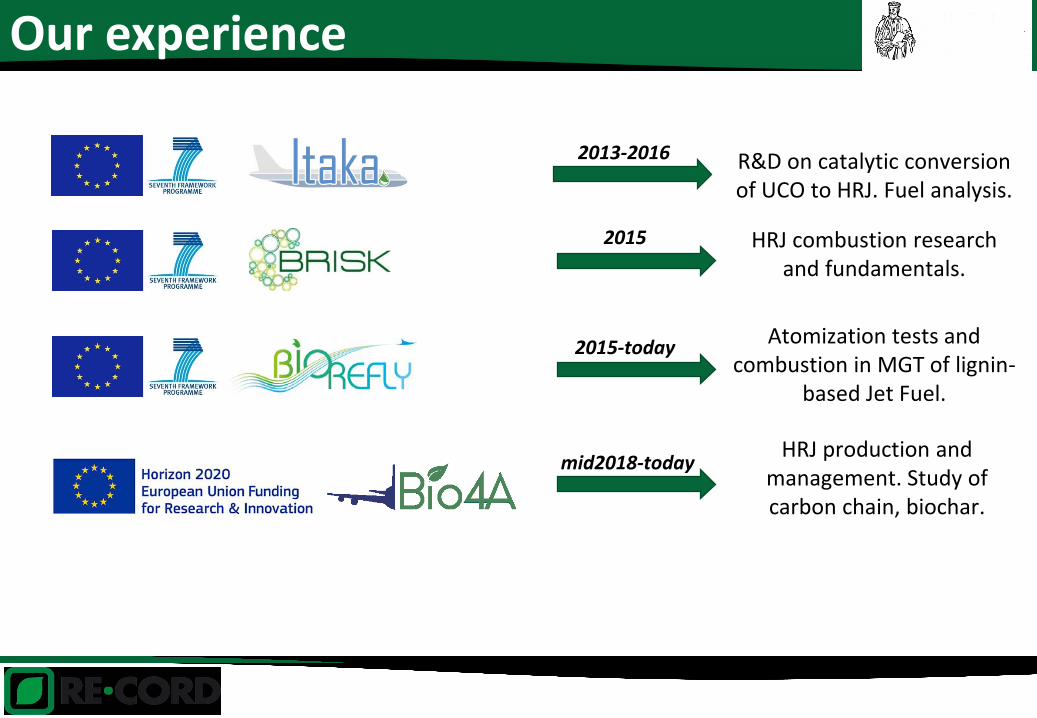
Our experience
2015-today
mid2018-today
2015
2013-2016 R&D on catalytic conversion of UCO to HRJ. Fuel analysis.
HRJ combustion research and fundamentals.
Atomization tests and combustion in MGT of lignin-
based Jet Fuel.
HRJ production and management. Study of carbon chain, biochar.

Outline
Context
Materials
Fuels
Combustor rig: HPOC
Measurements
Methods
Set up
Experimental schedule
Results
Combustion parameters
Emissions
Chemiluminescence
Conclusions and discussion
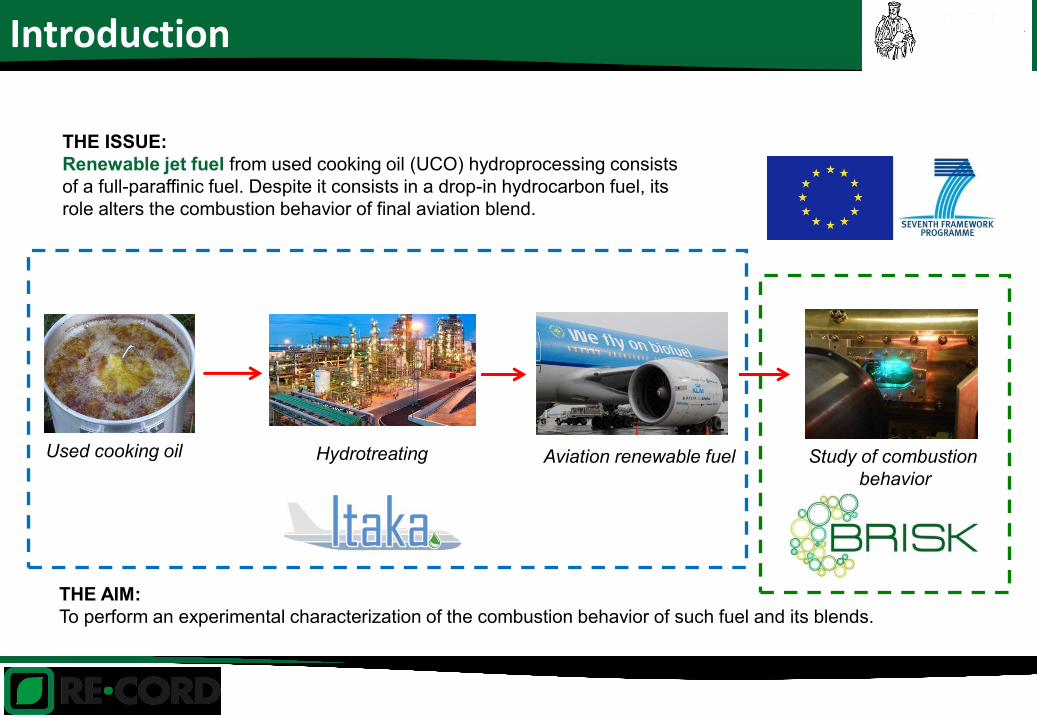
Introduction
THE ISSUE:
Renewable jet fuel from used cooking oil (UCO) hydroprocessing consists
of a full-paraffinic fuel. Despite it consists in a drop-in hydrocarbon fuel, its
role alters the combustion behavior of final aviation blend.
THE AIM:
To perform an experimental characterization of the combustion behavior of such fuel and its blends.
Used cooking oil Hydrotreating Aviation renewable fuel Study of combustion
behavior
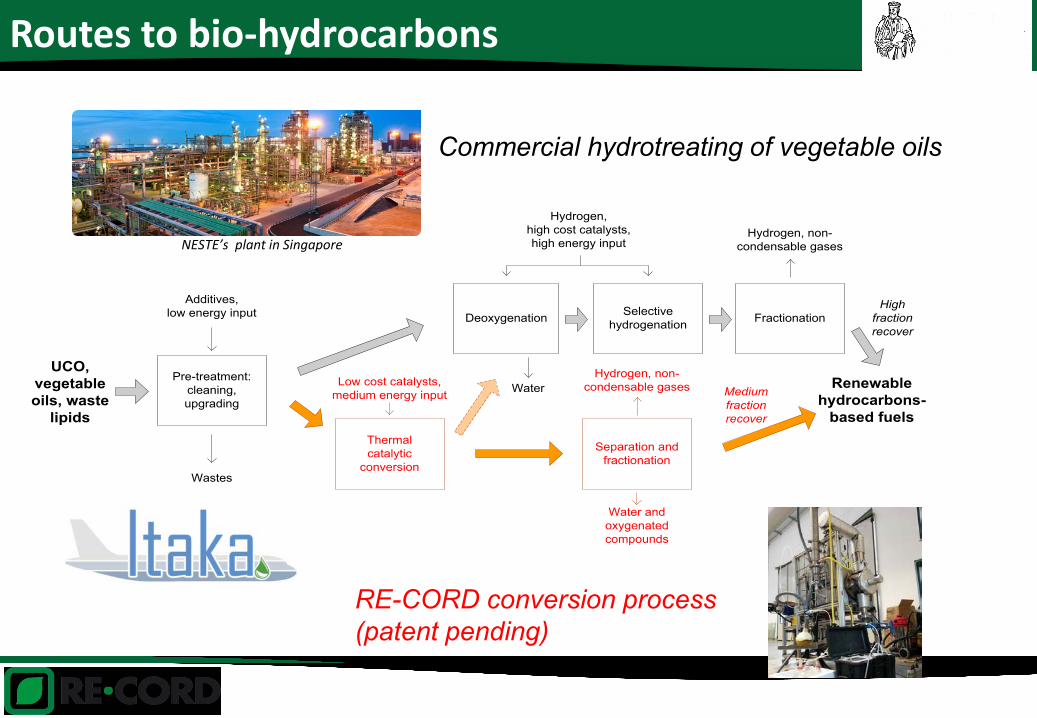
Routes to bio-hydrocarbons
Pre-treatment:
cleaning,
upgrading
Additives,
low energy input Selective
hydrogenationFractionation
Wastes
Hydrogen, non-
condensable gases
Renewable
hydrocarbons-
based fuels
UCO,
vegetable
oils, waste
lipids
Deoxygenation
Hydrogen,
high cost catalysts,
high energy input
Water
High
fraction
recover
Water and
oxygenated
compounds
Thermal
catalytic
conversion
Low cost catalysts,
medium energy input
Separation and
fractionation
Hydrogen, non-
condensable gases Medium
fraction
recover
RE-CORD conversion process
(patent pending)
Commercial hydrotreating of vegetable oils
NESTE’s plant in Singapore
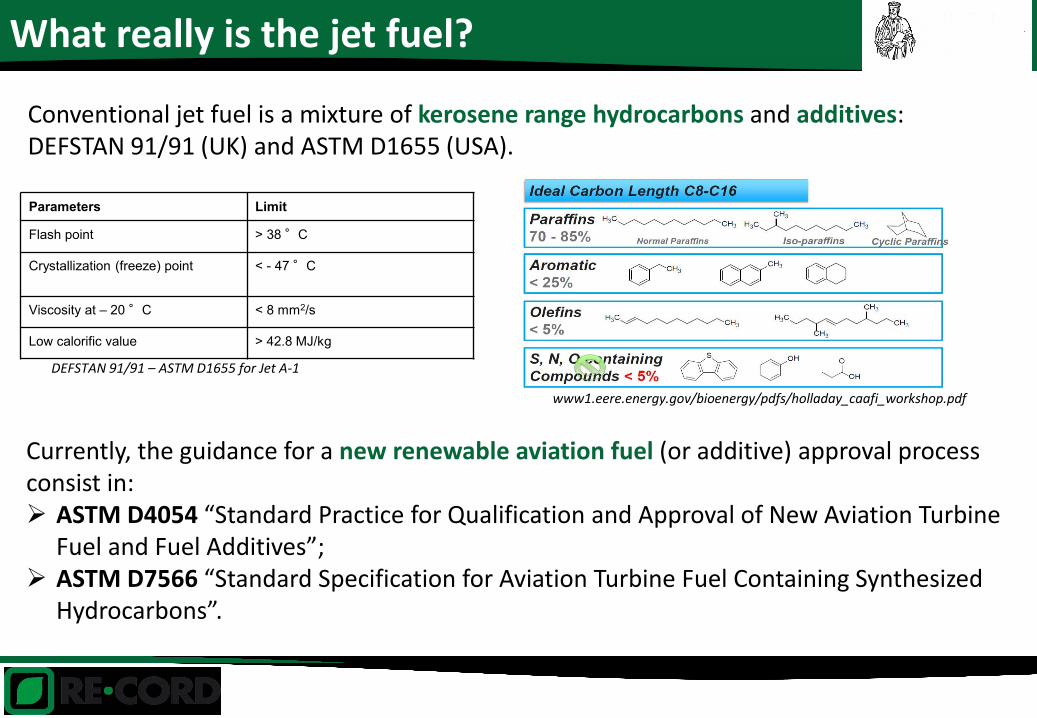
What really is the jet fuel?
Conventional jet fuel is a mixture of kerosene range hydrocarbons and additives:DEFSTAN 91/91 (UK) and ASTM D1655 (USA).
Parameters Limit
Flash point > 38°C
Crystallization (freeze) point < - 47°C
Viscosity at – 20°C < 8 mm2/s
Low calorific value > 42.8 MJ/kg
Currently, the guidance for a new renewable aviation fuel (or additive) approval process consist in: ASTM D4054 “Standard Practice for Qualification and Approval of New Aviation Turbine
Fuel and Fuel Additives”; ASTM D7566 “Standard Specification for Aviation Turbine Fuel Containing Synthesized
Hydrocarbons”.
www1.eere.energy.gov/bioenergy/pdfs/holladay_caafi_workshop.pdf
DEFSTAN 91/91 – ASTM D1655 for Jet A-1
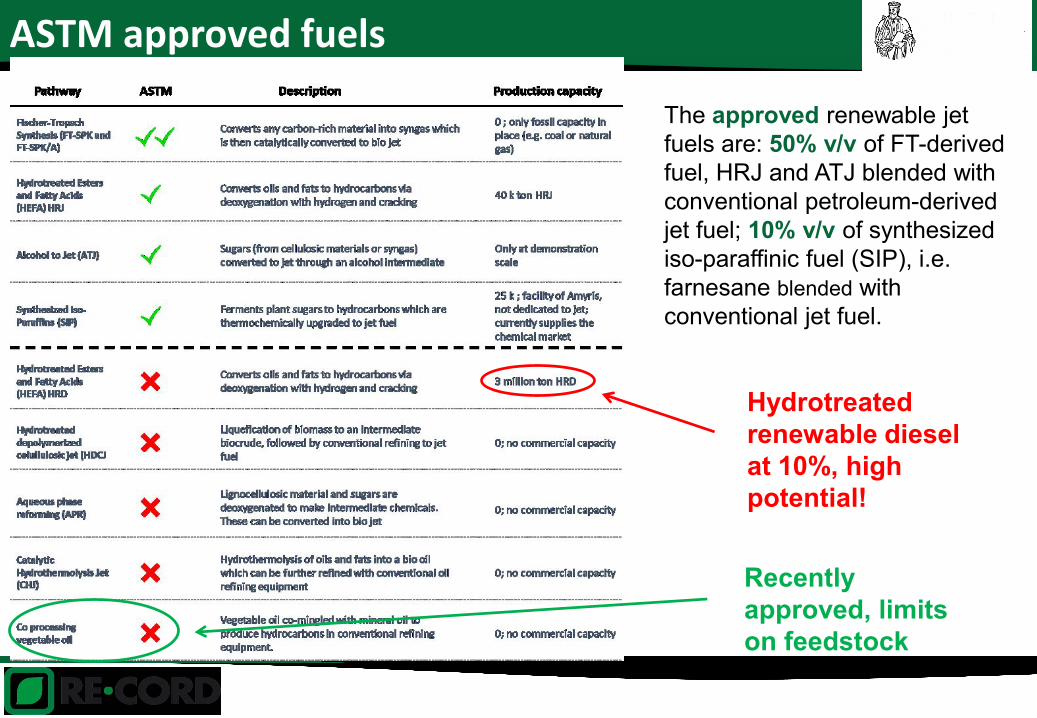
ASTM approved fuels
Hydrotreated
renewable diesel
at 10%, high
potential!
The approved renewable jet
fuels are: 50% v/v of FT-derived
fuel, HRJ and ATJ blended with
conventional petroleum-derived
jet fuel; 10% v/v of synthesized
iso-paraffinic fuel (SIP), i.e.
farnesane blended with
conventional jet fuel.
Recently
approved, limits
on feedstock
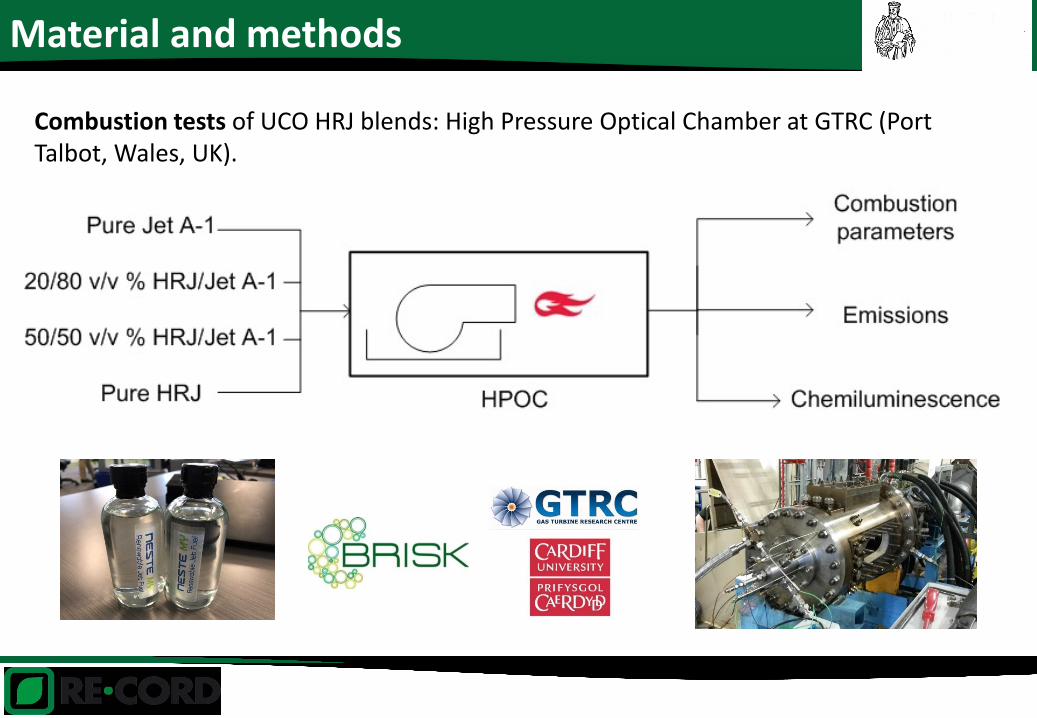
Material and methods
Combustion tests of UCO HRJ blends: High Pressure Optical Chamber at GTRC (Port Talbot, Wales, UK).
Outline
Context
Materials
Fuels
Combustor rig: HPOC
Measurements
Methods
Set up
Experimental schedule
Results
Combustion parameters
Emissions
Chemiluminescence
Conclusions and discussion
Fuels
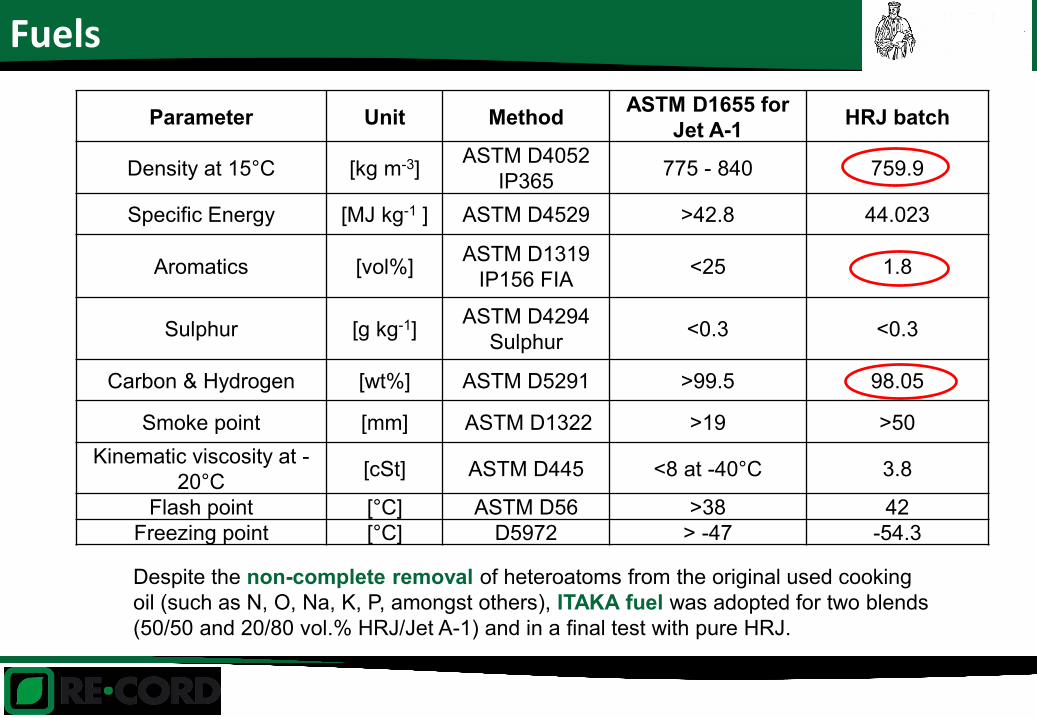
Parameter Unit MethodASTM D1655 for
Jet A-1HRJ batch
Density at 15°C [kg m-3]ASTM D4052
IP365775 - 840 759.9
Specific Energy [MJ kg-1 ] ASTM D4529 >42.8 44.023
Aromatics [vol%]ASTM D1319
IP156 FIA<25 1.8
Sulphur [g kg-1]ASTM D4294
Sulphur<0.3 <0.3
Carbon & Hydrogen [wt%] ASTM D5291 >99.5 98.05
Smoke point [mm] ASTM D1322 >19 >50
Kinematic viscosity at -
20°C[cSt] ASTM D445 <8 at -40°C 3.8
Flash point [°C] ASTM D56 >38 42
Freezing point [°C] D5972 > -47 -54.3
Despite the non-complete removal of heteroatoms from the original used cooking
oil (such as N, O, Na, K, P, amongst others), ITAKA fuel was adopted for two blends
(50/50 and 20/80 vol.% HRJ/Jet A-1) and in a final test with pure HRJ.
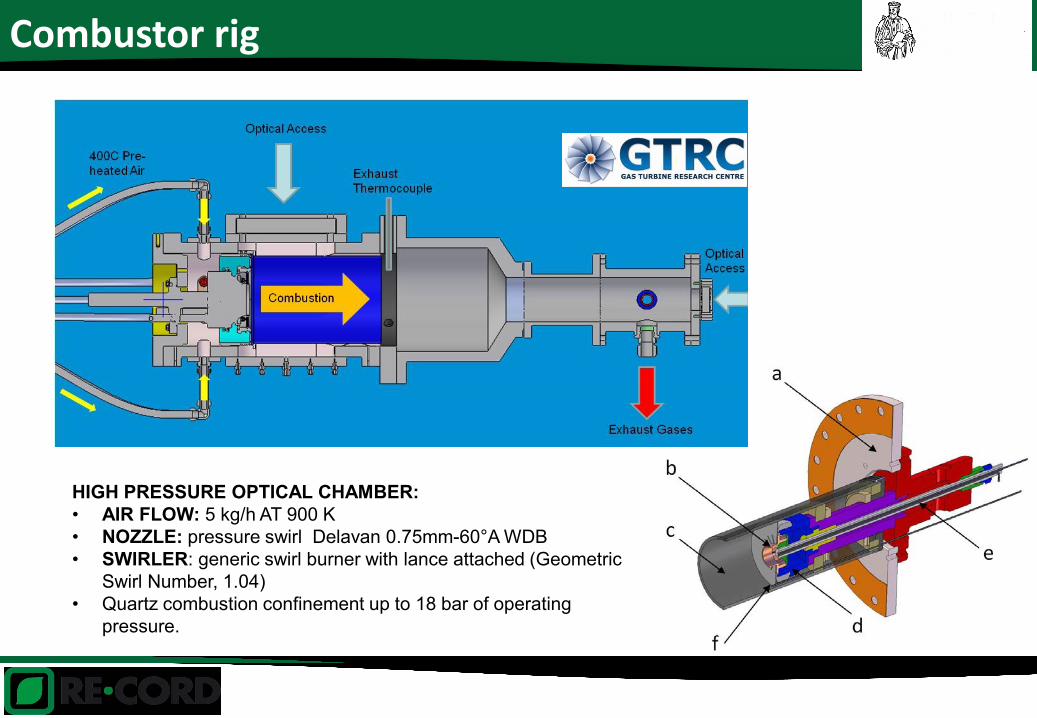
Combustor rig
HIGH PRESSURE OPTICAL CHAMBER:
• AIR FLOW: 5 kg/h AT 900 K
• NOZZLE: pressure swirl Delavan 0.75mm-60°A WDB
• SWIRLER: generic swirl burner with lance attached (Geometric
Swirl Number, 1.04)
• Quartz combustion confinement up to 18 bar of operating
pressure.
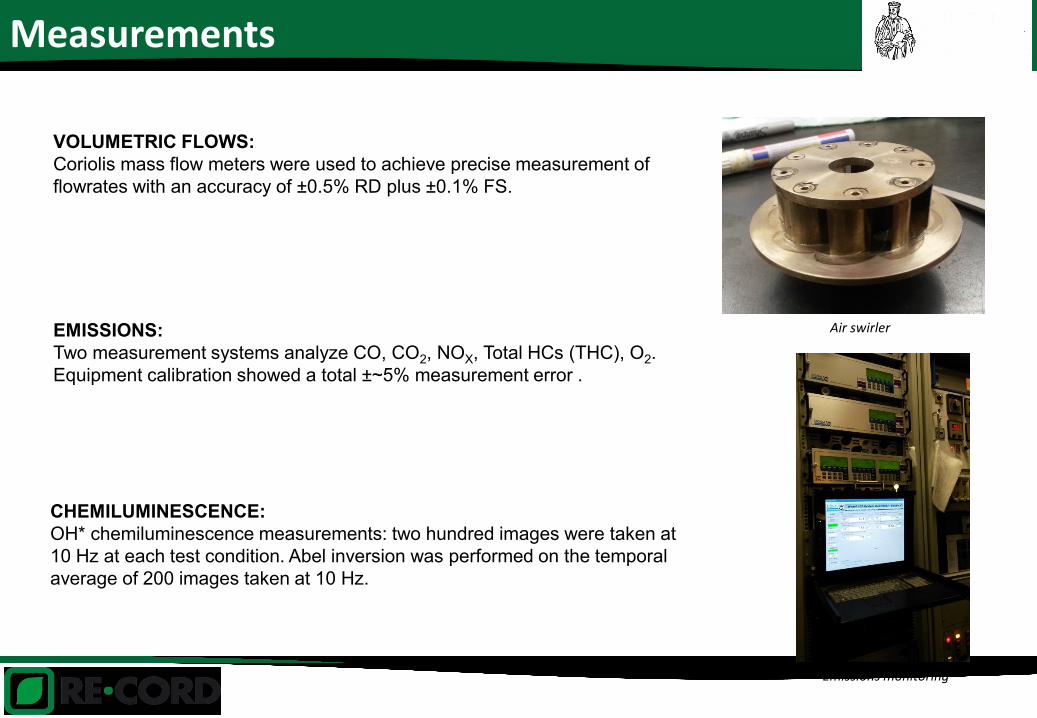
Measurements
VOLUMETRIC FLOWS:
Coriolis mass flow meters were used to achieve precise measurement of
flowrates with an accuracy of ±0.5% RD plus ±0.1% FS.
CHEMILUMINESCENCE:
OH* chemiluminescence measurements: two hundred images were taken at
10 Hz at each test condition. Abel inversion was performed on the temporal
average of 200 images taken at 10 Hz.
EMISSIONS:
Two measurement systems analyze CO, CO2, NOX, Total HCs (THC), O2.
Equipment calibration showed a total ±~5% measurement error .
Air swirler
Emissions monitoring
Outline
Context
Materials
Fuels
Combustor rig: HPOC
Measurements
Methods
Set up
Experimental schedule
Results
Combustion parameters
Emissions
Chemiluminescence
Conclusions and discussion
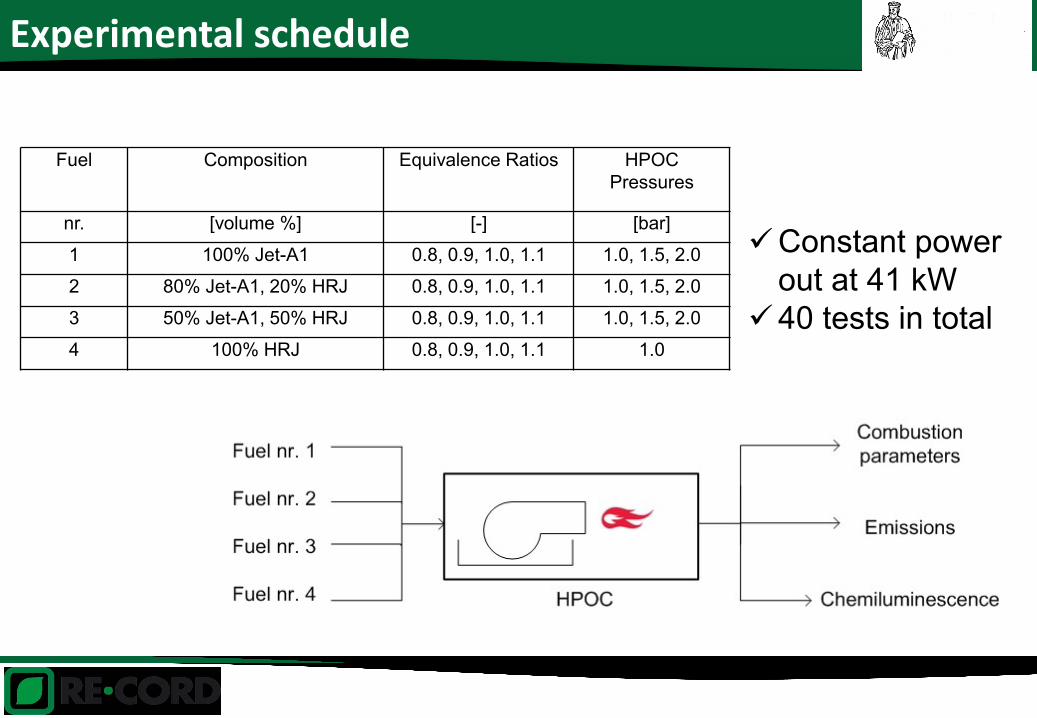
Experimental schedule
Fuel Composition Equivalence Ratios HPOC
Pressures
nr. [volume %] [-] [bar]
1 100% Jet-A1 0.8, 0.9, 1.0, 1.1 1.0, 1.5, 2.0
2 80% Jet-A1, 20% HRJ 0.8, 0.9, 1.0, 1.1 1.0, 1.5, 2.0
3 50% Jet-A1, 50% HRJ 0.8, 0.9, 1.0, 1.1 1.0, 1.5, 2.0
4 100% HRJ 0.8, 0.9, 1.0, 1.1 1.0
Constant power
out at 41 kW
40 tests in total
Outline
Context
Materials
Fuels
Combustor rig: HPOC
Measurements
Methods
Set up
Experimental schedule
Results
Combustion parameters
Emissions
Chemiluminescence
Conclusions and discussion
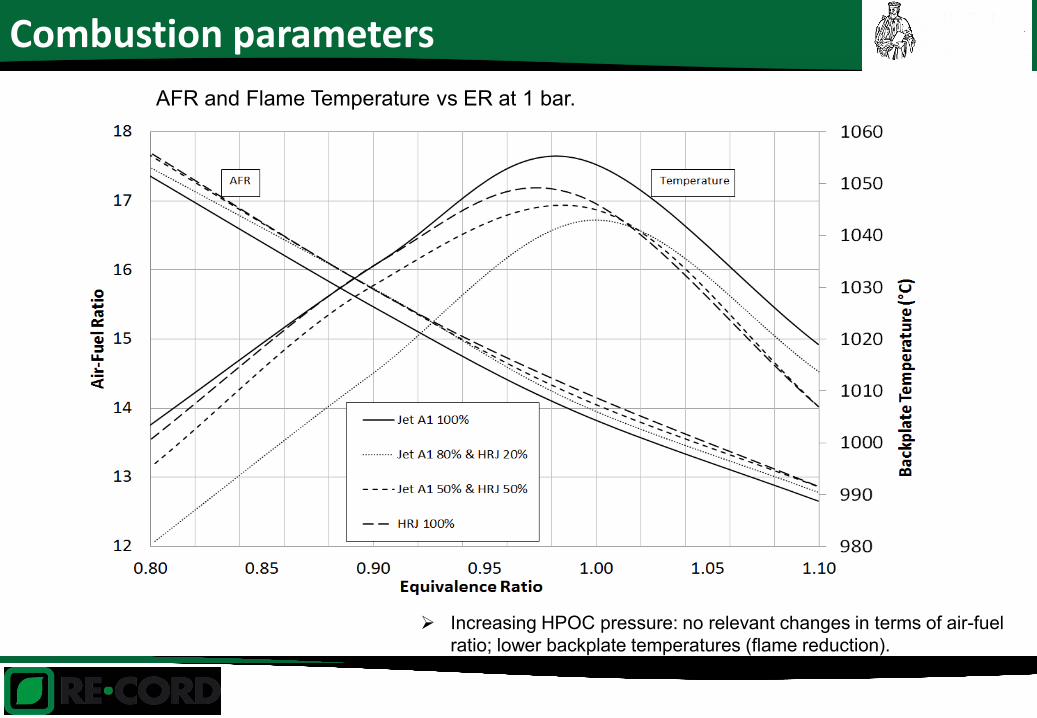
Combustion parameters
AFR and Flame Temperature vs ER at 1 bar.
Increasing HPOC pressure: no relevant changes in terms of air-fuel
ratio; lower backplate temperatures (flame reduction).
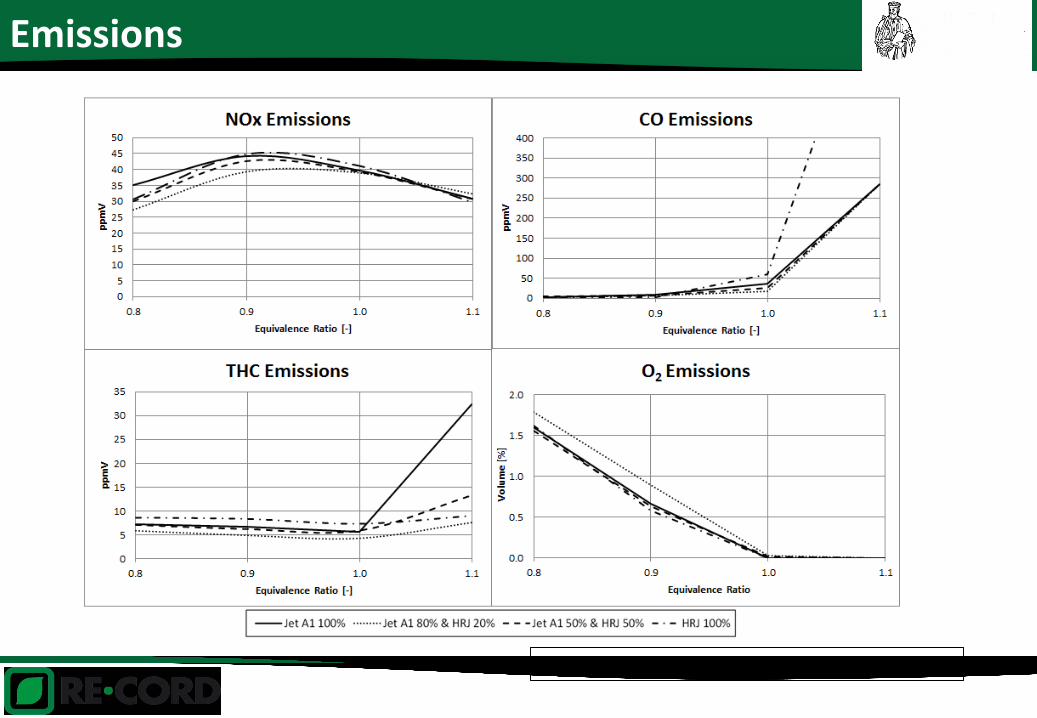
Emissions
Emissions at 1 bar. Values normalized to 15% O2
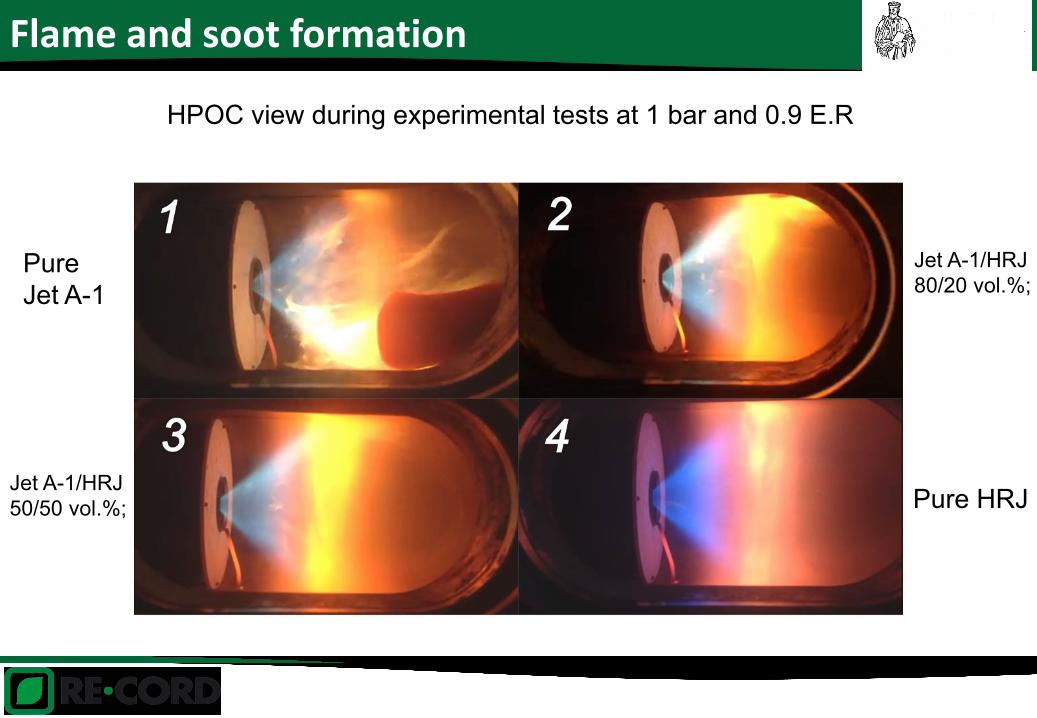
Flame and soot formation
HPOC view during experimental tests at 1 bar and 0.9 E.R
Pure
Jet A-1
Jet A-1/HRJ
80/20 vol.%;
Jet A-1/HRJ
50/50 vol.%; Pure HRJ
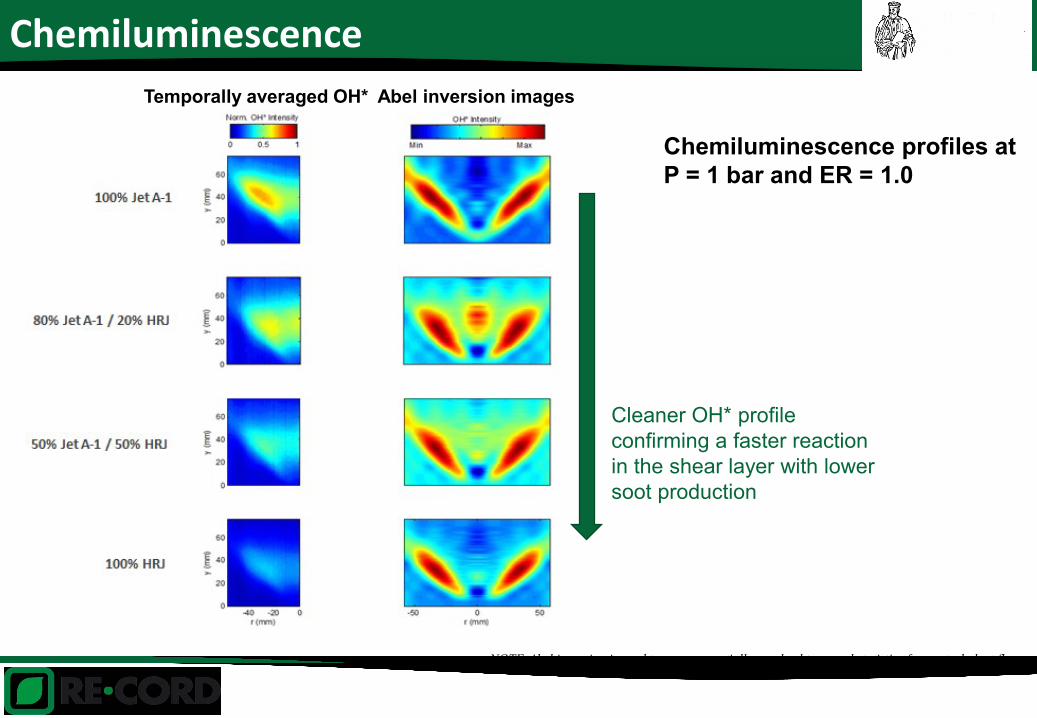
Chemiluminescence
Chemiluminescence profiles at
P = 1 bar and ER = 1.0
Abel inversion imagesTemporally averaged OH*
Cleaner OH* profile
confirming a faster reaction
in the shear layer with lower
soot production
NOTE:Abel inversion is used to recover spatially-resolved temporal statistics from a turbulent flow.
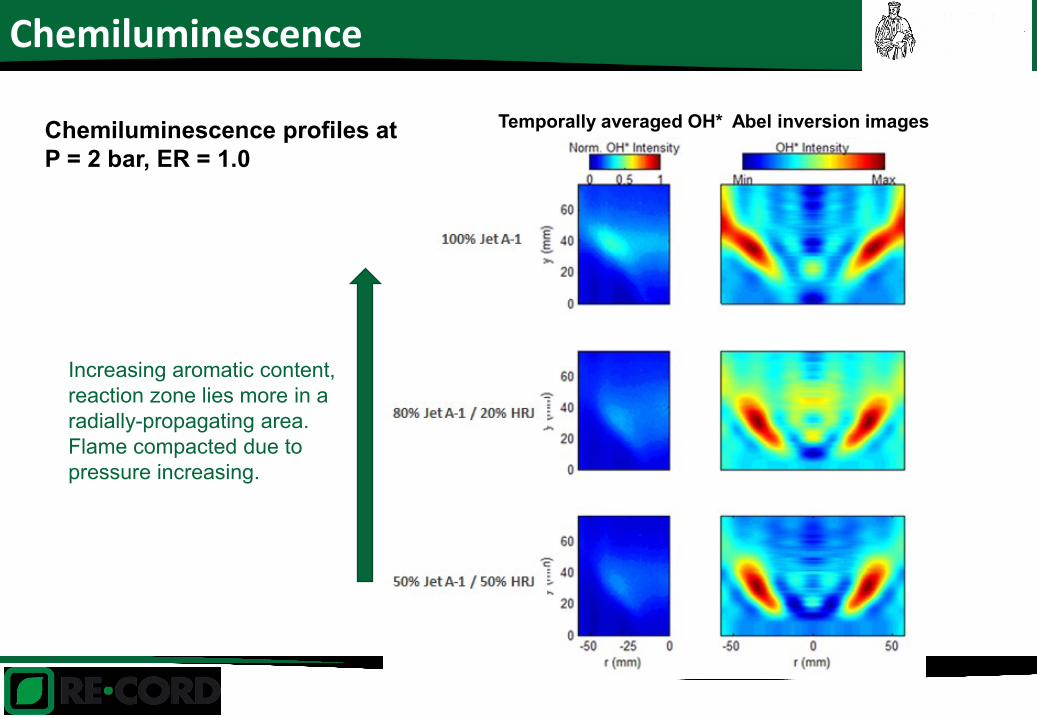
Chemiluminescence
Chemiluminescence profiles at
P = 2 bar, ER = 1.0
Abel inversion imagesTemporally averaged OH*
Increasing aromatic content,
reaction zone lies more in a
radially-propagating area.
Flame compacted due to
pressure increasing.
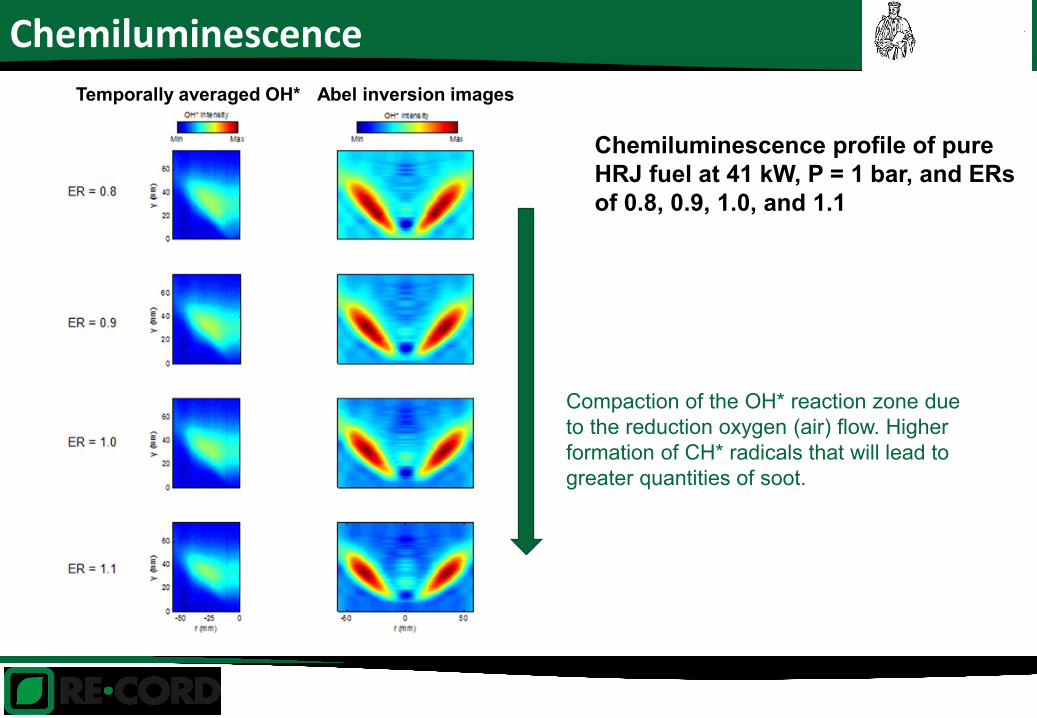
Chemiluminescence
Chemiluminescence profile of pure
HRJ fuel at 41 kW, P = 1 bar, and ERs
of 0.8, 0.9, 1.0, and 1.1
Abel inversion imagesTemporally averaged OH*
Compaction of the OH* reaction zone due
to the reduction oxygen (air) flow. Higher
formation of CH* radicals that will lead to
greater quantities of soot.
Outline
24/29
Context
Materials
Fuels
Combustor rig: HPOC
Measurements
Methods
Set up
Experimental schedule
Results
Combustion parameters
Emissions
Chemiluminescence
Conclusions and discussion
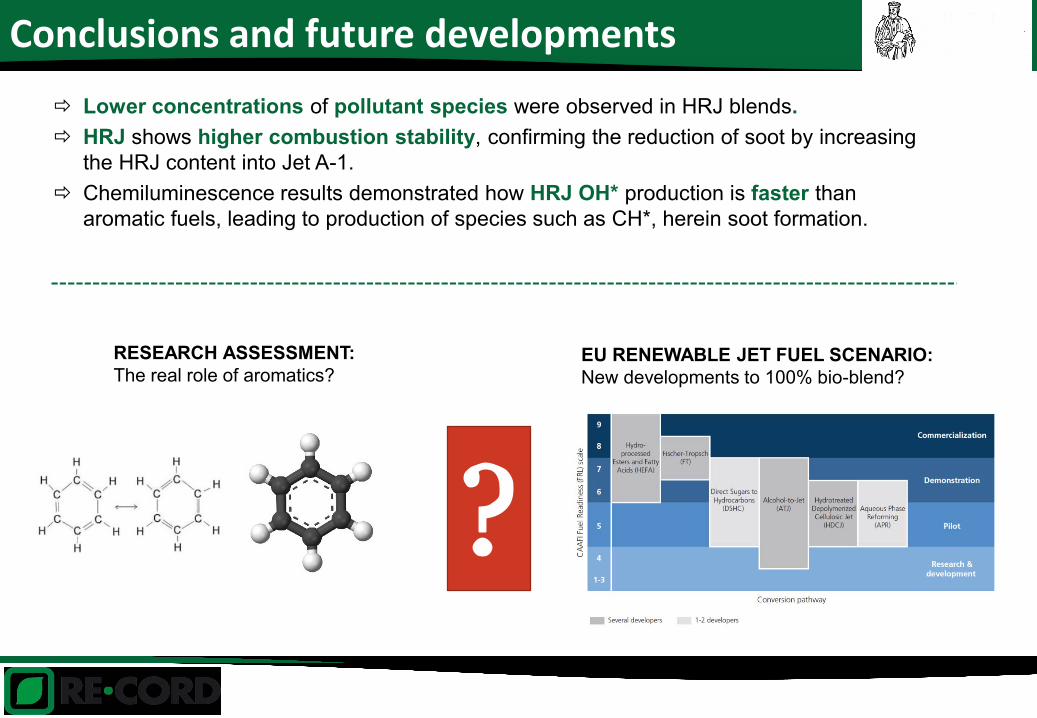
Conclusions and future developments
Lower concentrations of pollutant species were observed in HRJ blends.
HRJ shows higher combustion stability, confirming the reduction of soot by increasing
the HRJ content into Jet A-1.
Chemiluminescence results demonstrated how HRJ OH* production is faster than
aromatic fuels, leading to production of species such as CH*, herein soot formation.
RESEARCH ASSESSMENT:
The real role of aromatics?EU RENEWABLE JET FUEL SCENARIO:
New developments to 100% bio-blend?

Thanks for your Attention!
Marco Buffi
Contacts
Thanks for the attention!
Questions???
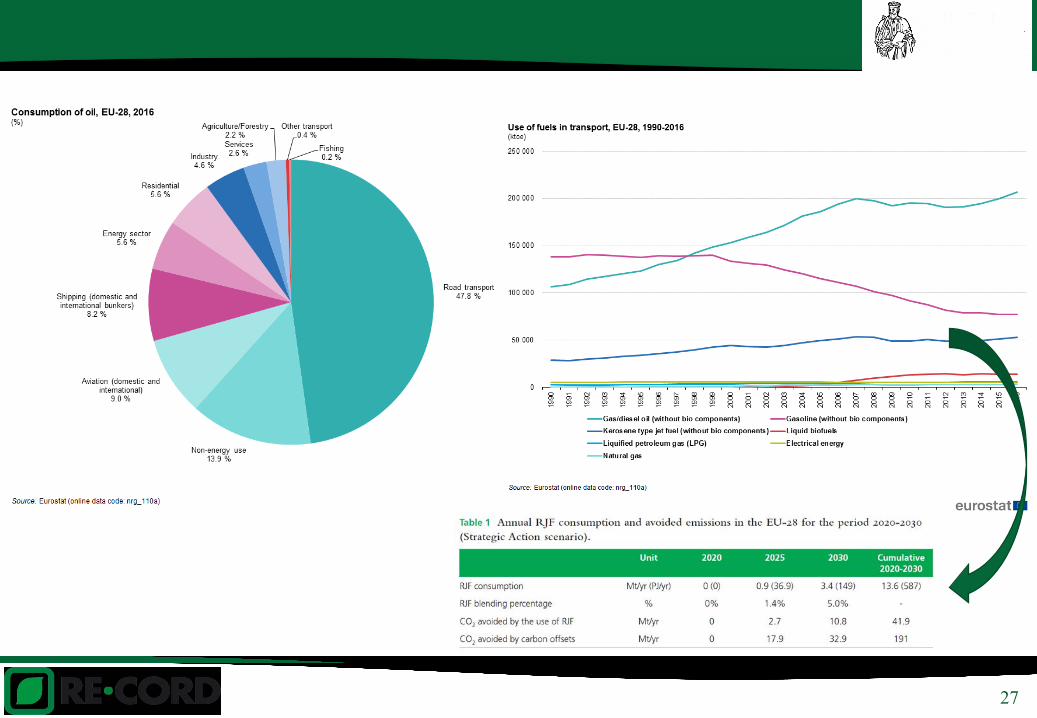
27
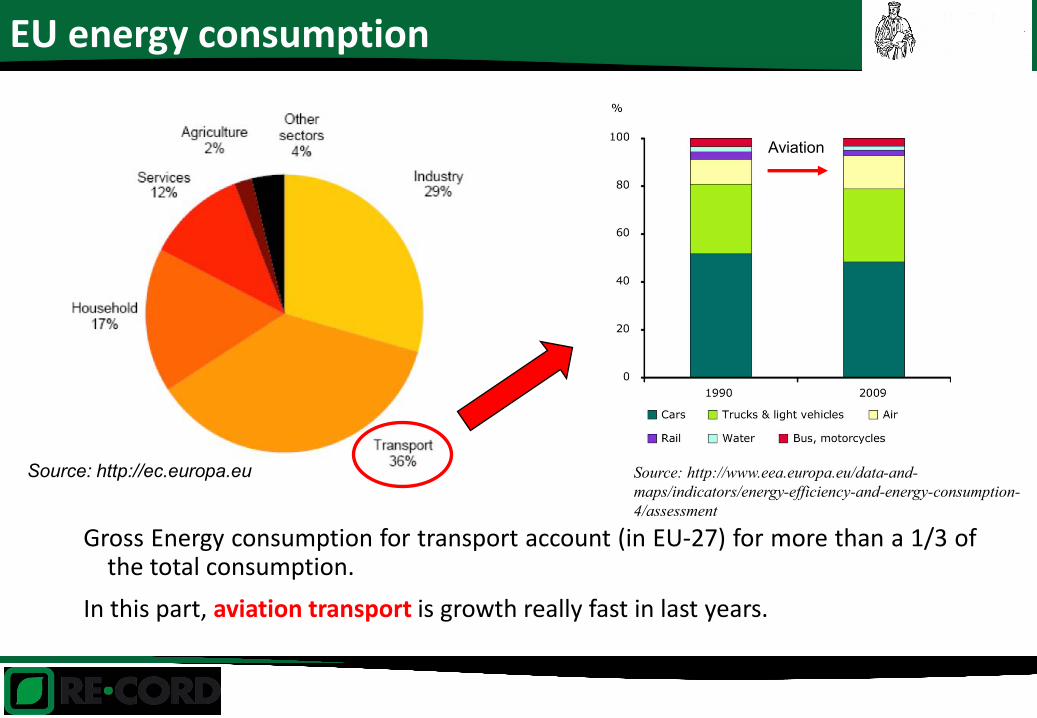
Gross Energy consumption for transport account (in EU-27) for more than a 1/3 ofthe total consumption.
In this part, aviation transport is growth really fast in last years.
EU energy consumption
Source: http://ec.europa.eu Source: http://www.eea.europa.eu/data-and-
maps/indicators/energy-efficiency-and-energy-consumption-
4/assessment
Aviation
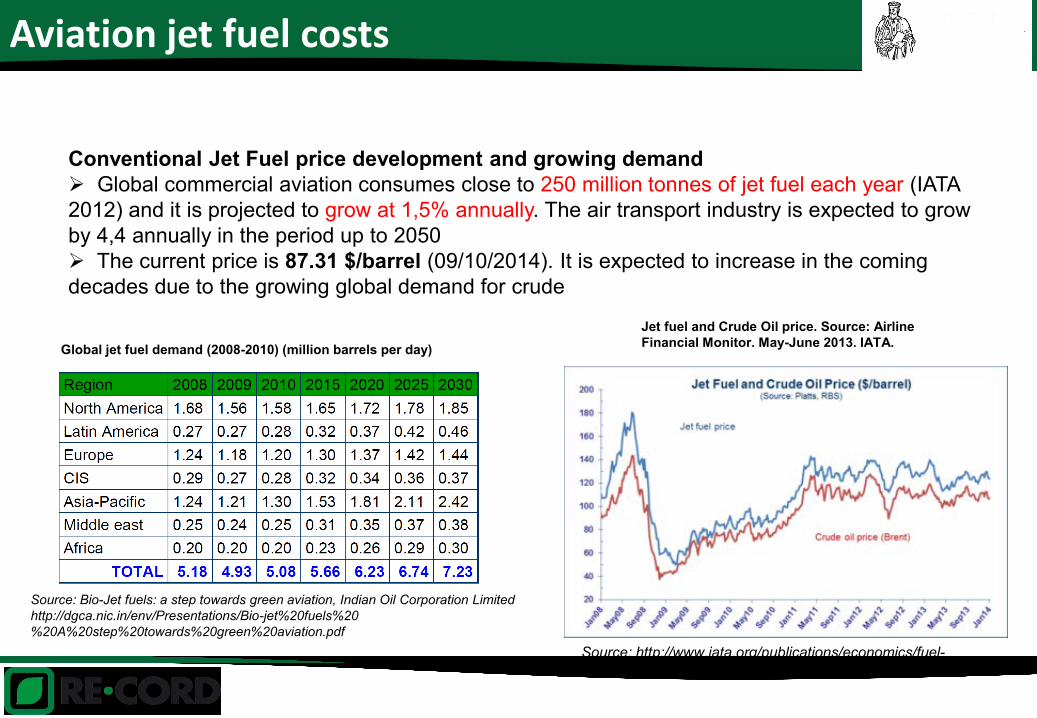
Conventional Jet Fuel price development and growing demand
Global commercial aviation consumes close to 250 million tonnes of jet fuel each year (IATA
2012) and it is projected to grow at 1,5% annually. The air transport industry is expected to grow
by 4,4 annually in the period up to 2050
The current price is 87.31 $/barrel (09/10/2014). It is expected to increase in the coming
decades due to the growing global demand for crude
Global jet fuel demand (2008-2010) (million barrels per day)
Source: Bio-Jet fuels: a step towards green aviation, Indian Oil Corporation Limited
http://dgca.nic.in/env/Presentations/Bio-jet%20fuels%20
%20A%20step%20towards%20green%20aviation.pdf
Source: http://www.iata.org/publications/economics/fuel-
monitor/Pages/price-analysis.aspx
Jet fuel and Crude Oil price. Source: Airline
Financial Monitor. May-June 2013. IATA.
Aviation jet fuel costs
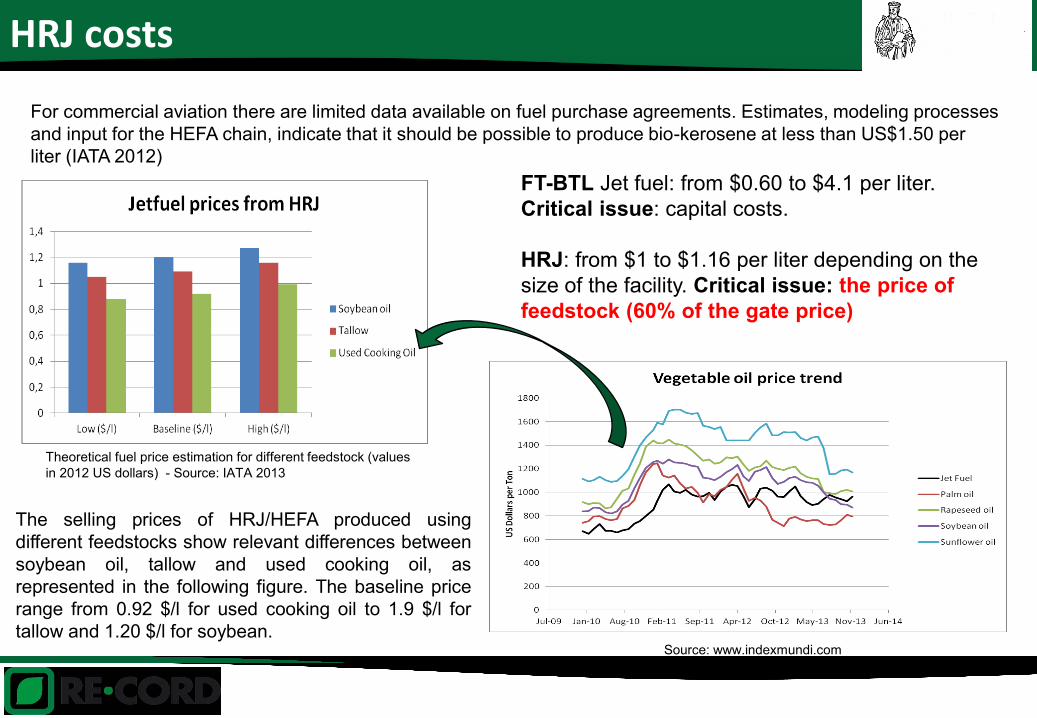
The selling prices of HRJ/HEFA produced using
different feedstocks show relevant differences between
soybean oil, tallow and used cooking oil, as
represented in the following figure. The baseline price
range from 0.92 $/l for used cooking oil to 1.9 $/l for
tallow and 1.20 $/l for soybean.
Theoretical fuel price estimation for different feedstock (values
in 2012 US dollars) - Source: IATA 2013
For commercial aviation there are limited data available on fuel purchase agreements. Estimates, modeling processes
and input for the HEFA chain, indicate that it should be possible to produce bio-kerosene at less than US$1.50 per
liter (IATA 2012)
FT-BTL Jet fuel: from $0.60 to $4.1 per liter.
Critical issue: capital costs.
HRJ: from $1 to $1.16 per liter depending on the
size of the facility. Critical issue: the price of
feedstock (60% of the gate price)
Source: www.indexmundi.com
HRJ costs
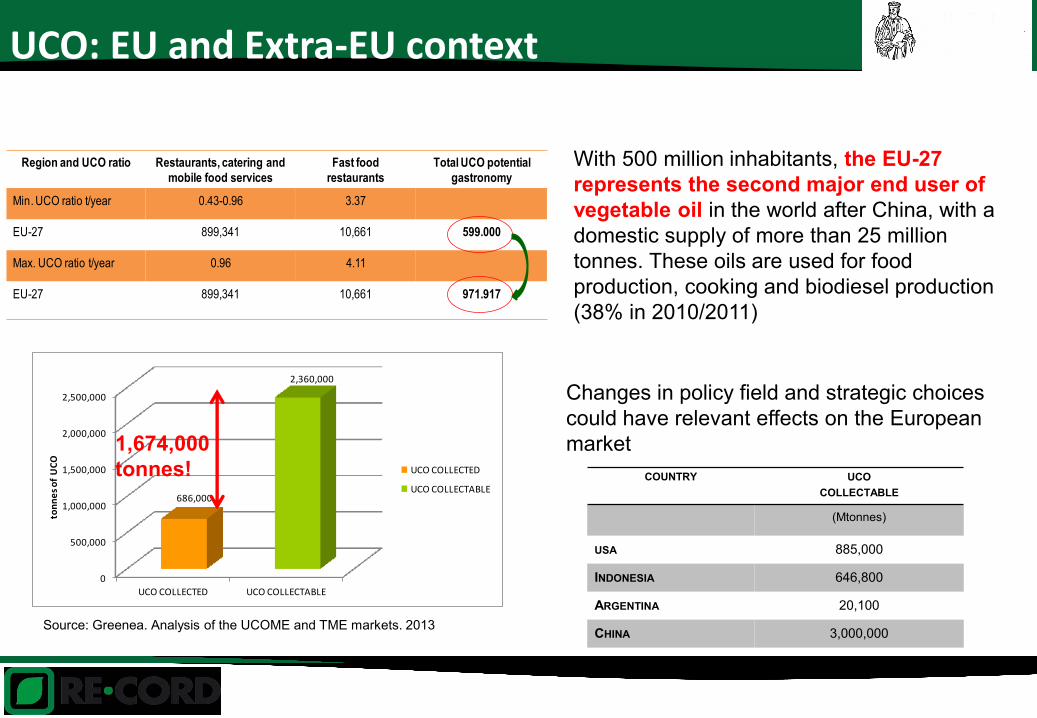
0
500,000
1,000,000
1,500,000
2,000,000
2,500,000
UCO COLLECTED UCO COLLECTABLE
686,000
2,360,000
ton
ne
s o
f U
CO
UCO COLLECTED
UCO COLLECTABLE
Source: Greenea. Analysis of the UCOME and TME markets. 2013
Region and UCO ratio Restaurants, catering and
mobile food services
Fast food
restaurants
Total UCO potential
gastronomy
Min. UCO ratio t/year 0.43-0.96 3.37
EU-27 899,341 10,661 599.000
Max. UCO ratio t/year 0.96 4.11
EU-27 899,341 10,661 971.917
With 500 million inhabitants, the EU-27
represents the second major end user of
vegetable oil in the world after China, with a
domestic supply of more than 25 million
tonnes. These oils are used for food
production, cooking and biodiesel production
(38% in 2010/2011)
COUNTRY UCO
COLLECTABLE
(Mtonnes)
USA 885,000
INDONESIA 646,800
ARGENTINA 20,100
CHINA 3,000,000
TOTAL 4,551,900
Changes in policy field and strategic choices
could have relevant effects on the European
market1,674,000
tonnes!
UCO: EU and Extra-EU context
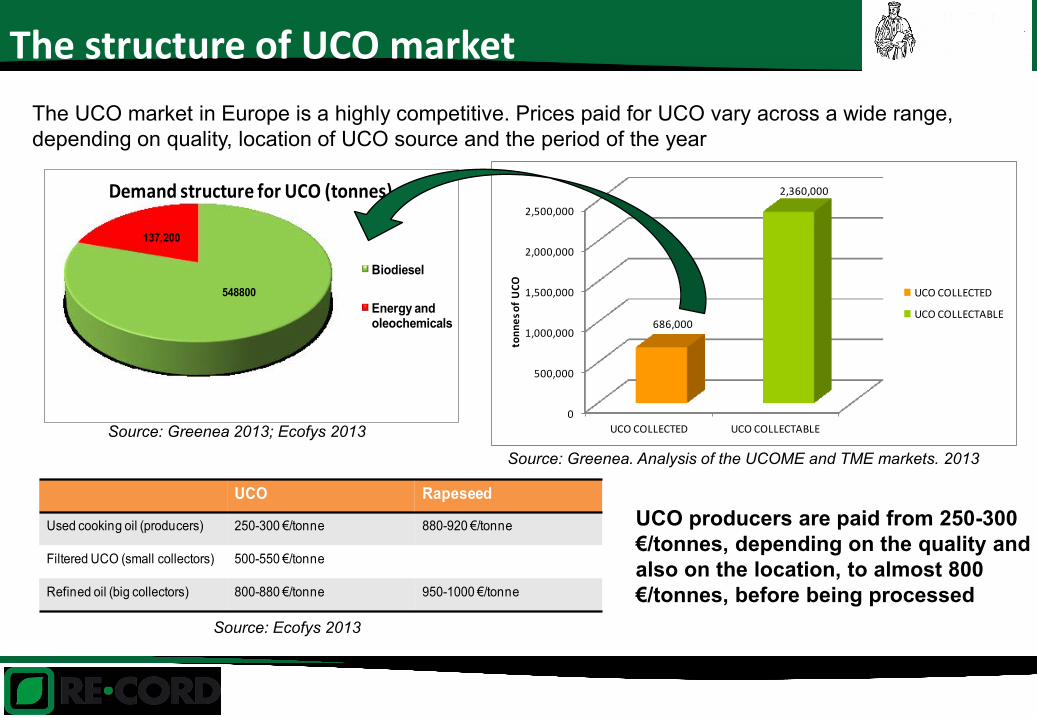
0
500,000
1,000,000
1,500,000
2,000,000
2,500,000
UCO COLLECTED UCO COLLECTABLE
686,000
2,360,000
ton
ne
s o
f U
CO
UCO COLLECTED
UCO COLLECTABLE
The UCO market in Europe is a highly competitive. Prices paid for UCO vary across a wide range,
depending on quality, location of UCO source and the period of the year
548800
137,200
Demand structure for UCO (tonnes)
Biodiesel
Energy and oleochemicals
UCO producers are paid from 250-300
€/tonnes, depending on the quality and
also on the location, to almost 800
€/tonnes, before being processed
UCO Rapeseed
Used cooking oil (producers) 250-300 €/tonne 880-920 €/tonne
Filtered UCO (small collectors) 500-550 €/tonne
Refined oil (big collectors) 800-880 €/tonne 950-1000 €/tonne
Source: Ecofys 2013
Source: Greenea 2013; Ecofys 2013
Source: Greenea. Analysis of the UCOME and TME markets. 2013
The structure of UCO market