Embed Size (px)
Citation preview

Texas A&M International University Texas A&M International University
Research Information Online Research Information Online
Theses and Dissertations
7-16-2021
Evaluation of Antimicrobial Activity & Phytochemical Analysis of Evaluation of Antimicrobial Activity & Phytochemical Analysis of
Two South Texas Species of the Fabaceae Family Two South Texas Species of the Fabaceae Family
Peter Cavazos
Follow this and additional works at: https://rio.tamiu.edu/etds
Recommended Citation Recommended Citation Cavazos, Peter, "Evaluation of Antimicrobial Activity & Phytochemical Analysis of Two South Texas Species of the Fabaceae Family" (2021). Theses and Dissertations. 156. https://rio.tamiu.edu/etds/156
This Thesis is brought to you for free and open access by Research Information Online. It has been accepted for inclusion in Theses and Dissertations by an authorized administrator of Research Information Online. For more information, please contact [email protected], [email protected], [email protected], [email protected].
EVALUATION OF ANTIMICROBIAL ACTIVITY & PHYTOCHEMICAL ANALYSIS OF LEAF EXTRACTS
OF TWO SOUTH TEXAS SPECIES OF THE FABACEAE FAMILY
A Thesis
by
PETER CAVAZOS
Submitted to Texas A&M International University in partial fulfillment of the requirements
for the degree of
MASTER OF SCIENCE
May 2020
Major Subject: Biology
EVALUATION OF ANTIMICROBIAL ACTIVITY & PHYTOCHEMICAL ANALYSIS OF LEAF EXTRACTS
OF TWO SOUTH TEXAS SPECIES OF THE FABACEAE FAMILY
A Thesis
by
PETER CAVAZOS
Submitted to Texas A&M International University in partial fulfillment of the requirements
for the degree of
MASTER OF SCIENCE Approved as to style and content by: Chair of Committee, Ruby A. Ynalvez Committee members, Cord Eversole Monica O. Mendez Alfred Addo-Mensah Chair of Department, Michael R. Kidd
May 2020
Major Subject: Biology
iii
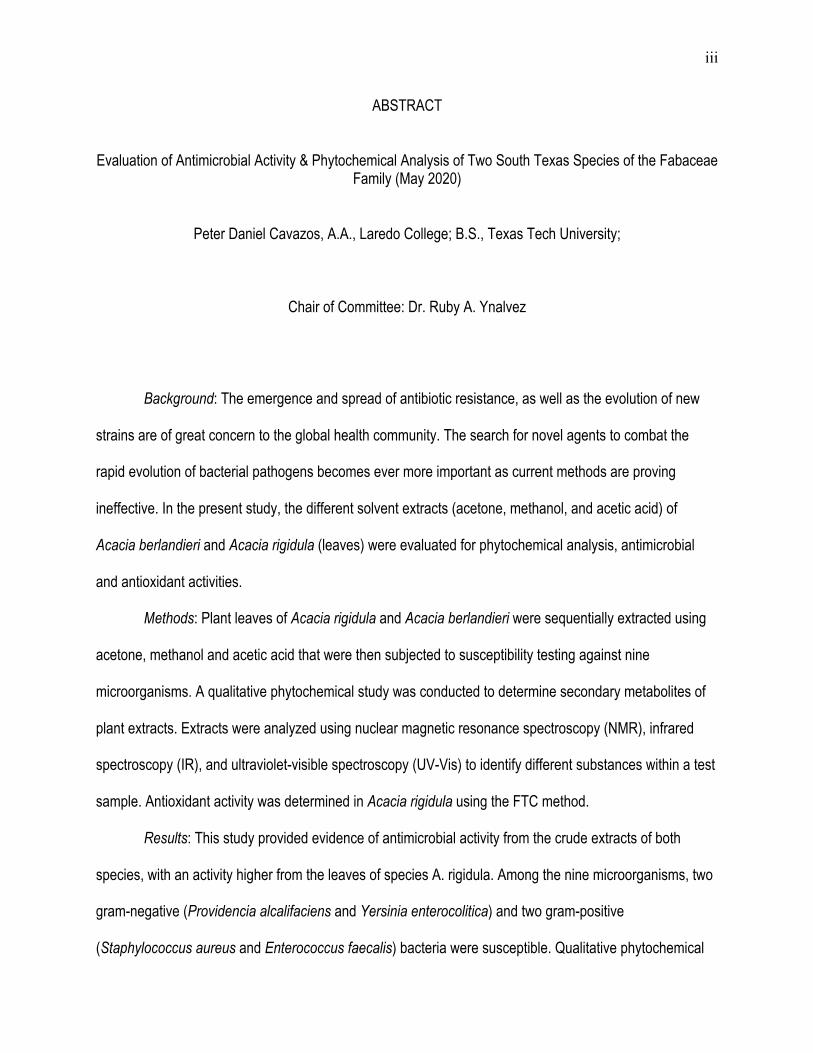
ABSTRACT
Evaluation of Antimicrobial Activity & Phytochemical Analysis of Two South Texas Species of the Fabaceae Family (May 2020)
Peter Daniel Cavazos, A.A., Laredo College; B.S., Texas Tech University;
Chair of Committee: Dr. Ruby A. Ynalvez
Background: The emergence and spread of antibiotic resistance, as well as the evolution of new
strains are of great concern to the global health community. The search for novel agents to combat the
rapid evolution of bacterial pathogens becomes ever more important as current methods are proving
ineffective. In the present study, the different solvent extracts (acetone, methanol, and acetic acid) of
Acacia berlandieri and Acacia rigidula (leaves) were evaluated for phytochemical analysis, antimicrobial
and antioxidant activities.
Methods: Plant leaves of Acacia rigidula and Acacia berlandieri were sequentially extracted using
acetone, methanol and acetic acid that were then subjected to susceptibility testing against nine
microorganisms. A qualitative phytochemical study was conducted to determine secondary metabolites of
plant extracts. Extracts were analyzed using nuclear magnetic resonance spectroscopy (NMR), infrared
spectroscopy (IR), and ultraviolet-visible spectroscopy (UV-Vis) to identify different substances within a test
sample. Antioxidant activity was determined in Acacia rigidula using the FTC method.
Results: This study provided evidence of antimicrobial activity from the crude extracts of both
species, with an activity higher from the leaves of species A. rigidula. Among the nine microorganisms, two
gram-negative (Providencia alcalifaciens and Yersinia enterocolitica) and two gram-positive
(Staphylococcus aureus and Enterococcus faecalis) bacteria were susceptible. Qualitative phytochemical

iv
testing revealed important secondary metabolites: phenols, flavonoids, saponins, terpenoids and tannins.
Each of which have been shown to possess antimicrobial properties and exert different modes of action.
NMR, IR, and UV-Vis spectroscopy revealed the basic structures within our unknown samples that are
commonly found in flavonoids, saponins, and tannins, reinforcing the results of phytochemical testing.
Results revealed antioxidant activity within selected A. rigidula extracts.
Conclusion: Analysis of the leaves extracts of A. berlandieri and A. rigidula have revealed the
presence of medicinally valued bioactive components. This study confirmed the efficacy of selected plant
extracts as natural antimicrobials and suggest the possibility of employing them in drugs for the treatment
of infectious diseases caused by the test organisms.
v
ACKNOWLEDGMENTS
First and foremost, I want to express my deepest gratitude to my research mentor Dr. Ruby A.
Ynalvez for giving me the opportunity to do research and providing invaluable guidance throughout this
project. Her unwavering enthusiasm for research kept me constantly engaged with my project and made
my time at Texas A&M International University enjoyable. It’s been a privilege and honor to work under her
guidance as there is no better mentor I envisioned for my study.
My appreciations also extend to my committee members, Dr. Alfred Addo-Mensah, Dr. Cord
Eversole and Dr. Monica Mendez for their encouragements and insightful comments. I am extending a
heartfelt thanks to Dr. Marcus Ynalvez and Dr. Jocelyn Lanorio for their assistance with the statistical and
chemical analysis. I am thankful for the discussions I had with them regarding research work and in
preparation for my thesis defense.
I would like to pay special regards to David Gonzalez and Yahaira Franco. Their immeasurable
support throughout this project cannot be repaid and I am forever indebted to them. Without their
contributions, this project could not have reached its goal. In addition, the physical and technical
contribution of both graduate and undergraduate students of RAY380 is greatly appreciated.
Finally, I would like to acknowledge with gratitude, the love and support of my family. Thank you for
encouraging me in all of my pursuits and inspiring me to follow my dreams. I am especially grateful to my
parents, who supported me emotionally and financially. Without whom I would never have enjoyed so many
opportunities.
vi
TABLE OF CONTENTS Page ABSTRACT ............................................................................................................................................................. iii
ACKNOWLEDGMENTS .......................................................................................................................................... v
TABLE OF CONTENTS .......................................................................................................................................... vi
LIST OF TABLES................................................................................................................... ................ ...............viii
LIST OF FIGURES ................................................................................................................................................. ix
LIST OF APPENDIX TABLES ................................................................................................................................. x
I. INTRODUCTION ...................................................................................................................................... 1
II. REVIEW OF LITERATURE ...................................................................................................................... 4
Importance of microorganisms ................................................................................................... 4
Antimicrobial activity of Fabaceae plant extracts ...................................................................... 6
Sample preservation and choice of solvents for extraction ........................................................ 7
Biological functions of selected secondary metabolites ………………………. ........................... 8
Phenols ..................................................................................................................................... 8
Tannins ..................................................................................................................................... 9
Terpenoids ................................................................................................................................ 9
Alkaloids ................................................................................................................................... 10
Flavonoids ... ............................................................................................................................ 11
III. METHODS .............................................................................................................................................. 12
Plant collection ......................................................................................................................... 12
Crude extraction ....................................................................................................................... 13
Microbial cell culturing .............................................................................................................. 13
Bacterial inoculum preparation ................................................................................................. 14
Testing for antibacterial activity ................................................................................................ 14
Statistical analysis .................................................................................................................... 15
vii
Qualitative phytochemical analysis .......................................................................................... 16
Determination of minimum inhibitory concentration (MIC) ....................................................... 19
Chemical analysis .................................................................................................................... 19
Antioxidant Assay ..................................................................................................................... 20
IV. RESULTS AND DISCUSSION ............................................................................................................... 21
Determination and comparison of means of zone of inhibitions between
leaf and stem extracts of the two Acacia species ................................................................... 21
Comparison of means of zone of inhibitions between leaf extracts of
two Acacia species ................................................................................................................... 23
Comparison of the antibacterial activity between both species and
solvents .................................................................................................................................... 25
Comparison of the effect of A. rigidula acetone leaf extracts on mean zone of inhibitions
among four bacterial pathogens ............................................................................................... 29
Determination of minimum inhibitory concentration (MIC) ....................................................... 30
Qualitative phytochemical analysis .......................................................................................... 32
Chemical analysis .................................................................................................................... 36
Antioxidant assay ..................................................................................................................... 41
V. CONCLUSION ........................................................................................................................................ 45
VI. RECOMMNEDATIONS AND FUTURE STUDIES .................................................................................. 46
VII. REFERENCES ....................................................................................................................................... 47
VIII. APPENDICES ........................................................................................................................................ 53
IX. VITA ........................................................................................................................................................ 55
viii
LIST OF TABLES
Table Page
1 List of gram-positive and gram-negative bacteria and mechanism of action.......................3
2 Antimicrobial activity of acetone, methanol, and acetic acid stem extracts of Acacia
berlandieri and Acacia rigidula against human pathogenic bacterial strains......................21
3 Antimicrobial activity of acetone, methanol, and acetic acid leaf extracts of Acacia
berlandieri and Acacia rigidula against human pathogenic bacterial strains.......................22
4 Average zone of inhibitions in millimeters (mm) of acetone, methanol, and acetic acid leaf
extracts of Acacia berlandieri and Acacia rigidula......................................................….....23
5 Analysis of variance for P. alcalifaciens, Y. enterocolitica, S. aureus, and E. faecalis.......26 6 Analysis of variance for all six samples using acetone as the extraction solvent………….29 7 Determination of minimum inhibitory concentrations using the acetone extract of Acacia
rigidula against the three P. alcalifaciens, Y. enterocolitica, and S. aureus at OD600nm..............................................................................................................................31
8 Determination of the presence of secondary metabolites for the Acacia extracts through
qualitative phytochemical tests………………………………..………....................................33 9 Infrared absorption values of common functional groups found in A. rigidula
extracts....................………………............................................……………........................40 10 Analysis of Variance determining antioxidant potential of A. rigidula extracts....................42 A1. Least square mean of A. rigidula extracts and controls when subjected to
P. alcalifaciens .................................................................................................................... 53
A2 Least square means for the effect of A. rigidula extracts and controls when subjected to P.
alcalifaciens ........................................................................................................................ 53
A3 Least square mean of A. rigidula extracts and controls when subjected to
Y. enterocolitica .................................................................................................................. 53
ix
A4 Least square means for the effect of A. rigidula extracts and controls when subjected to
Y. enterocolitica .................................................................................................................. 53
A5 Least square mean of A. rigidula extracts and controls when subjected to S. aureus ........ 54
A6 Least square means for the effect of A. rigidula extracts and controls when subjected to S.
aureus ................................................................................................................................. 54
A7 Least square mean of six samples of A. rigidula acetone extracts against the four most
susceptible bacteria ............................................................................................................ 54
A8 Least square means for the effect of four microorganism when subjects to six different
replicates of A. rigidula acetone extracts ............................................................................ 54

x
LIST OF FIGURES
Figure Page
1 Schematic diagram to demonstrate the of sampling of leaves and bark from (a) Acacia
berlandieri and (b) Acacia rigidula.......................................................................................12
2 Comparison of the mean zone of inhibitions of Acacia berlandieri and Acacia rigidula
leaf extracts against four human pathogens………….........................................….............27
3 Comparison of mean zone of inhibitions of acetone, methanol, and acetic acid
Acacia rigidula leaf extracts................................................................................................28
4 Efficacy of Acacia rigidula’s acetone extract against P. alcalifaciens, E. faecalis, S. aureus,
and Y. enterocolitica............................................................................................................30
5 1H NMR spectra of Acacia rigidula’s acetone, methanol, and acetic acid extracts..............37
6 Ultraviolet-visible spectra of Acacia rigidula’s acetone, methanol, and acetic
acid extracts.........................................................................................................................39
7 Infrared spectra of Acacia rigidula extracts: acetone, methanol, and acetic Acid................41
8 Antioxidant properties of Acacia rigidula extracts (0.2mg/mL) determined by ferric
thiocyanate method with their 95% confidence intervals ….................................................43
1
INTRODUCTION
Background
Throughout the world many people still rely on plants for medicinal purposes. This is especially true
for countries with large indigenous populations where affordable healthcare and access to medicine can be
nonexistent. Traditional health beliefs are most evident through the use of "bush medicine" by traditional
healers. Traditional healers prepare “bush medicine” because of its easy access as compared to Western
medicine (Maher, 1999). Thus, plants provide an essential support, mending the therapeutic gap in
developing countries (Sen & Chakraborty, 2017). Plants possess valuable properties that prevent
exploitation by other organisms, fight infections, and repair injuries. Secondary metabolites, which are not
directly involved in the normal growth or reproduction, provide plant survival mechanisms which also are
useful to humans. For example, secondary metabolites are a major source of antibiotics, food additives,
and pesticides (Zhou, 2015).
Currently, there are ~20,000 species of known medicinally valuable plants; therefore, the
development of novel drugs from natural sources will become more prevalent in the future because only an
estimated 10% of the world’s biodiversity has been evaluated for these purposes (Amor et al. 2008).
Biosynthesized compounds derived from primary metabolites include: alkaloids, phenols, essential oils,
steroids, lignins, tannins, etc. Each of these secondary metabolites have been the most successful source
of potential drug leads (Dias et al. 2012). Therefore, the discovery of naturally synthesized medicinal
compounds and the challenge of how to access them remains unanswered.
Previous studies have highlighted biological activities within the Fabaceae family.
(González-Burgos et al. 2011; Hossain et al. 2012). It is the second largest family currently used for
medicinal plant purposes with over 490 plant species (Dzoyem et al. 2014). A larger diversity of species
- - - - - - - - - -
The Journal of Analytical Science and Technology was used as a reference for formatting.
2
suggests a greater supply of raw materials for drug discovery and biotechnology (Alvez & Rosa, 2007).
These species possess important medicinal properties and have been widely used as components of
pharmaceutical products. Species like Glycyrrhiza uralensis, Glycyrrhiza inflata, and Glycyrrhiza glabra
have been identified for their inhibitory effects on HIV replication in vitro (Okamoto, 2000). Additionally,
plant materials from nearly 290 species belonging to 100 different genera of Fabaceae have been reported
to be toxic. For instance, many species within the genus Crotalaria contain pyrrolizidine alkaloids, and are
toxic to mammals and birds (Williams & Molyneux, 1987). Plants from the Fabaceae family have high levels
of biological activity, e.g. antimicrobial, antifungal, the medicinal value and a pattern of global ethnomedical
knowledge will only broaden as more species within this family are further evaluated (Mattana et al. 2010;
Jain et al. 2011; Cock, 2012; Jeyakumar, 2015; Zhou, 2015).
According to the World Health Organization (WHO), antibiotic resistance is rising to dangerously
high levels across the globe (Avorn, 2001). This has been attributed to the overuse and misuse of
medications within cultures. Because of these habits, many antibiotics have become ineffective due to the
development of resistance in certain bacteria. The lack of new drug development by pharmaceutical
industries due to a reduced economic incentives and challenges posed by regulatory requirements has also
attributed to the antibiotic resistance crisis (Ventola, 2015). The search for new antimicrobial agents and
their sources is an important line of research as the efficacy of antibiotics are being challenged by bacteria
and their development of resistant genes (Ventola, 2015). The goal of this study is to contribute to the
knowledge of potential novel plant sources with potential of antimicrobial activity towards medicinal drug
development. My specific objectives are to (1) evaluate the antimicrobial potential of different crude plant
extracts (leaves and bark) from the species Acacia rigidula and Acacia berlandieri, sequentially subjected
to acetone, methanol and acetic acid via disc diffusion assays (2) qualitatively determine the
phytoconstituent(s) responsible for the biological activities, and (3) to establish the profile of the bioactive
components present in the extract that exhibited the most significant antimicrobial activity.
3
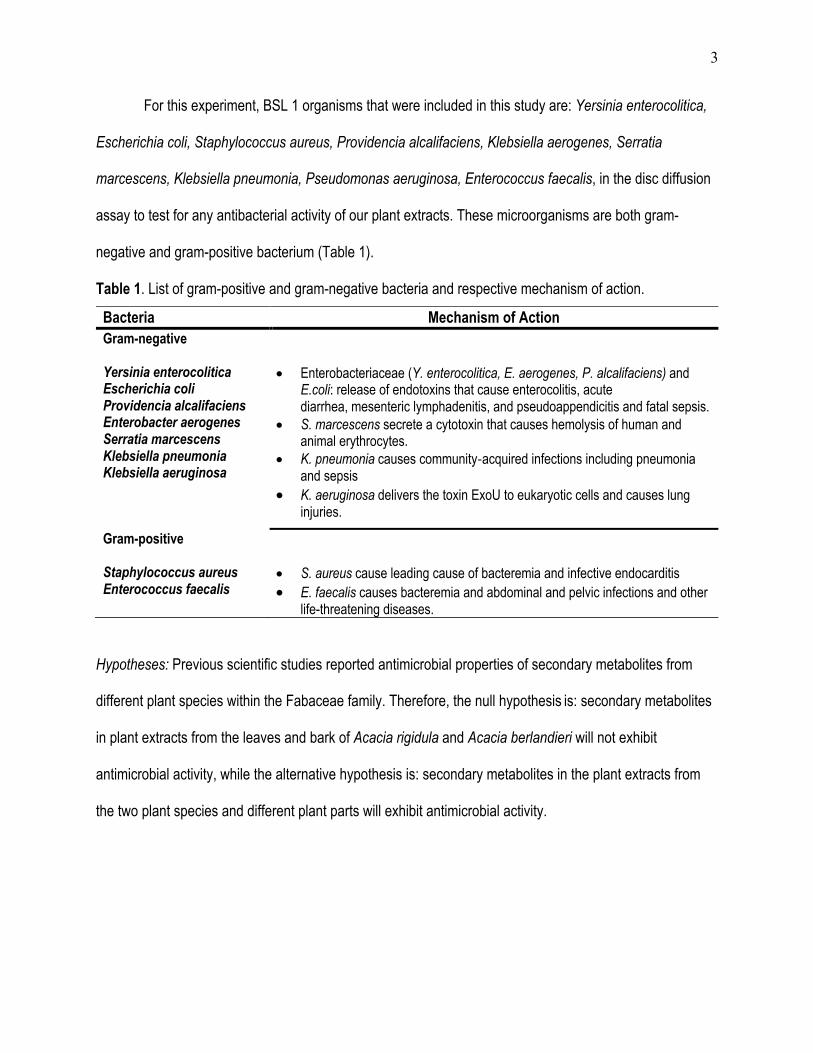
For this experiment, BSL 1 organisms that were included in this study are: Yersinia enterocolitica,
Escherichia coli, Staphylococcus aureus, Providencia alcalifaciens, Klebsiella aerogenes, Serratia
marcescens, Klebsiella pneumonia, Pseudomonas aeruginosa, Enterococcus faecalis, in the disc diffusion
assay to test for any antibacterial activity of our plant extracts. These microorganisms are both gram-
negative and gram-positive bacterium (Table 1).
Table 1. List of gram-positive and gram-negative bacteria and respective mechanism of action.
Bacteria Mechanism of Action Gram-negative Yersinia enterocolitica Escherichia coli Providencia alcalifaciens Enterobacter aerogenes Serratia marcescens Klebsiella pneumonia Klebsiella aeruginosa
• Enterobacteriaceae (Y. enterocolitica, E. aerogenes, P. alcalifaciens) and E.coli: release of endotoxins that cause enterocolitis, acute diarrhea, mesenteric lymphadenitis, and pseudoappendicitis and fatal sepsis.
• S. marcescens secrete a cytotoxin that causes hemolysis of human and animal erythrocytes.
• K. pneumonia causes community-acquired infections including pneumonia and sepsis
• K. aeruginosa delivers the toxin ExoU to eukaryotic cells and causes lung injuries.
Gram-positive Staphylococcus aureus Enterococcus faecalis
• S. aureus cause leading cause of bacteremia and infective endocarditis • E. faecalis causes bacteremia and abdominal and pelvic infections and other
life-threatening diseases.
Hypotheses: Previous scientific studies reported antimicrobial properties of secondary metabolites from
different plant species within the Fabaceae family. Therefore, the null hypothesis is: secondary metabolites
in plant extracts from the leaves and bark of Acacia rigidula and Acacia berlandieri will not exhibit
antimicrobial activity, while the alternative hypothesis is: secondary metabolites in the plant extracts from
the two plant species and different plant parts will exhibit antimicrobial activity.

4
REVIEW OF LITERATURE
Importance of microorganisms
Microorganisms are ubiquitous (Cushnie et al. 2014). Although some are beneficial to humans and
can prevent diseases caused by other bacteria, viruses and fungi; others are pathogenic, that if left
untreated may be detrimental to our health. Their acquisition of resistant genes makes them the ideal
candidates for further research. Every bacterial organism is genetically and physiologically unique;
however, they can easily share genetic material. Therefore, it is important that scientists develop innovative
ways to remain ahead of any outbreaks that may result from mutations or the misuse of synthetic drugs.
Human populations are locked in evolutionary arms races with pathogens that invade our bodies.
We must recognize that these are continuously evolving entities, developing better ways to fight and control
defense mechanisms humans are designing (Avorn, 2001). The rise of harmful “superbug” bacteria
challenges the effectiveness of antibiotics; thus, illnesses and deaths related to superbugs have surpassed
those of more well-known diseases like Ebola or AIDS. The improper use and overuse of antibiotics by
humans has given rise to the most well-known superbug, methicillin-resistant Staphylococcus aureus
(MRSA) (Harmon, 2013). This evolutionary arms race between germs and medicines is a major threat to
public health all over the world as the rate of bacterial resistance is much faster than the production of new
treatments.
Due to the development of resistant bacterial strains, antibacterial activity of plant extracts is a
heavily researched topic (Usman et al. 2009; Mattana et al. 2010; Cock, 2012). These studies present plant
extracts that are tested against a variety of bacterial strains to be used in combating bacterial resistance. It
is well documented that gram-positive organisms are more susceptible to drugs, which is why any results
that would act as a bactericidal to gram-negative microbes in this experiment would be beneficial (Delcour
2008; Woodford & Livermore, 2009; Fair & Tor, 2014).
5
The primary difference between gram-positive and gram-negative bacteria is the difference in the
structure of their bacterial cell wall. Gram-positive bacteria lack an outer lipid membrane that is found in
gram-negative bacteria. The cell wall of gram-positive bacteria is thick, with multiple layers of peptidoglycan
that generally make them more susceptible to antibiotics. However, infections caused by multidrug-resistant
gram-positive bacteria represent a major public health burden, not just in terms of death, but also an
increase expenditure within the health sector as patient management and implementation of infection
control measures are being taken (Woodford & Livermore, 2009). Staphylococcus aureus and
Enterococcus spp. are gram-positive pathogens found in clinical settings, specifically in the hospital
environment. The generation of superbugs, such as methicillin-resistant S. aureus (MRSA), regularly
attracts the public’s interest and, in many countries, there is ongoing research to prevent and reduce MRSA
infection rates. Their ability to survive and persist in a broad range of environments makes these bacterial
species dangerous to human health (Goh et al. 2017).
Gram-negative bacteria cause many types of infections which humans are often diagnosed with.
Several species, including Escherichia coli, are common causes of foodborne diseases (Uzodi et al. 2017).
Gram-negative bacteria can also cause respiratory infections, such as certain types of pneumonia, and
sexually transmitted diseases, including gonorrhea (Sabina et al. 2011). Treating gram-negative bacterial
infections can be difficult because of their extracellular membrane composition. It is this composition of the
outer membrane that adds an extra layer of protection where efflux pumps are commonly found in gram-
negative bacteria (Delcour 2008). By combining the hydrophobic lipid bilayer with channels that are highly
selective, this barrier prevents the crossing of many antibiotic drug classes. Even so, they are still able to
retain the ability to freely exchange genetic material with the external environment and possibly acquire
antibiotic resistant genes from other microorganisms (Delcour 2008). Superbugs, such as vancomycin-
resistant Enterococcus (VRE) and multidrug-resistant Pseudomonas aeruginosa have developed resistance
to certain antibiotics. Examples of gram-negative bacteria that have demonstrated drug resistance to some

6
antibiotics include E. coli, P. aeruginosa and K. pneumoniae (Mattana et al. 2010; Jeyakumar, 2015;
Ventola, 2015; Uzodi et al. 2017). Therefore, new drugs to prevent gram-negative bacterial infections are in
high demand.
Antimicrobial activity of Fabaceae plant extracts
Several species of Fabaceae family have been effective for treating a cough (Abrus precatorius),
diarrhea (Acacia nilotica), conjunctivitis (Acacia karoo), and toothaches (Acacia modesta) (Ashgar et al.
2003; Mazid et al. 2011; Mulaudzi et al. 2011; Deshpande 2013). In addition, these plant species possess
antibacterial properties inhibiting the growth of microorganisms that include E. faecalis, S. aureus, and B.
subtilis (Mulaudzi et al. 2011; Deshpande 2013). Cock (2012) examined the antimicrobial activity of
methanolic extracts of Acacia aulacocarpa leaves and Acacia complanta leaves. Using the disc diffusion
method, the antimicrobial activities of methanolic extracts were tested against a panel of bacteria where A.
aulacocarpa leaf extract inhibited the growth of 6 of the 14 bacteria tested. In a similar study where acetone
and methanol were used as the solvents in samples of Acacia arabica bark, extracts were found to be the
most potent against all the selected bacterial pathogens. In this study, the researchers sequentially
extracted secondary metabolites with acetone being the first solvent followed by methanol. The sequential
extraction was based on the increasing polarity of the solvents (Jeyakumar, 2015). The results of this study
show that extracts prepared from A. arabica bark show varying degrees of antimicrobial activity against
both gram-positive and gram-negative multi-drug resistant organisms selected for the study.
Contrary to the synthetic drugs, antibacterial activities of plant origin are associated with lesser side
effects and have an enormous therapeutic potential to heal many infectious diseases (Demain, 2009).
Plants are continuously being challenged by herbivores and microbes, but they also continuously survive.
Plants, like humans, are at an evolutionary arms race with pathogens, however, the inducible defenses
they possess deems them better fit to adapt. Plants belonging to the Fabaceae are commonly located in
7
harsh environments and the production of certain chemicals, such as anthraquinones, has allowed them to
compete for the survival of their species. The production of anthraquinones and many other structurally
different secondary metabolites allow plants to evolve during plant development as a mechanism of
herbivory, bacterial, and fungal defense (Zhou, 2015). For example, in A. arabica bark extracts,
phytochemical screening revealed the presence of terpenoids, phenols, tannins, flavonoids, and cardiac
glycosides in both the acetone and methanol plant extracts (Jeyakumar 2015). Studies suggest that Acacia
species possess phytochemical constituents with antibacterial properties that can be used to inhibit the
growth of bacteria (Mattana et al. 2010; Jain et al. 2011). Although much has been reported on other
species belonging to the Fabaceae family, to our knowledge, there is no report on the antimicrobial activity
of the species in this study. Identifying potential antibacterial agents through phytochemical analysis is
necessary as results of such studies will lead to the development of drugs against microbes. Thus,
biomolecules of plant origin appear to be a possible alternative for the control of these antibiotic resistant
human pathogens (Kumaraswamy et. al. 2008; Singh & Sharma, 2015).
Sample preservation and choice of solvents for extraction
There are two typical protocols of plant sample preparation prior to solvent extraction: sun drying
and freeze drying. Freeze drying plant samples has been shown to be more advantageous that sun drying
for conserving secondary metabolites. An important aspect of freeze drying is that it limits oxidative
changes of secondary metabolites taking place because the oxygen concentration is very low under
vacuum (Sarker, 2006). The decision of sample preparation in this study was chosen based on the amount
of preservation of phytochemical constituents, which was deemed a preferred method (Saifullah et al.
2019) when determining antimicrobial and antioxidant activity in leaves. Through the process of freeze
drying, enzymes become inactive, microbial growth is inhibited, there is no presence of heat, and
hydrolytically-unstable compounds remain stable under such conditions (Asami et al. 2003; Sarker, 2006;

8
Papoutsis et al. 2017). In addition, the dried material can be stored in a freezer for long periods without
significant degradation of phytochemicals.
The extraction procedure, which is an important step in deriving bioactive constituents from plant
material, has been continuously studied (Azwanida 2015). Traditional methods such as maceration and
Soxhlet extraction are commonly used. However, extraction yield and phytochemical constituents actively
recovered not only depend on the extraction method but are also largely dependent on the type of solvent
used during extraction procedures. The literature suggests that the most suitable solvents used for
extraction are aqueous mixtures containing ethanol, methanol, acetone, and some form of acid (Do et al.
2014). Therefore, the choice of solvents that will extract the desired secondary metabolites is critical.
Previous studies have reported that acetone, methanol and acetic acid extractions recovered
soluble components that inhibited growth of several bacteria. For example, methanol has been generally
found to be more efficient in extracting lower molecular weight phenols, whereas acetone is good for
extraction of flavonoids with higher molecular weights (Do et al. 2014). These results are similar to those of
Mattana (2010) where their extracts, using alcoholic solvents, exhibited a higher degree of antibacterial
activity. They further reported that antimicrobial activity of flavonoids was displayed against methicillin-
resistant Staphylococcus aureus. Other studies have noted that acids are a great solvent for separating
alkaloids on the basis of their solubility in immiscible solvents (Sarker, 2006).
Biological functions of selected secondary metabolites
Phenols
Phenols are compounds with an aromatic benzene ring produced by plants mainly for protection
against stress (Bhattacharya et al. 2010). Phenolics play other important roles in plants, from development
to structural integrity and scaffolding support for plants. There are approximately 8,000 known different
structures of plant phenolics, each with different activities. Modes of action include denaturation of bacterial

9
proteins and lysis of the cell membrane. Different groups of phenolic compounds have different biological
characteristics, and very little is known about the mechanisms by which they contribute to the prevention of
diseases. For example, phenolic phytoalexins, secreted by wounded plants, repel or kill many
microorganisms (Bhattacharya et al. 2010). In addition to the many roles that phenols play in plants,
phenolic metabolites exhibit a series of biological properties that promote human health (Dzialo et al. 2016).
Other studies have demonstrated a wide range of possible biologic mechanisms of action from the
phenols produced in the fruits of plants. Such mechanisms include the protection against cancer, oxidative
stress, anti-inflammatory activity, and anti-estrogenic effects. In addition, polyphenols also act on certain
skin disorders to help prevent or attenuate the progression of such skin conditions (Dzialo et al. 2016).
Tannins
Tannin, also called tannic acid, is a secondary metabolite that is ubiquitous and widely distributed in
plants that serves a purpose in various medical applications. Tannins are synthesized in the rough
endoplasmic reticulum of plants and can easily interact with most proteins. These compounds have been
reviewed to possess antibacterial, antiviral, antitumor and inhibitory effects on enzymes (Nakashima et al.
1992). A study performed on six tannins against Staphylococcus aureus determined that tannins interfered
with fibrin formation in S. aureus (Akiyama et al. 2001). It is also suggested that tannins affect the stability
of enzymes by forming complexes and altering their action and disrupt their overall integrity. This has been
observed in substrates that are required by many microorganisms, in addition to an altering of cell
membranes by bacterium. (Scalbert, 1991). Thus, tannins serve an important role in the defense of plants
against many organisms including bacterium and viruses.
Terpenoids
The fragrance of plants is carried in the essential oil fraction where they are highly enriched in
compounds based on an isoprene structure, otherwise known as terpenes. Along with the wide variety of

10
plant flavors and aromas which are produced by these compounds, terpenes also serve other functions for
plants. Terpenoids are another beneficial phytochemical with more than 40,000 individual compounds
known to exist. Plants have used these secondary metabolites for basic functions like growth, repair and
development. Interestingly, the medicinal use of these compounds has resulted in the production of the
cancer drug Taxol and the antimalarial and a potential anti-cancer drug, artemisinin, both of which are
terpenoid-based drugs. These drugs and their synthetic derivatives are still currently being used as well as
continuously being studied (Luo et al. 2014; Weaver, 2014; Konstat-Korzenny et al. 2018; Li et al. 2018). Of
all the secondary metabolites, terpenoids have been identified for their potential to prevent and treat liver
cancer (Singh & Sharma, 2015). In addition to their anti-cancer properties, terpenoids also have been used
for treatment of lung infections caused by P. aeruginosa (Cowan, 1999). Terpenoids’ chemical composition
and their many biological activities in nature has made them a resource for traditional and modern human
exploitation.
Alkaloids
Application of alkaloid-containing plants dates back to 2000 BCE with the primary use of medicines
for humans and animals, as well as a source of poison (Aniszewski, 2007). The first medically useful
example of an alkaloid was morphine. Alkaloids are a heterocyclic nitrogen compound that serves as a
protective agent for the plant against attack by predators, along with other functions such as end products
of metabolism or waste products, storage reservoirs of nitrogen, and growth regulators (Amirkia & Heinrich,
2014). The applications of alkaloids are not limited to the biological control to repel predators from plants
but also have pharmacological, veterinary and medical importance.
These compounds belong to the beta-carboline group which possess anti-HIV and antiparasitic
activities (Patel et al. 2012). Because alkaloids possess a nitrogen atom with an unshared pair of electrons,
they are able to bind with a wide variety of proteins, enzymes and receptors and influence the integrity of
11
both bacterial and viral enzymes (Cushnie et al. 2014). Finally, several phytochemicals possess
neuroprotective potential and manage neurodegenerative diseases (NDDs). Plant derived components
have been used from the ancient times against related diseases and alkaloids are one of the most reliable
agents against NDDs (Amirkia & Heinrich, 2014).
Flavonoids
Flavonoids are ubiquitous and found in many plant parts. Flavonoids and their metabolites are also
thought to exert modulatory actions in cells through actions on protein kinase and lipid
kinase signaling pathways (Mansuri et al. 2014). More than 6,500 different compounds that fall into
flavonoids have been identified. From the protection against stress and other biotic factors, flavonoids play
an important role between the plant and their environment. In plants, flavonoids have been known to
protect them from harmful UV radiation and subsequent cellular damage (Samanta et al. 2011). Along with
the protective properties for plants, these compounds have been exploited for decades to treat human
diseases. For example, they have favorable biochemical effects associated with diseases that include
cancer, Alzheimer's disease, and atherosclerosis (Panche, 2016). Ongoing research has resulted in the
isolation and identification of flavonoid structures possessing antifungal, antiviral and antibacterial activity.
Resistance to antimicrobial agents continues to become a global pressing issue of concern. Improving our
efforts of finding antimicrobial agents in established classes promotes future discovery of additional
compounds that also possess such capabilities.
12
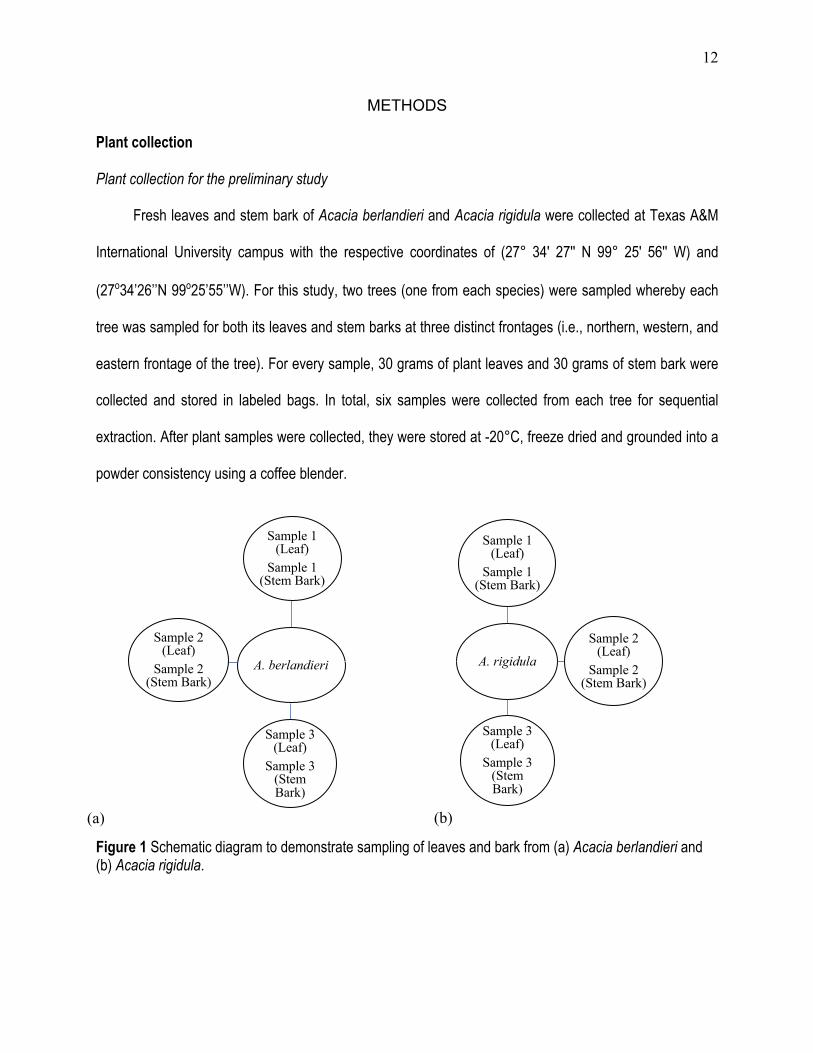
(b)
METHODS
Plant collection
Plant collection for the preliminary study
Fresh leaves and stem bark of Acacia berlandieri and Acacia rigidula were collected at Texas A&M
International University campus with the respective coordinates of (27° 34' 27'' N 99° 25' 56'' W) and
(27o34’26’’N 99o25’55’’W). For this study, two trees (one from each species) were sampled whereby each
tree was sampled for both its leaves and stem barks at three distinct frontages (i.e., northern, western, and
eastern frontage of the tree). For every sample, 30 grams of plant leaves and 30 grams of stem bark were
collected and stored in labeled bags. In total, six samples were collected from each tree for sequential
extraction. After plant samples were collected, they were stored at -20°C, freeze dried and grounded into a
powder consistency using a coffee blender.
Figure 1 Schematic diagram to demonstrate sampling of leaves and bark from (a) Acacia berlandieri and (b) Acacia rigidula.
A. berlandieri
Sample 1 (Leaf)
Sample 1 (Stem Bark)
Sample 3 (Leaf)
Sample 3 (Stem Bark)
Sample 2 (Leaf)
Sample 2 (Stem Bark)
A. rigidula
Sample 1 (Leaf)
Sample 1 (Stem Bark)
Sample 3 (Leaf)
Sample 3 (Stem Bark)
Sample 2 (Leaf)
Sample 2 (Stem Bark)
(a)
13
Plant collection for the main study
From the results of the preliminary study described above, results were averaged across samples.
Based on these results, the species with the higher antimicrobial activity, and the plant part with the higher
antimicrobial activity was selected to become the focus of the main study. The overall protocol for plant part
collection described in the preliminary study was used, with the exception that this time there were six (6)
trees from which samples were collected. Using the one species, the one plant part, and the one frontage
that yielded the highest antimicrobial activity was used as the treatment combination in which to compare the
zone of inhibition (ZOI) of the four bacteria that showed the largest (ZOI) in the preliminary study.
Crude extraction
Each powdered plant sample of A. rigidula and A. berlandieri was extracted separately with
different organic solvents based on the increasing polarity order of 30% acetone < 20% methanol < 7%
acetic acid; and a 1:10 mass: volume ratio. Each sample was homogenized separately in acetone with
shaking (VWR S-500 Orbital Shaker) for 48 hours at 350 rpm. Following the 48 hours shaking, the
homogenate was centrifuged at 3000 rpm for 20 minutes (Beckman GS-15 Series Centrifuge) and the
supernatant was collected and evaporated for the respective solvent using a Hei-VAP Precision rotary
evaporator and finally lyophilized (Labconco 2.5 L). The product after lyophilization was designated as the
extract. The extract was stored in a -20 °C freezer for future use. After centrifugation, the remaining pellet
was added to the next solvent for extraction. The extracts were then tested for their antimicrobial activity.
Microbial cell culturing
The microorganisms tested for antibacterial activity included: Y. enterocolitica, E. coli, S. aureus, P.
alcalifaciens, E. aerogenes, S. marcescens, K. pneumoniae, P. aeruginosa and E. faecalis. Bacteria were
obtained from the microbiology laboratory of the Department of Biology and Chemistry, Texas A&M
14
International University. Following the instructions of the manufacturer, Mueller Hinton (MH) agar (HiMedia
No. 2) was prepared after being autoclaved. Streak plating was performed to prepare master plates and a
single colony of each microorganism was used to prepare overnight cultures for the disc diffusion assay.
Bacterial inoculum preparation
Miller’s LB Broth (Amresco) was prepared following the instruction of the manufacturer and 2 mL
were added to each test tube that were sterilized using the autoclave. A single colony of each bacterium,
grown in our MH culture plates, was transferred into each LB broth tube. Cultures were incubated in a
water bath shaker at 37 °C for 16-18 hours. Following incubation, the turbidity of each LB Broth was diluted
with sterile water to an absorbance level of 0.132 ± 0.005 at 625 nm. This level is optically comparable to
the 0.5 McFarland standards. A spectrophotometer (Bausch and Lomb, Model Spectronic 20) was used to
adjust the absorbance of the suspension. This yielded a bacterial suspension of approximately 0.5-1.0 x
108 CFU/mL (Ynalvez et al. 2018).
Testing for antibacterial activity
Antibacterial activity of bark and leaf extracts were tested by using the disc diffusion method as
described by Tendencai (2004) with some modifications. Using Mueller Hinton agar, the presence of a zone
of inhibition (mm), indicated antibacterial activity by the plant extracts. From our diluted bacteria in the LB
broth tubes, 100 uL were inoculated to Mueller Hinton agar plates. Bacteria were spread onto the plate
using a sterilized L-shaped rod, while being rotated 15 times clockwise on a platform, to ensure equal
distribution of the inoculum. Sterile Whatman 6 mm antibiotic assay discs were impregnated with 20 µL of
the lyophilized plant extracts dissolved in dimethyl sulfoxide (DMSO) at a concentration of 0.5 mg/ µL. The
solvent to prepare extract solutions was DMSO. DMSO served as the negative control due to DMSOs
inability to inhibit bacterial growth.
15
The following antibiotic discs were used as the antibiotic positive controls for the following bacteria:
P. aeruginosa, K. pneumoniae, S. aureus, and E. faecalis 10 µg of vancomycin (Carolina Biological); E.
coli, Y. enterocolitica, E. aerogenes, P. alcalifaciens and S. marcescens- 10 µg of ciprofloxacin (Carolina
Biological). After completing the disc diffusion assay, plates were incubated at 37°C for 18-20 hours. After
incubation, presence of a zone of inhibition (ZOI) and the diameter of the ZOI (largest and smallest) were
measured in millimeters using a Vernier caliper. The test was replicated three times and each replicate with
three trials for the determination of antibacterial activity.
Statistical Analysis
Statistical analysis for the preliminary study
For each of the nine bacteria, an analysis of variance (ANOVA) associated with a 2 x 3 factorial
experiment was performed. In this experiment, species (factor 1) had 2 levels, namely: A. berlandieri and A.
rigidula; and solvents (factor 2) had 3 levels namely: acetone, methanol and acetic acid. To compare the 2
x 3 treatment combinations to both positive (+) and negative (-) controls, a mean comparison was
performed among the 2 x 3 = 6 treatment combinations and the two controls. The plant species x solvent
extracts were randomly allocated within each of the three frontages. Each treatment was given a number
and using a random number generator, this designated the placement of each extract. In all analyses, a
type-I error rate of a = 0.01 (or 1%) was used.
Statistical analysis for the main study
For this experiment, three bacteria that showed the largest ZOI during the preliminary experiment
were compared along with the three extraction solvents. An ANOVA associated with a 3x3 factorial
experiment was performed whereby the six trees served as blocks. By blocking, we reduce the variability
within blocks from external factors and to produce a better estimate of treatment effects. To compare the 3
x 3 = 9 treatment combinations to both the positive (+) and the negative (-) controls, a mean comparison
16
was performed among 9 treatment combinations and the two controls. The bacteria x extracts combinations
were randomly allocated within each of the six trees. In all analyses, a type-I error rate of a= 0.01 (or 1%)
was used.
Qualitative phytochemicals analysis
Each extract was subjected to a standard protocol for phytochemical screening to identify the
active chemical constituents. The results were graded on a scale that ranges from the absence (symbolized
by a “----“) of the respective metabolite, to the presence + (which defines minimal), ++ (intermediate) and
+++ (definite).
Testing for Alkaloids
Dragendorf & Wagner’s test: to prepare Dragendorf reagent, two solutions were prepared. To the
first solution, 0.17 g of bismuth nitrate, 2 mL of acetic acid, and 8 mL of water were added. To the second
solution, 4.0 g of potassium iodide, 10 mL of acetic acid, and 20 mL of water were added. The solutions
were mixed and diluted with distilled water to prepare 100 mL of the Dragendorf’s reagent. Additionally, to
prepare Wagner’s reagent, first 1.27 g of iodine was sublimed. Then, 2.0 g potassium iodide dissolved in 20
mL water, was added to the mixture. Subsequently, the mixture was diluted with distilled water to prepare
100 mL of Wagner’s reagent (Lu et al. 2014). Two hundred mg of extract was dissolved in 10 mL of
ethanol. To the plant extract, 5 mL of 2 M HCl was added. Then, the mixture was heated in a boiling water
bath for 5 minutes. After cooling, the mixture was filtered by centrifugation, and the filtrate was divided into
two equal portions. One portion was treated with 4 drops of Dragendorf reagent and the other with equal
amounts of Wagner’s reagent. The samples were then observed for the presence of turbidity or
precipitation, which indicated the presence of alkaloids. A (+) score was recorded if the reagent produces
only a slight opaqueness; a (++) score was recorded if a definite turbidity, but no flocculation was observed;
and a (+++) score was recorded if a definite heavy precipitate or flocculation was produced (Lu et al. 2014).
17
Testing for Phenols
Ferric chloride test: two mL of the 20mg/mL extract was treated with 3 drops of 10% ferric chloride
solution. Formation of a bluish-black colored solution indicated the presence of phenols (Panti et al. 2014).
Testing for Tannins
Gelatin test: 200 mg of freeze-dried extract was dissolved in 10mL of hot distilled water and later
filtered by centrifugation. The solution was divided into three test tubes. The following was added to the
respective test tube: (1) 0.9% solution of sodium chloride; (2) 0.9% sodium chloride and 1% gelatine
solution; and (3) 4 drops of 1% ferric chloride. Formation of a precipitate in the second treatment and a
characteristic blue, blue-black, green, or blue-green color for the third treatment, indicated the presence of
tannins (Lu et al. 2014; Evans, 2009).
Testing for cardiac glycosides
Legal’s test: 40 mg of freeze-dried extract was dissolved in 2 mL of ethanol and then filtered using
centrifugation. The filtrate was then treated with 1 mL of glacial acetic acid, 4 drops of 10% ferric chloride,
and concentrated 18 M sulfuric acid. The presence of cardiac glycosides was indicated by the green-blue
color indicates (Lu et al. 2014).
Testing for anthranol glycosides
Modified Borntrager’s test: two mL of the 20mg/mL extract was treated with 4 drops of 10% ferric
chloride solution and then immersed in boiling water for 5 minutes. The resulting solution was extracted
with an equal volume of concentrated benzene. Next, the benzene layer was separated by the addition of
10% ammonium hydroxide. The subsequent solution was mixed, and the immediate formation of rose-pink
color solutions indicated the presence of anthranol glycosides (Panti et al. 2014).
18
Testing for Diterpenes
Copper acetate test: two mL of the 20mg/mL extract was treated with 3 drops of copper acetate
solution. Formation of an emerald green solution indicated the presence of diterpenes (Panti et al. 2014).
Testing for Sterols/ Triterpenes
Forty mg of freeze-dried extract was dissolved in 2 mL of chloroform and filtered through
centrifugation. The filtrate was then added to 1 mL of concentrated 18M sulfuric acid. The presence of
sterols was indicated by a two-phase formation, with a red color in the chloroform phase (Lu et al. 2014).
Testing for Saponins
Froth test: Two mL of the 20mg/mL extract was diluted with 18mL of distilled water to make up a
20mL solution. The solution was later mixed, where a formation of about 1 cm layer of foam indicated the
presence of saponins (Panti et al. 2014).
Testing for Flavonoids
Four mL of the 20mg/mL extract, with the addition of 2mL of distilled water, was boiled for 10
minutes. The solution was later filtered by centrifugation. Four drops of 10% ferric chloride solution was
added to 2 mL of the filtrate. A green-blue or violet coloration indicated the presence of a phenolic hydroxyl
group (Usman et al. 2009).
Testing for resins
Precipitate test: 200 mg of the freeze-dried extract was treated with 15 mL of 96% ethanol. The
alcoholic extract was then poured into a beaker that contained 20 mL of distilled water. The presence of a
precipitate indicated a positive result for resins. (Usman et al. 2009).
19
Determination of minimum inhibitory concentration (MIC)
Extracts with the greatest potential of inhibition were further analyzed to determine the minimum
inhibitory concentration of the extracts as described by Chorianopoulos et al. (2006) with modifications. The
extracts were tested in the following concentrations: 0.5 mg/uL, 0.25 mg/uL, 0.1 mg/uL and 0.0625 mg/uL
along with the addition of growth medium inoculated with the selected bacteria that were susceptible to the
extracts. The resulting turbidity was observed after 24 hours, MIC were determined where growth was no
longer visible by assessment of turbidity by optical density readings at 600nm. This was done in triplicates
for each assay.
Chemical Analysis
Standard protocols for chemical analysis were performed by Dr. Jocelyn Lanorio, Department of
Chemistry, Illinois College. Reagents and deuterated NMR solvents were obtained from commercial sources
and used as received. 1H NMR spectra were recorded on a Bruker 300 MHz AVANCE I spectrometer with a
quattro nucleus probe (QNP). Proton chemical shifts were given in d values (ppm) using D2O as solvent at
room temperature.
UV-Vis single beam spectrophotometer Agilent Cary 60 UV-Vis Spectrophotometer was used for the
absorbance measurements in the range 200-800 nm using water as solvent at room temperature. All
measurements were repeated at least thrice to ensure reproducibility.
Solid state IR spectra were recorded on a Varian 640-IR with single bounce ZnSe ATR cell
spectrometer and υmax are partially reported (cm–1). The solid samples were pressed against the diamond
crystal using the attached pressure clamp.
20
Antioxidant Assay
The antioxidant activity of leave extracts was also determined in terms of measurement of % inhibition
of peroxidation in linoleic acid system following a reported method of Sultana et al (2007). Extracts (5 mg)
of each treatment were added to a solution mixture of linoleic acid (0.13 ml), 99.8% ethanol (10 ml) and 10
ml of 0.2 M sodium phosphate buffer (pH 7). Total mixture was diluted to 25 ml with distilled water. The
solution was incubated at 40 C for 15 days and the degree of oxidation was measured following
thiocyanate method with 10 ml of ethanol (75%), 0.2 ml of an aqueous solution of ammonium thiocyanate
(30%), 0.2 ml of sample solution and 0.2 ml of ferrous chloride (FeCl2) solution (20 mM in 3.5% HCl) being
added sequentially. After 3 min of stirring, the absorption values of mixtures measured at 500 nm were
taken as peroxide contents. A control was performed with linoleic acid but without extracts. Percent
inhibition of linoleic acid peroxidation, 100 – [(Abs. increase of sample at 360 h/Abs. increase of control at
360 h) 100], was calculated to express antioxidant activity.
21
RESULTS AND DISCUSSION
Preliminary Study
Determination and comparison of means of zone of inhibitions between leaf and stem extracts of
the two Acacia species
Plant extracts in the Fabaceae family such as Acacia aroma, Acacia arabica, and Mentha spicata
have been reported to possess antimicrobial properties (Mattana et al. 2010; Jain et al. 2011; Jeyakumar,
2015). In this regard, the potential of the presence of antimicrobial activity of six crude extracts (A.
berlandieri’s leaf extracts: acetone, methanol, acetic acid and A. rigidula’s leaf extracts: acetone, methanol,
acetic acid) was investigated. The extracts were subjected to antibacterial assays against nine different
bacteria to determine and to compare the antimicrobial activities between species and plant parts - - stems
and leaves (Tables 2 and Table 3).
Table 2. Antimicrobial activity of acetone, methanol, and acetic acid stem extracts of Acacia berlandieri and Acacia rigidula against human pathogenic bacterial strains.1
A. berlandieri A. rigidula Antibiotic
Human Pathogens Acetone Methanol A.A. Acetone Methanol A.A.
P. alcalifaciens - + - - - - +++ E. aerogenes - - - - - - +++ S. marcescens - - - - - - +++ K. pneumoniae - - - - - - +++ P. aeruginosa - - - + - - +++ Y. enterocolitica - + - - + - +++ E. coli - - - - - - +++ S. aureus + + - - + - +++ E. faecalis - - - - - - +++
1 Three positives (+++) were recorded for extracts showing an average zone of inhibition (ZOI) of greater than 10mm. Two positives (++) for extracts showing an inhibition of between 8-10mm and one positive (+) for extracts with a ZOI between 6-8 mm. A negative (-) was given if nothing was observed around the disc. Antibiotics: Vancomycin (P. aeruginosa, and K. pneumoniae S. aureus and E. faecalis) Ciprofloxacin: (E. coli, Y. enterocolitica, E. aerogenes, P. alcalifaciens and S. marcescens). A.A. is acetic acid. DMSO was used as a negative control and did not inhibit any bacteria, the data was not included.

22
Table 3. Antimicrobial activity of acetone, methanol, and acetic acid leaf extracts of Acacia berlandieri and Acacia rigidula against human pathogenic bacterial strains.1
A. berlandieri A. rigidula Antibiotic
Human Pathogens Acetone Methanol A.A. Acetone Methanol A.A.
P. alcalifaciens + + - +++ ++ + +++ E. aerogenes - - - - - - +++ S. marcescens - - - - - - +++ K. pneumoniae - - - - - - +++ P. aeruginosa + - - - - - +++ Y. enterocolitica + - ++ +++ ++ ++ +++ E. coli ++ + + + + + +++ S. aureus + - - +++ ++ ++ +++ E. faecalis + - + ++ ++ ++ +++
1 Three positives (+++) were recorded for extracts showing an average zone of inhibition (ZOI) of greater than 10mm. Two positives (++) for extracts showing an inhibition of between 8-10mm and one positive (+) for extracts with a ZOI between 6-8 mm. A negative (-) was given if nothing was observed around the disc. Antibiotics: Vancomycin (P. aeruginosa, and K. pneumoniae S. aureus and E. faecalis) Ciprofloxacin: (E. coli, Y. enterocolitica, E. aerogenes, P. alcalifaciens and S. marcescens). A.A. = Acetic acid extract. DMSO was used as a negative control and did not inhibit any bacteria, therefore is not included.
Of the nine bacterial pathogens exposed to the plant extracts, six of them (P. alcalifaciens, P. aeruginosa,
Y. enterocolitica, E. coli, S. aureus and E. faecalis) showed inhibition, while the other three bacteria were not
inhibited. The results demonstrated differences in antimicrobial activities as shown by the differences in mean
zone of inhibitions among plant parts and solvents used for extraction (Tables 2 and 3). The results from this
experiment were used to assess the antimicrobial potential of each crude extract and to determine which
plant would be used for further studies. During the qualitative analysis data were not statistically analyzed.
The results demonstrated that stems from both species, A. rigidula and A. berlandieri did not exhibit promising
antimicrobial activity and were not used in future experiments. Therefore, leaves were again sampled and
tested in order to provide further evidence of the antimicrobial activities present in leaf extracts of A.
berlandieri and A. rigidula.

23
Comparison of means of zone of inhibitions between leaf extracts of two Acacia species
The three leaf extracts (acetone, methanol, acetic acid) per species (A. rigidula and A. berlandieri)
were subjected to antibacterial assays against nine different bacteria where the mean zones of inhibition
were measured (Table 4). Both Acacia species exhibited differences in antimicrobial activities based from
mZOIs. A. berlandieri displayed minimal inhibitory effects (mZOI, 6.00 -8.99 mm) against three of the nine
bacterial species (P. alcalifaciens, P. aeruginosa, and Y. enterocolitica). Six of the nine bacterial species
were susceptible to the A. rigidula extracts (acetone, methanol, and acetic acid): four gram-negative (P.
alcalifaciens, P. aeruginosa, Y. enterocolitica and E. coli) and two gram-positive (S. aureus and E. faecalis).
The ZOIs ranged from 8.70 to 17.56 mm for acetone extract, 7.83 to 14.43 mm for methanol extract, and
6.00 to 12.33 mm for acetic acid extract. Surprisingly, the reports from this study provided different results
against Pseudomonas aeruginosa (Cock, 2012).The remaining gram-negative pathogens (S. marcescens
E. aerogenes, and K. pneumonia) were not inhibited by any of the extracts, consistent with results of the
preliminary experiment.
Table 4. Average zone of inhibitions in millimeters (mm) of acetone, methanol, and acetic acid leaf extracts of Acacia berlandieri and Acacia rigidula.1 A. berlandieri A. rigidula Antibiotic
Human Pathogens Acetone Methanol A. A. Acetone Methanol A. A. P. alcalifaciens 8.05 8.99 7.61 17.56 13.57 12.33 34.40 E. aerogenes 6.00 6.00 6.00 6.00 6.00 6.00 36.00 S. marcescens 6.00 6.00 6.00 6.00 6.00 6.00 35.29 K. pneumoniae 6.00 6.00 6.00 6.00 6.00 6.00 33.56 P. aeruginosa 8.50 8.66 6.00 12.21 11.91 9.55 31.31 Y. enterocolitica 8.62 6.00 6.00 16.50 14.43 12.19 34.79 E. coli 6.00 6.00 6.00 8.70 8.40 6.44 34.69 S. aureus 6.00 6.00 6.00 11.37 9.48 9.55 21.01 E. faecalis 6.00 6.00 6.00 12.07 7.83 6.00 16.13
1Measurements of 6.00 mm were recorded as not having activity (size of disc) while anything above 6.00 mm was recorded as having antimicrobial activity and given the respective value. A.A. is acetic acid. DMSO was used as a negative control and did not inhibit any bacteria (zone of inhibitions were 6.00 mm), therefore is not included.

24
Similar results were reported from two studies of acetone and methanol extracts of two species
belonging to the Fabaceae family, Acacia arabica and Acacia aulacocarpa (Cock, 2012; Jeyakumar, 2015).
Jeyakumar (2015) extracts of A. arabica, using different solvents, showed varying degrees of antimicrobial
activities against gram-positive and gram-negative organisms selected for the study. Three microorganisms
(Escherichia coli, Staphylococcus aureus and Pseudomonas aeruginosa) used in Jeyakumar’s (2015)
study were among three of the six susceptible bacteria in this study. Cock’s study of A. aulacocarpa
revealed that both gram-positive and gram-negative bacteria were inhibited by A. aulacocarpa methanol
extracts. Of the six susceptible bacteria in this study, Yersinia enterocolitica and Staphylococcus aureus,
were also susceptible to A. rigidula’s methanol extract. Furthermore, the three gram-negative bacteria (K.
pneumonia, E. aerogenes and S. marcescens) were not inhibited by neither A. rigidula nor A. berlandieri,
nor were they affected in Cock’s study (2012). Finally, the two gram-positive bacteria included in this
present study (S. aureus and E. faecalis) were both susceptible to our extracts and in agreement with Cock
(2012).
Of the two categories, gram-positive are known to be in general more inhibited than gram-negative
bacteria. Gram-positive bacteria lack the outer membrane, exposing them to antibiotics or in this case,
secondary metabolites. Without the outer membrane, secondary metabolites are able to penetrate the
peptidoglycan envelope and reach the cell membrane of gram-positive bacteria easier (Azzam et al. 2014;
Dzoyem et al. 2014; Ani et al. 2015). In this study, both S. aureus and E. faecalis were inhibited by A.
rigidula leaf extracts. S. aureus and E. faecalis are commonly used gram-positive bacteria which are
susceptible to extracts in other studies as well (Cock, 2012; Azzam et al. 2014; Dzoyem et al. 2014;
Jeyakumar, 2015). The susceptibility of E. faecalis has been reported by the Jaidka et al. (2017) as phenol
derivatives have the ability to partition the lipids of the bacterial cell membrane and mitochondria causing
extensive leakage from bacterial cells leading to death. Conversely, gram-negative bacterial cell wall outer
membrane (a lipopolysaccharide) is thought to act as a barrier to many substances including antibiotics.
25
This was evident by the fact that 5 of the 7 gram-negative bacteria conferred resistance to extracts in this
study and Cock’s study (2012).
Comparison of the antibacterial activity between both species and solvents
The mZOI observed in the plants extracts against P. alcalifaciens, Y. enterocolitica, E. faecalis, and
S. aureus were significantly different to those of DMSO (negative control) at an a = .01 (Table 5). The
analysis of variance determined significance, between plant species (Figure 2) and among solvents to
establish the most effective treatment (Figure 3). The negative control (DMSO) in all assays did not exhibit
any inhibition, thus indicating that the inhibition observed was attributed to the positive control (antibiotics)
or the antibacterial properties exhibited by active components of the extract. The four most susceptible
microorganisms to Acacia extracts are shown by results from the disc diffusion assay (Figure 2). For all four
bacteria, A. rigidula extracts showed significant differences in mean ZOI (a = .01) when compared to A.
berlandieri extracts. Although the extracts of A. berlandieri were not significantly different from DMSO
(negative control), A. rigidula did show a significant difference (Table A1-A6). Lines extending from the
colored bars (blue and green) represent 95% confidence intervals (CIs). Non-overlapping CIs for side-by-
side colored bars indicate significant difference in mean ZOI.
Of the six susceptible bacteria, P. alcalifaciens, Y. enterocolitica, E. faecalis, and S. aureus were
the most inhibited by A. rigidula. Specifically, acetone extracts showed a higher ZOI than methanol and
acetic acid extracts; however, there was no significant difference among the three solvents (Figure 3). The
results from this study are comparable to that of two other studies (Dzoyem et al. 2014; Jeyakumar, 2015).
Both studies used acetone for extraction and reported varying degrees of antimicrobial activity. Dzoyem et
al. (2014) tested nine different plant species within the Fabaceae family, six of them reporting significant
activity against at least one bacterial species. Jeyakumar’s (2015) acetone extracts of A. arabica displayed
promising results, specifically against S. aureus with a mZOI ranging between 17.67 to 22.67 mm. These
26
results set the baseline to use A. rigidula’s acetone extract for further analysis or in the main study. In this
study more replications were used and aimed to determine any significant difference among the ZOI of the
three bacteria that have shown the largest ZOI.
Table 5. Analysis of variance for P. alcalifaciens, Y. enterocolitica, S. aureus, and E. faecalis.1
1*,**, and ***Denote significance at the 0.05, 0.01 and 0.001 level, respectively
Human Pathogens Source SS DF MS F Value P>F
P. alcalifaciens Block 0.111348 2 0.055674 0.02 0.9836
Species 142.361345 1 142.361345 42.38 <.0001 ***
Extract 3809.853758 4 952.463442 283.51 <.0001 ***
Species*Extract 78.523976 4 19.630994 5.84 0.0034 **
Y. enterocolitica Block 10.304587 2 5.152294 2.84 0.0845
Species 16.815053 1 16.815053 9.28 0.007 **
Extract 1250.401728 4 312.600432 172.49 <.0001 ***
Species*Extract 47.544595 4 11.886149 6.56 0.0019 ***
S. aureus Block 8.4296867 2 4.2148433 3.47 0.0533
Species 38.5333333 1 38.5333333 31.69 <.0001 ***
Extract 697.7986348 4 174.4496587 143.49 <.0001 ***
Species*Extract 30.4724481 4 7.618112 6.27 0.0024 **
E. faecalis Block 45.928165 2 22.964083 6.47 0.0076 **
Species 137.723471 1 137.723471 38.79 <.0001 ***
Extract 3229.575826 4 807.393956 227.4 <.0001 ***
Species*Extract 113.759614 4 28.439904 8.01 0.0007 ***

27
Figure 2. Comparison of the mean zone of inhibitions of Acacia berlandieri and Acacia rigidula leaf extracts against four human pathogens. A) P. alcalifaciens (p<0.001), B) E. faecalis (p=0.007), C) S. aureus (p<0.001), and D) Y. enterocolitica (p<0.001).
02468
101214161820
A. berlandieri A. rigidula
mZO
I(mm
)
D)
02468
101214161820
A. berlandieri A. rigidula
mZO
I (m
m)
0
2
4
6
8
10
12
14
A. berlandieri A. rigidula
mZO
I(mm
)
B)
0
2
4
6
8
10
12
14
A. berlandieri A. rigidula
mZO
I (m
m)
C)
A)

28
Figure 3. Comparison of mean zone of inhibitions of acetone, methanol, and acetic acid Acacia rigidula leaf extracts. Notes: A) P. alcalifaciens, B) Y. enterocolitica, and C) S. aureus. Bars within a bacterial treatment, non-overlapping confidence intervals indicate significant difference at a= .01. See appendices (pages 54-55) for least mean squares and respective p values.
0
10
20
30
40
P. alcalifaciens
mZOI
(mm)
positive control acetone methanol acetic acid negative controlExtracts:
A)
0
10
20
30
40
Y. enterocolitica
mZOI
(mm)
positive control acetone methanol acetic acid negative controlExtracts:
0
10
20
30
40
S. aureus
mZOI
(mm)
positive control acetone methanol acetic acid negative controlExtracts:
B)
C)
29
Main Study
Comparison of the effect of A. rigidula acetone leaf extracts on mean zone of inhibitions among four
bacterial pathogens
Four bacterial pathogens were subjected to acetone extracts of Acacia rigidula from six different
samples (n=72). Mean ZOIs of acetone extracts against P. alcalifaciens, E. faecalis, S. aureus, and Y.
enterocolitica ranged from 10.41 to 14.65mm, 9.51 to 13.17mm, 12.44 to 14.97mm, 11.72 to 16.44mm,
respectively. Each assay was replicated in quadruplets and showed consistent antimicrobial activity (Figure
4). Neither bacterial species was statistically significant from the others but Y. enterocolitica did display the
highest mZOI compared to the other microorganisms (Table A7 and A8). None of the six extracts showed a
significant difference amongst one another but were significantly different when compared to DMSO
(negative control) (Table 6). The antibiotics used as positive controls (Ciprofloxacin and Vancomycin) were
significantly more active against the four bacterial species when compared to all the plant extracts and
DMSO.
Table 6. Analysis of variance for all six samples using acetone as the extraction solvent.
***Denote significance at the 0.001 level, **Denote significance at the 0.01 level.
After comparing the six different samples to one another, pooling the data provided the analysis to
compare the efficacy per treatment against the four microorganisms (Figure 4). As expected, the antibiotics
displayed a significantly higher ZOI compared to the acetone extract and the negative control. In addition,
when comparing each bacterium, neither of them were statistically significant from one another. However,
there is a significant difference in the ZOI of the acetone extract against all four microorganisms when
Source SS DF MS F Value P>F
Block 17.124672 5 3.424934 0.97 0.4436 Bacteria 54.356074 3 18.118691 5.14 0.0033 ** Extract 3313.970685 2 1656.985342 469.86 <.0001 *** Bacteria*Extract 116.705236 6 19.450873 5.52 0.0002 ***
30
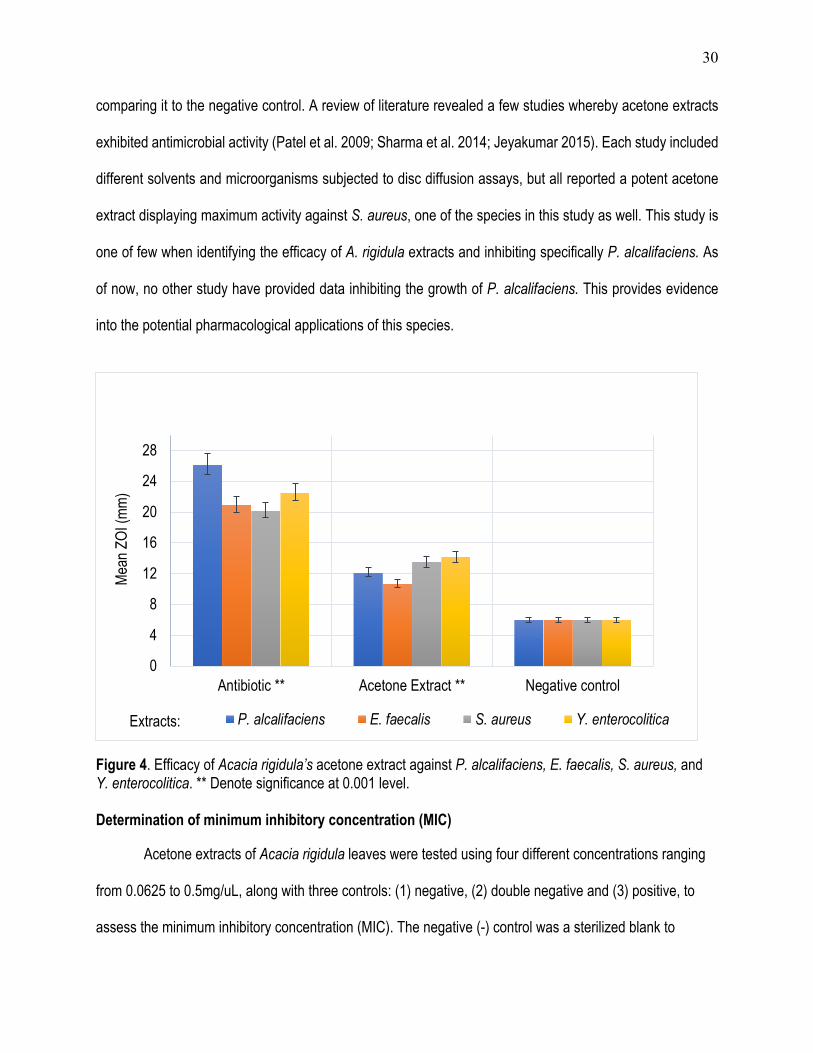
comparing it to the negative control. A review of literature revealed a few studies whereby acetone extracts
exhibited antimicrobial activity (Patel et al. 2009; Sharma et al. 2014; Jeyakumar 2015). Each study included
different solvents and microorganisms subjected to disc diffusion assays, but all reported a potent acetone
extract displaying maximum activity against S. aureus, one of the species in this study as well. This study is
one of few when identifying the efficacy of A. rigidula extracts and inhibiting specifically P. alcalifaciens. As
of now, no other study have provided data inhibiting the growth of P. alcalifaciens. This provides evidence
into the potential pharmacological applications of this species.
Figure 4. Efficacy of Acacia rigidula’s acetone extract against P. alcalifaciens, E. faecalis, S. aureus, and Y. enterocolitica. ** Denote significance at 0.001 level. Determination of minimum inhibitory concentration (MIC)
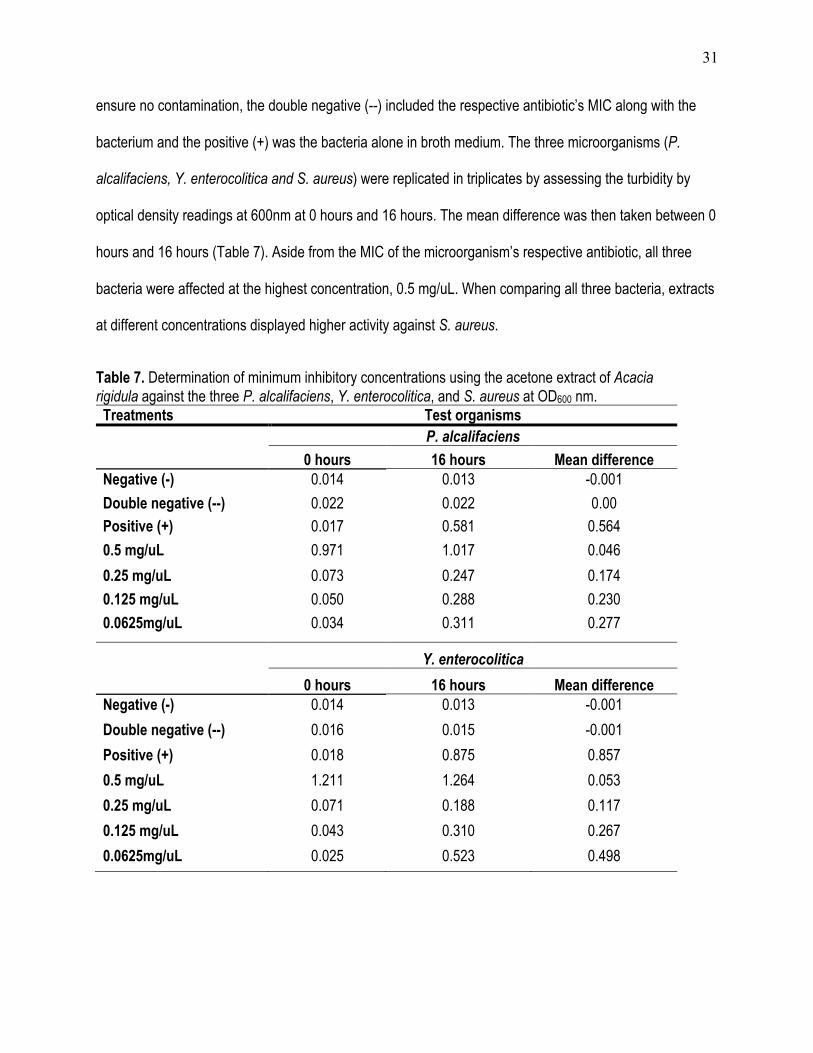
Acetone extracts of Acacia rigidula leaves were tested using four different concentrations ranging
from 0.0625 to 0.5mg/uL, along with three controls: (1) negative, (2) double negative and (3) positive, to
assess the minimum inhibitory concentration (MIC). The negative (-) control was a sterilized blank to
0
4
8
12
16
20
24
28
Antibiotic ** Acetone Extract ** Negative control
Mean
ZOI
(mm)
Extracts: P. alcalifaciens E. faecalis S. aureus Y. enterocolitica
31
ensure no contamination, the double negative (--) included the respective antibiotic’s MIC along with the
bacterium and the positive (+) was the bacteria alone in broth medium. The three microorganisms (P.
alcalifaciens, Y. enterocolitica and S. aureus) were replicated in triplicates by assessing the turbidity by
optical density readings at 600nm at 0 hours and 16 hours. The mean difference was then taken between 0
hours and 16 hours (Table 7). Aside from the MIC of the microorganism’s respective antibiotic, all three
bacteria were affected at the highest concentration, 0.5 mg/uL. When comparing all three bacteria, extracts
at different concentrations displayed higher activity against S. aureus.
Table 7. Determination of minimum inhibitory concentrations using the acetone extract of Acacia rigidula against the three P. alcalifaciens, Y. enterocolitica, and S. aureus at OD600 nm. Treatments Test organisms P. alcalifaciens 0 hours 16 hours Mean difference Negative (-) 0.014 0.013 -0.001 Double negative (--) 0.022 0.022 0.00 Positive (+) 0.017 0.581 0.564 0.5 mg/uL 0.971 1.017 0.046 0.25 mg/uL 0.073 0.247 0.174 0.125 mg/uL 0.050 0.288 0.230 0.0625mg/uL 0.034 0.311 0.277
Y. enterocolitica 0 hours 16 hours Mean difference Negative (-) 0.014 0.013 -0.001 Double negative (--) 0.016 0.015 -0.001 Positive (+) 0.018 0.875 0.857 0.5 mg/uL 1.211 1.264 0.053 0.25 mg/uL 0.071 0.188 0.117 0.125 mg/uL 0.043 0.310 0.267 0.0625mg/uL 0.025 0.523 0.498
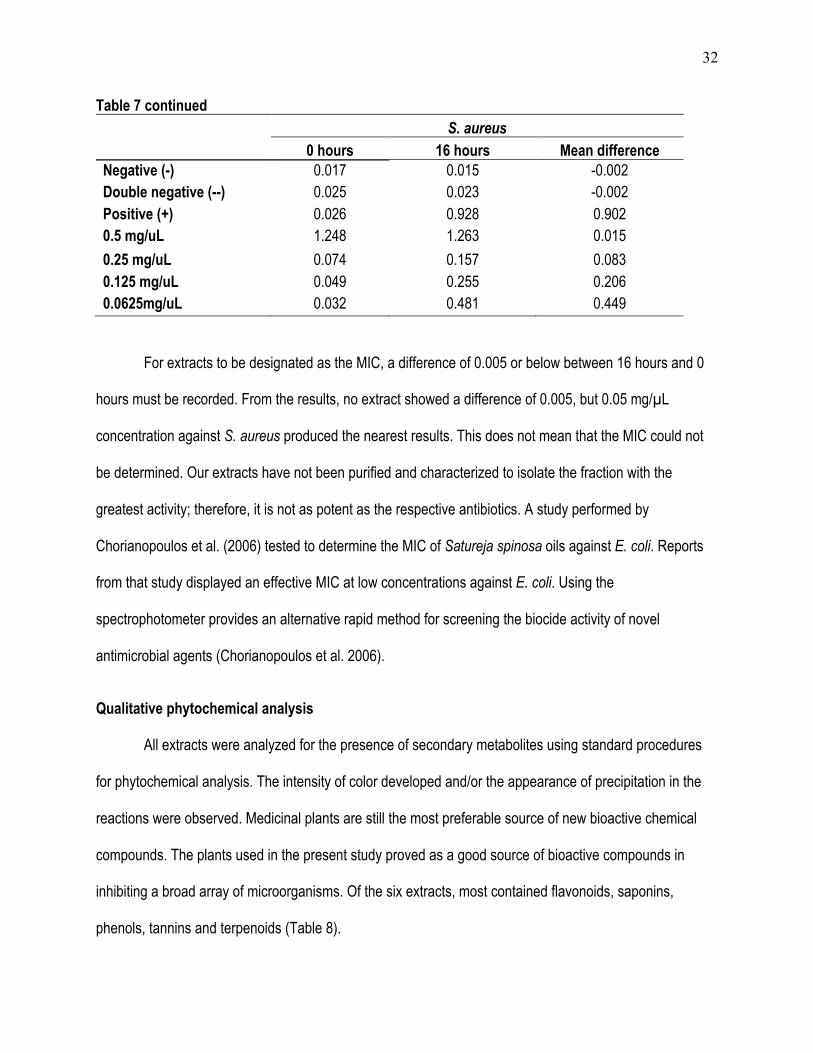
32
Table 7 continued S. aureus 0 hours 16 hours Mean difference Negative (-) 0.017 0.015 -0.002 Double negative (--) 0.025 0.023 -0.002 Positive (+) 0.026 0.928 0.902 0.5 mg/uL 1.248 1.263 0.015 0.25 mg/uL 0.074 0.157 0.083 0.125 mg/uL 0.049 0.255 0.206 0.0625mg/uL 0.032 0.481 0.449
For extracts to be designated as the MIC, a difference of 0.005 or below between 16 hours and 0
hours must be recorded. From the results, no extract showed a difference of 0.005, but 0.05 mg/μL
concentration against S. aureus produced the nearest results. This does not mean that the MIC could not
be determined. Our extracts have not been purified and characterized to isolate the fraction with the
greatest activity; therefore, it is not as potent as the respective antibiotics. A study performed by
Chorianopoulos et al. (2006) tested to determine the MIC of Satureja spinosa oils against E. coli. Reports
from that study displayed an effective MIC at low concentrations against E. coli. Using the
spectrophotometer provides an alternative rapid method for screening the biocide activity of novel
antimicrobial agents (Chorianopoulos et al. 2006).
Qualitative phytochemical analysis
All extracts were analyzed for the presence of secondary metabolites using standard procedures
for phytochemical analysis. The intensity of color developed and/or the appearance of precipitation in the
reactions were observed. Medicinal plants are still the most preferable source of new bioactive chemical
compounds. The plants used in the present study proved as a good source of bioactive compounds in
inhibiting a broad array of microorganisms. Of the six extracts, most contained flavonoids, saponins,
phenols, tannins and terpenoids (Table 8).

33
Table 8. Determination of the presence of secondary metabolites for the Acacia extracts through qualitative phytochemical tests.1
Tests Acacia berlandieri Acacia rigidula
Acetone Methanol Acetic Acid Acetone Methanol Acetic Acid
Cardiac Glycosides
- - - + light green
- + light green
Diterpenes ++ green color
solution
++ +++ emerald green
+++ ++ +
Sterols/ Triterpenes
+ two phase formation,
no red color
+++ two-phase
formation, with red precipitate
+ two-phase formation,
no red color
+ two-phase formation, slight red
+++ two-phase formation, with red
precipitate
+ two-phase
formation, no red color
Phenols +++ dark blue
green color
+++ dark blue
green color
+++ dark blue
green color
+++ dark blue
green color
+++ dark blue
green color
+++ dark blue
green color
Tannins +++ blue-black
color
– no color change
+ slightly dark
color
+++ blue black
color
+++ blue black
color
+++ blue black
color
Flavonoids +++ blue green
color
+++ blue green color
+++ blue green
color
++ blue green
color
+++ blue green
color
+++ blue green
color
Saponins +++ 1 cm foam
layer
+++ 1 cm foam layer
++ 1 cm foam
layer
+++ 1 cm foam
layer
++ 1 cm foam
layer
+++ 1 cm foam
layer 1The compounds, which were clearly present was symbolized as (+++), fairly present as (++), slightly present as (+), whereas negative reactions (−) represent the absence of those particular compounds in respective extracts. All extracts were negative for resins and alkaloids and therefore are not included in the table.
Saponins have several biological effects, some of which are antibacterial, antifungal, and antiviral
(Sparg et al. 2004; Mandal et al. 2005; Freiesleben and Jager, 2014). The presence of saponins in plants
have been related to a defense role against human pathogenic microbes and this was also reported by
Mandal et al. (2005). Of the saponins isolated from Acacia auriculiformis, one of the microorganisms
34
inhibited from the study was Pseudomonas aeruginosa. Similarly, P. aeruginosa was inhibited by extracts
from both species from the data report as all six extracts displayed signs of saponins. Surprisingly, A.
berlandieri exhibited most of its inhibitory effects against gram-negative bacteria. Saponins have been
studied to have antimicrobial mechanisms, which include disruption of the cell membrane integrity.
Saponins have a steroidal or triterpenoid aglycone which is able to form complexes with cholesterol. When
doing so, these surface-active properties increase membrane permeabilization allowing for cells to lyse
(Freiesleben and Jager, 2014).
Tannin compounds have been noted to possess antibacterial, antiviral and inhibitory effects on
enzymes (Nakashima et al. 1992). Studies have suggested that tannins possess antibacterial capabilities,
more importantly on S. aureus (Scalbert, 1991; Akiyama et al. 2001). When exposed to several tannins, S.
aureus is unable to coagulate plasma. The qualitative phytochemical analysis revealed that A. rigidula
extracts exhibited higher amounts of tannins when compared to A. berlandieri. A. berlandieri provided little
to no evidence when testing for tannins in the methanol and acetic acid extract. This can attribute to the
inhibitory effects of all three extracts from A. rigidula, which showed anti-S. aureus activity. Specifically, the
acetone extract of A. rigidula showed the highest activity against S. aureus and displayed greater positive
results of tannins when comparing the three solvents used for extraction.
Terpenoids have been shown to be active against bacteria, fungi, viruses and protozoa and their
mechanism of action is speculated to involve membrane disruption by the lipophilic compounds (Cowan,
1999; Singh and Thakur 2016; Zhou, 2015). All extracts showed different degrees of positive results
containing diterpenes and triterpenes, both of which are a class of terpenoids. Methanol extracts of A.
berlandieri and A. rigidula displayed greater positive results when comparing them to the other solvents.
According to Jeyakumar (2015) and the phytochemical screening of A. arabica, the presence of terpenoids
was confirmed. As mentioned previously, three inhibited test subjects in their study were also affected in
this study. The membrane interactions of terpenoids to modify membrane property and organization have
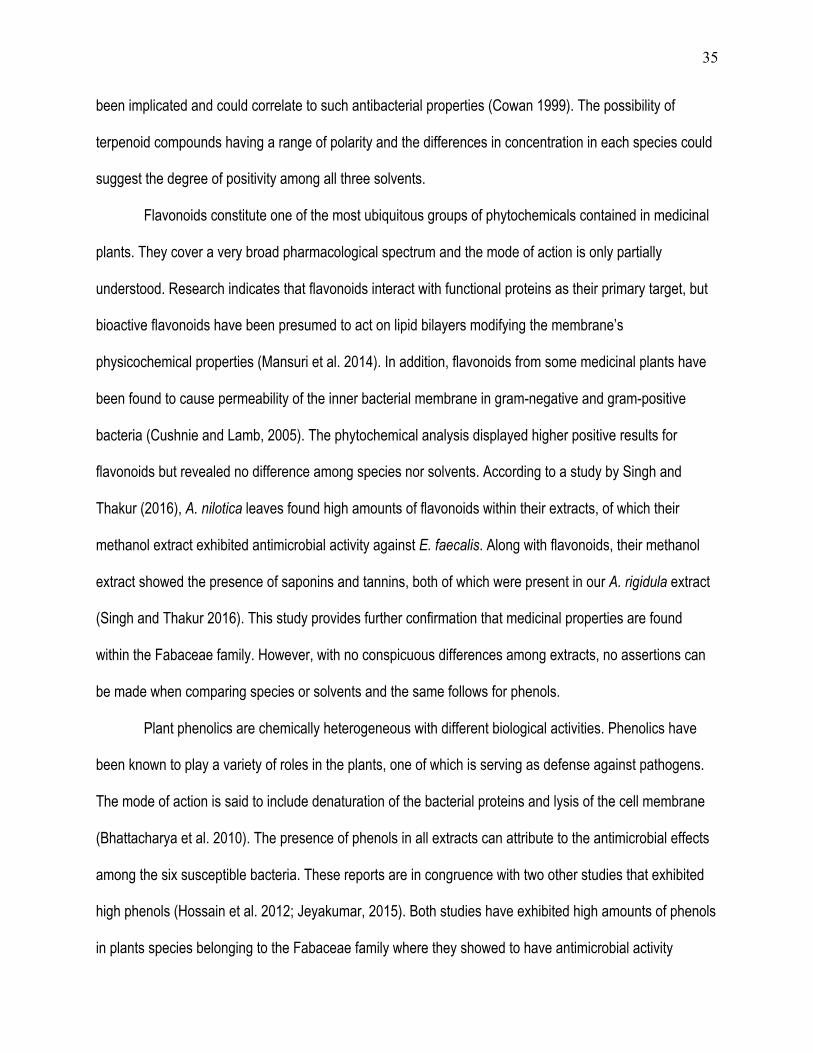
35
been implicated and could correlate to such antibacterial properties (Cowan 1999). The possibility of
terpenoid compounds having a range of polarity and the differences in concentration in each species could
suggest the degree of positivity among all three solvents.
Flavonoids constitute one of the most ubiquitous groups of phytochemicals contained in medicinal
plants. They cover a very broad pharmacological spectrum and the mode of action is only partially
understood. Research indicates that flavonoids interact with functional proteins as their primary target, but
bioactive flavonoids have been presumed to act on lipid bilayers modifying the membrane’s
physicochemical properties (Mansuri et al. 2014). In addition, flavonoids from some medicinal plants have
been found to cause permeability of the inner bacterial membrane in gram-negative and gram-positive
bacteria (Cushnie and Lamb, 2005). The phytochemical analysis displayed higher positive results for
flavonoids but revealed no difference among species nor solvents. According to a study by Singh and
Thakur (2016), A. nilotica leaves found high amounts of flavonoids within their extracts, of which their
methanol extract exhibited antimicrobial activity against E. faecalis. Along with flavonoids, their methanol
extract showed the presence of saponins and tannins, both of which were present in our A. rigidula extract
(Singh and Thakur 2016). This study provides further confirmation that medicinal properties are found
within the Fabaceae family. However, with no conspicuous differences among extracts, no assertions can
be made when comparing species or solvents and the same follows for phenols.
Plant phenolics are chemically heterogeneous with different biological activities. Phenolics have
been known to play a variety of roles in the plants, one of which is serving as defense against pathogens.
The mode of action is said to include denaturation of the bacterial proteins and lysis of the cell membrane
(Bhattacharya et al. 2010). The presence of phenols in all extracts can attribute to the antimicrobial effects
among the six susceptible bacteria. These reports are in congruence with two other studies that exhibited
high phenols (Hossain et al. 2012; Jeyakumar, 2015). Both studies have exhibited high amounts of phenols
in plants species belonging to the Fabaceae family where they showed to have antimicrobial activity

36
against both gram-positive and gram-negative microorganisms. As with the flavonoids, no difference was
exhibited between species or solvents.
Alkaloids have been found to have antimicrobial properties with microbicide effects (Cowan 1999).
However, in this study, no alkaloids were extracted from either species. It is suggested that alkaloids were
not soluble in the following immiscible solvents when extracting alkaloids due to the nature of their polarity
(Sarker, 2006). Singh and Thakur (2016) provided similar findings where A. nilotica leaves extracted with
butanol, ethanol and methanol did not reveal any alkaloids. Singh and Thakur used both polar and nonpolar
solvents for extraction while this study focused primarily on polar solvents (2016). A previous study
performed by Clement et al. (1998) identified several alkaloids in the stems of A. rigidula using chloroform,
a polar solvent but having a lesser dipole moment as the solvents used in this study. They identified several
alkaloid constituents but concluded that early and late seasons of the plant detects varying concentrations
of these derivatives. Therefore, absence of alkaloids could be due to the choice of polar solvents, the age
of the species, and the plant part selected.
Chemical analysis
Nuclear Magnetic Resonance (NMR)
Nuclear Magnetic Resonance provides a sensitive and powerful method of detecting presence of
different protons depending on their chemical environment. It can be used to monitor reaction progress and
detects the presence of different compounds. Due to the high polarity of the extracts, deuterated water
(D2O) was used as the NMR solvent. The extracts were found to be insoluble in common NMR solvents
such as chloroform-d (CDCl3) and benzene-d6 (C6D6). Since, phytochemical analysis provided clues for the
structure of the compounds; the chemical shifts observed were used in order to access different types of
protons that are indicative of the presence of the class of metabolites present in the extract. Representative
1H NMR spectra of extraction solvents of A. rigidula are reported in Figure 5.
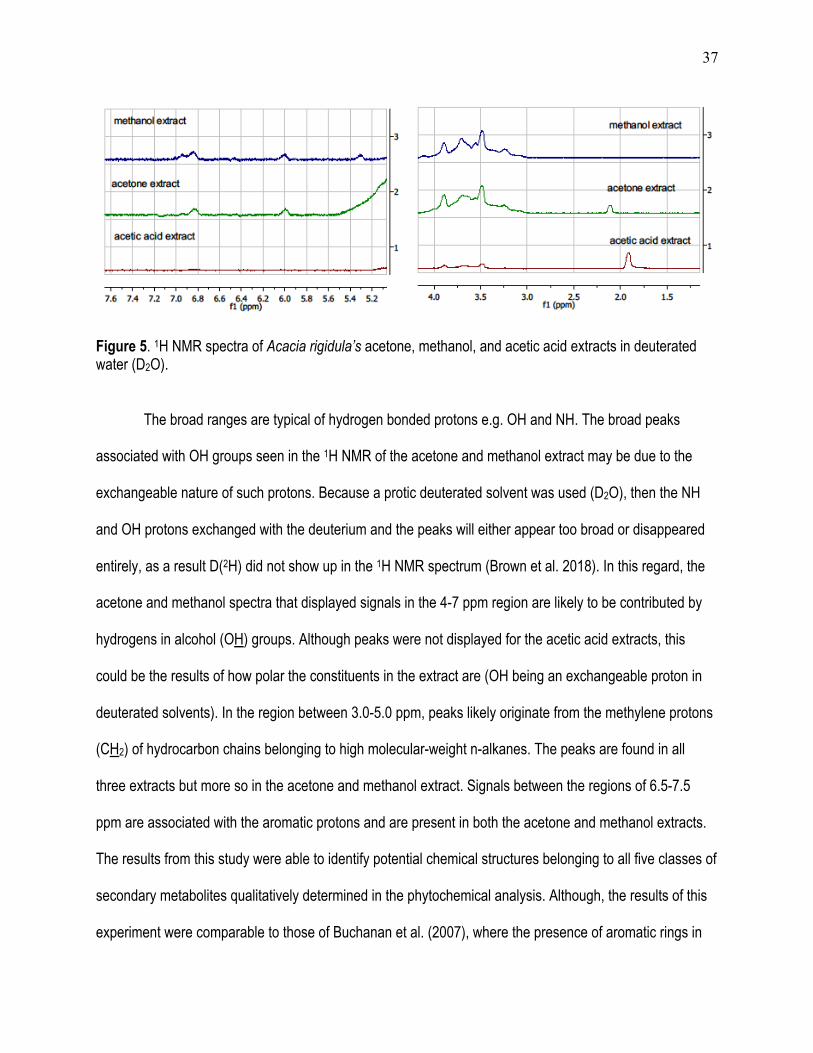
37
Figure 5. 1H NMR spectra of Acacia rigidula’s acetone, methanol, and acetic acid extracts in deuterated water (D2O).
The broad ranges are typical of hydrogen bonded protons e.g. OH and NH. The broad peaks
associated with OH groups seen in the 1H NMR of the acetone and methanol extract may be due to the
exchangeable nature of such protons. Because a protic deuterated solvent was used (D2O), then the NH
and OH protons exchanged with the deuterium and the peaks will either appear too broad or disappeared
entirely, as a result D(2H) did not show up in the 1H NMR spectrum (Brown et al. 2018). In this regard, the
acetone and methanol spectra that displayed signals in the 4-7 ppm region are likely to be contributed by
hydrogens in alcohol (OH) groups. Although peaks were not displayed for the acetic acid extracts, this
could be the results of how polar the constituents in the extract are (OH being an exchangeable proton in
deuterated solvents). In the region between 3.0-5.0 ppm, peaks likely originate from the methylene protons
(CH2) of hydrocarbon chains belonging to high molecular-weight n-alkanes. The peaks are found in all
three extracts but more so in the acetone and methanol extract. Signals between the regions of 6.5-7.5
ppm are associated with the aromatic protons and are present in both the acetone and methanol extracts.
The results from this study were able to identify potential chemical structures belonging to all five classes of
secondary metabolites qualitatively determined in the phytochemical analysis. Although, the results of this
experiment were comparable to those of Buchanan et al. (2007), where the presence of aromatic rings in
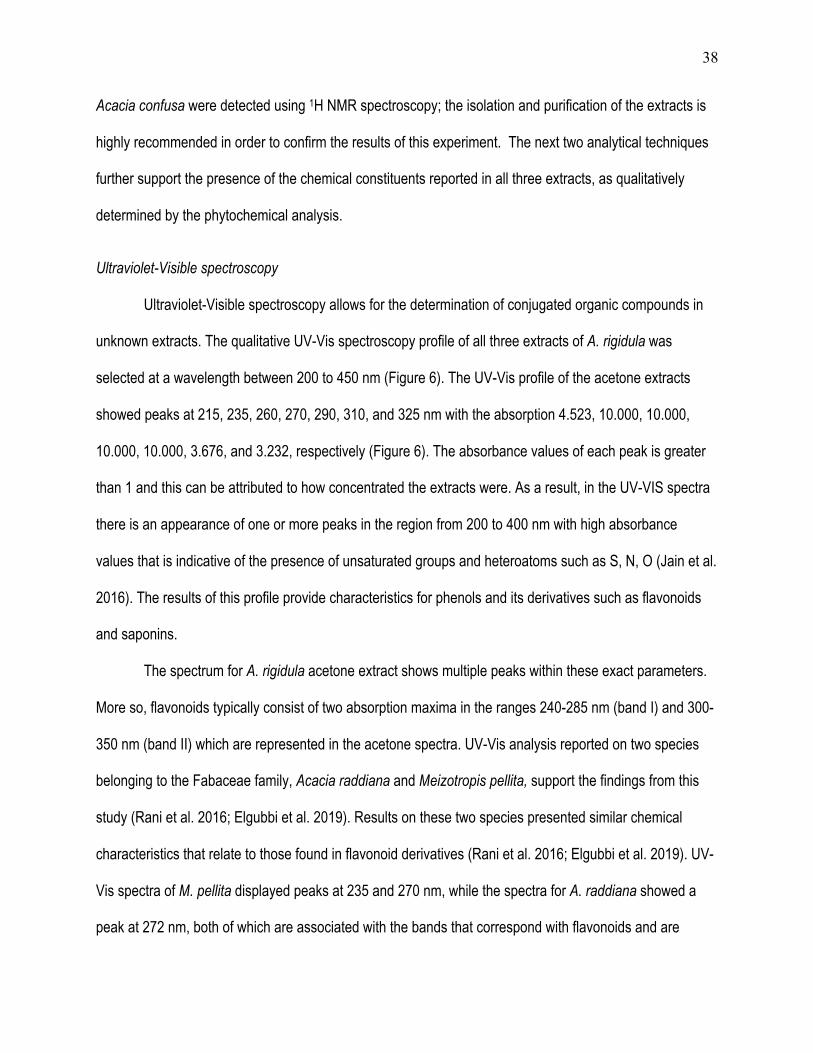
38
Acacia confusa were detected using 1H NMR spectroscopy; the isolation and purification of the extracts is
highly recommended in order to confirm the results of this experiment. The next two analytical techniques
further support the presence of the chemical constituents reported in all three extracts, as qualitatively
determined by the phytochemical analysis.
Ultraviolet-Visible spectroscopy
Ultraviolet-Visible spectroscopy allows for the determination of conjugated organic compounds in
unknown extracts. The qualitative UV-Vis spectroscopy profile of all three extracts of A. rigidula was
selected at a wavelength between 200 to 450 nm (Figure 6). The UV-Vis profile of the acetone extracts
showed peaks at 215, 235, 260, 270, 290, 310, and 325 nm with the absorption 4.523, 10.000, 10.000,
10.000, 10.000, 3.676, and 3.232, respectively (Figure 6). The absorbance values of each peak is greater
than 1 and this can be attributed to how concentrated the extracts were. As a result, in the UV-VIS spectra
there is an appearance of one or more peaks in the region from 200 to 400 nm with high absorbance
values that is indicative of the presence of unsaturated groups and heteroatoms such as S, N, O (Jain et al.
2016). The results of this profile provide characteristics for phenols and its derivatives such as flavonoids
and saponins.
The spectrum for A. rigidula acetone extract shows multiple peaks within these exact parameters.
More so, flavonoids typically consist of two absorption maxima in the ranges 240-285 nm (band I) and 300-
350 nm (band II) which are represented in the acetone spectra. UV-Vis analysis reported on two species
belonging to the Fabaceae family, Acacia raddiana and Meizotropis pellita, support the findings from this
study (Rani et al. 2016; Elgubbi et al. 2019). Results on these two species presented similar chemical
characteristics that relate to those found in flavonoid derivatives (Rani et al. 2016; Elgubbi et al. 2019). UV-
Vis spectra of M. pellita displayed peaks at 235 and 270 nm, while the spectra for A. raddiana showed a
peak at 272 nm, both of which are associated with the bands that correspond with flavonoids and are

39
shown in the results of this study. The findings from UV-Vis analysis were further supplemented with the
analytical technique known as infrared (IR) spectroscopy.
Figure 6. Ultraviolet-visible spectra of Acacia rigidula’s acetone, methanol, and acetic acid extracts.
Infrared Spectroscopy
Infrared spectroscopy was performed to determine the functional groups present in all three
extracts of leaves of A. rigidula. The results obtained in the infrared region enable the identification of the
chemical constituents and elucidation of the structures of compounds. The results of IR peak values and
functional groups are represented in Table 9. The IR spectrum profile is illustrated in Figure 7. The acetone
extract displayed an absorption at 3263.03 cm-1 that is due to the stretching of hydroxyl groups present in
the extract. It gave a strong peak at 2927.47 cm-1 which indicated the presence of C-H group that is due to
0
0.5
1
1.5
2
2.5
3
3.5
4
4.5
5
255 285 315 345 375 405 435 465 495
ABSO
RBA
NC
E
WAVELENGTH (NM)
UV-VISIBLE SPECTRA OF EXTRACTS
Acetone Extract
Methanol Extract
Acetic Acid Extract
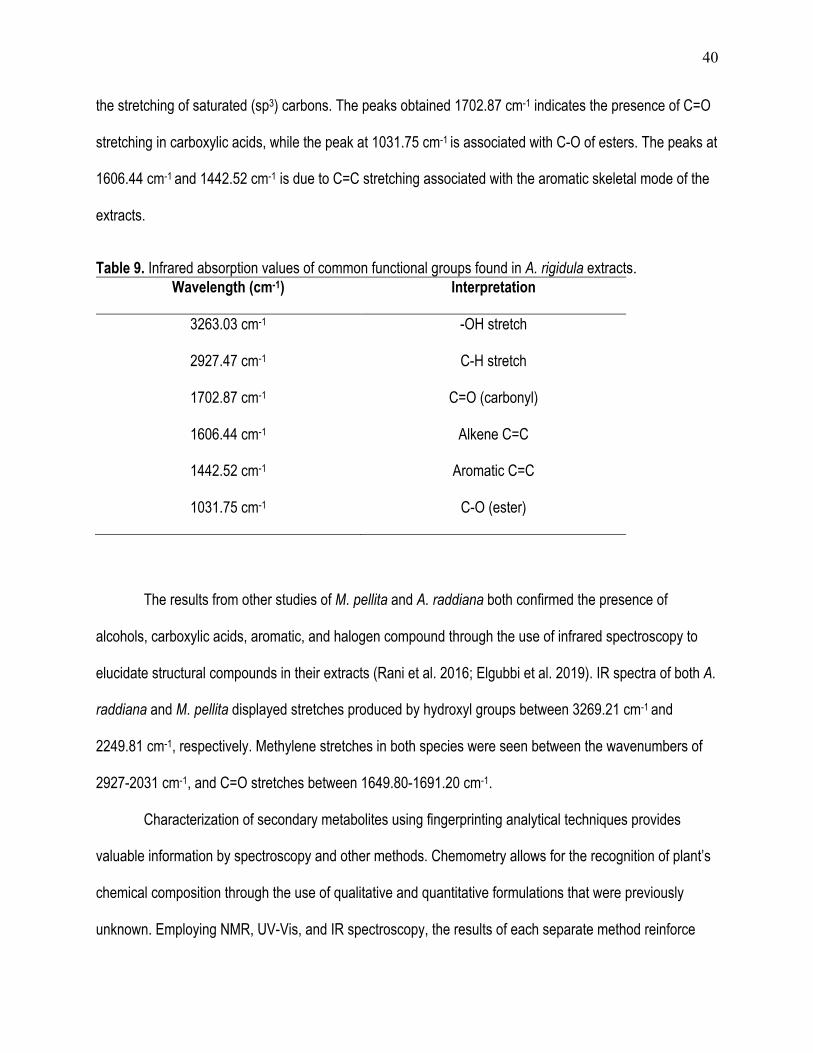
40
the stretching of saturated (sp3) carbons. The peaks obtained 1702.87 cm-1 indicates the presence of C=O
stretching in carboxylic acids, while the peak at 1031.75 cm-1 is associated with C-O of esters. The peaks at
1606.44 cm-1 and 1442.52 cm-1 is due to C=C stretching associated with the aromatic skeletal mode of the
extracts.
Table 9. Infrared absorption values of common functional groups found in A. rigidula extracts. Wavelength (cm-1) Interpretation
3263.03 cm-1 -OH stretch
2927.47 cm-1 C-H stretch
1702.87 cm-1 C=O (carbonyl)
1606.44 cm-1 Alkene C=C
1442.52 cm-1 Aromatic C=C
1031.75 cm-1 C-O (ester)
The results from other studies of M. pellita and A. raddiana both confirmed the presence of
alcohols, carboxylic acids, aromatic, and halogen compound through the use of infrared spectroscopy to
elucidate structural compounds in their extracts (Rani et al. 2016; Elgubbi et al. 2019). IR spectra of both A.
raddiana and M. pellita displayed stretches produced by hydroxyl groups between 3269.21 cm-1 and
2249.81 cm-1, respectively. Methylene stretches in both species were seen between the wavenumbers of
2927-2031 cm-1, and C=O stretches between 1649.80-1691.20 cm-1.
Characterization of secondary metabolites using fingerprinting analytical techniques provides
valuable information by spectroscopy and other methods. Chemometry allows for the recognition of plant’s
chemical composition through the use of qualitative and quantitative formulations that were previously
unknown. Employing NMR, UV-Vis, and IR spectroscopy, the results of each separate method reinforce

41
one another and allow for the confirmation of characteristic functional groups such as carboxylic acids,
alcohols, phenols, esters, and unsaturated hydrocarbons such as alkenes and arenes (C=C). All of which
are necessary for bioactive compounds that could be responsible for the various medicinal properties of
Acacia rigidula.
Figure 7. Infrared spectra of Acacia rigidula extracts: Acetone, Methanol, and Acetic Acid. Peak values are given for distinct functional groups absorbed at their respective value.
Antioxidant assay
Oxidative damage by free radicals plays a critical role in the pathogenesis of human diseases,
including cancer, emphysema, and neurodegenerative diseases such as Alzheimer's disease. Therefore,
there is an increasing demand for identifying exogenous antioxidants to overcome the toxicity generated by
1031.749635
1442.520985
1606.443824
1702.869023
2927.469057
80.0195553263.02875179
84
89
94
99
104
65080095011001250140015501700185020002150230024502600275029003050320033503500365038003950
% T
RAN
SMIT
TAN
CE
WAVENUMBER, CM-1
Acetic Acid Extract Methanol Extract Acetone Extract

42
free radicals (Subhaswaraj et al. 2017). This assay is of interest to determine the antioxidant activity in A.
rigidula extracts. The ferric thiocyanate method was used to assess the ability of all extracts to prevent
oxidation. Therefore, the antioxidant activity of all three extracts of Acacia rigidula was determined using
ferric thiocyanate by measuring the percent inhibition of linoleic acid oxidation (Figure 8). Linoleic acid is a
polyunsaturated fatty acid and under peroxidation, super radicals are formed that oxidizes Fe2+ to Fe 3+
which forms a complex with SCN- and its concentration can be determined by measuring its absorbance at
500nm. The higher the absorbance of each treatment is the result of the concentration of peroxides formed
during the reaction and results in a lower antioxidant activity (Sultana et al. 2007). Significance was found
between the six treatments (Table 10).
Table 10. Analysis of variance determining antioxidant potential of A. rigidula extracts.1
1 ***Denote significance at the 0.001 level.
Of the three extracts, the acetone extract was the only one to exhibit an observable inhibition of
peroxidation having an average of 42%, followed by the methanol extract at 25% and the acetic acid extract
at 6%. All three extracts are being compared to the positive controls, BHT and ascorbic acid, where both
showed inhibition of peroxidation of 70% and 69%, respectively. All three extracts exhibited a significant
difference (p <0.001) of percent inhibition of oxidation compared to one another and the negative control,
linoleic acid. Interestingly, the acetone extract was also the most effective extract at preventing oxidation,
as well as being the best extract for displaying the highest zone of inhibition.
A study performed by Sultana et al. (2007) found antioxidant activity in Acacia nilotica’s acetone
and methanol extract displaying inhibition of peroxidation between the ranges of 75%– 86%, however they
were using bark instead of leaves. The decrease in antioxidant activity among extracts reinforces the
Source SS DF MS F Value P>F Block 5.86701 2 2.93350 2.30 0.1504 Treatment 13857.24693 5 2771.444939 2175.92 <.0001 ***
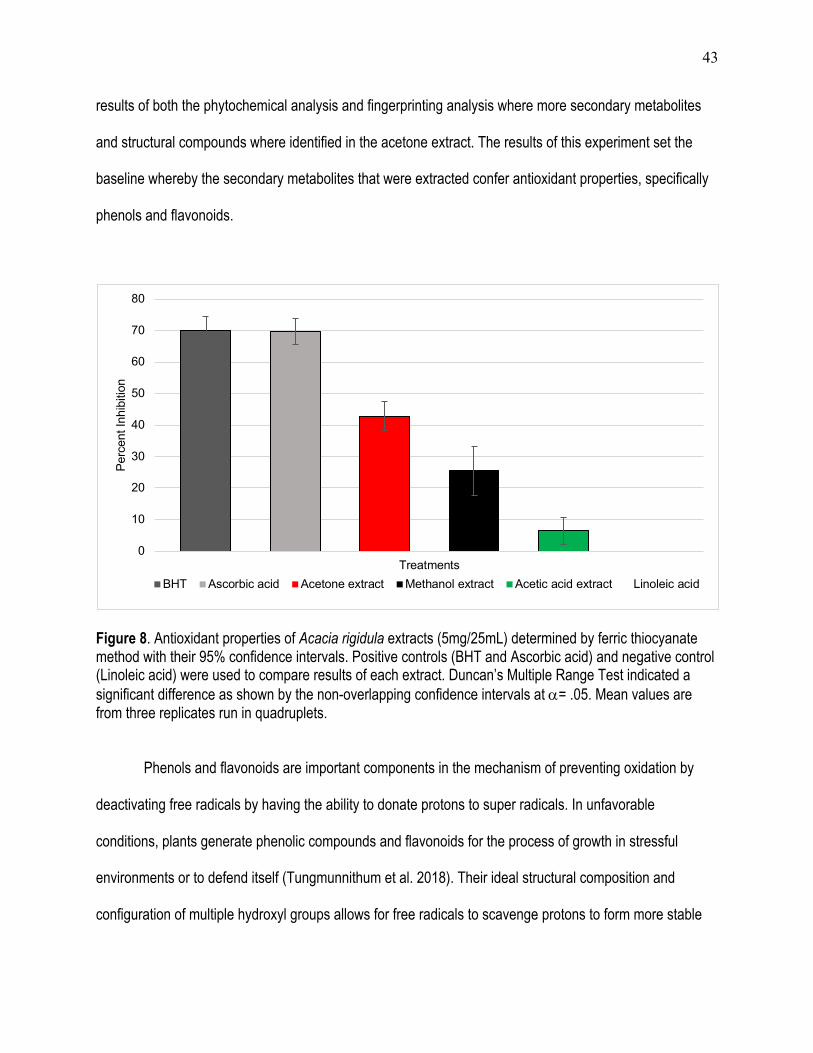
43
results of both the phytochemical analysis and fingerprinting analysis where more secondary metabolites
and structural compounds where identified in the acetone extract. The results of this experiment set the
baseline whereby the secondary metabolites that were extracted confer antioxidant properties, specifically
phenols and flavonoids.
Figure 8. Antioxidant properties of Acacia rigidula extracts (5mg/25mL) determined by ferric thiocyanate method with their 95% confidence intervals. Positive controls (BHT and Ascorbic acid) and negative control (Linoleic acid) were used to compare results of each extract. Duncan’s Multiple Range Test indicated a significant difference as shown by the non-overlapping confidence intervals at a= .05. Mean values are from three replicates run in quadruplets.
Phenols and flavonoids are important components in the mechanism of preventing oxidation by
deactivating free radicals by having the ability to donate protons to super radicals. In unfavorable
conditions, plants generate phenolic compounds and flavonoids for the process of growth in stressful
environments or to defend itself (Tungmunnithum et al. 2018). Their ideal structural composition and
configuration of multiple hydroxyl groups allows for free radicals to scavenge protons to form more stable
0
10
20
30
40
50
60
70
80
Treatments
Perc
ent I
nhib
ition
BHT Ascorbic acid Acetone extract Methanol extract Acetic acid extract Linoleic acid

44
compounds and preventing the denaturing of fatty lipids or other necessary proteins that undergo oxidative
damage. By specifically extracting phenols and flavonoids of A. rigidula and removing any impurities, we
can then determine a more accurate representation of the antioxidant potential in A. rigidula.
45
CONCLUSION
The increase in resistance to many commercially produced synthetic antimicrobial agents by
microorganisms has increased, hence the need of searching for new antimicrobial agents. Previous studies
of the Fabaceae family have reported properties of antimicrobial and secondary metabolites (Mattana et al.
2010; Jain et al. 2011; Jeyakumar, 2015). This study, with the use of antimicrobial susceptibility testing and
phytochemical analysis, has provided a novel discovery that Acacia berlandieri and Acacia rigidula exhibit
antimicrobial activity. Although stem samples did not provide promising results, leaf samples of both
species did. When comparing both species, extracts of Acacia rigidula (p<0.001) were significantly different
from DMSO (negative control) at inhibiting the growth of several microorganisms. Furthermore, key
secondary metabolites (phenols, flavonoids, saponins, terpenoids and tannins) are responsible for the
antimicrobial activity by extracts from plants were discovered via qualitative analysis (Sparg et al. 2004;
Mandal et al. 2005; Mujeeb, 2014). Each of these secondary metabolites has been shown to have
antimicrobial properties along with other applications (Nakashima et al. 1992; Cowan, 1999; Bhattacharya
et al. 2010; Mansuri et al, 2014). Extracts of both species did exhibit bactericidal activity; therefore, partially
supporting the alternative hypothesis. These extracts have not been purified but set the foundation for
further analysis. NMR, UV-Vis and IR spectroscopy did elucidate functional groups found in the classes of
secondary metabolites confirmed through qualitative phytochemical analysis. By continuing to use more
fingerprinting techniques, such as GC-MC and HPLC, this will lead to the isolation of those bioactive
compounds that allow for the inhibition of microorganisms and others that have antioxidant activity. Further
studies are needed before these extracts can be applied as antibiotics and antioxidants but there is
potential in these extracts.
46
RECOMMENDATIONS AND FUTURE STUDIES
The results of the antibacterial evaluation of the two medicinal plants suggests that these plants,
specifically A. rigidula, have the potential to be a good natural source as an antibacterial agent. The future
work should focus on investigating bioactive compounds and fractionating them to isolate those that exhibit
antimicrobial activity. Another potential idea for future work could be using other extraction techniques with
more extracting solvents or different concentrations of acetone to retrieve as many active compounds as
possible. An in-depth analysis on the effectiveness of other plant parts such as roots is recommended. This
study focused primarily on inhibiting the growth of bacteria alone; however, toxicity studies of the effective
extracts should be done to determine how safe these plant extracts are when treating infectious diseases.
Finally, further experimentation is needed to evaluate the antioxidant activity within these plant species.

47
REFERENCES Akiyama H, Fujii K, Yamasaki O, Oono T, Iwatsuki K (2001) Antibacterial action of several tannins against
Staphylococcus aureus, J Antimicrob Chemoth 48:487-491. Alvez R, Rosa I (2007) Biodiversity, traditional medicine and public health: where do they meet? J
Ethnobiol Ethnomed 3:14 Amirkia V, Heinrich, M (2014) Alkaloids as drug leads – A predictive structural and biodiversity-based
analysis. Planta Med 80:16. Amor I, Boubaker J, Sgaier MB, Skandrani I, Bhouri W, Neffati A, Kilani S, Bouhlel I, Ghedira K, Chekir-
Ghedira L (2008) Antimicrobial activity of essential oils isolated from Phlomis crinite Cav. ssp/ mauritanica Munby J Am Oil Chem Soc 85:1-5.
Ani IA, Zimmermann S, Reichling J, Wink M (2015) Pharmacological synergism of bee venom and melittin
with antibiotics and plant secondary metabolites against multi-drug resistant microbial pathogens. Phytomed 22:245-255.
Ashgar R, Ahmad M, Zafar M, Akram A, Mahmood J, Hassan M (2003) Antibacterial efficacy of Acacia
modesta Wall Miswak against dental pathogens. J Biol Sci 6:2024-2025. Aniszewski T (2007) Alkaloids – secrets of life, 1st ed. Elsevier, Amsterdam. Asami DK, Hong Y, Barrett DM, Mitchell AE (2003) Processing-induced changes in total phenolics and
procyanidins in clingstone peaches. J Sci Food Agric 85:56-63. Avorn J (2001) Antibiotic resistance: Synthesis of recommendations by expert policy groups. Boston,
Mass.: World Health Organization. Azwanida NN (2015) A Review on the Extraction Methods Use in Medicinal Plants, Principle, Strength and
Limitation. Med Aromat Plants 4:196. Azzam A, Hazaa M, Bayoumi S (2014). Antibacterial Activity of Some Plant Extracts Against Water
Bacterial Pollution. Int J Chem Environ Biol Sci 9:393-406. Bhattacharya A, Sood P, Citovsky V (2010) The roles of plant phenolics in defense and communication
during Agrobacterium and Rhizobium infection. Mol Plant Pathol 11(5):705-719. Brown GD, Bauer J, Osborn H, & Kuemmerle R (2018) A Solution NMR Approach To Determine the
Chemical Structures of Carbohydrates Using the Hydroxyl Groups as Starting Points. ACS, 3(12):17957–17975.
Buchanan M, Carroll A, Pass D, Quinn, R (2007) NMR spectral assignments of a new chlorotryptamine
alkaloid and its analogues from Acacia confusa. Magn Reson Chem 359-61.
48
Chorianopoulos N, Lambert R, Skandamis P, Evergetis E, Haroutounian S, Nychas G (2006) A newly developed assay to study the minimum inhibitory concentration of Satureja spinosa essential oil. J Appl Microbiol 121(5):1291-1299.
Clement BA, Goff CM, Forbes TDA (1998). Toxic amines and alkaloids from Acacia rigidula.
Phytochemistry 49:1377-1380. Cock, I (2012) Antimicrobial Activity of Acacia aulacocarpa and Acacia complanta methanolic
extracts. Phcog Commn 2:66-71. Cowan MM (1999) Plant Products as Antimicrobial Agents. Clin Microbiol Rev 12(4):564–582. Cushnie TT, Cushnie B, Lamb AJ (2014) Alkaloids: An overview of their antibacterial, antibiotic-enhancing
and antivirulence activities. Int J Antimicrob Agents 44(5):377-386. Cushnie TT, Lamb AJ (2005) Antimicrobial activity of flavonoids. Int J Antimicrob Agents 26(5):343-356. Delcour AH (2008) Outer membrane permeability and antibiotic resistance. Biochem Biophys Acta 5:808–
816. Demain AL (2009) Antibiotics: Natural products essential to human health. Med Res Rev 29:821-842. Deshpande SN (2013) Preliminary phytochemical analysis and in vitro investigation of antibacterial activity
of Acacia nilotica against clinical isolates. J Pharm Phytochem 5:23-27. Dias DA, Urban S, Roessner U (2012) A historical overview of natural products in drug discovery.
Metabolites 2(2):303-360. Do Q, Angkawijaya A, Tran-Nguyen P, Huynh L, Soetaredjo F, Ismadji S, Ju Y (2014). Effect of extraction
solvent on total phenol content, total flavonoid content, and antioxidant activity of limnophila aromatica. J Food Drug Anal 22(3):296-302.
Działo M, Mierziak J, Korzun U, Preisner M, Szopa J, Kulma A (2016) The Potential of Plant Phenolics in
Prevention and Therapy of Skin Disorders. Int J Mol Sci 17(2):160. Dzoyem J, McGaw L, Eloff J (2014) In vitro antibacterial, antioxidant and cytotoxic activity of acetone leaf
extracts of nine under-investigated fabaceae tree species leads to potentially useful extracts in animal health and productivity. BMC Complement Altern Med 14:147-147.
Elgubbi H, Altajtal A, Elabath A (2019) Phytochemical Screening Study and Anti-Candida Evaluation of
Acacia raddiana Leaves. ECNU 14:499-507. Evans WC (2009) Trease and Evans Pharmacognosy, 16th ed. Elsevier, London. Fair RJ, Tor Y (2014) Antibiotics and bacterial resistance in the 21st century. Perspect Medicin Chem 6:25-
64.
49
Freiesleben SH, Jager AK (2014) Correlations between plant secondary metabolites and their antimicrobial mechanisms—a review. J Appl Res Med Aromat Plants 3:1-6.
Goh HMS, Yong MHA, Chong KKL, Kline KA (2017) Model systems for the study of Enterococcal
colonization and infection. Virulence 8(8):1525–1562. González-Burgos E, Carretero ME, Gómez-Serranillos MP (2011) Sideritis Spp.: Uses, chemical
composition and pharmacological activities—a review. J Ethnopharmacol 135:209-250. Harmon K (2013) Stopping superbugs. Sci. Am. 308(2):18-18. Hossain K, Hassin M, Parvin N, Hasan M, Islam S, Haque A (2012) Antimicrobial, cytotoxic and
thrombolytic activity of Cassia senna leaves. J Appl Pharm Sci 2:186-190. Jain S, Jhade D, Paliwal P, Sharma P, Sharma N, Ahirwar D (2011) Pharmacognostic screening and
phytochemical evaluation of acacia leucophloea root. Int J green pharm 5(2):155-155. Jain P, Jain S, Bhawsar P (2016) Phytochemical analysis of Mentha spicata plant extract using UV-VIS,
FTIR and GC/MS technique. J Chem Pharm 1-6. Jaidka S, Somani R, Singh D J, Sheikh T, Chaudhary N, Basheer A (2017). Herbal combat against E.
faecalis - An in vitro study. J Oral Biol Craniofac Res 7(3):178–181. Jeyakumar E (2015) Antibacterial activity of Acacia arabica (Bark) extract against selected multi drug
resistant pathogenic bacteria. Int J Curr Microbiol Appl Sci 1:213-222. Konstat-Korzenny E, Ascencio-Aragón JA, Niezen-Lugo S, Vázquez-López R (2018) Artemisinin and Its
Synthetic Derivatives as a Possible Therapy for Cancer. Med Sci (Basel) 6(1):19. Kumaraswamy MV, Kavitha HU, and Satish S (2008) Antibacterial Evaluation and Phytochemical Analysis
of Betula utilis. World J Agric Res 4:661-664. Li J, Zhang C, Gong M, Wang M (2018) Combination of artemisinin-based natural compounds
from Artemisia annua L. for the treatment of malaria: Pharmacodynamic and pharmacokinetic studies. Phytother Res 32:1415– 1420.
Luo Y, Li D, Ran J, Yan B, Chen J, Dong X, Liu M (2014) End-binding protein 1 stimulates paclitaxel
sensitivity in breast cancer by promoting its actions toward microtubule assembly and stability. Protein & cell 5(6):469–479.
Maher P (1999) A Review Of ‘Traditional’ Aboriginal Health Beliefs. Aust J Rural Health 7:229-236. Mandal P, Sinha Babu S, Mandal N (2005) Antimicrobial activity of saponins from acacia
auriculiformis. Fitoterapia, 76(5):462-465.
50
Mattana C, Satorres S, Sosa A, Fusco M, Alcaráz, L (2010) Antibacterial activity of extracts of Acacia aroma against methicillin-resistant and methicillin-sensitive Staphylococcus. Braz J Microbiol 4(3):581-587.
Mazid M, Khan TA, Mohammad F (2011) Role of secondary metabolites in defense mechanism of plants.
Biol Med 2:232-249. Mulaudzi RB, Ndhlala AR, Kulkarni MG, Finnie JF (2011) Antimicrobial properties and phenolic contents of
medicinal by the Venda people for conditions related to venereal diseases. J Enthopharmacol 135:330-337.
Mujeeb F (2014) Phytochemical Evaluation, Antimicrobial Activity, and Determination of Bioactive
Components from Leaves of Aegle marmelos. Biomed Res Int 1-11. Nakashima H, Murakami T, Yamamoto N, Sakagami H, Tanuma S, Hatano T, Yoshida T, Okuda T (1992)
Inhibition of human immunodeficiency viral replications by tannins and related compounds. Antivir Res 18:91-103.
Okamoto T (2000) The protective effect of glycyrrhizin on anti-Fas antibody-induced hepatitis in mice. Eur J
Pharmacol 387:229–232. Panche AN, Diwan AD, Chandra SR (2016) Flavonoids: an overview. J Nutr Sci 5:47. Panti AB, Aguda RM, Razal RA, Belina-Aldemita MD, Tongco JVV (2014) Proximate analysis,
phytochemical screening and total phenolic and flavonoid content of the ethanolic extract of molave Vitex parviflora Juss. leaves. J Chem Pharm Res 6:1538-1542.
Papoutsis K, Pristijono P, Golding J, Stathopoulos C, Bowyer M, Scarlett C, Vuong Q (2017) Effect of
vacuum-drying, hot air-drying and freeze-drying on polyphenols and antioxidant capacity of lemon (citrus limon) pomace aqueous extracts. Int J Food Sci Technol 52(4):880-887.
Patel K, Gadewar M, Tripathi R, Prasad S, Patel DK (2012). A review on medicinal importance,
pharmacological activity and bioanalytical aspects of beta-carboline alkaloid “‘Harmine.’” Asian Pac J Trop Biomed 2(8):660–664.
Patel JD, Shrivastava AK, Kumar V (2009). Evaluation of some medicinal plants used in traditional wound
healing preparations for antibacterial property against some pathogenic bacteria. J. Clin. Immunol. Immunopathol. Res 1(1):7-12.
Rani N, Sharma S, & Sharma M (2016) Phytochemical Analysis of Meizotropis pellita by FTIR and UV- VIS
Spectrophotometer. Int J Pharm Sci Technol 9:31. Sabina Y, Rahman A, Ray RC, Montet D (2011) Yersinia enterocolitica: Mode of Transmission, Molecular
Insights of Virulence, and Pathogenesis of Infection. J Pathog Samanta A, Das G, Das SK (2011) Roles of flavonoids in plants. Int J Pharm Sci Technol 6(1):12–35.
51
Sarker SD, Latif Z, Gray AI (2006) Natural products isolation. Totowa, NJ: Humana Press. Scalbert A (1991) Antimicrobial properties of tannins. Phytochemistry 30:3875-3883. Sen S, Chakraborty R (2017) Revival, modernization and integration of indian traditional herbal medicine in
clinical practice: Importance, challenges and future. J Tradit Complement Med 7(2):234-244. Shi LS, Kuo SC, Sun HD, Morris-Natschke SL, Lee KH, Wu TS (2014) Cytotoxic cardiac glycosides and
coumarins from Antiaris toxicaria. Bioorg Med Chem 22:1889-1898. Singh B, Sharma RA (2015) Plant terpenes: defense responses, phylogenetic analysis, regulation and
clinical applications. Biotech 5(2):129–151. Singh R, Thakur R (2016) Phytochemical analysis and antibacterial activity of Acacia nilotica (L.) leaves
against pathogenic bacteria. Int J Green Pharm 10:104-110. Sparg SG, Light ME, J Van Staden (2004) Biological activities and distribution of plant saponins. J
Ethnopharmacol 94:219–243. Subhaswaraj P, Sowmya M, Jobina R, Sudharshan S, Dyavaiah M, Siddhardha B (2017). Determination of
antioxidant potential of Acacia nilotica leaf extract in oxidative stress response system of Saccharomyces cerevisiae. J. Sci Food Agric 97:5247-5253.
Sultana B, Anwar F, Przybylski R (2007) Antioxidant activity of phenolic components present in barks of
Azadirachta indica, Terminalia arjuna, Acacia nilotica, and Eugenia jambolana Lam. trees. Food Chem 1106–1114.
Tungmunnithum D, Thongboonyou A, Pholboon A, & Yangsabai A (2018) Flavonoids and Other Phenolic
Compounds from Medicinal Plants for Pharmaceutical and Medical Aspects: An Overview. Medicines (Basel), 5(3):93.
Usman H, Abdulrahman FI, Usman A (2009) Qualitative phytochemical screening and in vitro antimicrobial
effects of methanol stem bark extract of Ficus thonningii (Moraceae). Afr J Tradit Complement Altern Med 6:289-295.
Uzodi AS, Lohse CM, Banerjee R (2017) Risk Factors For and Outcomes of Multidrug-
Resistant Escherichia coli Infections in Children. J Infect Dis 6(2):245–257. Ventola CL (2015) The antibiotic resistance crisis: part 1: causes and threats. P T 40(4):277-83. Weaver BA (2014) How Taxol/paclitaxel kills cancer cells. Mol Biol Cell 25(18):2677–2681. Williams MC, Molyneux RJ (1987) Occurrence, concentration, and toxicity of pyrrolizidine alkaloids in
Crotalaria seeds. Weed Sci 35:476–481.
52
Woodford N, Livermore DM (2009) Infections caused by Gram-positive bacteria: A review of the global challenge. J Infec 59:S4-S16.
Ynalvez R, Compean K, Addo-Mensah A (2018) Qualitative Determination of the Secondary Metabolites
and Evaluation of the Antimicrobial Activity of Leaf Extracts from Different Plant Families (Boraginaceae, Fabaceae, Lamiaceae and Lauraceae) against Microorganisms of Clinical Importance. J Pharm Res Int 23:1-12.
Zhou S (2015) Modes of Action of Herbal Medicines and Plant Secondary Metabolites. Medicines
(Basel) 2(3):251-252.
53
APPENDICES
Table A1. Least square mean of A. rigidula extracts and controls when subjected to P. alcalifaciens.
Table A2. Least square means for the effect of A. rigidula extracts and controls when subjected to P. alcalifaciens. i/j 1 2 3 4 5 1 ---------- 0.5261 0.1109 <.0001 <.0001 2 0.5261 ---------- 0.8409 <.0001 0.0016 3 0.1109 0.8409 ---------- <.0001 0.0138 4 <.0001 <.0001 <.0001 ---------- <.0001 5 <.0001 0.0016 0.0138 <.0001 ----------
Table A3. Least square mean of A. rigidula extracts and controls when subjected to Y. enterocolitica.
Table A4. Least square means for the effect of A. rigidula extracts and controls when subjected to Y. enterocolitica. i/j 1 2 3 4 5 1 ---------- 0.2915 0.0363 <.0001 <.0001 2 0.2915 ---------- 0.777 <.0001 0.0066 3 0.0363 0.777 ---------- <.0001 0.0708 4 <.0001 <.0001 <.0001 ---------- <.0001 5 <.0001 0.0066 0.0708 <.0001 ----------
Extract Treatment mZOI LSMEAN LSMEAN Number 1 Acetone Extract 12.6233333 1 2 Methanol Extract 10.9483333 2 3 Acetic Acid extract 9.8644444 3 4 Antibiotic 37.5008333 4
Extract Treatment mZOI LSMEAN LSMEAN Number 1 Acetone Extract 12.5594444 1 2 Methanol Extract 10.35 2 3 Acetic Acid extract 9.0961111 3 4 Antibiotic 34.8925 4
54
Table A5. Least square mean of A. rigidula extracts and controls when subjected to S. aureus.
Table A6. Least square means for the effect of A. rigidula extracts and controls when subjected to S. aureus. i/j 1 2 3 4 5 1 ---------- 0.4094 0.2848 <.0001 0.0041 2 0.4094 ---------- 0.9989 <.0001 0.1531 3 0.2848 0.9989 ---------- <.0001 0.2353 4 <.0001 <.0001 <.0001 ---------- <.0001 5 0.0041 0.1531 0.2353 <.0001 ----------
Table A7. Least square mean of six samples of A. rigidula acetone extracts against the four most susceptible bacteria.
Table A8. Least square means for the effect of four microorganism when subjects to six different replicates of A. rigidula acetone extracts.
i/j 1 2 3 4 1 ---------- 0.0038 0.0758 0.8120 2 0.0038 ---------- 0.6810 0.0440 3 0.0758 0.6810 ---------- 0.3953 4 0.8120 0.0440 0.3953 ----------
Extract Treatment mZOI LSMEAN LSMEAN Number 1 Acetone Extract 8.6838889 1 2 Methanol Extract 7.545 2 3 Acetic Acid extract 7.3811111 3 4 Antibiotic 19.27 4
Bacteria Name mZOI LSMEAN LSMEAN Number 1 P. alcalifaciens 14.8129167 1 2 E. faecalis 12.5669444 2 3 S. aureus 13.2658333 3 4 Y. enterocolitica 14.2581944 4

55
VITA
Name: Peter Cavazos Address: 2859 Emory Loop Laredo, TX 78043 Email Address: [email protected] Education: A.A. Laredo College, 2015 B.S. Texas Tech University, 2017 Field of Specialization: Biology