Embed Size (px)
Citation preview

Assertive Community Treatment
U.S. DEPARTMENT OF HEALTH AND HUMAN SERVICESSubstance Abuse and Mental Health Services AdministrationCenter for Mental Health Serviceswww.samhsa.gov
Evaluating Your Program


Assertive Community Treatment
U.S. Department of Health and Human Services
Substance Abuse and Mental Health Services Administration
Center for Mental Health Services
Evaluating Your Program

Acknowledgments
This document was produced for the Substance Abuse and Mental Health Services Administration (SAMHSA) by the New Hampshire-Dartmouth Psychiatric Research Center under contract number 280-00-8049 and Westat under contract number 270-03-6005, with SAMHSA, U.S. Department of Health and Human Services (HHS). Neal Brown, M.P.A., and Crystal Blyler, Ph.D., served as the Government Project Officers.
Disclaimer
The views, opinions, and content of this publication are those of the authors and contributors and do not necessarily reflect the views, opinions, or policies of the Center for Mental Health Services (CMHS), SAMHSA, or HHS.
Public Domain Notice
All material appearing in this document is in the public domain and may be reproduced or copied without permission from SAMHSA. Citation of the source is appreciated. However, this publication may not be reproduced or distributed for a fee without the specific, written authorization from the Office of Communications, SAMHSA, HHS.
Electronic Access and Copies of Publication
This publication may be downloaded or ordered at www.samhsa.gov/shin. Or, please call SAMHSA’s Health Information Network at 1-877-SAMHSA-7 (1-877-726-4727) (English and Español).
Recommended Citation
Substance Abuse and Mental Health Services Administration. Assertive Community Treatment: Evaluating Your Program. DHHS Pub. No. SMA-08-4344, Rockville, MD: Center for Mental Health Services, Substance Abuse and Mental Health Services Administration, U.S. Department of Health and Human Services, 2008.
Originating Office Center for Mental Health Services Substance Abuse and Mental Health Services Administration 1 Choke Cherry Road Rockville, MD 20857 DHHS Publication No. SMA-08-4344 Printed 2008

Assertive Community Treatment
Evaluating Your Program
Evaluating Your Program shows Quality Assurance team members how to evaluate the effectiveness of your ACT program. It includes:
n a readiness assessment,
n the ACT Fidelity Scale,
n the General Organizational Index, and
n outcome measures that are specific to ACT.
You will also find instructions for conducting assessments and tips on how to use the data to improve your ACT program.
For references see the booklet, The Evidence.
This KIT is part of a series of Evidence-Based Practices KITs created by the Center for Mental Health Services, Substance Abuse and Mental Health Services Administration, U.S. Department of Health and Human Services.
This booklet is part of the Assertive Community Treatment KIT that includes a DVD, CD-ROM, and seven booklets:
How to Use the Evidence-Based Practices KITs
Getting Started with Evidence-Based Practices
Building Your Program
Training Frontline Staff
Evaluating Your Program
The Evidence
Using Multimedia to Introduce Your EBP

Assertive Community Treatment
What’s in Evaluating Your Program
Why Evaluate Your ACT Program? . . . . . . . . . . . . . . . . . 3
Getting Started . . . . . . . . . . . . . . . . . . . . . . . . . . . . . . 5
Using Data to Improve Your ACT Program . . . . . . . . . . 21
Appendix A: ACT Fidelity Scale and GOI Cover Sheet . . . . . . . . . . . . . . . . . . . 27
Appendix B: ACT Fidelity Score Sheet and ACT Fidelity Scale . . . . . . . . . . . . . . . . . . 31
Appendix C: ACT Fidelity Scale Protocol . . . . . . . . . . . . 37
Appendix D: General Organizational Index and GOI Score Sheet . . . . . . . . . . . . . . . . . . . 55
Appendix E: GOI Protocol . . . . . . . . . . . . . . . . . . . . . . 61
Appendix F: Outcomes Report Form . . . . . . . . . . . . . . 73
Appendix G: Instructions for the Outcomes Report Form . . . . . . . . . . . . . . . 77
Appendix H: Assessor Training and Work Performance Checklist . . . . . . . . . . 85


Evaluating Your Program 3 Evaluating Your Program 3 Appendix A: ACT Fidelity ScaleEvaluating Your Program 3 Why Evaluate Your ACT Program?
Evaluating Your Program
Why Evaluate Your ACT Program?
Key stakeholders who are implementing ACT may find themselves asking two questions:
n Has ACT been implemented as planned?
n Has ACT resulted in the expected outcomes?
Asking these two questions and using the answers to help improve your ACT program is a critical component for ensuring the success of your ACT program.
n To answer the first question, collect process measures (by using the ACT Fidelity Scale and General Organizational Index), which capture how services are provided.
n To answer the second question, collect outcome measures, which capture the program’s results.
As you prepare to implement ACT, we strongly recommend that you develop a quality assurance system using both process and outcome measures to monitor
and improve the quality of the program from the start-up phase and continuing through the life of the program.
Why you should collect process measures
Process measures give you an objective, structured way to determine whether you are delivering the services in the way that research has shown will result in desired outcomes. Process measures allow ACT programs to understand whether they are providing services that are faithful to the evidence-based practice model (or high fidelity services).
Experience suggests that process assessment is an excellent method to diagnose program weaknesses, while helping to clarify program strengths.

4 Evaluating Your ProgramAppendix A: ACT Fidelity Scale 4 Evaluating Your ProgramWhy Evaluate Your ACT Program? 4 Evaluating Your Program
Process measures also give mental health authorities a comparative framework to evaluate the quality of ACT programs across the State. They allow mental health authorities to identify Statewide trends and outliers.
Once ACT programs reach high fidelity, ongoing monitoring allows you to test local innovations while ensuring that ACT programs do not drift from core principles of evidence-based ACT.
Why you should collect outcome measures
While process measures capture how services are provided, outcome measures capture the program’s results. Every mental health service intervention has both immediate and long-term consumer goals. In addition, consumers have goals for themselves, which they hope to attain by receiving mental health services. These goals translate into outcomes and the outcomes translate into specific measures.
Research has shown that the outcomes you can expect from ACT are:
n Reduced hospital stays,
n Higher levels of housing stability,
n Improved symptoms and social functioning,
n Higher quality of life, and
n Increased consumer and family satisfaction with services.
Consumer outcomes are the bottom line for mental health services, like profit is in business. No successful businessperson would assume that the business was profitable just because employees worked hard.
In your mental health system, you should develop a quality assurance system that collects not only process measures, such as those on the ACT Fidelity Scale and General Organizational Index (GOI), but also outcome measures, such as those specified above, to show the effect that your ACT services has for consumers.
Developing a quality assurance system will help you:
n diagnose your ACT program’s strengths and weaknesses,
n formulate action plans for improving your ACT program,
n help consumers achieve their goals for recovery, and
n deliver mental health services both efficiently and effectively.

Evaluating Your Program 5 Evaluating Your Program 5 Appendix A: ACT Fidelity ScaleEvaluating Your Program 5 Getting Started
Let’s assume that administrators and ACT leaders have read Building Your Program. Your new ACT team has completed Training Frontline Staff. How do you know if you are ready to begin providing ACT services to consumers?
The Readiness Assessment on the next page will help quality assurance team members, advisory group leaders, and ACT leaders track the processes and administrative tasks required to develop an ACT program. Answering these questions will help you generate an ongoing “to-do” list (or implementation plan) to guide your steps in implementing ACT. It will also help you understand which components of ACT services are in place and what is still left to do.
Evaluating Your Program
Getting Started

6 Evaluating Your ProgramAppendix A: ACT Fidelity Scale 6 Evaluating Your ProgramGetting Started 6 Evaluating Your Program

Evaluating Your Program 7 Evaluating Your Program 7 Appendix A: ACT Fidelity ScaleEvaluating Your Program 7 Getting Started
Readiness Assessment: Part 1
Check any areas that you feel you do NOT completely understand.
o Principles of staffing, including total case size, total staff size, and staff-to-consumer ratios
o Role of the shift manager
o Role of lead mental health professional
o Role of lead nurse
o How to select an Individual Treatment Team (ITT) for consumers
o How the ITT involves other team members in consumers’ care
o Responsibilities of clinical supervision and how they are carried out
o How to supervise your staff in implementing the clinical practices
o How to organize and conduct an admission meeting
o The specific admission criteria for your program
o Who is responsible for doing the initial assessment and how it is documented
o Who is responsible for the initial treatment plan and how it is documented
o How the comprehensive assessment is done
o How to do a Psychiatric/Social Functioning Timeline
o How to develop a treatment plan that is individualized, objective, measurable, and based on consumers’ goals
o How to develop the Weekly Consumer Schedule from the treatment plan and set up a Cardex file
o How to use the Weekly Consumer Schedule in developing the Daily Team Schedule
o How to conduct the daily team meeting
o How to use the Daily Communication Log
o How continuous assessment and continuous treatment planning are done
o How the ACT team relates to advisory groups
o How your program’s fidelity to the ACT model will be measured
o How the system for collecting consumer outcome data will work
Other areas that were not listed where you still have questions:
Note areas where you still are unclear or have questions. Arrange to speak to an ACT consultant or experienced ACT leader:

8 Evaluating Your ProgramAppendix A: ACT Fidelity Scale 8 Evaluating Your ProgramGetting Started 8 Evaluating Your Program
Readiness Assessment: Part 2
Check items that are already in place or that you have already completed. In the right column, note the next steps you will take to obtain or complete the remaining items.
Staffing Next steps
o The team has a total of 10-12 FTE, including at least:
o 1 FTE psychiatrist
o 2 FTE psychiatric nurses
o 2 employment specialists
o 2 substance abuse specialists
o 1 mental health consumer (either as a peer advocate or in another position)
o 1 FTE program assistant
o Reflects cultural diversity of the community in which the program will operate
o Task-specific job descriptions for each position on the team
o Several potential questions for job applicants to evaluate response to typical situations
o A schedule that provides coverage 24-hours a day, 365 days a year with team members rotating evening, weekend, and holiday coverage
o Written personnel policies that address required staff, staffing ratios, qualifications, orientation, training, etc.
Facility and equipment Next steps
o Central location in the community the program covers
o Desks, office furniture, and equipment in place, including:
o A conference table
o Chairs
o File cabinets
o Secure storage for consumers’ records
o Telephones
o Fax machine
o Copier
o Computers
o Printer
o 1 large room, rather than individual offices, where team members work
o Direct access to the reception area
o Available parking for team members and consumers
o 1 or more rooms where private interviews or a group can be conducted
o Space to store consumer belongings and donated items
o The medication room can be secured. The medication room contains:
o Sink
o Thermometer
o Scale
o Blood pressure cuff
o Refrigerator
o Medication storage

Evaluating Your Program 9 Evaluating Your Program 9 Appendix A: ACT Fidelity ScaleEvaluating Your Program 9 Getting Started
Medication administration Next steps
o Team psychiatrist and nurse have reviewed Chapter 8 of A Manual for ACT Start‑Up (Allness & Knoedler, 2003) (Managing Medications) and have participated in developing policies, procedures, and processes.
o System in place for medication administration, including:
o Knowing the rules for your State about medication administration and delivery
o A medication administration record (MAR) for each consumer where new medications or changes in medications are noted
o A plan for a master MAR or computer print-out for nurses to use when packaging medications for individual consumers
o A procedure for either obtaining unit doses of medication from pharmacies or for nurses to package unit doses for delivery
o Time set aside in the team schedule for nurses to tend to medication ordering, packaging, and documentation
o A system for team members to return undelivered medications
o A procedure for new information about medications to be shared with the team
o A system for scheduling and tracking lab work
o A procedure for changes to be made to the consumer’s Weekly Schedule when changes in medication require changing team members’ activities (e.g., changing frequency of delivering medications, scheduling lab work, etc.)
o Pharmaceutical companies with programs for indigent consumers identified and contacted
o Pharmaceutical company representatives have been contacted about providing samples to consumers who cannot pay for them
o Written policies and procedures about medication administration and related quality- assurance issues
Consumer records Next steps
o The contents and sections of consumers’ treatment records have been determined. The records:
o Comply with Medicaid requirements
o Comply with JCAHO requirements
o Written policies and procedures have been developed concerning consumer records
o Writing style for progress notes has been determined
o Available supplies for assembling records, including:
o Necessary blank forms and pages
o File folders or binders
o Section dividers
o Adequate space for storing records

10 Evaluating Your ProgramAppendix A: ACT Fidelity Scale 10 Evaluating Your ProgramGetting Started 10 Evaluating Your Program
Program budget Next steps
The program budget includes:
o Competitive salaries and fringe benefits
o Somewhat higher salaries for lead mental health profession and lead registered nurse
o Rent, utilities, and facility maintenance
o Telephone and communication equipment, including:
o Pagers
o Cell phones
o Office supplies
o Consumer record binders
o Dividers
o Progress notes
o Pens
o Copy paper
o Toner
o Other
o Office equipment
o Fax machine
o Copier
o Printer
o Chart racks
o Storage cabinet
o File cabinets
o Office furniture
o Desks
o Chairs
o Conference table
o Travel and transportation
o Vehicle lease or purchase
o Travel reimbursement
o Parking
o Reimbursement for liability insurance for personal vehicles
o Medication and medical supplies and equipment (e.g., scale, blood pressure cuff)
o Professional insurance
o Consumer services funds
o Staff education and training
o Consultation on ACT implementation
o Consultant pharmacist (if used)
o External evaluators (if needed)
o Team leader understands how the program generates revenue
o Billing processes have been set up
o Written policies and procedures created for disbursement and accounting for consumer services funds

Evaluating Your Program 11 Evaluating Your Program 11 Appendix A: ACT Fidelity ScaleEvaluating Your Program 11 Getting Started
Administration of clinical processes Next steps
o Specific admission criteria
o Forms available to document the initial assessment and initial treatment plan
o Forms available to document the Psychiatric/Social Functioning History Timeline
o Supply of release of information forms
o Initial supply of Weekly Consumer Schedules
o File box to store active schedules
o Initial supply of Daily Team Schedule forms
o A Daily Communication Log set up
Monitoring Next steps
o System to monitor fidelity to the ACT model in place
o System to monitor consumer outcomes in place
o Any elements that will be monitored by the State mental health system, Medicaid, or JCAHO identified
o Team members know the elements that are being evaluated
o Details of how data are collected and entered into spreadsheets specified
Frequency of process assessments
In addition to the Readiness Assessment, you should conduct your first process assessment before you begin providing any ACT services to determine if your agency already has core components of ACT in place. During the first 2 years of implementing ACT, plan to assess your ACT program every 6 months. After your ACT program has matured and achieved high fidelity, your leadership may choose to conduct assessment once a year.
Agencies that have successfully implemented ACT indicate you must continue to evaluate the process to ensure that you do not revert to previous practice patterns.
Once your ACT program has achieved high fidelity to the evidence-based model, team members may tailor the program to meet individual needs of the community. Continued use of process evaluations along with outcomes monitoring will allow you to understand the extent to which your changes result
in departure of your program from model fidelity and whether the changes positively or negatively affect consumers.
How to use ACT process measures
Two tools have been developed to monitor how ACT services are provided:
n the ACT Fidelity Scale and
n General Organizational Index (GOI).
You may administer both tools at the same time.
The ACT Fidelity Scale has 28 program-specific items. Each item is rated on a 5-point scale, ranging from 1 (meaning not implemented) to 5 (meaning fully implemented). The scale items fall into three categories:
n human resources (structure and composition),
n organizational boundaries, and
n nature of services.

12 Evaluating Your ProgramAppendix A: ACT Fidelity Scale 12 Evaluating Your ProgramGetting Started 12 Evaluating Your Program
The General Organizational Index is a second set of process measures that has been developed. In contrast to fidelity scales, which are specific to each evidence-based practice, the GOI can be used when implementing any of the evidence-based practices. The GOI
measures agency-wide operating procedures that have been found to affect agencies’ overall capacity to implement and sustain any EBP.
For the ACT Fidelity Scale and GOI, see Appendices B and D. These forms may also be printed from the CD in your ACT KIT.
About the process measures that are included in the KIT
While quality assurance measures have been developed and are included in all EBP KITS, the length of time that these measures have been used and the level of psychometric testing varies.
The ACT Fidelity Scale has one of the longest histories. Developed and described by Teague, Bond, and Drake (1998), the ACT Fidelity Scale has undergone extensive psychometric testing. It has demonstrated discriminant and predictive validity and has been widely adopted by many State and local agencies throughout the United States and internationally. The scale has been found to differentiate between established ACT teams, as monitored and trained by ACT trainers, and other types of intensive case management and brokered case management (Teague et al., 1998).
Regarding predictive validity, several studies using precursors to the ACT Fidelity Scale have found strong correlations between ACT fidelity and consumer outcomes (Latimer, 1999; McGrew et al., 1994; McHugo et al., 1999). One study using the ACT Fidelity Scale found a .49 correlation between the items on the scale and reduction in hospital use (which was not statistically significant, perhaps due to small sample size) (Bond & Salyers, 2004).
The General Organizational Index, developed by Robert Drake and Charlie Rapp, is a newly developed scale. This scale has undergone multiple revisions based on feedback gathered during the 3-year pilot testing of the KIT materials.
Table 1: Status of EBP Fidelity Scales (2/05)
EBPScale
Developed?Piloted
Discriminant Validity?
Predictive Validity?
Broad Use?
ACT 1998 Yes Yes Yes
Supported
Employment1997 Yes Yes Yes
IMR 2002 In progress
Psycoeducation 2002 In progress
Co-occurring
Disorders2002 In progress

Evaluating Your Program 13 Evaluating Your Program 13 Appendix A: ACT Fidelity ScaleEvaluating Your Program 13 Getting Started
Who can conduct process assessments?
Assessments can be conducted either internally by an agency/program or externally by a review group. With external reviews, there is a distinct advantage in using assessors who are familiar with the program but are, at the same time, independent. The goal is to select objective and competent assessors.
Although we recommend using outside raters, ACT leaders can also use fidelity scales to conduct self-ratings. The validity of self-ratings (or any ratings, for that matter) depends on:
n the knowledge of the person making the ratings,
n access to accurate information pertaining to the ratings, and
n the objectivity of the ratings.
If you do conduct a self-rating, beware of potential biases of raters who are invested in seeing your program “look good” or who do not fully understand ACT principles.
If you administer your assessment internally, it is obviously important for the ratings to be made objectively and based on hard evidence. Circumstances will dictate decisions in this area, but we encourage agencies to choose a review process that fosters objectivity in ratings, e.g., by involving a team member who is not centrally involved in providing the service.
Only people who have experience and training in interviewing and data collection procedures (including chart reviews) should conduct assessments. Additionally, assessors need to understand the nature and critical ingredients of ACT. To increase the reliability of the findings, we recommend that at least two raters conduct all fidelity assessments.
Agencies that have successfully implemented ACT have taken different approaches to identify assessors. Some agencies train ACT advisory committee members as assessors and rotate the responsibility of completing assessments. Others have preexisting quality assurance teams and simply designate members of the team to complete the ACT assessments. In other cases, the mental health authority has designated staff to conduct ACT assessments.
If your agency chooses to use a consultant or trainer to assist with the first year of ACT implementation, you should involve that person in the assessment process to enhance the technical assistance provided. Whichever approach your agency leadership chooses, we encourage you to make these decisions early in the planning stages of implementing your ACT program. For a checklist to help evaluate the training and work performance of assessors, see Appendix H.
How to conduct process assessments
A number of activities take place before, during, and after a process assessment. In general, assessments include:
n interviews with administrators, the ACT leader, ACT team members, and consumers and families;
n the observation of team meetings; and
n a chart review.
Collecting information from multiple sources helps assessors more accurately capture how services are provided. A day-long site visit is the optimal method for acquiring this information.
The following suggestions outline steps in the assessment process.

14 Evaluating Your ProgramAppendix A: ACT Fidelity Scale 14 Evaluating Your ProgramGetting Started 14 Evaluating Your Program
Before the process assessment
n n n Prepare your assessment questions
A detailed protocol has been developed to help you understand each item on the ACT Fidelity Scale and GOI, the rationale for why it was included, guidelines for the types of information you must collect during your assessment visit to rate the item, and instructions for completing your ratings.
While we expect that quality assurance teams will select which outcome measures meet your agency’s needs, you should use the fidelity scale and GOI in full. Collecting data for all the items on these scales will allow your agency to gain a comprehensive understanding of how closely your ACT services resemble the ACT model.
For the protocols, see Appendices C and E. Use this information to prepare the materials that you take to your assessments.
n n n Create a timeline for the assessment
Assessments require you to carefully coordinate efforts and to have good communication, particularly if you have multiple assessors. Therefore, it may be useful to list all the necessary activities leading up to and during the visit. For instance, the timeline might include a note to make reminder calls to confirm interview dates and times.
n n n Establish a contact person
You should have one key person in the ACT program who arranges your visit and communicates beforehand the purpose and scope of your assessment to people
who will participate in interviews. Typically, this contact person will be the ACT leader. Exercise common courtesy in scheduling well in advance, respecting the competing time demands on ACT team members, etc.
n n n Establish a shared understanding with ACT team members
It is essential that assessors communicate the goals of the assessment. The most successful assessments are those in which assessors and ACT team members share the goal to understand how the program is progressing according to evidence-based principles. If administrators or team members fear that they will lose funding or look bad if they don’t score well, then the accuracy of the data may be compromised. The best agreement is one in which all parties are interested in learning the truth.
n n n Indicate what you will need from respondents during your visit
In addition to the purpose of the assessment, briefly describe what information you need, who you must speak with, and how long each interview or visit will take to complete. The visit will be most efficient if the ACT leader gathers beforehand as much as possible of the following information:
n Roster of ACT team members — (roles, full-time equivalents [FTEs])
n Staff vacancies each month for the last 6 months (or as long as the program has existed if less than 6 months)
n Number of people who have left the team during the last 2 years (or since program started if less than 2 years old)
n Written description of the team’s admission criteria

Evaluating Your Program 15 Evaluating Your Program 15 Appendix A: ACT Fidelity ScaleEvaluating Your Program 15 Getting Started
n Roster of ACT consumers
n Number of consumers with co-occurring disorders
n Number of consumers admitted to ACT program, per month, for the last 6 months:
o How many consumers ended their involvement with the program in the last 6 months, broken down in these categories:n Graduated (left because they
significantly improved)n Left townn Closed because they refused
services or team cannot find them
n Deceasedn Other (explain)
o List of the last 10 consumers admitted to psychiatric hospital
o List of the last 10 consumers discharged from psychiatric hospital
o Number of consumers living in supervised group homes
o Number of consumers for whom the ACT team has contacted their informal support network (e.g., family member, landlord) at least once.
Reassure the ACT leader that you will be able to conduct the assessment, even if not all of the requested information is available. Indicate that some information (e.g., staffing and number of active consumers) is more critical than other information.
Tell the contact person that you must observe at least one team meeting during your visit. This is an important factor in determining when you should schedule your visit.
n n n Alert your contact person that you will need to sample 20 charts
From a time efficiency standpoint, it is preferable that the charts be drawn beforehand, using a random selection procedure. There may be concern that the evaluation may be invalidated if team members hand-pick charts or update them before the visit. If you both understand that the goal is to better learn how the program is implementing services, this is less likely to occur.
You can further ensure random selection by asking for 20 charts to rate and randomly selecting 10 to review. Other options include asking the ACT program for a de-identified list of consumers (i.e., names removed) and using the list to choose 10 charts to review.
It is important to select the most representative sample of charts. If a team assigns consumers to different levels of service intensity, the sample should reflect this (e.g., for a team with 30% of its consumers on Level 1, 60% of consumers on Level 2, and 10% on Level 3, 30% of reviewed charts should come from Level 1 consumers, 60% of reviewed charts from Level 2, and so on).
n n n Clarify reporting procedures
With the appropriate people (agency administrators, the mental health authority, or the ACT leader), assessors should clarify who should receive a report of the assessment results. Recipients may include:
n agency administrators,
n members of the agency’s quality assurance team,

16 Evaluating Your ProgramAppendix A: ACT Fidelity Scale 16 Evaluating Your ProgramGetting Started 16 Evaluating Your Program
n members of the ACT advisory committee,
n the ACT leader,
n ACT team members, and
n consumers and families.
Assessors should also clarify how the agency would like the report to be distributed. For example, assessors may mail or fax the report and follow up to discuss the results in a meeting or by conference call.
n n n Organize your assessment materials
Three forms have been created to assist you in conducting your assessment.
n The first form, the ACT Fidelity and GOI Cover Sheet, is intended to help you organize your process assessment. It captures general descriptive information about the agency and will help you track the sources of your data collection.
n The second and third forms are score sheets for the two scales. They help you compare assessment ratings from one time period to the next. They may also be useful if you are interested in graphing results to examine your progress over time For the ACT Fidelity and GOI Cover Sheet and Score Sheets, see Appendices A, B, and D. These forms may also be printed from the CD in the KIT.
During your assessment visit
n n n Tailor your terminology
To avoid confusion during your interviews, tailor the terminology you use. For example, an ACT program may use member for consumer or clinician for team member.
Every agency has specific job titles for particular staff roles. By adopting the local terminology, you will improve communication.
n n n Conduct your chart review
In some cases, a lag may exist between when a service is rendered and when it is documented in the consumer’s chart. When you sample chart data, try to gather data from the most recent time period where documentation is completed in full to get the most accurate representation of services rendered.
To ascertain the most up-to-date time period, ask the ACT leader, ACT team members, or administrative staff. Avoid getting an inaccurate sampling of data where office-based services (e.g., nurses’ visits or weekly groups) might be charted more quickly than services rendered in the field (e.g., case manager progress notes).

Evaluating Your Program 17 Evaluating Your Program 17 Appendix A: ACT Fidelity ScaleEvaluating Your Program 17 Getting Started
n n n If discrepancies between sources occur, query the ACT leader to get a better sense of the program’s performance in a particular area.
The most common discrepancy is likely to occur when the ACT leader’s interview gives a more idealistic picture of the team’s functioning than the chart and observational data do. For example, on item S1 of the ACT Fidelity Scale, the chart review may show that consumer contact occurs largely in the office; however, the ACT leader may state that the ACT team members spend most of their time working in the community.
To understand and resolve this discrepancy, the assessor may say something like, “Our chart review shows 50% of consumer contact is office-based, but you estimate community-based contact is 75%. What is your interpretation of this difference?”
n n n Before you leave, check for missing data
It is a good idea to check in with the ACT leader at the end of the visit to review and resolve any discrepancies, if possible.
After your assessment visit
n n n Follow up
If necessary, follow up on any missing data (for example, by calling or sending e-mail). This would include discussing with the ACT leader any discrepancies between data sources that you notice after the visit has been completed.
n n n Score the ACT Fidelity Scale and GOI
Use the ACT Fidelity Scale and GOI protocols in Appendices C and E to score the ACT program. If you assess an agency for the first time to determine which components of ACT the agency already has in place before using this KIT to implement the ACT model, some items may not apply. If an item cannot be rated, assign a value of 1 for that item.
n n n Complete scales independently
If you have two assessors, both should independently review the data collected and rate the scales. The assessors should then compare their ratings, resolve any disagreements, and devise a consensus rating.
n n n Complete the Score Sheets
Tally the item scores and determine which level of implementation was achieved.
Choose your outcome measures
Unlike ACT process measures, which must be used in full to comprehensively understand how services are provided, you must decide which outcome measures will be most informative for your ACT program.
Initially, your quality assurance system should be simple to use and maintain. Complexity has doomed numerous well-intended attempts to collect and use outcome data. One way to simplify is to limit the number of outcome measures used. Select your outcome measures based on the type of information that will be most useful to your agency.
18 Evaluating Your ProgramAppendix A: ACT Fidelity Scale 18 Evaluating Your ProgramGetting Started 18 Evaluating Your Program
Develop procedures
Agencies may choose to develop the outcomes portion of their quality assurance system from scratch or use existing outcomes monitoring systems. A number of electronic evaluation programs are available to help you develop comprehensive, integrated, user-friendly quality assurance and outcome monitoring systems.
Examples include both publicly available tools, such as the Consumer Outcomes Monitoring Package (see the next page) and the Decision Support 2000+ Online (www.ds2kplus.org); and commercially available products, such as Service Process Quality ManagementTM (www.nccbh.org).
When deciding whether to use an existing outcomes monitoring package or to design your own, it is important to keep in mind your organization’s capabilities. The system must not create undue burden for ACT team members, and it must provide information to them that is useful in their jobs.
The system should fit into the workflow of the organization, whether that means making ratings on paper, using the Consumer Outcomes Monitoring Package (COMP) computer application, or developing your own outcomes monitoring package. Begin with whatever means are available and expand the system from there. In the beginning, you may collect data with a simple report form and you can report hand-tallied summaries to ACT team members.
A computer with a spreadsheet program (e.g., Excel) makes data tabulation and graphing easier than if it is done by hand. A computerized system for data entry and report generation presents a clear advantage, and it may be the goal, but do not wait for it.
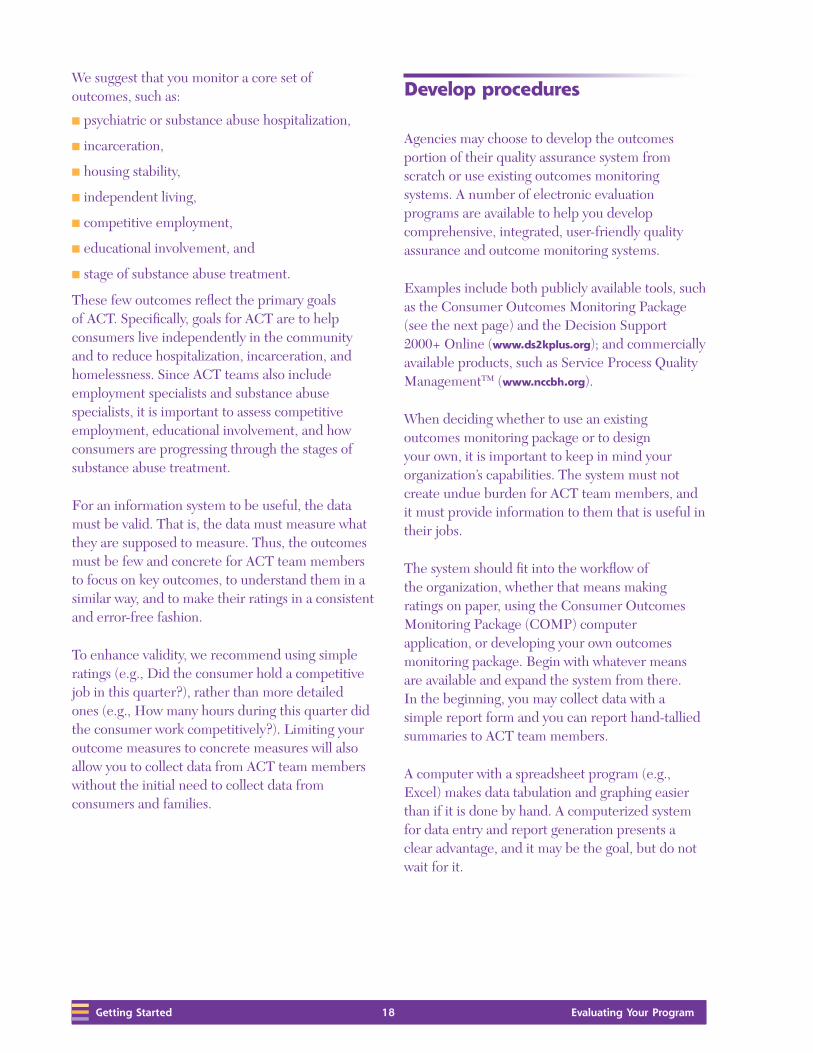
We suggest that you monitor a core set of outcomes, such as:
n psychiatric or substance abuse hospitalization,
n incarceration,
n housing stability,
n independent living,
n competitive employment,
n educational involvement, and
n stage of substance abuse treatment.
These few outcomes reflect the primary goals of ACT. Specifically, goals for ACT are to help consumers live independently in the community and to reduce hospitalization, incarceration, and homelessness. Since ACT teams also include employment specialists and substance abuse specialists, it is important to assess competitive employment, educational involvement, and how consumers are progressing through the stages of substance abuse treatment.
For an information system to be useful, the data must be valid. That is, the data must measure what they are supposed to measure. Thus, the outcomes must be few and concrete for ACT team members to focus on key outcomes, to understand them in a similar way, and to make their ratings in a consistent and error-free fashion.
To enhance validity, we recommend using simple ratings (e.g., Did the consumer hold a competitive job in this quarter?), rather than more detailed ones (e.g., How many hours during this quarter did the consumer work competitively?). Limiting your outcome measures to concrete measures will also allow you to collect data from ACT team members without the initial need to collect data from consumers and families.

Evaluating Your Program 19 Evaluating Your Program 19 Appendix A: ACT Fidelity ScaleEvaluating Your Program 19 Getting Started
Feedback does not have to come from a sophisticated computer system to be useful. It is more important that it is meaningful and frequent. For a sample Outcomes Report Form, see Appendix F; it has an example of a simple, paper-based way to collect participation and outcome data regularly. For instructions for using the Outcomes Report Form, see Appendix G.
How often should you collect outcomes data?
Plan to monitor the outcomes for EBP consumers every 3 months and share the data with your ACT team. Collecting data at regular and short intervals will enhance the reliability of your outcomes data. While we recommend that you design a system for collecting outcomes early in the implementation process, ACT programs should not expect to see the desired results until the ACT program is fully operational.
Sponsored in part by SAMHSA, the Consumer Outcomes Monitoring Package (COMP) was designed by a team at The School of Social Welfare, University of Kansas. This computer application allows agencies to choose from a pre-established list of outcomes developed for each EBP.
Data may be entered for the chosen outcomes and reports generated quarterly or monthly. The COMP also allows agencies to view their outcomes data using a variety of tables and graphs.
The designers of COMP tried to make the computer application as easy and flexible to use as possible. You may access COMP through the web. Agencies can download the computer application and print out Installation Instructions and a User Manual, that provide definitions and forms.
To download COMP:
n Go to http://research.socwel.ku.edu/ebp
n Click on the link to the download page
n Click on the links to download the Installation Instructions and User Manual.
n Follow the instructions to install the application.
What is the Consumer Outcomes Monitoring Package?

20 Evaluating Your ProgramAppendix A: ACT Fidelity Scale 20 Evaluating Your ProgramGetting Started 20 Evaluating Your Program
How should you identify data collectors?
Agency administrators or mental health authorities may assign the responsibility for collecting outcomes data to:
n the ACT leader;
n members of the EBP advisory committee;
n the quality assurance team;
n independent consultants, including consumers and family members; and
n other staff.
Unlike collecting process measures, collecting outcome measures does not require a day-long assessment process. Many standard outcome measures, such as hospitalization, homelessness, incarceration, and substance abuse, will be information that ACT team members can report from their daily work with consumers.
It is important to develop a quick, easy, standardized approach to collect outcomes data. For example, create a simple form or computer database that ACT team members can routinely update.
Once you have established your core outcomes monitoring system, learned how to routinely collect data, and are accustomed to using it to improve your ACT program, you will be ready to expand your outcomes measures. Consider seeking input from consumers and families about how to improve ACT services, both practically and clinically.
Consumers and families are important informants for agencies seeking to improve outcomes. Agencies may want to know:
n if consumers are satisfied with their services,
n how services have affected their quality of life, and
n whether they believe the services are helping them to
achieve their recovery goals.
While collecting data from consumers and families requires more staff time than the information that may be reported quickly by ACT team members, consumers and families can give ACT team members valuable feedback.
We recommend the following surveys for collecting information from consumers and families:
n the Mental Health System Improvement Program
(MHSIP) Consumer Satisfaction Survey at:
www.mhsip.org
n recovery measurement instruments such as those
described in Measuring the Promise: A Compendium of
Recovery Measures, Volume II, available through:
http://www.tecathsri.org
It is difficult to obtain a representative sample of consumer and family respondents since mailed surveys are often not returned and interviews may be done only with people who are cooperative and easy to reach.
Avoid bias in your consumer and family data by using a variety of mechanisms to conduct your assessments. For example, consider combining feedback collected through surveys with that obtained from focus groups. Another option is to hire a consultant to conduct qualitative interviews with a small group of consumers or families.
Expanding your outcome measures

Evaluating Your Program 21 Evaluating Your Program 21 Appendix A: ACT Fidelity ScaleEvaluating Your Program 21 Improving Your ACT Program
Evaluating Your Program
Using Data to Improve Your ACT Program
As you develop a quality assurance system, ACT leaders and team members will weave it into the fabric of their daily routines. Process assessments will give you a window into the demanding work done every day. Outcome reports will give you tangible evidence of the use and value of services, and they will become a basis for decisionmaking and supervision.
At some point, your ACT team may wonder how they did their jobs without an information system as they come to view it as an essential ingredient of well-implemented evidence-based practices.
n n n Create reports from your assessments
For your process data, in addition to completing the ACT Fidelity Scale, GOI, and score sheets, assessors should write a report explaining their scores. The report should include:
n an interpretation of the results of the assessment,
n strengths and weaknesses of the ACT program, and
n clear recommendations to help the ACT program improve.
The report should be informative, factual, and constructive.

22 Evaluating Your ProgramAppendix A: ACT Fidelity Scale 22 Evaluating Your ProgramImproving Your ACT Program 22 Evaluating Your Program
For your outcomes data, start with simple, easy-to-read reports. Then let experience determine what additional reports you need. You can design your reports to give information about individual consumers, a single team member’s caseload, treatment teams, or the program as a whole.
For example, reports generated for individual consumers may track the consumer’s participation in specific ACT services and outcomes over time. You could enter these reports in consumers’ charts and they could be the basis for discussions about the consumer’s progress.
n n n Use tables and graphs to understand your outcomes data
After the first process and outcomes assessments, it is often useful to provide a visual representation of a program’s progress over time. We recommend that you use tables and graphs to report the results. By graphing your ACT fidelity score, you have a visual representation of how your ACT program has changed over time. For an example, see Figure 1. For your process data, you may simply graph the results using an Excel spreadsheet and include this in your report.
When your program shows greater fidelity over time, the graph will display it and reinforce your efforts. Another feature of graphing assessment scores is to examine the cut-off score for fair (85) or good (113) implementation. Your program can use these scores as targets.
Note: 113 – 140 = good implementation
85 – 112 = fair implementation
84 and below = not ACT
70
80
90
100
110
120
130
140
Oct-01
Aug-01
Jun-01
Apr-01
Feb-0
1
Dec-00
Oct-00
Aug-00
Jun-00
Apr-00
Feb-0
0

Evaluating Your Program 23 Evaluating Your Program 23 Appendix A: ACT Fidelity ScaleEvaluating Your Program 23 Improving Your ACT Program
Here are three examples of tables and graphs that can be used to help you understand your outcomes data and use the results to improve your ACT program.
Example 1: Periodic summary tables
Periodic summary tables summarize your outcomes data each quarter and address these kinds of questions:
n How many consumers participated in our ACT program last quarter?
n What proportion of consumers in our ACT program were hospitalized last quarter?
n How did the hospitalization rate for those on ACT teams compare to the rate for consumers in standard case management?
n How many consumers with a substance use disorder in our ACT program are receiving substance abuse treatment?
n How many consumers in our ACT program worked competitively during the last quarter?
Agencies often use this type of table to understand consumer participation or to compare actual results with agency targets or goals. These tables are also frequently used to describe agencies’ services in annual reports or for external community presentations.
Table 2: Sample Periodic Summary Table of Enrollment in Evidence-Based Practices
Not eligible
Eligible but NOT in EBP service
Enrolled Percent eligible consumers enrolled
Supported Employment
0 30 60 67%
Assertive Community Treatment
30 25 90 86%
This agency provides both ACT and Supported Employment services. The ACT team serves 115 consumers. Of those, 90 receive ACT services, while 25 consumers are eligible but receive a service other than ACT. Consequently, 86% of consumers eligible for ACT currently receive the service.
Example 2: Movement tables
Tables that track changes in consumer characteristics (called movement tables) can give you a quick reference for determining service effectiveness. For example, Table 3 compares consumer residential status between two quarters.
Table 3: Sample Residential Movement Table Number of Consumers Moved
To: FY: 01 Qtr: 3
From: FY: 01 Qtr: 2
Institutional Substantial care
Semi-independent
Independent
Institutional 2 1 1 3
Substantial care 3 8 1 3
Semi-independent 1 0 2 4
Independent 1 3 2 100
Totals 7 12 6 110
above the diagonal
below the diagonal
within the diagonal
To create this table, the data were collapsed into the four broad categories. The vertical data cells reflect the residential status for consumers for the beginning quarter. The horizontal data cells reflect the most recent quarterly information. The residential status categories are then ordered from most restrictive setting (Institutional) to least restrictive (Independent).
The data in this table are presented in three colors. The purple cells are those above the diagonal, the tan cells are those below the diagonal, and the white cells are those within the diagonal. The data cells above the diagonal represent consumers who moved into a less restrictive environment between quarters. As you can see, three consumers moved from institutional care to independent living. The data reported in the diagonal cells ranging from the upper left quadrant to the lower right reflect consumers who remained in the same residential status between quarters. As you can see, two consumers were in an institution for both quarters of this report.
The cells below the diagonal line represent consumers who moved into a more restrictive setting between quarters. Three people moved from substantial care to institutional living. The column totals show the number of consumers in a given residential status for the current quarter, and the row totals show the prior quarter.
24 Evaluating Your ProgramAppendix A: ACT Fidelity Scale 24 Evaluating Your ProgramImproving Your ACT Program 24 Evaluating Your Program
You can use movement tables to portray changes in outcomes that are important to consumers, supervisors, and policymakers. The data may stimulate discussion around the progress that consumers are making or the challenges with which they are presented.
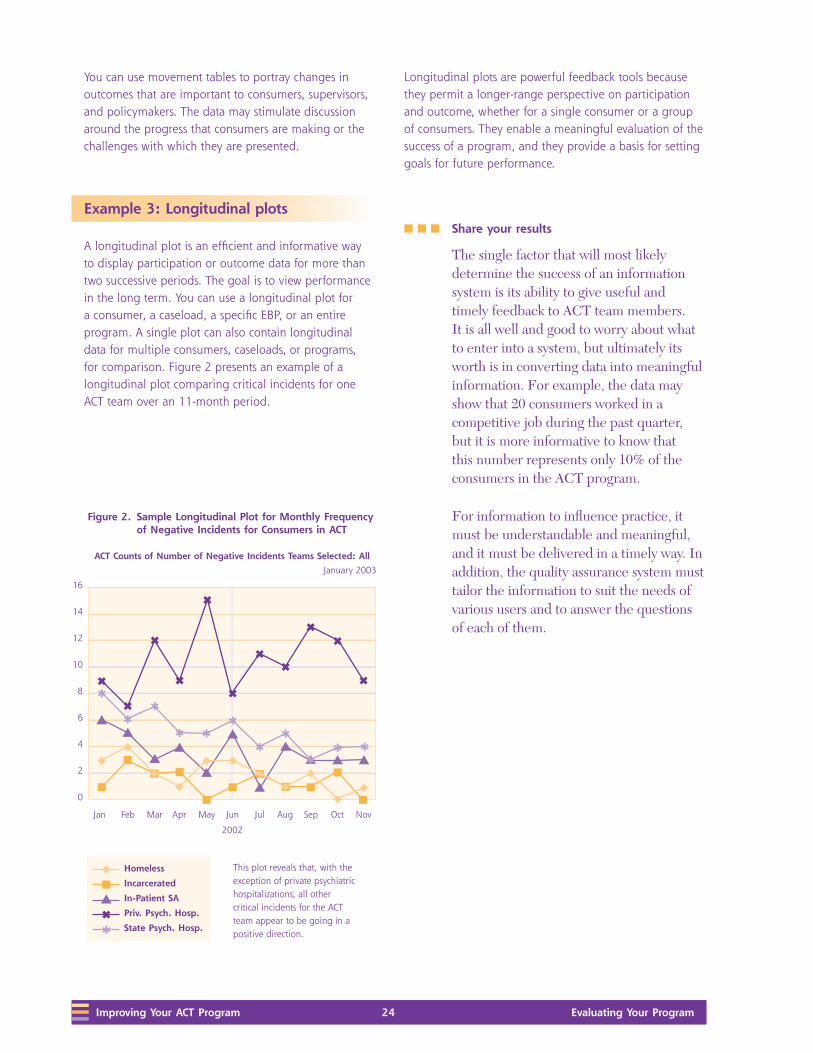
Example 3: Longitudinal plots
A longitudinal plot is an efficient and informative way to display participation or outcome data for more than two successive periods. The goal is to view performance in the long term. You can use a longitudinal plot for a consumer, a caseload, a specific EBP, or an entire program. A single plot can also contain longitudinal data for multiple consumers, caseloads, or programs, for comparison. Figure 2 presents an example of a longitudinal plot comparing critical incidents for one ACT team over an 11-month period.
Longitudinal plots are powerful feedback tools because they permit a longer-range perspective on participation and outcome, whether for a single consumer or a group of consumers. They enable a meaningful evaluation of the success of a program, and they provide a basis for setting goals for future performance.
n n n Share your results
The single factor that will most likely determine the success of an information system is its ability to give useful and timely feedback to ACT team members. It is all well and good to worry about what to enter into a system, but ultimately its worth is in converting data into meaningful information. For example, the data may show that 20 consumers worked in a competitive job during the past quarter, but it is more informative to know that this number represents only 10% of the consumers in the ACT program.
For information to influence practice, it must be understandable and meaningful, and it must be delivered in a timely way. In addition, the quality assurance system must tailor the information to suit the needs of various users and to answer the questions of each of them.
This plot reveals that, with the exception of private psychiatric hospitalizations, all other critical incidents for the ACT team appear to be going in a positive direction.
Evaluating Your Program 25 Evaluating Your Program 25 Appendix A: ACT Fidelity ScaleEvaluating Your Program 25 Improving Your ACT Program
Sharing results with ACT team members
After each assessment, dedicate time during the team meeting to discuss the results. Numbers reflective of above average or exceptional performance should trigger recognition, compliments, or other rewards. Data reflecting below average performance should provoke a search for underlying reasons and should generate strategies that offer the promise of improvement.
By doing this regularly, ACT leaders will create a “learning organization” characterized by adaptive responses to information that aim to improve consumer outcomes.
Sharing results with your ACT advisory committee or quality assurance team
You may also use this information to keep external stakeholders engaged. Sharing information with vested members of the community, staff from your mental health authority, and consumer and family advocates can be valuable. Through these channels, you may develop support for the ACT program, increase consumer participation, and raise private funds for your agency.
Sharing results internally
Agencies may distribute reports during all staff- and manager-level meetings to keep staff across the agency informed and engaged in the process of implementing ACT.
Agencies with successful ACT programs highlight the importance of developing an understanding and support for the ACT model across the agency.
Sharing results with consumers and families
Agencies may highlight assessment results in consumer meetings. Increasing consumers’ understanding of the ACT program may motivate consumers to participate in the treatment process and build trust in the consumer-provider relationship. Furthermore, sharing results may create hope and enthusiasm for your ACT program.
Sharing information motivates people and stimulates changes in behavior. Sharing the results of your assessments with a variety of stakeholders is the key to improving your program.

26 Evaluating Your ProgramAppendix A: ACT Fidelity Scale 26 Evaluating Your ProgramImproving Your ACT Program 26 Evaluating Your Program

Evaluating Your Program 27 Evaluating Your Program 27 Appendix A: ACT Fidelity Scale
Appendix A: ACT Fidelity Scale and GOI Cover Sheet
Evaluating Your Program

28 Evaluating Your ProgramAppendix A: ACT Fidelity Scale 28 Evaluating Your Program

Evaluating Your Program 29 Evaluating Your Program 29 Appendix A: ACT Fidelity Scale
ACT Fidelity Scale and GOI Cover Sheet Today’s date: _____/___/_____
Assessors’ names: ___________________________________________
___________________________________________
___________________________________________
Program name (or Program code): __________________________________
Agency name: ___________________________________________
Agency address: _____________________________________________________________________ Street
_____________________________________________________________________ City State ZIP code
Team leader or contact person: ______________________________________________________________
Telephone: ( ___) _____–_______ E-mail: ________________________________________
Sources used for ACT fidelity and GOI assessments: o Chart review Number reviewed: ______o Brochure review
o Team meeting observation
o Supervision observation
o Team leader interview o ACT team interviews Number interviewed: ______o Consumer interviews Number interviewed: ______o Family member interviews Number interviewed: ______o Other staff interviewed Number interviewed: ______o Other
Number of ACT team members: _______
Number of current ACT consumers: _______
Number of consumers served last year: _______
Funding source: _____________________________________________________________________
Agency location: o Urban?
o Rural?
Date program was started: _____/_____/______

30 Evaluating Your ProgramAppendix A: ACT Fidelity Scale 30 Evaluating Your Program

Evaluating Your Program 31 Evaluating Your Program 31 Appendix B: ACT Fidelity Score Sheet
Appendix B: ACT Fidelity Score Sheet and ACT Fidelity Scale
Evaluating Your Program

32 Evaluating Your ProgramAppendix B: ACT Fidelity Score Sheet 32 Evaluating Your Program

Evaluating Your Program 33 Evaluating Your Program 33 Appendix B: ACT Fidelity Score Sheet
ACT Fidelity Scale
Human resources: Structure and composition
Criterion
Ratings / Anchors
1 2 3 4 5
H1 Small caseload: Consumer/
provider ratio = 10:1
50 consumers/team
member or more
35 – 49 21 – 34 11 – 20 10 consumers/team
member or fewer
H2 Team approach:
Provider group functions as
team rather than as individual
ACT team members; ACT team
members know and work with all
consumers
Less than 10%
consumers with
multiple team face-
to-face contacts in
reporting 2-week
period
10 – 36% 37 – 63% 64 – 89% 90% or more consumers
have face-to-face contact
with >1 staff member
in 2 weeks
H3 Program meeting:
Meets often to plan and review
services for each consumer
Service-planning for
each consumer usually
1x/month or less
At least 2x/month
but less often
than 1x/week
At least 1x/week but
less than 2x/week
At least 2x/week
but less than 4x/
week
Meets at least 4 days/
week and reviews each
consumer each time,
even if only briefly
H4 Practicing ACT leader:
Supervisor of Frontline ACT team
members provides direct services
Supervisor provides no
services
Supervisor
provides services
on rare occasions
as backup
Supervisor provides
services routinely as
backup or less than
25% of the time
Supervisor
normally provides
services between
25% and 50%
time
Supervisor provides
services at least 50%
time
H5 Continuity of staffing:
Keeps same staffing over time
Greater than 80%
turnover in 2 years
60 – 80%
turnover in 2
years
40 – 59% turnover in
2 years
20 – 39% turnover
in 2 years
Less than 20% turnover
in 2 years
H6 Staff capacity:
Operates at full staffing
Operated at less than
50% staffing in past 12
months
50 – 64% 65 – 79% 80 – 94% Operated at 95% or
more of full staffing in
past 12 months
H7 Psychiatrist on team:
At least 1 full-time psychiatrist
for 100 consumers works with
program
Less than .10 FTE
regular psychiatrist for
100 consumers
.10 – .39 FTE for
100 consumers
.40 – .69 FTE for 100
consumers
.70 – .99 FTE for
100 consumers
At least 1 full-time
psychiatrist assigned
directly to 100-
consumer program
H8 Nurse on team:
At least 2 full-time nurses
assigned for a 100-consumer
program
Less than .20 FTE
regular nurse for 100
consumers
.20 – .79 FTE for
100 consumers
.80 – 1.39 FTE for
100 consumers
1.40 – 1.99 FTE for
100 consumers
2 full-time nurses or
more are members for
100-consumer program
H9 Substance abuse specialist on
team:
A 100-consumer program with at
least 2 staff members with 1 year
of training or clinical experience
in substance abuse treatment
Less than .20 FTE
S/A expertise for 100
consumers
.20 – .79 FTE for
100 consumers
.80 – 1.39 FTE for
100 consumers
1.40 – 1.99 FTE for
100 consumers
2 FTEs or more with
1 year S/A training
or supervised S/A
experience
H10 Vocational specialist on team:
At least 2 team members with
1 year training/experience in
vocational rehabilitation and
support
Less than .20 FTE
vocational expertise for
100 consumers
.20 – .79 FTE for
100 consumers
.80 – 1.39 FTE for
100 consumers
1.40 – 1.99 FTE for
100 consumers
2 FTEs or more with 1
year voc. rehab. training
or supervised VR
experience
H11 Program size:
Of sufficient absolute size to
consistently provide necessary
staffing diversity and coverage
Less than 2.5 FTE staff 2.5 – 4.9 FTE 5.0 – 7.4 FTE 7.5 – 9.9 At least 10 FTE staff

34 Evaluating Your ProgramAppendix B: ACT Fidelity Score Sheet 34 Evaluating Your Program
Organizational boundaries
Criterion
Ratings / Anchors
1 2 3 4 5
O1 Explicit admission criteria:
Has clearly identified mission to
serve a particular population.
Has and uses measurable and
operationally defined criteria to
screen out inappropriate referrals.
Has no set criteria and
takes all types of cases
as determined outside
the program
Has a generally
defined mission
but admission
process
dominated by
organizational
convenience
Tries to seek and
select a defined
set of consumers
but accepts most
referrals
Typically actively
seeks and
screens referrals
carefully but
occasionally bows
to organizational
pressure
Actively recruits a
defined population
and all cases comply
with explicit admission
criteria
O2 Intake rate:
Takes consumers in at a low
rate to maintain a stable service
environment
Highest monthly
intake rate in the last 6
months = greater than
15 consumers/month
13 – 15 10 – 12 7 – 9 Highest monthly intake
rate in the last 6 months
no greater than 6
consumers/month
O3 Full responsibility for
treatment services:
In addition to case management,
directly provides psychiatric
services, counseling/
psychotherapy, housing support,
substance abuse treatment,
employment and rehabilitative
services
Provides no more than
case management
services
Provides 1 of
5 additional
services and
refers externally
for others
Provides 2 of 5
additional services
and refers externally
for others
Provides 3 or 4
of 5 additional
services and refers
externally for
others
Provides all 5 services to
consumers
O4 Responsibility for crisis
services:
Has 24-hour responsibility for
covering psychiatric crises
Has no responsibility
for handling crises
after hours
Emergency
service has
program-
generated
protocol for
program
consumers
Is available by
phone, mostly in
consulting role
Provides
emergency service
backup; e.g.,
program is called,
makes decision
about need for
direct program
involvement
Provides 24-hour
coverage
O5 Responsibility for hospital
admissions:
Is involved in hospital admissions
Is involved in fewer
than 5% decisions to
hospitalize
ACT team is
involved in
5% – 34% of
admissions
ACT team is involved
in 35% – 64% of
admissions
ACT team is
involved in
65% – 94% of
admissions
ACT team is involved
in 95% or more
admissions
O6 Responsibility for hospital
discharge planning:
Is involved in planning for
hospital discharges
Is involved in fewer
than 5% of hospital
discharges
5% – 34%
of program
consumer
discharges
planned jointly
with program
35% – 64% of
program consumer
discharges planned
jointly with program
65 – 94% of
program consumer
discharges
planned jointly
with program
95% or more discharges
planned jointly with
program
O7 Time-unlimited services
(graduation rate):
Rarely closes cases but remains
the point of contact for all
consumers as needed
More than 90%
of consumers are
expected to be
discharged within 1
year
From 38 – 90%
of consumers
expected to be
discharged within
1 year
From 18 – 37% of
consumers expected
to be discharged
within 1 year
From 5 – 17%
of consumers
expected to be
discharged within
1 year
All consumers served
on a time-unlimited
basis, with fewer
than 5% expected to
graduate annually

Evaluating Your Program 35 Evaluating Your Program 35 Appendix B: ACT Fidelity Score Sheet
Nature of services
Criterion
Ratings / Anchors
1 2 3 4 5
S1 Community-based services:
Works to monitor status, develop community living skills in community rather than in office
Less than 20% of face-to-face contacts in community
20 – 39% 40 – 59% 60 – 79% 80% of total face-to-face contacts in community
S2 No dropout policy:
Retains high percentage of consumers
Less than 50% of caseload retained over 12-month period
50 – 64% 65 – 79% 80 – 94% 95% or more of caseload is retained over a 12-month period
S3 Assertive engagement mechanisms:
As part of ensuring engagement, uses street outreach and legal mechanisms (probation/parole, OP commitment) as indicated and as available
Passive in recruitment and re-engagement; almost never uses street outreach legal mechanisms
Makes initial attempts to engage but generally focuses on most motivated consumers
Tries outreach and uses legal mechanisms only as convenient
Usually has plan for engagement and uses most mechanisms available
Demonstrates consistently well-thought-out strategies and uses street outreach and legal mechanisms whenever appropriate
S4 Intensity of service:
High total amount of service time, as needed
Average 15 minutes/ week or less of face-to-face contact for each consumer
15 – 49 minutes/ week
50 – 84 minutes/week 85 – 119 minutes/week
Average 2 hours/week or more of face-to-face contact for each consumer
S5 Frequency of contact:
High number of service contacts, as needed
Average less than 1 face-to-face contact/ week or fewer for each consumer
1 – 2x/week 2 – 3x/week 3 – 4x/week Average 4 or more face-to-face contacts/week for each consumer
S6 Work with informal support system:
With or without consumer present, provides support and skills for consumer’s support network: family, landlords, employers
Less than .5 contact/ month for each consumer with support system
.5 – 1 contact/ month for each consumer with support system in the community
1 – 2 contact/month for each consumer with support system in the community
2 – 3 contacts/month for consumer with support system in the community
4 or more contacts/month for each consumer with support system in the community
S7 Individualized substance abuse treatment:
1 or more team members provides direct treatment and substance abuse treatment for consumers with substance-use disorders
No direct, individualized substance abuse treatment provided
Team variably addresses SA concerns with consumers; provides no formal, individualized SA treatment
While team integrates some substance abuse treatment into regular consumer contact, no formal, individualized SA treatment
Some formal individualized SA treatment offered; consumers with substance-use disorders spend less than 24 minutes/week in such treatment
Consumers with substance-use disorders average 24 minutes/week or more in formal substance abuse treatment
S8 Co-Occurring disorder treatment groups:
Uses group modalities as treatment strategy for consumers with substance-use disorders
Fewer than 5% of consumers with substance-use disorders attend at least 1 substance abuse treatment group meeting a month
5 – 19% 20 – 34% 35 – 49% 50% or more of consumers with substance-use disorders attend at least 1 substance abuse treatment group meeting/month
S9 Dual Disorders (DD) Model:
Uses a non-confrontational, stage-wise treatment model, follows behavioral principles, considers interactions of mental illness and substance abuse, and has gradual expectations of abstinence
Fully based on traditional model: confrontation; mandated abstinence; higher power, etc.
Uses primarily traditional model: e.g., refers to AA; uses inpatient detox & rehab; recognizes need to persuade consumers in denial or who don’t fit AA
Uses mixed model: e.g., DD principles in treatment plans; refers consumers to persuasion groups; uses hospitalization for rehab.; refers to AA, NA
Uses primarily DD model: e.g., DD principles in treatment plans; persuasion and active treatment groups; rarely hospitalizes for rehab. or detox except for medical necessity; refers out some SA treatment
Fully based in DD treatment principles, with treatment provided by ACT staff members
S10 Role of consumers on team:
Consumers involved as team members providing direct services
Consumers not involved in providing service
Consumers fill consumer-specific service roles (e.g., self-help)
Consumers work part-time in case-management roles with reduced responsibilities
Consumers work full-time in case management roles with reduced responsibilities
Consumers employed full-time as ACT team members (e.g., case managers) with full professional status

36 Evaluating Your ProgramAppendix B: ACT Fidelity Score Sheet 36 Evaluating Your Program
ACT Fidelity Score Sheet
Date of visit: _______ / ______/ ________
Agency name: __________________________________
Assessors’ names: _______________________________ _____________________________________________
Assessor 1 Assessor 2 Consensus
H1 Small caseload
H2 Team approach
H3 Program meeting
H4 Practicing ACT leader
H5 Continuity of staffing
H6 Staff capacity
H7 Psychiatrist on team
H8 Nurse on team
H9 Substance abuse specialist on team
H10 Vocational specialist on team
H11 Program size
O1 Explicit admission criteria
O2 Intake rate
O3 Full responsibility for treatment services
O4 Responsibility for crisis services
O5 Responsibility for hospital admissions
O6 Responsibility for hospital discharge planning
O7 Time-unlimited services
S1 In vivo services
S2 No drop-out policy
S3 Assertive engagement mechanisms
S4 Intensity of service
S5 Frequency of contact
S6 Work with support system
S7 Individualized substance abuse treatment
S8 Co-Occurring disorder treatment groups
S9 Co-Occurring disorders (Dual Disorders) model
S10 Role of consumers on treatment team
Total mean score

Evaluating Your Program 37 Evaluating Your Program 37 Appendix C: ACT Fidelity Scale Protocol
Appendix C: ACT Fidelity Scale Protocol
Evaluating Your Program

38 Evaluating Your ProgramAppendix C: ACT Fidelity Scale Protocol 38 Evaluating Your Program

Evaluating Your Program 39 Evaluating Your Program 39 Appendix C: ACT Fidelity Scale Protocol
ACT Fidelity Scale Protocol
Similar to the ACT Fidelity Scale, the ACT Fidelity Scale Protocol is divided into three categories:
n Human Resources (Structure and Composition),
n Organizational Boundaries, and
n Nature of Services.
Human Resources: Structure and Composition
H1. Small caseload
Definition: Consumer/team member ratio of 10:1
Rationale: ACT teams should maintain a low consumer-to-staff ratio in the range of 10:1 to ensure adequate intensity and individualization of services.
Sources of information:
1. ACT leader interview
n Begin interview by asking ACT leader to identify all team members, their roles, and whether they are full time.
n From this roster, calculate the number of full-time equivalent (FTE) staff and confirm with ACT leader.
n Possible questions include, “How many staff work on the ACT team?” and “How many consumers are currently served by the team?”
n In counting the current caseload, include all active consumers. The caseload totals should include any consumer who has been formally admitted, even if it is as recent as the last week. The team determines the definition of active status, but note that the count will affect other fidelity items, such as frequency of visits.
2. Agency documents
n Some ACT teams have a Cardex or similar organization system, or the roster of active consumers is listed elsewhere. If doubt exists about the precise count of the caseload, then these documents can be consulted as a crosscheck on the count.
n Item response coding: Count all team members who conduct home visits and other case management duties. Unless countervailing reasons exist, count all team members providing direct services (including substance abuse specialist, employment specialist, and ACT leader), EXCEPT the psychiatrist.
n Do not include administrative support staff when determining the caseload ratio.
Formula:
Number of consumers presently served
Number of FTE staff
If this ratio is 10 or less, code the item as “5.”
Special case: Do not count team members who are technically employed by the team but who have been on extended leave for 3 months or more.

40 Evaluating Your ProgramAppendix C: ACT Fidelity Scale Protocol 40 Evaluating Your Program
H2. Team Approach
Definition: Provider group functions as a team; team members know and work with all consumers.
Rationale: The entire team shares responsibility for each consumer; each team member contributes expertise as appropriate. The team approach ensures continuity of care for consumers and creates a supportive organizational environment for team members.
Sources of information:
1. Chart review
n Review charts for 10 randomly selected consumers. Remember to use the most complete and up-to-date time period from the chart.
n Ask the ACT leader, team members, or an administrative person for the most recent, but complete, period of documentation. Data should be taken from the last 2 full calendar weeks before the fidelity visit (or the most recent 2-week period available in the charts if the records are not current).
n Count the number of different ACT team members who have had a face-to-face contact with the consumer during this time.
n Determine the percentage of consumers who have seen more than 1 team member in the 2-week period.
2. Team leader interview: “In a typical 2-week period, what percentage of consumers sees more than 1 member of the team?”
3. Team member interview
n During a home visit, ask the case manager which ACT team members have seen this consumer this week.
n “How about the previous week?”
n “Is this pattern similar for other consumers?”
4. Consumer interview
n “Who have you seen from the ACT team this week? How about last week?”
n “Do you see the same person over and over or different people?”
5. Other data sources (e.g., computerized summaries)
n Use this data source if available, but ask the ACT leader for information about how it is compiled and how confident one can be in its accuracy.
Item response coding: Use chart review as the primary data source. Determine the number of different staff who have seen each consumer. The score on the DACTS is determined by the percentage of consumers who have contact with more than one ACT worker in the 2-week period. For example, if > 90% of consumers see more than 1 case manager in a 2-week period, code the item a “5.”
If the information from different sources does not agree, (for example, if the ACT leader indicates a higher rate of shared caseloads than the records do), then ask the ACT leader to help you understand the discrepancy. The results from a chart review are overruled if other data (e.g., ACT leader interview, internal statistics) conflict with or refute it.
H3. Program Meeting
Definition: Program meets frequently to plan and review services for each consumer.
Rationale: Daily team meetings allow ACT team members to discuss consumers, solve problems, and plan treatment and rehabilitation efforts, ensuring all consumers receive optimal service.
Sources of information:
1. ACT leader interview
n “How often does the ACT team meet as a full group to review services provided to each consumer?”
n “How many consumers are reviewed at each meeting?”

Evaluating Your Program 41 Evaluating Your Program 41 Appendix C: ACT Fidelity Scale Protocol
2. Internal documentation
n The consumer service log (e.g., a Cardex that holds summary data for each consumer) may help determine whether each consumer is discussed (even briefly) at each meeting.
Item response coding: This count includes clinical review meetings only; exclude administrative and treatment planning meetings from the count for this item. The expectation is that all full-time team members should attend all meetings; the team psychiatrist may attend fewer meetings (to receive full credit, the psychiatrist should attend at least once a week). Part-time team members are expected to attend at least twice weekly to receive full credit on this item. Team members from all shifts should routinely attend.
If the team meets at least 4 days a week and reviews each consumer each time, score a “5.” If the team meets 4 or more days a week but does not discuss each consumer each time, they would earn a “4” for this item.
Poor attendance at the team meeting does not count against the score on this item if the program holds the expectation that all team members attend; however, poor attendance is something to note in the fidelity assessment report.
H4. Practicing ACT Leader
Definition: Supervisor of Frontline ACT team members provides direct services.
Rationale: Research has shown this factor was among the 5 most strongly related to better consumer outcomes. ACT leaders who also have direct clinical contact are better able to model appropriate clinical interventions and remain in touch with the consumers served by the team.
Sources of information:
1. ACT leader interview
n “Do you provide direct services to consumers?”
n [If “yes”] “What percentage of your time is devoted to direct services?”
2. Productivity records
n Some agencies require staff to track direct service time. Ask if this applies at this agency and ask to see the information for the last calendar month (or some similar unit of time). Make sure that the chosen period of time is typical; e.g., exclude a week in which the center was undergoing Joint Commission on Accreditation of Healthcare Organizations (JCAHO) accreditation.
Item response coding: Give more weight to the actual records than to the verbal report. If a discrepancy exists, ask the ACT leader to help you understand it. If the ACT leader provides services at least 50% of the time, code the item as a “5.”
H5. Continuity of Staffing
Definition: Program maintains the same staffing over time.
Rationale: Maintaining a consistent staff enhances team cohesion; additionally, consistent staffing enhances the therapeutic relationships between consumers and providers.
Sources of information:
1. ACT leader interview
n Before the fidelity visit, ask the ACT leader to have available a list of all employees over the past 2 years (or for the duration of the existence of the program).
n “What is the total number of staff positions on the ACT team?
n “Name the team members who have left in the past 2 years.” [If the team has been in existence for a shorter period, use the formula below to adjust for the shortened timeframe.]
Item response coding:
Formula:
Number of staff to leave 12 xTotal number of positions Number of months

42 Evaluating Your ProgramAppendix C: ACT Fidelity Scale Protocol 42 Evaluating Your Program
Examples:
There were 20 staff workers who occupied the nine line positions at West over 24 months, compared with seven staff workers for five line positions at South over 23 months. The annual turnover rate was 61.1% for West versus 20.9% for South.
West: 11/9 x 12/24 = 61.1%
South: 2/5 x 12/23 = 20.9%
If the annual turnover rate is 10% or less, then the item is coded as a “5.” A team member who has been on an extended leave for 3 months or more is considered among the number of staff who have left, even if he or she technically remain in the position.
H6. Staff Capacity
Definition: Program operates at full staffing.
Rationale: Maintaining consistent, multidisciplinary services requires minimal position vacancies.
Sources of information:
1. ACT leader interview
n Before the fidelity visit, ask that the ACT leader have available a list of unfilled positions for each month over past year (or for the duration of the existence of the program).
n Ask the ACT leader to go through the past 12 months, month by month.
n “Did you have any position vacancies in January? [If “yes,” ask “How many?”] Continue through all 12 of the previous months (or for the length of time the program has been operating, if less than 12 months).
n “Have you had anyone who has been on leave for more than 1 month during the last 12 months?” [Count any extended absences, e.g., sick leave or leave after the birth of a child, in the same fashion as months of vacancies.]
n Item response coding: For each month, calculate the vacancy rate.
Formula:
100 x (sum of number vacancies each month)Total number of staff positions x 12
Include the psychiatrist, but exclude any administrative support staff when determining total staff positions. Calculate the mean monthly vacancy rate (given by the above formula) for the 12-month period. Subtract from 100%.
If the program has operated at 95% or more of full staffing capacity for the last 12 months, code the item as a “5.” If a member of the team is on extended leave for 1 month or more, this counts as a position vacancy.
H7. Psychiatrist on Staff
Definition: For 100 consumers, at least 1 full-time psychiatrist is assigned to work with the program.
Rationale: The psychiatrist serves as medical director for the team. In addition to medication monitoring, the psychiatrist functions as a fully integrated team member, participating in treatment planning and rehabilitation efforts.
Sources of information:
1. ACT leader interview
n Information about FTE psychiatrist is obtained during the initial review of the staffing.
n Calculate the FTE psychiatrist time per 100 consumers (see formula, below).
2. Team member interview
n “What is the psychiatrist’s role on the team?”
n “Does he or she come to meetings?”
n “Is he or she readily accessible?”
n “Does the psychiatrist ever see consumers who are not on the ACT team?”

Evaluating Your Program 43 Evaluating Your Program 43 Appendix C: ACT Fidelity Scale Protocol
3. Consumer interview
n “How often do you see the team psychiatrist?”
n “Do you use the ACT team psychiatrist for medications?”
Item response coding:
Formula:
FTE value x 100 = FTE per 100 consumers
Number of consumers served
Examples:
West has .75 FTE psychiatrist for a 50-consumer program. South has .75 FTE for a 120-consumer program.
West: [(.75 * 100) / 50] = 1.5 FTE psychiatrist ➔ code item 5
South: [(.75 * 100) /120] = .63 FTE psychiatrist ➔ code item 3
If information across sources is inconsistent, ask for clarification during the ACT leader interview or follow up with the program. As with all scale items, base the rating on the most credible evidence available (e.g., even if the psychiatrist is reported as 1.0 FTE to a 100-person ACT team, if the consumers and ACT team members consistently report that he or she is unavailable for consultation, a lower score on this item is likely appropriate).
If at least 1 full-time psychiatrist is assigned directly to a 100-consumer program, code the item as a “5.”
H8. Nurse on staff
Definition: At least 2 full-time nurses are assigned to work with a 100-consumer program.
Rationale: The full-time RN has been found to be a critical ingredient in successful ACT programs. The nurses function as full members of the team, which includes conducting home visits, treatment planning, and daily team meetings. Nurses can help administer needed medications and serve to educate the team about important medication issues.
Sources of information:
1. ACT leader interview
n Information about FTE RNs is obtained during the initial review of the staffing.
n Calculate the FTE nurse time per 100 consumers (see formula, below).
2. Team member interview
n “What is the nurse’s role on the team?”
n “Does he or she come to meetings?”
n “Is he or she readily accessible?”
n “Does the nurse ever have responsibilities (or consumers) outside the ACT team?”
3. Consumer interview
n “How often do you see the team nurses?”
Item response coding:
Formula:
FTE value x 100 = FTE per 100 consumers
Number of consumers served
If inconsistent, reconcile information across sources and score accordingly.
If 2 full-time nurses or more are members of a 100-consumer program, code the item as a “5.”
H9. Substance abuse specialist on staff
Definition: At least 2 staff members on the ACT team with at least 1 year of training or clinical experience in substance abuse treatment, per 100-consumer program
Rationale: Concurrent substance-use disorders are common in consumers. Appropriate assessment and intervention strategies are critical.

44 Evaluating Your ProgramAppendix C: ACT Fidelity Scale Protocol 44 Evaluating Your Program
Sources of information:
1. ACT leader interview
n Information about FTE substance abuse specialists is obtained during the initial review of the staffing.
n For each substance abuse specialist, determine if each has at least 1 year of training or experience in substance abuse treatment.
n Calculate the FTE substance abuse specialist time per 100 consumers (see formula, below)
Item response coding:
Formula:
FTE value x 100 = FTE per 100 consumers
Number of consumers served
Someone with State certification or licensure in substance abuse counseling meets the training/experience requirements; such credentialing is sufficient, but not necessary to obtain full credit on this item. If a substance abuse counselor is on loan from another program or otherwise works part time on the team (e.g., he or she has another role at the center), give partial credit according to the percentage of time dedicated to the ACT team.
If 2 FTEs or more with 1 year of substance abuse training or supervised substance abuse treatment experience are assigned to a 100-consumer program, code the item as a “5.”
H10. Vocational specialist on staff
Definition: Program includes at least 2 staff members with at least 1 year of training/experience in vocational rehabilitation and support.
Rationale: ACT teams emphasize skill development and support in natural settings. Fully integrated ACT teams include vocational services that enable consumers to find and keep jobs in integrated work settings.
Sources of information:
1. ACT leader interview
n Information about FTE vocational specialist is obtained during the initial review of the staffing.
n Calculate the FTE vocational specialist time for 100 consumers (see formula, below).
Item response coding:
Formula:
FTE value x 100 = FTE per 100 consumers
Number of consumers served
Full credit may be given even if the team’s vocational specialist belongs to a separate supported employment team, if he or she sees only ACT consumers. Otherwise, give partial credit according to the percentage of time the vocational specialist works with ACT consumers.
If, for a 100-consumer program, 2 FTEs or more with 1-year vocational rehabilitation training/supervised experience were assigned, code the item as a “5.”
H11. Program size
Definition: Program is of sufficient size to consistently provide necessary staffing diversity and coverage.
Rationale: The ACT team provides an integrated approach to mental health services, through which the range of treatment issues are addressed from a variety of perspectives. It is critical to maintain adequate staff size and disciplinary background to provide comprehensive, individualized service to each consumer.
Sources of information:
1. ACT leader interview
n Information about FTE vocational specialist is obtained during the initial review of the staffing.

Evaluating Your Program 45 Evaluating Your Program 45 Appendix C: ACT Fidelity Scale Protocol
Item response coding: If the program has at least 10 FTE staff, code the item as a “5.” Count all staff, including psychiatrist (exclude administrative support staff).
Organizational Boundaries
O1. Explicit admission criteria
Definition: The program has a clearly identified mission to serve a particular population; it uses measurable and operationally defined criteria to screen out inappropriate referrals. Admission criteria should be pointedly targeted toward consumers who typically do not benefit from usual services. ACT teams are intended for adults with serious mental illness. In addition to these very general criteria, an ACT team should have further admission guidelines tailored to their treatment setting. Examples of more specific admission criteria that might be suitable include:
n Pattern of frequent hospital admissions
n Frequent use of emergency services
n Consumers discharged from long-term hospitalizations
n Co-occurring substance-use disorders
n Homelessness
n Involvement with the criminal justice system
n Not adhering to medications as prescribed
n Not benefiting from usual mental health services (e.g., day treatment)
Rationale: ACT is best suited to consumers who do not effectively use less intensive mental health services.
Sources of Information:
1. ACT leader interview
n “Does your ACT team have a clearly defined target population with whom you work?”
n “What formal admission criteria do you use to screen potential consumers?”
n “How do you apply these criteria?”
n “Who makes referrals to the ACT team?”
n “Who has the final say about whether a consumer is served by the ACT team?”
n “Are there circumstances where you have to take consumers onto your team?”
n “What recruitment procedures do you use to find consumers for the ACT team?”
n “Do you have some ACT consumers who you feel do not really need the intensity of ACT services?”
2. Team member interview: “How does someone become a consumer of the ACT team?”
3. Internal records: Note documentation of application of explicit admission criteria
Item response coding: If the program serves a well-defined population and all consumers meet explicit admission criteria, code the item as a “5.”
O2. Intake rate
Definition: Program takes consumers in at a low rate to maintain a stable service environment.
Rationale: To provide consistent, individualized, and comprehensive services to consumers, a low growth rate of the consumer population is necessary.
Sources of Information:
1. ACT leader interview
n Before the fidelity visit, ask that the ACT leader have a list of the new admissions for the last 6 months.

46 Evaluating Your ProgramAppendix C: ACT Fidelity Scale Protocol 46 Evaluating Your Program
n “How many new consumers have you taken on, per month, during the last 6 months?”
Item response coding: If the highest monthly intake rate during the last 6 months was no greater than 6 consumers, code the item as a “5.” For new teams, this score may be low if the team is under pressure to serve a full caseload; their rating on this item will likely improve once they have been operating for a period of time.
O3. Full responsibility for treatment services
Definition: ACT team directly provides psychiatric services and medication management, counseling/psychotherapy, housing support, substance abuse treatment, and employment/rehabilitative services, in addition to case management services.
Rationale: Consumers benefit when services are integrated into a single team, rather than when they are referred to many different service providers. Furthermore, an integrated approach allows services to be tailored to each consumer.
Sources of Information:
1. ACT leader interview
n Through discussion with the ACT leader, determine which services the team provides and for which services consumers are referred elsewhere. Determine the nature of services the team offers.
n “Do your consumers see other psychiatrists outside of the ACT team?”
n “Do some consumers receive case management services from their residences?”
n “Do any consumers live in supervised group homes? If yes, how many? What is the nature of the case management/rehabilitation services?” [If more than 10% live in a group residence and receive services that generally duplicate what the ACT team would otherwise be doing (e.g., if they are heavily staffed), then count this as brokered residential services.]
n “What percentage of consumers receives additional (non-ACT) case management services?”
n “I am going to read you a list. Which of the following services do your consumers receive from another department within your agency (or from another agency, and which do your team provide directly?” (Ask for details on particular services as necessary.)
n case management
n medication prescription, administration, monitoring, and documentation
n counseling/individual supportive therapy
n housing support
n substance abuse treatment
n employment or other rehabilitative services (e.g., ADLs, vocational counseling/support)
2. Team member interview: Ask similar questions of the ACT leader.
3. Consumer interview
n “Who helps you get your services for housing? For employment?”
n “Who helps you besides the ACT team?”
Item response coding: The ACT leader is the primary source. If discrepancies exist, follow up. In general, the team should offer these services in proactive, systematic, and inclusive fashion to all consumers. If the team is responsible for 90% or more of each type of services for its consumers, code the item as a “5.”
O4. Responsibility for crisis services
Definition: Program has 24-hour responsibility for covering psychiatric crises.
Rationale: An immediate response can help minimize distress when consumers are faced with crisis. When the ACT team provides crisis intervention, continuity of care is maintained.

Evaluating Your Program 47 Evaluating Your Program 47 Appendix C: ACT Fidelity Scale Protocol
Sources of Information:
1. ACT leader interview
n “What 24-hour emergency services are available for ACT consumers?”
n “What is the ACT team’s role in providing 24-hour emergency services?”
Item response coding: If the program provides 24-hour coverage directly (i.e., an ACT team member is on-call at all times, typically by carrying a beeper), code the item as a “5.” If the team is not the first line of crisis intervention (e.g., they are notified of crises through the general crisis line for the mental health center), a lower score is appropriate. Code as “4” if the crisis line reliably calls the ACT team for any situation beyond routine.
O5. Responsibility for hospital admissions
Definition: ACT team is closely involved in hospital admissions.
Rationale: More appropriate use of psychiatric hospitalization occurs and continuity of care is maintained when the ACT team is involved with psychiatric hospitalizations.
Sources of information:
1. ACT leader interview
n Before the fidelity visit, ask that the ACT leader compile a list of the last 10 hospital admissions. Review each admission with the ACT leader.
n “What happened on this admission (i.e., describe the process as it involves the ACT team)?”
n “Was the team aware of the admission in advance?”
n “In general, what role does the ACT team play in the decision to hospitalize ACT consumers?”
n “Are any ACT team members in regular contact with the hospital?”
n “Does the ACT team policy differ from the rest of the agency regarding hospital admissions?”
2. Team member interview
n “How often is the team involved in the decision to admit consumers for psychiatric hospitalization?”
n “Describe the process the team goes through when consumers must be admitted to a hospital.”
Item response coding: Determine the percentage of admissions in which the ACT team was involved in admissions. If 95% or more of all admissions involved the ACT team, code the item as a “5.”
O6. Responsibility for hospital discharge planning
Definition: Program is involved in planning for hospital discharges.
Rationale: Ongoing participation of the ACT team during a consumer’s hospitalization and discharge planning allows the team to help maintain community supports (e.g., housing) and continuity of service.
Sources of information:
1. ACT leader interview
n Before the fidelity visit, ask that the ACT leader compile a list of the last 8-10 hospital discharges. Review each discharge with the ACT leader.
n “What happened on this discharge?” (i.e., describe the process as it involves the ACT team)
n “Was the team aware of the discharge in advance?”
n “What was the percentage of cases in which the ACT team was involved in the decision or planning for discharge of consumers hospitalized in the last year?”
n “What role does the ACT team play in psychiatric or substance abuse discharges?”
n “Does the ACT team role in hospital discharges differ from the general agency policy?”
2. Team member interview: “How often is the team involved with discharge planning when consumers are hospitalized for psychiatric or substance abuse reasons?”

48 Evaluating Your ProgramAppendix C: ACT Fidelity Scale Protocol 48 Evaluating Your Program
Item response coding: Determine the number of discharges where the ACT team was involved. If 95% or more of all discharges were planned jointly between the ACT team and the hospital, code the item a “5.”
O7. Time-unlimited services/Graduation rate
Definition: Program does not have arbitrary time limits for consumers admitted to the program cases but remains the point of contact for all consumers indefinitely as needed.
Rationale: Consumers often regress when they are terminated from short-term programs. Time-unlimited services encourage the development of stable, ongoing therapeutic relationships.
Sources of information:
1. ACT leader interview
n Before the fidelity visit, ask that the ACT leader compile a list of consumers who have been discharged from the program within the last 12 months. Review these discharges with the ACT leader.
n “How many of these consumers have you graduated because they no longer needed services?”
n “What percentage of ACT consumers are expected to be discharged from their team within the next 12 months?”
n “Does your team use a level or step-down system for consumers who no longer require intensive services?” [If “yes”] Probe for specifics: what criteria are used, how contact is maintained, etc.
Item response coding: Calculate percentage of consumers discharged. Include only consumers who graduated (i.e., whose need for services was reduced); omit from the count any consumers who left because they relocated or dropped out of treatment — these are counted in Item S2.
The intent of this item is to gauge the program philosophy about graduation. If all consumers are served on a time-unlimited basis, with fewer than 5% expected to graduate from the program annually, code the item as a “5.”
Nature of Services
S1. Community-based services
Definition: Program works to monitor status and develop skills in the community, rather than function as an office-based program.
Rationale: Contacts in natural settings (i.e., where consumers live, work, and interact with other people) are thought to be more effective than when they occur in hospital or office settings because skills may not transfer well to natural settings. Furthermore, more accurate assessments of consumers can occur in their community setting because the team member can directly observe rather than relying on self-report. Medication delivery, crisis intervention, and networking are more easily accomplished through home visits.
Sources of information:
1. Chart review (See During your fidelity site visit under Fidelity assessor checklist for instructions how to choose charts.)
n Calculate the ratio of community-based visits to the total number of face-to-face contacts for each of the 10 charts reviewed.
n Determine the median value (the average of the 5th and 6th numbers when all values are ranked — see chart review worksheet).
n Remember to use the most complete and up-to-date time period from the chart. Ask the ACT leader, ACT team members, or an administrative person for the most recent but complete period of documentation.
n Review internal reports and documentation, if available.
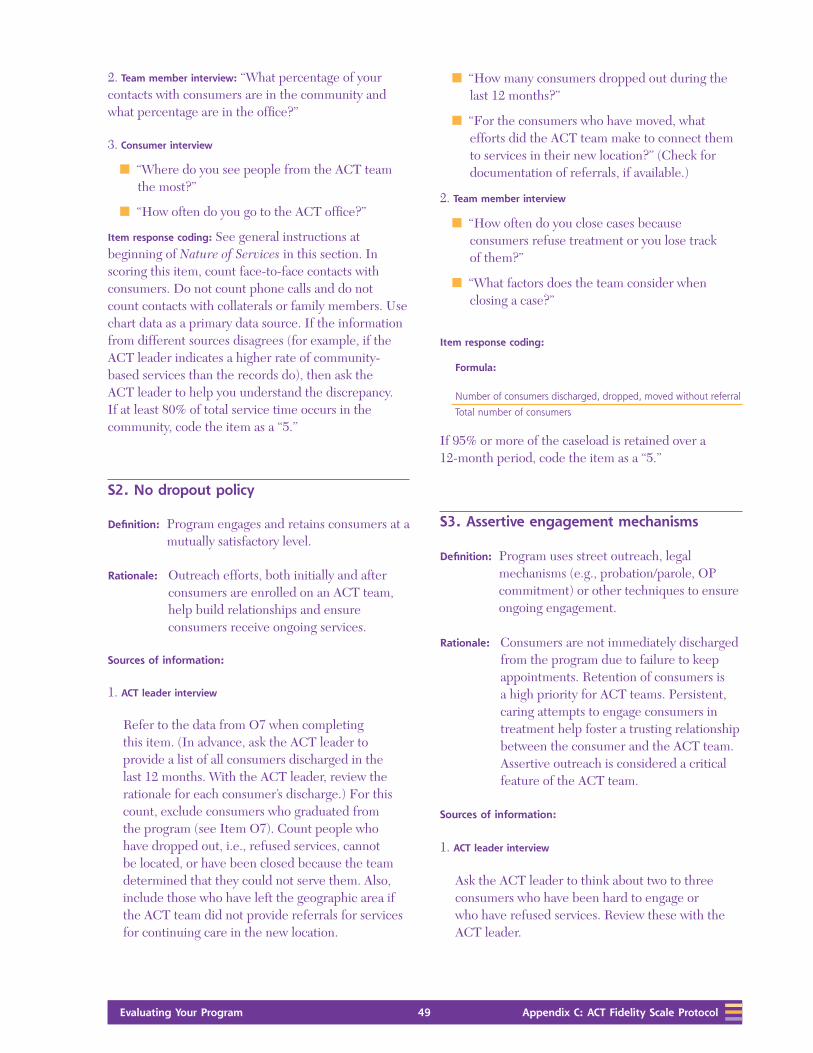
Evaluating Your Program 49 Evaluating Your Program 49 Appendix C: ACT Fidelity Scale Protocol
2. Team member interview: “What percentage of your contacts with consumers are in the community and what percentage are in the office?”
3. Consumer interview
n “Where do you see people from the ACT team the most?”
n “How often do you go to the ACT office?”
Item response coding: See general instructions at beginning of Nature of Services in this section. In scoring this item, count face-to-face contacts with consumers. Do not count phone calls and do not count contacts with collaterals or family members. Use chart data as a primary data source. If the information from different sources disagrees (for example, if the ACT leader indicates a higher rate of community-based services than the records do), then ask the ACT leader to help you understand the discrepancy. If at least 80% of total service time occurs in the community, code the item as a “5.”
S2. No dropout policy
Definition: Program engages and retains consumers at a mutually satisfactory level.
Rationale: Outreach efforts, both initially and after consumers are enrolled on an ACT team, help build relationships and ensure consumers receive ongoing services.
Sources of information:
1. ACT leader interview
Refer to the data from O7 when completing this item. (In advance, ask the ACT leader to provide a list of all consumers discharged in the last 12 months. With the ACT leader, review the rationale for each consumer’s discharge.) For this count, exclude consumers who graduated from the program (see Item O7). Count people who have dropped out, i.e., refused services, cannot be located, or have been closed because the team determined that they could not serve them. Also, include those who have left the geographic area if the ACT team did not provide referrals for services for continuing care in the new location.
n “How many consumers dropped out during the last 12 months?”
n “For the consumers who have moved, what efforts did the ACT team make to connect them to services in their new location?” (Check for documentation of referrals, if available.)
2. Team member interview
n “How often do you close cases because consumers refuse treatment or you lose track of them?”
n “What factors does the team consider when closing a case?”
Item response coding:
Formula:
Number of consumers discharged, dropped, moved without referral
Total number of consumers
If 95% or more of the caseload is retained over a 12-month period, code the item as a “5.”
S3. Assertive engagement mechanisms
Definition: Program uses street outreach, legal mechanisms (e.g., probation/parole, OP commitment) or other techniques to ensure ongoing engagement.
Rationale: Consumers are not immediately discharged from the program due to failure to keep appointments. Retention of consumers is a high priority for ACT teams. Persistent, caring attempts to engage consumers in treatment help foster a trusting relationship between the consumer and the ACT team. Assertive outreach is considered a critical feature of the ACT team.
Sources of information:
1. ACT leader interview
Ask the ACT leader to think about two to three consumers who have been hard to engage or who have refused services. Review these with the ACT leader.

50 Evaluating Your ProgramAppendix C: ACT Fidelity Scale Protocol 50 Evaluating Your Program
n “What did the team do to reach out to each of these consumers?”
n “Was there anything more you could have done to retain them in services?”
n “What methods does the team use to keep consumers involved in ACT?”
n “Which, if any, of the following methods, does the team use? Representative payee services, outpatient commitment, contacts with probation or parole officers, street and shelter outreach after a consumer is enrolled in ACT, or other mechanisms (please name).”
n “How many consumers receive each of the above services?”
2. Team member interview: “What happens if consumers say they don’t want your services?”
3. Consumer interview: “What happens if consumers say they don’t want ACT services any more?”
Item response coding: If the program demonstrates consistently well-thought-out strategies and uses street outreach and legal mechanisms whenever appropriate, code the item as a “5.”
S4. Intensity of service
Definition: High amount of face-to-face service time, as needed.
Rationale: To help consumers with serious symptoms maintain and improve their function within the community, high service intensity is often required.
Sources of information:
1. Chart review (See During your fidelity site visit under Fidelity assessor checklist for instructions how to choose charts)
n Using the same charts as used for Item S1, calculate the mean amount of service hours per consumer, per week, over a month-long period. (If applicable, the charts should proportionately represent the number of consumers who have “stepped down” in program intensity.) Include only face-to-face contacts in your tally.
n From the mean values over a 4-week period, determine the median number of service hours across the sample (average of the 5th and 6th values when the mean service hours per week are ranked — see worksheet). Remember to use the most complete and up-to-date time period from the chart.
n Ask the ACT leader, team members, or an administrative person for the most recent, but complete, period of documentation.
2. Review of management information reports, if available.
Item response coding: See general instructions at beginning of Nature of Services section. In scoring this item, count face-to-face contacts with consumers. Do not count phone calls. Do not count contacts with collaterals or family members.
Ask the ACT leader for the best data source to obtain this information, but the default is chart review, unless the ACT leader can make a case for a better source. If the median value is 2 or more hours per week, per consumer, code the item as a “5.”
S5. Frequency of contact
Definition: High amount of face-to-face service contacts, as needed.
Rationale: ACT teams are highly invested in their consumers and maintain frequent contact to provide ongoing, responsive support as needed. Frequent contacts are associated with improved consumer outcomes.
Sources of information:
1. Chart review (See During your fidelity site visit under Fidelity assessor checklist for instructions how to choose charts.)

Evaluating Your Program 51 Evaluating Your Program 51 Appendix C: ACT Fidelity Scale Protocol
n Using the same charts used for Item S1, calculate the mean number of face-to-face consumer-ACT service contacts, per week, over a month-long period.
n From the calculated mean values, determine the median number of service contacts across the sample average of the 5th and 6th values when the mean service contacts per week are ranked). Remember to use the most complete and up-to-date time period from the chart.
n Ask the ACT leader, team members, or an administrative person for the most recent but complete period of documentation.
2. Review of internal reports/documentation, if available.
3. Consumer interview: “How many times have you seen ACT team members during the past week?”
Item response coding: See general instructions at beginning of Nature of Services section. In scoring this item, count face-to-face contacts with consumers. Do not count phone calls. Do not count contacts with collaterals or family members. Ask the ACT leader for the best data source for this information, but the default is chart review, unless he or she can make a case for a better source. If the program averages four or more contacts per week, per consumer, code the item a “5.”
S6. Work with informal support system
Definition: Program provides support and skills for consumers’ informal support network (i.e., people not paid to support consumer, such as family, landlord, shelter staff, employers, or other key person).
Rationale: Developing and maintaining community support further enhances consumers’ integration and functioning.
Sources of information:
1. ACT leader interview
n Review the consumer roster with the ACT leader. Determine for how many consumers the ACT team has made at least one contact with an informal support network. Focus the discussion on this subgroup.
n “Among consumers with whom you have had at least one contact with their informal network in the last month, how frequently does the team have contact with the consumer’s informal network (in cases where there has been contact within the past month)?”
2. Review of internal reports/documentation, if available.
3. Team member interview: “On average, how often do you work with the family, landlord, employer, or other informal support network members for each consumer?”
4. Consumer interview: “How often is there contact between the ACT team and your family? Your landlord? Your employer?”
Item response coding: Use ACT leader as primary data source. Include contacts with family, landlord, and employer; exclude those who are paid to help consumers, such as Social Security Disability or Department of Human Services representatives.
Tabulate the rate for the subgroup for which the team has at least some contact. From this, calculate the rate for the entire caseload.
Example:
Suppose 100 consumers are on the team and the team has some contact with the network for 50 consumers. The average contact with this subgroup is 2 contacts a month. Therefore, the rate for the entire caseload is:
2 * 50= 1 time per month
100
If the program makes 4 or more contacts per month, per consumer, code the item as a “5.”

52 Evaluating Your ProgramAppendix C: ACT Fidelity Scale Protocol 52 Evaluating Your Program
S7. Individualized substance abuse treatment
Definition: One or more members of the team provide direct treatment and substance abuse treatment for consumers with substance-use disorders.
Rationale: Substance-use disorders often occur concurrently in consumers with serious mental illnesses; these co-occurring disorders require treatment that directly addresses them.
Sources of information:
1. ACT leader and substance abuse specialist interviews
n “How many consumers have a substance-use disorder?”
n “Of these consumers, how many received structured individual counseling for substance use from the substance abuse counselor on the team or another ACT team member this last month?” The counseling can be in the office, at the consumers’ homes, or elsewhere, but it must be more than informal queries or “nagging.”
n Ask the nature of the counseling. Ideally, the counseling should follow Integrated Treatment of Co-Occurring Disorders counseling principles (see item S9) but, for this item, the criterion is more lenient. It must relate specifically to substance use; it cannot be generic counseling.
If the person providing the counseling is not a substance abuse counselor, then you should interview the team member who provides this counseling to gauge whether it qualifies as appropriate substance abuse counseling. To count for this item, the interventions must be structured and according to consumers’ goals or treatment plan.
n “For each consumer who received substance abuse counseling in the last month, how many sessions did he or she have? How long were the sessions?”
Item response coding: The substance abuse counselor interview is the primary data source.
n Calculate the total number of sessions for the consumers who receive substance abuse treatment.
n Calculate the total number of minutes per month for each of these consumers.
n Multiply the number of sessions by the number of minutes per month.
n Divide this product by the number of consumers with substance use problems.
n Divide by 4 (weeks/month).
Example:
20 consumers with DD. 10 receive 50-minute counseling sessions every other week
(10 * 100 /20)= 12.5 minutes per week per DD consumer
4
If ACT team members provide DD counseling in the car and in the course of home visits, then code this more informal contact at level 3 if it roughly meets the time requirement. To score a 4 or 5, a more formal structure than simply counseling embedded within home visits must exist.
S8. Co-occurring disorder treatment groups
Definition: Program uses group modalities as a treatment strategy for people with substance-use disorders.
Rationale: Group treatment has been shown to positively influence recovery for consumers with dual disorders.
Sources of information:
1. ACT leader interview
n “How many of the consumers with DD (identified in S7) attended at least one treatment group in the last month?”
n “How many groups are offered?”
n “Who offers these groups?” (Do not count groups offered by organizations that are not connected to the ACT team. Only groups led by ACT team members or by team members who are integrated with the ACT team, i.e., have regular contact with the ACT team count.)
n “How many consumers attend these groups?”

Evaluating Your Program 53 Evaluating Your Program 53 Appendix C: ACT Fidelity Scale Protocol
2. Substance abuse counselor interview: Repeat same questions as above.
Item response coding: Use substance abuse counselor interview as primary source of data. If 50% or more of all consumers with substance-use disorders attend at least 1 substance abuse tr eatment group meeting during a month, code the item as a “5.”
S9. Co-occurring disorders model
Definition: Program uses a non-confrontational, stage-wise treatment model, follows behavioral principles, considers interactions between mental illness and substance abuse, and has gradual expectations of abstinence.
Rationale: The co-occurring disorders model attends to the concerns of both SMI and substance abuse for maximum opportunity for recovery and symptom management.
Sources of information:
1. ACT leader interview
n “What is the treatment model used to treat consumers with substance abuse problems?” (Probe for whether confrontation is used.)
n “Do you refer consumers to AA? What about detox programs?”
n “Do you see the goal as abstinence?”
n “How does your team view abstinence versus reduction of use?”
n “Does your team use harm reduction tactics?” [If “yes”] “What are some examples?”
n “Are you familiar with a stage-wise approach to substance-use treatment? [If “yes”] “Give some examples of how your program uses this approach.”
2. Team member (substance abuse counselor) interview:
Repeat same questions as above.
Item response coding: Use ACT leader interview as primary data source. If the program is fully based in DD treatment principles, with the team providing treatment, code the item as a “5.” A program can receive full credit for this item if it includes self-help (e.g., AA) referrals as additional support rather than in place of team-based interventions.
S10. Role of consumers on treatment team
Definition: Consumers are members of the team who provide direct services.
Rationale: Some research has concluded that including consumers as team members on case management teams improves the practice culture, making it more attuned to consumers’ perspectives.
Sources of information:
1. ACT leader interview
n “How are consumers involved as members of your team? (e.g., employed, volunteer, not at all, etc.)”
n If they are paid employees, are they full time?
n Are they considered full-fledged ACT team members? (Alternatively, are they considered aides?)
2. Team member interview: Ask similar questions as for ACT leader.
3. Consumer interview: “How are consumers involved as members of your team? (e.g., employed, volunteer, not at all, etc.)”

54 Evaluating Your ProgramAppendix C: ACT Fidelity Scale Protocol 54 Evaluating Your Program
Note for items H8–H11:
Programs do not receive credit for having specialists on staff (e.g., RN, substance abuse or vocational specialists) if the person assigned to that position is on leave at the time of the fidelity visit and has been on leave for 3 months or more.
For estimates of several of the service items (e.g., S1, S4, S5, and S6), subjective estimates from the ACT leader or case managers are usually not very helpful. Often these staff will say, “It depends.”
Written documentation is the primary source for these items. Ask the ACT leader for an opinion about the best data source to obtain this information, but the default is chart review, unless he or she can make a case for a better source.
Item response coding: This item refers to disclosed mental health consumers who have received treatment for psychiatric disorders. If consumers are employed as ACT team members with equal status as other case managers, code the item as “5.” If they work full time but at reduced responsibility, code as “4.” If part time, but providing clinical activities (e.g., co-lead a group) code as “3.” If their participation is “token” involvement on team, code as “2.” (If consumer staff does not attend or participate in treatment team meetings, for instance, this would likely be coded as a “2.”) Also code the item as “2” if the consumer works in a position such as driver or administrative assistant.

Evaluating Your Program 55 Evaluating Your Program 55 Appendix D: General Organizational Index
Appendix D: General Organizational Index and GOI Score Sheet
Evaluating Your Program

56 Evaluating Your ProgramAppendix D: General Organizational Index 56 Evaluating Your Program

Evaluating Your Program 57 Evaluating Your Program 57 Appendix D: General Organizational Index
General Organizational Index
G1. Program philosophy
Committed to clearly articulated philosophy consistent with specific evidence-based model, based on these 5 sources:
n ACT leader
n Senior staff (e.g., executive director, psychiatrist)
n Team members providing the EBP
n Consumers and families receiving EBP
n Written materials (e.g., brochures)
1
No more than 1 of 5 sources shows clear understanding of program philosophy
2
2 of 5 sources show clear understanding of program philosophy
3
3 of 5 sources show clear understanding of program philosophy
4
4 of 5 sources show clear under-standing of pro-gram philosophy
5
All 5 sources show clear understanding and commitment to program philosophy for specific EBP
OR OR OR OR
All sources have numerous major areas of discrepancy
All sources have several major areas of discrepancy
Sources mostly aligned to program philosophy, but have 1 major area of discrepancy
Sources mostly aligned to program philosophy, but have 1 or 2 minor areas of discrepancy
*G2. Eligibility/Consumer
identification
All consumers with serious mental illness in the community support program, crisis consumers, and institutionalized consumers are screened to determine whether they qualify for EBP using standardized tools or admission criteria consistent with EBP. Also, agency systematically tracks number of eligible consumers.
20% of consumers receive standardized screening and/or agency DOES NOT systematically track eligibility
21% – 40% of consumers receive standardized screening and agency systematically tracks eligibility
41% – 60% of consumers receive standardized screening and agency systematically tracks eligibility
61% – 80% of consumers receive standardized screening and agency systematically tracks eligibility
>80% of consumers receive standardized screening and agency systematically tracks eligibility
*G3. Penetration
Maximum number of eligible consumers served by EBP, as defined by the ratio:
Number of consumers receiving EBPNumber of consumers eligible for EBP
Ratio .20 Ratio .21 – .40 Ratio .41 – .60 Ratio .61 – .80 Ratio > .80
* These 2 items coded based on all consumers with serious mental illness at the site or sites where EBP is being implemented; all other items refer specifically to those receiving the EBP.
Total number of consumers in target population
Total number of consumers eligible for EBP % % eligible:
Total number of consumers receiving EBP Penetration rate

58 Evaluating Your ProgramAppendix D: General Organizational Index 58 Evaluating Your Program
1 2 3 4 5
G4. Assessment Assessments are completely absent or completely non-standardized
Pervasive deficiencies in 2 of the following:
n standar di zation
n quality of assessments
n timelinessess
n comprehen-siveness
Pervasive deficiencies in 1 of the following:
n standar di zation
n quality of assessments
n timelinessess
n comprehen-siveness
61%-80% of consumers receive standard-ized, high-quality assessments at least annually
>80% of consumers receive standardized, high-quality assessments; the information is comprehensive across all assessment domains and updated at least annually
Full standardized assessment of all consumers who receive EBP services. Assessment includes:
n history and treatment of medical, psychiatric, substance-use disorders
n current stages of all existing disorders
n vocational history
n any existing support network
n evaluation of biopsychosocial risk factors
OR
Information is deficient for 1 or 2 assessment domains
G5. Individualized treatment plan 20% of consumers EBP serves have explicit individualized treatment plan, related to EBP, updated every 3 months
21% – 40% of consumers EBP serves have explicit individualized treatment plan, related to EBP, updated every 3 months
41% – 60% of consumers EBP serves have explicit individualized treatment plan, related to EBP, updated every 3 months
61% – 80% of consumers EBP serves have explicit individualized treatment plan, related to EBP, updated every 3 months
>80% of consumers EBP serves have explicit individualized treatment plan related to EBP, updated every 3 months
For all EBP consumers, an explicit, individualized treatment plan exists related to the EBP that is consistent with assessment and updated every 3 months
OR
Individualized treatment plan updated every 6 months for all consumers
G6. Individualized treatment 20% of consumers EBP serves receive individualized services meeting goals of EBP
21% – 40% of consumers EBP serves receive individualized services meeting goals of EBP
41% – 60% of consumers EBP serves receive individualized services meeting goals of EBP
61% – 80% of consumers EBP serves receive individualized services meeting goals of EBP
>80% of consumers EBP serves receive individualized services meeting goals of EBP
All EBP consumers receive individualized treatment meeting goals of EBP
G7. Training 20% of team members receive standardized training annually
21% – 40% of team members receive standardized training annually
41% – 60% of team members receive standardized training annually
61% – 80% of team members receive standardized training annually
>80% of team members receive standardized training annually
All new team members receive standardized training in EBP (at least a 2-day workshop or equivalent) within 2 months after hiring. Existing team members receive annual refresher training (at least 1-day workshop or equivalent).
G8. Supervision 20% of team members receive supervision
21% – 40% of team members receive weekly structured consumer-centered supervision
41% – 60% of team members receive weekly structured consumer-centered supervision
61% – 80% of EBP team members receive weekly structured consumer-centered supervision
>80% of EBP team members receive structured weekly supervision, focusing on specific consumers, in sessions that explicitly address EBP model and its application
ACT team members receive structured, weekly supervision (group or individual format) from a team member experienced in particular EBP. Supervision should be consumer centered and explicitly address EBP model and its application to specific consumer situations.
OR OR OR
All EBP team members receive informal supervision
All EBP team members receive monthly supervision
All EBP team members receive supervision twice a month

Evaluating Your Program 59 Evaluating Your Program 59 Appendix D: General Organizational Index
1 2 3 4 5
G9. Process monitoring No attempt at monitoring process is made
Informal process monitoring is used at least annually
Process monitor-ing is deficient on 2 of these 3 criteria:
n comprehensive and standard-ized
n completed ev-ery 6 months
n used to guide program im-provements
Process monitoring is deficient on 1 of these 3 criteria:
n comprehensive and standardized
n completed every 6 months
n used to guide program improvements
Standardized comprehensive process monitoring occurs at least every 6 months and is used to guide program improvements
Supervisors and ACT leaders monitor process of implementing EBP every 6 months and use the data to improve program. Monitoring involves a standardized approach, e.g., using fidelity scale or other comprehensive set of process indicators.
OR
Standardized monitoring done annually only
G10. Outcome monitoring No outcome monitoring occurs
Outcome monitoring occurs at least once a year, but results are not shared with team members
Standardized outcome monitoring occurs at least once a year. Results are shared with team members
Standardized outcome monitoring occurs at least twice a year. Results are shared with team members
Standardized outcome monitoring occurs quarterly. Results are shared with EBP members
Supervisors and ACT leaders monitor outcomes for EBP consumers every 3 months and share data with EBP team members. Monitoring involves standardized approach to assessing a key outcome related to EBP, e.g., psychiatric admissions, substance abuse treatment scale, or employment rate.
G11. Quality Assurance (QA) No review or no committee
QA committee has been formed, but no reviews have been completed
Explicit QA review occurs less than annually
Explicit QA review occurs annually
Explicit review every 6 months by QA group or steering committee for EBP
Agency has QA committee or implementation steering committee with an explicit plan to review EBP or components of the program every 6 months.
OR
QA review is superficial
G12. Consumer choice about service provision
Consumer-centered services are absent (or team members make all EBP decisions)
Few sources agree that type and frequency of EBP services reflect consumer choice
Half of the sources agree that type and frequency of EBP services reflect consumer choice
Most sources agree that type and frequency of EBP services reflect consumer choice
All sources agree that type and frequency of EBP services reflect consumer choice
All consumers receiving EBP services are offered choices; EBP team members consider and abide by consumer preferences for treatment when offering and providing services. OR
Agency fully embraces consumer choice with one exception

60 Evaluating Your ProgramAppendix D: General Organizational Index 60 Evaluating Your Program
General Organizational Index Score Sheet
Date of visit: _______ / ______/ ________
Agency name: __________________________________
Assessors’ names: _______________________________ _____________________________________________
Assessor 1 Assessor 2 Consensus
G1 Program philosophy
G2 Eligibility/Consumer identification
G3 Penetration
G4 Assessment
G5 Individualized treatment plan
G6 Individualized treatment
G7 Training
G8 Supervision
G9 Process monitoring
G10 Outcome monitoring
G11 Quality Assurance (QA)
G12 Consumer choice regarding service provision
Total mean score
Evaluating Your Program 61 Evaluating Your Program 61 Appendix E: GOI Protocol
Appendix E: GOI Protocol
Evaluating Your Program

62 Evaluating Your ProgramAppendix E: GOI Protocol 62 Evaluating Your Program
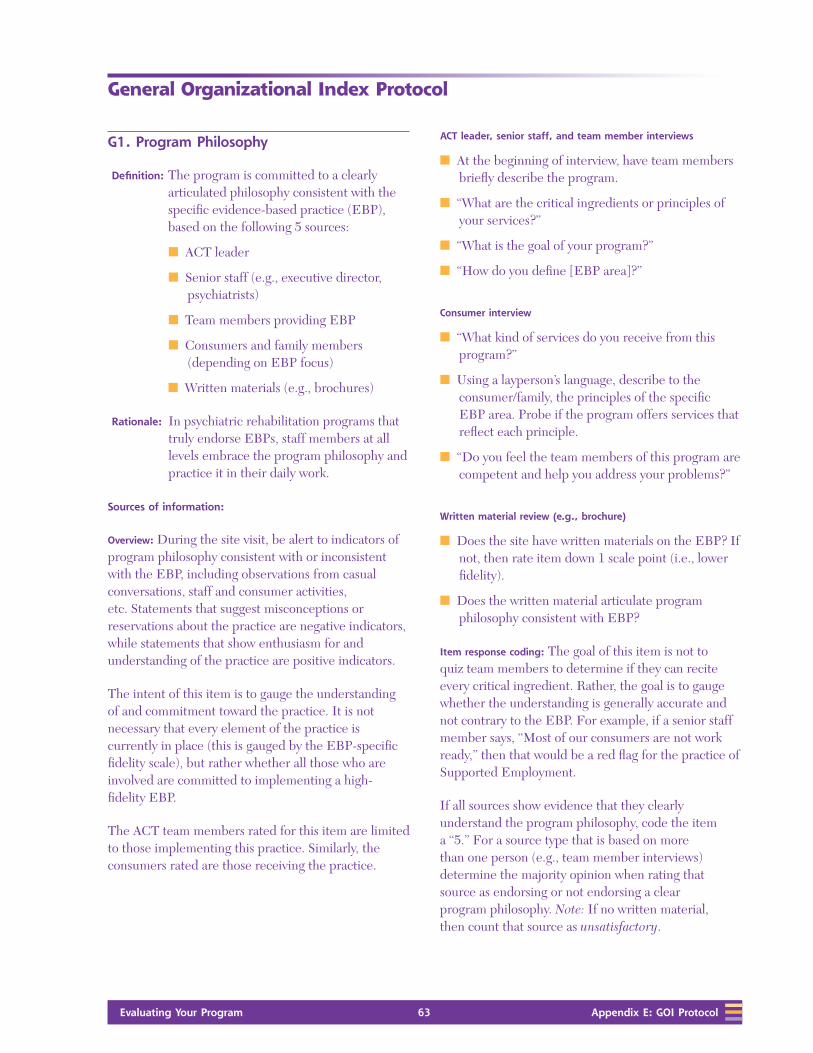
Evaluating Your Program 63 Evaluating Your Program 63 Appendix E: GOI Protocol
General Organizational Index Protocol
G1. Program Philosophy
Definition: The program is committed to a clearly articulated philosophy consistent with the specific evidence-based practice (EBP), based on the following 5 sources:
n ACT leader
n Senior staff (e.g., executive director, psychiatrists)
n Team members providing EBP
n Consumers and family members (depending on EBP focus)
n Written materials (e.g., brochures)
Rationale: In psychiatric rehabilitation programs that truly endorse EBPs, staff members at all levels embrace the program philosophy and practice it in their daily work.
Sources of information:
Overview: During the site visit, be alert to indicators of program philosophy consistent with or inconsistent with the EBP, including observations from casual conversations, staff and consumer activities, etc. Statements that suggest misconceptions or reservations about the practice are negative indicators, while statements that show enthusiasm for and understanding of the practice are positive indicators.
The intent of this item is to gauge the understanding of and commitment toward the practice. It is not necessary that every element of the practice is currently in place (this is gauged by the EBP-specific fidelity scale), but rather whether all those who are involved are committed to implementing a high- fidelity EBP.
The ACT team members rated for this item are limited to those implementing this practice. Similarly, the consumers rated are those receiving the practice.
ACT leader, senior staff, and team member interviews
n At the beginning of interview, have team members briefly describe the program.
n “What are the critical ingredients or principles of your services?”
n “What is the goal of your program?”
n “How do you define [EBP area]?”
Consumer interview
n “What kind of services do you receive from this program?”
n Using a layperson’s language, describe to the consumer/family, the principles of the specific EBP area. Probe if the program offers services that reflect each principle.
n “Do you feel the team members of this program are competent and help you address your problems?”
Written material review (e.g., brochure)
n Does the site have written materials on the EBP? If not, then rate item down 1 scale point (i.e., lower fidelity).
n Does the written material articulate program philosophy consistent with EBP?
Item response coding: The goal of this item is not to quiz team members to determine if they can recite every critical ingredient. Rather, the goal is to gauge whether the understanding is generally accurate and not contrary to the EBP. For example, if a senior staff member says, “Most of our consumers are not work ready,” then that would be a red flag for the practice of Supported Employment.
If all sources show evidence that they clearly understand the program philosophy, code the item a “5.” For a source type that is based on more than one person (e.g., team member interviews) determine the majority opinion when rating that source as endorsing or not endorsing a clear program philosophy. Note: If no written material, then count that source as unsatisfactory.

64 Evaluating Your ProgramAppendix E: GOI Protocol 64 Evaluating Your Program
Difference between a major and minor area of discrepancy
(needed to distinguish between scores of “4” and “3”): An example of a minor source of discrepancy for ACT might be larger caseload sizes (e.g., 20–1) or some brokering of services. An example of a major discrepancy would be if the team seldom made home visits or if the psychiatrist was uninvolved in the treatment team meetings.
G2. Eligibility/Consumer Identification
Definition: For EBPs implemented in a mental health
center: All consumers in the community support program, crisis consumers, and institutionalized consumers are screened using standardized tools or admission criteria that are consistent with the EBP.
For EBPs implemented in a service area: All consumers within the jurisdiction of the service area are screened using standardized tools or admission criteria that are consistent with the EBP. For example, in New York, county mental health administrations are responsible for identifying consumers who will be served by ACT programs.
The target population refers to all adults with serious mental illness (SMI) served by the provider agency or service area. If the agency serves consumers at multiple sites, then assessment is limited to the site or sites that are targeted for the EBP. If the target population is served in discrete programs (e.g., case management, residential, day treatment, etc.), then ordinarily all adults with SMI are included in this definition.
Screening will vary according to the EBP. The intent is to identify all who could benefit from the EBP. Examples from KITs in the series:
n For Integrated Treatment for Co-Occurring Disorders
and ACT, the admission criteria are specified by the EBP and specific assessment tools are recommended for each.
n For Supported Employment, all consumers are invited to receive the service because all are presumed eligible (although the program is intended for consumers at the point they express interest in working).
n For Illness Management and Recovery, screening includes assessing the skills and issues addressed by this EBP.
n For Family Psychoeducation, screening includes assessing the involvement of family members or significant others.
In every case, the program should have an explicit, systematic method for identifying the eligibility of every consumer. Screening typically occurs at program admission; for a program that is newly adopting an EBP, there should be a plan for systematically reviewing consumers who are already active in the program.
Rationale: Accurate identification of consumers who would benefit most from the EBP requires routine review for eligibility, based on criteria consistent with the EBP.
Sources of information:
ACT leader, senior staff, and team member interviews
n “Describe the eligibility criteria for your program.”
n “How are consumers referred to your program? How does the agency identify consumers who would benefit from your program? Do all new consumers receive screening for substance abuse or SMI diagnosis?”
n “What about crisis [or institutionalized] consumers?”
n Request a copy of the screening instrument used by the agency.
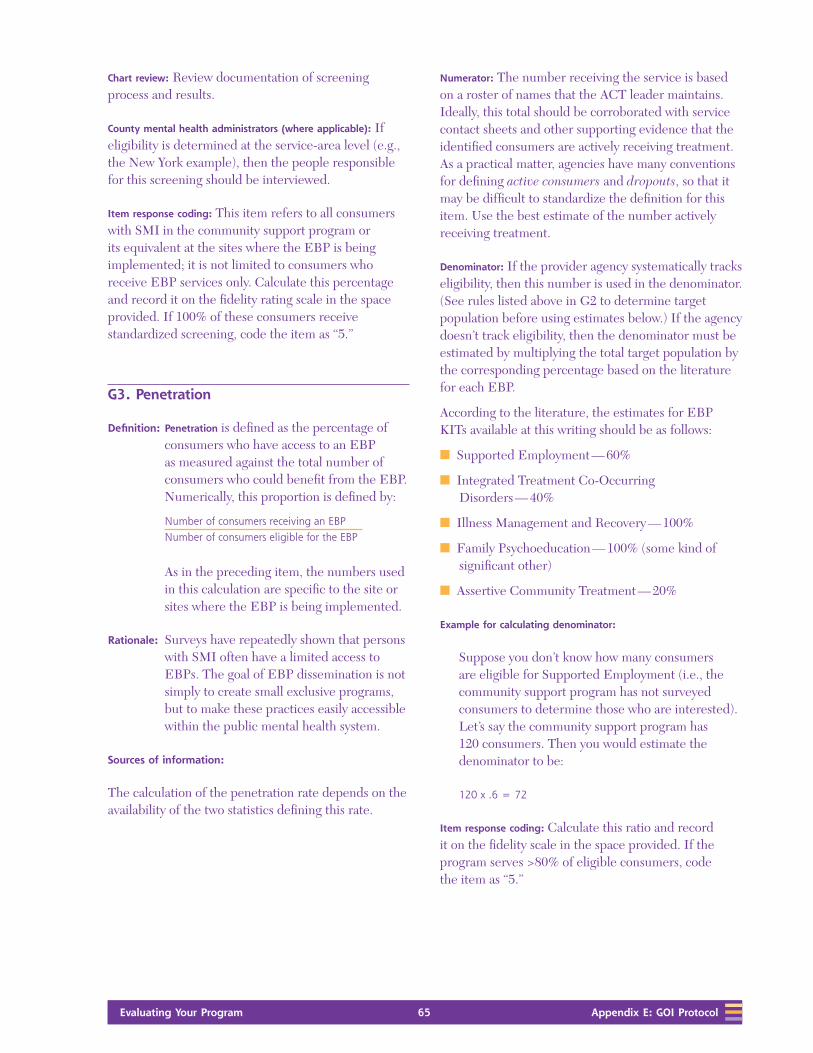
Evaluating Your Program 65 Evaluating Your Program 65 Appendix E: GOI Protocol
Chart review: Review documentation of screening process and results.
County mental health administrators (where applicable): If eligibility is determined at the service-area level (e.g., the New York example), then the people responsible for this screening should be interviewed.
Item response coding: This item refers to all consumers with SMI in the community support program or its equivalent at the sites where the EBP is being implemented; it is not limited to consumers who receive EBP services only. Calculate this percentage and record it on the fidelity rating scale in the space provided. If 100% of these consumers receive standardized screening, code the item as “5.”
G3. Penetration
Definition: Penetration is defined as the percentage of consumers who have access to an EBP as measured against the total number of consumers who could benefit from the EBP. Numerically, this proportion is defined by:
Number of consumers receiving an EBPNumber of consumers eligible for the EBP
As in the preceding item, the numbers used in this calculation are specific to the site or sites where the EBP is being implemented.
Rationale: Surveys have repeatedly shown that persons with SMI often have a limited access to EBPs. The goal of EBP dissemination is not simply to create small exclusive programs, but to make these practices easily accessible within the public mental health system.
Sources of information:
The calculation of the penetration rate depends on the availability of the two statistics defining this rate.
Numerator: The number receiving the service is based on a roster of names that the ACT leader maintains. Ideally, this total should be corroborated with service contact sheets and other supporting evidence that the identified consumers are actively receiving treatment. As a practical matter, agencies have many conventions for defining active consumers and dropouts, so that it may be difficult to standardize the definition for this item. Use the best estimate of the number actively receiving treatment.
Denominator: If the provider agency systematically tracks eligibility, then this number is used in the denominator. (See rules listed above in G2 to determine target population before using estimates below.) If the agency doesn’t track eligibility, then the denominator must be estimated by multiplying the total target population by the corresponding percentage based on the literature for each EBP.
According to the literature, the estimates for EBP KITs available at this writing should be as follows:
n Supported Employment — 60%
n Integrated Treatment Co-Occurring Disorders — 40%
n Illness Management and Recovery — 100%
n Family Psychoeducation — 100% (some kind of significant other)
n Assertive Community Treatment — 20%
Example for calculating denominator:
Suppose you don’t know how many consumers are eligible for Supported Employment (i.e., the community support program has not surveyed consumers to determine those who are interested). Let’s say the community support program has 120 consumers. Then you would estimate the denominator to be:
120 x .6 = 72
Item response coding: Calculate this ratio and record it on the fidelity scale in the space provided. If the program serves >80% of eligible consumers, code the item as “5.”

66 Evaluating Your ProgramAppendix E: GOI Protocol 66 Evaluating Your Program
G4. Assessment
Definition: All EBP consumers receive standardized, high-quality, comprehensive, and timely assessments.
Standardization refers to a reporting format that is easily interpreted and consistent across consumers.
High quality refers to assessments that provide concrete, specific information that differentiates between consumers. If most consumers are assessed using identical words or, if the assessment consists of broad, noninformative checklists, then this would be considered low quality.
Comprehensive assessments include:
n history and treatment of medical, psychiatric, and substance use disorders;
n current stages of all existing disorders;
n vocational history;
n any existing support network; and
n evaluation of biopsychosocial risk factors.
Timely assessments are those updated at least annually.
Rationale: Comprehensive assessment/re-assessment is indispensable in identifying target domains of functioning that may need intervention, in addition to the consumer’s progress toward recovery.
Sources of information:
ACT leader, senior staff, and team member interviews
n “Do you give a comprehensive assessment to new consumers? What are the components that you assess?”
n Ask for a copy of the standardized assessment form, if available, and have ACT team members go through the form.
n “How often do you re-assess consumers?”
Chart review
n Look for comprehensiveness of assessment by looking at multiple completed assessments to see if they address each component of the comprehensive assessment every time an assessment is performed.
n “Is the assessment updated at least yearly?”
Item response coding: If >80% of consumers receive standardized, high-quality, comprehensive, and timely assessments, code the item a “5.”
G5. Individualized Treatment Plan
Definition: For all EBP consumers, an explicit, individualized treatment plan exists (even if it is not called this) related to the EBP that is consistent with assessment and updated every 3 months.
Individualized means that goals, steps to reaching the goals, services/interventions, and intensity of involvement are unique to this consumer. Plans that are the same or similar across consumers are not individualized. One test is to place a treatment plan without identifying information in front of supervisors to see if they can identify the consumer.
Rationale: Core values of EBP include individualization of services and supporting consumers’ pursuit of their goals and progress in their recovery at their own pace. Therefore, treatment plans need ongoing evaluation and modification.
Sources of information:
Note: This item and the next are assessed together; i.e., follow-up questions about specific treatment plans with questions about the treatment.
Chart review (treatment plan)
n Using the same charts as examined during the EBP-specific fidelity assessment, look for documentation of specific goals and consumer-based goal-setting process.

Evaluating Your Program 67 Evaluating Your Program 67 Appendix E: GOI Protocol
n “Are the treatment recommendations consistent with assessment?”
n “What evidence is used for a quarterly review?”
ACT leader interview: “Describe the process of developing a treatment plan. What are the critical components of a typical treatment plan and how are they documented?”
Team member interview
n When feasible, use the specific charts selected above. Ask ACT team members to go over a sample treatment plan.
n “How do you come up with consumer goals?” Listen for consumer involvement and individualization of goals.
n “How often do you review (or follow up on) the treatment plan?”
Consumer interview
n “What are your goals in this program? How did you set these goals?”
n “Do you and your team members together review your progress toward achieving your goals?” [If “yes”] “How often? Please describe the review process.”
Team meeting/supervision observation, if available
n Observe how the treatment plan is developed. Listen especially for discussion of assessment, consumer preferences, and individualization of treatment.
n Do they review treatment plans?
Item response coding: If >80% of EBP consumers have an explicit individualized treatment plan that is updated every 3 months, code the item as “5.” If the treatment plan is individualized but updated only every 6 months, code the item as “3.”
G6. Individualized Treatment
Definition: All EBP consumers receive individualized treatment meeting the goals of the EBP.
Individualized treatment means that steps, strategies, services, interventions, and intensity of involvement are focused on specific consumer goals and are unique for each consumer. Progress notes are often a good source of what really goes on.
Treatment could be highly individualized, despite the presence of generic treatment plans.
An example of a low score on this item for
integrated co-occurring disorders treatment:
If a consumer in the engagement phase of recovery is assigned to a relapse prevention group and is constantly told he or she needs to quit using, rather than using motivational interventions.
An example for a low score on this item for ACT:
If the majority of progress notes are written by day treatment staff who see the consumer 3 – 4 days per week, while the ACT team only sees the consumer about once per week to issue his check.
Rationale: The key to the success of an EBP is implementing a plan that is individualized and meets the goals for the EBP for each consumer.
Sources of information:
Chart review (treatment plan): Using the same charts as examined during the EBP-specific fidelity assessment, examine the treatment provided. Limit the focus to a recent treatment plan related to the EBP. Judge whether an appropriate treatment occurred during the time frame indicated by the treatment plan.
Team member interview: When feasible, use the specific charts selected above. Ask ACT team members to go over a sample treatment plan and treatment.
Consumer interview: “Tell me about how this program or team member is helping you meet your goals.”
Item response coding: If >80% of EBP consumers receive treatment that is consistent with the goals of the EBP, code the item a “5.”
68 Evaluating Your ProgramAppendix E: GOI Protocol 68 Evaluating Your Program
G7. Training
Definition: All new ACT team members receive standardized training in the EBP (at least a 2-day workshop or its equivalent) within 2 months after they are hired. Existing ACT team members receive annual refresher training (at least a 1-day workshop or its equivalent).
Rationale: Team member training and retraining are warranted to ensure that evidence-based services are provided in a standardized manner, across ACT team members, and over time.
Sources of information:
ACT leader, senior staff, and team member interviews
n “Do you provide new ACT team members with systematic training for [EBP area]?” [If “yes,” probe for specifics: mandatory or optional, length, frequency, content, group or individual format, who trains, in-house or outside training, etc.]
n “Do ACT team members already on the team receive refresher trainings?” [If yes] Probe for specifics.
Review training curriculum and schedule, if available: Does the curriculum appropriately cover the critical ingredients for [EBP area]?
Team member interview
n “When you first started in this program, did you receive a systematic/formal training for [EBP area]?” [If “yes,” probe for specifics: mandatory or optional, length, frequency, content, group or individual format, who trained, in-house or outside training, etc.]
n “Do you receive refresher trainings?” [If “yes,” probe for specifics.]
Item response coding: If >80% of ACT team members receive at least yearly, standardized training for [EBP area], code the item as “5.”
G8. Supervision
Definition: ACT team members receive structured, weekly supervision from team members experienced in the particular EBP. The supervision can be either group or individual, but CANNOT be peers-only supervision without a supervisor. The supervision should be consumer-centered and explicitly address the EBP model and how it applies to specific consumer situations. Administrative meetings and meetings that are not specifically devoted to the EBP do not fit the criteria for this item. The consumer-specific EBP supervision should be at least 1 hour long each week.
Rationale: Regular supervision is critical not only for individualizing treatment, but also for ensuring the standardized provision of evidence-based services.
Sources of information:
ACT leader, senior staff, and team member interviews
n Probe for logistics of supervision: length, frequency, group size, etc.
n “Describe what a typical supervision session looks like.”
n “How does the supervision help your work?”
Team meeting and supervision observation, if available: Listen for discussion of [EBP area] in each case reviewed.
Supervision logs documenting frequency of meetings
Item response coding: If >80% of ACT team members receive weekly supervision, code the item as “5.”

Evaluating Your Program 69 Evaluating Your Program 69 Appendix E: GOI Protocol
G9. Process Monitoring
Definition: Supervisors and ACT leaders monitor the process of implementing the EBP every 6 months and use the data to improve the program. Process monitoring involves a standardized approach, e.g., using a fidelity scale or other comprehensive set of process indicators.
An example of a process indicator would be systematic measurement of how much time individual case managers spend in the community instead of in the office. Process indicators could include items related to training or supervision. The underlying principle is that whatever is being measured is related to implementing the EBP and is not being measured to track billing or productivity.
Rationale: Systematic and regular collection of process data is imperative in evaluating program fidelity to EBP.
Sources of information:
ACT leader, senior staff, and team member interviews
n “Does your program collect process data regularly?” [If “yes,” probe for specifics: frequency, who, how (using [EBP area] Fidelity Scale vs. other scales), etc.]
n “Does your program collect data on consumer service use and treatment attendance?”
n “Have the process data affected how your services are provided?
Review of internal reports and documentation, if available
Item response coding: If evidence exists that standardized process monitoring occurs at least every 6 months, code the item as “5.”
G10. Outcome Monitoring
Definition: Supervisors and ACT leaders monitor the outcomes of EBP consumers every 3 months and share the data with ACT team members in an effort to improve services. Outcome monitoring involves a standardized approach to assessing consumers.
Rationale: Systematic and regular collection of outcome data is imperative in evaluating program effectiveness. Effective programs also analyze such data to ascertain what is working and what is not working, and use the results to improve the quality of services they provide.
Key outcome indicators for each EBP are discussed in the EBP KITs. A provisional list is as follows:
n Supported employment — competitive employment rate
n Integrated co-occurring disorders treatment — substance use (such as the Stages of Treatment Scale)
n Illness management and recovery — hospitalization rates; relapse prevention plans; medication compliance rates
n Family psychoeducation — hospitalization and family burden
n ACT — hospitalization and housing
Sources of information:
ACT leader, senior staff, and team member interviews
n “Does your program have a systematic method for tracking outcome data?” [If “yes,” probe for specifics: how (computerized vs. chart only), frequency, type of outcome variables, who collects data, etc.]
n “Do you use any checklist or scale to monitor consumer outcome (e.g., Substance Abuse Treatment Scale)?”

70 Evaluating Your ProgramAppendix E: GOI Protocol 70 Evaluating Your Program
n “What do you do with the outcome data? Do your ACT team members review the data on a regular basis?” [If “yes,” “How is the review done (e.g., cumulative graph)?”]
n “Have the outcome data affected how your services are provided? If so, how?
Review of internal reports/documentation, if available
Item response coding: If standardized outcome monitoring occurs quarterly and results are shared with ACT team members, code the item a “5.”
G11. Quality Assurance (QA)
Definition: The agency’s QA committee has an explicit plan to review the EBP or components of the program every 6 months. The steering committee for the EBP can serve this function.
Good QA committees help the agency in important decisions, such as penetration goals, placement of the EBP within the agency, and hiring and staffing needs. QA committees also help guide and sustain the implementation by:
n reviewing fidelity to the EBP model,
n making recommendations for improvement,
n advocating and promoting the EBP within the agency and in the community, and
n deciding on and keeping track of key outcomes relevant to the EBP.
Rationale: Research has shown that programs that most successfully implement EBPs have better outcomes. Again, systematically and regularly collecting process and outcome data is imperative in evaluating program effectiveness.
Sources of information:
ACT leader interview: “Does your agency have an established team or committee that is in charge of reviewing the components of your [EBP area] program?” [If “yes,” probe for specifics: who, how, when, etc.]
QA committee member interview
n “Please describe the tasks and responsibilities of the QA committee.” Probe for specifics: purpose, who, how, when, etc.
n “How do you use your reviews to improve the program’s services?”
Item response coding: If the agency has an established QA group or steering committee that reviews the EBP or components of the program every 6 months, code the item as “5.”
G12. Consumer Choice About Service Provision
Definition: All consumers who receive EBP services are offered a reasonable range of choices consistent with the EBP; ACT team members consider and abide by consumer preferences for treatment when they offer and provide services.
Choice is defined narrowly in this item to refer to services provided. This item does not address broader issues of consumer choice, such as choosing to engage in self-destructive behaviors.

Evaluating Your Program 71 Evaluating Your Program 71 Appendix E: GOI Protocol
To score high on this item, it is not sufficient that a program offers choices. The choices must be consonant with EBP. So, for example, a program implementing Supported Employment would score low if the only employment choices it offered were sheltered workshops. A reasonable range of choices means that ACT team members offer realistic options to consumers rather than prescribing only one or a couple of choices or dictating a fixed sequence or prescribing conditions that a consumer must complete before becoming eligible for a service.
Sample of relevant choices by EBPs current at this writing
Supported Employment
n Type of occupation
n Type of work setting
n Schedules of work and number of hours
n Whether to disclose
n Nature of accommodations
n Type and frequency of follow-up supports
Integrated Co-occurring disorders Treatment
n Group or individual interventions
n Frequency of DD treatment
n Specific self-management goals
Family Psychoeducation
n Consumer readiness for involving family
n Who to involve
n Choice of problems and issues to work on
Illness Management and Recovery
n Selection of significant others to be involved
n Specific self-management goals
n Nature of behavioral tailoring
n Skills to be taught
Assertive Community Treatment
n Type and location of housing
n Nature of health promotion
n Nature of assistance with financial management
n Specific goals
n Daily living skills to be taught
n Nature of medication support
n Nature of substance abuse treatment
Rationale: A major premise of EBP is that consumers are capable of playing a vital role in managing their illnesses and in making progress towards achieving their goals. Providers accept the responsibility for getting information to consumers so that they can more effectively participate in treatment.
Sources of information:
ACT leader interview
n “Tell us what your program philosophy is about consumer choice. How do you incorporate consumers’ preferences into the services you provide?”
n “What options exist for your services? Give examples.”
Team member interview
n “What do you do when a disagreement occurs between what you think is the best treatment for a consumer and what he or she wants?”
n “Describe a time when you were unable to abide by a consumer’s preferences.”

72 Evaluating Your ProgramAppendix E: GOI Protocol 72 Evaluating Your Program
Consumer interview: “Does the program give you options for the services you receive? Are you receiving the services you want?”
Team meeting/supervision observation: Look for discussion of service options and consumer preferences.
Chart review (especially treatment plan): Look for documentation of consumer preferences and choices.
Item response coding: If all sources that support that type and frequency of EBP services always reflect consumer choice, code the item as “5.” If the agency embraces consumer choice fully, except in 1 area (e.g., requiring the agency to assume representative payeeships for all consumers), then code the item as “4.”
Note: Ratings for both scales are based on current behavior and activities, not planned or intended behavior. For example, to get full credit for Item O4 (responsibility for crisis services), it is not enough that the program is currently developing an on-call plan.
The standards used for establishing the anchors for the fully implemented ratings were determined through a variety of expert sources as well as empirical research.
Evaluating Your Program 73 Evaluating Your Program 73 Appendix F: Outcomes Report Form
Appendix F: Outcomes Report Form
Evaluating Your Program

74 Evaluating Your ProgramAppendix F: Outcomes Report Form 74 Evaluating Your Program

Evaluating Your Program 75 Evaluating Your Program 75 Appendix F: Outcomes Report Form
Outcomes Report Form
Quarter o January, February, March Year ________ o April, May, June
o July, August, September
o October, November, December
Reported by _______________________________
Agency _______________________________ Team ������������������������������������������������������������������
About the consumer
Consumer ID _____________________________ Discharge date ����/����/���� Date of birth ����/����/����
o Male Ethnicity �����������������������������������������������
o Female Primary diagnosis ���������������������������������������
What was the consumer’s evidence-based service status on the last day of the quarter?
Unknown Not Eligible Eligible Enrolled
Integrated Treatment for Co-Occurring Disorders o o o o
Supported Employment o o o o
Assertive Community Treatment o o o o
Illness Management and Recovery o o o o
Family Psychoeducation o o o o
In the past 3 months, how often has the consumer… Number of daysNumber of
incidents
Been homeless?
Been incarcerated?
Been in a State psychiatric hospital?
Been in a private psychiatric hospital?
Been hospitalized for substance abuse reasons?

76 Evaluating Your ProgramAppendix F: Outcomes Report Form 76 Evaluating Your Program
In the past 3 months, how many days was the consumer
competitively employed? (Use 0 if the consumer has not been
competitively employed.)
______ Days
Was the consumer competitively employed on the last day
of the reporting period?
o Yes
o No
What was the consumer’s stage of substance abuse
treatment on the last day of the quarter? Check one.
o Not applicable
o Pre-engagement
o Engagement
o Early persuasion
o Late persuasion
o Early active treatment
o Late active treatment
o Relapse prevention
o In remission or recovery
What was the consumer’s living arrangement on the last
day of the quarter? Check one.
o Not applicable
o Psychiatric hospital
o Substance abuse hospitalization
o General hospital psychiatric ward
o Nursing home or IC-MH
o Family care home
o Living with relatives (heavily dependent for personal care)
o Group home
o Boarding house
o Supervised apartment program
o Living with relatives (but largely independent)
o Living independently
o Homeless
o Emergency shelter
o Other (specify) __________________________________________ __________________________________________
What was the consumer’s educational status on the last day
of the quarter? Check one.
o Not applicable
o No educational participation
o Avocational/Educational involvement
o Pre-educational explorations
o Working on GED
o Working on English as Second Language
o Basic educational skills
o Attending vocational school, vocational program (CNA training), apprenticeship, or high school
o Attending college: 1-6 hours
o Attending college: 7 or more hours
o Other (specify) __________________________________________
What is the consumer’s highest level of education? Check one.
o No high school
o High school diploma or GED
o Some college
o Associates degree
o Vocational training certificate
o Bachelor of Arts or Bachelor of Science
o Masters degree or Ph.D.

Evaluating Your Program 77 Evaluating Your Program 77 Appendix G: Instructions for ORF
Appendix G: Instructions for the Outcomes Report Form
Evaluating Your Program

78 Evaluating Your ProgramAppendix G: Instructions for ORF 78 Evaluating Your Program

Evaluating Your Program 79 Evaluating Your Program 79 Appendix G: Instructions for ORF
Instructions for the Outcomes Report Form
Before you fill out the Outcomes Report Form, become familiar with the definitions of the data elements to provide consistency among reporters.
General data
Quarter: Check the time frame for the reporting period.
Year: Fill in the current year.
Reported by: Fill in the name and title of the person who
completed the form.
Agency: Identify the agency name.
Team: Write the team name or number.
About the consumer
Consumer ID: Write the consumer ID that is used at your
agency, usually a name or an identifying number.
This information will be accessible only to the
agency providing the service.
Discharge date: If the consumer has been discharged during this
report period, fill in the discharge date.
Date of birth: Fill in the consumer’s date of birth (example:
09/22/1950).
Gender: Check the appropriate box.
Ethnicity: Fill in the consumer’s ethnicity.
Primary Write the DSM diagnosis.
diagnosis:
Evidence-Based service status
What was the consumer’s evidence-based service status on
the last day of the quarter? Check the appropriate boxes according to these definitions:
Eligible: Does the consumer meet the participation
criteria for a specific EBP? Each EBP has criteria
for program participation that should be used to
determine eligibility.
Enrolled: Is the consumer participating in a particular EBP
service or has the consumer participated in the
EBP in the past period? Note: Aggregate data
about eligibility and enrollment can be used to
determine the percent of eligible consumers who
received services.
Incident reporting
For the following outcomes, record the number of days
and number of incidents that the consumer spent in each
category during the reporting period.
Categories:
Been Record the number of days that the consumer
homeless: was homeless and how many times the consumer
was homeless during the reporting period.
Homeless refers to consumers who lack a fixed,
regular, and adequate nighttime residence.
Been Record the number of days and incidents that the
incarcerated: consumer spent incarcerated in jails or in other
criminal justice lock-ups.
Been in a Record the number of days and incidents
State psychiatric that the consumer spent hospitalized primarily
hospital: for treatment of psychiatric disorders in a State
psychiatric hospital.

80 Evaluating Your ProgramAppendix G: Instructions for ORF 80 Evaluating Your Program
Been in a Record the number of days and incidents that the
private consumer spent hospitalized primarily for
psychiatric treatment of psychiatric disorders in a private
hospital psychiatric hospital.
Been Record the number of days and incidents that the
hospitalized consumer spent hospitalized primarily for
for substance treatment of substance-use disorders, including
abuse both public and private hospitals whose primary
reasons: function is treating substance-use disorders.
Competitive employment
In the past 3 months, how many days was the consumer
competitively employed? Competitive employment means working in a paid position (almost always outside the mental health center) that would be open to all community members to apply. Competitive employment excludes consumers working in sheltered workshops, transitional employment positions, or volunteering. It may include consumers who are self-employed but only if the consumer works regularly and is paid for the work.
Stage of substance abuse treatment
What was the consumer’s stage of substance abuse
treatment on the last day of the quarter? Record the consumer’s stage of substance abuse recovery, according to the following nine categories:
n Not Applicable: No history of substance abuse disorder.
n Pre-engagement: No contacts with a case manager, mental health counselor, or substance abuse counselor.
n Engagement: The consumer has had contact with an assigned case manager or counselor, but does not have regular contacts. The lack of regular contact implies lack of a working alliance.
n Early persuasion: The consumer has regular contacts with a case manager or counselor, but has not reduced substance use for more than a month. Regular contacts imply having a working alliance and a relationship in which substance abuse can be discussed.
n Late persuasion: The consumer is engaged in a relationship with a case manager or counselor, is discussing substance use or attending a group, and shows evidence of reducing use for at least 1 month (fewer drugs, smaller quantities, or both). External controls (e.g., Antabuse) may be involved in reduction.
n Early active treatment: The consumer is engaged in treatment, is discussing substance use or attending a group, has reduced use for at least 1 month, and is working toward abstinence (or controlled use without associated problems) as a goal, even though he or she may still be abusing.
n Late active treatment: The consumer is engaged in treatment, has acknowledged that substance abuse is a problem, and has achieved abstinence (or controlled use without associated problems) but for less than 6 months.
n Relapse prevention: The consumer is engaged in treatment, has acknowledged that substance abuse is a problem, and has achieved abstinence (or controlled use without associated problems) for at least 6 months. Occasional lapses, not days of problematic use, are allowed.
n In remission or recovery: The consumer has had no problems related to substance use for more than 1 year and is no longer in any type of substance abuse treatment.

Evaluating Your Program 81 Evaluating Your Program 81 Appendix G: Instructions for ORF
Living arrangement
What was the consumer’s living arrangement on the last
day of the quarter? These data give your agency an ongoing record of the consumer’s residential status.
n Not applicable or unknown
n Psychiatric hospital: Those hospitals, both public and private, whose primary function is treating mental disorders. This includes State hospitals and other freestanding psychiatric hospitals.
n Substance-use hospitalization: Those hospitals, both public and private, whose primary function is treating substance-use disorders.
n General hospital psychiatric ward: Psychiatric wards located in general medical centers that provide short-term, acute crisis care.
n Nursing home or IC-MH. Facilities that are responsible for the medical and physical care of consumers and have been licensed as such by the State.
n Family care home: This category is for situations in which consumers live in single-family dwellings with non-relatives who provide substantial care. Substantial care is determined by the degree to which non-relatives are responsible for the daily care of consumers. Such things as medication management, transportation, cooking, cleaning, restrictions on leaving the home, and money management are considered. Non-relatives may have guardianship responsibilities. If consumers are unable to do most daily living tasks without the aid of caretakers, consider caretakers to be providing substantial care.
n Lives with relatives (heavily dependent for personal
care): Here consult consumers and relatives about how much family members are responsible for the daily care of consumers. An important distinction between this status and supervised apartment program is to ask, “If the family were not involved, would the consumer be living in a more restrictive setting?” In assessing the extent to which family members provide substantial care, consider such things as taking medication, using transportation, cooking, cleaning, having control of leaving the home, and managing money. If consumers are unable to independently perform most daily living functions, consider family members to be providing substantial care.
n Group home: A group home is a residence that is run by staff who provide many functions (shopping, meal preparation, laundry, etc.) that are essential to living independently.
n Boarding house: A boarding home is a facility that provides a place to sleep and meals, but it is not seen as an extension of a mental health agency nor is it staffed with mental health personnel. These facilities are largely privately run and consumers have a high degree of autonomy.
n Supervised apartment program: Consumers live (fairly independently) in an apartment sponsored by a mental health agency. In determining whether someone fits this category, look at the extent to which mental health staff have control over key aspects of the living arrangements. Example characteristics of control include:
n The mental health agency signs the lease.
n The mental health agency has keys to the house or apartment.
n Mental health agency staff provides onsite day or evening coverage.
n The mental health agency mandates that consumers participate in certain mental health services — medication clinic, day program, etc., to live in the house or apartment.

82 Evaluating Your ProgramAppendix G: Instructions for ORF 82 Evaluating Your Program
Note: Consumers who receive only case management support or financial aid are NOT included in this category; they are considered to be living independently.
n Lives with relatives (but is largely independent): An assignment to this category requires having information from consumers and families. The key consideration relates to the degree to which consumers can perform most tasks essential to daily living without being supervised by family members.
n Living independently: Consumers who live independently and are capable of self-care, including those who live independently with case management support. This category also includes consumers who are largely independent and choose to live with others for reasons unrelated to mental illness. They may live with friends, a spouse, or other family members. The reasons for shared housing could include personal choice related to culture or financial considerations.
n Homeless: Consumers who lack a fixed, regular, and adequate nighttime residence.
n Emergency shelter: Temporary arrangements due to a crisis or misfortune that are not specifically related to a recurrence of the consumer’s illness. While many emergency shelters provide emotional support, the need for emergency shelter is due to an immediate crisis unrelated to the consumer’s mental illness.
n Other: Those who complete the form should clearly define this status in the space provided.
Educational status
What was the consumer’s educational status on the last day
of the quarter? These data provide your agency with an ongoing record of the consumer’s educational status.
n Not applicable
n No educational participation: Consumer is not participating in educational activities.
n Avocational/educational involvement:
These are organized classes in which consumers enroll consistently and expect to take part for the purpose of life enrichment, hobbies, recreation, etc. These classes must be community-based, not run by the mental health center. Classes are those in which anyone could participate, not just consumers. If any of these activities involve college enrollment, use the categories below.
n Pre-educational explorations: Consumers in this status are engaged in educational activities with the specific purpose of working toward an educational goal. This includes consumers who attend a college orientation class with the goal of enrolling, meet with the financial aid office to apply for scholarships, or apply for admission to enroll. This status also includes consumers who attend a mental health center-sponsored activity focusing on an educational goal (e.g., campus visits with a case manager to survey the location of classrooms; meetings with the case manager and college staff to secure entitlements).
n Working on GED: Consumers who are taking classes to obtain their GED.
n Working on English as Second Language:
Consumers who are taking classes in English as a Second Language in a community setting.
n Basic educational skills: Consumers who are taking adult educational classes focused on basic skills, such as math and reading.

Evaluating Your Program 83 Evaluating Your Program 83 Appendix G: Instructions for ORF
n Attending vocational school or apprenticeship,
vocational program (CAN training), or attending
high school: Consumers who are:
n participating in community-based vocational schools;
n learning skills through an apprenticeship, internship, or in a practicum setting;
n involved in on-the-job training to acquire more advanced skills;
n participating in correspondence courses which lead to job certification; and
n young adults attending high school.
n Attending college: 1–6 hours. Consumers who attend college for 6 hours or less per term. This status continues over breaks, etc., if consumers plan to continue enrollment. This status suggests that consumers regularly attend college and includes correspondence, TV, or video courses for college credit.
n Attending college: 7 or more hours. Consumers who attend college for more than 7 hours per term. This status continues over breaks, etc., if consumers plan to continue enrollment.
Regular attendance with expectations of completing course work is essential for assignment to this status.
n Other: Those who complete the form should clearly define this status in the space provided.

84 Evaluating Your ProgramAppendix G: Instructions for ORF 84 Evaluating Your Program

Evaluating Your Program 85 Evaluating Your Program 85 Appendix H: Assessor Training
Appendix H: Assessor Training and Work Performance Checklist
Evaluating Your Program

86 Evaluating Your ProgramAppendix H: Assessor Training 86 Evaluating Your Program

Evaluating Your Program 87 Evaluating Your Program 87 Appendix H: Assessor Training
Assessor Training and Work Performance Checklist
Assessment date ����/����/����
Assessor’s name ������������������������������������������������������������ ���������������������� First Middle Initial Last Title
Agency visited ������������������������������������������������������������
Agency address �������������������������������������������������������������������������������������������������� Street
�������������������������������������������������������������������������������������������������� City State ZIP code
EBP assessed ��������������������������������������������������������������������������������������������������
Assessor qualifications
Yes
o 1a. Data collection and skills: Assessor’s skills are evidenced by his or her prior work experience, credentials, or supervisor’s observations.
o 1b. EBP knowledge: Assessor’s knowledge is evidenced by his or her prior work experience, credentials, or passing a knowledge test on a specific EBP.
o 1c. Training: Assessors receive at least 8 hours of systematic training on chart review, interviewing techniques, and process assessment.
o 1d. Shadowing: Assessors complete at least 1 assessment with an experienced assessor before the first official process assessment.
o 1e. Practice rating: Assessors co-rate as practice before being official assessors and agree exactly with an experienced assessor on ratings for at least 80% of items.
____/5 Subtotal

88 Evaluating Your ProgramAppendix H: Assessor Training 88 Evaluating Your Program
Data Collection
o 2a. Contact and scheduling: With contact person, assessors identify a date convenient to site, explain purpose of the assessment, identify information to be assembled ahead of time, and develop specific schedule of interviews and assessment activities.
o 2b. Number of assessors: 2 or more assessors are present during the assessment visit and independently rate all items. If agency is working with a consultant, assessor may join with consultant to conduct assessments.
o 2c. Time management: Sufficient time is allotted and all necessary materials reviewed (2 days for 2 assessors).
o 2d. Interviewing: Interview all the sources stipulated in the protocol (e.g., for IMR, interviews with the program director, 3 ACT team members, and 3 consumers).
o 2e. Completion of documents: Complete score sheet, cover sheet, and any other supplemental documents relating to the agency.
o 2f. Documentation supporting rating: Each assessor provides written documentation for evidence supporting the rating for each item (e.g., marginal notes).
o 2g. Chart selection and documentation: Chart selection follows guidelines provided in the protocol (e.g., randomized, appropriate type and number of charts). Assessors note discrepancies (e.g., chart unavailability).
o 2h. Chart review: Both assessors review all charts and rate them independently.
o 2i. Resolution of discrepancies: When a discrepancy exists between sources (e.g., charts and ACT team members), assessors make follow-up probes with an appropriate informant (typically the ACT leader or relevant staff members).
o 2j. Independent ratings: No later than 1 day after the assessment, assessors independently complete scales before discussing ratings.
____/10 Subtotal
Post-assessment visit
o 3a. Timely consensus: Within 5 working days after the assessment, assessors discuss their ratings to determine consensus ratings, identifying any follow-up information needed. A third assessor (e.g., supervisor) may be consulted to resolve difficult ratings.
o 3b. Inter-rater reliability: Raters agree exactly on ratings for at least 80% of the items. Sources of unreliability are discussed with supervisor and strategies developed to reduce future unreliability.
o 3c. Follow-up on missing data: If follow-up calls are needed to complete an item, information obtained within 3 working days.
____/3 Subtotal

Evaluating Your Program 89 Evaluating Your Program 89 Appendix H: Assessor Training
Comprehensive report writing
o 4a. Documentation of background information:
n List recipients of report in the header (usually the agency director and ACT leader; add others by mutual agreement).
n Summarize time, place, and method.
n Provide background about scale.
o 4b. Site and normative fidelity data: Provide a table with item-level (consensus) scores, along with normative data (if available). Normative data include both national and State norms. In this table, provide comparative site data from prior assessments. On second and later assessments, provide a graph of global fidelity ratings over time for the site (trend line).
o 4c. Quantitative summary: Provide narrative summary of quantitative data. List strengths and weaknesses.
o 4d. Score interpretations:
n Interpret overall score.
n Include other pertinent observations.
n Provide overall summary.
n Provide opportunity for site to comment and clarify.
o 4e. Report editing: If agency is working with a consultant, consultant may write report. Assessor and supervisor review draft of the report before it is submitted to the agency.
____/5 Subtotal
Report submission and follow-up
o 5a. Timely report: Report sent to agency director within 2 weeks of visit.
o 5b. Follow-up on report: If agency is working with a consultant, consultant discusses report with designated agency staff within 1 month of assessment.
____/2 Subtotal
Quality control
o 6. Quality control: Supervisor reviews assessments and gives feedback, as necessary, to assessors. Depending on skill level of assessors, supervisor periodically accompanies assessors on assessment for quality assurance purposes.
____/1 Subtotal
____/27 Total — Add the subtotals.

90 Evaluating Your ProgramAppendix H: Assessor Training 90 Evaluating Your Program


DHHS Publication No. SMA-08-4344Printed 2008
21769.0708.7765020404