Embed Size (px)
Citation preview
Evaluating Wind-Following and Ecosystem Services for
Hydroelectric Dams in PJM
Alisha Fernandez
Leone Family Department of Energy and Mineral Engineering
The Pennsylvania State University
Entry for Dennis J. O‟Brien USAEE/IAEE Best Student Paper Award, July 6, 2011
Keywords: Hydroelectric dam, wind generation, energy policy, ancillary services, drought
ABSTRACT
Hydropower can provide inexpensive, flexible fill-in power to compensate for intermittent
renewable generation. Policies for hydropower dams maintain multiple services beyond electric
generation, including environmental protection, flood control and recreation. We model the
decision of a hydroelectric generator to shift some of its power production capacity away from
the day-ahead energy market into a “wind-following” service that smoothes the intermittent
production of wind turbines. Offering such a service imposes both private and social opportunity
costs. Since fluctuations in wind energy output are not perfectly correlated with day-ahead
energy prices, a wind-following service will necessarily affect generator revenues. Seasonal
wind patterns produce conflicts with the goal of managing rivers for “ecosystem services” – the
maintenance or enhancement of downstream ecosystems. We illustrate our decision model using
the Kerr Dam in Pennsylvania-New Jersey-Maryland Interconnection‟s (PJM) territory in North
Carolina. We simulate the operation of Kerr Dam over a three-year period that features
hydrologic variability from normal water years to extreme drought conditions. We use an
optimization framework to estimate reservation prices for Kerr Dam offering wind-following
services in the PJM market. Wind-following may be profitable for Kerr Dam at low capacity
levels during some time periods if ecosystems services are neglected and if side payments, or
reserves-type payments, are provided. Wind-following with ecosystem services yields revenue
losses that typically cannot be recovered with reserves market payments. Water release patterns
are inconsistent with ecosystem-services goals when Kerr Dam dedicates significant capacity to
wind-following, particularly in drought years.
2
1. Introduction
As part of a regulatory push to increase the use of renewable resources in electricity
generation and to reduce the environmental footprint associated with electric power generation,
policies that subsidize or provide incentives for renewable energy investment have become
prominent in the state and federal regulatory environment within the United States. The U.S.
federal government, for example, provides subsidies in the form of production tax credits and
loan guarantees. Individual states have implemented so-called “Renewable Portfolio Standards”
(RPS), which set specific targets for investment in renewable or alternative generation sources.
An RPS involves a policy at the state level that requires a specific amount of generation from
renewable generators by a set timeframe.1 Production of electricity from renewable resources
generates Renewable Energy Credits (RECs), which can be sold in over-the-counter markets or
can be used directly by utilities to meet RPS requirements. The economic impacts of RPS have
been the subject of a number of studies (see, for example, Dobesova et al., 2005; Apt et al., 2007;
Fischer, 2010; Blumsack and Xu, 2011), and have remained one of the principal policy drivers
for renewable electricity generation in the U.S.
Wind generation is the predominant renewable electricity generation technology (aside from
hydroelectricity) in the U.S. today. The generation of electricity from wind turbines produces
minimal emissions of any kind, but requires a controllable and responsive service that fills in
supply during periods of low wind-energy production in order to maintain reliability and
dynamic stability on the transmission network. Our focus in this paper is on the use of
hydroelectricity (not pumped-storage hydro, as in Garcia-Gonzalez et al., 2008) to provide this
1 The majority of U.S. states currently have renewable energy mandates or “goals” (non-binding
penetration targets) in place. See
http://apps1.eere.energy.gov/states/maps/renewable_portfolio_states.cfm

3
balancing service; specifically on the decision by hydroelectric generators to shift capacity from
a pre-scheduled “energy” service to a service that is responsive to wind energy fluctuations.
Using hydropower to balance short-term fluctuations in supply and demand (so-called “load
following”) is not a new idea. With some exceptions for very large hydro facilities, many hydro
generators behave as load-followers, adjusting output in response to changes in electricity
demand (Denholm et al., 2004; Sioshansi et al., 2009; Sioshansi, 2011; Kern et al., 2011). Our
model explores a market scenario where a hydro generator provides fill-in power based on wind
generation fluctuations instead of load fluctuations. We refer to this operational practice as “wind
following.”
Operationally, we model a hydroelectric dam that chooses to provide fill-in power based on
the variable output of a collection of wind turbines and offering energy through a day-ahead
scheduling market. The coupled wind farm and hydroelectric dam would thus be fully
dispatchable by the system operator and able to participate in day-ahead markets, as in Anderson
and Cardell (2008).2 Our specific case study is to model revenue-maximizing decision making
for a hydroelectric dam in the Southeastern U.S. selling hydro supplies in the Pennsylvania-New
Jersey-Maryland Interconnection (PJM) electricity market. The hydro dam operator can choose
to allocate capacity between the PJM day-ahead energy market and a wind-following service that
is responsive to changes in wind energy output. We model the dam‟s decision-making process
and annual revenues using historical data from wet to severe drought years.
We find that the utilization of hydroelectricity to provide such a wind-following service
would necessarily impose opportunity costs on the owner of the hydroelectric dam since
fluctuations in wind energy are anti-correlated with fluctuations in electricity demand. We
2 The coupled wind/hydro installation could be ramped-up by the system operator by increasing hydro
production during intervals of low wind. The coupled installation could be ramped-down by reducing
hydro output or by spilling wind energy.

4
provide a decision framework with which to assess these opportunity costs, and we find that
these opportunity costs are typically lower than the payments that system operators would need
to make to facilitate large-scale wind energy integration by utilizing existing ancillary services
markets. Only during periods of hydrologic drought do our estimated opportunity costs exceed
ancillary services payments if other potentially conflicting water demands are neglected.
However, if the dam is asked to satisfy downstream river-flow requirements to support
downstream ecosystem quality in addition to the wind-following services policy option (Richer,
et al., 1996; Suen and Eheart, 2006; Whisnant et al., 2009; Kern et al., 2011), we find strong
conflicts between the policy goals of providing wind-following services and providing services
to support the health of vulnerable ecosystems. The reservation price required to induce entry
into a wind-following market by hydroelectric generators is highly sensitive to the regulatory
regime in which the dam is assumed to operate.
Our results suggest that regulatory adjustments would be necessary to induce generators to
provide wind-following services, whether as ancillary services or in the form of an energy fill-in
product coupled with a specific wind site or collection of sites. Either construct would
necessitate that market prices and payments to suppliers be based on opportunity cost, rather than
incremental accounting costs. We find that current ancillary services prices would be
compensatory for generators offering wind-following services, but the system costs of large-
scale wind integration may be lower if wind generators were required to offer an energy product
coupled with a dispatchable resource. We hypothesize that such a policy would also facilitate the
inclusion of wind and other renewables into regional system planning processes, although this
area is left as a topic for future research. Our results are based on the simulated operation of a
hydroelectric dam (since we are also concerned with policy conflicts between energy production
5
and other river management policy objectives) but are qualitatively generalizable to other
potential technologies used to back-up wind energy production.
2. The decision to offer fill-in energy for wind farms
A hydroelectric operator participating in a centralized electricity market faces the decision of
when to sell electricity into the market (thus passing water from the reservoir through the
turbine) and what type of product to sell to the market. Generators selling into centralized
markets can offer various combinations of energy, capacity and ancillary services such as
regulation and operating reserves. The provision of ancillary services generally imposes an
operational efficiency penalty on the generator since the generator heat rate varies with the level
and time derivative of output (for an example, see Katzenstein and Apt, 2009). Hydroelectric
facilities are particularly advantageous for providing ancillary services due to their fast ramping
rates and low efficiency penalty.
Our focus in this paper is on the decision to offer energy through a day-ahead scheduling
market versus offering a wind-following product that provides the market with ramp-up and
ramp-down services in response to fluctuations in wind energy output. The basic profit-
maximization problem for a hydroelectric generator offering energy services during a period (t =
0,…,T) is taken from Horsley and Wrobel (1999) and Perekhodtsev (2003):
(1) ∏ ∑
subject to the following constraints 2-4:
(2)

6
(3)
(4)
In the maximization problem, yt is the energy output at time t, sold into the market at price pt.
The marginal costs of producing hydroelectricity are low, so these are neglected in the problem
formulation. The variable st is the level of the reservoir behind the dam, which must be kept
within the bounds (smin, smax). The hydro operator must adjust flows through the dam to meet a
target level s* at the end of the period (time T). The reservoir constraints are collectively
referred to as the guide curve for the hydroelectric dam operator.3 Guide curves are typically set
to achieve a number of objectives, including energy production, recreation, and ecosystem
services.
If the prices pt are deterministic, then the solution to the hydroelectric generator‟s
maximization problem is to supply electricity to the market during the highest-priced hours
(Perekhodtsev, 2003). To provide wind-following services to the market, the generator specifies
a portion of its production capacity yrescap ≤ ymax that is removed from the day-ahead energy
market and utilized for the wind-following service. This capacity allocation between the wind-
following and energy services represents a commitment on the part of the generator in advance
of real-time dispatch. The actual wind-following energy yres,t produced by this slice of the
generator‟s capacity is determined not by the generator‟s energy supply offer but in response to a
system signal wt. Thus, this portion of the generator‟s output is governed by:
(5)
3 We follow Horsley and Wrobel (1999) and Perekhodtsev (2003) in modeling the guide curve as a hard
constraint. Kern, et al (2011) note that some deviations from the guide curve are observed in practice.
7
The constant of proportionality γ indicates the contribution of the generator to offsetting the
system fluctuation dw/dt. The specific system fluctuation that we study in this paper corresponds
to changes in wind energy output.4
The wind-following service that we describe in this paper does not currently exist in PJM or
any other U.S. Regional Transmission Organization (RTO), and one of the goals of this paper is
to evaluate the economic incentives necessary for individual generators to participate in such a
market. Mount, et al. (2011) have also argued that RTOs will need to establish separate markets
and prices for wind integration services.5 In our model, wind-following services could be
provided in the form of “fill-in” power offered to the day-ahead or real-time market (in which
case they would be paid the day-ahead or real-time price for each MWh of fill-in energy
provided), or generators could offer capacity to a wind-following reserves type of market.
Generators providing reserve capacity earn a reservation price prescap for the capacity (MW)
removed from the energy market to be dispatched as reserves. For the amount of energy actually
produced (MWh), generators are paid the real-time energy price pt. The optimization problem
for a generator providing both energy and reserves to the market is thus:
(6) ∏ ∑
subject to the following constraints 7-12:
(7) ( )
4 The wind-following ancillary services signal may be a function of the wind forecast error rather than a
function of wind variability in and of itself. We do not have data on wind forecast errors, so we use
variations in wind energy output as a proxy. Time-series studies of wind forecast error such as de Mello,
et al. (2011) have found that the variability in forecast error is comparable to the variability of wind
energy output itself. 5 Mount, et al. (2011) focus on providing ramp-up and ramp-down services on the demand side of the
market, while our focus is the supply side. A portfolio of demand-side and supply-side resources will
likely be necessary to integrate large amounts of wind energy without degrading system reliability (Apt,
2007, also makes this observation).
8
(8)
(9) ( )
(10) ( )
(11)
(12)
Equation 7 indicates that reserve energy (MWh) produced by the generator is not a decision
variable, but is rather a function of the system signal wt. Equation 8 indicates that the generator‟s
capacity must be completely allocated between the energy market and the reserves market. The
amount sold into the energy market cannot exceed yenergycap (equation 9) and the amount of
electrical energy produced through the reserves market cannot exceed yrescap (equation 10). Note
that if the portion of the generator‟s capacity dedicated to providing reserves is utilized during
the same time t that the generator would elect to schedule delivery into the energy market, then
the generator would be indifferent between offering energy and reserves, and the optimal
reservation price prescap would be zero.
The Lagrange multipliers μt and ηt indicate the marginal opportunity cost of committing to an
allocation (yrescap, yenergycap) when a re-allocation towards one or the other of the two markets
would have been more profitable. These multipliers are thus the shadow cost of capacity
commitment to one market versus another. For example, if dwt/dt is very small during a period
of high prices, then the generator would have ex-post preferred to re-allocate capacity away from
the wind-following service. This sort of ex-post re-allocation is typically not permitted in
centralized electricity markets, due to the need to pre-schedule both energy and reserves. The
9
scenario analysis performed in this research estimates these Lagrange multipliers over a range of
operational set-points that yield different revenue streams and costs when capacity is allocated
between energy and wind-following services.
Whether wind-following services are offered as fill-in power through the energy markets or
offered as ancillary services, we define the total opportunity cost (OC) arising from the
allocation of yrescap to providing wind-following services, versus not offering these services as:6
(13) ∏ ∏
Based on the generator‟s optimization problem, it is clear that as the correlation between energy
market prices and wt declines, the opportunity cost of providing reserves services increases and a
larger payment prescap is necessary to provide incentives for generators to offer wind-following
services to the system operator.
3. Roanoke River Basin case study
As a case study for examining properties of a wind-following reserves product in centralized
electricity markets, we examine a small hydroelectric power producer in the Roanoke River
Basin (RRB), located in the Southeastern U.S. The RRB possesses three dams that lie in series:
Kerr, Gaston and Roanoke Rapids, ultimately controlling outflow to the downstream Hardwood
Bottomland Forest ecosystem. This forestland houses protected aquatic and terrestrial wildlife
6 We use the term “opportunity cost” differently than it is used in the context of PJM‟s ancillary services
market. Our concept of opportunity cost refers to the difference in total generator revenues arising from
allocating some amount of capacity to wind-following versus an operational practice of offering only into
the day-ahead or real-time energy markets, as in Kern, et al. (2011). One of our goals in this paper is to
determine the reservation price for wind-following capacity or energy that would be required to induce
entry into a market for wind-following services.
10
and plant species in which the state of North Carolina has invested more than $40 million in
conservation efforts (Whisnant et al., 2009). Preserving downstream environmental quality in
the face of hydrologic fluctuations is an additional regulatory objective in the operations of dams
on the Roanoke River.
We focus in particular on the operation of Kerr dam, which is owned by the U.S. Army
Corps of Engineers but operated by Dominion Energy. Kerr Dam sells electricity into the PJM
market, and Dominion also wheels energy from Kerr or the broader PJM market to local electric
distribution companies in North Carolina known as “preference utilities.” The preference
utilities lie outside PJM‟s territory and have been allocated property rights to the output of Kerr
Dam at low rates (see Section 4.2). Thus, multiple stakeholders influence Kerr Dam‟s operation
and profits. Kerr is responsible for flood control, recreation, municipal supply, hydroelectricity
generation, and ecosystem services.
Power production decisions at Kerr Dam are made on a weekly basis, and are the result of a
multi-step communication chain. Each Wednesday, the United States Corps of Engineers
(USACE) determines a weekly water declaration for the volume of water to be released from the
Kerr reservoir, which is sent to the Southeastern Power Administration (SEPA). The water
release declaration can also be expressed in a weekly energy declaration (MWh). In parallel, the
preference utilities submit a delivery schedule to SEPA that specifies when they are to receive
electricity wheeled from Dominion at the subsidized rate. Dominion is responsible for wheeling
power to the preference utilities according to their declared schedules, but can draw either on
Kerr Dam or the PJM spot market to fill the preference utilities requests. Thus, the operation of
Kerr Dam does not always physically follow the schedules set by the preference utilities.

11
4. Model description
4.1 Scenario analysis description
We model operational decisions at Kerr dam, the decisions of preference utilities regarding
their allocation of low-cost energy from Kerr dam, and the resulting pattern of power production,
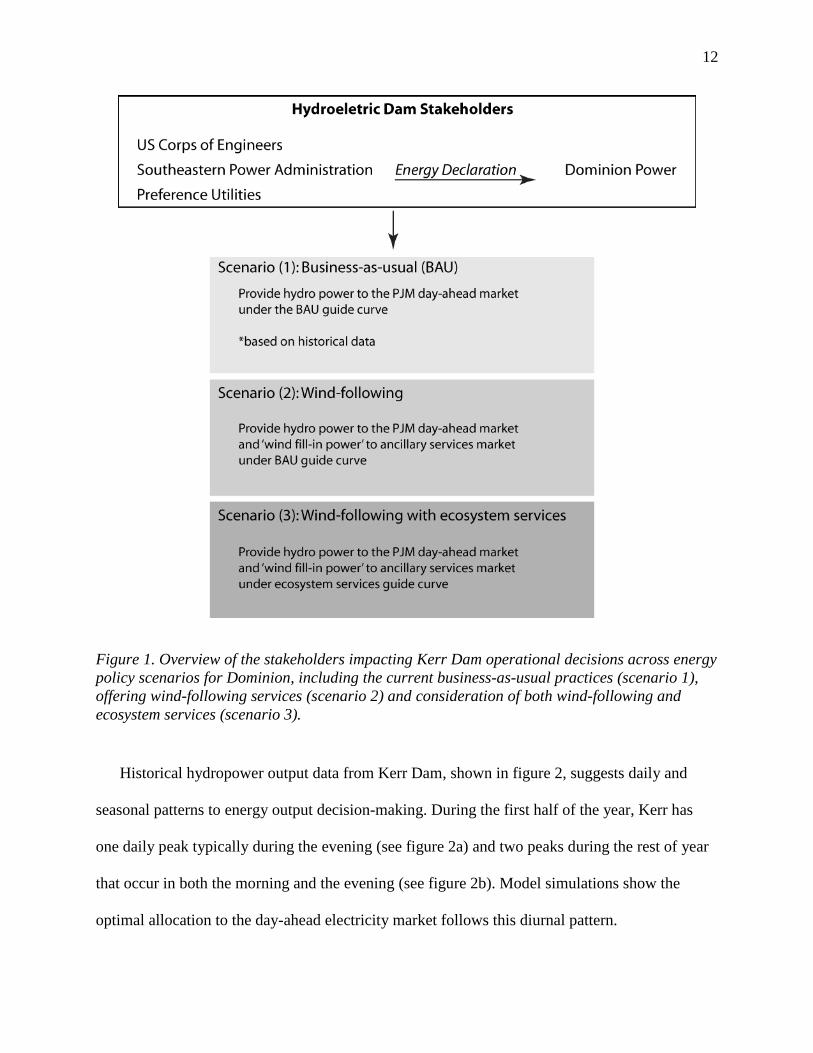
river flows and energy-market revenues under three scenarios (figure 1). The first scenario called
„business-as-usual‟ (BAU) uses historical hydropower production data from Kerr Dam. Our
other two scenarios are benchmarked against this BAU scenario. The second scenario or „wind-
following‟ uses a linear program to determine the timing and amount of power production that
maximizes annual revenue for Kerr dam by supplying hydropower to the day-ahead and
synchronized reserves market. The third scenario builds from the previous two by offering
generation through the day-ahead and ancillary services market, but also meets storage and
release targets that benefit the downstream ecosystem. Thus, we call the third scenario „wind-
following with ecosystem services‟.
In all scenarios, Kerr Dam is assumed to be a price-taker in the relevant markets (i.e., we do
not assume any strategic timing of releases as in Bushnell, 2003). We also assume that water
could be spilled during some hydrologic scenarios (i.e., water is pushed through the spillway
when mandated releases are larger than the turbine capacity) but we do not consider scenarios
where the system operator “spills” wind by dispatching the wind farm down.
12
Figure 1. Overview of the stakeholders impacting Kerr Dam operational decisions across energy
policy scenarios for Dominion, including the current business-as-usual practices (scenario 1),
offering wind-following services (scenario 2) and consideration of both wind-following and
ecosystem services (scenario 3).
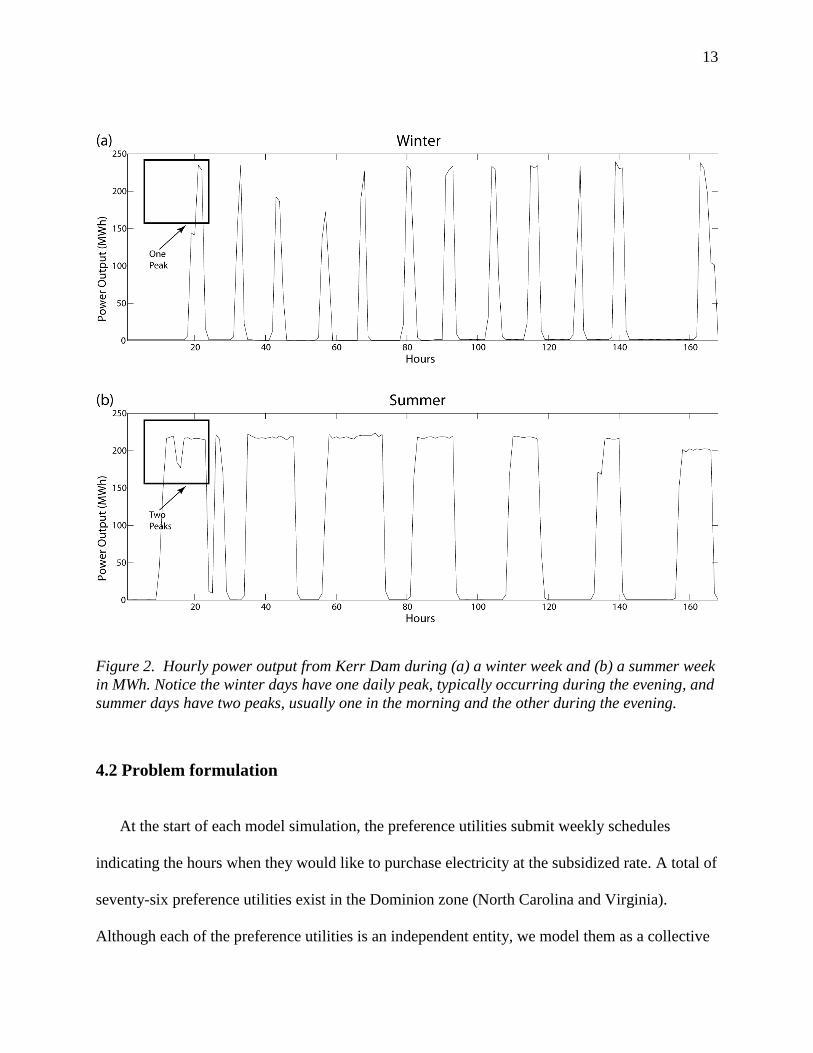
Historical hydropower output data from Kerr Dam, shown in figure 2, suggests daily and
seasonal patterns to energy output decision-making. During the first half of the year, Kerr has
one daily peak typically during the evening (see figure 2a) and two peaks during the rest of year
that occur in both the morning and the evening (see figure 2b). Model simulations show the
optimal allocation to the day-ahead electricity market follows this diurnal pattern.
13
Figure 2. Hourly power output from Kerr Dam during (a) a winter week and (b) a summer week
in MWh. Notice the winter days have one daily peak, typically occurring during the evening, and
summer days have two peaks, usually one in the morning and the other during the evening.
4.2 Problem formulation
At the start of each model simulation, the preference utilities submit weekly schedules
indicating the hours when they would like to purchase electricity at the subsidized rate. A total of
seventy-six preference utilities exist in the Dominion zone (North Carolina and Virginia).
Although each of the preference utilities is an independent entity, we model them as a collective

14
group that solves a single optimization problem, namely to minimize the cost of meeting their
customers‟ electricity demands. The preference utilities can use three supply sources:
Option 1: Power can be purchased from the PJM spot market (yPJM,t) at price pPJM,t. We
assume that preference utilities are price-takers in the PJM market.
Option 2: Power can be self-generated from resources owned by the preference utilities (ySG,t)
We set ySG,t to be $80.66/MWh, representing an average of delivered natural gas price of $10.00
per thousand cubic feet, delivered No. 6 fuel oil price of $2.12 per gallon and marginal cost of
hydroelectricity of $10/MWh (EIA, Natural Gas Prices, 2010; EIA, No. 2 Distillate Prices, 2010;
Newcomer et al., 2008; Newcomer and Apt, 2009).
Option 3: Preference utilities can schedule delivery from Kerr Dam at the subsidized price of
$8.25/MWh (Kern et al., 2011). The optimization problem for the preference utilities is thus:
(14) ∑
subject to the following constraints 15-18:
(15) ∑
(16)
(17) ∑
(18)
In equations 15 through 18, Loadt is the total preference utility electricity demand during
hour t, and Weekly BAU Declaration is the weekly energy declaration at Kerr Dam under current
BAU operations, which determines the amount of low-cost electricity available to the preference
customers on a weekly basis. Equation 15 says that the preference utilities must meet customer
15
demands during each hour through a combination of PJM spot market purchases, self-generation,
and subsidized energy from Kerr Dam. Equation 16 is the capacity constraint on Kerr Dam.
Equations 17 and 18 define the total weekly amount of subsidized energy available from Kerr
Dam, and the capacity constraint on self-generation of 9.08 MW during each hour t.7
Dominion‟s revenues depend on the differential between the fixed SEPA rate pS and the
hourly expected price pM as well as the amount of generation sold to the preference utilities and
PJM. If prices in the PJM wholesale market drop below SEPA‟s fixed rate during hours when the
preference utilities request delivery of generation from Kerr Dam, Dominion earns increased
revenues (ps – pM). Similarly, if PJM prices are higher than the SEPA fixed rate, then Dominion
loses money (pM – pS) during hours when it must wheel power to the preference utilities. Thus,
the scheduling decisions by the preference customers influence Dominion‟s revenues but not
operations at Kerr dam (since Dominion can always wheel power to the preference utilities from
the broader PJM market).8
The BAU scenario is based on historical data from Kerr Dam. We assume that Dominion
operates Kerr Dam so as to maximize revenues. We use historical output data from Kerr Dam
and price data from PJM to calculate BAU revenues, as shown in equation 19 for an arbitrary
time horizon t = (1,…,T).
(19) ∑ ( )
7 Data regarding self-generation capacity was collected through telephone interviews with the preference
utilities. 8 Prior to Dominion joining PJM in 2005, the physical scheduling of power output at Kerr dam followed
requests by preference utilities to have power wheeled from Kerr at the SEPA rate (Whisnant et al.,
2009).
16
The second scenario optimizes revenues with a wind-following constraint. Under this
scenario, the dam allocates some amount of its capacity (up to 100 MW) to balancing output
fluctuations from a collection of wind turbines in the Allegheny Mountains near the
Virginia/West Virginia border (NREL, 2010).
In our initial simulations of Kerr Dam‟s capacity allocation problem, we found that
dedicating capacity to wind-following resulted in frequent violations of the guide curve under all
hydrological and policy scenarios. This result is interesting in and of itself, as it suggests
fundamental conflicts between usage of the river system to achieve renewable energy goals and
river-system management goals related to other energy production, recreation and downstream
ecosystem health. For the purposes of examining the financial trade-offs faced by Kerr Dam
related to the decision to provide wind-following services, we include in Kerr Dam‟s objective
function a revenue penalty of $1,000/MWh that applies if the hourly output exceeds the hourly
energy declaration. This penalty factor is consistent with other penalty-factor formulations in the
power systems literature (Zerriffi, et al., 2005; Blumsack et al., 2007).
Equation 20 shows Dominion‟s optimization problem under the wind-following scenario to
maximize revenues over an arbitrary time horizon, assuming that yrescap = 100 MW.
(20) ∑ ( ) ( )
( ) ( )
subject to the following constraints (21) –(25):
(21)
(22) ∑
17
(23)
(24)
(25)
Constraint (21) allocates the turbine capacity to the day-ahead and wind-following markets,
and (22) ensures the monthly power output does not exceed the monthly BAU energy
declaration. Constraint (23) ensures that the amount of the reservoir supply dedicated to wind-
following at each hour satisfies the amount of wind compensation requested. Constraint (24) is
the upper bound that requires at each hour the reservoir supply dedicated to hydropower
production is at most approximately 100 MW. Constraint (25) is the upper bound for wind fill-in
power being at most 100 MW at each time step.
Lastly, we model a scenario where Kerr Dam offers wind-following services coupled with
flow constraints intended to maintain the health of the Hardwood Bottomland forest ecosystem
(i.e., the Kerr Ecosystem Management Plan or KEMP). Details of the KEMP guide curve can be
found in (Whisnant et al., 2009). Broadly, KEMP would increase required releases from Kerr
Dam by as much as 40% (compared to current operations) during the spring and early summer.
The model adjusts hydropower production according to the guide curve defined by the KEMP
strategy (Whisnant et al., 2009) to consider peak electricity periods and riparian flow levels.
Equation 26 describes the „wind-following and ecosystem services‟ objective function with
the relevant constraints. During certain times of the year in this scenario, Kerr Dam must spill
water to meet release targets; this spilling carries an opportunity cost that we calculate as pPJM,t
multiplied by the quantity of foregone power production from spillingt.
18
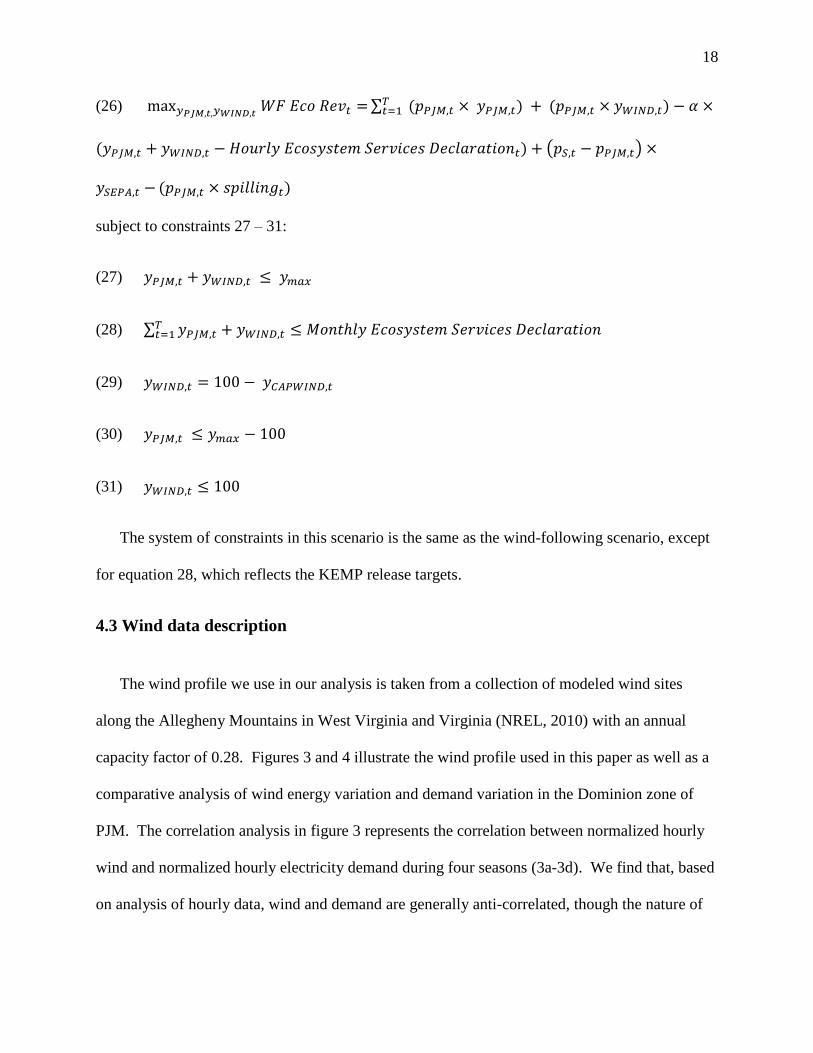
(26) ∑ ( ) ( )
( ) ( )
( )
subject to constraints 27 – 31:
(27)
(28) ∑
(29)
(30)
(31)
The system of constraints in this scenario is the same as the wind-following scenario, except
for equation 28, which reflects the KEMP release targets.
4.3 Wind data description
The wind profile we use in our analysis is taken from a collection of modeled wind sites
along the Allegheny Mountains in West Virginia and Virginia (NREL, 2010) with an annual
capacity factor of 0.28. Figures 3 and 4 illustrate the wind profile used in this paper as well as a
comparative analysis of wind energy variation and demand variation in the Dominion zone of
PJM. The correlation analysis in figure 3 represents the correlation between normalized hourly
wind and normalized hourly electricity demand during four seasons (3a-3d). We find that, based
on analysis of hourly data, wind and demand are generally anti-correlated, though the nature of
19
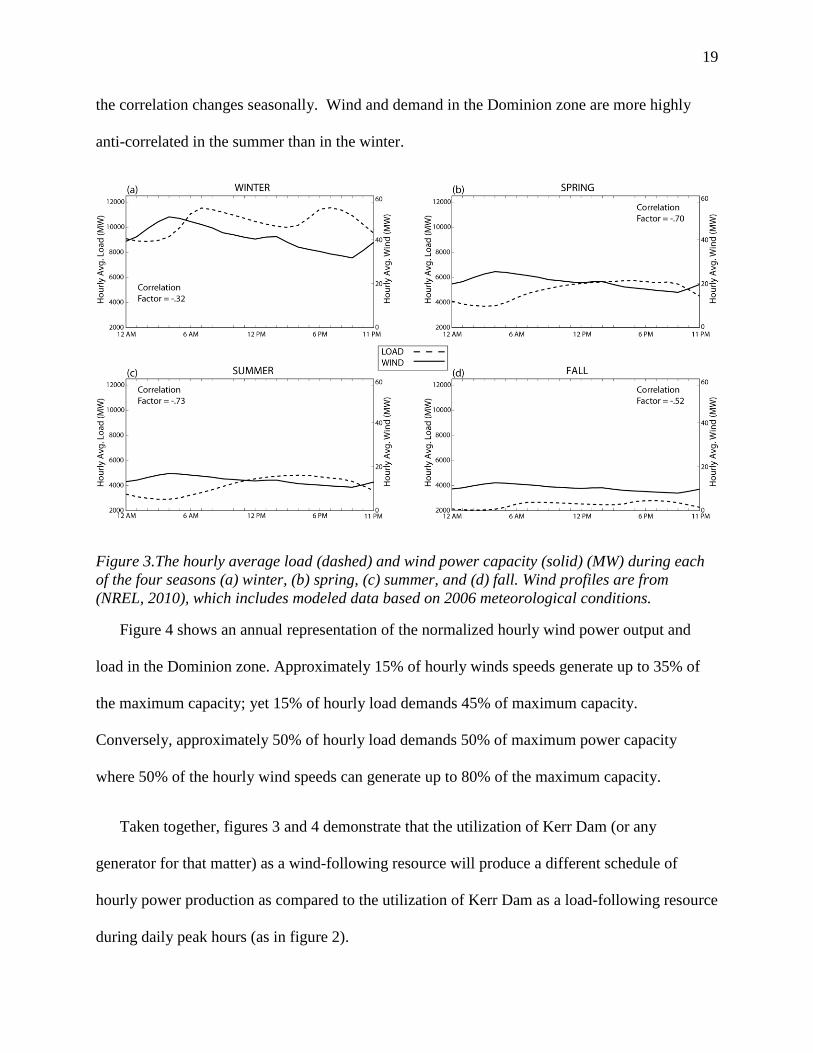
the correlation changes seasonally. Wind and demand in the Dominion zone are more highly
anti-correlated in the summer than in the winter.
Figure 3.The hourly average load (dashed) and wind power capacity (solid) (MW) during each
of the four seasons (a) winter, (b) spring, (c) summer, and (d) fall. Wind profiles are from
(NREL, 2010), which includes modeled data based on 2006 meteorological conditions.
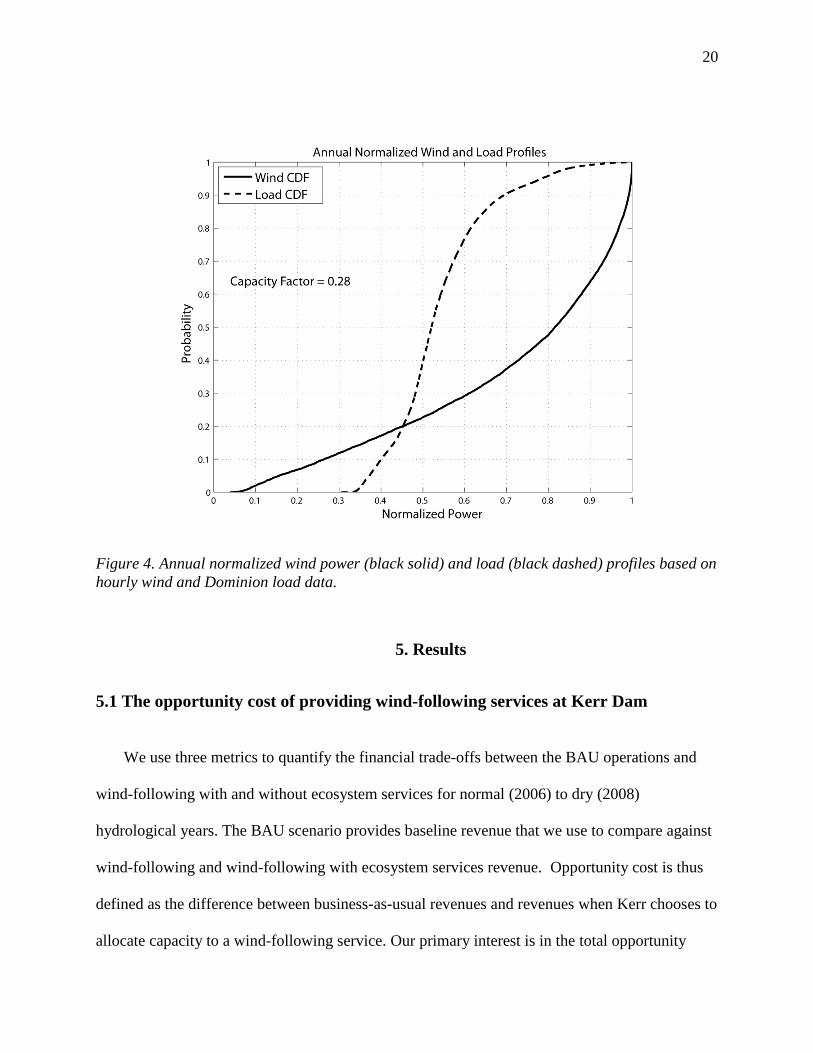
Figure 4 shows an annual representation of the normalized hourly wind power output and
load in the Dominion zone. Approximately 15% of hourly winds speeds generate up to 35% of
the maximum capacity; yet 15% of hourly load demands 45% of maximum capacity.
Conversely, approximately 50% of hourly load demands 50% of maximum power capacity
where 50% of the hourly wind speeds can generate up to 80% of the maximum capacity.
Taken together, figures 3 and 4 demonstrate that the utilization of Kerr Dam (or any
generator for that matter) as a wind-following resource will produce a different schedule of
hourly power production as compared to the utilization of Kerr Dam as a load-following resource
during daily peak hours (as in figure 2).
20
Figure 4. Annual normalized wind power (black solid) and load (black dashed) profiles based on
hourly wind and Dominion load data.
5. Results
5.1 The opportunity cost of providing wind-following services at Kerr Dam
We use three metrics to quantify the financial trade-offs between the BAU operations and
wind-following with and without ecosystem services for normal (2006) to dry (2008)
hydrological years. The BAU scenario provides baseline revenue that we use to compare against
wind-following and wind-following with ecosystem services revenue. Opportunity cost is thus
defined as the difference between business-as-usual revenues and revenues when Kerr chooses to
allocate capacity to a wind-following service. Our primary interest is in the total opportunity
21
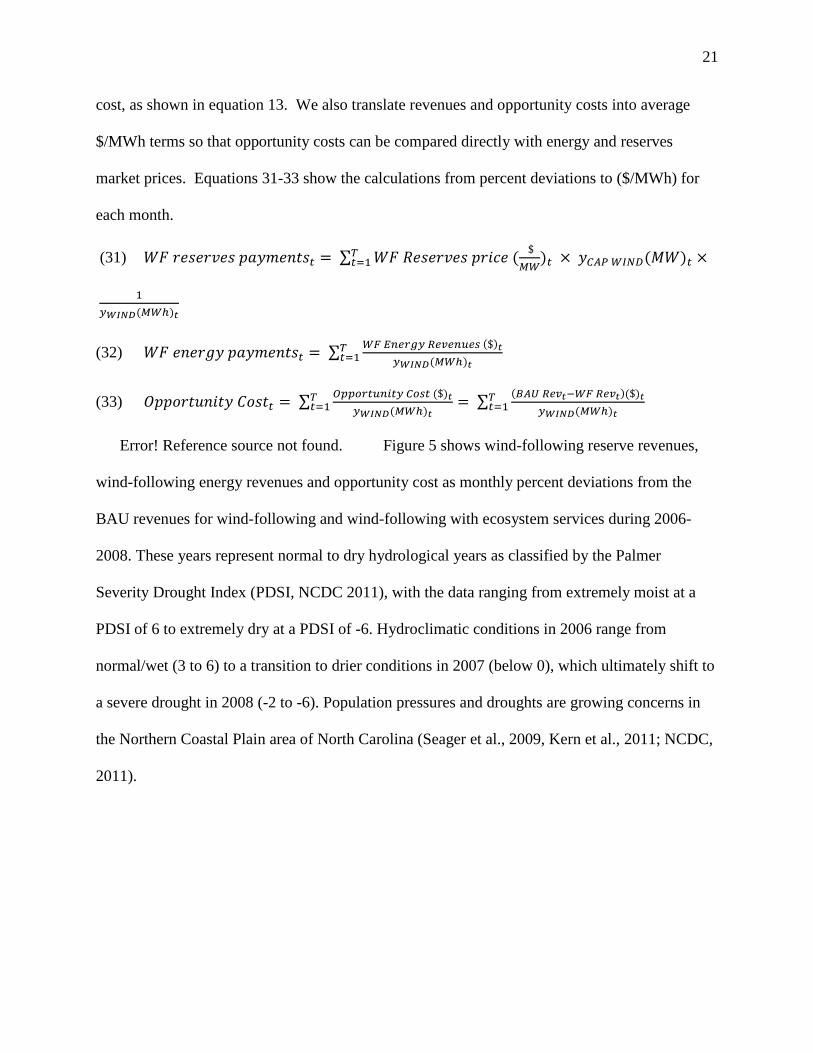
cost, as shown in equation 13. We also translate revenues and opportunity costs into average
$/MWh terms so that opportunity costs can be compared directly with energy and reserves
market prices. Equations 31-33 show the calculations from percent deviations to ($/MWh) for
each month.
(31) ∑ (
) ( )
( )
(32) ∑ ( )
( )
(33) ∑ ( )
( ) ∑
( )( )
( )
Error! Reference source not found. Figure 5 shows wind-following reserve revenues,
wind-following energy revenues and opportunity cost as monthly percent deviations from the
BAU revenues for wind-following and wind-following with ecosystem services during 2006-
2008. These years represent normal to dry hydrological years as classified by the Palmer
Severity Drought Index (PDSI, NCDC 2011), with the data ranging from extremely moist at a
PDSI of 6 to extremely dry at a PDSI of -6. Hydroclimatic conditions in 2006 range from
normal/wet (3 to 6) to a transition to drier conditions in 2007 (below 0), which ultimately shift to
a severe drought in 2008 (-2 to -6). Population pressures and droughts are growing concerns in
the Northern Coastal Plain area of North Carolina (Seager et al., 2009, Kern et al., 2011; NCDC,
2011).
22
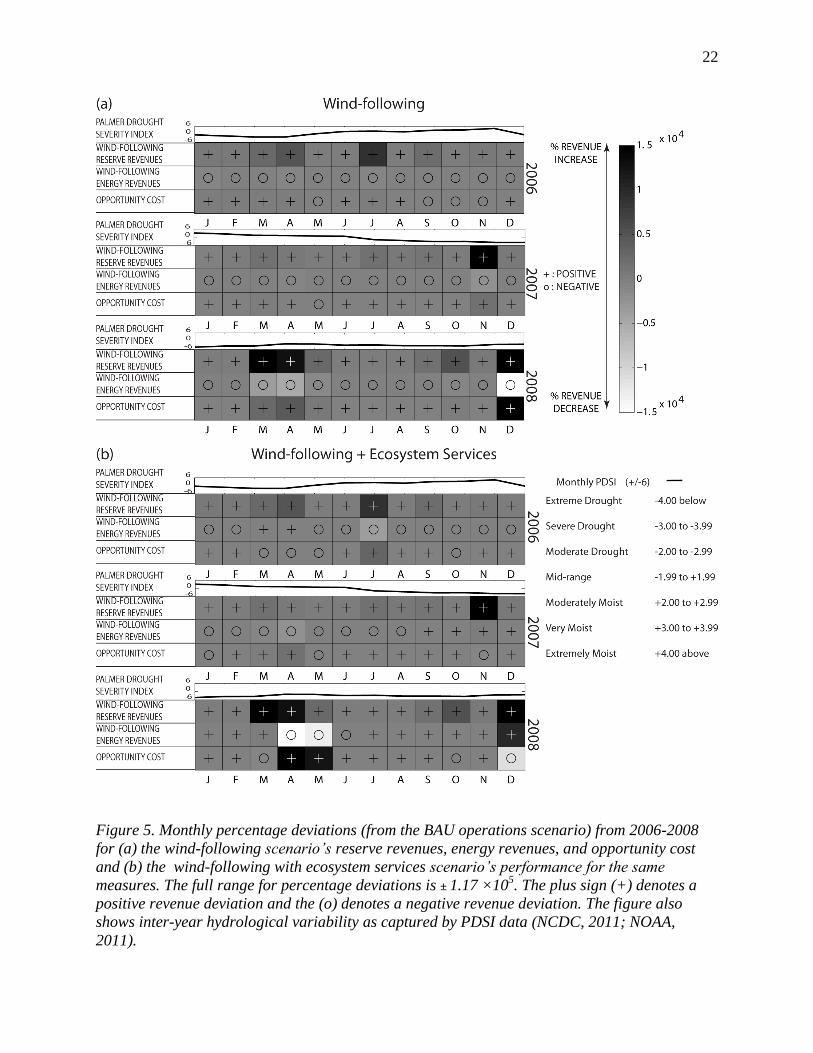
Figure 5. Monthly percentage deviations (from the BAU operations scenario) from 2006-2008
for (a) the wind-following scenario’s reserve revenues, energy revenues, and opportunity cost
and (b) the wind-following with ecosystem services scenario’s performance for the same
measures. The full range for percentage deviations is ± 1.17 ×10⁵. The plus sign (+) denotes a
positive revenue deviation and the (o) denotes a negative revenue deviation. The figure also
shows inter-year hydrological variability as captured by PDSI data (NCDC, 2011; NOAA,
2011).

23
The opportunity cost is directly impacted by hydrologic variability. In figure 5, the shaded
boxes show positive (black), negative (white) and neutral (gray) monthly revenue deviations
from the BAU scenario. Figure 5a shows that the revenue impacts to Kerr Dam from offering
wind-following services vary by month and year, with more extreme monthly revenue impacts in
drier years (2007 and 2008). Overall, figure 5 suggests that on a monthly basis, the revenue
impacts from wind-following may at times be extreme (± 1.17×10⁵
percent deviation from the
BAU scenario although they are shown below on a range of ± 1.5×10⁴), depending on whether
wind-following reserves and energy revenues are accrued in on-peak or off-peak periods. In
figure 5b, wind-following with ecosystems services shows negative energy revenues for most all
months ranging from moderate (-0.2 percent of BAU revenues) to extreme (-5.2 ×10⁴
percent of
BAU revenues) impacts. Large revenue losses (i.e., large opportunity costs relative to BAU
operations) may occur when Dominion must sell peak power at a lower rate to the preference
utilities (incurring a cost) and may need to provide ancillary services during the day with reduced
winds.
Conversely, opportunity cost in wind-following with ecosystem services (figure 5b) is
positive for most months, suggesting there is a conflict between providing wind support services
and spilling for ecosystem services. A positive opportunity cost also signifies that Dominion
would earn more revenues by not allocating capacity to a wind-following service and staying in
the day-ahead energy market. The positive opportunity costs during the dry summer months in
2007 and 2008 suggest that Dominion allocates less reservoir supply to wind-following services
and must also ration water to meet KEMP spilling requirements and minimum downstream river
levels for other services (fishing, recreation etc.). April 2008 in figure 5b further shows a large
positive opportunity cost, suggesting there is a conflict with meeting the stricter spilling releases

24
during the spawning season (i.e., less hydro power) and providing wind-following. A few winter
months in wind-following with ecosystem services show the opposite trend, indicating Dominion
would see higher revenues by offering wind-following services and operate under less restrictive
spilling requirements.
5.2 Opportunity cost curves for wind-following services
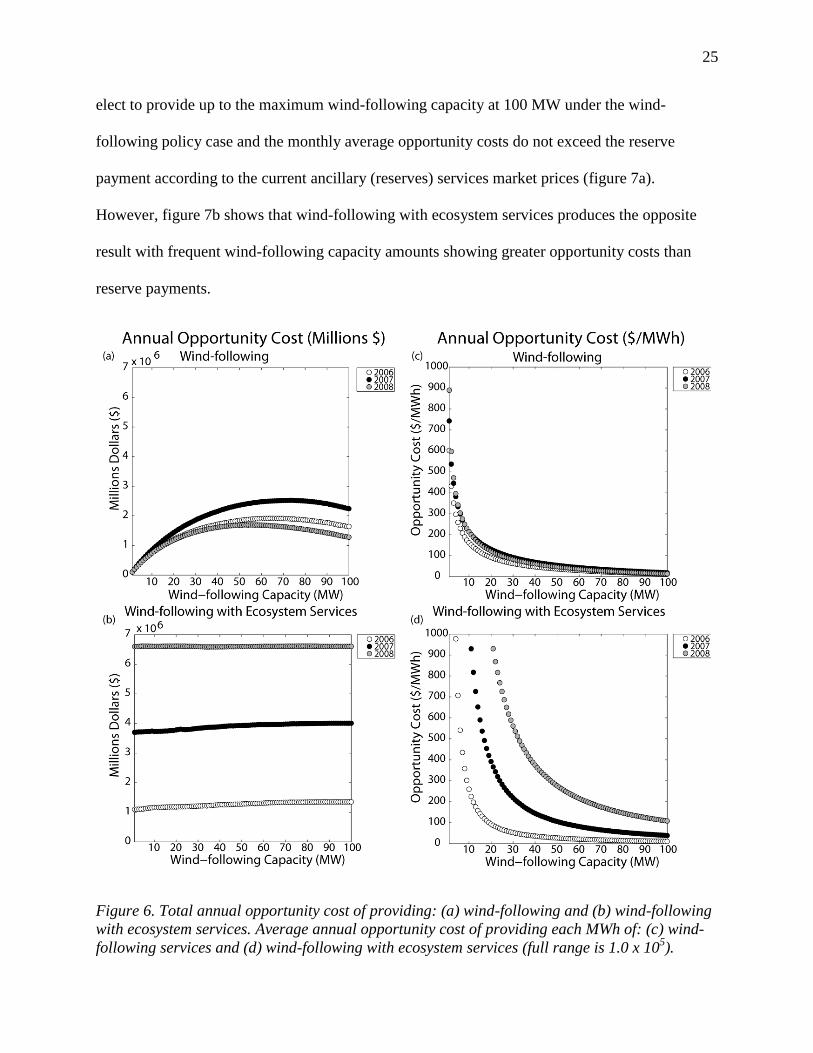
Equation 33 describes the average annual opportunity cost for providing wind-following
services; Figure 6 traces out the total annual and average annual opportunity cost (in $ per MWh
of wind-following energy provided) of providing wind-following services as the slice of wind-
following capacity ranges up to 100 MW. At higher levels of wind-following (without also
providing ecosystem services), we see concomitant increases in the opportunity cost to Kerr Dam
until the size of the wind-following slice is around 60 MW. The total and annual average
opportunity costs are significantly higher when Kerr Dam provides wind-following services in
addition to ecosystem services under the KEMP policy. The invariance of total opportunity costs
to the level of wind-following provided (figure 6b) suggests that these costs are dominated by
persistent violations of the KEMP guide curve (recall that we set a penalty of $1,000 per MWh
for each violation), indicating conflicts between the goals of operating the dam for wind-
following and ecosystem services. We thus conclude that operating a small-scale hydroelectricity
dam like Kerr Dam with hydrological uncertainty may lead to significant opportunity costs when
adjusting reservoir releases for the downstream environment (figure 6b).
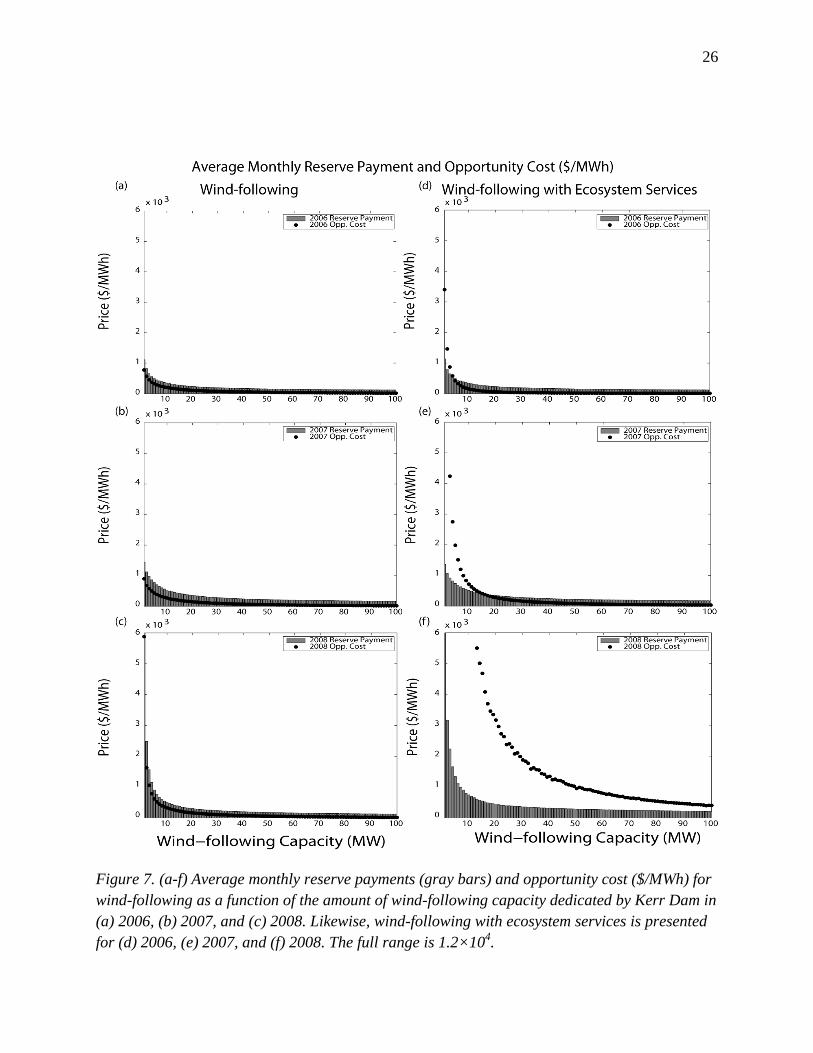
Figure 7 summarizes an additional sensitivity analysis of the average monthly reserve
payments and opportunity cost ($/MWh) with a wind-following range of 1 to 100 MW. In the
figure, when the reserve payments (gray bars) exceed the opportunity cost (black dot), Dominion
is fully compensated for offering wind-following under the specified policy case. Dominion may
25
elect to provide up to the maximum wind-following capacity at 100 MW under the wind-
following policy case and the monthly average opportunity costs do not exceed the reserve
payment according to the current ancillary (reserves) services market prices (figure 7a).
However, figure 7b shows that wind-following with ecosystem services produces the opposite
result with frequent wind-following capacity amounts showing greater opportunity costs than
reserve payments.
Figure 6. Total annual opportunity cost of providing: (a) wind-following and (b) wind-following
with ecosystem services. Average annual opportunity cost of providing each MWh of: (c) wind-
following services and (d) wind-following with ecosystem services (full range is 1.0 x 10⁵).
26
Figure 7. (a-f) Average monthly reserve payments (gray bars) and opportunity cost ($/MWh) for
wind-following as a function of the amount of wind-following capacity dedicated by Kerr Dam in
(a) 2006, (b) 2007, and (c) 2008. Likewise, wind-following with ecosystem services is presented
for (d) 2006, (e) 2007, and (f) 2008. The full range is 1.2×10⁴.

27
The sensitivity analysis also illustrates that reserve payments are greater than the positive
opportunity cost with wind-following in 2008, suggesting that wind-following is profitable for
Dominion under drought conditions if unconstrained by other demands. Yet, the 2008 results for
wind-following with ecosystem services demonstrate the opposite, further supporting the
increasingly large, positive annual opportunity costs shown in figure (7b) as Dominion allocates
more reservoir capacity into the ancillary services market. Thus, utilizing hydroelectricity to
abate wind intermittency becomes a challenge during water-constrained years.
6. Conclusion
Large-scale wind penetration requires the use of flexible resources to fill in during
intermittent production periods, posing a challenge to maintain current and future electrical grid
reliability standards. Hydroelectric dams possess the physical characteristics (fast ramp-time,
large capacity, minimal emissions) to meet system demand and smooth out wind-power
fluctuations in a manner consistent with the environmental goals of renewable energy policy.
River systems, however, are generally managed to meet many different social objectives. Our
analysis has focused on three of these objectives (hydroelectric revenue, facilitating wind
integration and maintenance of downstream ecosystem quality). We find that a number of
regulatory trade-offs emerge once we alter business-as-usual practices with wind-following and
ecosystem services policies.
Our results suggest that regulatory adjustments would be necessary to induce generators to
provide wind-following services, whether as ancillary services or in the form of an energy fill-in
product coupled with a specific wind site or collection of sites. Either construct would

28
necessitate that market prices and payments to suppliers be based on opportunity cost, rather than
incremental accounting costs. We find that current ancillary services prices would be
compensatory for generators offering wind-following services, but the system costs of large-
scale wind integration may be lower if wind generators were required to offer an energy product
coupled with a dispatchable resource. We hypothesize that such a policy would also facilitate the
inclusion of wind and other renewables into regional system planning processes, although this
area is left as a topic for future research. Our results are based on the simulated operation of a
hydroelectric dam (since we are also concerned with policy conflicts between energy production
and other river management policy objectives) but are qualitatively generalizable to other
potential technologies used to back-up wind energy production.
29
References
Anderson, C.L., Cardell, J.B. (2008). Reducing the Variability of Wind Power Generation for
Participation in Day Ahead Electricity Markets. Proceedings of the 41st Annual Hawaii
International Conference on System Sciences (HICSS 2008), Waikoloa HI.
Apt, J., Keith, D.W., and Morgan, M.G. (2007). Promoting Low-Carbon Electricity Production.
Issues in Science & Technology, 24, 37-44.
Apt, J. (2007). The spectrum of power from wind. Journal of Power Sources, 169:2, 369-374.
Blumsack, S., Lave, L.B., and Marija, I. (2007). A Quantitative Analysis of the Relationship
Between Congestion and Reliability in Electric Power Networks. Energy Journal, 28(4), 73-100.
Blumsack, S., and Xu., J. (2011, forthcoming). The Impact of Renewable Energy Siting
Decisions on Electricity-Sector Air Emissions in the Western U.S.. Energy Policy.
Bushnell, J. (2003). A Mixed Complementarity Model of Hydrothermal Electricity Competition
in the Western United States. Operations Research 51, 80–93.
Denholm, P. and Kulcinski, G.L. (2004). Life cycle energy requirements and greenhouse gas
emissions from large scale energy storage systems. Energy Conversion and Management, 45,
2153-2172.
De Mello, P., Lu, N. and Makarov, Y. (2011). An optimized autoregressive forecast error
generator for wind and load uncertainty study. Wind Energy, doi: 10.1002/we.460.
Dobesova, K., Apt, J., and Lave, L.B. (2005). Are renewables portfolio standards cost-effective
emission abatement policy? Environmental Science & Technology, 39 (22), 858-8583.
Fischer, C. (2010). When Do Renewable Portfolio Standards Reduce Electricity Prices?. Energy
Journal, 31(1), 101-120.
Garcia-Gonzalez, J., De la Muela, R.M.R., Santos, L.M, Gonzalez, A.M. (2008). Stochastic
Joint Optimization of Wind Generation and Pumped Storage Units in an Electricity Market.
IEEE Transactions on Power Systems, 23:2, 460-468.
Horsley, A. and Wrobel, J. (1999). Efficiency Rents of Storage Plants in Peak-Load Pricing, II:
Hydroelectricity. London School of Economics and Political Science, Discussion Paper No.
TE/99/372.
Katzenstein, W. and Apt, J. (2009). Air Emissions Due to Wind and Solar. Environmental
Science and Technology, 43(2), 253-258.
Kern, J.D., Characklis, G., Doyle, M., Blumsack, S. and Wishunt, R. (2011, forthcoming). The
Influence of De-Regulated Electricity Markets on Hydropower Generation and Downstream
Flow Regime. Journal of Water Resources Planning and Management.

30
Mount, T., Lamadrid, A. and Woo-Young, J. (2011). How will customers pay for the smart
grid? Proc. 30th
Eastern Advanced Workshop on Regulation and Competition, Skytop PA.
National Climate Data Center (NCDC) (2011). Climate Division Data. State Climate Office of
North Carolina. http://www.nc-climate.ncsu.edu/climate/climdiv.php. Accessed 2011.
National Oceanic and Atmospheric Administration (NOAA) (2011). Palmer Drought Index
Long-term Meteorological Conditions. NOAA/NESDIS/NCDC.
http://www.ncdc.noaa.gov/oa/climate/research/prelim/drought/pdiimage.html. Accessed 2011.
National Renewable Energy Lab (NREL) (2010). Wind Integration Datasets: Eastern Wind
Dataset. http://www.nrel.gov/wind/integrationdatasets/eastern/methodology.html. Accessed
2010.
Newcomer, A. and Apt, J. (2009). Near term implications of a ban on new coal-fired power
plants in the US. Environmental Science & Technology, 43 (11), 3995-4001.
Newcomer, A., Blumsack, S., Apt, J., Lave, L.B., and Morgan, M.G. (2008). The short run
economic and environmental effects of a carbon tax on U.S. electric generation. Environmental
Science & Technology, 42, 3139-3144.
Perekhodtsev, D. (2003).Two Essays on Problems in Electricity Deregulation, Carnegie-Mellon
University, Ph.D. Dissertation.
Richer, A., Baumgartner, J., Braun, D. (1996). A Method for Assessing Hydrologic Alteration
within Ecosystems. Conservation Biology, 10(4), 1163-1174.
Seager, R., Tzanova, A. and Nakamura, J. (2009). Drought in the Southeastern United States:
Causes, Variability over the last Millennium, and the Potential for Future Hydroclimatic Change.
Journal of Climate, 22, 5021-5045.
Sioshansi, R. (2011). Increasing the value of wind energy with storage. Energy Journal 32(2), 1
– 30.
Sioshansi, R., Denholm, P., Jenkin, T., and Weiss, J. (2009). Estimating the Value of Electricity
Storage in PJM: Arbitrage and Some Welfare Effects. Energy Economics, 31(2), 269-277.
Suen, J.P. and Eheart, J.W. (2006). Reservoir management to balance ecosystem and human
needs: Incorporating the paradigm of the ecological flow regime. Water Resources Research, 42.
U.S. Energy Information Administration (EIA) (2010). Independent Statistics and Analysis: No.
2 Distillate Prices by Sales Type. http://tonto.eia.doe.gov/dnav/pet/pet_pri_dist_dcu_nus_a.htm.
Accessed 2010.
U.S. Energy Information Administration (EIA) (2010). Independent Statistics and Analysis:
Natural Gas Prices. http://tonto.eia.doe.gov/dnav/ng/ng_pri_sum_dcu_SNC_a.htm. Accessed
2010.
Whisnant, R.B., Characklis, G.W., Doyle, M.W., Flatt, V.B., and Kern, J.D. (2009) Operating
policies and administrative discretion at the John. H. Kerr project (Report).
Zerriffi, H., Dowlatabadi, H., and Farrell, A. (2005). Incorporating stress in electric power
systems reliability models. Energy Policy, 35(1), 61-75.