Embed Size (px)
Citation preview

Evaluating the Relationship Between the Carbon and Sulfur Cycles in the Later Cambrian Ocean: An Example from the Port au Port Group, Western Newfoundland, Canada
CitationHurtgen, Matthew T., Sara B. Pruss, and Andrew Herbert Knoll. 2009. Evaluating the relationship between the carbon and sulfur cycles in the later Cambrian ocean: An example from the Port au Port Group, western Newfoundland, Canada. Earth and Planetary Science Letters 281(3-4): 288-297.
Published Versiondoi:10.1016/j.epsl.2009.02.033
Permanent linkhttp://nrs.harvard.edu/urn-3:HUL.InstRepos:3988784
Terms of UseThis article was downloaded from Harvard University’s DASH repository, and is made available under the terms and conditions applicable to Open Access Policy Articles, as set forth at http://nrs.harvard.edu/urn-3:HUL.InstRepos:dash.current.terms-of-use#OAP
Share Your StoryThe Harvard community has made this article openly available.Please share how this access benefits you. Submit a story .
Accessibility

Evaluating the relationship between the carbon and sulfur cycles in the later Cambrian ocean: An example from the Port au Port
Group, western Newfoundland, Canada
Matthew T. Hurtgen1 Department of Earth and Planetary Sciences, Northwestern University, Evanston, IL 60208, USA
Sara Pruss Department of Geology, Smith College, Northampton, Massachusetts 01063, USA
Andrew H. Knoll Department of Organismic and Evolutionary Biology, Harvard University, Cambridge, Massachusetts 02138, USA
1 Corresponding author: [email protected], ph 847.491.7539, fax 847.491.8060

2
ABSTRACT
We present a high-resolution δ34S (sulfate and pyrite) and δ13Ccarbonate record from the
Middle-Upper Cambrian Port au Port Group, a mixed carbonate-siliciclastic succession exposed
in western Newfoundland, Canada. The results illustrate systematic δ34Ssulfate shifts of >15‰
over relatively short stratigraphic intervals (10 m, likely <1 m.y.), low average Δ34Ssulfate-pyrite (ca.
23 ‰) and a generally positive coupling between changes in δ13Ccarbonate and δ34Ssulfate. Together,
these results indicate that Middle to Late Cambrian sulfate concentrations were low and that the
sulfate reservoir was more sensitive to change than it was in either terminal Neoproterozoic or
Cenozoic oceans. However, a simple carbon (C) and sulfur (S) isotope box model of the Late
Cambrian ocean illustrates that low sulfate concentrations alone fail to account for the >15‰
δ34Ssulfate shifts recognized in Port au Port strata. Such large shifts can be generated only if
fluctuating oceanic redox is invoked; marine anoxia forces reduced C/S burial and elevated Δ34S,
driving larger δ34S changes per mole of organic carbon buried. The conclusion that later
Cambrian oceans featured both low sulfate levels and widespread subsurface anoxia supports
hypotheses that link fluctuating marine redox conditions in the delayed recovery of skeletal
animals and metazoan reefs from late Early Cambrian extinction.
Keywords: Cambrian, sulfate, anoxic, sulfur isotopes, Newfoundland, SPICE

1. Introduction 1
The biogeochemical cycles of carbon (C) and sulfur (S) are intimately linked through a 2
variety of feedbacks that operate on timescales of days to millions of years. For example, under 3
anaerobic conditions, some bacteria respire organic matter via sulfate reduction, reducing sulfate 4
to sulfide that then reacts with iron (Fe), assuming it is available, to form pyrite. On much 5
longer timescales, increases in organic carbon (OC) burial can drive an increase in atmospheric 6
O2 concentration which, in turn, facilitates an increase in the extent to which sulfides on land are 7
oxidatively weathered and, ultimately, delivered to the oceans as riverine sulfate. These two 8
processes impose very different relationships between the C isotope composition of dissolved 9
inorganic carbon (DIC) and the sulfur isotope composition of sulfate in seawater. The former 10
leads to a positive correlation between δ13Ccarbonate (assumed to reflect the δ13C of DIC) and 11
δ34Ssulfate whereas the latter prescribes a long-term negative correlation (e.g., Veizer et al., 1980). 12
Of course, the recognition of either a positive or negative correlation between δ13Ccarbonate and 13
δ34Ssulfate depends strongly on the relative residence times of seawater DIC and sulfate, neither of 14
which is well constrained for the Cambrian Period. 15
In the modern ocean, the concentration of DIC is ~2 mM with a residence time of ~100 16
k.y. (Berner and Berner, 1996). Because of this relatively short residence time, the δ13C 17
composition of DIC is susceptible to both heterogeneity among the world’s ocean basins and 18
short-term (<1 m.y.) change. In contrast, δ34Ssulfate is both homogenous throughout the ocean 19
(Rees, 1978) and buffered against short-term variations due to the relatively high concentration 20
(28 mM) and long residence time (~25 m.y.) of sulfate in the oceans (Holser et al. 1989). The 21
large inequality in the residence times of DIC and sulfate in the recent geologic past (i.e., the 22
Cenozoic) has made it difficult to evaluate the relationship between these two biogeochemical 23

2
cycles that play an important role in regulating Earth’s climate (e.g., Kurtz et al., 2003, Paytan et 24
al., 2004). 25
Recent work highlighting the δ34S composition of carbonate-associated sulfate (CAS) and 26
pyrite suggests that seawater sulfate concentrations increased near the end of the Neoproterozoic 27
Era (Hurtgen et al., 2005; Fike et al., 2006; Halverson and Hurtgen, 2007). However, the 28
chemical composition of fluid inclusions encased in halite (Horita et al., 2002; Lowenstein et al., 29
2001, 2003; Brennan et al. 2004; Petrychenko et al., 2005) and the recognition of 34S-enriched 30
CAS (Kampschulte and Strauss, 2004; Gill et al., 2007), pyrite (Strauss, 1999) and francolite-31
bound sulfate (Hough et al., 2006) in Lower to Middle Cambrian strata indicate that sulfate 32
levels may have been substantially lower during this time interval relative to both the terminal 33
Neoproterozoic and Cenozoic oceans. 34
Here, we present a detailed δ13Ccarbonate and δ34S (sulfate and pyrite) record from the 35
Middle-Upper Cambrian Port au Port Group, western Newfoundland, Canada. These sediments 36
record two intervals marked by C isotope excursions, including a ~4‰ positive δ13Ccarbonate 37
excursion that has been identified in a number of localities around the world (the SPICE event, 38
Saltzman et al., 2004). Because of this, the Port au Port succession provides an unusual 39
opportunity to explore the relationship between the marine geochemical cycles of C and S during 40
a time interval when the characteristic response times of the DIC and sulfate reservoirs may have 41
been more closely balanced than they are at present. Finally, insights gleaned from the 42
relationship between the C and S cycles during the Cambrian Period may provide an important 43
environmental context for biological changes during this interval, including the 40 m.y. paucity 44
of robust skeletonized fossils in Middle Cambrian through Early Ordovician rocks (e.g., Knoll, 45
2003; Rowland and Shapiro, 2002; Pruss et al., in review). 46

3
47
2. Background 48
2.1 Geochemical cycles of C and S: Mass balance and isotopic considerations 49
The δ13C and δ34S composition of seawater DIC and sulfate, respectively, are dictated by 50
the mass and isotopic compositions of C and S fluxes into and out of the ocean. For C, the 51
primary input is riverine delivery of DIC resulting from the weathering of crustal rocks. C is 52
removed from marine waters through photosynthesis and subsequent OC burial, as well as by 53
carbonate precipitation and deposition. Analogous to the C cycle, the primary input of S (as 54
sulfate) to seawater is riverine delivery resulting from the oxidative weathering of sulfides and 55
dissolution of evaporites (principally calcium sulfates) and carbonates (e.g., CAS) on land. 56
Sulfate is removed from the ocean via evaporite and carbonate deposition, as well as by bacterial 57
sulfate reduction (BSR) and associated pyrite deposition. 58
Balanced changes in the burial of OC and pyrite have played an important role in 59
regulating atmospheric oxygen concentrations through geologic time (Holland, 1973, 1984; 60
Berner and Raiswell, 1983; Kump and Garrels, 1986; Berner 1987). BSR participates in, and so 61
links, the geochemical cycles of C and S. In the presence of oxygen, OC, produced via 62
photosynthesis in the water column, sinks and is respired aerobically. Once oxygen is 63
consumed, either within the water column or sediments, some microbes decompose OC via BSR, 64
reducing sulfate to sulfide that may react with available iron (Fe) to form sedimentary pyrite. 65
Therefore, increased delivery of OC increases oxygen demand, leading to increased BSR, sulfide 66
production and pyrite formation (Berner and Raiswell, 1983). 67
A kinetic isotope effect accompanies the production of both OC and sulfide during 68
photosynthesis and BSR, respectively. The light isotope (i.e., 12C and 32S) is preferentially 69

4
removed from the terminal electron acceptor (i.e., CO2 and sulfate) during the production of both 70
OC and sulfide. Within this context, a global increase in OC production and supply to marine 71
sediments should result in increased production of pyrite and, therefore, a positive shift in the C 72
and S isotope compositions of the marine DIC and sulfate reservoirs, respectively. However, as 73
noted above, the characteristic response times of DIC and sulfate strongly influence the rate and 74
magnitude at which the isotope composition of each reservoir can shift. 75
Here, reservoir- and time-dependent mass balance equations for δ13Ccarbonate and δ34Ssulfate 76
(adopted from Kump and Arthur, 1999; Kurtz et al., 2003 and Kah et al., 2004) are used to 77
illustrate how the individual residence times of marine DIC and sulfate influence the degree to 78
which perturbations to the coupled geochemical cycles of C and S affect the rate and magnitude 79
of isotopic change. The C isotope composition of carbonate deposition (δ13Ccarbonate) is assumed 80
to reflect the δ13C of the DIC pool from which it precipitated and is represented by: 81
d
dtδ13Ccarbonate =
Fwc(δwc −δ13Ccarbonate)−ForgΔ
13C
Mc
(1) 82
where Fwc is the total input flux of C to the ocean-atmosphere system from weathering, δwc is the 83
isotope composition of that weathering component, Forg represents the amount of OC buried, 84
Δ13C represents the average isotope fractionation incurred during the production of OC, and Mc 85
is the mass of dissolved carbonate in the ocean. Similarly, the S isotope composition of sulfate 86
deposition (δ34Ssulfate) is assumed to reflect the δ34S of the seawater from which it precipitated 87
and is represented by: 88
d
dtδ34Ssulfate =
Fws (δws −δ34Ssulfate)−FpyΔ
34S
Ms
(2) 89

5
where Fws is the total input flux of S to the ocean-atmosphere system from weathering, δws is the 90
isotope composition of that weathering component, Fpy is the total amount of pyrite buried and 91
Δ34S is the average net isotope fractionation between seawater sulfate and pyrite resulting from 92
the processes (e.g., BSR, disproportionation of intermediate S species, sulfide oxidation) 93
associated with iron sulfide formation, and Ms is the mass of sulfate in the ocean. Note, sulfate 94
removed from the oceans via calcium sulfate precipitation in evaporite settings involves minimal 95
isotopic fractionation (0-2.4‰; Ault and Kulp, 1959; Raab and Spiro, 1991) and is excluded 96
from this model. However, large-scale changes in evaporite deposition might significantly 97
influence oceanic δ34Ssulfate. 98
Here, we consider the response of δ13Ccarbonate and δ34Ssulfate to a 50% increase in Forg and 99
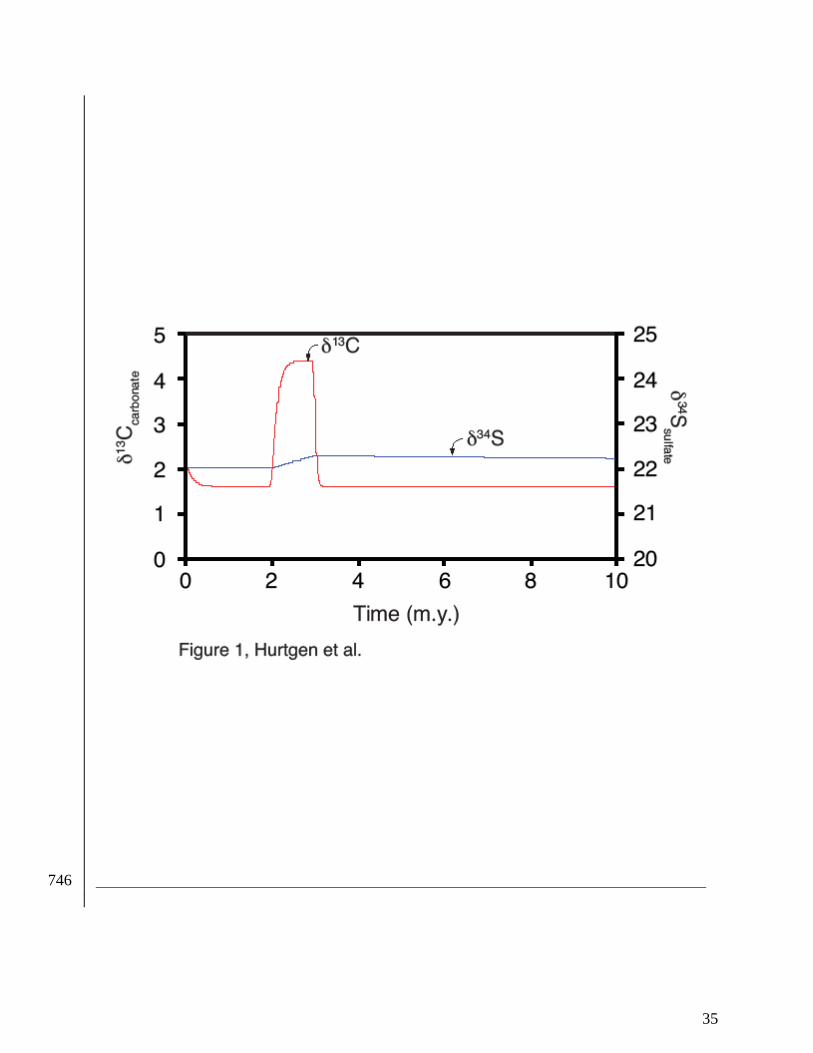
Fpy for 1 m.y. (from 2 to 3 m.y. in Fig. 1). Initial conditions were constructed using equations (1) 100
and (2) and mass, fluxes and isotope compositions were adopted from Kurtz et al. (2003) and 101
approximate the Cenozoic C and S cycles at steady state (Table 1). The C and S cycles are 102
linked using a constant C/S burial ratio of 7.7 (Berner and Raiswell, 1983; Raiswell and Berner, 103
1985). The 50% increase in Forg and Fpy manifests as a 2.8‰ positive excursion in δ13C but a 104
negligible (0.3‰) shift in δ34Ssulfate. Of course, this is a simplified model of a more complex 105
system, but it illustrates the importance of concentration and residence time when interpreting 106
perturbations to the coupled C and S cycles at various times in Earth history. 107
108
3. Geologic Setting 109
3.1 The Port au Port Group, Newfoundland, Canada 110
The Middle and Upper Cambrian Port au Port Group is exposed on the south-facing shore 111
of the Port au Port peninsula in western Newfoundland. The succession records Sauk II and 112

6
Sauk III transgression and was deposited autochthonously on the southeastern margin of 113
equatorial Laurentia in a subtidal-peritidal setting on a mixed carbonate-clastic platform (Chow 114
and James, 1987; Cowan and James, 1993). 115
The basal unit of the Port au Port Group, the March Point Formation (~35 m), 116
disconformably overlies siliciclastic rocks of the Lower Cambrian Hawke Bay Formation. 117
March Point lithologies comprise interbedded glauconitic and phosphatic silicilcastics, along 118
with thinly-bedded nodular limestones; they include the deepest water facies preserved in the 119
Middle and Upper Cambrian succession, with some units likely deposited below storm wave 120
base. The overlying Cape Ann Member (~15 m) of the Petit Jardin Formation contains olive-121
colored shales as well as a few thrombolitic carbonate horizons. The overlying Campbell's 122
Member (~100 m) consists largely of oolites, microbial build-ups, and fine grained carbonate 123
lithologies. The succeeding Big Cove Member, in turn, is a 40-m-thick succession of mostly 124
olive and gray shales with thin limestone beds. The shales are replaced by oolites and microbial 125
build-ups in the overlying Felix Member (50 m). The Man O' War Member (55 m) is 126
lithologically similar to the underlying Felix Member but contains a greater proportion of 127
siliciclastic sediments. Microbial build-ups are common features throughout the March Point 128
and Petit Jardin formations but skeletal limestones are rare. 129
The March Point Formation preserves a Bolaspidella trilobite fauna, which indicates an 130
upper Middle Cambrian age. The SPICE event (>4‰ δ13Ccarbonate positive excursion) has 131
previously been identified in this particular section by Saltzman et al. (2004) and is 132
biostratigraphically constrained to the Aphelaspis, Dunderbergia, and Elvinia trilobite zones 133
(Cowan and James, 1993; Saltzman et al., 2004), which are Upper Cambrian (Steptoean) in age. 134
Absolute age dates are absent from Port au Port strata, but given these broad biostratigraphic and 135

7
chemostratigraphic constraints, the section of the Port au Port Group addressed in this study was, 136
in all probability, deposited over 5-10 million years. 137
138
4. Methods 139
Carbonate-associated sulfate (CAS) and pyrite were extracted using the techniques of 140
Burdett et al. (1989) and Canfield et al. (1986), respectively. S isotope results are reported as per 141
mil (‰) deviations from the S isotope composition of Vienna Canon Diablo Troilite (VCDT), 142
using the conventional delta (δ34S) notation; results were generally reproducible to within ± 143
0.2‰. C isotope ratios are expressed as ‰ deviations relative to VPDB in the standard delta 144
(δ13C) notation. Average external precision is estimated to be better than 0.1‰. S and C isotope 145
data are provided in Supplementary Tables 1 and 2, respectively. 146
147
5. Results 148
Carbonate C isotope values (δ13C) shift systematically through the section, with values 149
ranging from ~-4 to 2‰ (Fig. 2). Here, we focus on two intervals marked by sizable C isotope 150
excursions. The first encompasses the March Point Formation and the Cape Ann and lower 151
Campbell’s members of the Petit Jardin Formation. δ13C increases from a low of ~-2.5‰ at the 152
base of the section to an average of -0.5‰ over approximately 30 m, drops to -4‰ over the next 153
30 m (in the Cape Ann Member) and then rises again to an average of ~-0.5‰. δ34Ssulfate follows 154
a similar although more exaggerated pattern, with values starting at ~30‰, falling to 15‰ and 155
then increasing to values >40‰ (Fig. 2). The initial drop in δ34Ssulfate precedes the decline in 156
δ13C by ~25 m. δ34Spyrite generally mimics δ34Ssulfate through this interval; values begin around 157

8
15‰, decline to around 0‰ (one value reaches -12‰) before increasing to >25‰. Calculated 158
Δ34S (δ34Ssulfate - δ34Spyrite) values through this interval range from 6 to 24‰. 159
The second interval includes the upper portion of the Big Cove Member, and the Felix 160
and the Man O’ War members of the Petit Jardin Formation. δ13C begins at -1‰, falls steadily 161
over the next 35 m to -2‰, increases to nearly 2‰ over the next 30 m and then shifts to -3‰ 162
over 25 m. This positive excursion, termed the SPICE event, has been recognized in time-163
equivalent sections globally, although absolute values vary from location to location (e.g., 164
Saltzman et al., 2000, 2004). 165
In the upper Big Cove Member, δ34Ssulfate drops sharply from >40 to 27‰ with virtually 166
no change in δ13C. Furthermore, δ34Ssulfate values do not shift to markedly heavier values through 167
the SPICE event, but do fall at the upper end of the C isotope excursion. The δ34Spyrite record is 168
sparse through this interval (limited pyrite availability) but shows values that range from 0 to 169
9‰. Δ34S values begin >40‰ in the upper Big Cove Member and fall to ~20‰ in the Man O’ 170
War Member. 171
While negative δ13Ccarbonate excursions in particular appear to correspond to lithologic 172
transitions in the Port au Port strata, the relationship between these two variables is not 173
systematic. For example, one negative δ13C excursion is associated with relatively shallow 174
deposition within the upper Campbell’s Member while another is linked with the deeper water 175
(relative to the upper Campbell’s Member) facies of the Cape Ann Member. 176
The large variations in δ34Ssulfate evident in parts of the Port au Port strata warrant 177
consideration of secondary processes that could affect the S isotope composition of CAS. 178
δ18Ocarbonate is a useful indicator of geochemical alteration as 18O-depleted signatures are often 179
attributed to post-depositional alteration resulting from isotopic exchange with meteoric fluids 180

9
(e.g., Given and Lohmann, 1985). The absence of any correlation between δ34SCAS and 181
δ18Ocarbonate suggests that post-depositional processes did not alter the S isotope composition of 182
CAS substantially. Furthermore, to a first order, δ34Spyrite is dictated by seawater sulfate δ34S. 183
Therefore, the large and sympathetic shits in δ34Ssulfate and δ34Spyrite (particularly in the lower part 184
of the section) supports the contention that δ34Ssulfate is recording a primary seawater signal. 185
186
6. Discussion 187
6.1 Ediacaran and Cambrian S isotopes and marine sulfate levels 188
Several lines of evidence suggest that an Ediacaran increase in the oxidation state of the 189
ocean-atmosphere system led, perhaps for the first time in Earth history, to elevated seawater 190
sulfate concentrations. This evidence includes, but is not limited to, a shift in the abundance of 191
redox-sensitive elements (Canfield et al., 2007; Scott et al., 2008) and a substantial rise in the S 192
isotope difference between seawater sulfate and contemporaneously deposited sedimentary 193
pyrite (Δ34S) (Canfield and Teske, 1996; Hurtgen et al., 2005; Fike et al., 2006; Halverson and 194
Hurtgen, 2007; McFadden et al., 2008). Importantly, the extent of fractionation between 195
seawater sulfate and co-occurring sedimentary pyrite is controlled in large part by sulfate 196
availability. And, the amount of oxygen in the ocean atmosphere system is believed to exert a 197
primary control on marine sulfate levels because the primary source of seawater sulfate is 198
riverine input derived in part from the oxidative weathering of pyrite (e.g., Canfield, 2004). This 199
increase in Δ34S (and by inference an increase in Earth surface oxygen levels) is evident in 200
Figure 3 and marked by a substantial decline in δ34Spyrite through the second half of the Ediacaran 201
Period, as recorded in sediments from Oman (Fike et al. 2006). Δ34S decreases at the very end of 202
the Ediacaran period (Fike and Grotzinger, 2008) before increasing again in the earliest 203

10
Cambrian. [Note that this composite δ34S (sulfate and pyrite) and δ13C record does not include 204
all available data for the terminal Neoproterozoic due to poor age constraints for some samples.] 205
Sulfate levels may have dropped substantially during Early to Middle Cambrian time as 206
suggested by the chemical composition of fluid inclusions in halite (Horita et al., 2002; 207
Lowenstein et al., 2001, 2003; Brennan et al. 2004; Petrychenko et al., 2005) and 34S-enriched 208
CAS (Kampschulte and Strauss, 2004; Gill et al., 2007), pyrite (Strauss, 1999) and francolite-209
bound sulfate (Hough et al., 2006) in Early to Middle Cambrian sediments. The recognition of a 210
marked decrease in Δ34S would corroborate the notion that marine sulfate levels fell at this time 211
(see discussion below). However, as Figure 3 illustrates, it is difficult to evaluate Δ34S through 212
this interval due to a lack of previously published δ34Ssulfate and δ34Spyrite generated in tandem 213
from the same stratigraphic section. 214
215
6.2 δ34Ssulfate, δ34Spyrite, Δ34S and Middle to Late Cambrian sulfate availability 216
The S isotope results from this study support the fluid inclusion (Horita et al., 2002; 217
Lowenstein et al., 2001, 2003; Brennan et al. 2004; Petrychenko et al., 2005) and previous S 218
isotope work (Strauss, 1999; Kampschulte and Strauss, 2004; Hough et al., 2006; Gill et al., 219
2007) and suggest that sulfate concentrations in the Middle to Late Cambrian ocean were low 220
relative to terminal Neoproterozoic and modern values. The large and systematic shifts in 221
δ34Ssulfate (>25‰) occur over relatively short geological timescales (<~2 m.y.; based on the 222
assumption that the entire section of Port au Port Group addressed in this study was deposited 223
over 5 to 10 million years) and are consistent with a seawater sulfate reservoir that was sensitive 224
to relatively short-term environmental perturbations (e.g., changes in pyrite burial and/or Δ34S). 225
Moreover, δ34Spyrite shifts in unison with δ34Ssulfate through much of the section, but especially 226

11
through the March Point Formation and Cape Ann and Campbell’s members of the Petit Jardin 227
Formation. To a first order, δ34Spyrite is dictated by seawater sulfate δ34S and sympathetic 228
changes in δ34Ssulfate and δ34Spyrite supports the contention that δ34Ssulfate is changing over 229
relatively short stratigraphic distances (at least in this particular setting). 230
The S isotope difference between marine sulfate and contemporaneously deposited 231
sedimentary pyrite (Δ34S) provides further evidence for lower sulfate levels during this time 232
interval. The kinetic isotope effect associated with BSR, documented through experimental 233
studies (i.e., Detmers et al., 2001) and in natural systems (Habicht and Canfield, 1997; Habicht 234
and Canfield, 2001), leads to a fractionation of 2-46‰. In large part, the magnitude of this 235
fractionation is controlled by sulfate availability; larger fractionations are typically expressed 236
under non-limiting sulfate concentrations where microbes have a large reservoir of sulfate that 237
allows them to dissimilate 32S preferentially. Smaller fractionations occur when sulfate is 238
limiting because sulfate-reducing microbes can alter the local sulfate reservoir (water column or 239
sediments) by extracting 32S in the production of sulfide, thereby increasing the δ34S composition 240
of residual sulfate and subsequently generated pyrite. Moreover, the capacity of sulfate-reducing 241
microbes to dissimilate 32S in preference to 34S decreases as sulfate concentrations fall below 242
~50-200 µM (Habicht et al., 2002). Therefore, the overall effect of sulfate limitation is lower 243
Δ34S. 244
In order to achieve Δ34S >46‰, BSR must be accompanied by fractionations incurred 245
during the disproportionation of intermediate S species (e.g., S0, S2O32-; Jørgensen, 1990) that 246
results in sulfide depleted in 34S relative to the initial reactant by an additional 7-20‰ (Canfield 247
and Thamdrup, 1994; Cypionka et al., 1998; Habicht et al., 1998; Böttcher et al., 2001). 248

12
Through repeated sulfide oxidation and disproportionation cycles, sulfide isotope values can 249
become depleted relative to sulfate by significantly more than 46‰. 250
While variable, Port au Port Group Δ34S values average 23‰; all but three of the values 251
fall between 15 and 30‰ and none exceed 46‰. This average is both lower than the assumed 252
modern average value (35‰; Garrels and Lerman, 1984) and average values published for the 253
latest Neoproterozoic (~35‰; Fike et al., 2006). However, <46‰ values do not necessarily 254
indicate that S disproportionation was absent (i.e., Hurtgen et al., 2005, Johnston et al. 2005); 255
rather, they may relate to the efficiency with which sulfide is removed by reaction with Fe2+, 256
itself a function of seawater PO2 (Hurtgen et al., 2005). It is important to note that the S isotope 257
composition of sedimentary pyrite is strongly influenced by local conditions and therefore these 258
modest Δ34S values are not necessarily representative of a Middle to Late Cambrian average. 259
However, the low Δ34S values in combination with the rapid shifts in δ34Ssulfate and δ34Spyrite over 260
relatively short stratigraphic distances strongly support the notion that this particular basin 261
contained low sulfate concentrations. 262
263
6.3 Relationship between δ13C, δ34S, and sulfate concentrations 264
Very generally, δ13C and δ34Ssulfate are positively correlated through the Port au Port 265
strata, which suggests that the residence times of DIC and sulfate may have been roughly 266
comparable, at least in this basin. These positively correlated C and S isotope shifts may have 267
been driven by changes in OC burial and subsequent sympathetic changes in pyrite burial. 268
However, two deviations from the positive correlation exist and suggest, not surprisingly, that 269
the relationship between these two elemental cycles is more complex than outlined above. 270

13
The most obvious deviation occurs during the SPICE event, where the ~4‰ positive C 271
isotope excursion that straddles the Felix and Man O’ War members is not accompanied by a 272
significant shift in δ34Ssulfate (or δ34Spyrite). While only five δ34Ssulfate values were determined 273
through the SPICE event, it is important to note that one sample is coincident with the peak of 274
the δ13C excursion. This pattern is very similar to that generated by the model we used to 275
ascertain changes in the coupled C and S system for the Cenozoic (Fig. 1); it would seem to 276
suggest that the residence time of sulfate in the ocean was much greater than that of DIC and 277
perhaps not drastically different from the modern ocean. However, the rapid δ34Ssulfate shifts that 278
are present throughout this section (Fig. 2) are consistent with a sulfate reservoir more sensitive 279
to isotopic modification and it is unlikely that sulfate levels would increase through the SPICE 280
event given that the positive δ13C excursion is thought to have been driven by an increase in OC 281
burial (Saltzman et al., 2004), providing more fuel for BSR. Moreover, in a separate section of 282
equivalent age deposited in an epicontinental sea elsewhere in Laurentia (Nevada), δ34Ssulfate does 283
exhibit a positive excursion (>10‰) through the SPICE interval (Gill et al., 2007) and pre-284
SPICE event δ13C and δ34S are elevated relative to Newfoundland strata. These contrasting 285
datasets from central and southern Laurentia suggest that the ocean was heterogeneous with 286
respect to δ34Ssulfate (and δ13C) and so further supports the contention that Cambrian seawater 287
sulfate concentrations were low relative to modern values. 288
If marine sulfate concentrations were substantially lower in the Cambrian, why is it that 289
positive δ13C excursions are recognized globally and δ34Ssulfate excursions are not? One possible 290
explanation is that the residence time of seawater sulfate through this interval was significantly 291
lower than that of DIC, allowing for greater δ34Ssulfate heterogeneity throughout the world oceans. 292
If we assume the residence time of DIC approximated modern values (~100 k.y.), and S fluxes 293

14
into and out of the ocean were similar to Cenozoic estimates (~1.5 x 10¹⁸ moles/m.y.; Kurtz et 294
al., 2003), then sulfate levels must have been substantially < ~100 µM. If S fluxes into and out 295
of the ocean scaled proportionally with the marine sulfate reservoir and were lower during the 296
Cambrian, sulfate concentrations would have been even lower. Conversely, if the residence time 297
of DIC in the Cambrian ocean were higher than modern values (e.g., Berner, 2006), sulfate levels 298
could have been higher. For example, if the residence time of DIC in the Cambrian ocean was 299
500 k.y. (~5x modern levels) and S fluxes into and out of the ocean were similar to Cenozoic 300
estimates, then sulfate levels must have been < 525 µM in order for the residence time of sulfate 301
to be less than the residence time of DIC. Again, if S fluxes into and out of the ocean scaled 302
proportionally with sulfate levels and were lower, sulfate concentrations would have been 303
substantially < 525 µM. These sulfate concentrations are well below those estimated from fluid 304
inclusions encased in Cambrian halite (e.g., ~5 - 12 mM; Horita et al., 2002; Lowenstein et al., 305
2003, Brennan et al. 2004, Petrychenko et al., 2005). However, given the number of unknowns 306
(e.g., DIC residence time, S fluxes into and out of the ocean) we cannot rule out the possibility 307
that the residence time of seawater sulfate was less than the residence time of DIC during this 308
time. 309
Alternatively, the apparent heterogeneity in δ34Ssulfate may indicate that one or both of 310
these environments (Newfoundland and/or Nevada) were somewhat restricted and not fully 311
tracking the S isotope composition of the global ocean. If so, however, why is it that sediments 312
from both localities record the δ13C excursion across the SPICE event but the δ34Ssulfate excursion 313
is expressed only in Nevada? One explanation may be linked to carbon exchange between 314
marine surface waters and the atmosphere. Over relatively short geologic timescales (< 104 y.r.), 315
the δ13C composition of bulk atmospheric CO2 is governed by carbon exchange with the 316

15
terrestrial biosphere and DIC in marine surface waters (e.g., Indermühle et al. 1999). Since 317
vascular land plants had not evolved in the Cambrian (e.g., Edwards 1979), the C isotope 318
composition of atmospheric CO2 would have largely been dictated by equilibrium isotope 319
fractionations associated with air-sea gas exchange between the atmosphere and ocean (Mook, 320
1986). If δ13CDIC of marine surface waters were driven to substantially higher values for 321
hundreds of thousands of years—as they were during the SPICE event (Saltzman et al. 2004)—322
the δ13C composition of atmospheric CO2 should have also increased by a corresponding, albeit 323
offset, amount. This 13C-enriched atmospheric CO2 could then influence the surface waters of 324
basins not well connected to the open ocean and essentially transfer the δ13Ccarbonate excursion 325
generated in the open ocean to more restricted settings. The absolute δ13C values of carbonates 326
surrounding the SPICE event in Newfoundland and Nevada are not the same but the magnitude 327
of the C isotope excursion is remarkably similar (~4‰). No similar mechanism is known for 328
expressing δ34Ssulfate excursions generated in the open ocean to more restricted settings. 329
However, in order for the C isotope composition of DIC in an isolated basin to be buffered to the 330
atmosphere, the amount of C residing as DIC in the restricted basin must have been substantially 331
lower than the amount of CO2 in the Cambrian atmosphere. Of course, neither the size of the 332
DIC reservoir nor Cambrian pCO2 levels is known, and therefore, it is difficult to evaluate the 333
reasonableness of this explanation. 334
The second instance where C and S isotopes appear to deviate from positively correlated 335
changes is in the March Point Formation where a 15 ‰ decrease in δ34Ssulfate (and δ34Spyrite) 336
precedes a ~4‰ fall in δ13C (Fig. 2). This is an intriguing result and again may indicate that 337
sulfate levels were sufficiently low in this basin and that the characteristic response time for 338
δ34Ssulfate < δ13CDIC. In other words, a decrease in OC burial may have influenced δ34Ssulfate more 339

16
rapidly than δ13C by reducing pyrite burial rates. While time constraints are poor through this 340
interval, the lag time between the initial δ34S drop and δ13C fall is represented by ~25 m of 341
section and likely represents too much time (>104 y.r.) for this to be reasonable if the residence 342
time of DIC was between 100 and 500 k.y. Alternatively, the δ34Ssulfate decline may not have 343
been directly and/or immediately linked to perturbations of the C cycle. For example, δ34Ssulfate 344
variations are typically attributed to changes in pyrite burial rates facilitated by changes in OC 345
availability. However, in the modern ocean, pyrite burial efficiency is quite low; as much as 346
95% of sulfide generated during BSR is reoxidized to sulfate and intermediate S species 347
(Jørgensen et al., 1990). Within this context, pyrite burial rates may oscillate substantially if the 348
percentage of BSR-generated sulfide that is oxidized to sulfate and intermediate S species 349
varies—even if global rates of BSR remain constant. 350
Turchyn and Schrag (2004) argued that fluctuations in the oxygen isotope composition of 351
seawater sulfate over the last 10 m.y. can be attributed to changes in the extent and means by 352
which sulfide has been reoxidized on continental margins. These high frequency changes in 353
pyrite burial efficiency have had little to no effect on δ34Ssulfate over the last 10 m.y. due to the 354
large residence time of sulfate over this time interval (e.g., Paytan et al., 1998). However, if the 355
Cambrian ocean had much lower sulfate concentrations, changes in the balance between sulfide 356
production (via BSR) and reoxidation could have affected δ34Ssulfate considerably on shorter (<1 357
m.y.) geological timescales. An important control on the extent of sulfide reoxidation is oxygen 358
availability in the marine system and it has been argued that globally extensive black shale 359
deposition in the Middle and Upper Cambrian resulted from poor ventilation of the deep oceans 360
during a greenhouse climate (Berry and Wilde, 1978). The δ34S drop that proceeds the δ13C fall 361
in the March Point Formation may have been induced by changes in pyrite burial efficiency 362

17
facilitated by subtle changes in Cambrian marine redox that influenced the S cycle before (and/or 363
to a greater extent than) the C cycle. This discussion is expanded below. More specifically, we 364
explore how oceanic redox might influence the C/S burial ratio and Δ34S on a global scale in a 365
way that would facilitate larger δ34Ssulfate excursions per mole of OC burial. 366
367
6.4 Modeling insights 368
Here, we utilize the simple reservoir- and time-dependent mass balance equations for 369
δ13C and δ34Ssulfate (equations 1 and 2) to understand better the relationship between sulfate 370
residence time and δ34Ssulfate response to perturbations to the Cambrian C cycle. More 371
specifically, how low must sulfate concentrations have been (assuming Cenozoic inputs and 372
outputs of S to and from the marine system) to generate the >10‰ δ34Ssulfate shifts expressed in 373
the Cambrian data presented in Figure 2 and yet remain consistent with the modest, but not 374
negligible, Δ34S values? In the following simulations, we assume the >10‰ δ34Ssulfate variations 375
were global in extent; however, as already discussed, it is possible that the Newfoundland δ34S 376
signal records local perturbations not necessarily linked to the global ocean. Nonetheless, this 377
exercise highlights important aspects of the relationships among δ13C, δ34S, and Δ34S in a low 378
sulfate ocean. 379
The sensitivity of δ34Ssulfate to a stepwise, 50% increase in Forg and Fpy for 1 m.y. (during 380
the interval 2 to 3 m.y., represented by gray band) is explored under varying initial sulfate 381
concentrations (Fig. 4). As earlier, initial conditions were constructed using mass, flux and 382
isotope compositions believed to represent Cenozoic C and S cycles (Kurtz et al., 2003). 383
However, here we prescribe lower initial sulfate levels (0.28 mM, 1.9 mM and 3.5 mM) and a 384
lower Δ34S (25‰ rather than 35‰) that approximates the average recorded in Port Au Port 385

18
Group sediments and is more consistent with a low sulfate ocean. The reduced Δ34S forces a 386
lower steady state δ34Ssulfate value (17.7‰) but more importantly it reduces the magnitude of 387
δ34Ssulfate excursions generated per mole of OC buried. The C and S cycles are again linked using 388
a constant C/S burial ratio of 7.7. [Raiswell and Berner (1986) challenged constant C/S and we 389
explore the consequences of relaxing this assumption below.] Although not shown in Figure 4, 390
the 50% increase in Forg forces a 2.8‰ positive excursion in δ13C as shown in Figure 1. 391
The model results indicate that even at very low initial sulfate concentrations (280 µM, τ 392
= 0.27 m.y.), a 50% increase in OC and pyrite burial prompts only an ~5‰ δ34Ssulfate excursion. 393
In three of the four runs, Δ34S was held constant at 25‰. However, in run 1a (Fig. 4), we 394
include a stepwise decrease in Δ34S from 25 to 15‰ once sulfate concentrations drop to < 200 395
µM (e.g., Habicht et al., 2002). This forces δ34Ssulfate to decrease abruptly within the OC burial 396
event and ultimately bring about an ~8‰ decline over 1 m.y. This underscores an interesting 397
aspect of S cycling in low sulfate oceans: the sensitivity of Δ34S to fluctuating ocean chemistries 398
and its influence on the S isotope evolution of seawater sulfate. 399
Previous work suggests that the Middle to Upper Cambrian ocean may have been more 400
susceptible to at least regional anoxia. Berry and Wilde (1978) argued that extensive black shale 401
deposition in the Cambrian resulted from poor ventilation of the deep oceans due to minimal sea 402
ice formation at high latitudes. Similarly, Saltzman (2005) suggested that extended (>107 y.r.) 403
periods of relative δ13C stability found in much of the Middle and Upper Cambrian resulted from 404
nitrogen limitation in a greenhouse climate that promoted reduced O2 solubility in marine waters 405
and increased denitrification as result of water column anoxia. Furthermore, Raiswell and 406
Berner (1986) found that C/S ratios in Cambrian aged marine shales were lower (~0.5) than 407

19
those recorded during any other period during the Phanerozoic (modern = 2.8). They attributed 408
reduced C/S to euxinic conditions. 409
If the chemocline were raised into the water column during times of enhanced OC 410
production in the Cambrian, syngenetic (water column) pyrite formation may have occurred. 411
This has important implications for evaluating the relationship between the Cambrian C and S 412
isotope record for two reasons. First, sediments deposited under euxinic conditions are 413
characterized by reduced C/S as result of syngenetic pyrite formation that is decoupled from the 414
amount of OC buried in the sediments (Leventhal, 1983; Raiswell and Berner, 1985). Under 415
these circumstances, Fe is often the limiting factor in pyrite formation rather than OC (Raiswell 416
and Berner, 1985). Second, if a significant fraction of pyrite ultimately buried in the sediments 417
formed syngenetically, Δ34S values may have shifted to significantly higher values. This is 418
because sulfate-reducing bacteria have a much larger reservoir of sulfate from which to 419
dissimilate the lighter 32S versus 34S (e.g., Lyons, 1997; the effect is seen in mid-Proterozoic S 420
isotope data of Shen et al., 2003). Within this context, if the Cambrian ocean was susceptible to 421
periods of euxinia, C/S ratios likely decreased and Δ34S may have increased (assuming sulfate 422
levels were not brought too low during the event), permitting much larger S isotope shifts in 423
seawater sulfate per mole of C buried. 424
As earlier, the sensitivity of δ34Ssulfate to a stepwise, 50% increase in Forg for 1 m.y. is 425
explored under varying initial sulfate concentrations (Fig. 5). However, in order to account for 426
an increase in syngenetic pyrite formation resulting from anoxia, Fpy increases 100% through the 427
OC burial event and Δ34S increases from 25 to 30‰. As a result, larger δ34Ssulfate excursions are 428
expressed per mole of OC buried. A ~13‰ δ34Ssulfate increase is generated over 1 m.y. when 429
initial sulfate levels are set at 700 µM (τ = 0.67 m.y.). 430

20
Given these preliminary modeling results, it appears that > 10‰ global δ34Ssulfate shifts 431
may be generated by OC burial events (Forg increases by 50%) at sulfate levels approaching 1 432
mM if C/S and Δ34S are allowed to fluctuate as a result of water column anoxia. Of course, this 433
is a crude estimate that assumes we have some control on the residence time of DIC in the 434
Cambrian as well as S fluxes into and out of the ocean—which we do not. In fact, if S fluxes 435
into and out of the ocean were scaled proportionally with the marine sulfate reservoir and were 436
lower in the Cambrian, the residence time of sulfate would have been higher (similar to Cenozoic 437
values), making it more difficult to generate > 10‰ δ34Ssulfate excursions (e.g., Fig. 1). We are 438
not necessarily advocating a particular sulfate concentration for Late Cambrian seawater. 439
Rather, we are suggesting that sulfate levels were low relative to modern values, that decreased 440
residence time for S and, possibly, increased residence time for C are necessary to understand the 441
relationships between C and S isotopes, and perhaps most importantly, basinal anoxia must be 442
invoked in the models to reproduce the geochemical signatures preserved in the Port au Port 443
strata. Furthermore, the interpretations developed in this study are only based on two sections in 444
relatively shallow seas bordering Laurentia (Newfoundland and Nevada; Gill et al., 2007). 445
Future work should focus on reconstructing the temporal and spatial evolution of δ13C and δ34S 446
(sulfate and pyrite) through multiple sections of early Paleozoic strata in order to constrain the 447
mechanistic details underpinning the geochemical evolution of the C and S cycles. Nonetheless, 448
these two data sets, coupled with simple modeling results, do highlight some interesting 449
dynamics relating OC burial, sulfate concentrations, ocean redox, Δ34S and ultimately δ34Ssulfate. 450
451
6.5 Relationships among sulfate levels, atmospheric O2 and Cambrian life 452

21
The Early Paleozoic represents one of the most dynamic times in the history of complex 453
life. Within the first 25 million years of the Cambrian Period, animals with mineralized 454
skeletons diversified and the first metazoan reefs were established. This major diversification, 455
known as the Cambrian Explosion, was disrupted by major extinctions near the end of the Early 456
Cambrian (e.g., Zhuravlev and Wood, 1996). These extinctions decimated the archaeocyathids 457
and other massively calcified reef builders and also marked the last appearances of many so-458
called small shelly fossils (but see Porter, 2004, for discussion of taphonomic bias). For the 459
ensuing ~40 million years of the Middle to Late Cambrian and earliest Ordovician, the 460
abundance of skeletons was low in marine carbonates (Li and Droser, 1997, 1999), animal reefs 461
were absent (Rowland and Shapiro, 2002) and turnover rates were unusually high (Bambach et 462
al., 2004). What makes this interval enigmatic is that it postdates the origins of both the major 463
animal body plans and the evolution of calcified skeletons within many of them, but predates the 464
major Ordovician radiation that established skeletons as major sinks for calcium carbonate. 465
If an increase in the oxidation state of the coupled ocean-atmosphere system paved the 466
way for the evolution and radiation of macroscopic Metazoa in the Ediacaran (e.g., Knoll and 467
Carroll, 1999; Canfield et al., 2007; Fike et al., 2006), it is reasonable to ask if changes in marine 468
redox profiles during the Early to Middle Cambrian and into the Ordovician governed the demise 469
and delayed recovery of skeletonized animals (e.g., Zhuravlev and Wood, 1996; Pruss et 470
al.,2007). Several lines of evidence suggest that marine waters were more susceptible to 471
episodes of anoxia during this time, including extensive black shale deposition (Berry and Wilde, 472
1978), increased seawater temperatures and therefore lower O2 solubility (Berry and Wilde, 473
1978; Saltzman 2005; Trotter et al., 2008), and reduced C/S in Cambro-Ordovician marine shales 474
(Raiswell and Berner, 1986). Furthermore, the C and S isotope models presented in this study 475

22
indicate that fluctuating water column anoxia in a low sulfate ocean generates the largest δ34S 476
excursions per mole of OC produced/buried consistent with the δ13C and δ34Ssulfate shifts 477
expressed in the Port au Port carbonates of Newfoundland. Collectively, these results suggest 478
that reduced oxygen levels in subsurface water masses may have played a significant role in late 479
Early Cambrian extinction and the delayed recovery of animal reefs and skeletonized animals, 480
arguably by decreasing the saturation state of surface waters with respect to carbonate minerals 481
(Fischer et al. 2007, Higgins and Schrag, 2007; see Pruss et al., 2007, for explicit discussion of 482
Cambro-Ordovician oceans). Continuing geochemical research will help to determine the 483
environmental context of major events in both Cambrian and Ordovician skeletal evolution. 484
485
7. Conclusions 486
A significant increase in Δ34S, as recorded in terminal Neoproterozoic rocks, suggests 487
that an increase in the oxidation state of the ocean-atmosphere system facilitated an increase in 488
seawater sulfate concentrations just prior to the appearance of the Ediacaran Fauna (Fike et al., 489
2006). Sulfate levels, however, may have dropped substantially during the Early to Middle 490
Cambrian (Horita et al., 2002; Lowenstein et al., 2001, 2003; Brennan et al., 2004; Kampschulte 491
and Strauss, 2004; Petrychenko et al., 2005; Hough et al., 2006; Gill et al., 2007). S isotope 492
results presented in this study support these findings; reduced Δ34S, large δ34Ssulfate shifts over 493
relatively short stratigraphic intervals, and a general positive coupling between δ13Ccarbonate and 494
δ34Ssulfate all suggest that the Middle to Late Cambrian sulfate reservoir was more sensitive to 495
change than either terminal Neoproterozoic or Cenozoic oceans. 496
A simple C and S isotope box model illustrates that low sulfate concentrations alone fail 497
to account for the >10‰ δ34Ssulfate shifts recognized in the Port au Port Group strata. These 498

23
larger δ34S shifts can be generated if fluctuating oceanic redox is invoked, whereby marine 499
anoxia forces reduced C/S and elevated Δ34S, resulting in larger δ34S changes per mole of OC 500
buried. The emerging environmental picture of the later Cambrian Earth system suggests that 501
the delayed recovery of organisms with carbonate skeletons and animal reefs following late 502
Early Cambrian extinction may have been due in part to fluctuating marine redox and reduced 503
oxygen levels in the coupled ocean-atmosphere system. 504
Ultimately, the relationship between the geochemical cycles of C and S represent a 505
complex set of feedbacks that operate on a variety of timescales. The Middle to Late Cambrian 506
ocean presents an opportunity to investigate the driving forces behind C and S isotopic change in 507
oceans unlike those we know today (i.e., through most of Earth history). 508
509
Acknowledgements 510
We thank the Agouron Institute (postdoctoral fellowship to SP) and NSF Grant DES 511
0420592 (AHK) for partial funding of this research. We also thank Greg Eischeid and Dan 512
Schrag for assistance with carbon and oxygen isotope analyses and David Fike, an anonymous 513
reviewer and P. Delaney for comments that improved the content and clarity of this manuscript. 514
515

24
References Cited 516
Ault, W.U. and Kulp, J.L., 1959. Isotopic geochemistry of sulphur. Geochimica et 517
Cosmochimica Acta 16, 201-235. 518
Bambach, R.K., Knoll, A.H. and Wang, S.M., 2004. Origination, extinction, and mass depletions 519
of marine diversity. Paleobiology 30, 522-542. 520
Berner, E.K. and Berner, R.A., 1996. Global Environment. Prentice Hall, Upper Saddle River, 521
NJ, 376 pp. 522
Berner, R.A., 1987. Models for carbon and sulfur cycles and atmospheric oxygen: application to 523
Paleozoic geologic history. American Journal of Science 287, 177-196. 524
Berner, R.A., 2006. GEOCARBSULF: A combined model for Phanerozoic atmospheric O2 and 525
CO2. Geochimica et Cosmochimica Acta 70, 5653-5664. 526
Berner, R.A. and Raiswell, R., 1983. Burial of organic carbon and pyrite sulfur in sediments over 527
Phanerozoic time: a new theory. Geochimica et Cosmochimica Acta 47, 855-862. 528
Berry, W.B.N. and Wilde, P., 1978. Progressive ventilation of the oceans-An explanation for the 529
distribution of the lower Paleozoic black shales. American Journal of Science 278, 257-530
275. 531
Böttcher, M.E., Thamdrup, B. and Vennemann, T.W., 2001. Oxygen and sulfur isotope 532
fractionation during anaerobic bacterial disproportionation of elemental sulfur. 533
Geochimica et Cosmochimica Acta 65, 1601-1609. 534
Brennan, S.T., Lowenstein, T.K. and Horita, J., 2004. Seawater chemistry and the advent of 535
biocalcification. Geology 32, 473-476. 536

25
Burdett, J.W., Arthur, M.A. and Richardson, M., 1989. A Neogene seawater sulfur isotope age 537
curve from calcareous pelagic microfossils. Earth and Planetary Science Letters 94, 189-538
198. 539
Canfield, D.E., 2004. The evolution of the Earth surface sulfur reservoir. American Journal of 540
Science 304, 839-861. 541
Canfield, D.E., Poulton, S.W. and Narbonne, G.M., 2007. Late Neoproterozoic deep-ocean 542
oxygenation and the rise of animal life. Science 315, 92-95. 543
Canfield, D.E., Raiswell, R., Westrich, J.T., Reaves, C.M. and Berner, R.A., 1986. The use of 544
chromium reduction in the analysis of reduced inorganic sulfur in sediments and shales. 545
Chemical Geology 54, 149-155. 546
Canfield, D.E. and Teske, A., 1996. Late Proterozoic rise in atmospheric oxygen concentration 547
inferred from phylogenetic and sulphur-isotope studies. Nature 382, 127-132. 548
Canfield, D.E. and Thamdrup, B., 1994. The production of 34S-depleted sulfide during bacterial 549
disproportionation of elemental sulfur. Science 266, 1973-1975. 550
Chow, N. and James, N.P., 1987. Facies-specific, calcitic and bimineralic ooids from Middle and 551
Upper Cambrian platform carbonates, western Newfoundland, Canada. Journal of 552
Sedimentary Petrology 57, 907-921. 553
Cowan, C.A. and James, N.P., 1993. The interactions of sea-level change, terrigenous-sediment 554
influx, and carbonate productivity as controls on Upper Cambrian Grand Cycles of 555
western Newfoundland, Canada. Geological Society of America Bulletin 105, 1576-556
1590. 557
26
Cypionka, H., Smock, A.M. and Böttcher, M.E., 1998. A combined pathway of sulfur compound 558
disproportionation in Desulfovibrio desulfuricans. FEMS Microbiology Ecology 166, 559
181-186. 560
Derry, L.A., Brasier, M., Corfield, R., Rozanov, A. and Zhuravlev, A., 1994. Sr and C isotopes 561
in Lower Cambrian carbonates from the Siberian craton: a paleoenvironmental record 562
during the "Cambrian explosion". Earth and Planetary Science Letters 128, 671-681. 563
Detmers, J., Brüchert, V., Habicht, K.S. and Kuever, J., 2001. Diversity of sulfur isotope 564
fractionations by sulfate-reducing prokaryotes. Applied and Environmental Microbiology 565
67, 888-894. 566
Edwards, D., 1979. The early history of vacular plants based on Late Silurian and Early 567
Devonian floras of the British Isles. In: A.L. Harris, C.H. Holland and B.E. Leake 568
(Editors), The Caledonides of the British Isles-reviewed. Geological Society of London 569
Special Publication, pp. 405-410. 570
Fike, D.A. and Grotzinger, J.P., 2008. A paired sulfate—pyrite δ34S approach to understanding 571
the evolution of the Ediacaran—Cambrian sulfur cycle. Geochimica et Cosmochimica 572
Acta 72, 2636-2648. 573
Fike, D.A., Grotzinger, J.P., Pratt, L.M. and Summons, R.E., 2006. Oxidation of the Ediacaran 574
Ocean. Nature 444, 744-747. 575
Fischer, W., Higgins, J. and Pruss, S., 2007. Delayed biotic recovery from the Permian-Triassic 576
extinction may have been influenced by a redox-driven reorganization of the marine 577
carbonate system, Geological Society of America, Abstracts with Programs, pp. 420. 578
Garrels, R.M. and Lerman, A., 1984. Coupling of sedimentary sulfur and carbon cycles-an 579
improved model. American Journal of Science 284, 989-1007. 580

27
Gill, B.C., Lyons, T.W. and Saltzman, M.R., 2007. Parallel, high-resolution carbon and sulfur 581
isotope records of the evolving Paleozoic marine sulfur reservoir. Palaeogeography, 582
Palaeoclimatology, Palaeoecology 256, 156-173. 583
Given, R.K. and Lohmann, K.C., 1985. Derivation of the original isotopic composition of 584
Permian marine cements. Journal of Sedimentary Petrology 55, 430-439. 585
Gorjan, P., Veevers, J.J. and Walter, M.R., 2000. Neoproterozoic sulfur-isotope variation in 586
Australia and global implications. Precambrian Research 100, 151-179. 587
Habicht, K.S. and Canfield, D.E., 1997. Sulfur isotope fractionation during bacterial sulfate 588
reduction in organic-rich sediments. Geochimica et Cosmochimica Acta 61, 5351-5361. 589
Habicht, K.S. and Canfield, D.E., 2001. Isotope fractionation by sulfate-reducing natural 590
populations and the isotopic composition of sulfide in marine sediments. Geology 29, 591
555-558. 592
Habicht, K.S., Canfield, D.E. and Rethmeier, J., 1998. Sulfur isotope fractionation during 593
bacterial reduction and disproportionation of thiosulfate and sulfite. Geochimica et 594
Cosmochimica Acta 62, 2585-2595. 595
Habicht, K.S., Gade, M., Thamdrup, B., Berg, P. and Canfield, D.E., 2002. Calibration of sulfate 596
levels in the Archean ocean. Science 298, 2372-2374. 597
Halverson, G.P., Hoffman, P.F., Schrag, D.P., Maloof, A.C. and Rice, A.H., 2005. Towards a 598
Neoproterozoic composite carbon isotope record. Geological Society of America Bulletin 599
117, 1181-1207. 600
Halverson, G.P. and Hurtgen, M.T., 2007. Ediacaran growth of the marine sulfate reservoir. 601
Earth and Planetary Science Letters 263, 32-44. 602

28
Hayes, J.M., Strauss, H. and Kaufman, A.J., 1999. The abundance of 13C in marine organic 603
matter and isotopic fractionation in the global biogeochemical cycle of carbon during the 604
past 800 Ma. Chemical Geology 161, 103-125. 605
Higgins, J. and Schrag, D., 2007. CaCO3 cycling in anoxic oceans, Geological Society of 606
America, Abstracts with Programs, pp. 420. 607
Holland, H.D., 1973. Systematics of the isotopic composition of sulfur in the oceans during the 608
Phanerozoic and its implications for atmospheric oxygen. Geochimica et Cosmochimica 609
Acta 37, 2605-2616. 610
Holland, H.D., 1984. The Chemical Evolution of the Atmosphere and Oceans. Princeton 611
University Press, Princeton, NJ, 582 pp. 612
Holser, W.T., Maynard, J.B. and Cruikshank, K.M., 1989. Modelling the Natural Cycle of 613
Sulphur Through Phanerozoic Time. In: P. Brimblecombe and A.Y. Lein (Editors), 614
Evolution of the Global Biogeochemical Sulphur Cycle. John Wiley & Sons Ltd, pp. 21-615
56. 616
Horita, J., Zimmermann, H. and Holland, H.D., 2002. Chemical evolution of seawater during the 617
Phanerozoic: Implications from the record of marine evaporites. Geochimica et 618
Cosmochimica Acta 66, 3733-3756. 619
Hough, M.L. et al., 2006. A major sulphur isotope event at c. 510 Ma: a possible anoxia-620
extinction-volcanism connection during the Early-Middle Cambrian transition? Terra 621
Nova 18, 257-263. 622
Hurtgen, M.T., Arthur, M.A. and Halverson, G.P., 2005. Neoproterozoic sulfur isotopes, the 623
evolution of microbial sulfur species, and the burial efficiency of sulfide as sedimentary 624
pyrite. Geology 33, 41-44. 625

29
Hurtgen, M.T., Arthur, M.A., Suits, N.S. and Kaufman, A.J., 2002. The sulfur isotopic 626
composition of Neoproterozoic seawater sulfate: Implications for a snowball Earth? Earth 627
and Planetary Science Letters 203, 413-430. 628
Hurtgen, M.T., Halverson, G.P., Arthur, M.A. and Hoffman, P.F., 2006. Sulfur cycling in the 629
aftermath of a 635-Ma snowball glaciation: Evidence for a syn-glacial sulfidic deep 630
ocean. Earth and Planetary Sciences 245, 551-570. 631
Indermühle, A. et al., 1999. Holocene carbon-cycle dynamics based on CO2 trapped in ice at 632
Taylor Dome, Antarctica. Nature 398, 121-126. 633
Johnston, D.T. et al., 2005. Active microbial sulfur disproportionation in the Mesoproterozoic. 634
Science 310, 1477-1479. 635
Jørgensen, B.B., 1990. A thiosulfate shunt in the sulfur cycle of marine sediments. Science 249, 636
152-154. 637
Kah, L.C., Lyons, T.W. and Frank, T.D., 2004. Low marine sulphate and protracted oxygenation 638
of the Proterozoic biosphere. Nature 431, 834-838. 639
Kampschulte, A. and Strauss, H., 2004. The sulfur isotopic evolution of Phanerozoic seawater 640
based on the analysis of structurally substituted sulfate in carbonates. Chemical Geology 641
204, 255-286. 642
Knoll, A. and Carroll, S., 1999. Early animal evolution: emerging views from comparative 643
biology and geology. Science 284, 2129-2137. 644
Knoll, A.H., 2003. Biomineralization and evolutionary history. In: P.A. Dove, J.D. Yoreo and S. 645
Weiner (Editors), Biomineralization. Mineralogical Society of America, Washington, 646
DC, pp. 329-356. 647

30
Kump, L.R. and Arthur, M.A., 1999. Interpreting carbon-isotope excursions: carbonates and 648
organic matter. Chemical Geology 161, 181-198. 649
Kump, L.R. and Garrels, R.M., 1986. Modeling atmospheric O2 in the global sedimentary redox 650
cycle. American Journal of Science 286, 337-360. 651
Kurtz, A.C., Kump, L.R., Arthur, M.A., Zachos, J.C. and Paytan, A., 2003. Early Cenozoic 652
decoupling of the global carbon and sulfur cycles. Paleoceanography 18. 653
Leventhal, J.S., 1983. An interpretation of carbon and sulfur relationships in Black Sea 654
sediments as indicators of environments of deposition. Geochimica et Cosmochimica 655
Acta 47, 133-137. 656
Li, X. and Droser, M.L., 1997. Nature and distribution of Cambrian shell concentrations: 657
Evidence from the Basin and Range Province of the Western United States (California, 658
Nevada, and Utah). Palaios 12, 111-126. 659
Li, X. and Droser, M.L., 1999. Lower and Middle Ordovician shell beds from the Basin and 660
Range province of the western United States (California, Nevada, and Utah). Palaios 14, 661
215-233. 662
Lowenstein, T.K., Hardie, L.A., Timofeeff, M.N. and Demicco, R.V., 2003. Secular variation in 663
seawater chemistry and the origin of calcium chloride basinal brines. Geology 31, 857-664
860. 665
Lowenstein, T.K., Timofeeff, M.N., Brennan, S.T., Hardie, L.A. and Demicco, R.V., 2001. 666
Oscillations in Phanerozoic seawater chemistry: Evidence from fluid inclusions. Science 667
294, 1086-1088. 668

31
Lyons, T.W., 1997. Sulfur isotopic trends and pathways of iron sulfide formation in upper 669
Holocene sediments of the anoxic Black Sea. Geochimica et Cosmochimica Acta 61, 670
3367-3382. 671
McFadden, K.A. et al., 2008. Pulsed oxidation and biological evolution in the Ediacaran 672
Doushantuo Formation. Proceedings of the National Academy of Science 105, 3197-673
3202. 674
Mook, W.G., 1986. 13C in atmospheric CO2. Netherlands Journal of Sea Research 20, 211-223. 675
Paytan, A., Kastner, M., Campbell, D. and Thiemens, M.H., 1998. Sulfur isotopic composition of 676
Cenozoic seawater sulfate. Science 282, 1459-1462. 677
Paytan, A., Kastner, M., Campbell, D. and Thiemens, M.H., 2004. Seawater sulfur isotope 678
fluctuations in the Cretaceous. Science 304, 1663-1665. 679
Petrychenko, O.Y., Peryt, T.M. and Chechel, E.I., 2005. Early Cambrian seawater chemistry 680
from fluid inclusions in halite from Siberian evaporites. Chemical Geology 219, 149-161. 681
Porter, S.M., 2004. Closing the phosphatization window: testing for the influence of taphonomic 682
megabias on the pattern of small shelly fossil decline. Palaios 19, 178-183. 683
Pruss, S., Finnegan, S., Fischer, W. and Knoll, A., submitted. Carbonates in skeleton-poor seas: 684
New insights from Cambrian and Ordovician strata of Laurentia. Palaios. 685
Raab, M. and Spiro, B., 1991. Sulfur isotopic variations during seawater evaporation with 686
fractional crystallization. Chemical Geology 86, 323-333. 687
Raiswell, R. and Berner, R.A., 1985. Pyrite formation in euxinic and semi-euxinic sediments. 688
American Journal of Science 285, 710-724. 689
Raiswell, R. and Berner, R.A., 1986. Pyrite and organic matter in Phanerozoic normal marine 690
shales. Geochimica et Cosmochimica Acta 50, 1967-1976. 691

32
Rees, C.E., Jenkins, W.J. and Monster, J., 1978. The sulphur isotopic composition of ocean 692
water sulphate. Geochimica et Cosmochimica Acta 42, 377-381. 693
Rowland, S.M. and Shapiro, R.S., 2002. Reef patterns and environmental influences in the 694
Cambrian and earliest Ordovician. In: W. Kiessling, E. Flügel and J. Golonka (Editors), 695
Phanerozoic Reef Patterns, Tulsa, pp. 95-128. 696
Saltzman, M.R., 2005. Phosphorus, nitrogen, and the redox evolution of Paleozoic oceans. 697
Geology 33, 573-576. 698
Saltzman, M.R. et al., 2004. The Late Cambrian SPICE event and the Sauk II-Sauk III 699
regression: New evidence from Laurentian basins in Utah, Iowa and Newfoundland. 700
Journal of Sedimentary Research 74, 366-377. 701
Saltzman, M.R. et al., 2000. A global carbon isotope excursion (SPICE) during the Late 702
Cambrian: relation to trilobite extinctions, organic-matter burial and sea level. 703
Palaeogeography Palaeoclimatology Palaeoecology 162, 211-223. 704
Schröder, S., Schreiber, B.C., Amthor, J.E. and Matter, A., 2004. Stratigraphy and environmental 705
conditions of the terminal Neoproterozoic-Cambrian Period in Oman: evidence from 706
sulphur isotopes. Journal of the Geological Society, London 161, 489-499. 707
Scott, C. et al., 2008. Tracing the stepwise oxygenation of the Proterozoic ocean. Nature 452, 708
456-459. 709
Shen, Y., Knoll, A.H. and Walter, M.R., 2003. Evidence for low sulphate and anoxia in a mid-710
Proterozoic marine basin. Nature 423, 632-635. 711
Strauss, H., 1999. Geological evolution from isotope proxy signals-sulfur. Chemical Geology 712
161, 89-101. 713

33
Trotter, J.A., Williams, I.S., Barnes, C.R., Lécuyer, C. and Nicoll, R.S., 2008. Did cooling 714
oceans trigger Ordovician biodiversification? Evidence from conodont thermometry. 715
Science 321, 550-554. 716
Turchyn, A.V. and Schrag, D.P., 2004. Oxygen isotope constraints on the sulfur cycle over the 717
past 10 million years. Science 303, 2004-2007. 718
Veizer, J., Holser, W.T. and Wilgus, C.K., 1980. Correlation of 13C/12C and 34S/32S secular 719
variations. Geochimica et Cosmochimica Acta 44, 579-587. 720
Zhuravlev, A. and Wood, R., 1996. Anoxia as the cause of the mid-early Cambrian (Botomian) 721
extinction event. Geology 24, 311-314. 722

34
Figure 1. The response of δ13Ccarbonate and δ34Ssulfate to a 50% increase in organic carbon and 723
pyrite burial for 1 m.y. As a result of increased pyrite burial, sulfate concentrations 724
fell from 28.0 to 27.8 mM. Pre-perturbation mass and isotope compositions were 725
adopted from Kurtz et al. (2003) and approximate the Cenozoic C and S cycles at 726
steady-state. 727
728
Figure 2. Stratigraphic column and geochemical data for the March Point and Petit Jardin 729
Formations of the Port au Port Group, Newfoundland, Canada. 730
731
Figure 3. Compilation of Ediacaran-Ordovician δ13Ccarbonate (Halverson et al., 2005; Derry et 732
al., 1994; Hayes et al., 1999; Saltzman 2005) and δ34Ssulfate (Hurtgen et al., 2002; 733
Kampschulte and Strauss, 2004; Fike et al., 2006) and δ34Spyrite (Canfield and Teske, 734
1996; Gorjan et al., 2000; Schöder et al., 2004; Hurtgen et al., 2006; Fike et al., 735
2006). 736
737
Figure 4. δ34Ssulfate response to a stepwise, 50% increase in Fpy for 1 m.y. (from 2 to 3 m.y. and 738
represented by gray band) under varying initial sulfate concentrations (0.28 mM, τ = 739
0.27 m.y.; 1.9 mM, τ = 1.80 m.y.; and 2.5 mM, τ = 3.33 m.y.). 740
741
Figure 5. δ34Ssulfate response to a stepwise, 100% increase in Fpy and 10‰ increase in Δ34S 742
(from 25 to 35‰) for 1 m.y. (from 2 to 3 m.y. and represented by gray band) under 743
varying initial sulfate concentrations (0.70 mM, τ = 0.67 m.y.; 2.1 mM, τ = 2.00 m.y.; 744
and 3.5 mM, τ = 3.33 m.y.). 745
35
746

36
747

37
748

38
749

39
750