Embed Size (px)
Citation preview
URL: http://dx.doi.org/10.31703/ger.2021(VI-II).03 DOI: 10.31703/ger.2021(VI-II).03 p-ISSN: 2521-2974 e-ISSN: 2707-0093 L-ISSN: 2521-2974 Citation: Khan, A., Haq, Z. u., & Iqbal, J. (2021). Evaluating the Determinants and Sustainability of Public Debt for the South Asian Association for Regional Cooperation (SAARC) Countries. Global Economics Review, VI(II), 24-40. https://doi.org/10.31703/ger.2021(VI-II).03
Evaluating the Determinants and
Sustainability of Public Debt for the South Asian Association for Regional Cooperation
(SAARC) Countries
Ayaz Khan * Zahoor ul Haq † Javed Iqbal ‡
This study examines the sustainability and relationship of public debt to selected
macroeconomic variables for South Asian Association of Regional Cooperation (SAARC) countries from 1996 to 2017. For the relationship of public debt to macroeconomic variables, we employ a panel Autoregressive Distributed Lagged (ARDL) model. For sustainability measurement of public debt, we used a theoretically derived model based on necessary and sufficient conditions. The panel ARDL results for the long run show that the saving-investment gap and economic growth negatively while the budget deficit and current account positively explain public debt. The sustainability measurement results based on necessary and sufficient conditions reveal that public debt remains unsustainable for most of the years in the presence of macroeconomic variables. It is recommended that countries in this association should formulate policies that promote saving culture. This saving culture may not only promote investment but also can affect the current account situation of these countries.
Pages: 24 – 40
Vol. VI, No. II
(Spring 2021)
Key Words: Public Debt, Macroeconomic Variables, Panel ARDL, Sustainability, SAARC Countries
JEL Classification: E20, F32, H68
Introduction A country on the verge of its development stage is trying to bring economic stability and needs to focus on sectors that boost economic growth, e.g., production, consumption, and investment. Since the government does invest in some sectors due to its moral responsibilities like spending on health, education, water, and sanitation, social safety, communications (roads and highways), etc., these are the
* PhD Scholar, Department of Economics, Abdul Wali Khan University Mardan, KP, Pakistan. Email: [email protected] † Professor, Department of Economics, Pakhtunkhwa Economic Policy Research Institute, Abdul Wali Khan University Mardan, KP, Pakistan. ‡ Assistant Professor, Department of Economics, Pakhtunkhwa Economic Policy Research Institute, Abdul Wali Khan University Mardan, KP, Pakistan.
areas where private investors hesitate to invest. So, if the government wants to encourage the private sector to boost their investment and enhance their confidence, then they can go for some huge amount of initial injection into the economy. Debt importance and harmfulness analysis are one of the core areas of research for both developed and developing nations of the world. Both developed and developing
Abstract
Evaluating the Determinants and Sustainability of Public Debt for the South Asian Association for Regional Cooperation (SAARC) Countries
Vol. VI, No. II (Spring 2021) Page | 25
countries incurred debt, but the situation becomes more suppressing when it is observed and imperialized that the debt which is initiated for the growth, stability, and economic development destabilized the growth and development. The entire world, in the course of time does acquire debt whether it is a developed or developing nation (Reinhart & Rogoff, 2008). (Benayed, Gabsi, & Belguith, 2015) were of the view that policymakers and economists from the world got attention toward rising public debt and its negative impacts on the economy. (Campos, Jaimovich, & Panizza, 2006) Attributed the accumulation of public debt to the budget deficit in the economy. They further say that change in the stock of debt is equal to the budget deficit.
Debt sustainability at one end represents the economic growth that it brings to sustained the economy in the future, and at another end, it represents the number of surpluses it produces to repay the debt obligations without rescheduling the debt payments. A sustainable debt is one that produces surpluses, which are sufficient to repay the debt obligation in the future. The public debt sustainability issue got attention after the 1980’s era. Several methods were introduced by researchers to find out the sustainability of public debt. The studies are based on using fiscal account measures for the public debt sustainability through a unit root and cointegration testing approaches see (Greiner & Semmler, 1999; Hakkio & Rush, 1991; Hamilton & Flavin, 1985; Wilcox, 1989). Other sets of studies focused on the current account situation and debt sustainability using unit root and cointegration testing procedures see (CArneiro, 1997; Rocha & Bender, 2000; Sawada, 1994).
The current study is focusing on the South Asian Association for Regional Cooperation (SAARC) countries. SAARC
countries represent 21 percent of the world population and about 4.23 percent of the global economy up to 2019. Based on the area, SAARC comprises about 3 percent of the world area. SAARC aims to promote the quality of life and welfare of the associated nation’s peoples, to realize the associated countries full potential for the enhancing economic growth process, social and cultural development progress plus active collaboration and mutual assistance in the fields of social, cultural, economic, technical and scientific for transfer of knowledge and skills, to address and depend one another on international forums on the matters of common interest, to enhance mutual trade among the associated countries and to work together with other organization either regional or non-regional with similar purpose and objectives.
However, literature about the saving investment gap is least evident about the relationship and deciding the sustainability of public debt, especially in SAARC countries. The objective of the current study is to imperialized the relationship and sustainability of public debt in the presence of saving investment gap, fiscal outcome ( budget deficit or surplus), current account (surplus or deficit), and GDP growth rate. Literature Review Forslund, Lima, and Panizza (2011) used a data set of 95 countries designated as developing countries emerging markets to assess the determinants of public debt; results of the study show that domestic debt size and inflation at the national level were weakly associated if the current account is kept control. However, countries with a more liberalized or neutral capital flow, inflation, and public debt relationship is mostly contradictory. Teles and Mussolini (2014) show that economic growth insignificantly affects
Ayaz Khan, Zahoor ul Haq and Javed Iqbal
Page | 26 Global Economics Review (GER)
the debt. Further, they found a significant relationship between debt taken for productive expenditure and economic growth; their results also suggest that economic growth for an economy can be stimulated by an increase in productive public debt for expenditures. Doğan and Bilgili (2014) estimate the impact of public and private external debt on economic growth. The finding of the study suggests that debt affect economic growth negatively. Further, the study also shows that negative affect on economic growth mainly comes from the public external debt. Qayyum, Din, and Haider (2014) developed a theoretical model for external debt, foreign aid, and governance in an open economy. The study showed that foreign aid and external debt have a level impact on consumption instead of growth rate effect. Investment is not affected by foreign aid directly, but saving is directly and positively affected by foreign aid. Economic growth is positively affected by foreign aid, and it plays a constructive role in increasing economic activities. On the other hand, external debt negatively affected growth and imposed a burden on the economy by pushing it into a debt trap and further troubles. The study recommended that developing countries should use foreign aid for financing budgets instead of going into debt. Van Bon (2015) studied 60 developing countries in Africa, Asia, and Latin America for determining the debt situation. The findings of the study show that trade openness, government expenditures, private investment, and real GDP per capita significantly determined the public debt. Sustainability of debt achievement is important for a country because an unsustainable debt leads to an increase in indebtedness. Macroeconomic literature and textbooks agreed upon that to finance the development process poor countries need to borrow. When indebtedness become
large in poor countries the rate of investment also reduce in it, mean the profit on investment in the poor countries expected to be taxed away and process of growth and development may become stagnant see (Krugman, 1988; Sachs, 1988). Empirical studies also use the cointegration method for testing debt sustainability. The focus is made on the long-run relationship between revenues and expenditures. Debt is accounted as sustainable when a long run relationship exists. Several country base and region base studies were conducted to determine the sustainability of debt. Country-based studies on the sustainability of public debt include (Crowder, 1997; Haug, 1991; Quintos, 1995; Tanner & Liu, 1994). For region-wise research on debt sustainability base on co-integration relationship see (Afonso, 2005; Ahmed & Rogers, 1995; Papadopoulos & Sidiropoulos, 1999; Payne, 1997). Fincke and Greiner (2011) argued that a fiscal policy could satisfy the intertemporal budget constraint of the government when the primary surplus to public debt remains positive and significant. A sustainable fiscal policy for debt is one that enables the government to have debt today and primary surpluses in the future. According to Schumacher and di Mauro (2015), it is important to analyze the sustainability of debt for an economy because it helps in determining the future position of debt accumulation. Sustainability enables us to find that the debt accumulation in near future will remain stable or explosive. Theoretical Framework The Individual’s Consumption’s Problem To build up the theoretical aspect of the study, a small hypothetical open developing economy consisting of four sectors (i.e. households, business,
Evaluating the Determinants and Sustainability of Public Debt for the South Asian Association for Regional Cooperation (SAARC) Countries
Vol. VI, No. II (Spring 2021) Page | 27
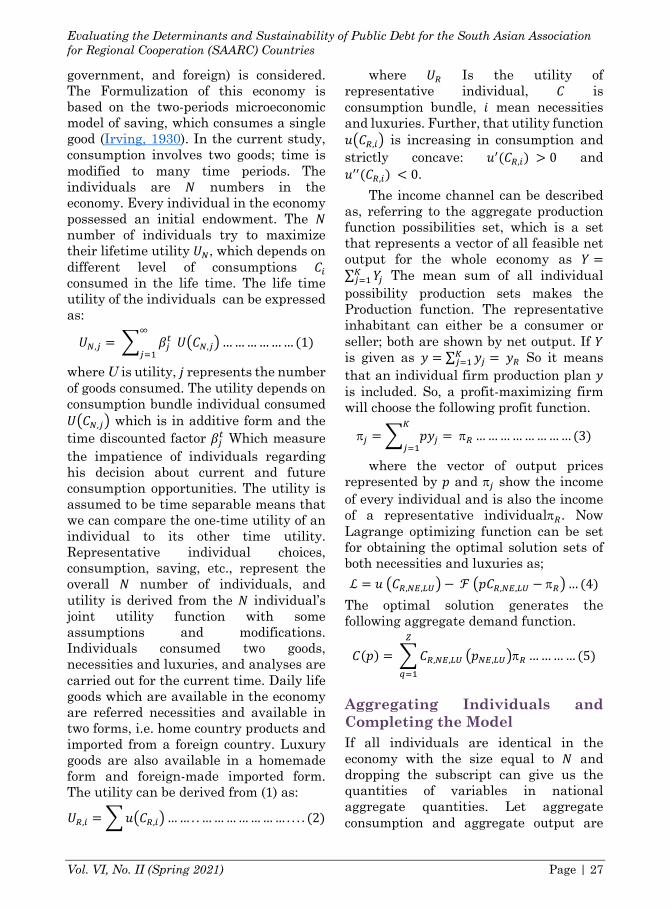
government, and foreign) is considered. The Formulization of this economy is based on the two-periods microeconomic model of saving, which consumes a single good (Irving, 1930). In the current study, consumption involves two goods; time is modified to many time periods. The individuals are 𝑁 numbers in the economy. Every individual in the economy possessed an initial endowment. The 𝑁 number of individuals try to maximize their lifetime utility 𝑈!, which depends on different level of consumptions 𝐶" consumed in the life time. The life time utility of the individuals can be expressed as:
𝑈!,$ =& 𝛽$%&
$'(𝑈(𝐶!,$)………………(1)
where U is utility, 𝑗 represents the number of goods consumed. The utility depends on consumption bundle individual consumed 𝑈(𝐶!,$) which is in additive form and the time discounted factor 𝛽$% Which measure the impatience of individuals regarding his decision about current and future consumption opportunities. The utility is assumed to be time separable means that we can compare the one-time utility of an individual to its other time utility. Representative individual choices, consumption, saving, etc., represent the overall 𝑁 number of individuals, and utility is derived from the 𝑁 individual’s joint utility function with some assumptions and modifications. Individuals consumed two goods, necessities and luxuries, and analyses are carried out for the current time. Daily life goods which are available in the economy are referred necessities and available in two forms, i.e. home country products and imported from a foreign country. Luxury goods are also available in a homemade form and foreign-made imported form. The utility can be derived from (1) as:
𝑈)," =&𝑢(𝐶),")…… . . ………………… . . . . (2)
where 𝑈) Is the utility of representative individual, 𝐶 is consumption bundle, 𝑖 mean necessities and luxuries. Further, that utility function 𝑢(𝐶),") is increasing in consumption and strictly concave: 𝑢*(𝐶),") > 0 and 𝑢**(𝐶),") < 0.
The income channel can be described as, referring to the aggregate production function possibilities set, which is a set that represents a vector of all feasible net output for the whole economy as 𝑌 =∑ 𝑌$+$'( The mean sum of all individual
possibility production sets makes the Production function. The representative inhabitant can either be a consumer or seller; both are shown by net output. If 𝑌 is given as 𝑦 = ∑ 𝑦$+
$'( =𝑦) So it means that an individual firm production plan 𝑦 is included. So, a profit-maximizing firm will choose the following profit function.
p$ =& 𝑝𝑦$+
$'(=p) ……………………(3)
where the vector of output prices represented by 𝑝 and p$ show the income of every individual and is also the income of a representative individualp). Now Lagrange optimizing function can be set for obtaining the optimal solution sets of both necessities and luxuries as; ℒ = 𝑢(𝐶),!,,-.) − ℱ(𝑝𝐶),!,,-. − p))… (4)
The optimal solution generates the following aggregate demand function.
𝐶(𝑝) = &𝐶),!,,-.
/
0'(
(𝑝!,,-.)p) …………(5)
Aggregating Individuals and Completing the Model If all individuals are identical in the economy with the size equal to 𝑁 and dropping the subscript can give us the quantities of variables in national aggregate quantities. Let aggregate consumption and aggregate output are
Ayaz Khan, Zahoor ul Haq and Javed Iqbal
Page | 28 Global Economics Review (GER)
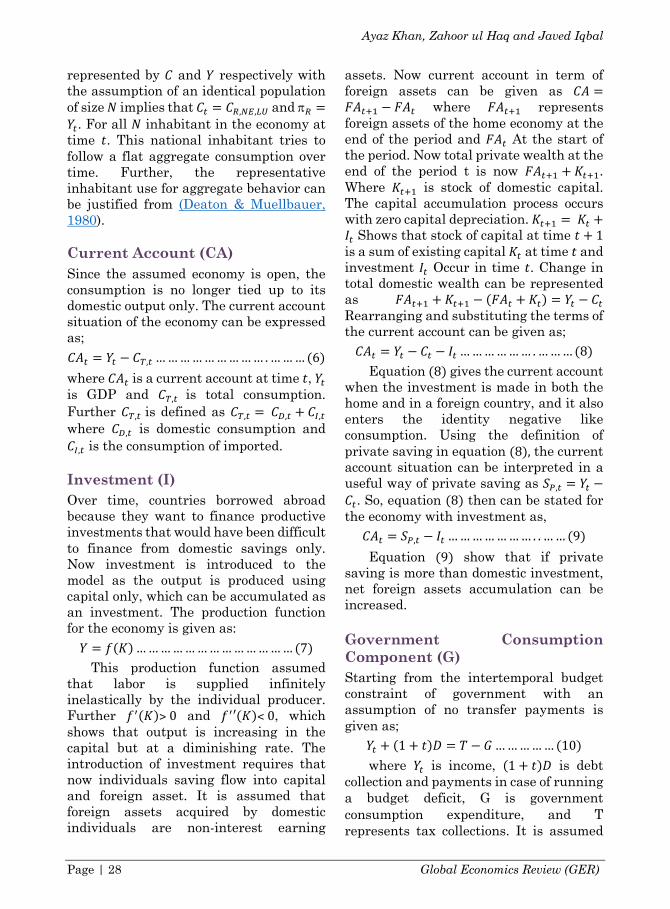
represented by 𝐶 and 𝑌 respectively with the assumption of an identical population of size 𝑁 implies that 𝐶% = 𝐶),!,,-. and p) =𝑌%. For all 𝑁 inhabitant in the economy at time 𝑡. This national inhabitant tries to follow a flat aggregate consumption over time. Further, the representative inhabitant use for aggregate behavior can be justified from (Deaton & Muellbauer, 1980). Current Account (CA) Since the assumed economy is open, the consumption is no longer tied up to its domestic output only. The current account situation of the economy can be expressed as; 𝐶𝐴% = 𝑌% − 𝐶1,% ……………………… .………(6) where 𝐶𝐴% is a current account at time 𝑡, 𝑌% is GDP and 𝐶1,% is total consumption. Further 𝐶1,% is defined as 𝐶1,% =𝐶2,% + 𝐶3,% where 𝐶2,% is domestic consumption and 𝐶3,% is the consumption of imported. Investment (I) Over time, countries borrowed abroad because they want to finance productive investments that would have been difficult to finance from domestic savings only. Now investment is introduced to the model as the output is produced using capital only, which can be accumulated as an investment. The production function for the economy is given as: 𝑌 = 𝑓(𝐾)…………………………………(7)
This production function assumed that labor is supplied infinitely inelastically by the individual producer. Further 𝑓*(𝐾)˃0 and 𝑓*′(𝐾)˂0, which shows that output is increasing in the capital but at a diminishing rate. The introduction of investment requires that now individuals saving flow into capital and foreign asset. It is assumed that foreign assets acquired by domestic individuals are non-interest earning
assets. Now current account in term of foreign assets can be given as 𝐶𝐴 =𝐹𝐴%4( − 𝐹𝐴% where 𝐹𝐴%4( represents foreign assets of the home economy at the end of the period and 𝐹𝐴% At the start of the period. Now total private wealth at the end of the period t is now 𝐹𝐴%4( +𝐾%4(. Where 𝐾%4( is stock of domestic capital. The capital accumulation process occurs with zero capital depreciation. 𝐾%4( =𝐾% +𝐼% Shows that stock of capital at time 𝑡 + 1 is a sum of existing capital 𝐾% at time 𝑡 and investment 𝐼% Occur in time 𝑡. Change in total domestic wealth can be represented as 𝐹𝐴%4( +𝐾%4( − (𝐹𝐴% +𝐾%) = 𝑌% − 𝐶% Rearranging and substituting the terms of the current account can be given as; 𝐶𝐴% = 𝑌% − 𝐶% − 𝐼% ……………… .………(8)
Equation (8) gives the current account when the investment is made in both the home and in a foreign country, and it also enters the identity negative like consumption. Using the definition of private saving in equation (8), the current account situation can be interpreted in a useful way of private saving as 𝑆5,% = 𝑌% −𝐶%. So, equation (8) then can be stated for the economy with investment as, 𝐶𝐴% = 𝑆5,% − 𝐼% ………………… . .……(9) Equation (9) show that if private
saving is more than domestic investment, net foreign assets accumulation can be increased. Government Consumption Component (G) Starting from the intertemporal budget constraint of government with an assumption of no transfer payments is given as;
𝑌% + (1 + 𝑡)𝐷 = 𝑇 − 𝐺……………(10) where 𝑌% is income, (1 + 𝑡)𝐷 is debt
collection and payments in case of running a budget deficit, G is government consumption expenditure, and T represents tax collections. It is assumed
Evaluating the Determinants and Sustainability of Public Debt for the South Asian Association for Regional Cooperation (SAARC) Countries
Vol. VI, No. II (Spring 2021) Page | 29
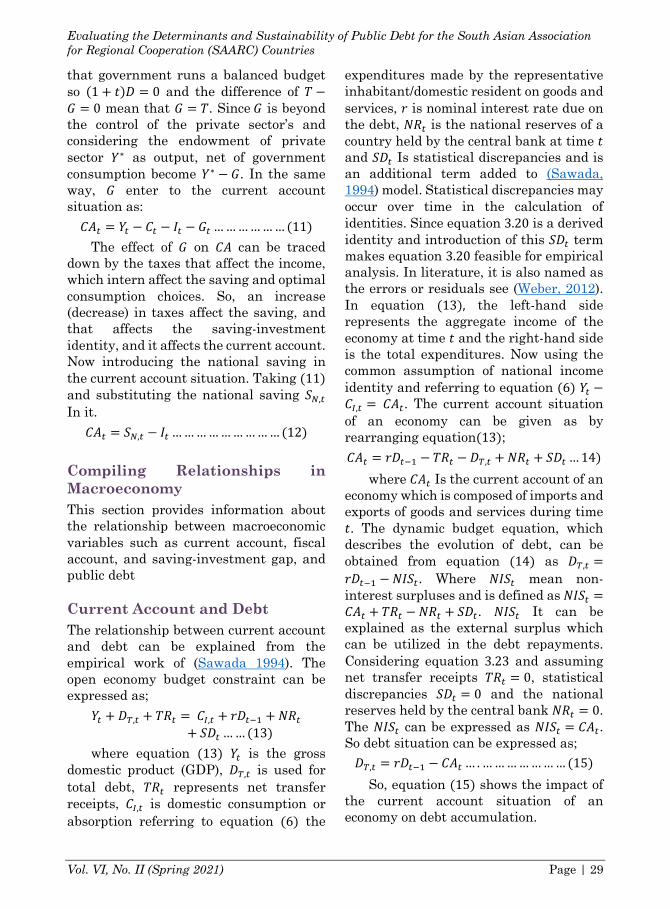
that government runs a balanced budget so (1 + 𝑡)𝐷 = 0 and the difference of 𝑇 −𝐺 = 0 mean that 𝐺 = 𝑇. Since𝐺 is beyond the control of the private sector’s and considering the endowment of private sector 𝑌∗ as output, net of government consumption become 𝑌∗ − 𝐺. In the same way, 𝐺 enter to the current account situation as: 𝐶𝐴% = 𝑌% − 𝐶% − 𝐼% − 𝐺% ………………(11)
The effect of 𝐺 on 𝐶𝐴 can be traced down by the taxes that affect the income, which intern affect the saving and optimal consumption choices. So, an increase (decrease) in taxes affect the saving, and that affects the saving-investment identity, and it affects the current account. Now introducing the national saving in the current account situation. Taking (11) and substituting the national saving 𝑆!,% In it.
𝐶𝐴% = 𝑆!,% − 𝐼% ………………………(12) Compiling Relationships in Macroeconomy This section provides information about the relationship between macroeconomic variables such as current account, fiscal account, and saving-investment gap, and public debt Current Account and Debt The relationship between current account and debt can be explained from the empirical work of (Sawada 1994). The open economy budget constraint can be expressed as;
𝑌% +𝐷1,% + 𝑇𝑅% =𝐶3,% + 𝑟𝐷%7( +𝑁𝑅%+ 𝑆𝐷% ……(13)
where equation (13) 𝑌% is the gross domestic product (GDP), 𝐷1,% is used for total debt, 𝑇𝑅% represents net transfer receipts, 𝐶3,% is domestic consumption or absorption referring to equation (6) the
expenditures made by the representative inhabitant/domestic resident on goods and services, 𝑟 is nominal interest rate due on the debt, 𝑁𝑅% is the national reserves of a country held by the central bank at time 𝑡 and 𝑆𝐷% Is statistical discrepancies and is an additional term added to (Sawada, 1994) model. Statistical discrepancies may occur over time in the calculation of identities. Since equation 3.20 is a derived identity and introduction of this 𝑆𝐷% term makes equation 3.20 feasible for empirical analysis. In literature, it is also named as the errors or residuals see (Weber, 2012). In equation (13), the left-hand side represents the aggregate income of the economy at time 𝑡 and the right-hand side is the total expenditures. Now using the common assumption of national income identity and referring to equation (6) 𝑌% −𝐶3,% =𝐶𝐴%. The current account situation of an economy can be given as by rearranging equation(13); 𝐶𝐴% = 𝑟𝐷%7( − 𝑇𝑅% −𝐷1,% +𝑁𝑅% + 𝑆𝐷% …14)
where 𝐶𝐴% Is the current account of an economy which is composed of imports and exports of goods and services during time 𝑡. The dynamic budget equation, which describes the evolution of debt, can be obtained from equation (14) as 𝐷1,% =𝑟𝐷%7( −𝑁𝐼𝑆%. Where 𝑁𝐼𝑆% mean non-interest surpluses and is defined as 𝑁𝐼𝑆% =𝐶𝐴% + 𝑇𝑅% −𝑁𝑅% + 𝑆𝐷%. 𝑁𝐼𝑆% It can be explained as the external surplus which can be utilized in the debt repayments. Considering equation 3.23 and assuming net transfer receipts 𝑇𝑅% = 0, statistical discrepancies 𝑆𝐷% = 0 and the national reserves held by the central bank 𝑁𝑅% = 0. The 𝑁𝐼𝑆% can be expressed as 𝑁𝐼𝑆% = 𝐶𝐴%. So debt situation can be expressed as; 𝐷1,% = 𝑟𝐷%7( − 𝐶𝐴% … .…………………(15)
So, equation (15) shows the impact of the current account situation of an economy on debt accumulation.
Ayaz Khan, Zahoor ul Haq and Javed Iqbal
Page | 30 Global Economics Review (GER)
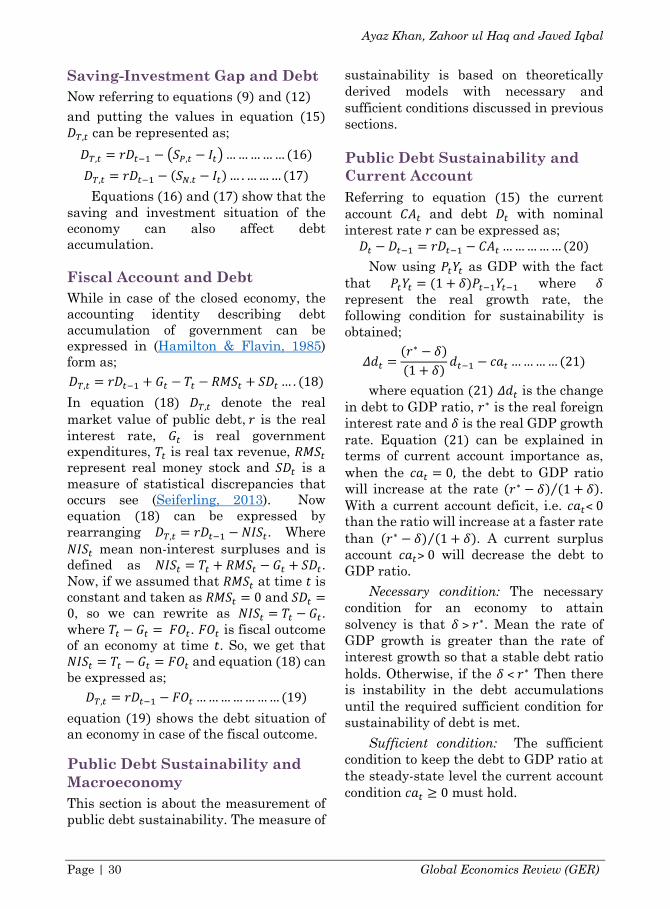
Saving-Investment Gap and Debt Now referring to equations (9) and (12) and putting the values in equation (15) 𝐷1,% can be represented as; 𝐷1,% = 𝑟𝐷%7( − (𝑆5,% − 𝐼%)……………(16) 𝐷1,% = 𝑟𝐷%7( − (𝑆!.% − 𝐼%)… .………(17) Equations (16) and (17) show that the
saving and investment situation of the economy can also affect debt accumulation. Fiscal Account and Debt While in case of the closed economy, the accounting identity describing debt accumulation of government can be expressed in (Hamilton & Flavin, 1985) form as; 𝐷1,% = 𝑟𝐷%7( + 𝐺% − 𝑇% − 𝑅𝑀𝑆% + 𝑆𝐷% … . (18) In equation (18) 𝐷1,% denote the real market value of public debt,𝑟 is the real interest rate, 𝐺% is real government expenditures, 𝑇% is real tax revenue, 𝑅𝑀𝑆% represent real money stock and 𝑆𝐷% is a measure of statistical discrepancies that occurs see (Seiferling, 2013). Now equation (18) can be expressed by rearranging 𝐷1,% = 𝑟𝐷%7( −𝑁𝐼𝑆%. Where 𝑁𝐼𝑆% mean non-interest surpluses and is defined as 𝑁𝐼𝑆% = 𝑇% + 𝑅𝑀𝑆% − 𝐺% + 𝑆𝐷%. Now, if we assumed that 𝑅𝑀𝑆% at time 𝑡 is constant and taken as 𝑅𝑀𝑆% = 0 and 𝑆𝐷% =0, so we can rewrite as 𝑁𝐼𝑆% = 𝑇% − 𝐺%. where 𝑇% − 𝐺% =𝐹𝑂%. 𝐹𝑂% is fiscal outcome of an economy at time 𝑡. So, we get that 𝑁𝐼𝑆% = 𝑇% − 𝐺% = 𝐹𝑂% and equation (18) can be expressed as;
𝐷1,% = 𝑟𝐷%7( − 𝐹𝑂% …………………(19) equation (19) shows the debt situation of an economy in case of the fiscal outcome. Public Debt Sustainability and Macroeconomy This section is about the measurement of public debt sustainability. The measure of
sustainability is based on theoretically derived models with necessary and sufficient conditions discussed in previous sections. Public Debt Sustainability and Current Account Referring to equation (15) the current account 𝐶𝐴% and debt 𝐷% with nominal interest rate 𝑟 can be expressed as; 𝐷% −𝐷%7( = 𝑟𝐷%7( − 𝐶𝐴% ……………(20)
Now using 𝑃%𝑌% as GDP with the fact that 𝑃%𝑌% = (1 + 𝛿)𝑃%7(𝑌%7( where 𝛿 represent the real growth rate, the following condition for sustainability is obtained;
𝛥𝑑% =(𝑟∗ − 𝛿)(1 + 𝛿) 𝑑%7( − 𝑐𝑎% …………(21)
where equation (21) 𝛥𝑑% is the change in debt to GDP ratio, 𝑟∗ is the real foreign interest rate and 𝛿 is the real GDP growth rate. Equation (21) can be explained in terms of current account importance as, when the 𝑐𝑎% = 0, the debt to GDP ratio will increase at the rate (𝑟∗ − 𝛿) (1 + 𝛿)⁄ . With a current account deficit, i.e. 𝑐𝑎%˂0 than the ratio will increase at a faster rate than (𝑟∗ − 𝛿) (1 + 𝛿)⁄ . A current surplus account 𝑐𝑎%˃0 will decrease the debt to GDP ratio.
Necessary condition: The necessary condition for an economy to attain solvency is that 𝛿˃𝑟∗. Mean the rate of GDP growth is greater than the rate of interest growth so that a stable debt ratio holds. Otherwise, if the 𝛿˂𝑟∗ Then there is instability in the debt accumulations until the required sufficient condition for sustainability of debt is met.
Sufficient condition: The sufficient condition to keep the debt to GDP ratio at the steady-state level the current account condition 𝑐𝑎% ≥ 0 must hold.
Evaluating the Determinants and Sustainability of Public Debt for the South Asian Association for Regional Cooperation (SAARC) Countries
Vol. VI, No. II (Spring 2021) Page | 31
Public Debt Sustainability and Saving-Investment Gap Referring to equation (16) and (17) and modifying it as; 𝑆𝐼𝐷! − 𝑆𝐼𝐷!"# = 𝑟𝑆𝐼𝐷!"# − '𝑆$,! − 𝐼$,!(… (22)
where 𝑆𝐼𝐷 is, the same debt represented in equation (22). The name is modified to make differentiation in the analysis of public debt. Dividing equation (22) by 𝑃%𝑌% which represent GDP and yield;
𝑠𝑖𝑑! =(1 + 𝑟)(1 + 𝛿) 𝑠𝑖𝑑!"# − '𝑠$,! − 𝑖$,!(. ………(23)
where 𝑠𝑖𝑑% is debt to GDP ratio, 𝑟 is the real interest rate, and 𝛿 is the real GDP growth rate. The saving-investment gap condition can influence the debt to GDP ratio in different ways. If (𝑠1,% − 𝑖1,%)˃0 mean savings are greater than investment, so the debt to GDP ratio will decline by more than (1 + 𝑟) (1 + 𝛿)⁄ . Otherwise, if the (𝑠1,% − 𝑖1,%)˂0 this condition represent extra debt accumulation, and the debt to GDP ratio will grow by more than (1 + 𝑟) (1 + 𝛿)⁄ .
Necessary condition: The necessary condition for sustainability of public debt is that 𝛿˃𝑟. It means that the ratio of (1 + 𝑟) (1 + 𝛿)⁄ ˂1 and the dynamic of debt is convergent and remain sustained over time if 𝛿˂𝑟 with suppressing real GDP growth in front of real interest rate growth leads to unsustainable debt until the required sufficient condition holds.
Sufficient condition: The sufficient condition for sustainability of debt is that (𝑠1,% − 𝑖1,%) ≥ 0. This condition clarifies that the long-run debt will remain sustained on the steady-state level. Public Debt Sustainability and Fiscal Account The intertemporal budget constraint of a small developing country where 𝐺% represent government expenditures, 𝑇% is
the tax revenue, 𝐵% is used for debt (Borrowing) over time, 𝑟 is the interest rate can be given as;
𝛥𝐵% = 𝑟𝐵%7( − 𝑇% − 𝐺% … .……… . (24) Now using 𝑃%𝑌% as GDP and dividing
equation (24) by this term, we get the following results
𝑏! =(1 + 𝑟)(1 + 𝛿) 𝑏!"# − (𝑓𝑎&!)˃0…………(25)
where 𝑏% is debt to GDP ratio, (𝜏%−𝑔%) is a government primary budget balance, 𝑟 is the real interest rate, 𝛿 represent real GDP growth and (1 + 𝑟) (1 + 𝛿)⁄ are discount rates. The fiscal account can affect the debt to GDP ratio in different ways. If (𝑓𝑎"%)˃0 means that either government collects more revenue over expenditures or there is a cut on the expenditures. Both situations, along with the seigniorage revenue, will decrease the debt to GDP ratio by more than (1 + 𝑟) (1 + 𝛿)⁄ . Otherwise, if (𝑓𝑎"%)˃0 than the ratio of debt to GDP will increase by more than the ratio of the discount rates.
Necessary condition: The necessary condition for the attainment of solvency for an economy is that 𝛿˃𝑟 mean when real growth rate exceeds the real interest rate, the ratio of (1 + 𝑟) (1 + 𝛿)⁄ ˂1 and the debt to GDP ratio will converge and remain sustained over time. On the other hand, if 𝛿˂𝑟 then an explosive debt dynamic can be experienced by the economy until the sufficient condition remains intact.
Sufficient condition: The sufficient condition for sustainability of public debt is that (𝑓𝑎"%)˃0. Methodology and data Panel Autoregressive Distributed Lag (ARDL) Model Pesaran and Smith (1995) proposed the Mean Group (MG) estimation method in which, across the sections, constant term,
Ayaz Khan, Zahoor ul Haq and Javed Iqbal
Page | 32 Global Economics Review (GER)
slop parameters, and error variances can differ. In this method, the individual model for each cross-section may be built, and a simple mean of each coefficient is calculated. Pesaran, Shin, and Smith (1999) introduced a new technique to measure the dynamic panel as Pooled Mean Group (PMG). The PMG method restricts the MG technique by making long-run coefficient to remain the same across the section while allowing short-run intercepts, coefficients, and variances to vary across the sections.
A general representation of models derived in the theoretical framework section can be given as; 𝑃𝐷𝑃𝐺!" = 𝛼# + 𝛼$𝑆𝐼𝐺𝑃𝐺!" + 𝛼%𝐵𝐷𝑃𝐺!" + 𝛼&𝐶𝐴𝑃𝐺!"
+ 𝛼'𝐺𝐷𝑃𝐺!" + 𝜀!" …… (26) Where 𝑃𝐷𝑃𝐺"% is public debt to GDP
ratio, 𝑆𝐼𝐺𝑃𝐺"% is saving-investment gap percent of GDP measure by the difference between gross saving and gross fixed capital formation, 𝐵𝐷𝑃𝐺"% fiscal account (budget deficit/surplus) percent of GDP, 𝐶𝐴𝑃𝐺"% current account (deficit/surplus) percent of GDP and 𝐺𝐷𝑃𝐺"% is GDP growth rate.
A general lag dependent panel model for time periods, 𝑡 = 1,2, … . . , 𝑇 and number of cross-sections, 𝑖 = 1,2, … . . , 𝑁 can be given as;
𝑌&! ==𝜕&'𝑦&,!"'
(
')#
+=𝛿&'𝑋&,!"'
*
')+
+ 𝜌&𝐷!
+ 𝜀&! ………………………(27) where 𝑌"% is the dependent variable, 𝑋"%
and 𝐷% are a vector of explanatory variables in which 𝑋"% vary both over time and across the section, while 𝐷% Only vary over time and includes fixed observation regressors like trend and intercept terms. The parameters of lag dependent variables 𝜕"$ are scalars and coefficient of 𝛿"$ and 𝜌" are vectors of unknowns with a white noise error term 𝜀"%.
The above model can be specified in 𝐴𝑅𝐷𝐿(𝑝. 𝑞, 𝑞, … , 𝑞) with error correction mechanism named as Pooled Mean Group (PMG) regression used by (Pesarsan et. al 1997) as; ∆𝑃𝐷𝑃𝐺!" = 𝜑!4𝑃𝐷𝑃𝐺!,")$ − 𝛽!𝑋!"8
+9𝜕!*∆𝑃𝐷𝑃𝐺!,")* ++)$
*,$
9𝛿!*∆𝑋!.")*
.)$
*,#+ 𝜌!𝐷" + 𝜀!" …(28)
𝑋"% is a vector of explanatory variables, which includes (𝑆𝐼𝐺𝑃𝐺"% , 𝐵𝐷𝑃𝐺"% , 𝐶𝐴𝑃𝐺"% , 𝐺𝐷𝑃𝐺"%). 𝜑" is the speed of adjustment parameter for each group and is expected to be less than zero i.e. 𝜑" < 0. 𝛽"is long-run relationship vector of coefficient and can be tested for the long-run relationship under Wald test approach. (𝑃𝐷𝑃𝐺",%7( − 𝛽"𝑋"%) is the error correction term. 𝜕"$ and 𝛿"$ are the short-run dynamics coefficients and 𝜀"% is a white noise error term. For unit root testing in variables taken in the study (Levin, Lin, & Chu, 2002) and (Im, Pesaran, & Shin, 2003) tests were selected.
Sustainability Measurement Referring to the models derived in the theoretical framework section, the following models are used for measuring debt sustainability for the SAARC region. Public Debt Sustainability and Current Account Sustainability in the presence of current account can be measured from equation (21) as 𝛥𝑑! =
(𝑟∗ − 𝛿)(1 + 𝛿) 𝑑!"# − 𝑐𝑎! ……… . .………(29)
Public Debt Sustainability and saving-Investment Gap Sustainability in the presence of saving investment gap can be measured from equation (23) as 𝑠𝑖𝑑! =
(#./)(#.1)
𝑠𝑖𝑑!"# − '𝑠$,! − 𝑖$,!(.…………(30)
Evaluating the Determinants and Sustainability of Public Debt for the South Asian Association for Regional Cooperation (SAARC) Countries
Vol. VI, No. II (Spring 2021) Page | 33
Public Debt Sustainability and Fiscal Account Sustainability in the presence of fiscal account can be measured from equation (25) as 𝑏! =
(1 + 𝑟)(1 + 𝛿) 𝑏!"# −
(𝑓𝑎&!)˃0………………(31)
Data The data for the analysis is taken from the World Development Indicators (WDI) and International Monetary Fund (IMF) latest data sets. For the measurement of sustainability, average values of the variables were obtained from all SAARC countries' data sets.
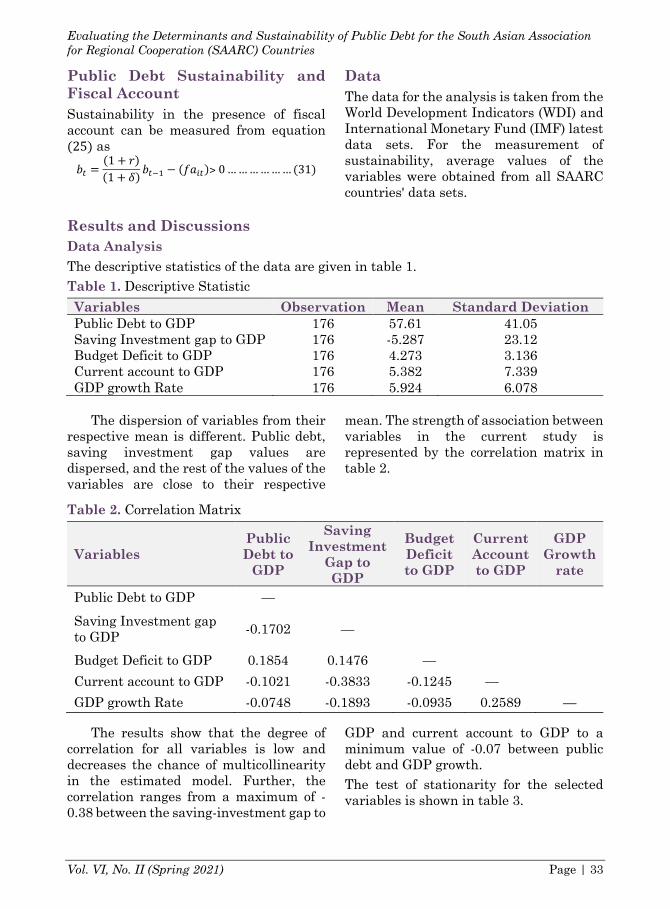
Results and Discussions Data Analysis The descriptive statistics of the data are given in table 1. Table 1. Descriptive Statistic Variables Observation Mean Standard Deviation Public Debt to GDP 176 57.61 41.05 Saving Investment gap to GDP 176 -5.287 23.12 Budget Deficit to GDP 176 4.273 3.136 Current account to GDP 176 5.382 7.339 GDP growth Rate 176 5.924 6.078
The dispersion of variables from their
respective mean is different. Public debt, saving investment gap values are dispersed, and the rest of the values of the variables are close to their respective
mean. The strength of association between variables in the current study is represented by the correlation matrix in table 2.
Table 2. Correlation Matrix
Variables Public Debt to
GDP
Saving Investment
Gap to GDP
Budget Deficit to GDP
Current Account to GDP
GDP Growth
rate
Public Debt to GDP — Saving Investment gap to GDP -0.1702 —
Budget Deficit to GDP 0.1854 0.1476 — Current account to GDP -0.1021 -0.3833 -0.1245 — GDP growth Rate -0.0748 -0.1893 -0.0935 0.2589 —
The results show that the degree of
correlation for all variables is low and decreases the chance of multicollinearity in the estimated model. Further, the correlation ranges from a maximum of -0.38 between the saving-investment gap to
GDP and current account to GDP to a minimum value of -0.07 between public debt and GDP growth. The test of stationarity for the selected variables is shown in table 3.
Ayaz Khan, Zahoor ul Haq and Javed Iqbal
Page | 34 Global Economics Review (GER)
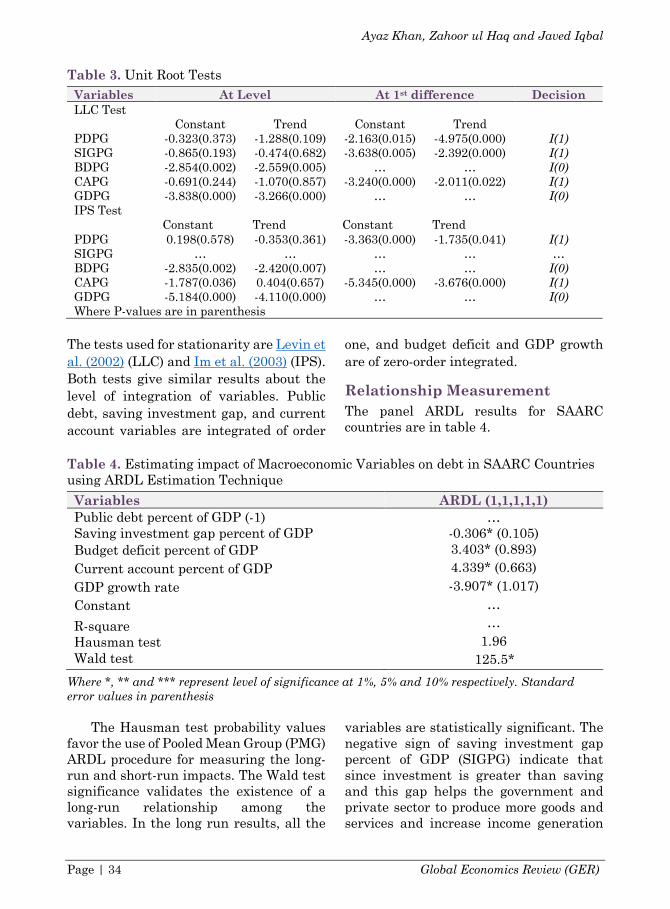
Table 3. Unit Root Tests Variables At Level At 1st difference Decision LLC Test Constant Trend Constant Trend PDPG -0.323(0.373) -1.288(0.109) -2.163(0.015) -4.975(0.000) I(1) SIGPG -0.865(0.193) -0.474(0.682) -3.638(0.005) -2.392(0.000) I(1) BDPG -2.854(0.002) -2.559(0.005) … … I(0) CAPG -0.691(0.244) -1.070(0.857) -3.240(0.000) -2.011(0.022) I(1) GDPG -3.838(0.000) -3.266(0.000) … … I(0) IPS Test Constant Trend Constant Trend PDPG 0.198(0.578) -0.353(0.361) -3.363(0.000) -1.735(0.041) I(1) SIGPG … … … … … BDPG -2.835(0.002) -2.420(0.007) … … I(0) CAPG -1.787(0.036) 0.404(0.657) -5.345(0.000) -3.676(0.000) I(1) GDPG -5.184(0.000) -4.110(0.000) … … I(0) Where P-values are in parenthesis
The tests used for stationarity are Levin et al. (2002) (LLC) and Im et al. (2003) (IPS). Both tests give similar results about the level of integration of variables. Public debt, saving investment gap, and current account variables are integrated of order
one, and budget deficit and GDP growth are of zero-order integrated.
Relationship Measurement The panel ARDL results for SAARC countries are in table 4.
Table 4. Estimating impact of Macroeconomic Variables on debt in SAARC Countries using ARDL Estimation Technique Variables ARDL (1,1,1,1,1) Public debt percent of GDP (-1) … Saving investment gap percent of GDP -0.306* (0.105) Budget deficit percent of GDP 3.403* (0.893) Current account percent of GDP 4.339* (0.663) GDP growth rate -3.907* (1.017) Constant … R-square Hausman test Wald test
… 1.96
125.5* Where *, ** and *** represent level of significance at 1%, 5% and 10% respectively. Standard error values in parenthesis
The Hausman test probability values favor the use of Pooled Mean Group (PMG) ARDL procedure for measuring the long-run and short-run impacts. The Wald test significance validates the existence of a long-run relationship among the variables. In the long run results, all the
variables are statistically significant. The negative sign of saving investment gap percent of GDP (SIGPG) indicate that since investment is greater than saving and this gap helps the government and private sector to produce more goods and services and increase income generation
Evaluating the Determinants and Sustainability of Public Debt for the South Asian Association for Regional Cooperation (SAARC) Countries
Vol. VI, No. II (Spring 2021) Page | 35
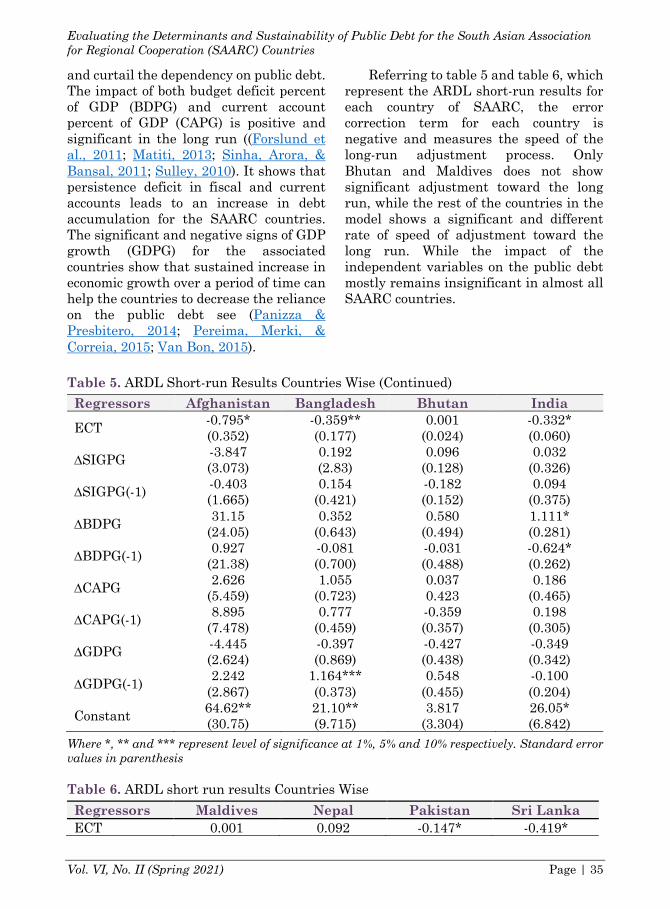
and curtail the dependency on public debt. The impact of both budget deficit percent of GDP (BDPG) and current account percent of GDP (CAPG) is positive and significant in the long run ((Forslund et al., 2011; Matiti, 2013; Sinha, Arora, & Bansal, 2011; Sulley, 2010). It shows that persistence deficit in fiscal and current accounts leads to an increase in debt accumulation for the SAARC countries. The significant and negative signs of GDP growth (GDPG) for the associated countries show that sustained increase in economic growth over a period of time can help the countries to decrease the reliance on the public debt see (Panizza & Presbitero, 2014; Pereima, Merki, & Correia, 2015; Van Bon, 2015).
Referring to table 5 and table 6, which represent the ARDL short-run results for each country of SAARC, the error correction term for each country is negative and measures the speed of the long-run adjustment process. Only Bhutan and Maldives does not show significant adjustment toward the long run, while the rest of the countries in the model shows a significant and different rate of speed of adjustment toward the long run. While the impact of the independent variables on the public debt mostly remains insignificant in almost all SAARC countries.
Table 5. ARDL Short-run Results Countries Wise (Continued) Regressors Afghanistan Bangladesh Bhutan India
ECT -0.795* (0.352)
-0.359** (0.177)
0.001 (0.024)
-0.332* (0.060)
∆SIGPG -3.847 (3.073)
0.192 (2.83)
0.096 (0.128)
0.032 (0.326)
∆SIGPG(-1) -0.403 (1.665)
0.154 (0.421)
-0.182 (0.152)
0.094 (0.375)
∆BDPG 31.15 (24.05)
0.352 (0.643)
0.580 (0.494)
1.111* (0.281)
∆BDPG(-1) 0.927 (21.38)
-0.081 (0.700)
-0.031 (0.488)
-0.624* (0.262)
∆CAPG 2.626 (5.459)
1.055 (0.723)
0.037 0.423
0.186 (0.465)
∆CAPG(-1) 8.895 (7.478)
0.777 (0.459)
-0.359 (0.357)
0.198 (0.305)
∆GDPG -4.445 (2.624)
-0.397 (0.869)
-0.427 (0.438)
-0.349 (0.342)
∆GDPG(-1) 2.242 (2.867)
1.164*** (0.373)
0.548 (0.455)
-0.100 (0.204)
Constant 64.62** (30.75)
21.10** (9.715)
3.817 (3.304)
26.05* (6.842)
Where *, ** and *** represent level of significance at 1%, 5% and 10% respectively. Standard error values in parenthesis Table 6. ARDL short run results Countries Wise Regressors Maldives Nepal Pakistan Sri Lanka ECT 0.001 0.092 -0.147* -0.419*
Ayaz Khan, Zahoor ul Haq and Javed Iqbal
Page | 36 Global Economics Review (GER)
(0.025) 0.208 (0.049) (0.116)
∆SIGPG …
-1.065 (0.450)
-0.546 (0.333)
0.445 (0.448)
∆SIGPG(-1) …
0.517 (0.613)
0.049 (0.300)
1.050* (0.442)
∆BDPG -0.044 (.226)
9.125* (3.471)
1.143** (0.544)
0.389 (0.917)
∆BDPG(-1) 0.007 (0.218)
0.050 (2.686)
-0.023 (0.516)
-0.147 (0.971)
∆CAPG 0.067 (0.128)
4.657* (1.589)
0.291 (0.384)
1.489* (0.556)
∆CAPG(-1) -0.039 (0.098)
1.445 (1.259)
-0.241 (0.341)
1.277* (0.458)
∆GDPG -0.308* (0.114)
-4.808* (1.920)
-0.407 (0.592)
-0.212 (0.466)
∆GDPG(-1) -0.251* (0.090)
-0.954 (1.426)
-0.210 (0.446)
-1.063* (0.376)
Constant 0.950 (2.457)
69.80* (17.10)
11.44* (4.114)
38.84* (10.07)
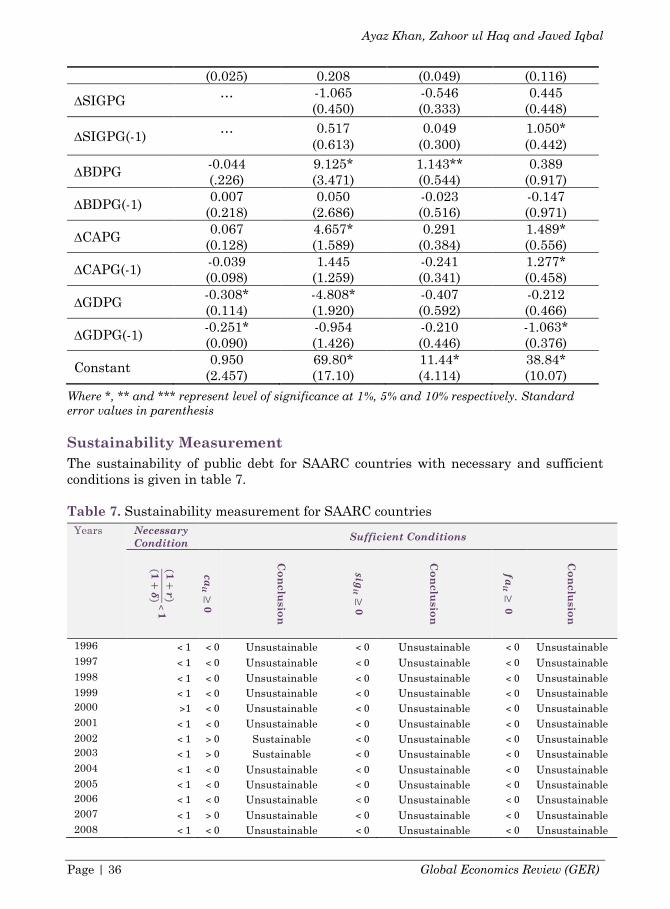
Where *, ** and *** represent level of significance at 1%, 5% and 10% respectively. Standard error values in parenthesis Sustainability Measurement The sustainability of public debt for SAARC countries with necessary and sufficient conditions is given in table 7. Table 7. Sustainability measurement for SAARC countries
Years Necessary Condition Sufficient Conditions
(𝟏+𝒓 )
(𝟏+𝜹 ) ˂ 𝟏
𝒄𝒂𝒊𝒕 ≥
𝟎
Conclusion
𝒔𝒊𝒈𝒊𝒕 ≥
𝟎
Conclusion
𝒇𝒂𝒊𝒕 ≥
𝟎
Conclusion
1996 ˂1 ˂0 Unsustainable ˂0 Unsustainable ˂0 Unsustainable 1997 ˂1 ˂0 Unsustainable ˂0 Unsustainable ˂0 Unsustainable 1998 ˂1 ˂0 Unsustainable ˂0 Unsustainable ˂0 Unsustainable 1999 ˂1 ˂0 Unsustainable ˂0 Unsustainable ˂0 Unsustainable 2000 ˃1 ˂0 Unsustainable ˂0 Unsustainable ˂0 Unsustainable 2001 ˂1 ˂0 Unsustainable ˂0 Unsustainable ˂0 Unsustainable 2002 ˂1 ˃0 Sustainable ˂0 Unsustainable ˂0 Unsustainable 2003 ˂1 ˃0 Sustainable ˂0 Unsustainable ˂0 Unsustainable 2004 ˂1 ˂0 Unsustainable ˂0 Unsustainable ˂0 Unsustainable 2005 ˂1 ˂0 Unsustainable ˂0 Unsustainable ˂0 Unsustainable 2006 ˂1 ˂0 Unsustainable ˂0 Unsustainable ˂0 Unsustainable 2007 ˂1 ˃0 Unsustainable ˂0 Unsustainable ˂0 Unsustainable 2008 ˂1 ˂0 Unsustainable ˂0 Unsustainable ˂0 Unsustainable
Evaluating the Determinants and Sustainability of Public Debt for the South Asian Association for Regional Cooperation (SAARC) Countries
Vol. VI, No. II (Spring 2021) Page | 37
Years Necessary Condition Sufficient Conditions
(𝟏+𝒓)
(𝟏+𝜹) ˂𝟏
𝒄𝒂𝒊𝒕 ≥
𝟎
Conclusion
𝒔𝒊𝒈𝒊𝒕 ≥
𝟎
Conclusion
𝒇𝒂𝒊𝒕 ≥
𝟎
Conclusion
2009 ˂1 ˂0 Unsustainable ˂0 Unsustainable ˂0 Unsustainable 2010 ˂1 ˂0 Unsustainable ˂0 Unsustainable ˂0 Unsustainable 2011 ˂1 ˂0 Unsustainable ˂0 Unsustainable ˂0 Unsustainable 2012 ˂1 ˂0 Unsustainable ˂0 Unsustainable ˂0 Unsustainable 2013 ˂1 ˂0 Unsustainable ˂0 Unsustainable ˂0 Unsustainable 2014 ˂1 ˂0 Unsustainable ˃0 Sustainable ˂0 Unsustainable 2015 ˂1 ˂0 Unsustainable ˂0 Unsustainable ˂0 Unsustainable 2016 ˂1 ˂0 Unsustainable ˂0 Unsustainable ˂0 Unsustainable 2017 ˂1 ˂0 Unsustainable ˂0 Unsustainable ˂0 Unsustainable
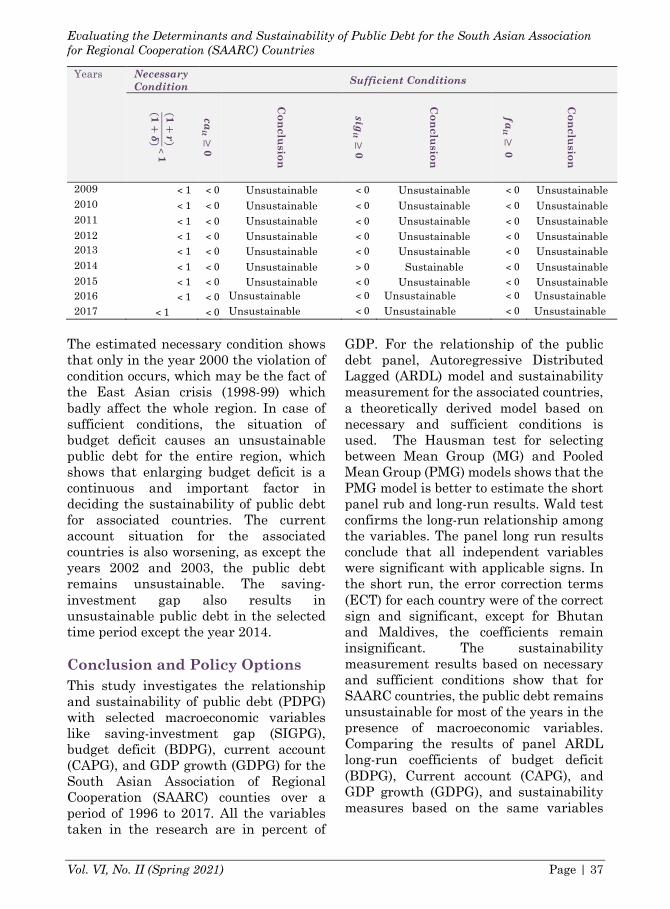
The estimated necessary condition shows that only in the year 2000 the violation of condition occurs, which may be the fact of the East Asian crisis (1998-99) which badly affect the whole region. In case of sufficient conditions, the situation of budget deficit causes an unsustainable public debt for the entire region, which shows that enlarging budget deficit is a continuous and important factor in deciding the sustainability of public debt for associated countries. The current account situation for the associated countries is also worsening, as except the years 2002 and 2003, the public debt remains unsustainable. The saving-investment gap also results in unsustainable public debt in the selected time period except the year 2014. Conclusion and Policy Options This study investigates the relationship and sustainability of public debt (PDPG) with selected macroeconomic variables like saving-investment gap (SIGPG), budget deficit (BDPG), current account (CAPG), and GDP growth (GDPG) for the South Asian Association of Regional Cooperation (SAARC) counties over a period of 1996 to 2017. All the variables taken in the research are in percent of
GDP. For the relationship of the public debt panel, Autoregressive Distributed Lagged (ARDL) model and sustainability measurement for the associated countries, a theoretically derived model based on necessary and sufficient conditions is used. The Hausman test for selecting between Mean Group (MG) and Pooled Mean Group (PMG) models shows that the PMG model is better to estimate the short panel rub and long-run results. Wald test confirms the long-run relationship among the variables. The panel long run results conclude that all independent variables were significant with applicable signs. In the short run, the error correction terms (ECT) for each country were of the correct sign and significant, except for Bhutan and Maldives, the coefficients remain insignificant. The sustainability measurement results based on necessary and sufficient conditions show that for SAARC countries, the public debt remains unsustainable for most of the years in the presence of macroeconomic variables. Comparing the results of panel ARDL long-run coefficients of budget deficit (BDPG), Current account (CAPG), and GDP growth (GDPG), and sustainability measures based on the same variables
Ayaz Khan, Zahoor ul Haq and Javed Iqbal
Page | 38 Global Economics Review (GER)
conclude that both methods validate the measurement.
The current study empirically validates the importance of saving investment gap variable situation along with fiscal account and current account outcomes and economic growth in explaining the relationship and sustainability of public debt for SAARC countries. It is advised that countries in the association should formulate policies that promote saving culture. This saving
culture not only promotes investment but also can affect the current account situation of the countries. The focus of policymakers should also be toward sustained economic growth as it can curb the public debt. The unnecessary increase in expenditures and directing policies toward productive projects can help in decreasing the budget deficit and enhancing national saving which in return can positively influence the current account and can reduce the reliance on public debt.
Evaluating the Determinants and Sustainability of Public Debt for the South Asian Association for Regional Cooperation (SAARC) Countries
Vol. VI, No. II (Spring 2021) Page | 39
References Afonso, A. (2005). Fiscal sustainability:
The unpleasant European case. FinanzArchiv/Public Finance Analysis, 19-44.
Ahmed, S., & Rogers, J. H. (1995). Government budget deficits and trade deficits Are present value constraints satisfied in long-term data? Journal of Monetary Economics, 36(2), 351-374.
Campos, C. F., Jaimovich, D., & Panizza, U. (2006). The unexplained part of public debt. Emerging Markets Review, 7(3), 228-243.
CArneiro, D. D. (1997). A sustentabilidade dos déficits externos. revista ANPEC, 1(3), 11-28.
Crowder, W. J. (1997). The long-run Fisher relation in Canada. Canadian Journal of Economics, 1124-1142.
Deaton, A., & Muellbauer, J. (1980). Economics and consumer behavior: Cambridge university press.
Doğan, İ., & Bilgili, F. (2014). The non-linear impact of high and growing government external debt on economic growth: A Markov Regime-switching approach. Economic Modelling, 39, 213-220.
Fincke, B., & Greiner, A. (2011). Debt sustainability in selected euro area countries: Empirical evidence estimating time-varying parameters. Studies in Nonlinear Dynamics Econometrics, 15(3).
Forslund, K., Lima, L., & Panizza, U. (2011). The determinants of the composition of public debt in developing and emerging market countries. Review of Development Finance, 1(3-4), 207-222.
Greiner, A., & Semmler, W. (1999). An inquiry into the sustainability of German fiscal policy: Some Time-Series Tests. Public Finance Review, 27(2), 220-236.
Hakkio, C. S., & Rush, M. (1991). Is the budget deficit “too large?”. Journal of Economic inquiry, 29(3), 429-445.
Hamilton, J. D., & Flavin, M. A. (1985). On the limitations of government borrowing: A framework for empirical testing. National Bureau of Economic Research.
Haug, A. A. (1991). Cointegration and government borrowing constraints: Evidence for the United States. Journal of Business Economic Statistics, 9(1), 97-101.
Im, K. S., Pesaran, M. H., & Shin, Y. (2003). Testing for unit roots in heterogeneous panels. Journal of econometrics, 115(1), 53-74.
Irving, F. (1930). The theory of interest: New York: Kelley, Reprint of the Edition.
Krugman, P. R. (1988). Financing vs. forgiving a debt overhang (0898-2937).
Levin, A., Lin, C.-F., & Chu, C.-S. J. (2002). Unit root tests in panel data: asymptotic and finite-sample properties. Journal of econometrics, 108(1), 1-24.
Matiti, C. M. (2013). The effect of selected determinants on public debt in Kenya. University of Nairobi,
Panizza, U., & Presbitero, A. F. (2014). Public debt and economic growth: is there a causal effect? Journal of Macroeconomics, 41, 21-41.
Papadopoulos, A. P., & Sidiropoulos, M. G. (1999). The sustainability of fiscal policies in the European Union. International Advances in Economic Research, 5(3), 289-307.
Payne, J. E. (1997). International evidence on the sustainability of budget deficits. Applied Economics Letters, 4(12), 775-779.
Pereima, J. B., Merki, M., & Correia, F. M. (2015). Economic growth and public debt: Addressing unobserved
Ayaz Khan, Zahoor ul Haq and Javed Iqbal
Page | 40 Global Economics Review (GER)
heterogeneity.http://www.economia.ufpr.br.
Pesaran, M. H., & Smith, R. (1995). Estimating long-run relationships from dynamic heterogeneous panels. Journal of econometrics, 68(1), 79-113.
Pesaran, M. H., Shin, Y., & Smith, R. P. (1999). Pooled mean group estimation of dynamic heterogeneous panels. Journal of the American statistical Association, 94(446), 621-634.
Qayyum, U., Din, M.-u., & Haider, A. (2014). Foreign aid, external debt and governance. Economic Modelling, 37, 41-52.
Quintos, C. E. (1995). Sustainability of the deficit process with structural shifts. Journal of Business Economic and Statistics, 13(4), 409-417.
Reinhart, C. M., & Rogoff, K. S. (2008). This time is different: A panoramic view of eight centuries of financial crises. National Bureau of Economic Research.
Rocha, F., & Bender, S. (2000). Present value tests of the Brazilian current account. Revista de Economia Aplicada.
Sachs, J. (1988). The Debt Overhang of Developing Countries. Ronald Findlay, Guillermo Calvo, Pentti J. Kouri, Jorge Braga de Macedo, Basil Blackwell.
Sawada, Y. (1994). Are the heavily indebted countries solvent?: Tests of intertemporal borrowing constraints. Journal of Development Economics, 45(2), 325-337.
Schumacher, J., & di Mauro, B. W. (2015). Greek debt sustainability and official
crisis lending. Brookings Papers on Economic Activity, 279-305.
Seiferling, M. M. (2013). Stock-flow adjustments, government’s integrated balance sheet and fiscal transparency: International Monetary Fund.
Sinha, P., Arora, V., & Bansal, V. (2011). Determinants of Public Debt for middle income and high income group countries using Panel Data regression.
Sulley, P. E. (2010). Macroeconomic Determinants of Accumulation of Public External Debt: The Case of Tanzania. Economics of Development (ECD). http://hdl.handle.net/2105/8647
Tanner, E., & Liu, P. (1994). Is the budget deficit “too large”?: some further evidence. Economic Inquiry, 32(3), 511-518.
Teles, V. K., & Mussolini, C. C. (2014). Public debt and the limits of fiscal policy to increase economic growth. European Economic Review, 66, 1-15.
Van Bon, N. (2015). The relationship between public debt and inflation in developing countries: Empirical evidence based on difference panel GMM. Asian Journal of Empirical Research, 5(9), 128-142.
Weber, A. (2012). Stock-flow adjustments and fiscal transparency: A cross-country comparison: International Monetary Fund.
Wilcox, D. W. (1989). The sustainability of government deficits: Implications of the present-value borrowing constraint. Journal of Money, Credit and Banking, 21(3), 291-306.