Embed Size (px)
Citation preview

1
byRobin V. Davis, P.G.Project ManagerUtah Department of Environmental QualityLeaking Underground Storage [email protected] 801-536-4177
Evaluating the Petroleum
Studies of Natural Attenuation of Subsurface Petroleum Hydrocarbons
Vapor Intrusion Pathway
& Recommended Screening Criteria
THANKS TO SPONSORS: AEHS, API, EPA OUST
AEHS 26nd Annual International Conference on Soil, Sediment, Water & Energy, Amherst, Massachusetts
Vapor Intrusion Workshop, Monday October 18, 2010

2
OBJECTIVE
• Develop guidance for screening/exclusion criteria to determine when PVI pathway is incomplete
• Understand why so many LUST sites exist nationwide, but few report cases of petroleum vapor intrusion to indoor air
• Petroleum Vapor Database:
• Show mechanisms, characteristics & trends of petroleum hydrocarbon vapor biodegradation
• Avoid unnecessary, $costly$ PVI investigations
SCOPE
Compile basic, high-quality field data to evaluate vapor intrusion pathway: soil type, source extent & degree, LNAPL, DTW, contaminant concentrations in dissolved & vapor phases
The objective of studying and evaluating the behavior of subsurface petroleum
vapors is to understand why, with so many LUST sites worldwide, the PVI pathway
is rarely complete. Advancing our knowledge enables us to develop screening criteria to determine when PVI investigations are necessary.
The scope of evaluating the PVI pathway involves collecting and compiling basic
site data (Petroleum Vapor Database). A LUST site must be fully characterized by collecting basic, good-quality data wherein the nature, extent & degree of
contamination and contaminant sources are fully defined (required by 40 CFR Part
280) and provide knowledge of contaminant distribution in soil and groundwater,
including temporal effects such as fluctuating DTW. Once these subsurface
characteristics are understood, LUST PMs can better understand if the PVI pathway may be complete and if VI investigations are really necessary. VI investigations are
costly and highly invasive to properties and their occupants, and unnecessary work
should be avoided.
Detailed discussion of the Petroleum Vapor Database is provided in Davis R.V.,
2009, LUSTLine #61.

3
Petroleum Hydrocarbon Vapor Intrusion
Recent Timeline & History
Work Groups & Studies of
2002-2010
4
• 2002: EPA OSWER Draft Guide for Vapor Intrusion Evaluations:� Comprehensive
� Cautious screening criteria
� Recommends forming work group to study VI pathway for petroleum
� Recommends for chlorinated hydrocarbons, NOT petroleum LUST sites because biodegradation is not considered
• 2003-2005: EPA OUST & States Petroleum Vapor Intrusion Work Group
� Compiled international database (U.S. & Canada)
� Studied behavior of subsurface petroleum hydrocarbons associatedwith PVI pathway
• 2005-2010: Continued Field & Modeling Research Studies
� Bio Vapor Model: Analytical Model, accounts for biodegradation of petroleum hydrocarbons in the subsurface (DeVaull and McHugh, 2010)
� American Petroleum Institute (API) Work Group, peer-reviews EPA OUST petroleum vapor database, compiles more data
� EPA OUST PVI Work Group revived, database much larger, testing models, preparing to publish PVI guidance
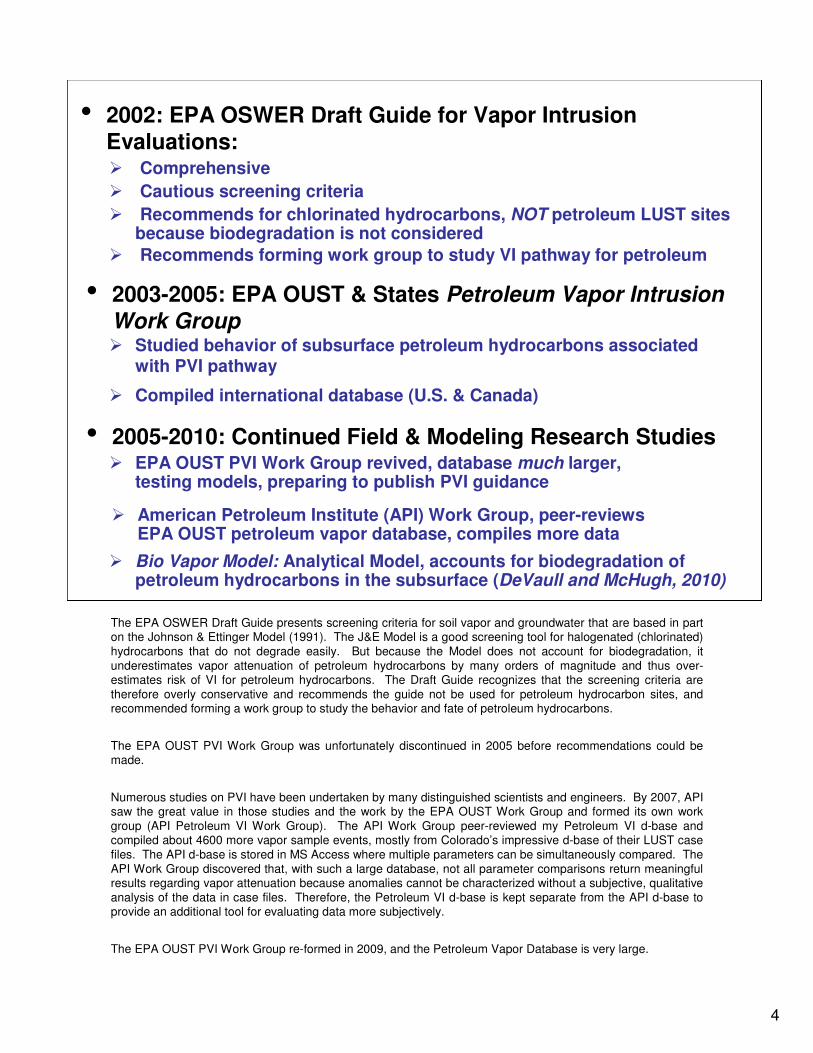
The EPA OSWER Draft Guide presents screening criteria for soil vapor and groundwater that are based in part on the Johnson & Ettinger Model (1991). The J&E Model is a good screening tool for halogenated (chlorinated)
hydrocarbons that do not degrade easily. But because the Model does not account for biodegradation, it
underestimates vapor attenuation of petroleum hydrocarbons by many orders of magnitude and thus over-estimates risk of VI for petroleum hydrocarbons. The Draft Guide recognizes that the screening criteria are
therefore overly conservative and recommends the guide not be used for petroleum hydrocarbon sites, and recommended forming a work group to study the behavior and fate of petroleum hydrocarbons.
The EPA OUST PVI Work Group was unfortunately discontinued in 2005 before recommendations could be made.
Numerous studies on PVI have been undertaken by many distinguished scientists and engineers. By 2007, API saw the great value in those studies and the work by the EPA OUST Work Group and formed its own work
group (API Petroleum VI Work Group). The API Work Group peer-reviewed my Petroleum VI d-base and compiled about 4600 more vapor sample events, mostly from Colorado’s impressive d-base of their LUST case
files. The API d-base is stored in MS Access where multiple parameters can be simultaneously compared. The
API Work Group discovered that, with such a large database, not all parameter comparisons return meaningful results regarding vapor attenuation because anomalies cannot be characterized without a subjective, qualitative
analysis of the data in case files. Therefore, the Petroleum VI d-base is kept separate from the API d-base to provide an additional tool for evaluating data more subjectively.
The EPA OUST PVI Work Group re-formed in 2009, and the Petroleum Vapor Database is very large.

5
Results of Published Studies
� Characteristics of petroleum vapor attenuation are well-understood & predictable
� Vapors attenuate with sufficient thickness of clean oxygenated (aerobic) overlying soil; Oxygen 1%-6%
� Vapors attenuate by 100 to 1,000,000-fold, most 1000-10,000-fold
� Biodegradation of PHCs by hundreds/thousands microbial genera/ species proven by 100 years of published research
� LNAPL, contaminated soil or high dissolved concentrations near or in direct contact with buildings, sumps, elevator shafts
• Causes of vapor intrusion
• Subsurface soil is a natural bioreactor:
• No reported cases of PHC vapor intrusion from low source strengths
The characteristics of subsurface petroleum vapor attenuation and causes of vapor
intrusion by petroleum hydrocarbons are well-understood. For vapors to biodegrade and attenuate, there must be a sufficient thickness of clean, aerobic soil that
contains oxygen between 1% (DeVaull, 2007) and 6% (Davis R.V., 2009; Sanders
and Hers, 2006).
There are no reported cases of vapor intrusion from low dissolved source strengths.
All reported cases of vapor intrusion from petroleum sources are caused by
LNAPL/free product, contaminated soil or very high dissolved concentrations in
direct contact or proximity to buildings or anthropogenic/engineered preferential
pathways such as sumps, elevator shafts, improperly sealed utility conduits into buildings, and groundwater cleanup systems (i.e. air sparging) that do not
adequately capture vapors.

66
UST
Contaminated soil
Dissolved contamination
Clean aerobic soil
LNAPL & contaminated soil
Strong vapor source from LNAPL
& contaminated soil
Weak Vapor Source from
Dissolved Plume
HENRY’S LAW CONSTANT
Characterize Site, Know Extent & Degree of Contamination & Sources
of Petroleum Vapors
Gas Station Building
Conceptual Site Model
Build a Site Conceptual Model based on site-specific data. Title 40 of the
Code of Federal Regulations, Part 280 for leaking USTs requires that sites be fully characterized, and decisions be based on adequate site
characterization where the extent and degree of contamination and
contaminant sources are known and well-defined. The presence and
thickness of clean soil above contaminant sources are generally known in
the early phases of site characterization. Clean soil contains the necessary oxygen for biodegrading PHCs and can be easily characterized with
accurate logs of soil cores and samples.
Volatile compounds associated with LNAPL, contaminated soil, and very high dissolved contaminant concentrations can generate very high vapor
concentrations that, when in close proximity to buildings or utilities, can
cause PVI. Those conditions are the only known cases of petroleum vapor
intrusion.
Contaminants dissolved in GW partition to vapor phase according to Henry’s
Law Constant. There are no known or reported cases of petroleum vapor
intrusion associated with low dissolved-phase concentrations at or near
buildings or utilities.

7
Recognize Signature Characteristics of Aerobic Biodegradation & Attenuation of
Petroleum Hydrocarbon Vapors
Beaufort, SC NJ-VW2
(Lahvis, et al., 1999)
0
5
10
15
0 5 10 15 20 25
O2 & CO2 (% V/V)
1.E+00 1.E+02 1.E+04 1.E+06 1.E+08
Benzene (ug/m3)
Oxygen
Carbon Dioxide
Benzene
Benzene in GW
16,000 ug/L
Vapor Monitoring Well NJ-VW-2
De
pth
fe
et
bg
s
Beaufort, SC, Lahvis et al, 1999
Sand, fine-grained, silt
8 ft clean soil attenuates vapors
Subsurface Bio-AF=7E-07
Profile of a typical vapor monitoring well from Petroleum Vapor d-base shows
unmistakable signature characteristics of subsurface vapor attenuation: Each symbol
represents depth of a vapor completion point in a multi-depth vapor monitoring well.
Contaminants near source exhibit high vapor concentrations, with associated oxygen
depletion & carbon dioxide enrichment. As contaminant vapors diffuse upward through
clean, oxygenated soil, they degrade aerobically wherein oxygen is consumed, carbon
dioxide is produced, and contaminant concentrations decrease away from source. When
contaminants are degraded, oxygen and carbon dioxide rebound to near-atmospheric
concentrations.
8
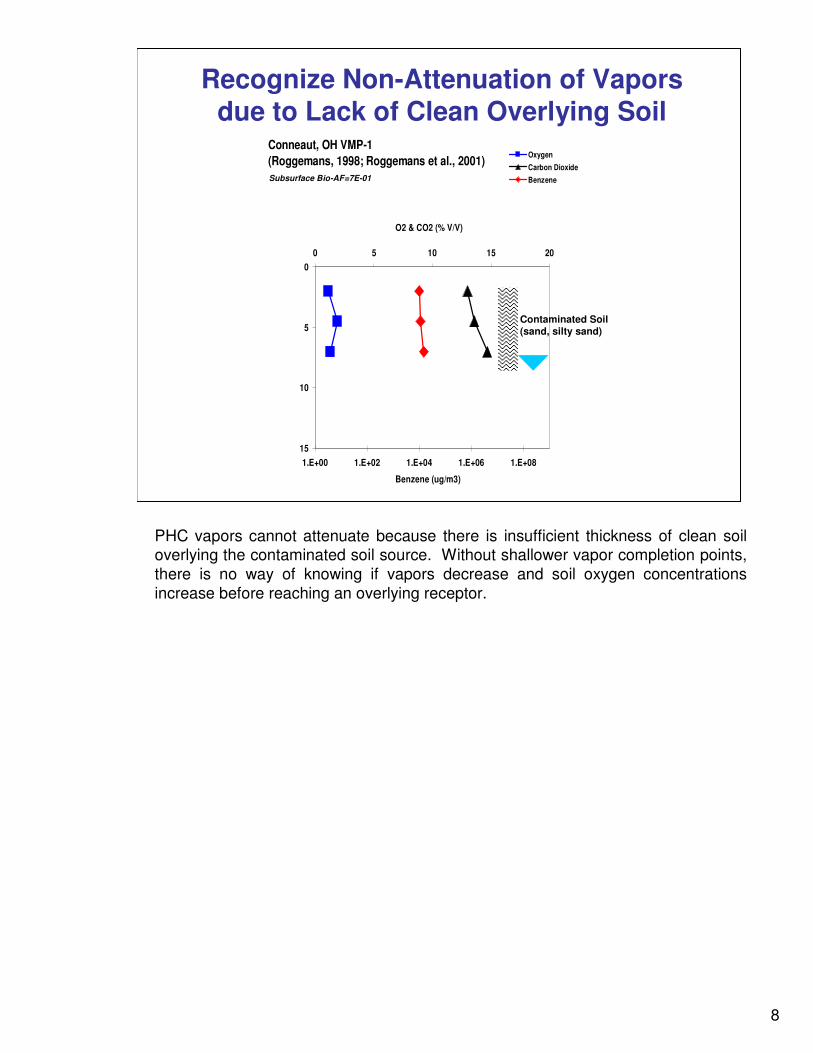
Recognize Non-Attenuation of Vapors due to Lack of Clean Overlying Soil
Conneaut, OH VMP-1
(Roggemans, 1998; Roggemans et al., 2001)
AF 7E-01
0
5
10
15
0 5 10 15 20
O2 & CO2 (% V/V)
1.E+00 1.E+02 1.E+04 1.E+06 1.E+08
Benzene (ug/m3)
Oxygen
Carbon Dioxide
Benzene
Contaminated Soil (sand, silty sand)
Subsurface Bio-AF=7E-01
PHC vapors cannot attenuate because there is insufficient thickness of clean soil overlying the contaminated soil source. Without shallower vapor completion points,
there is no way of knowing if vapors decrease and soil oxygen concentrations
increase before reaching an overlying receptor.

9
VW-118/26/06
0
2
4
6
8
10
12
14
1.00E+00 1.00E+03 1.00E+06 1.00E+09
SV Concentration, ug/m3
De
pth
, fe
et
bg
s
Benzene SV, ug/m3
TPH SV, ug/m3
VW-116/27/07
0
2
4
6
8
10
12
141.00E+00 1.00E+03 1.00E+06 1.00E+09
SV Concentration, ug/m3
De
pth
, fe
et
bg
s
Benzene SV, ug/m3
TPH SV, ug/m3
Hal’s, Green River, UtahVW-11
8/26/06 6/27/07
Recognize Importance of Shallow Vapor Completion Points
Shallow points
confirm
attenuation
above
contaminated
zone
No attenuation
within
contaminated
zone
Example of apparent non-attenuation due to no shallow soil completion point in 2006
This slide shows benzene and TPH vapor profiles of vapor well VW-11 from two different sampling dates, the earlier 8/06 event having no shallow completion. Vapor
concentrations are very high within the contaminated soil zone (patterned area)
and, from the 8/26/06 sampling event where the shallowest vapor sample was
obtained from 4 feet deep, vapors appear to not attenuate below the overlying
paved road. However, on 6/27/07, vapor samples obtained from 2.5 feet deep showed nearly complete vapor attenuation. Leak testing confirmed the good
integrity of each completion point.
Some practitioners maintain that vapor completion points set too shallow (some say <5 feet deep) may be subject to short-circuiting or otherwise drawing in atmospheric
air, causing a false-negative effect on vapor analyses. Others argue that this effect
is not occurring at most sites because, according to standard sampling practices,
vapor samples are obtained relatively quickly (“grab samples”) and draw vapor in
from the area directly around the completion point. Studies in Utah show that only faulty completion points or unnecessarily long sampling times result in drawing in
atmospheric air. VW-11 is an example that shows the benefits of shallow
completion points out-weighing the perception that short-circuiting might occur.

10
Field Example:
Deep SV Benzene, ug/m3
Shallow SV Benzene, ug/m3
=AF
~1,000,000x contaminant reduction
~1 ug/m3
145,000 ug/m3AF = = 7E-06
Expressing Magnitude of Subsurface Vapor Attenuation
“Attenuation Factor” AF
= ratio of shallow subsurface vapor concentration divided by deep
Low AF = Great attenuation of contaminants
Beaufort, SC NJ-VW2
(Lahvis, et al., 1999)
0
5
10
15
0 5 10 15 20 25
O2 & CO2 (% V/V)
1.E+00 1.E+02 1.E+04 1.E+06 1.E+08
Benzene (ug/m3)
Oxygen
Carbon Dioxide
Benzene
Benzene in GW
16,000 ug/L
Magnitude of subsurface AFs is expressed by dividing the shallow soil vapor
concentration by the deep soil vapor concentration. The lower the AF, the greater
attenuation and contaminant reduction. Significant attenuation is observed when the
petroleum contaminant source has 2 to 10 feet of clean overlying soil. This example
shows that vapors associated with a very high source strength are fully attenuated with 7
to 8 feet of clean overlying soil and the AF is very low.

11
Petroleum Vapor Database
# Geographic Locations Evaluated
# Subsurface paired benzene soil vapor & GW sample events useful for screening criteria
54
KEY
112/608
Perth
168 sites & 910 Soil Vapor Sample Events Evaluated in the United States, Canada, Australia
307
2/13
54/307
Sydney
Tasmania
This map shows the number of geographic locations and soil vapor sample events (benzene) available for evaluating attenuation and developing screening criteria. Data are currently available from sites in Canada, United States and Australia. There are approximately equal numbers of geographic locations and soil vapor events for TPH measurements.
The Petroleum Vapor Database contains measurements for spatial and temporal subsurface soil vapor sample events from multi-depth and sub-slab vapor sample points, GW measurements, reports of LNAPL if present, soil boring logs, and soil data.
The Petroleum Vapor Database was originally constructed in 2003-2005 as part the EPA OUST PVI Work Group evaluation of vapor intrusion from petroleum-only sources. This originally small database is now much larger due to continued intensive and global investigation of the petroleum vapor intrusion pathway. There is now greater confidence in making meaningful interpretations of petroleum hydrocarbon contaminated sites and determining when the petroleum vapor intrusion pathway may be complete.

12
0
20
40
60
80
100
1.E-021.E-03<1.E-04
Subsurface Vapor Attenuation Factors
Nu
mb
er
of
So
il V
ap
or
Sa
mp
le E
ve
nts
Benzene TPH
0
30
60
90
120
150
Reason 1: No
Clean
Overlying Soil
Reason 2: Low
Source
Strength
Reason 3:
Rapid
Attenuation
Near High-
Strength
Source
Nu
mb
er
of
So
il V
ap
or
Sa
mp
le E
ve
nts Benzene TPH
3 Reasons for Insignificant
AF
0
40
80
120
160
200
>1.E-011.E-011.E-021.E-03<1.E-04
Subsurface Vapor Attenuation Factors
Nu
mb
er
of
So
il V
ap
or
Sa
mp
le E
ve
nts
Benzene TPH
Distribution of Magnitude of Subsurface Petroleum Vapor Attenuation
Screen these outReasonable
application 100x to 1000x
Most events exhibit very low AFs, significant attenuation (<10,000x)
The Petroleum Vapor Intrusion d-base contains abundant data for subsurface SV events from
which meaningful AFs are derived: benzene 237, TPH 189, including many sample events
beneath buildings (benzene 53, TPH 41).
Results: Insignificant AFs >1E-02 (<100-fold contaminant reduction) are due to 3 Reasons: 1)
No clean soil overlying the source; 2) Low source strengths; 3) Vapors attenuate directly
above even very strong sources. Of the SV events exhibiting significant attenuation, the
majority of shows >10,000-fold reduction contaminant vapor concentration (AF <1E-04).
The database contains many single-point sub-slab vapor events from which AFs cannot be
determined but are still valuable for general, qualtitative evaluation. Some of those sub-slab
points have multi-depth vapor monitoring wells adjacent to the building (“near-slab” or
“exterior”). The d-base has only one site where vapor intrusion is reported to occur: Stafford,
New Jersey Building #73 (Sanders and Hers, 2006) because very high dissolved gasoline contaminant concentrations occur only 5 feet below the building. Benzene vapors do not
intrude the building (dissolved benzene 12,000 ug/L) but MTBE, 2,2,4-Trimethylpentane and
Cyclohexane do (dissolved MTBE 590,000 ug/L).
Adequate site characterization identifies these characteristics of attenuation and can
determine the need for VI investigations.

13
BioVapor Model
DeVaull & McHugh, 2010. Find it atwww.api.org/ehs/groundwater/vapor/bio
-vapor-intrusion.cfm
� Soil Vapor Sources
� Dissolved Sources
BioVapor Model is a Useful Screening Tool for Estimating Bioattenuation of PHC vapors based on field data:
Comparison of Field Data in Petroleum Vapor Database to Model Results
BioVapor has been peer-reviewed by the EPA PVI Work Group.
From the BioVapor User’s Manual:
“BioVapor is a user-friendly spreadsheet implementation of the Indoor Vapor Intrusion with Oxygen-Limited Biodegradation model presented in DeVaull, 2007.
This algebraic model incorporates a steady-state vapor source, diffusion-dominated
soil vapor transport in a homogeneous subsurface soil layer, and mixing within a
building enclosure. The soil is divided into a shallow aerobic layer including first-order biodegradation and a deeper anaerobic layer in which biodegradation is
neglected. Model equations are provided in Appendix B of this guide. The user has
three options for specifying the oxygen supply below the building foundation: 1)
direct entry of the depth of the aerobic zone below the building foundation, 2)
constant oxygen concentration below the building foundation, or 3) constant flow of atmospheric air below the building foundation. For Options 2 or 3, the model is
solved by iteratively varying the aerobic depth to match oxygen demand (due to
baseline soil respiration and biodegradation of chemicals) to oxygen supply. In the
absence of aerobic biodegradation, the model is essentially equivalent to the
Johnson and Ettinger (1991) vapor intrusion model. Although other analytical models have accounted for biodegradation with 1st-order decay, BioVaporimproves on this method by accounting for limited oxygen availability.”

14
Beaufort, SC (Lahvis et al, 1999)
Soil Vapor Field Data Compared to BioVapor Model from dissolved source
0
3
6
9
12
1.0E-01 1.0E+01 1.0E+03 1.0E+05 1.0E+07 1.0E+09
TPH-gro, ug/m3
De
pth
, fe
et
bls
TPH-gro Field-Measured, ug/m3
TPH-gro Bio Vapor Prediction, ug/m3, AF=0.1, O2=1%, foc=0.5%, Bare Earth
TPH-gro Bio Vapor Prediction, ug/m3, AF=0.1, O2=1%, foc=0.5%, Pavement
TPH-gro Bio Vapor Prediction, ug/m3, AF=0.1, O2=1%, foc=0.5%, Aerobic Depth Specified
Beaufort, SC (Lahvis et al, 1999)
Soil Vapor Field Data Compared to BioVapor Model from Dissolved Source
0
3
6
9
12
1.0E+00 1.0E+01 1.0E+02 1.0E+03 1.0E+04 1.0E+05 1.0E+06 1.0E+07
Benzene, ug/m3
De
pth
, fe
et
bls
Benzene Field-Measured, ug/m3
Benzene BioVapor Prediction, ug/m3, AF=0.1, O2=1%, foc=0.5%, Bare Earth
Benzene BioVapor Prediction, ug/m3, AF=0.1, O2=1%, foc=0.5%, Pavement
Benzene BioVapor Prediction, ug/m3, AF=0.1, O2=1%, foc=0.5%, Aerobic Depth=3.4 ft bls
Benzene in GW 16,000 ug/L
TPH in GW 67,100 ug/L
Model under-predicts attenuation by 100x to 10,000x
Beaufort, SC (Lahvis et al 1999)
Bare Soil, Near PavementDissolved Source (likely LNAPL)
Vapor profiles of field data compared to BioVapor Model using high-strength
dissolved source (although LNAPL is likely) and three scenarios, each using the same AF and O2 and foc concentrations: 1) overlying bare earth (actual on-site
condition); 2) overlying pavement, and; 3) specified depth of aerobic zone, which in
this case is known from multi-depth SV points, and can also be determined from
routine soil boring logs. The Model closely reflects the site conditions within less
than 1 order of magnitude.

15
Hal's, Green River, Utah
VW-7, 9-1-09
TPH-gro
Soil Vapor Field Data Compared to BioVapor Model
0
5
10
15
20
1.0E+00 1.0E+01 1.0E+02 1.0E+03 1.0E+04 1.0E+05 1.0E+06 1.0E+07
TPH-gro, ug/m3
De
pth
, fe
et
bls
TPH-gro Field-Measured, ug/m3
TPH-gro BioVapor Prediction, ug/m3, O2=1%, foc=0.5%
Hal's, Green River, Utah
VW-7, 9-1-09
Benzene
Soil Vapor Field Data Compared to BioVapor Model
0
5
10
15
20
1.0E+00 1.0E+01 1.0E+02 1.0E+03 1.0E+04 1.0E+05
Benzene, ug/m3
De
pth
, fe
et
bls
Benzene Field-Measured, ug/m3
Benzene Bio Vapor Prediction, ug/m3, O2=1%, foc=0.5%
Model under-predicts attenuation by 100x->1000x
Hal’s VW-7 (UDEQ 9/1/09)
Soil Vapor Source, LNAPL, Multi-Depth Near-Slab
Model under-predicts attenuation by 100x->1000x
BioVapor Model run using benzene and TPH-gro subsurface soil vapor source
concentrations. For benzene and TPH-g, the model run using defaults O2=1%, foc=0.5%, under-predicts attenuation by 100x to >1000x.
VW-7 is completed beneath asphalt about 5 feet away from building edge.

16
(Abreu-Johnson Model, Abreu et al 2009, API #4775)
Vapor source 100,000 ug/m3
Vapor source 1,000,000 ug/m3
Vapor source 10,000,000 ug/m3
Numerical Numerical Numerical Numerical ModelModelModelModel
Effect of Vapor Source Concentration & Depth Beneath BuildingsEffect of Vapor Source Concentration & Depth Beneath BuildingsEffect of Vapor Source Concentration & Depth Beneath BuildingsEffect of Vapor Source Concentration & Depth Beneath Buildings
Dr. Lilian Abreu (Arcadis) developed a 3-D numerical model to simulate the
behavior of volatile organic compounds, including petroleum hydrocarbons in the subsurface beneath buildings. The Model also simulates subsurface oxygen that
naturally diffuses in from atmospheric air, mixes in the subsurface, and facilitates
degradation of petroleum hydrocarbons.
Shown here are 3 Model runs simulating a building basement scenario with
increasingly stronger vapor source strengths. As the vapors diffuse upward, they
are attenuated as shown by the “iso-attenuation contours.” The bottom panel
shows the Model run using the strongest vapor source of 10,000,000 ug/m3, which
generally represents LNAPL, and indicates vapors are attenuated with about 10 feet of overlying soil. These results accurately reflect field conditions observed in the
Petroleum Vapor Database.

17
BioVapor Model:
� Very high-strength sources likely need PVI
investigation
Conclusions from Models
� Under-predicts subsurface attenuation & over-
predicts PVI by 10xxxx for low-to-medium-high
source strength
� Vapors associated with low source strengths
beneath buildings are attenuated with a few feet of
clean overlying soil
Abreu-Johnson Numerical Model:

18
Determine Thickness of Clean
Overlying Soil Required to
Attenuate Vapors Associated with:
Developing Screening Criteria
• Dissolved Sources
• LNAPL & Soil Sources
Screening criteria are important for determining when vapor intrusion investigations are
necessary. Data analysis of the Petroleum Vapor database shows that vapors
attenuate with some amount of clean overlying soil, and those sites exhibiting significant
vapor attenuation have subsurface AFs <0.01 (i.e., high attenuation of contaminants by greater than or equal to 100-fold). These AFs are different from the BioVapor AF
because subsurface AFs express attenuation due to biological processes and
degradation of petroleum compounds in the vadose zone.
Many practitioners want to know how much clean overlying soil is required to fully attenuate vapors of a particular dissolved source strength. To understand this
relationship, I evaluated the Petroleum VI d-base for sites in which the following
characteristics are known: depth to GW, and depth, distribution and strength of
contaminant sources and their associated vapors.
Finally, Project Managers must determine the need for sub-slab sampling because it is
highly-invasive to building owners & occupants. This procedure has been met with
understandable resistance in Utah and likely elsewhere.

19
Benzene vapor concentrations at depth
15
5
0
Feet bgs
Method for Evaluating Vapor Attenuation from Dissolved Sources
Benzene in GW 16,000 ug/L
FORMULA: 11 ft – 3 ft = 8 ft clean overlying soil
10
<1 ug/m3
2,300 ug/m3
16,700 ug/m3
145,000 ug/m3
Multi-Depth Vapor Monitoring Well
Beaufort, SC, Lahvis et al 1999
NJ-VW-2
8 feet Clean overlying soil
3 ft
4 ft
7 ft
DTW ~11 ft11 ft
Estimated Contaminated
soil zone
The Petroleum Vapor d-base contains abundant high-quality data for benzene and
TPH sample events that were evaluated line-by-line. These data include depth to groundwater, dissolved concentrations and proximal and concurrent multi-depth soil
vapor concentrations.
Method: subtract depth of deepest clean vapor sample point from the depth to groundwater. In this case, it takes 8 feet of overlying soil to attenuated vapors
associated with 16,000 ug/L benzene dissolved in GW. This method is
conservative because it does not account for contaminated smear zone soils that
may be present.

20
Near-Slab Multi-Depth, Sub-Slab
0
1
2
3
4
5
6
7
8
9
10
1 100 10,000 1,000,000
TPH, dissolved, ug/L
Th
ick
ne
ss
Cle
an
So
il R
eq
uir
ed
to
A
tte
nu
ate
TP
H V
ap
ors
, fe
et
TPH: Soil Vapor & Dissolved Paired Measurements
All Soil Types
Near-Slab Multi-Depth, Sub-Slab
0
1
2
3
4
5
6
7
8
9
10
1 10 100 1,000 10,000 100,000
Benzene, dissolved, ug/L
Th
ick
ne
ss
Cle
an
So
il R
eq
uir
ed
to
A
tte
nu
ate
Be
nz
en
e V
ap
ors
, fe
et
Benzene: Soil Vapor & Dissolved Paired Measurements
All Soil Types
Results for Dissolved Benzene & TPH Exterior + Sub-Slab
TPH: 73 exterior/near-slab + 24 sub-slab = 97 totalBenzene: 199 exterior/near-slab + 37 sub-slab = 236 total
5 ft clean overlying soil attenuates vapors associated with dissolved Benzene <1,000 ug/L, TPH 10,000 ug/L
The Petroleum Vapor d-base contains enough high-quality data to determine thickness of clean overlying soil necessary to fully attenuate vapors from their respective dissolved source strengths. There are numerous paired benzene and TPH SV & GW field measurements from about 100 geographic locations. Conservative screening criteria emerge showing that vapors associated with dissolved benzene sources of about 1,000 ug/L or less, and TPH sources of 10,000 ug/L or less are attenuated with 5 feet of clean overlying soil.
NOTE: The sample events that require over 8 feet of clean soil are from sites where the sample intervals are 8-10 feet apart or there is unreported soil contamination or free product. Attenuation at these sites likely occurs in 8 feet or less based on the trend shown by all the other data in the d-base.
Criteria for Evaluating Data Set
- Clean soil overlies groundwater (dissolved sources)
- Known depth to groundwater and dissolved sources
- Groundwater & soil vapor data collected at about same time (concurrent) from close proximity
- Complete attenuation of soil vapors defined by shallow soil vapors = 0 or <DL (which does vary; full attenuation verified by samplers/authors)
- Majority of soil vapor measurements from multi-depth soil vapor points, representative sub-slab events included
- LUST sites AND refineries
-LNAPL sites evaluated separately
21
Sub-Slab
0
1
2
3
4
5
6
7
8
9
10
1 100 10,000 1,000,000
TPH, dissolved, ug/L
Th
ick
ne
ss
Cle
an
So
il R
eq
uir
ed
to
A
tte
nu
ate
TP
H V
ap
ors
, fe
et
TPH: Soil Vapor & Dissolved Paired Measurements
Sub-Slab
0
1
2
3
4
5
6
7
8
9
10
1 10 100 1,000 10,000 100,000
Benzene, dissolved, ug/L
Th
ick
ne
ss
Cle
an
So
il R
eq
uir
ed
to
A
tte
nu
ate
Be
nz
en
e V
ap
ors
, fe
et
Benzene: Soil Vapor & Dissolved Paired Measurements
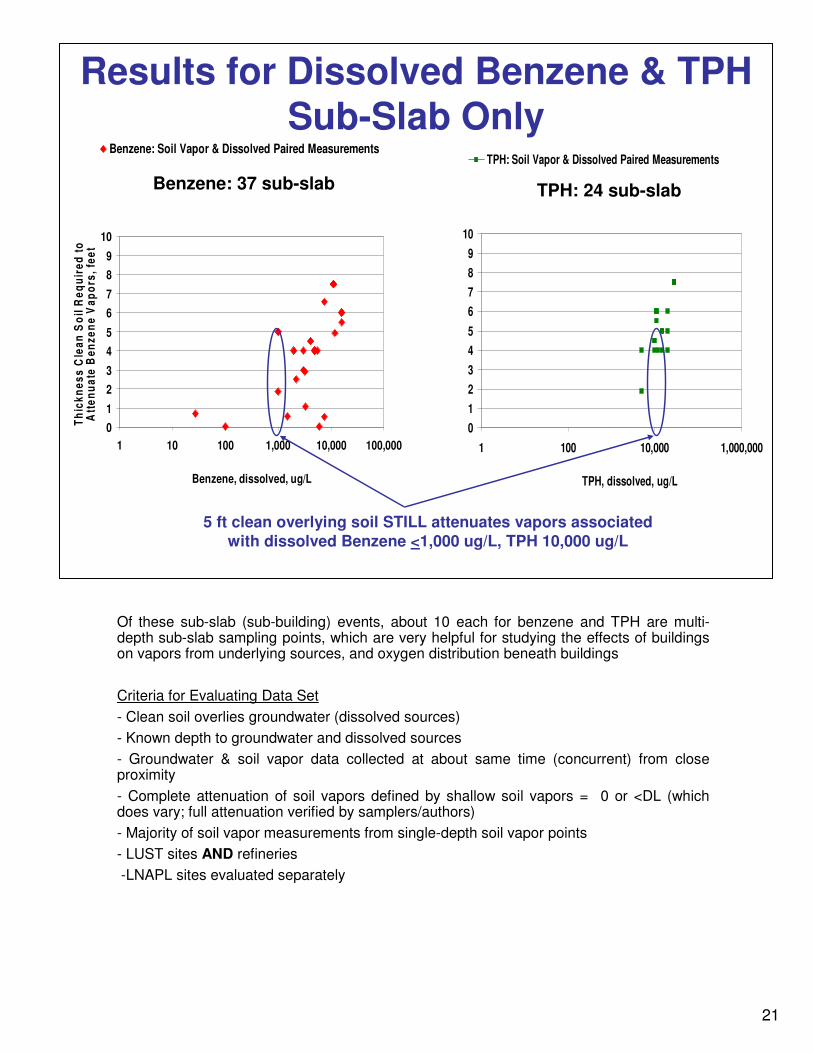
Results for Dissolved Benzene & TPH Sub-Slab Only
Benzene: 37 sub-slab TPH: 24 sub-slab
5 ft clean overlying soil STILL attenuates vapors associated with dissolved Benzene <1,000 ug/L, TPH 10,000 ug/L
Of these sub-slab (sub-building) events, about 10 each for benzene and TPH are multi-depth sub-slab sampling points, which are very helpful for studying the effects of buildings on vapors from underlying sources, and oxygen distribution beneath buildings
Criteria for Evaluating Data Set
- Clean soil overlies groundwater (dissolved sources)
- Known depth to groundwater and dissolved sources
- Groundwater & soil vapor data collected at about same time (concurrent) from close proximity
- Complete attenuation of soil vapors defined by shallow soil vapors = 0 or <DL (which does vary; full attenuation verified by samplers/authors)
- Majority of soil vapor measurements from single-depth soil vapor points
- LUST sites AND refineries
-LNAPL sites evaluated separately

22
Hard Rock: Basalt, Dolerite,
Sandstone,Siltstone, Shale
0
5
10
1 10 100 1,000 10,000 100,000
Benzene in Groundwater, ug/L
Fe
et
of
Cle
an
Ov
erl
yin
g S
oil
Re
qu
ire
d t
o A
tte
nu
ate
As
so
cia
ted
Va
po
rs
Benzene: Soil Vapor & Dissolved Paired Measurements
Fine-Grained Soil: Sandy Clay, Silt, Silty Sand,
Silty Clay, Clay, Glacial Till
0
5
10
1 10 100 1,000 10,000 100,00
0
Benzene in Groundwater, ug/L
Fe
et
Cle
an
Ov
erl
yin
g S
oil
R
eq
uir
ed
to
Att
en
ua
ate
d
As
so
cia
ted
Va
po
rs
Paired SV & GW Measurements: Benzene
Sand, gravel
0
5
10
1 10 100 1,000 10,000 100,000
Benzene in Groundwater, ug/L
Fe
et
Cle
an
Ov
erl
yin
g S
oil
Re
qu
ire
d t
o
Att
en
ua
te A
ss
oc
iate
d V
ap
ors
Paired SV & GW Measurements: Benzene
Hard Rock: Basalt, Dolerite, Sandstone, Siltstone, Shale
Results of Database Analysis of Dissolved Sources for 3 Soil Types
R. Davis & J. Wright databases
Sand, Gravel
Sand is the better
bioreactor
The field data indicate that coarse-grained soil requires less than 5 feet of clean soil thickness to attenuate vapors associated with 6,000 ug/L benzene. This is opposite of the J&E model predictions because the model assumes less attenuation in sand due to greater air-filled porosity in sand. Field data suggest that coarse-grained soil is more permeable for oxygen as well as contaminants.
The field data indicate that fine-grained soil requires 5 feet of clean soil thickness to attenuate vapors associated with 1,000 ug/L benzene. This is opposite of the J&E model predictions because the model assumes greater attenuation in clay, for example, due to clay’s physical properties. Field data suggest that fine-grained soil is less permeable for oxygen as well as contaminants.
Vapor attenuation in hard rock formations is similar to that in coarse-grained soil. 5 feet of rock attenuates vapors associated with dissolved benzene concentrations up to 3,000 ug/L.
Criteria for Evaluating Data Set
- Clean soil overlies groundwater (dissolved sources)
- Known depth to groundwater and dissolved sources
- Groundwater & soil vapor data collected at about same time (concurrent)
- Complete attenuation of soil vapors defined by shallow soil vapors = 0 or <DL (which does vary; full attenuation verified by samplers/authors)
- Majority of soil vapor measurements from multi-depth soil vapor points, representative sub-slab events included
- LUST sites & refineries included
-LNAPL sites evaluated separately

2323
Biodegradation Rate Analysis & Soil Type (Matt Lahvis 2010)
from Lahvis (2009)
KEYPOINT
• sensitivity of biodegradation to environmental factors has been examined for a range of observed conditions (dbase analysis)
0.0001
0.001
0.01
0.1
1
10
sand silt silty clay clayFIR
ST
-OR
DE
R R
AT
E C
ON
ST
AN
T (k
wh
r-1)
upper quartile
lower quartile
median
outlier
BENZENE
Biodegradation rates determined by model calibration to benzene soil-gas data (R. Davis dbase)
Sand is the better
bioreactor
This plot was derived using a different method of analyzing the d-base (decay-rate-
based) and confirms that PHC vapors are degraded most rapidly in coarse-grained soil.
This analysis was conducted by Matt Lahvis by applying R-UNSAT to the soil-gas
data contained in R. Davis’ database. Matt Lahvis’s R-UNSAT Model is available at the United States Geological Survey website:
http://nj.usgs.gov/toxics/models.html#R-UNSAT: “In a calibrative mode, R-UNSAT
can be used to estimate rates of mass transport, biodegradation and volatilization
rates, or transport properties of unsaturated-zone sediments. In a predictive mode,
R-UNSAT can be used to predict the distribution of a species as a function of time and space and to estimate mass-loss or loading rates to ground water.” The
BioVapor Model can also be used to perform similar analyses.
Matt Lahvis, 2010: “This plot of first-order biodegradation rate vs. soil type shows that the rate decreases for lower-permeability soils where the O2 may be more
limited.” In other words, coarse-grained soils are most permeable to oxygen, which
is necessary for degrading petroleum hydrocarbons.
23

24
VW-7
6/26/07
0
5
10
15
20
0 5 10 15 20
O2 & CO2 (% v/v)
De
pth
fe
et
bg
s
1.E+00 1.E+02 1.E+04 1.E+06 1.E+08
Benzene (ug/m3)
Oxygen
Carbon Dioxide
Benzene
Method 2 Formula: 15 – 11 = 4 feet
CLEAN soil thickness
2 Methods for Evaluating Vapor Attenuation from
LNAPL & Contaminated Soil Sources
Hals’, Green River,
Utah (UDEQ)
Method 1 Formula: 20 – 11 = 9 feet
TOTAL soil thickness
contaminated soil zone
The Hal’s site, introduced in a previous slide, was the subject of a vapor intrusion
investigation. LNAPL extends about 300 feet down-gradient of the site and numerous multi-depth soil vapor monitoring wells were installed. This vapor profile
shows that vapor concentrations are high at the deep depth (15 feet) and fully
attenuated just above the contaminated soil zone at 11 feet. Using this consistent
method for evaluating the database for this method for screening approach, the
thickness of clean soil is reported as 4 feet. To err on the side of caution, the deep depth, even though it lies within the zone of soil contamination, is necessarily
accounted for in the data analysis. The actual thickness of clean soil needed to
attenuate vapors may be much thinner.
Past work on vapor attenuation associated with LNAPL sources (Davis RV,
2009) used an overly conservative method by subtracting the deepest SV
point where vapors are attenuated from the depth to GW. That method
unnecessarily accounts for contaminated soil. The new method, shown in
this example, is more realistic and can be used for screening soil-only
contaminated sites as well as smear zones associated with LNAPL sites.

25
0
5
10
15
20
25
30
Thic
kness o
f Overlyin
g S
oil, fe
et
Coachella-3
Chillum Chatterton Hal’s MissionValley
Refinery, Unknown US Location
Coachella-2
Sample events beneath buildings
(All soil types. 43 paired SV benzene & LNAPL Events)
Method 1 Results for LNAPL Sources 30 ft TOTAL
(clean + contaminated) overlying soil attenuates benzene vapors associated with LNAPL
The Petroleum Vapor d-base contains a data sub-set that is used for determining
the thickness of overlying soil necessary for fully attenuating vapors from their
respective LNAPL sources. There are 43 paired benzene SV & GW field
measurements from 6 geographic locations; 11 events beneath buildings. Screening criteria emerge showing that benzene vapors associated with LNAPL
sources are attenuated with 30 feet of overlying soil. There may be contaminated
soil included in this analysis due to LNAPL smear zones that are not reported for all
sites in the d-base.
Criteria for Evaluating Data Set
-Data for 3 LUST sites (Chillum, Coachella, Hal’s) & 3 refineries (Chatterton,
Mission Valley, Refinery Site (unknown location)
-LNAPL sources reported at known depths
-Complete attenuation of soil vapors defined by shallow soil vapors = 0, <DL (which
may vary; full attenuation verified by samplers/authors)
- Soil vapor measurements from multi-depth and sub-slab completion points

26
Near-Slab Multi-Depth, Sub-Slab
0
1
2
3
4
5
6
7
8
9
10
Th
ick
ne
ss
of
Cle
an
So
il O
ve
rly
ing
LN
AP
L
Re
qu
ire
d t
o A
tte
nu
ate
Va
po
rs,
fee
t
TPH SV Sample Event over LNAPL & Soil Sources
Near-Slab Multi-Depth, Sub-Slab
0
1
2
3
4
5
6
7
8
9
10
Th
ick
ne
ss
of
Cle
an
So
il O
ve
rly
ing
LN
AP
L
Re
qu
ire
d t
o A
tte
nu
ate
Va
po
rs,
fee
t
Benzene SV Sample Event over LNAPL & Soil Sources
Method 2 Results for LNAPL & Soil Sources
Benzene: 48 exterior/near-slab + 23 sub-slab = 71 total
TPH: 17 exterior/near-slab + 19 sub-slab = 36 total
~8 ft CLEAN overlying soil attenuates vapors associated with LNAPL/Soil Sources
Past work on vapor attenuation associated with LNAPL sources (Davis RV, 2009) reported that 30 feet of soil attenuate vapors. That method, however, unfairly accounted for some contaminated soil in the total soil column evaluated. The thickness of only clean soil required to attenuate associated vapors is only 8 feet.
In late 2009 and early 2010, further refinement in analyzing the data in the Petroleum Vapor d-base involved determining the thickness of only clean, aerobic soil necessary for attenuating vapors associated with contaminated soil and LNAPL. The thickness shown here are based on known or estimated depth to the top of contaminated soil and therefore known thickness of aerobic soil, the essential medium for degrading petroleum. This thickness was determined by measuring the distance between the shallowest SV point where vapors are clearly present and the deepest SV point where vapors are fully attenuated. That distance represents the thickness of the necessary aerobic zone, which is a maximum of 8 feet.
Most of the data is from LUST sites. There are 3 refineries in the data set: Chatterton, Mission Valley, Refinery Site-unknown U.S. location.
Criteria for Evaluating Data Set
- Known/suspected depths and intervals of uncontaminated soil, top of contaminated soil and LNAPL smear zone, and deep contaminated SV
- Complete attenuation of soil vapors defined by shallow soil vapors = 0, <DL (which may vary; full attenuation verified by samplers/authors)

27
Characterize Site
No Further PVI Evaluation
Needed
Collect Soil Vapor Data & Evaluate
Attenuation
Compare IA/OA to Screening or Health-
Based Criteria
Mitigate
Decision Matrix
No Exceedance
No Exceedance
No Exceedance
No Exceedance
1
2
3
4
5
6
1
Compare Dissolved/LNAPL/Soil Field Data to Screening Criteria
It is important to have a clear decision pathway and set of procedures to ensure
consistency and avoid unnecessary work. Utah’s LUST program follows 6 basic steps to determine if the PVI pathway may be complete. Utah’s procedures are
based on the EPA OSWER Draft VI Guide, which is the only available current
federal guidance.

28
Screening Criteria
� 5 feet CLEAN soil overlying Benzene <1,000 ug/L, TPH <10,000 ug/L
� 8 feet CLEAN soil overlying top of LNAPL smear zone
Dissolved Sources
PVI Pathway Not Complete
LNAPL Sources
� 30 feet TOTAL soil for less-characterized sites
Soil Sources (See California updated draft LUFT Manual, July 2010)
� 5 feet CLEAN soil overlying TPH <100 mg/kg, PID <10 ppm-v, O2 >4%
Soil Vapor Sources� Vapors are attenuated below the receptor

29
Conclusions
• Petroleum hydrocarbon vapors are readily biodegraded & attenuated by 10xxxx givenclean surrounding soil
• Independent database analyses/peer-review byR. Davis & M. Lahvis show consistent, similar results
Recommendations
• Apply Screening (Exclusion) Criteria for petroleum-contaminated sites to screen out the PVI pathway
• LUST sites are readily characterized, decisionsare made quickly
• Use Decision Chart, CSM to identify potentially complete PVI Pathway
• Use BioVapor Model to further evaluate sites
The Petroleum Vapor d-base has abundant information on the behavior and fate of subsurface petroleum hydrocarbons that can be used to apply screening criteria in order to
protect human health and the environment and limited financial resources. These opinions
are my own and I hope this information is helpful for states and other entities that are
developing or re-thinking their own screening criteria for the vapor intrusion pathway.

30
THANK YOU
API Petroleum Vapor Intrusion Work GroupHarley Hopkins, Bruce Bauman, Roger Claff: APITom McHugh, GSI EnvironmentalGeorge DeVaull, Shell Global SolutionsTom Peargin, Chevron-TexacoJohn Menatti, Utah DEQLynn Spence, P.E., Spence EngineeringTodd Ririe, BPBlayne Hartman, Hartman Environmental Geoscience
EPA OUST, ORD, PVI Work Group
Matt Lahvis, Shell Global Solutions
Jackie Wright, Environmental Risk Sciences
Acknowledgments