Embed Size (px)
Citation preview

Vapor Intrusion Pathway: A Practical Guideline
17 November 2009New Orleans, LA
2
Vapor Intrusion - So What?August 8, 2005
DANGER BENEATH OUR
FEET“IS MY FAMILY SAFE?”: A COMMUNITY VIEW OF VAPOR INTRUSION
Vapors End Deal for New School 54
A defunct Rochester charter school located in
the former Mapledale Party House, once eyed
by the city as a possible site for a public
school, is now considered by the city to be too
contaminated to consider buying.

3
Overall Course Objective
To Improve the State of the Practice of Vapor Intrusion Investigation and Mitigation
4
Course Overview
Introduction / Framework
VI Investigative Approach
Site Investigative Tools
Data Review / Background
Vapor Intrusion Pathway
Mitigation
5
ITRC Vapor Intrusion Pathway:A Practical Guideline
Key vapor intrusion issues• Investigative strategies• Phased, iterative process• Background
contamination• The “toolbox”• Conceptual site model• Future land use• Remediation technologies• Closure strategies• Qualified consultants
6
ITRC – Shaping the Future of Regulatory Acceptance
Host organizationNetwork
• State regulatorsAll 50 states and DC
• Federal partners
• ITRC Industry Affiliates Program
• Academia• Community stakeholders
Wide variety of topics• Technologies• Approaches• Contaminants• Sites
Products• Documents
Technical and regulatory guidance documentsTechnology overviewsCase studies
• TrainingInternet-basedClassroom
DOE DOD EPA

7
Introduction to VI Pathway / Investigative Framework
Key Topics • Why the fuss over VI?• Definition of vapor intrusion• Technical basics• Special influences • Community issues• Regulatory guidance• Preliminary Screening Steps• Distance Criterion• Site Investigation Steps
Introduction / Framework
VI Investigative Approach
Site Investigative Tools
Data Review / Background
Mitigation
8
Historical Perspective
1989 1991 1998 1999 2000 2001 2002 2007 2008
MA DEPHillside School
Investigation
The Missing Pathway Period
CO DPHERedfields,
CDOT Sites
USEPA includes VI
in EI Determination
USEPAholds DC
Vapor Summit
J&E Model
published
ITRCVI Practical Guideline
ITRCVI Scenario Document
The National VI Discussion
PeriodASTM
VI Standard
NH DESResidential
IA Assessment
Guide
USEPA Subsurface
Vapor Intrusion Guidance

9
VI Regulatory State Guidance
States with Regulatory Guidance in 2009
States with Regulatory VI Guidance in 2004
10
Magnitude of VI Cases –No Further Action (NFA)?
As of October 2007, only 6% of the responding states have re-opened a closed case due to the VI pathway
50% of the states have the authority to re-open a closed case based on site-specific information due to the VI pathway

11
Interdisciplinary Challenge
Risk assessorMechanical engineerCommunity relations coordinatorIndustrial hygienistEnvironmental scientistSoil scientistHydrogeologistAnalytical chemistLegal professionalReal estate agentsBanksInsurance agents
12
Vapor Intrusion
The migration of volatile chemicals from the subsurface into overlying buildings (USEPA 2002a)
IndoorAir
VadoseZone
Soil Gas
Soil and Groundwater
Contamination
Commercial/Industrial Worker
Working over Plume Without Basement
Resident Living over PlumeBasement or Crawl Space
13
What Is a VI Compound?
Compounds of concern• Volatile organics• Semi-volatile organics
i.e., naphthalene• Mercury• PCBs• Dioxins
USEPA VI Guidance identifies 114 compoundsState guidance varies in number of compounds
14
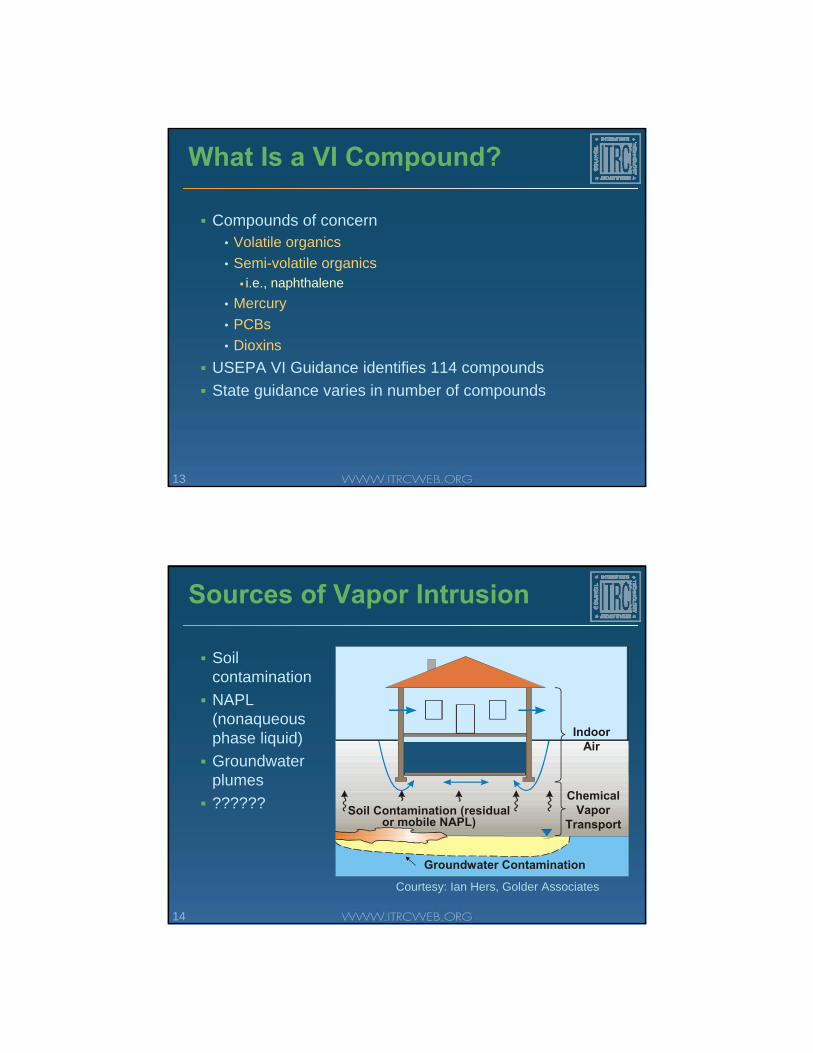
Sources of Vapor Intrusion
Soil contaminationNAPL (nonaqueous phase liquid)Groundwater plumes??????
Courtesy: Ian Hers, Golder Associates
Indoor Air
Chemical Vapor
TransportSoil Contamination (residual
or mobile NAPL)
Groundwater Contamination

15
Vapor Pathway into Structures
Pathway• Partitioning to vapor
phase• Diffusion in vadose zone• Advection near building• Dilution in building
16
Factors Affecting Movement in the Vapor Phase
Rainfall - Infiltration may displace soil-gas containing VOCs (volatile organic compounds) to dryer soil underneath a building and prevent mass loss to the atmosphere
Temperature - Higher indoor temperature compared to outdoor temperature may
create a “stack” effect
Wind and Barometric Fluctuation - Inside pressure relative to outside pressure
Source: Figures from Massachusetts DEP

17
Building Design and Ventilation
Air exchange rate - the rate at which outdoor air replaces indoor air
• HVAC• Ventilation
Exhaust pollutants from a fixed sourceDilute pollutants from all sources within a space
Appendix C in ITRC VI Practical Guidance discusses building types
18
Attenuation Factor Concept
Indoor Air10 μg/m3
500 μg/m3
Alpha = 10/500
Soil Gas (shallow)
Alpha = 0.02 (shallow soil gas)
αsg = Cindoor/Csg

19
Attenuation (Alpha) Factors
αsg = Cindoor/Csg
αgw = Cindoor/(Cgw*H)
Lower alpha means higher attenuation
Variation in current regulatory VI guidance:
EPA αsg = 0.1 for sub-slabCA αsg = 0.01 for sub-slabNJ αsg = 0.02 for sub-slabNH αsg = 0.02 for sub-slab
20
Understanding Units
Your First Quiz
1 µg/L benzene equals
• 1 ppbv• 24 µg/m3
• 307 ppbv• None of the above
21
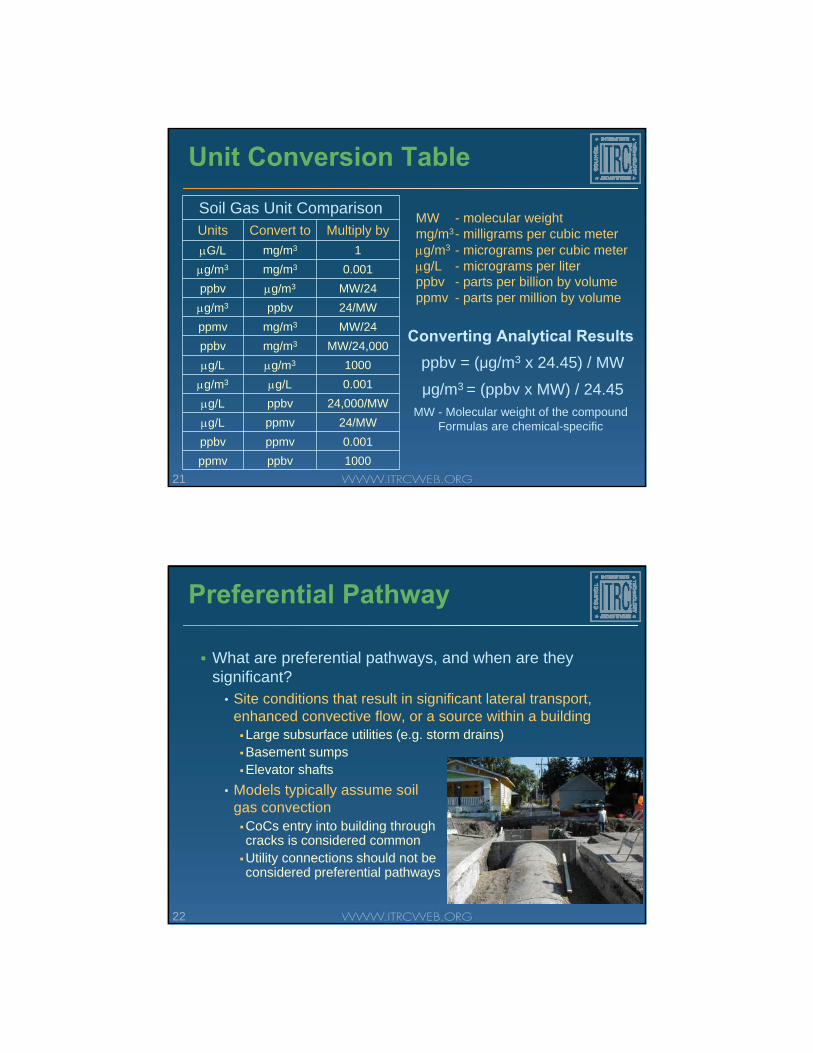
Unit Conversion Table
Converting Analytical Resultsppbv = (μg/m3 x 24.45) / MW
μg/m3 = (ppbv x MW) / 24.45MW - Molecular weight of the compound
Formulas are chemical-specific
MW - molecular weightmg/m3- milligrams per cubic meterμg/m3 - micrograms per cubic meterμg/L - micrograms per literppbv - parts per billion by volumeppmv - parts per million by volume
Soil Gas Unit ComparisonUnits Convert to Multiply byμG/L mg/m3 1μg/m3 mg/m3 0.001ppbv μg/m3 MW/24μg/m3 ppbv 24/MWppmv mg/m3 MW/24ppbv mg/m3 MW/24,000μg/L μg/m3 1000μg/m3 μg/L 0.001μg/L ppbv 24,000/MWμg/L ppmv 24/MWppbv ppmv 0.001ppmv ppbv 1000
22
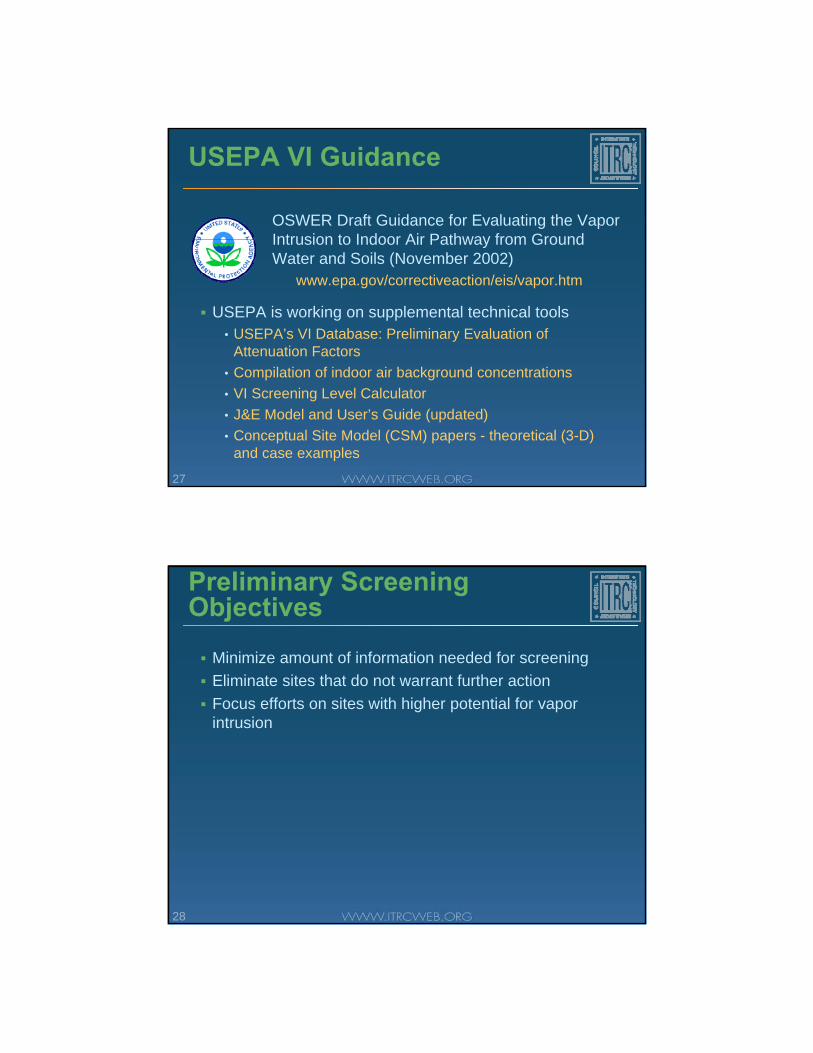
Preferential Pathway
What are preferential pathways, and when are they significant?
• Site conditions that result in significant lateral transport, enhanced convective flow, or a source within a building
Large subsurface utilities (e.g. storm drains)Basement sumpsElevator shafts
• Models typically assume soil gas convection
CoCs entry into building through cracks is considered common Utility connections should not be considered preferential pathways

23
Land Use
Developed vs. future useCommercial vs. residentialInstitutional restrictionsSensitive populationsMunicipal zoning laws
24
Community Outreach
Sensitive topic in communityStrong community outreach helps inform and prepare Working with community groupsCommunication strategies
Refer to Appendix A, “Community
Stakeholder Concerns”in the ITRC VI-1 2007

25
Multiple Lines of Evidence (MLE)
Soil gas spatial concentrations Groundwater spatial data Background (internal and external / ambient) sourcesBuilding construction and current conditionSub-slab soil gas dataSoil gas dataIndoor air dataConstituent ratiosSoil stratigraphyTemporal patterns
26
Conceptual Site Model (CSM)
Simplified version (pictures and/or descriptions) of a complex real-world system that approximates its relationships
27
USEPA VI Guidance
USEPA is working on supplemental technical tools• USEPA’s VI Database: Preliminary Evaluation of
Attenuation Factors• Compilation of indoor air background concentrations• VI Screening Level Calculator• J&E Model and User’s Guide (updated)• Conceptual Site Model (CSM) papers - theoretical (3-D)
and case examples
OSWER Draft Guidance for Evaluating the Vapor Intrusion to Indoor Air Pathway from Ground Water and Soils (November 2002)
www.epa.gov/correctiveaction/eis/vapor.htm
28
Preliminary Screening Objectives
Minimize amount of information needed for screeningEliminate sites that do not warrant further actionFocus efforts on sites with higher potential for vapor intrusion
29
Preliminary Screening Steps
Step 1: Does the site represent an acute exposure concern?
Step 2: Are there sufficient characterization data to evaluate this pathway?
Step 3: Are any of the site contaminants of concern both volatile and toxic?
Step 4: Are buildings located in close proximity to volatile chemicals in soil, soil gas or groundwater?
Step 5: Identify the appropriate occupant exposure scenarios and screening levels for this site.
Step 6: Do the data exceed the appropriate generic screening levels?
Step 7: Does the exceedance warrant further investigation?
30
Step 1 – Acute Exposure?
Are site concentrations at acute levels?• Odors• Physiological symptoms• ATSDR MRLs (Agency for Toxic Substances and Disease
Registry Minimal Risk Levels)Petroleum Hydrocarbons
• LELs (Lower Explosive Limit)

31
Step 2 – Sufficient Data?
Existing data• Groundwater• Soil• Soil gas• Indoor air
Source characterizationPathway evaluation
32
Step 3 – Volatile Compounds?
List of chemicals• USEPA Office of Solid Waste and Emergency Response
(OSWER)• State lists
If no, no further actionIf yes, compare to “quantitative” criteria (generic screening levels)

33
Plume
GW Flow
?
Step 4 – Distance Criteria?
LateralVerticalPreferential pathways may increase distance (relatively rare)Petroleum hydrocarbons vs. chlorinated solvents
34
Steps 5 – Exposure Scenarios and Screening Levels?
Look-up tables• OSWER table• State screening levels
ResidentialNon-residentialOccupationalDifference between chlorinated VOCs and petroleum hydrocarbons

35
Step 6 – Data Comparison
Compare site data to look-up table valuesAvailable for groundwater and soil gasConcentration < screening level
• No further action (NFA)Concentration > screening level
• Cannot screen out• Does not mean vapor intrusion is occurring• Need more information
36
Step 7 – Further Investigation?
Last step in the preliminary screeningData above screening levels
• Additional investigation• Mitigation

37
Preliminary Screening Issues
Issues• Screening criteria must be conservative• Screening levels are very low
Do not account for biodegradation• Most people agree conservative enough, but…• Very few sites are being screened out
Choices• Realistic screening levels, if warranted• Accept that more site-specific data will be needed at most
sites• Mitigation
38
Preliminary Screening Summary
Three possible outcomes1. Screen out
Not common2. Screen in
Most commonScreening targets may change as you collect site specific data
3. Mitigate

39
Site Investigation Phase
Step 8: Choose a VI investigative strategyStep 9: Design a VI investigative work planStep 10: Implement VI investigation work planStep 11: Evaluate the dataStep 12: Is additional investigation necessary?Step 13: Is mitigation warranted?
Refer to Chapter 3 in the ITRC VI-1 2007
40
Step 8: Choose an Investigative Strategy
Decide the media and technical approach for assessing the VI pathwayCharacterization tools
• Interior sampling• Exterior sampling
Analyte listUse of supplemental data

41
Step 9: Design a VI Investigation Work Plan
• Develop a site-specific CSM• Identified data gaps• Identify sampling locations• Understand background• Prepare for sampling• Understand groundwater
issues
• Community outreach• Access issues• Implementation• Scheduling• Impacted structures
Investigation work plan components
42
Step 10: Implement VI Investigation Work Plan
ScheduleExpectations of field work
• Worst-case conditions (e.g., heating season)• Seasonal differences
Flexibility and property access Communication
43
Step 11: Evaluate the Data
Do data make sense?Identify data gaps?
• Do data exceed allowable levels?• Use site specific levels where
appropriate.Revisit CSM
44
Step 12: Is Additional Investigation Necessary?
Why do you need additional data?• Potential background sources• Possible variation temporal and spatial• Delineation
Consider supplemental tools• Customized to the site conditions

45
Step 13: Is Mitigation Warranted?
Is exposure pathway complete?Risk management decisionMonitoring
46
VI Investigative Approach
Key Topics • Site-specific features
affecting VI• Multiple lines of evidence
(MLEs)• Conceptual site models
(CSMs)
Introduction / Framework
VI Investigative Approach
Site Investigative Tools
Data Review / Background
Mitigation

47
Ingredients for Effective VI Assessments
Investigatory approachDetermine correct screening levelsSample and analyze properlyKnow and use supplemental toolsDemonstrating bioattenuation
48
Site-Specific Features
Source• Degradable vs. non-degradable • VOCs vs. SVOCs• Vadose zone vs. groundwater• NAPL or not
Pathway• Diffusion vs. advection dominated• Barriers: wet clay-rich layers, freshwater lens• Preferential pathways: highly permeable fill, openings in
building envelopeReceptor
• Building pressure/vacuum, ventilation rates• Interior sources (background)• Sensitive populations

49
Multiple Lines of Evidence (MLE)
Soil gas spatial concentrations Groundwater spatial data Background (internal and external / ambient) sourcesBuilding construction and current conditionSub-slab soil gas dataSoil gas dataIndoor air dataConstituent ratiosSoil stratigraphyTemporal patterns
50
MLE: Chemistry
Groundwater
External Soil Gas Near-Slab Soil Gas
Sub-Slab Soil Gas Indoor Air Outdoor Air

51
MLE: Soil Properties
0
10
20
30
40
50
60
70
80
90
100
0.00010.0010.010.1110
Particle Size (mm)
Cum
ulat
ive
Wei
ght R
etai
ned
(%)
1 to 2 feet4 to 5 feet7 to 8 feet10 to 11 feet13 to 14 feet17 to 18 feet18 to 19 feet19 to 20 feet
GrvSand
Silt Claycrs medium fine
Coring and Visual InspectionParticle Size Distribution
Porosity and Moisture ContentFlow, Vacuum, and Permeability
52
MLE: Weather Data
Barometric and Differential Pressure Soil Gas Pressure over Time
Seasonal Trends from Weather Effects Wind Speed vs. Building Vacuum
0.1
1
10
100
1000
10000
100000
1000000
Jun-99
Dec-99
Jun-00
Dec-00
Jun-01
Dec-01
Jun-02
Dec-02
Jun-03
Dec-03
Jun-04
Dec-04
Jun-05
Dec-05
Jun-06
Dec-06
Jun-07
Dec-07
Sampling Date
Con
cent
ratio
n (p
pbv )
SVOC 1
SVOC 2
SVOC 3
SVOC 4
PCE
TCE

53
MLE: Gas Pump Tests
Gas Pumping Tests
Analysis of Pneumatic Properties
Concentration vs. Volume Purged
54
MLE: HVAC Monitoring
Pressure/Ventilation Testing
Electromagnetic Flow Meters
Test and Balance Reports
Smoke Pen

55
MLE: Building Pressure Manipulation
Adjust HVAC to pressurize building – do [VOCs]IA drop?IA = Indoor Air
0.001
0.01
0.1
1
10
100
1000
Outdoor Air Predicted IA IA Pre-Mitigation
IA Post-Mitigation
ΔP ~ 10 PaCon
cent
ratio
n (μ
g/m
3 )
Maximum75th
25th
Minimum
Median
Air flow doubled, but TCE dropped by 10x – indicates TCE originated from VI
Berry-Spark et. al., 2005
56
MLE: Degradation
Comparison of Data to Model
Field Screening for O2 and CO2
Vertical Profiles of O2 and CO2
soil surfaceO2 CO2
VOCscleansoil
increasingdepth
VOCs
O2
flux

57
MLE: Modeling
0 10 20 30 40 50 60 70 80 90 100
x (m)
-8
-6
-4
-2
0
Dep
th b
gs (m
)
0 10 20 30 40 50 60 70 80 90 100
x (m)
-8
-6
-4
-2
0
Dep
th b
gs (m
)
a) Hydrocarbon
b) Oxygen
α bio = 1.1 x 10⁻¹³
0 10 20 30 40 50 60 70 80 90 100
x (m)
-8
-6
-4
-2
0
Dep
th b
gs (m
)
0 10 20 30 40 50 60 70 80 90 100
x (m)
-8
-6
-4
-2
0
Dep
th b
gs (m
)
a) Hydrocarbon
b) Oxygen
α bio = 1.1 x 10⁻¹³
0
10
20
30
40
50
601.E-08 1.E-07 1.E-06 1.E-05 1.E-04 1.E-03 1.E-02 1.E-01 1.E+00
Dimensionless Concentration (C/Csource)
Dep
th (f
t)
Benzene Detects Benzene ND DLM PCE Detects PCE NDs JEM
t1/2 = 2.8 dlambda = 0.25 day-1DLM = 1-10 ft bgs
PCE Cgw = 0.79 ppbBenzene Cgw = 52500 ppb
Lithology
⎟⎟
⎠
⎞
⎜⎜
⎝
⎛ −=
tDarerfc
ra
CoC
eff4
Radial Diffusion in Vadose Zone
3-D Abreu and Johnson Model
1-D J&E Model with Biodegradation
58 Prepared by GeoSyntec for EPA
Is This Your Site?

59
Conceptual Site Model (CSM)
Simplified version (pictures and/or descriptions) of a complex real-world system that approximates its relationships
60
Components of a CSM
Underground utilities and pipesExisting and potential future buildingsConstruction of buildingsType of HVAC systemSoil stratigraphyHydrogeology and depth to water tableReceptors present (sensitive?)Nature of vapor sourceVadose zone characteristicsLimits of source area and contaminants of concernSurface cover description in source and surrounding area
CSM Checklist is found in Appendix B in
the ITRC VI-1 2007

61
Chlorinated VOCs in GW
Stack effect
Diffusion through vadose zone
Volatilization from water table
Source
GeoSyntec Consultants
62
Fresh-Water Lens
Assess off-gassing with combined shallow GW and deep soil gas samplesMap “extent” in soil gas before selecting buildings for intrusive samples
Rainfall
“clean” soil
“clean” groundwater
Source
GeoSyntec Consultants
63
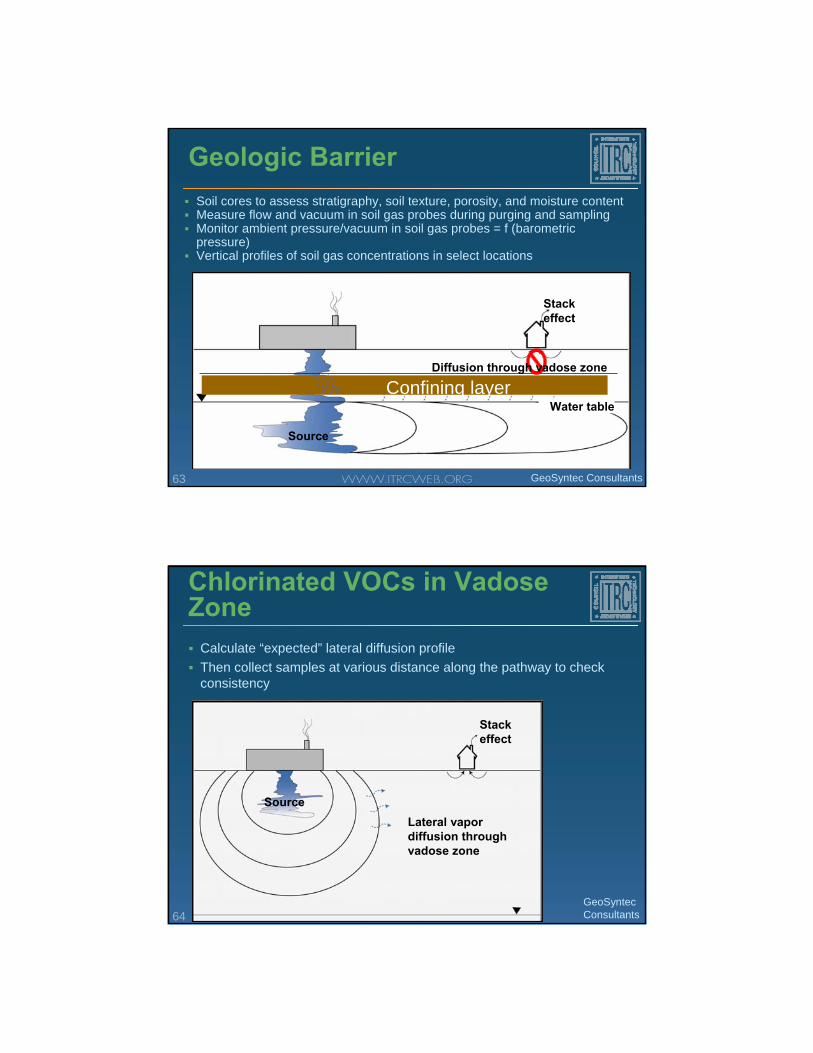
Geologic BarrierSoil cores to assess stratigraphy, soil texture, porosity, and moisture contentMeasure flow and vacuum in soil gas probes during purging and samplingMonitor ambient pressure/vacuum in soil gas probes = f (barometric pressure)Vertical profiles of soil gas concentrations in select locations
Confining layerWater table
Source
Stack effect
Diffusion through vadose zone
GeoSyntec Consultants
64
Chlorinated VOCs in Vadose Zone
Calculate “expected” lateral diffusion profileThen collect samples at various distance along the pathway to check consistency
Stack effect
Lateral vapor diffusion through vadose zone
Source
GeoSyntec Consultants

65
Large Buildings
Talk with Facilities Engineer – review Test and Balance ReportMonitor sub-slab to building pressure differential over timeReview historic VOC use, storage, handling locationsPID (photoionization detector) screening at select locations (floor drains, sumps, etc.)
66
Source Outside BuildingReview depth of footings vs. water table (barrier?)Soil gas and sub-slab samples and pressure differential
Delta P
Watertable(10-20 ft bgs)
Groundwater(with TCE)
Flow Direction
TCE vapor migration
TCE tank
Building footings
Poured concrete slab
floor
Roof top forced air HVAC system/air exchanger
Tempered air inActive
manufacturing area
TCE DNAPL
GeoSyntec Consultants
67
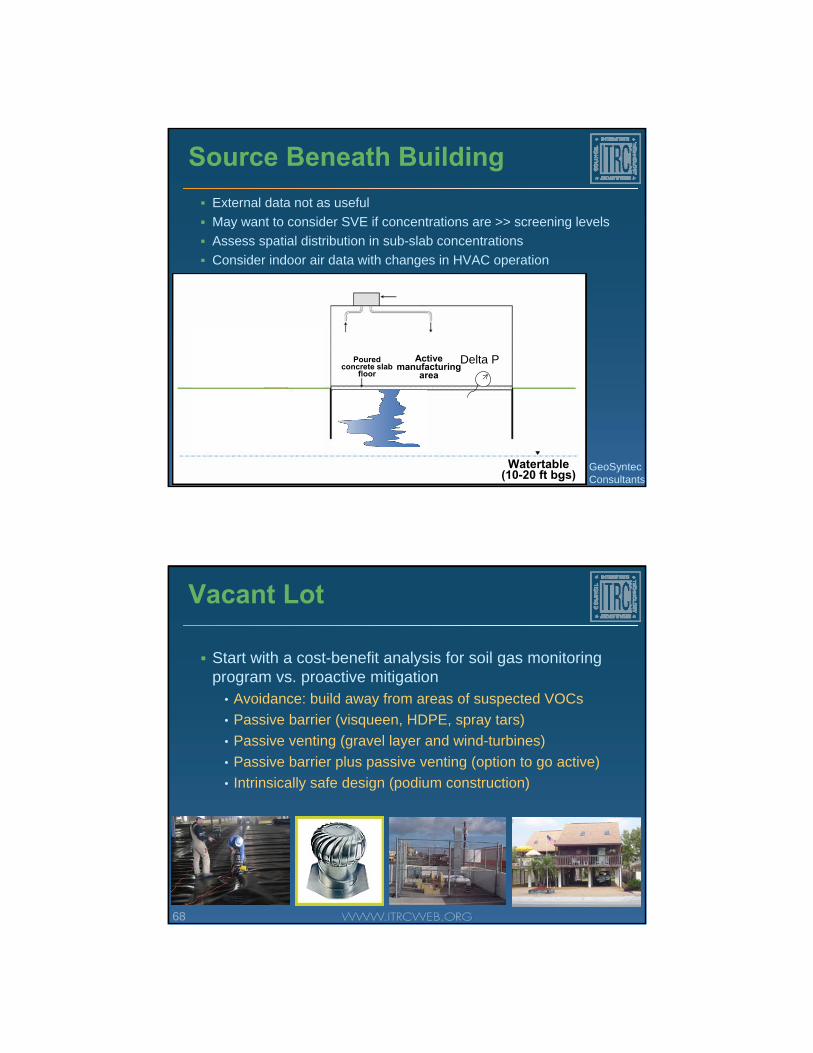
Source Beneath BuildingExternal data not as usefulMay want to consider SVE if concentrations are >> screening levelsAssess spatial distribution in sub-slab concentrationsConsider indoor air data with changes in HVAC operation
Delta P
Watertable(10-20 ft bgs)
Active manufacturing
areaPoured
concrete slab floor
GeoSyntec Consultants
68
Vacant Lot
Start with a cost-benefit analysis for soil gas monitoring program vs. proactive mitigation
• Avoidance: build away from areas of suspected VOCs• Passive barrier (visqueen, HDPE, spray tars)• Passive venting (gravel layer and wind-turbines)• Passive barrier plus passive venting (option to go active)• Intrinsically safe design (podium construction)

69
Tall Buildings
Neutral pressureplane
Neutral pressureplane
Cold Climate Hot Climate
70
Complicating Factors for VI Assessments
Ultra low screening levels• Increases chances for false positives
Inconsistent screening levelsAllowed assessment methods
• Vary among agenciesChlorinated vs. petroleum hydrocarbons
• Treat same way?• Allow for bioattenuation – how?

71
Key Investigation Issues
Experience of the collector/consultant• Have they done this before?• Do they understand risk base screening levels (RBSLs)? • Quality/experience of field staff? Senior or junior?
Get enough data near/around/underLegal perspective
• How conservative to be?
72
Summary
One-size doesn’t fit all – customize to site-specific conditions
• Let the science lead the logicDecide in advance what you expect the data to show
• Consistency supports the conceptual site modelMap out a plan for anticipated and potential outcomesConcentrations are not the only lines of evidence

73
Investigative Tools
Key Topics• Sampling
Exterior verses interiorGroundwaterSoilSoil GasIndoor AirAnalytical Methods
• Supplemental tools/data • Modeling
Introduction / Framework
VI Investigative Approach
Site Investigative Tools
Data Review / Background
Mitigation
74
Data Quality Objectives
Define/identify• Study goals• Contaminants of concern• Regulatory screening
levelsComplete
• Pre-sampling building survey
Interior surveySite screening
Choose/establish • Sampling and analytical
method• Number of samples• Reporting limits
Collect• Samples• Quality assurance (QA)
samplesEstablish
• Validation procedures

75
Interior vs. Exterior
Interior data (sub-slab and indoor air samples)• Access agreements, background challenges, scheduling
Exterior data (soil gas and groundwater samples)• Is the pathway incomplete?• Data to support site-specific modeling• Improve scoping of internal data collection
76
“Interior” Investigations
Public relations• Access agreements, fact sheets, meetings
Removal of interior sources (if practical)Samples and “controls”
• Outdoor, sub-slab, etc.Analytical methods, analytes, reporting limitsRisk communicationPotential litigation
77
“Exterior” Investigations
“Map” the contaminationIdentify buildings with potential VI risksIdentify target compoundsCollect site-specific geologic/pneumatic dataMinimize inconvenience to occupants/ owners
“Bound the scope of the problem”
78
Groundwater Data
Assess available data • Well location and construction• Aquifer characteristics• Interpolate – flow and direction
Gather new data• Well location, construction,
samplingConsider perched water, vertical profilesIncorporate long-term monitoring

79
Groundwater Sampling
Issue: Proper sampling and interpretation of vertical profile of chemicals in groundwater concentration is critical
• Each scenario below could give the same groundwater concentration, but vastly different soil vapor concentrations
Paul C. Johnson – Arizona State University 2002
80
Soil Phase Data
Soil data generally not acceptable in VI investigations• 10X to 1000X losses of VOCs (EPA/600/SR-93/140)
Existing soil data – line of evidence• Can screen in sites• Generally cannot be used alone to screen out sites
Convert to soil gas concentrations• Partitioning equations exist• But equations tend to over predict soil gas concentration
Sampling – minimize VOC loss – method 5035• However, methanol extraction causes elevated reporting
limits, which are too high to be protective for vapor intrusion screening

81
Soil Gas Data
Pros• Representative of subsurface processes • Measures concentrations in the gas phase• Higher screening levels (vs. Indoor Air)• Relatively inexpensive • Can give real-time results
Cons• Attenuation factor is variable• Conservative Screening Levels (especially for PHCs)• Protocols still debated
82
Predictive Modeling
Pros• Can use GW, soil (?), soil gas data• Relatively easy
Cons• “screening level” model (~10X at best)• Which version to use? • Need to verify inputs• Needs to verify assumptions are met
83
Model Assumptions
One-dimensional vertical transportSteady state conditionsNo preferential pathwaysUniform mixing within buildingSlab on grade or basement construction
No biodegradationHomogeneous vadose zoneConstant source concentrationNo gas generation (e.g., municipal waste)No barometric pumping
Prior to using model results, you need to ensure that model assumptions and site conditions are consistent
84
How Well Does J&E Predict?
Hydrocarbons• No bioattenuation especially for deeper and lower
concentration sourcesOFTEN OVER PREDICTS
Chlorinated solvents – deep source• Calculated SG value too high by >10x
OFTEN OVER PREDICTS
Chlorinated solvents – surface source• Calculated SG value too low
WILL UNDER PREDICT IF VAPOR CLOUD

85
Soil Gas Sampling and Analysis Methods
Sample collection issues• Active soils gas surveys• Passive soil gas surveys• Flux chamber surveys
Sample analysis issues• Active soils gas samples• Passive soil gas samples• Surface flux chamber
samples
Refer to:
Regulators Checklist for Reviewing Soil Gas Data, Appendix F
(ITRC VI-1, 2007)
86
Get Enough Data
Soil gas not homogeneousLateral and vertical variations exist Don’t chase 1 point anomaliesGet enough data near/around/underOn-site analysis/field screening enables real-time decisions to select additional sampling locations

87
Which Soil Gas Method?
Active?Passive? Flux Chambers? (supplemental tool)
Active method most often employed for VI
88
Passive Soil Gas
Pros• Easy to deploy• Can find contamination zones• Low permeability soils
Cons• May not give concentration• No less expensive (depending on analysis)
Currently considered as screening tool

89
Direct Flux Measurement (Flux Chambers)
Pros• Direct measurement of intrusion
Cons• Proper location (may miss preferential paths)• Protocols debated• How to use data?• Unsophisticated audience• Regulatory acceptance limited
90
Static Flux Chamber
USEPA, 1996

91
Active Soil Gas Sampling
Considerations• Purge and sample volumes• Flow rate, vacuum, and leak tests• Sample containers • Temporal effects• Real-time sample and analysis• Sample density and locations
USEPA, 1996
92
Sub-slab Soil Gas Sampling
Soil gas most likely to enter structure• May detect chemicals originating within building
May collect indoor air concurrently for comparisonSample at slab base and/or at depthPermanent or temporary sample pointsActive and passive approaches
Passive sampler insertion
Active sampling

93
Soil Gas Sampling Issues
Sample size • Larger the volume, larger the zone of influence• Smaller volumes faster and easier to collect
Containers• Canisters: Potential carry over; Higher cost • Tedlars: Good for ~2 days; Easier to collect
Flow rate• Not important for coarse soils. Most agencies < 200 ml/min
Tracer/leak compound• Crucial for sub-slab and larger sample volumes • Gases (He, SF6, Propane) and Liquids (IPA)
94
Soil Gas Sampling Issues
Rain and meteorological parameters• How long to wait after a rain event?• High winds? Sub-slab O2 changes > 10 mph• Barometric pressure? • Time-integrated samples?• Existing data does not show large variations
Pneumatic testing• Gives vadose zone permeability

95
SVOC Sampling
96
Some Final Collection Issues
Individually certified clean canisters• Not needed if Detection Limit > 5 µg/m3
Residual vacuum in canisters • Not critical for soil gas samples
Dedicated flow controllers • Bellows type has large dead-volume• Calibrated orifice typically can be reused

97
Soil Gas Sampling Strategies
Exterior vs. Interior (sub-slab)
Repeated Sampling
Documenting bioattenuation
98
Sub-Slab vs. Near-Slab Samples
?

99
Sub-Slab vs. Near-Slab
EPA and some states prefer sub-slab • Ponding effect under slab?• Balls don’t run uphill
Very intrusive
Hydrocarbons: if O2 high, near-slab okay
Cl-HCs: at source or mid-depth
100
Resampling of Soil Gas?
Depth below surface • 3ft to 5ft below ground surface generally considered stable• Temporal studies ongoing
Seasonal effects – how important?• Most studies show less than 5x
Extreme conditions will have effect• Heavy rain• Extreme heating/cooling

101
Wind speed
RainfallBarometric pressure
Pressure differentialWind direction
O2 and HC Concentrations
Cause and Effect?
Slide courtesy of Paul Johnson, ASU and Chevron Corp
102
Temporal Variability in SG
Slide courtesy of Dr. William Wertz, NY-DEC

103
Spring to Fall SG Trend
Slide courtesy of Todd McAlary, Geosyntec
104
Soil Gas Temporal Study
Slide courtesy of EPA-ORD and H&P Geochemistry
Nor
mal
ized
Con
cent
ratio
n
Probe A3 (TCE - Normalized)
00.20.40.60.8
11.21.41.61.8
2
13:50
:09
17:51
:27
07:43
:51
11:44
:54
02:02
:09
06:03
:14
22:06
:54
02:11
:46
Time (3/16/07 to 4/10/07)
3' (Port 9)
8' (Port 10)
17' (Port 5)

105
Indoor Air Sampling
What could go wrong?
SUMMA Canister
Evacuation Chamber
Air Sampling Pump with
Sorbent Tubes
Glass Sampling
Bulb
Tedlar Gas Sampling Bag
106
Indoor Air Measurement
Pros• Actual indoor concentration, no modeling required• Relatively quick, no drilling or heavy equipment• Less spatial variability than soil vapor
One sample often adequate for typical basements
Cons• Potential for background sources, typically addressed by:
Ambient air and sub-slab vapor samplesSurvey of building materials and activities
• No control (sample left unattended for up to 24 hours)• Typically more temporal variability than soil vapor
Up to one order of magnitude common for indoor air• Requires entering home

107
Coordinating with the Lab
Select appropriate canister size
• Based on required reporting limits (RLs)
e.g., Scan mode vs. SIM modeCanister cleaning
• Batch versus individual• RLs used for certifying clean• Dedicated low level cans
Flow regulator• Clean regulator too• Ensure no thread damage• Proper flow rate
Consider spare canisters
108
Pressure Issues
Canisters are large pressure gauges
• Evacuated to very low pressure (.05 Torr = .002” Hg)
• Reading is difference between inside and outside pressure
Pressure will fluctuate with ambient pressurePressure will reduce with increasing elevation
• ~4 inches per mileNote: local “barometric pressure” is converted to sea level
• Ambient pressure is actual pressure
29.9 in Hg
25.9 in Hg
INITIAL CANISTER PRESSURE IN DENVER
INITIAL CANISTER PRESSURE AT SEA LEVEL
109
Common Pressure Problems
Field pressures too high or too low• Use a calibrated and reliable gauge• Gauges that come with the canisters are often inaccurate
Initial field pressure is low• Initial field pressures less than about 28” Hg (corrected for
elevation) likely indicate some leakage between the lab and field
Final field pressures of zero indicate that sample collection terminated some time earlier
• Likely an unknown sample collection time, unless checking of the regulator allows this to be back-calculated
110
Additional Pressure Problems
Final field pressure is above 10” Hg• Likely due to incorrectly set or selected flow regulator, or
plugged line• May not be sufficient sample to meet RLs
But have the lab check – often still enough sample
Final lab pressure more than 2” Hg less than final field pressure
• Correct for elevation• May indicate inaccurate field gauge• Or may indicate loss of vacuum
Dilution air equal to percent increase in sample volumePotential cross-contamination during shipping & storage
111
Location
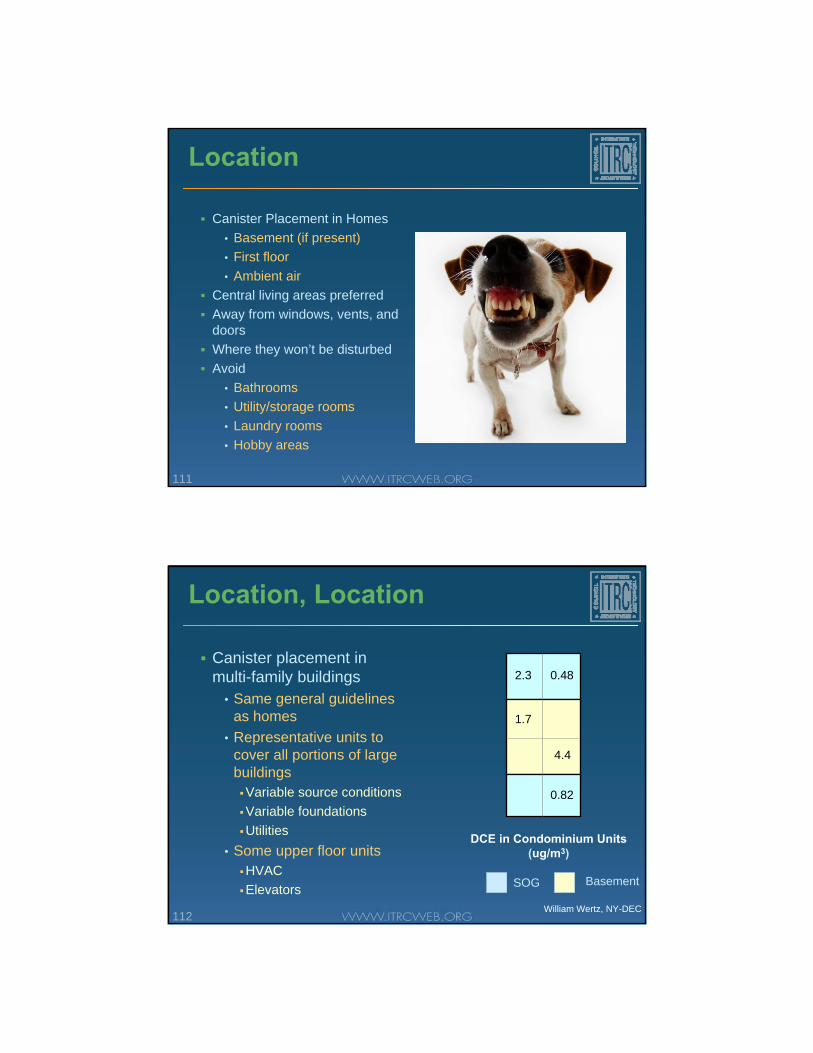
Canister Placement in Homes• Basement (if present)• First floor• Ambient air
Central living areas preferredAway from windows, vents, and doorsWhere they won’t be disturbedAvoid
• Bathrooms• Utility/storage rooms• Laundry rooms• Hobby areas
112
Location, Location
Canister placement in multi-family buildings
• Same general guidelines as homes
• Representative units to cover all portions of large buildings
Variable source conditionsVariable foundationsUtilities
• Some upper floor unitsHVACElevators
DCE in Condominium Units(ug/m3)
0.482.3
1.7
4.4
0.82
SOG Basement
William Wertz, NY-DEC

113
Location, Location, Location
Canister placement in commercial buildings
• Sufficient samples to represent various
Areas of buildingPlumes & source areasFoundation conditionsHVAC zonesSensitive populationsInfluence of elevators
• AvoidCopy/printing roomsStorage/utility areas
5 ug/L
0.53
0.67
0.542.0
PCE in Office complex(ug/m3)
2.5
1.8
10 ug/L
20 ug/L
SOG Basement
William Wertz, NY-DEC
114
Other Indoor Air Issues
Sampling• How long? Grab, 8 hours, 24 hours?• How often? Once, twice, more?• Pen/marker emissions can be picked up.
Data interpretation• Compare with outdoor air concentrations• Compare with sub-slab vapor concentrations• Less necessary for compounds with few background
sources (e.g., 1,1-DCE)
115
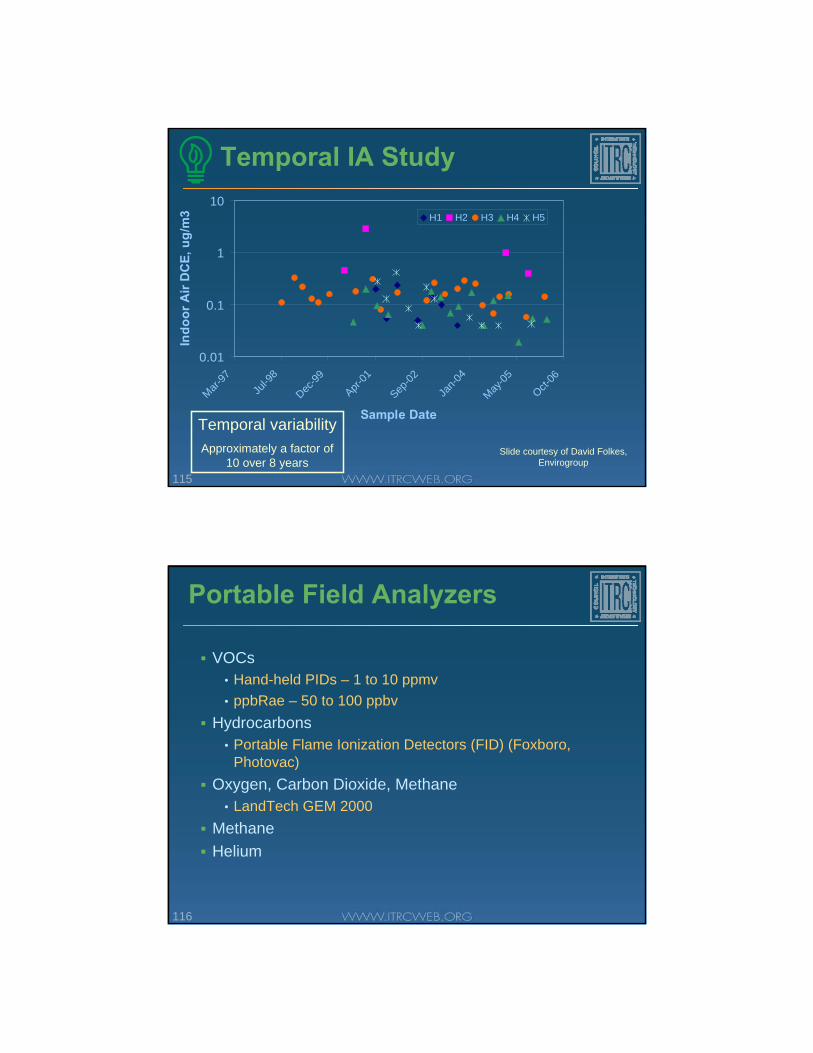
Temporal IA Study
0.01
0.1
1
10
Mar-97
Jul-9
8
Dec-99
Apr-01
Sep-02
Jan-0
4
May-05
Oct-06
Sample Date
Indo
or A
ir D
CE,
ug/
m3 H1 H2 H3 H4 H5
Slide courtesy of David Folkes, Envirogroup
Temporal variabilityApproximately a factor of
10 over 8 years
116
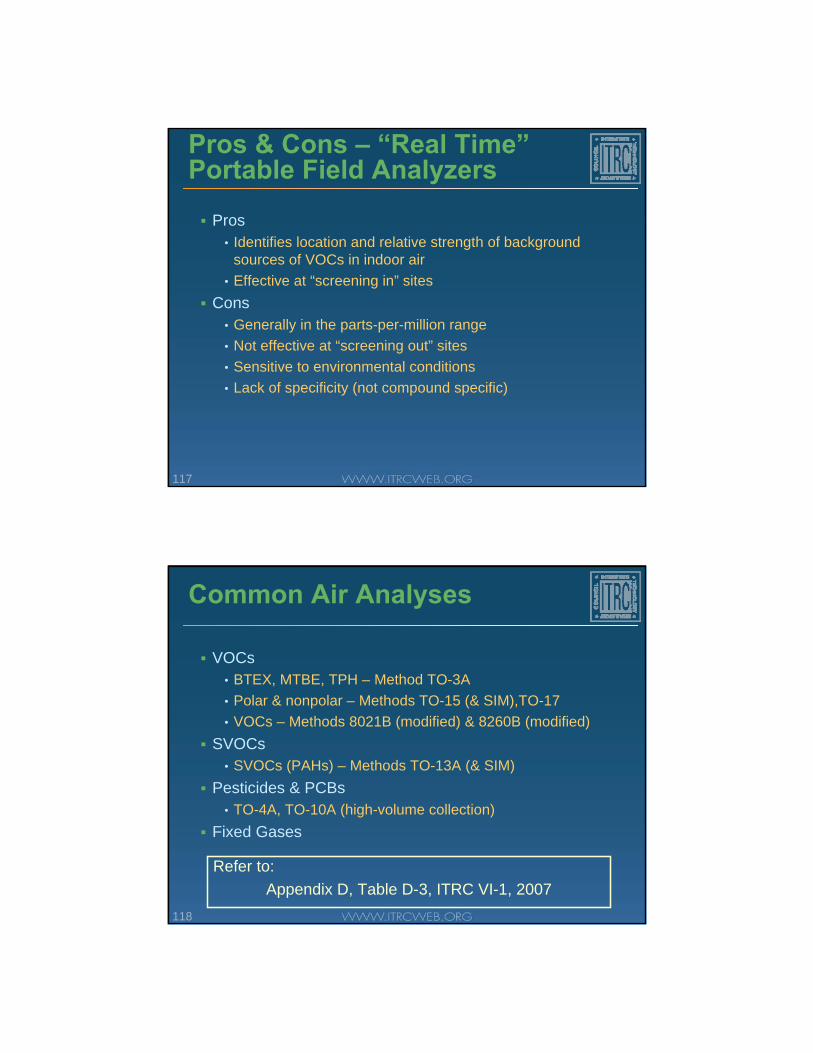
Portable Field Analyzers
VOCs• Hand-held PIDs – 1 to 10 ppmv• ppbRae – 50 to 100 ppbv
Hydrocarbons• Portable Flame Ionization Detectors (FID) (Foxboro,
Photovac)Oxygen, Carbon Dioxide, Methane
• LandTech GEM 2000MethaneHelium
117
Pros & Cons – “Real Time”Portable Field Analyzers
Pros• Identifies location and relative strength of background
sources of VOCs in indoor air• Effective at “screening in” sites
Cons• Generally in the parts-per-million range• Not effective at “screening out” sites • Sensitive to environmental conditions• Lack of specificity (not compound specific)
118
Common Air Analyses
VOCs• BTEX, MTBE, TPH – Method TO-3A• Polar & nonpolar – Methods TO-15 (& SIM),TO-17• VOCs – Methods 8021B (modified) & 8260B (modified)
SVOCs• SVOCs (PAHs) – Methods TO-13A (& SIM)
Pesticides & PCBs• TO-4A, TO-10A (high-volume collection)
Fixed Gases
Refer to:Appendix D, Table D-3, ITRC VI-1, 2007

119
Common Soil Gas Analyses
VOCs• Soil and Water Methods:
8021, 8260• Air Methods: TO-14, TO-15,
TO-17Hydrocarbons
• 8015 m, TO-3Oxygen, carbon dioxide
• ASTM 1945-96SVOCs
• TO-4, TO-10, TO-13• 8270 (?)
Autosampler GC/MS for TO-17 Analysis
120
Soil Gas VOC Analysis
All methods give reliable resultsDetection level discriminator
• TO Methods: <1 to 10 µg/m3 $200-$350• 8260: 10 to 100 µg/m3 $100-$150• 8021: 2-10 µg/m3 $50-$100
On-site analysis• Extremely helpful for VI • Real time verification

121
On-Site 8021 Analysis vs.Off-site TO-15 Analysis
Slide courtesy of Dr. Dominic DiGuilio, EPA-
ORD
ppbv
122
On-site 8260 vs. Off-site TO-15
1,1-DCE by on-site lab and syringe (µg/L)
1,1-
DC
E b
y fix
ed la
b an
d S
umm
a (µ
g/L)
10
1
0.1
0.010.01 0.1 1 10
Avocet Consulting
Group, 2006

123
High Soil Gas Concentrations Create Headaches
Typical soil gas concentrations• Benzene near gasoline soil: >100,000 µg/m3
• TPH vapor: >1,000,000 µg/m3
• PCE under dry cleaner: >100,000 µg/m3
TO-15 maximum concentration: 2,000 µg/m3
• Must do large dilutions, detection limit (DL) goes up• False positives from hot samples
Canister and hardware and instrument blanksField screening very beneficial
124
New Advance: TO-15 Scan/SIM
Simultaneous scan/SIM mode enables • <10 µg/m3 for All VOCs and• < 2 µg/m3 for subset of compounds
Only 2cc of sample – eliminates hardwareReal-time analysis in structures

125
Supplemental Tools/Data
Site specific alpha using radon• Factor of 10 to 100 - $100/sample
Indoor air ventilation rate• Factor of 2 to 10 - <$1,000 per determination
Real-time, continuous analyzers • Can sort out noise/scatter
Pressure measurements • Can help interpret indoor air results
126
Automated Analyzers
GC and GC/MS (TO-15)Can reach ultra-low levels (1-10 ug/m3) for subset of compoundsCan analyze 4 to 15 times per hourUp to 16 sampling portsReal-time feedback

127
Continuous Monitoring Data
Huntington Beach Site - Soil Gas
0
5
10
15
20
25
30
35
6:18 P
M
8:00 P
M
9:41 P
M
11:23
PM
1:04 A
M
2:45 A
M
4:27 A
M
6:08 A
M
7:50 A
M
9:31 A
M
11:13
AM
12:54
PM
2:36 P
M
4:17 P
M
5:59 P
M
Time
Valu
e (%
)
CH4
CO2
O2
128
Bioattenuation of Hydrocarbons
Existing data suggest O2 effective barrierAttenuation > 10,000 timesDocument by vertical profiles of contaminants of concern and O2
How to quantify?

129
Theoretical Bio Profile
soil surface
O2
CO2
VOCscleansoil
petroleumproduct
increasingdepth
VOCs
O2
flux
130
Dissolved phase NAPL
L = 1 m
L = 2 m
L = 3 m L = 5 m L = 10 m
Effect of Vapor Source Concentration and Depth
Modeling assumptions:• Benzene source• Sand soil• Basement• l = 0.79 h-1
Biodegradation is likely to have a significant effect on a for non-NAPL sourcesFor NAPL sources, effect of biodegradation on alpha may be minimal due to oxygen depletionL: source-foundation distance
Vapor Source Concentration (mg/L)
Atte
nuat
ion
Fact
or
1.E-10
1.E-08
1.E-06
1.E-04
1.E-02
0.1 1 10 100 1000
L = 1 m, λ = 0.79 (1/h)L = 2 m bgs, λ = 0.79 (1/h)
L = 3 m, λ = 0.79 (1/h)L = 5 m, λ = 0.79 (1/h)
L = 10 m, λ = 0.79 (1/h)L = 1 m, No Biodegradation
L = 10 m, No Biodegradation
Slide courtesy of Dr. Lilian Abreu, Geosyntec Consultants, and API

131
BioVaporA 1-D Vapor Intrusion Model with
Oxygen-Limited Aerobic Biodegradation
National Tanks ConferenceSacramento, CA
March 30 - April 1, 2009
Slide courtesy of API
132
KEY POINT:
Version of Johnson & Ettinger vapor intrusion model modified to include aerobic biodegradation (DeVaull, 2007).
Uses iterative calculation method to account for limited availability of oxygen in vadose zone.
Simple interface intended to facilitate use by wide range of environmental professionals.
O2 HC
SIMPLE MATH
Conclusions: What is BioVapor?
Slide courtesy of API
Oxygen Mass Balance
User-Friendly
Version 1 available in Spring 2009. Free from API web site.
1-D Analytical Model

133
Summary
Multiple investigatory tools existSelection is site/bldg specificSoil gas methods commonly usedSoil gas sampling and analysis issues plentifulSupplemental tools can be helpfulBioattenuation of hydrocarbons common
134
Data Review and Background Evaluation
Key Topics • Data quality review• Groundwater, soil, soil
gas data interpretation• Other lines of evidence
(supplemental tools/data)• Indoor air data evaluation• Background contributions
Introduction / Framework
VI Investigative Approach
Site Investigative Tools
Data Review / Background
Mitigation

135
Typical Decision Process
1. Start with data quality review• Check for bias, consistency with CSM, etc.
2. Compare to appropriate screening levels• Protective, so if values < SL, likely no issue
3. Re-evaluate if data are > generic SLs• Review critical parameters and sanity checks
4. Utilize other lines of evidence5. Consider option for pre-emptive mitigation
136
Data Quality ReviewProgram design
• Well justified scope of work based on CSM and DQOsField methods
• Samples representative and reproducibleLaboratory methods
• Analysis precise and accurate, reporting limits < targetsQuality assurance / quality control
• Duplicates, replicates, equipment blanks, container certification, outdoor air samples, building survey, etc.
Assess consistency with CSM after each phase• Compare data to expectations
Refer to Appendix E, Quality Assurance Considerations, in
the ITRC VI-1 2007

137
Common Data Quality Issues
Positive bias• Equipment blank samples may show VOCs• May also find compounds unrelated to the site
Negative bias• Adsorptive losses in sample train• Leaks (soil gas and sub-slab)• Volatilization losses (groundwater, soil)
Variability• Spatial, temporal, operator
Exacerbated because target levels are so low
138
Reviewing Attenuation Factors
Concentration (C) allowed = Cindoor / alphaAlpha varies with depth and soil type
• Sub-slab• Soil gas• Groundwater
Three general sources for alpha values• Empirical (EPA database)• From models (e.g. J&E Model)• Measured with tracers (radon, 1,1-DCE, etc.)

139
Interpreting GW Data
Compare to look-up tables (conservative)Use attenuation factor
• USEPA 2002, Figure 3 or local or state guidance • Use groundwater or soil gas alpha
Use J&E model (if allowed)• Groundwater spreadsheet if allowed• Soil gas spreadsheet if convert to Csg
Note: GW Data May Over-Predict Risk
140
GW Data Exercise
TCE at 50 µg/L in GWGW depth 20’, sandy soilH constant = 0.5Residential Setting, allowed Cindoor = 1 µg/m3
Default GW alpha: 0.0005
Does TCE exceed allowable value? Is vapor intrusion likely occurring?

141
Solution - GW Data Exercise
TCE in soil gas ~= 50 µg/L x 0.5 = 25 ug/L = 25,000 ug/m3
TCE in indoor air ~= 25,000 ug/m3 x 0.0005 = 12.5 ug/m3
Residential Setting, allowed Cindoor = 1 µg/m3
Does TCE exceed allowable value? YES
Is vapor intrusion likely occurring? It Depends
DISCUSSION: What does it depend on?
142
Interpreting Soil Data
Soil data generally not acceptable for VI assessment by most agencies Look-up tables rarely existCalculate soil gas concentration from soil data using partitioning equation (easier to use J&E soil spreadsheet to calculate soil gas concentration)
Note: Soil data often under predicts risk (negative bias in soil data from volatilization losses)

143
Interpreting Exterior Soil Gas Data
Compare to look-up tables (conservative)Use attenuation factor
• USEPA 2002, Figure 3 or local or State guidance Use J&E model (if allowed)
• Soil gas screen and advanced spreadsheets
Note: May or may not rule out individual buildings
144
Soil Gas Data Exercise
Benzene at 6 µg/L at 5’ bgsSandy soilCommercial Receptor, allowed Cindoor= 15 µg/m3
Default alpha: 0.002
Does the benzene value exceed allowable value?Is vapor intrusion likely occurring?

145
Solution - Soil Gas Data Exercise
Benzene indoor air ~= 6 µg/L x 0.002 = 0.012 ug/L = 12 ug/m3
Commercial Receptor, allowed Cindoor= 15 µg/m3
Does the benzene value exceed allowable value?No
Is vapor intrusion likely occurring?It Depends
DISCUSSION: What does it depend on?
146
Interpreting Sub-Slab SG Data
Look-up tablesUse attenuation factor
• From local state guidance or EPA: 0.10• J&E Model is not really designed for sub-slab to indoor alpha • Consider radon to determine slab-specific alpha
Potential for indoor air to impact sub-slab?• Buildings breathe both ways, so it is common to see
chemicals from indoor sources in sub-slab samples

147
Interpreting Indoor Air Data
Interpretation complicated by ambient background and indoor sourcesAre measured values > allowed?Is outdoor air > indoor air? If indoor > outdoor, how to determine if VI?
• Compare to sub-slab concentrations• Use constituent ratios and tracers• Pressure measurements
148
Ambient (Outdoor) Air
PCE 1 µg/m3
PCE 1 µg/m3
PCE = Background (ambient)
PCE 1 µg/m3

149
Comparison to Outdoor Air Data
Clean Air Act (1970, 1990, 1997) is helping• Yet still 20,000,000 kg of VOCs released each year
Point sources vs. widespread air quality• Local dry cleaner• Nearby freeway• Large urban or industrial area
Spatial and temporal variability• Effect of wind speed and direction, transient sources
How many samples are needed?• Generally at least one for each day of indoor air sampling
150
Outdoor Air Quality – TCE
10-6 target = 0.022 µg/m3
(also off-scale!)

151
Ambient Air Temporal TrendsCalifornia Air Resources Board
BenzeneP
arts
per
bill
ion
6
5
4
3
2
1
0
Year
1989
1990
1991
1992
1993
1994
1995
1996
1997
1998
1999
2000
2001
2002
90th PercentileMeanDetection limit
Ambient (outdoor) air quality has greatly improved over the last decade
152
Background Sources
Background refers to concentrations not attributable to releases from a site, and is usually described as naturally occurring or anthropogenic (USEPA 2002)
• Background concentrations may exceed risk-based levels in indoor air for some common VOCs
• Background sources may be inside the building or present in ambient outdoor air
• The final remedy may or may not eliminate a source of risks caused by background sources
• Some states incorporate typical background concentrations into their screening values, but most do not

153
CERCLA Approach to Background
Background contributions to the concentrations of contaminants associated with a release at a site COPCs(contaminants of potential concern) should be included in the risk assessment
CERCLA does not generally clean up to concentrations below natural or anthropogenic background levels.
Background information is important for risk managers making decisions about appropriate remedial actions
BUT
Source: “Role of Background in the CERCLA Cleanup Program” OSWER 9285.6-07P, April 2002
154
Indoor Sources
Specific sources of indoor air contamination
• Consumer activities• Household products• Building materials and
furnishings• Ambient (outdoor) air

155
Published Indoor Air (IA) Background Data
Reasonable place to start, but must consider• Variability between homes
Ventilation, habits, and hobbiesUrban vs. rural settings
• Changes over timeSome studies are dated
• Truncated data setsLots of Non Detects, makes statistics tough
• Limited list of analytes versus USEPA, 2002, Table 1
156
USEPA Indoor Air (IA) Background Data
Background indoor air concentrations of VOCs in North America
• Indoor air concentrations have decreased over time since 1970
• Background indoor air concentrations of some chemicals exceed risk based concentration (RBC, 1E-06)
e.g. benzene, carbon tetrachloride, chloroform, MtBE, PCE• Concentrations of some chemicals at vapor intrusion sites
fall within the range of background indoor air concentrationse.g., PCE, 111TCA
Dawson, 2008
157
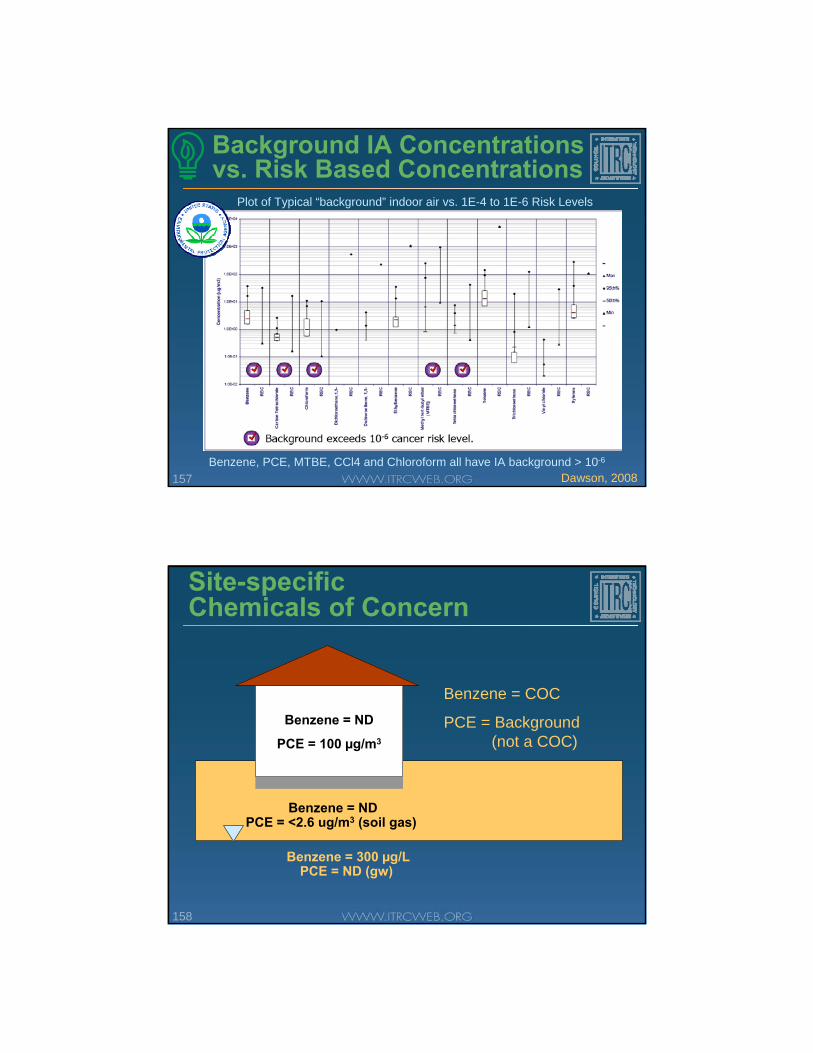
Background IA Concentrations vs. Risk Based Concentrations
Benzene, PCE, MTBE, CCl4 and Chloroform all have IA background > 10-6
Dawson, 2008
Plot of Typical “background” indoor air vs. 1E-4 to 1E-6 Risk Levels
158
Site-specificChemicals of Concern
Benzene = ND
PCE = 100 µg/m3
Benzene = 300 µg/L PCE = ND (gw)
Benzene = NDPCE = <2.6 ug/m3 (soil gas)
Benzene = COC
PCE = Background(not a COC)

159
COCs = Multiple Lines of Evidence
Site-specific COCs• COCs not present in soil or groundwater are likely due to
background sources• Media must be well characterized• Degradation products must be considered• Review Building Survey – are consumer products present
that contain the compounds detected that are not COCs?
160
Breathing Buildings
PCE
100 µg/m3
PCE Not detected (gw)
PCE = Background
PCE 10 µg/m3 (soil gas)
Is this “vapor extrusion”? Why or why not?

161
Forensics: Constituent Ratios
Comparing the ratio of two or more compounds in one media with another media (i.e., GW to SG, SG to IA)
Constituent ratios can provide evidence for and against vapor intrusion
Attenuation factors can be assessed by comparing values for various compounds (background contributions will tend to increase the alpha value)
162
Constituent Ratio Example
Constituent ratio for indoor air does NOT match the ratio for sub-slab soil gas
TCE = 80 µg/m3
DCE= 20 µg/m3
TCE = 0.5 x DCE
TCE = 4 x DCE
Most TCE in indoor air likely from a background source, but the rest (~10 µg/m3) may still be unacceptable
163
Marker Compounds or Tracers
Characteristic of subsurface chemicalsDetectable concentrationsRare in “background”Similar fate and transport propertiesPossible examples include
• 1,1-Dichloroethene• Radon• Trichloroethene (although still present in some cleaning
solutions)
164
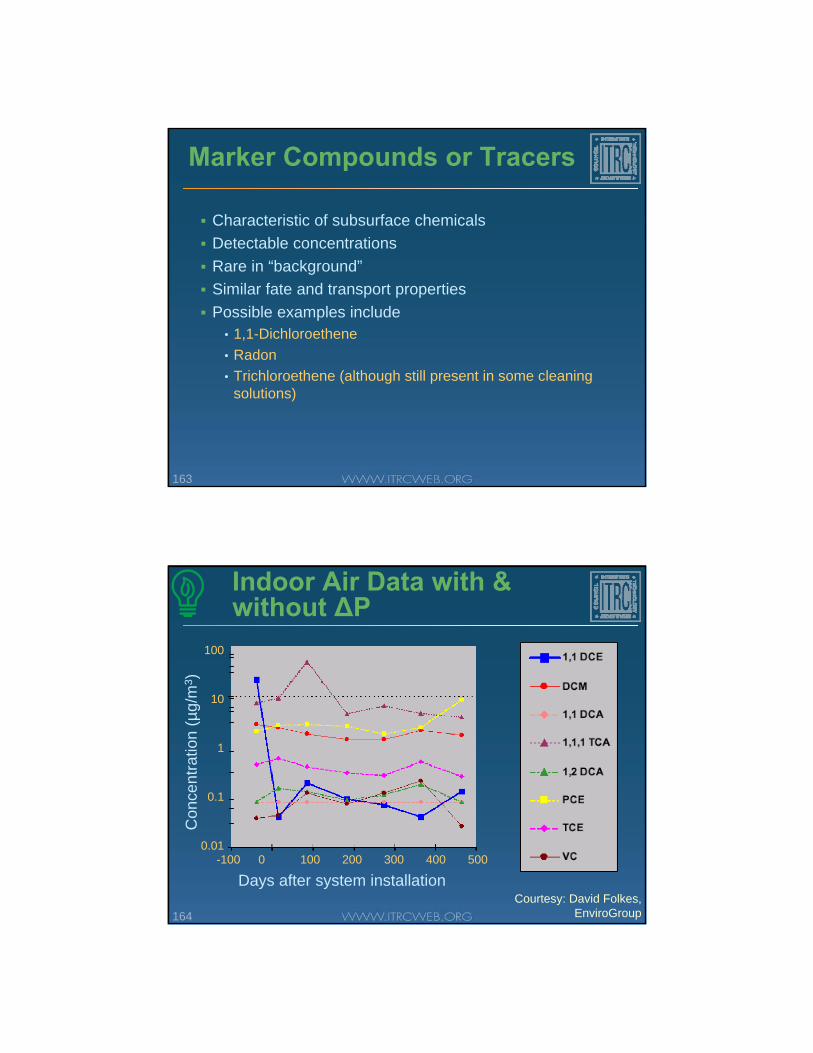
Indoor Air Data with & without ΔP
Courtesy: David Folkes, EnviroGroup
Days after system installation-100 0 100 200 300 400 500
Con
cent
ratio
n (µ
g/m
3 )
100
10
1
0.1
0.01

165
Building Pressurization – TCE
Outdoor Air
Modeled Indoor Air (Soil Gas x alpha)
Measured Indoor Air(ambient
conditions)
Measured Indoor Air
with building pressurized by ~10 Pa
maximum75th
median25th
minimum
1000
100
10
1
0.1
0.01
0.001
TCE
Con
cent
ratio
n (u
g/m
3 )
TCE concentration dropped when building was pressurized Berry-Spark et. al., 2005
166
Consideration of Variability
Indoor air samples of 24-hours typically show up to an order of magnitude temporal variability
• Radon industry addressed this by requiring samples to be collected over a longer period
Deeper soil gas samples tend to have less temporal variability, but tend to overestimate risks for degradable compoundsSeason climate changes (hot/cold, wet/dry) are minimal in some areas, significant in others

167
Indoor Air Data Example
Retail Shopping Mall
Gas
Station1
basement2
slab3
slab4
slab
Tenant 1
BasementAcetone - 12,400 Benzene - 1,447MTBE - 7,860
1st FloorAcetone - 25,417Benzene - NDMTBE - NDPCE - 79THF - 57
Tenant 2
1st FloorAcetone - 35 Benzene - NDMEK - 1,690MTBE - 2.2PCE - 2,281THF - 1,010
Tenant 3
1st FloorAcetone - 18 Benzene - 1.1MEK - NDMTBE - 2.7PCE - 460THF - ND
Tenant 4
1st FloorAcetone - 83 Benzene - 0.8MEK - NDMTBE - 1.6PCE - 1,322THF - ND
All results reported in μg/m3
168
Mitigation
Key Topics • Site remediation• Institutional controls• Building controls• Barriers, venting, and
treatment• Special issues• Closure
Lesson goal• Think critically about
approaches to mitigation
Introduction / Framework
VI Investigative Approach
Site Investigative Tools
Data Review / Background
Mitigation

169
Vapor Intrusion Mitigation
What are the 3 general approaches?
170
Site Remediation
Eliminate source of vapors
X

171
Institutional Controls
Prevent exposure to vapors
X
172
Building Controls
Prevent entry of vapors into building
X
173
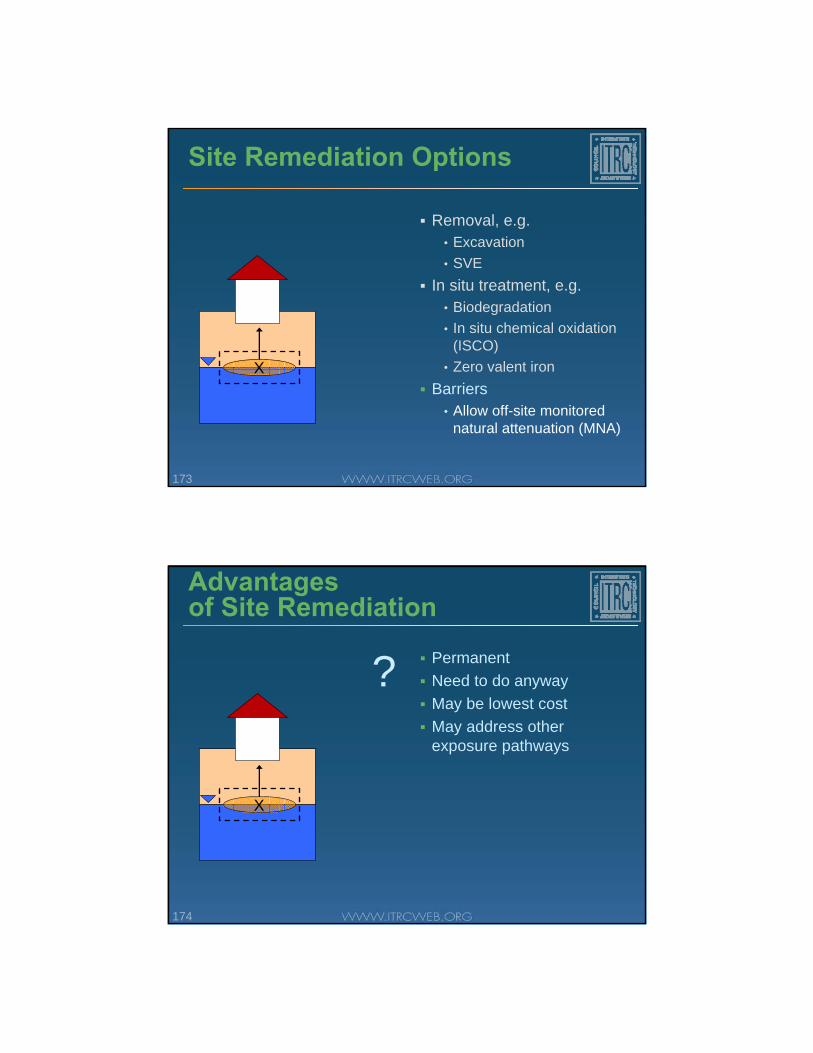
Site Remediation Options
Removal, e.g.• Excavation• SVE
In situ treatment, e.g.• Biodegradation• In situ chemical oxidation
(ISCO)• Zero valent iron
Barriers• Allow off-site monitored
natural attenuation (MNA)
X
174
Advantages of Site Remediation
PermanentNeed to do anywayMay be lowest costMay address other exposure pathways
X
?

175
X
Disadvantages of Site Remediation
May take too longMay be too expensiveBuilding may be in the way
?
176
Institutional Controls
Legal mechanisms
Restrict useRequire controlsRequire evaluation
X

177
Institutional Controls
Types? Deed noticeDeed restrictionCovenantZoning requirementUse control areaOne-call notificationSite management plan
X
178
Institutional Controls
Advantages? Lower cost • Compared to controls
Quick to implement• Depending on type
Allows time for site remediation
X

179
Institutional Controls
Disadvantages? Limits site useHard to enforce over long periods of timeProperty value?X
180
Building Controls
Lesson goal: Understand basic principles behind each approach, so that you can
• Select the best approach based on building and site conditions
• Deal with unusual conditions
• Understand strengths and weaknesses of each approach
X

181
Mitigation Concepts
diffusion
advection
Air exchangeCia
-∆P
Remove Source
X
X XX
XX
182
Barriers – Existing Buildings
Seal cracks and penetrationsCrawl space liners (e.g. LDPE)
caulkLiner
seal

183
Barriers – Existing Buildings
Aerated floor system
Raised floor (air tight)
Vented air space
184
Barriers – New Buildings
Liner below slab• Spray-on rubberized asphalt membrane• Geomembrane (e.g., HDPE)
Liner

185
Spray-On Barriers
No product endorsements intended by this presentation
Courtesy of Land Sciences Technologies Courtesy of CETCO Liquid Boot Company
GeoSeal Liquid Boot
186
Barrier Concept
How do barriers work?
Co
Css
Sub-slab vapor concentrations before liner

187
Barrier Concept
How do barriers work?
Sub-slab vapor concentrations after liner*
Co
Css
* No venting layer
188
Barrier Concept
Vapors must diffuse or flow laterally
Co
Css
Sub-slab vapor concentrations after liner*
* No venting layer
189
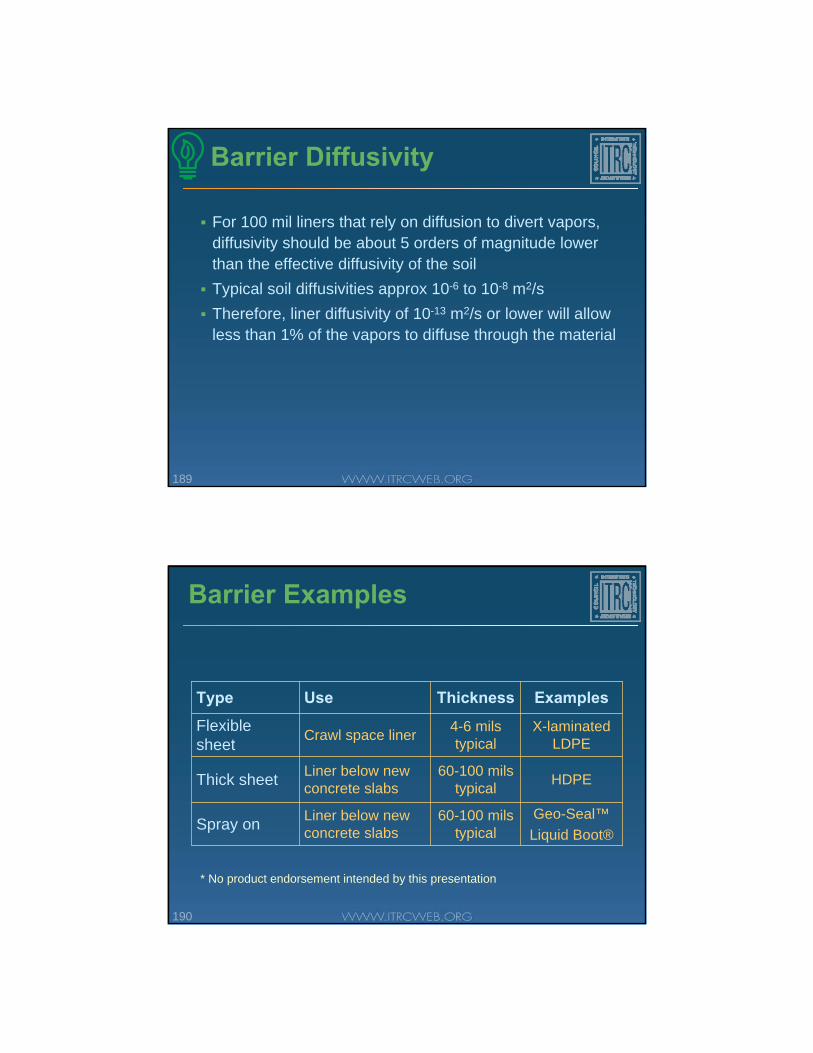
Barrier Diffusivity
For 100 mil liners that rely on diffusion to divert vapors, diffusivity should be about 5 orders of magnitude lower than the effective diffusivity of the soilTypical soil diffusivities approx 10-6 to 10-8 m2/sTherefore, liner diffusivity of 10-13 m2/s or lower will allow less than 1% of the vapors to diffuse through the material
190
Barrier Examples
Geo-Seal™Liquid Boot®
60-100 mils typical
Liner below new concrete slabsSpray on
HDPE60-100 mils typical
Liner below new concrete slabsThick sheet
X-laminated LDPE
4-6 mils typicalCrawl space linerFlexible
sheet
ExamplesThicknessUseType
* No product endorsement intended by this presentation

191
Barrier Integrity
Key to barriers is integrity of sealVapors can move by advection or diffusion through holes, gaps in seals at foundations and penetrations
-∆P Utility Pipe
192
Barrier Integrity
Must be able to survive construction• Construction foot traffic, dropped tools, rebar• Pouring of concrete, aggregate
Rigorous construction quality control essentialIntegrity testing recommended
• Smoke tests• Indoor air tests

193
Liner Puncture StudyN
umbe
r of h
oles
per
squ
are
met
er
Note: (1) No geotextile(2) Geotextile on top(3) Geotextile both sides
0
5
10
15
20
(1) (2) (3) (1) (2) (3)CPE Hypalon
Holes less than 2mm diameterHoles greater than 2mm diameter
0
200
400
600
800
(1) (2) (3)LDPE
from Folkes and Hunter 1984
194
Riser Pipe
Passive Venting Layers
Provide vapor pathway to reduce Css
Co
Css
• Gravel,• Sand, • Geogrid, or• Geotextile
195
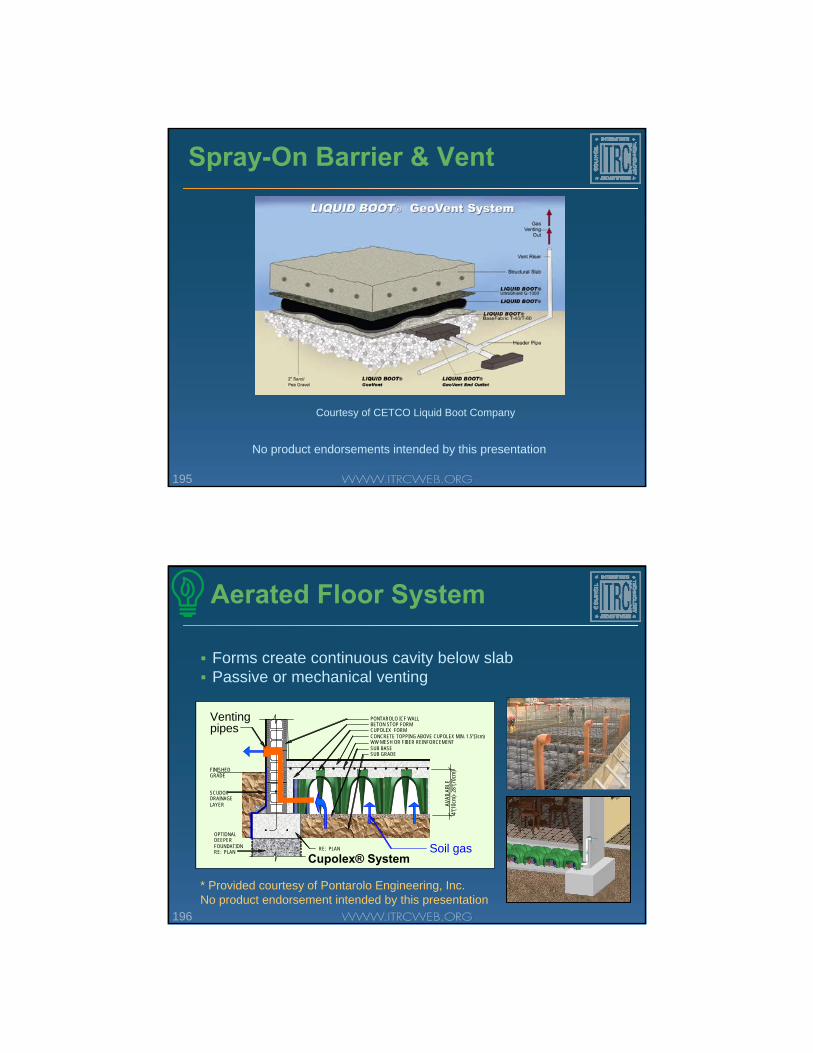
Spray-On Barrier & Vent
No product endorsements intended by this presentation
Courtesy of CETCO Liquid Boot Company
196
Aerated Floor System
Forms create continuous cavity below slabPassive or mechanical venting
* Provided courtesy of Pontarolo Engineering, Inc.No product endorsement intended by this presentation
FINISHED GRADE
RE: PLAN
AVAI
LABL
E 4”
(10c
m) -2
8”(7
0cm)
PONTAROLO ICF WALLBETON STOP FORM CUPOLEX FORM CONCRETE TOPPING ABOVE CUPOLEX MIN. 1.5”(3cm)WW MESH OR FIBER REINFORCEMENTSUB BASESUB GRADE
OPTIONAL DEEPERFOUNDATION RE: PLAN
SCUDOX DRAINAGELAYER
Soil gas
Venting pipes
Cupolex® System

197
Passive Venting Mechanisms
Passive venting layers rely on diffusion and natural pressure gradients
• Thermal-induced pressure gradient
Warm
Cool
198
Passive Venting Mechanisms
Passive venting layers rely on diffusion and natural pressure gradients
• Wind-induced pressure gradient• Augment with wind turbine
wind
Suction
199
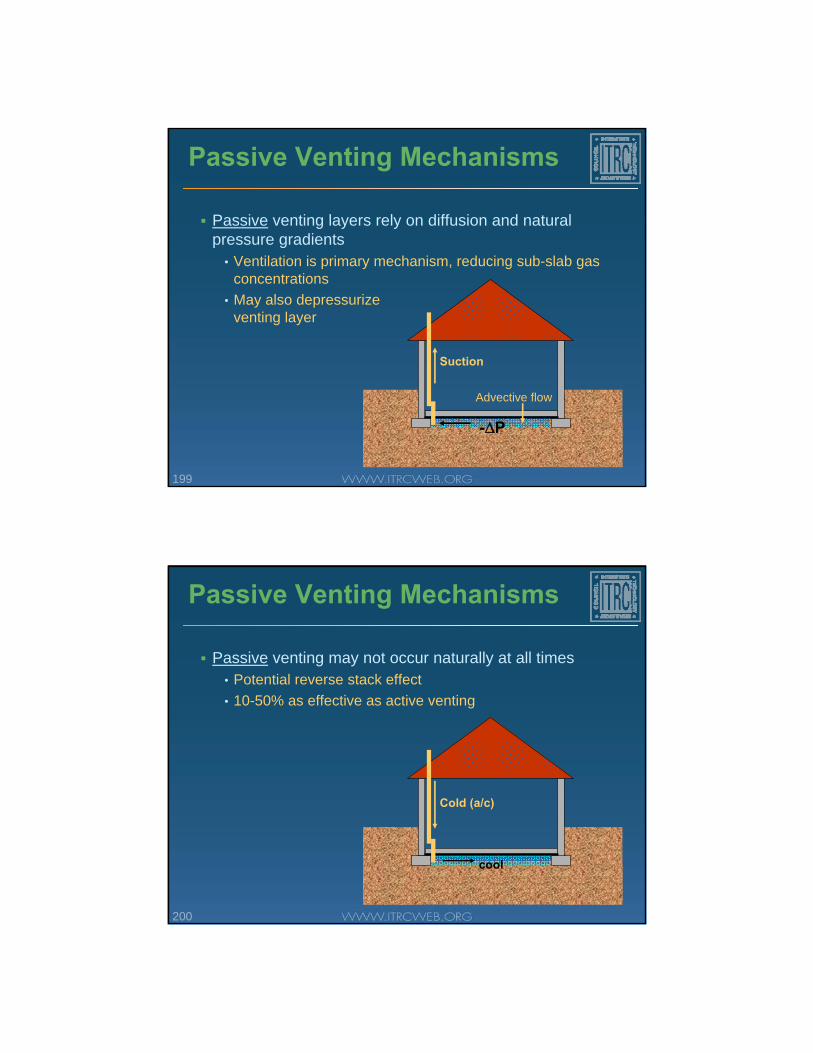
Passive Venting Mechanisms
Passive venting layers rely on diffusion and natural pressure gradients
• Ventilation is primary mechanism, reducing sub-slab gas concentrations
• May also depressurizeventing layer
Suction
-∆P
Advective flow
200
Passive Venting Mechanisms
Passive venting may not occur naturally at all times• Potential reverse stack effect• 10-50% as effective as active venting
Cold (a/c)
cool

201
Active Venting
Active venting layers rely on fans to create suction (i.e., depressurize venting layer)
• Passive vents are only 10 to 50%as effective as active systems
-∆P
Advective flow
Fan
202
Sub-slab (Active) Depressurization
Most widely applied and successful building controlExisting buildings – no barrier or venting layerNew buildings – typically include barriers and venting layers$1500 to $3000 to install WATER TABLEVAPORS
BASEMENT
FANSEAL
SUCTIONPIT
Building- specific conditions may limit options for suction pit, riser pipe, and fan locations.
Can be applied to new and existing structures
Wet and low permeability soils retard vapor movement
Adaptable technology, applicable to a wide variety of site conditions and geology
Requires periodic maintenanceSuccessful track record of performance, 90 to 99% reductions typical, 99.5% or greater reductions possible with well designed systems
DisadvantagesAdvantages

203
SSD in Existing Building
Riser Pipe
To Fan
Seal
Suction Pit-∆P
204
Suction Field
How much suction is needed?Recommended sub-slab depressurization levels to over-come indoor levels (EPA, 1993)
• 0.015 inches water column (WC) over entire slab• 0.025 to 0.035 inches if measured in summer without
exhaust fans runningHowever, good reductions (radon) often achieved with less depressurization due to sub-slab vapor concentrations (EPA, 1993)New York State Department of Environmental Conservation suggests minimum 0.003 inches WC

205
Diagnostic Tests - Example
Recreational facility in New YorkMultiple suction points tested - one shown in this example (S-1)
• Shop vac used to apply -41” WC suction• Pressure difference measured at 11 test holes
Courtesy Tom Hatton, Clean Vapor, Inc.
Slab
∆P = Pss - Pbuilding
Pss
Pbuilding
Negative ∆P
Postive ∆P
206
Diagnostic Test Example

207
Baseline Pressure Differentials
-0.04
-0.02
0
0.02
0.04
T-1 T-2 T-3 T-4 T-5 T-6 T-7 T-8 T-9 T-10 T-11Sub
-sla
b -I
ndoo
r Pre
ssur
e, In
. WC
208
Induced Pressure Differentials
-2.5
-2
-1.5
-1
-0.5
0 T-1 T-2 T-3 T-4 T-5 T-6 T-7 T-8 T-9 T-10 T-11
Sub
-sla
b -I
ndoo
r Pre
ssur
e, In
. WC

209
Suction Test Results
210
Radius of Influence
R2 = 0.8614
0.01
0.1
1
10
0 10 20 30 40 50 60 70
Distance, Feet
Dep
ress
uriz
atio
n (in
ches
WC
)
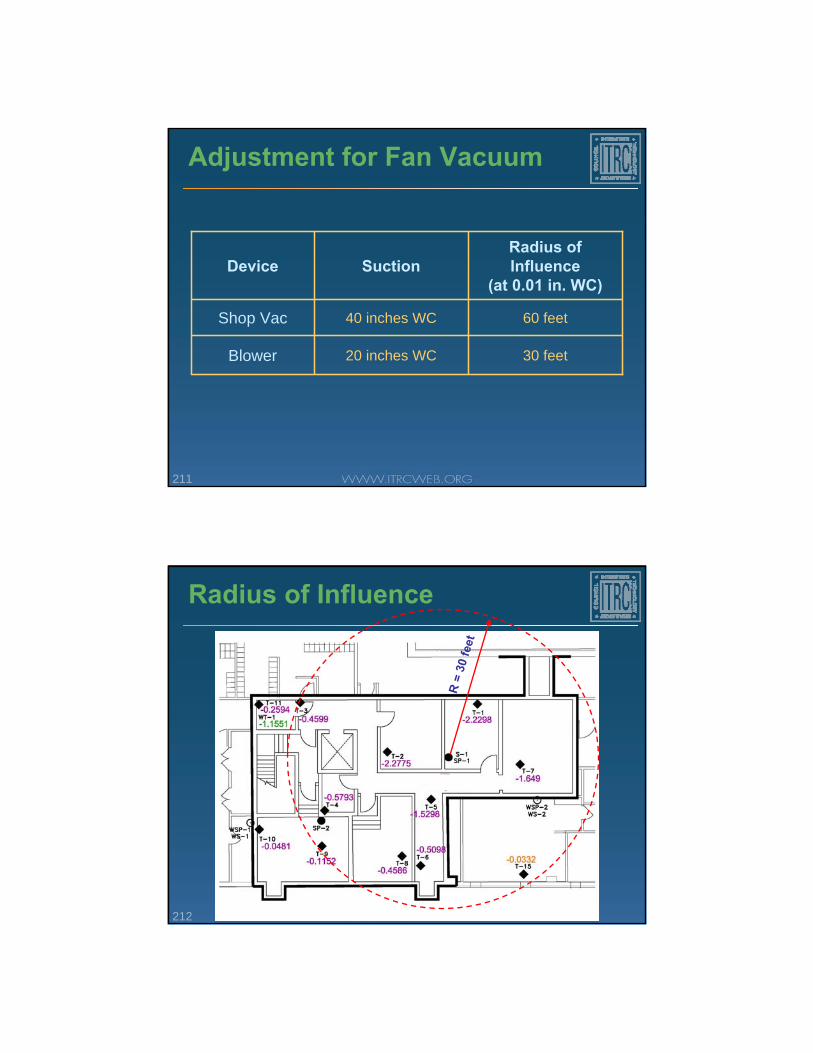
211
Adjustment for Fan Vacuum
30 feet20 inches WCBlower
60 feet 40 inches WCShop Vac
Radius of Influence
(at 0.01 in. WC)SuctionDevice
212
Radius of Influence
R =
30 fe
et

213
SSD Variations
Sub-Membrane Depressurization
Riser Pipe to Fan
Liner
Seal
o o o o o o o o o
Perforated Pipe
CRAWL SPACE
214
SSD Variations
Block Wall Depressurization
Cinder block foundation wall

215
SSD Variations
Foundation drain depressurization
Foundation drain
Sump
Air-tight Seal
216
Passive vs. Active
Favored by many developersNo active components or costsLess stigma perceivedBarriers must be robustVenting must be providedIntegrity should be tested (more difficult to test than active)Only works for new buildingsImperfections likely to existPassive venting less effectiveLack of performance data
Active ControlsPassive Controls

217
Passive vs. Active
Less favored by developersOperation and maintenance neededPerceived stigmaHighly effective (99.5% reduction)Relatively low cost most casesEasily tested (pressures)New or existing buildingsEasily modifiedSubstantial performance dataCan initially be passive (convert to active system if necessary)
Favored by many developersNo active components or costsLess stigma perceivedBarriers must be robustVenting must be providedIntegrity should be tested (more difficult to test than active)Only works for new buildingsImperfections likely to existPassive venting less effectiveLack of performance data
Active ControlsPassive Controls
218
Building Pressurization
Positive building pressures• Requires increase intake air
flow• Creates downward pressure
gradient through slab• Increases energy costs
HVAC
diffusion
+∆P

219
Indoor Air Treatment
Typical residential unit• Size of shop vac• 22 lbs of carbon• Effective up to 1500 ft2
• 3 speed 400-CFM fan –runs whisper quiet
• Electricity demand = 60 watt light bulb
Source: www.allerair.com
220
High Water Table
Mitigation options? Install french drains and depressurizePositive building pressureInstall false floor and depressurizeIndoor air treatmentIf surface water, may be clean lens

221
Intrinsically Safe Design
222
Operation, Maintenance and Monitoring
Operation• Electrical costs• Emission controls
Maintenance• Fan replacement
Monitoring• Testing• Inspections
Low Pressure Monitoring PanelCourtesy Tom Hatton, Clean Vapor, Inc.

223
Closure
When long term cleanup objectives are met• Building mitigation will no longer be required• Institutional controls can be retired/removed
Consider how decisions to stop mitigation will be made at the beginning of programCollect sufficient information during operations and maintenance (O&M) to make closure decisions
• Develop correlations between subsurface media concentrations and indoor air concentrations
224
Take Home Messages
Vapor intrusion is a complex pathwayMultiple lines of evidence approach is criticalTool box is large and growingBackground sources & physical processes complicate data interpretationScience of vapor intrusion is advancing and changing

225
ITRC Vapor Intrusion Pathway: A Practical Guideline (VI-1)
Key vapor intrusion issues• Investigative strategies• Phased, iterative process• Background
contamination• The “toolbox”• Conceptual site model• Future land use• Remediation technologies• Closure strategies• Qualified consultants
226
ITRC Resources Available Online
ITRC Vapor Intrusion Resources and Links
• Documents• Surveys• Links• Contacts• Training
http://www.itrcweb.org/VaporIntrusion

227
ITRC VI Classroom Training
ITRC is offering 2-Day classroom training on the VI pathway that will include:
Interactive PresentationsHands-on ExhibitsInformative HandoutsProblem Sets
2010 Sessions:
Norfolk, VA - March 22-23, 2010TBD – July 12-13, 2010Atlanta, GA – October 4-5, 2010