Embed Size (px)
Citation preview

– – ©
I. Introduction
A better
assessment of
pension risks is
needed
The growth of private pensions and their expanding role in retirement
income systems calls for a better understanding and management of the risks that
they are exposed to. Investment risk features most prominently amongst them, as
evidenced by the average decline of 20 percent in OECD private pension assets
between January and October 2008 (OECD 2009).
Defined benefit
plans are generally
preferable for
members but
perceived as less
attractive by many
employers
From the perspective of the plan member, private pensions are a form of
long-term savings, where contributions today are invested in order to pay for
benefits tomorrow. Plan members generally prefer guaranteed benefits, as in a
defined benefit (DB) plan, but trade-offs such as the cost of volatility in
contributions, need to be taken into account.1 Increasingly, however, employers
are turning to (collective) defined contribution (DC) plans where contribution
rates are fixed but retirement income risks are borne entirely by employees.
Focus of study is
on trade-offs
between volatility
in contributions
and benefits from
perspective of plan
member
The principal purpose of this article is to analyse the trade-off between the
(un)certainty in contributions on the one hand and benefits on the other that is
embedded in different pension arrangements. The article employs the funding
ratio (ratio of assets to liabilities) and the replacement rate (ratio of benefits to
salaries) as key criteria for evaluating the risk sharing characteristics of a
private pension plan or scheme from the perspective of the plan member. The
focus is on risk sharing within the various schemes, irrespective of whether it is
the employer, employees, or a combination of both that pays contributions.
The paper analyses
investment and
inflation risk as
well as
intergenerational
risk sharing
The main risks to a pension contract are investment risk (and specifically
the mismatch between assets and liabilities), inflation risk, biometric risks (of
which the most important in a pension plan is longevity risk) and
bankruptcy/insolvency risks. The focus in this article is on investment risk and
inflation risk, although longevity risk is introduced to study the limits of
intergenerational risk sharing via markets.
Pension plans can
be classified in
terms of type of
risk sharing
Higher benefit certainty as a pensioner inevitably leads to greater volatility
over contributions as a worker. In other words, the more benefits are protected
against investment and inflation risk, the greater will be the need to steer the
funding ratio via changes in contribution rates that ultimately affect current
workers‟ incomes. We analyse this basic trade-off across a range of design
schemes, ranging from arrangements where risks are completely or partially
pooled (DB and hybrid systems) to an arrangement without pooling (individual
DC). All pension arrangements assume that there is a single asset allocation for
all members. An extension of this research would allow differentiation of
investment policy between age cohorts, offering pensioners the results of a safer
investment portfolio.
Hybrid plans show
superior forms of
risk sharing
The stochastic simulations performed show that hybrid plans (those in
between traditional DB and individual DC) appear to be more efficient and
sustainable forms of risk sharing than either of the other two. Of the three main
hybrid plans analysed, conditional indexation plans appear to have the greatest
potential as sustainable forms of risk sharing.

– ©
Section II provides an introduction to risk sharing in occupational pension
arrangements. Section III provides an example of the limitations of risk sharing
via the market, highlighting the value of occupational pensions. Section IV
evaluates the outcomes of funding ratios and replacement rates for different
types of pension plans. The last section concludes.
I. Two main perspectives on risk sharing in pension arrangements
Risk sharing can
be analysed in two
main ways……
Between employees
and employers
The main value of collective or occupational pension plans lies in their
potentially low costs of administration and their ability to incorporate different
kinds of risk sharing that are not readily available in the market or that are only
accessible at a high cost. Risk sharing can be analysed from two different
perspectives. First, risks are shared between employees and pensioners on the
one hand and the sponsoring employers, on the other. This kind of risk sharing
was the subject of a recent OECD study.2 Analysing this form of risk sharing
requires a discussion of the overall wage setting framework, as pension
contributions are normally negotiated as part of the pay bargain process. In
theory, the balance between employer and employee contributions is neutral (or
irrelevant) because both are part of the total remuneration, so higher employer
contributions eventually mean lower salaries (or other benefits).
And within-
scheme risk
sharing
The second perspective on risk sharing is to focus on the benefits and costs
of risk sharing embedded in the various types of pension plans from the angle of
members and beneficiaries (pensioners) by assessing how (successfully) the
different risks are pooled within the various schemes. From this perspective
volatility of contributions constitute a risk for current workers, irrespective of
who pays for them. By focusing on within-scheme risk sharing, this article will
evaluate the trade-off between contribution risk (by focusing on the funding
ratio) and benefit risk (by using the replacement rate) for the average or
representative plan member and pensioner. The analysis could be developed
further to calculate the distribution of the net economic value of different forms
of plan design across employees of different ages and pensioners as well as its
evolution over time across different cohorts. This extension will be analysed in a
separate study.
II.a Risk sharing vs. redistribution
Risk sharing
should be
distinguished from
solidarity
In addition to offering risk-sharing features, occupational pension plans can
also involve one-sided or non-reciprocal redistributions between different kinds
of workers. For example, the uniform contribution rate that employees of all
ages pay in occupational plans of some countries like the Netherlands means that
for a given benefit level young workers „overpay‟ to acquire the pension rights
while older workers „underpay‟. This wealth transfer is partly offset by the lower
life expectancies of the old relative to the young at the same age, but given past
rates of life expectancy improvements, the net wealth transfer is likely to favour
the old. This kind of ‟solidarity‟ between the young and the old was the topic of
debates in the Netherlands (see, e.g., Boeijen et al., 2007, and Aarssen and
Kuipers, 2007). It has been argued that this transfer may be pushing the young
away from defined benefit arrangements in the direction of arrangements

– – ©
emphasising individual features (Boeijen et al., 2007).
Interestingly, such concerns seem not to have been voiced in other
countries, probably because the share of employee contributions is much lower
or nil.3 Unlike employee contributions - which indeed in most countries tend to
be a fixed percentage of wages - employer contributions to defined benefit
pension plans tend follow actuarial cost methods involving increasing
contributions as a percentage of salary with the age of the worker. This is the
case, for example, of the projected unit credit method, which is nowadays the
most popular actuarial cost method and has also been adopted by the
organisation in charge of international accounting standards.4
Some pension
plans involve
unintended
redistributions
More generally, the following types of intended or unintended
redistributions arise in occupational pension plans of the defined benefit type
that have employee contributions and accrual rates that do not vary with age:
From the young to the old;
From those who join the plan early in their lives to those who join it
late;
From those who leave the plan early to those who leave it later;
From those who have flat earnings profiles to those with steeper
earnings profiles towards the end of their career.
Other types of redistributions in defined benefit type that can emerge even
if employee contribution rates and accrual rates vary with age are the following:
When deferred benefits are not revalued like accrued benefits, early
leavers lose out at the expense of those who stay in the plan;
In final pay plans, workers with steeper earnings profiles profit at the
expense of workers with flatter profiles;
Partnered members profit at the expense of single members as their
partners obtain survivor‟s pensions;
Women on average get more value from equal contributions than men
because of their longer average life expectancy.5
II.b Key characteristics of risk sharing in different pension arrangements
There are six main
types of pension
plans with
associated risk
sharing features
Occupational pension arrangements can offer different forms of risk
sharing. This section describes briefly the key characteristics of six main types of
risk sharing arrangements observed in practice. The first four of these will be
evaluated in Section IV.

– ©
(i) Traditional (final pay and career average) DB plans
In these plans, a formula links benefits to wages and the length of the
service period. The replacement rate is fixed as a percentage of the worker‟s
final or career average wage. To the extent that benefits are paid as inflation-
indexed annuities, pensioners face no benefit risk. These types of plans therefore
shift all risks related to benefit provision to the sponsoring employer, and hence
to current and future workers.
(ii) DB plans with conditional indexation
In these pension arrangements, benefits are calculated as in traditional DB
plans except that indexation of pensions in payments and in some cases accrued
benefits is conditional on the plan‟s funded status. The higher is the funding ratio
the greater the extent of indexation.
(iii) Cash balance plans
Under a cash balance plan benefits are calculated on the basis of individual
accounts that are credited with a fixed investment return until retirement. At
retirement, benefits may be paid as lump-sums or annuities. Cash balance plans
is a type of risk-sharing pension arrangement that is free of all the redistributions
mentioned earlier. It only protects against investment risk, but not longevity risk
before retirement. It may also fail to protect against inflation risk if the
investment return guarantee is set at too low a level (or a nominal level only).
(iv) Collective DC plans
In a collective DC plan, contribution rates are fixed. Benefits are calculated
as in traditional DB one but both the extent of indexation and nominal benefits
are linked to the plan‟s funded status. Nominal accrued benefits and even
nominal pensions in payment can be cut if the funding ratio falls below a certain
level. Pensioners therefore face greater benefit risks than under the previous
pension arrangements.
(v) Nursery plans
Benefits are calculated on a pure (individual) DC basis up to a certain age
and DB thereafter. The plan effectively treats early leavers (those who leave
their employer before retirement) differently from long-tenure employees. The
latter are covered by a traditional DB plan, while the former are fully exposed to
benefit risk. Nursery plans, therefore, do not involve a different form of risk
sharing to the ones just described.

– – ©
(vi) Floor or underpin plans
Benefits are the higher of the outcomes of a DC and a DB formula. For
example, the plan may guarantee a minimum rate of return but pay the actual,
market rate of return if this is higher. Alternatively, the plan may guarantee
minimum benefits and pay higher ones based on a DC formula if these are
higher. Such pension deals have many similarities with both conditional
indexation and collective DC plans, but do not allow for any steering with the
funding ratio. Under such plans, there is no surplus or excess funding, as the
actual market return must always credited to benefits if it is higher than the
guaranteed level.
III. The limits of intergenerational risk sharing via the market
Pension funds are
institutions for
intergenerational
risk sharing
Before evaluating risk sharing through occupational pension plans one may
wonder whether such contracts can always be successfully replicated by the
market, specifically when intergenerational risks are involved. Two general
approaches or solutions to intergenerational risk sharing can in principle be
distinguished. The first approach is based on the principle that pension funds
collectively bear intergenerational risks. More precisely, pension funds
collectively organise risk sharing by redistributing the risks between various
stakeholders including future generations. This implies that these risks are in the
end borne by these stakeholders (pension funds act only an (organising) agent
and not as a principal; they do not own funds or reserves like insurers do). Given
the large population of (future) stakeholders, the price of intergenerational risk
sharing is lower when organised via pension funds. The first solution implies
that pension funds make markets more complete, meaning that pension funds
improve social welfare (assuming that efficient market-based hedging
opportunities are not available; see below and annex 1).
Intergenerational
risk sharing via the
market is limited
The second approach is based on hedging solutions via financial markets
(e.g. they buy hedges in the market or they reinsure these risks). The remainder
of this section discusses the limits of intergenerational risk-sharing via the
market. To illustrate the issues and policy decisions at stake, we will refer to
longevity risk as a clear case of an intergenerational risk that poses a great
challenge for pension funds to incorporate in pension arrangements.
The market for
hedging micro
longevity risk is
affected by adverse
selection
Idiosyncratic or micro longevity risk (survival risk) can in principle be
tackled in an efficient risk sharing fashion via annuities markets.6 Unfortunately,
private annuity markets are affected by adverse selection. Government action (in
the form of e.g. mandatory participation rules) can in principle address this type
of market failure.
Common tools to
minimise macro
longevity risk are
insufficient
Aggregate or macro longevity risk affects current cohorts in roughly the
same way. Positive correlations across individuals mean that private market
solutions cannot be used to share this risk efficiently.7 Common tools to
minimise exposure to this macro risk (diversification across cohorts,
international diversification via cross-border investments, risk sharing with
annuitants, or hedging of insurance companies by selling both annuities and life-
insurance) cannot completely eliminate it.

– ©
Governments are
best placed to
intermediate
intergenerational
risk sharing
Financial markets (including insurance) work efficiently for sharing short-
term risks between cohorts (with largely overlapping lifetimes) but not, for
example, for the long-term life risks of older cohorts that are largely known
when the younger cohorts arrive. Ex ante efficient intergenerational risk sharing
via private markets is therefore not possible as future generations cannot be
included.8 The government, on the other hand, can use fiscal policy (taxes, social
insurance, transfers and public debt) as a vehicle to spread risk across
generations, thereby (in theory) improving social welfare. To put it differently,
governments have in principle the ability to make markets more complete by
providing longevity insurance backed by future generations.9 This conclusion
can be generalised by introducing a social security system in an overlapping-
generation economy so as to achieve an optimal intergenerational risk sharing
arrangement.10
Governments need
to consider general
equilibrium effects
of macro longevity
risk
However, government interventions need to take the following
considerations into account.11
First, government policy need to include important
general equilibrium effects of aggregate longevity risks. A (permanent) macro
longevity shock not only increases systematically life spans, but has also macro-
economic effects via changes in factor prices and the capital-labour ratio.12
It is
therefore possible that a longevity shock will increase the (future) supply of
labour and decrease (future) wages.13
There are welfare
gains from
transferring risk
from older to
younger
generations
A second consideration is that future (“new”) generations are subject to the
same longevity shock as the current (“old”) generation. But the key difference in
terms of impact is that the new generation can use their entire life-span to adjust
labour supply, consumption and savings to a jump in longevity, while this is not
the case for the old generation.14
This perspective creates the possibility of
creating welfare gains by sharing some of the financial risks of longevity shocks
for the old generation with future generations. And only the government has the
power to enforce inter-generational contracts.15
In practice, taxes
and social security
may distort optimal
risk sharing
arrangements
A third consideration is that although governments have in principle the
tools to spread efficiently risk across generations, this may not occur in practice.
Optimal inter-generational risk-sharing may be distorted by taxes16
and social
security arrangements.17
This means that the optimal degree of inter-generational
risk-sharing has not been moved onto the right generation. Governments are
already heavily involved in inter-generational risk-sharing via public pensions
and other social security arrangements.18
It is difficult to demonstrate but the
distorting influence of “politics” makes it unlikely that this is the optimal amount
of risk-sharing. For the same reason it is likely that to-days‟ inter-generational
arrangements favour the current generation (of voters) at the expense of future
generations.19
IV. Evaluation of outcomes under different pension plans
Pensions plans are
assessed on the
basis of funding
and benefit levels
In order to evaluate the attractiveness of different pension plans we focus
on two key performance variables: the funding ratio and the replacement rate.
The funding ratio (the ratio of pension plan assets to liabilities) is an indicator of
the solvency of the pension plan, used by both regulators and investors. Ratios
below 100% indicate a situation of underfunding, requiring an elimination of the

– – ©
deficit via additional contributions, lower benefits, or both. Funding ratios above
100%, on the other hand, indicate that the plan has excess assets which requires
a strategy to allocate that excess over time. Beyond a certain level of excess
funding, the pension plan may reduce its contributions, increase its benefits, or
take both measures. Variability in the funding ratio reduces the predictability of
contribution schedules, creating costs for contributors (employers and
employees). Other than adjusting contributions and benefits, a pension plan may
reduce the variability in its funding ratio by seeking to invest its assets in a way
that closely mirrors movements in its liabilities.
Both nominal and
real funding ratios
are relevant policy
indicators
Funding ratios may be stated in nominal and in real terms. Nominal funding
ratios exclude any indexation to accrued benefits or benefits in payment.
Accrued benefits are calculated on the basis of current salaries while one
assumes that pensions in payment will be constant over time. Real funding
ratios, on the other hand, should in principle take full account of any indexation
promised or targeted. As indexation is voluntary in most OECD countries,
regulators normally use nominal funding ratios as their policy variable (see Pugh
and Yermo (2008)). Some countries also require pension funds to hold a
solvency margin above full funding. This is the case for example in Denmark,
Finland, and the Netherlands. For the pension fund itself, sponsoring employers,
and employees, the real funding ratio is a more relevant funding target, as the
goal is to deliver benefits that at least keep up with the cost of living (price
inflation) and if possible also with the standard of living (wage inflation).
The replacement
rate is a key benefit
measure
The second key performance variable of a pension plan that we analyse is
the replacement rate, defined as the ratio of a pensioner‟s benefit at retirement
relative to his or her final wage before retirement. For a person to maintain his or
her standard of living after retirement a reasonable target replacement rate is
70%. This level considers the fact that pensioners typically do not need to
contribute to pension systems, their lower consumption needs and in particular
the fact that in most OECD countries a worker reaching retirement is (or was at
some point) a home owner and hence spends only a small part of its disposable
income on housing. Variability in the replacement rate reduces a worker‟s
welfare by making it less likely that he or she will attain the target income at
retirement.
The different pension plans described earlier can be evaluated on these two
criteria by using a simple projection scenario that uses common assumptions:
Same contribution rate (14% of salary) and other basic plan rules (e.g.
payment in the form of annuities)
Same actuarial and economic assumptions (see appendix)
Same investment policy (60-40 and 30-70 equity-bond allocation)
Same regulations (e.g. minimum and maximum funding rules)
The specific pension plans modelled are the following:

– ©
Career-average defined benefit plan with unconditional indexation:
this plan pays benefits that are a percentage of the career average wage,
where both past wages and benefits in payment are indexed to the
average rate of salary growth of plan members. Effectively, the
replacement rate is fully guaranteed in real terms.
Career-average defined benefit plan with conditional indexation: as
above but indexation for purposes of calculating accrued benefits and
for indexing pensions in payment depends on the plan‟s funding status.
The conditionality affects all members, whether active, deferred or
passive, in an equal way. The formula, or indexation ladder, used to
calculate the extent of indexation is the one currently in place at
Pensioenfonds Zorg & Welzijn (PFZW), the second largest pension
fund in the Netherlands. The indexation ladder is described in Box 1.
Cash balance plan: this plan is based on a fixed indexation rate of
3.2% in nominal terms that is applied to accrued, deferred and
currently paid benefits. This rate is equal to the expected wage
inflation.
Collective DC plan: benefits are calculated as under a career-average
plan, but nominal benefits are cut when the nominal funding ratio is
below 95%, benefit cuts are made up when the nominal funding ratio
goes above 105% and extra benefits are paid when it goes above 180%.
“Individual” DC plan: benefit are calculated on the basis of an
individual account and market rates of return, but the contribution rate
progressively increases over time in order to reflect the actuarial
weighting of contributions in a defined benefit setting. The rising
contribution rate schedule makes it possible to compare this plan with
the other pension plans.
Box 1: Explanation of the indexation ladder of PFZW
The indexation ladder depends on both the nominal and real funding ratio of the fund. Any indexation given is linked to the wage inflation in the sector health care and social welfare. When the nominal funding ratio is below 105%, no indexation is given. When it is above 130%, full indexation is given, so the indexation is equal to the wage inflation. When the funding ratio is between 105% and 130%, only a part of the indexation is given. If the funding ratio is for instance 117.5% (exactly in the middle of 105 and 130), half of the wage inflation is given.
When the real funding ratio is above 100%, extra indexation is given. This extra indexation will only be given if any indexation in the past is missed and will be exactly as much as the indexation that is missed. For example, if in one year, the nominal funding ratio is 104% and the wage inflation is 3%, then no indexation is given (the funding ratio is below 105%). If a year later, the real funding ratio is above 100%, full indexation of that year is given and on top of that, extra indexation of 3% is given, because that is the missed indexation of last year. Figure 1 shows the indexation ladder.

– – ©
Figure 1: Indexation ladder of PFZW
-10%
0%
10%
20%
30%
40%
50%
60%
70%
80%
90%
100%
110%
120%
130%
140%
150%
Indexation (%
of w
age in
flation)
105% 130% 100% real
Model based on
Monte Carlo
simulations
The funding ratio and benefit projections are based on Monte Carlo
simulations. The funding ratio is calculated in both nominal and real terms. The
real funding ratio is calculated using a real interest rate to discount future
pension benefits and therefore overestimates the actual funding ratio if the
pension fund wishes to pay wage indexation (instead of price inflation). The
reason for using this approximation is that wage-adjusted discount rates are not
available in the market. However, as wage inflation is assumed to be on average
1% above price inflation, the wage-based real funding ratio may be as much as
20% lower than the levels calculated using the price-based real discount rate.
The starting real funding ratio is set at 100%. The simulation calculates 500
scenarios and generates the output in the form of dispersion of funding ratios and
replacement rates over a projection period of 40 years.20
The 500 scenarios are
real world scenarios. This means that they are forward looking and cannot be
used to calculate market values.
The input of the model consists of 500 different scenarios of economic
variables for 60 years into the future. The properties of these economic variables
- like standard deviation and correlations - are based on past data, where the
returns are based on PGGM assumptions. Table 1 shows some properties of the
most important variables.
Two main types of
investment
strategies are
modelled
Different kinds of investment policy were used in the models: a riskier
portfolio of 60% equity and 40% bonds; and a safer portfolio of 30% equities
and 70% bonds. Separate projections were also made for long maturity nominal
bonds and index-linked bonds.21
– ©
Table 1. Statistical properties of main financial and economic variables used in model
Average (arithmetic) Average (geometric) Standard deviation
Wage inflation 3.3% 3.2% 3.2%
Price inflation 2.0% 2.0% 1.9%
Equity 8.7% 7.8% 14.8%
Bonds 4.4% 4.4% 4.0%
Short interest rate
(3-month nominal) 3.8% 3.8% 1.5%
Long interest rate
(30 years nominal) 5.2% 5.2% 1.2%
Short interest rate
(3-month real) 1.8% 1.8% 1.1%
Long interest rate
(30 years real) 2.7% 2.7% 0.5%
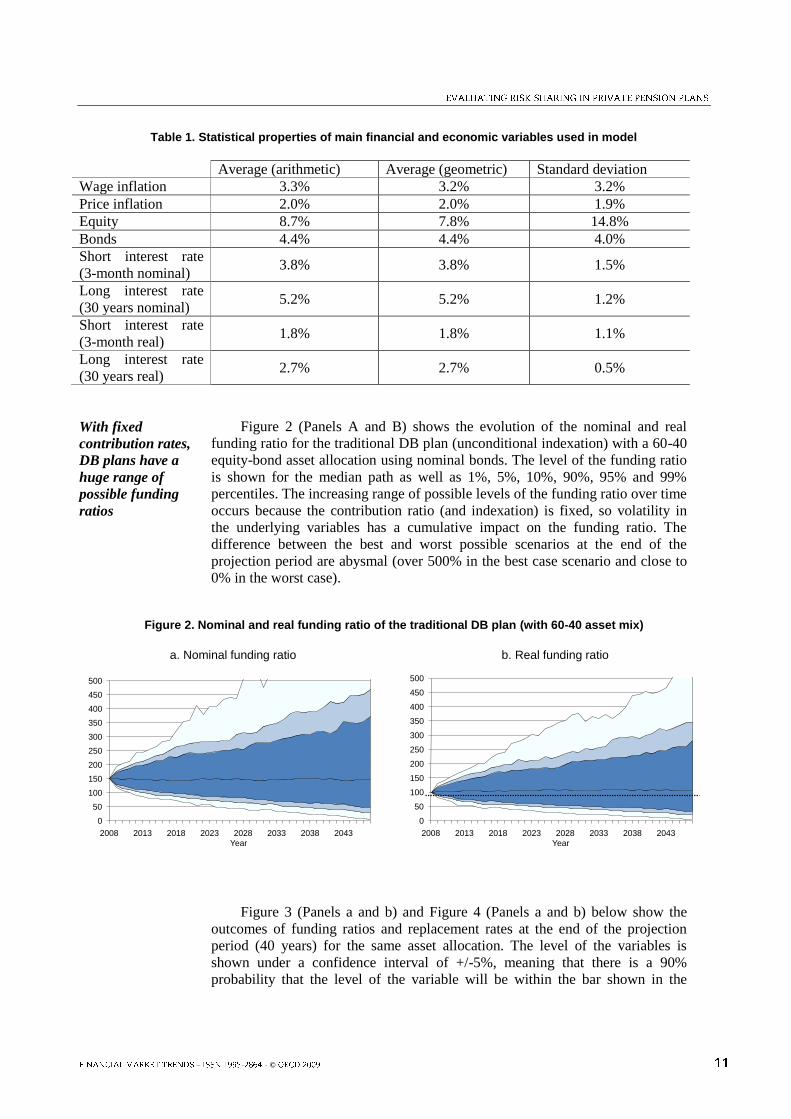
With fixed
contribution rates,
DB plans have a
huge range of
possible funding
ratios
Figure 2 (Panels A and B) shows the evolution of the nominal and real
funding ratio for the traditional DB plan (unconditional indexation) with a 60-40
equity-bond asset allocation using nominal bonds. The level of the funding ratio
is shown for the median path as well as 1%, 5%, 10%, 90%, 95% and 99%
percentiles. The increasing range of possible levels of the funding ratio over time
occurs because the contribution ratio (and indexation) is fixed, so volatility in
the underlying variables has a cumulative impact on the funding ratio. The
difference between the best and worst possible scenarios at the end of the
projection period are abysmal (over 500% in the best case scenario and close to
0% in the worst case).
Figure 2. Nominal and real funding ratio of the traditional DB plan (with 60-40 asset mix)
a. Nominal funding ratio
0
50
100
150
200
250
300
350
400
450
500
2008 2013 2018 2023 2028 2033 2038 2043
Year
b. Real funding ratio
0
50
100
150
200
250
300
350
400
450
500
2008 2013 2018 2023 2028 2033 2038 2043
Year
Figure 3 (Panels a and b) and Figure 4 (Panels a and b) below show the
outcomes of funding ratios and replacement rates at the end of the projection
period (40 years) for the same asset allocation. The level of the variables is
shown under a confidence interval of +/-5%, meaning that there is a 90%
probability that the level of the variable will be within the bar shown in the

– – ©
figure after 40 years. The middle point indicated with a cross is the median level
of the variable at the end of the projection period.
Figure 3a shows the nominal funding ratios while Figure 3b shows the real
funding ratio. The real funding ratio shows a similar pattern across pension plans
to that of the nominal ones but the ranges are much narrower. Figure 4a shows
the range of replacement rates that may be reached with different degrees of
certainty under the various pension plans. Finally, Figure 4b shows the age at
which a plan member may expect to reach a 70% replacement rate with different
degrees of certainty. This chart quantifies the value of lower (higher)
replacement rates relative to the 70% target in additional (fewer) years of work,
that is in later (earlier) retirement.
Figure 3. Funding ratio projections for different pension plans at t=40
a. Nominal funding ratio projections
0
100
200
300
400
500
600
uncond index cond index Cash balance Collective DC Individual DC
95%
50%
5%
b. Real funding ratio projections
0
100
200
300
400
500
600
uncond index cond index Cash balance Collective DC Individual DC
95%
50%
5%
Figure 4. Replacement rate and required age projections for different pension plans at t=40
a. Replacement rate projections
0
20
40
60
80
100
120
uncond index cond index Cash balance Collective DC Individual DC
95%
50%
5%
b. Age required to reach 70% replacement rate
58
60
62
64
66
68
70
uncond index cond index Cash balance Collective DC Individual DC
95%
50%
5%
Risk manifests
itself in funding
ratio or
replacement rate
As can be observed by contrasting Figures 3a and 3b against 4a and 4b, risk
manifests itself in either the funding ratio or in the replacement rate. As the
projections assume a fixed contribution rate, the greater the security sought in
the replacement rate (the smaller the range of possible outcomes) the greater the
variability in the funding ratio. The range of possible funding ratio outcomes and

– ©
replacement rates is very large. At one extreme, the plan with unconditional
indexation (the first on the left of both figures) offers a replacement rate of
around 70% under all scenarios, but the corresponding funding ratio can range
between 20 percent and nearly 340% (funding ratios below and above these
levels have each a 5% probability). At the other extreme, a pure DC plan is fully
funded at all times, but leads to a range of possible replacement rates from 50%
to 112%. As shown in Figure 3b, the worst 5% of scenarios for the pure DC plan
(a replacement rate lower than 50%) can also be interpreted as requiring for at
least an additional three years of work in order to achieve the target 70%
replacement rate.
The pension plans in between are various forms of risk sharing
arrangements that involve variability in both funding ratios and replacement
rates, but at narrower ranges than in the two extreme cases. In particular, the
conditional indexation plan reduces some of the risk of underfunding but
introduces a risk of lower (and to some extent also higher) replacement rates
than under the unconditional scenario case.
Collective DC
plans lead to
benefit profiles
similar to those of
individual DC
plans
The cash balance plan offers improved upside potential on replacement
rates, while lowering the risk of overfunding and raising the risk of underfunding
relative to the conditional indexation plan. The collective DC system in turn
provides greater security over the funding ratio but at the expense of a larger
variability of the replacement rate. In fact, this last plan provides benefit
outcomes that are not that different to those of a pure DC plan.
V. How to select ‘optimal’ pension plans
Choosing between
plan deals depends
on the member’s
risk aversion
How should employers and employees choose among the different pension
plans described above? From the perspective of a risk-averse worker, the career-
average plan with unconditional indexation would seem to be the natural choice.
The replacement rate offered by this plan (around 70%) is nearly equal to that of
the average scenario under any of the other pension plans. But all the other plans
expose the worker to the possibility that benefits will be lower or higher than this
average level.
Benefit promises
ultimately come at
the cost of funding
and, hence,
contribution
volatility
However, a promise of a fixed replacement rate requires someone to
manage the risks of the funding ratio. As regulators set constraints to both under-
and overfunding to limit, respectively, solvency risks and tax abuse, highly
variable funding ratios need to be corrected via changes in the contribution
policy. This means in turn that workers are ultimately exposed to changes in
their net wages. Security in pensioners‟ income ultimately translates into
insecurity in workers‟ income.22
Contribution risk
ultimately
translates into
wage risk
By accepting a somewhat more volatile replacement rate after retirement
employers and employees can be exposed to a less volatile funding ratio.
Employers, workers, and pensioners need to decide on a suitable trade-off
between funding and benefit volatility that meets their respective concerns.
Volatile funding ratios imply volatile consumption for active members (the
pension fund will use the contribution policy to steer the funding ratio to
sustainable levels); volatile replacement rates imply volatile consumption

– – ©
changes around the retirement age. Since individuals seek to smooth their
consumption patterns throughout their life, hybrid systems using both
contribution rates and benefits (replacement rates) as policy instruments would
appear to dominate systems using only one of the two instruments.
Uncertainty over
benefits reduces
scope for adjusting
contributions
However, all of these risk sharing pension plans require a commitment on
the part of the different stakeholders to honour their commitments. Are such
commitments sustainable over time? A generation that under a risk-sharing plan
is exposed to higher contribution rates could also end up at retirement with lower
replacement rates than the previous generation. Hence, it may be argued that the
higher the dispersion in benefit outcomes the less likely that workers will be
willing to support current beneficiaries via increases in contributions.
Cash balance
plans are at
greatest risk of
very low funding
levels
While it is difficult to generalise on this issue, it would seem that the cash
balance plan is at greatest risk of suffering such generational conflicts. Both the
conditional indexation plans and the collective DC plan lower the risk of
underfunding to such a degree that makes it very unlikely that there will be a
need to vary contribution rates. Only in the worst 5% of scenarios is the real
funding ratio below 65%, while the nominal funding ratio only falls below 94%
(in the conditional indexation plan) and 91% (in the collective DC plan) under
the worst 5% of scenarios. On the other hand, under a cash balance plan, the real
and nominal funding ratios are expected to be below 46% and 63%, respectively,
in the worst 5% of scenarios. As pension regulators focus mainly on nominal
funding ratios, at least when indexation is not guaranteed, the contribution policy
of the cash balance plan is likely to be very volatile.
Conditional
indexation plans
risk a build-up of
very large buffers
The conditional indexation suffers from a different type of problem, which
is the possibility of building large funding surpluses or excess funding.23
Such
outcomes may not only lead to demands for higher benefits but are in practice
prohibited by tax authorities so as to reduce tax abuse.24
A practical solution to
situations of very high levels of overfunding is to engage in contribution
holidays, as is the case in traditional defined benefit plans. However, there may
be demands for higher benefits from current pensioners. Conditional indexation
plans therefore call for a transparent and intergenerationally satisfactory policy
on how very large funding surpluses will be allocated.
Limited value risk
sharing in
collective DC plans
Generational tensions over funding deficits and surpluses favour generally
pension plans such as those exemplified by the collective DC plan modelled in
the previous section. Underfunding leads to lower benefits while overfunding
leads to higher benefits, following a clear policy rule. However, both workers
and pensioners may question the value of risk sharing under this plan as the
downside and upside risks are very similar to those of a pure DC plan. The
extent of risk sharing in collective DC plans is dependent on the levels at which
the pension funds cuts and increases benefits25
.
These arguments are summarised in Table 2 in a very synthetic form in
order to assess the sustainability of these different pension plans along three
different dimensions of risk sharing: the predictability of the replacement rate,
the risk of higher contribution rates, and the risk of high funding ratios (build-up
of large surpluses). The scores are based on a +/- formulation, where “+”
indicates a positive outcome from the perspective of members and “-” indicates a

– ©
negative outcome. The numbers of pluses or minuses indicates the importance of
the effect. The pure DC plan is given a zero score on all three indicators so it is
used as the reference against which all other plans are scored.
The more predictable and stable the benefits, the greater the value of the
pension arrangement for plan members. On the other hand, a greater risk of
higher contribution rates lowers the value of the arrangement. Finally, the build-
up of large surpluses can also lead to demands for special pay-outs or lower
contributions and hence jeopardise the viability of the pension arrangement in
question. However, as mentioned before, large surpluses can be allocated via an
intergenerationally satisfactory rule. They are in general less threatening to the
perceived value of pension arrangements than increases in contribution rates.
Table 2. Risk sharing in different pension plans
Pension plan Level and predictability of replacement rate
Risk of higher contribution rates
Risk of high funding ratios
DB, unconditional indexation
++++ ---- ----
DB, conditional indexation
++ - ----
Cash balance +++ --- ---
Collective DC + - -
Pure DC 0 0 0
VI. Concluding remarks
Pension plans can
be assessed
according to their
risk sharing
features
This study has evaluated the attractiveness of different types of pension
arrangements from the perspective of the members by analysing the trade-off
between the uncertainty in contributions on the one hand, and benefits on the
other that is embedded in different pension arrangements. The paper employed
the funding ratio (ratio of assets to liabilities) and the replacement rate (ratio of
benefits to salaries) as key criteria for evaluating the risk sharing characteristics
of the various private pension plans or schemes from the perspective of the plan
member. This trade-off is dependent on the risk sharing characteristics within the
various schemes, irrespective of whether it is the employer, employees, or a
combination of both that pays contributions. The pension arrangements
considered range from the traditional DB plan where the replacement rate is
guaranteed in real terms (no benefit risk) to the pure or individual DC plan
where individual members bear fully the uncertainty of the level of benefits
stemming from three main sources of risk (investment, inflation and longevity).
Hybrid plans can
provide effective
risk sharing
Our simulations (focusing on inflation and investment risks) show that
hybrid plans (those in between traditional DB and individual DC) may entail
more efficient and sustainable forms of risk sharing. Conditional indexation
plans offer high levels of predictability of replacement rates, have a low risk of
requiring higher contribution rates to correct underfunding and only suffer from
a high risk of building up large funding excesses. But it was also shown that the
latter feature is ultimately more a blessing than a curse. In contrast, collective
DC plans do not suffer from the risk of high funding excesses, but they expose
– – ©
pensioners to substantial replacement rate risk, offering a range of benefit
outcomes that is not that different from individual DC plans. The cash balance
plan modelled offers lower downside risk to replacement rates than either of the
previous two deals but suffers from a substantial risk of underfunding, and hence
higher contribution rates. However, it should be noted that this underfunding risk
is driven by the assumption of a fixed rate of return assumption on contributions.
In practice, cash balance plans may index returns (and benefits) to a market rate
of return, such as a government bond rate, which would make underfunding less
problematic but would lead to greater risk in benefit levels.
Conditional
indexation plans
appear best placed
to deal with
financial risks
In sum, in today‟s regulatory, social and economic environment,
conditional indexation plans seem to have the greatest potential to deliver high,
predictable pensions, while maintaining some stability in contribution costs,
thereby suggesting themselves as a sustainable form of risk sharing. An
improved version of a conditional indexation plan than the one considered here
may involve greater security for pensioners over indexation in exchange of
greater upside over benefits (access to the funding excess) for active members.
Ultimately, however, the choice of a specific pension arrangement depends on
the preferences of employees and pensioners, and in particular their degree of
risk aversion and their ability or willingness to commit to an intergenerational
risk sharing contract.
Longevity risk
requires further
research
In a follow-up study we intend to extend our study by addressing also
longevity risk in the simulations and by calculating the distribution of the net
economic value of the various pension arrangements across employees of
different ages and pensioners.

– ©
ANNEX 1. CHANNELS OF RISK TRANSFER
This annex discusses several proposals for risk transfer. As in the main text,
we will take longevity risk as a concrete example. This risk transfer is needed or
should be considered when pension funds (or annuity providers) are not capable
to absorb and manage efficiently longevity risk26
. Transferring the longevity risk
of pension funds27
and annuity providers can then in principle take place via four
principal channels:28
Protection seeker takes insurance from re-insurers.
Conversion of DB benefits to annuities via bulk „buy outs‟.
Annuity provider writes balancing insurance product.29
Capital market solutions.
Re-insurance companies have a fairly limited underwriting capacity. As a
rule, re-insurers do not take on longevity risk, unless it is for an existing client
and part of an overall package of risks, while capped at a relatively small level.30
As a result, the appetite of re-insurers for longevity risk transaction seems to be
rather small at this stage, although this situation can improve with more precise
knowledge of this risk and growing risk transfer demand.
Also the capacity of the buy-out market is rather small. The conversion of
DB benefits to annuities is both very expensive, while insurance capacity is very
limited. Initially, the UK buy-out market shrunk, with only two major re-insurers
active.31
However, more recently (during the last 1-2 years), there has been a
significant increase in the UK buy-out market.
The third way of transferring longevity risk is based on hedging through
balancing products. An obvious example is the case where a holder of longevity
risk would enter into a contract with a term assurance portfolio, thereby
combining a conventional level annuity with a whole-life assurance to the value
of the cost of the annuity. The resulting combination of the underlying risks
(mortality and longevity risk) would then reduce an insurer‟s exposure to future
increases in longevity, thereby also reducing the capital reserves held in respect
of this risk.
The very limited capacity of the first three channels for transferring
longevity risk has prompted the search for capital market solutions. This last
channel for transferring longevity risk would allow protection seekers to buy
longevity bonds.32
This capital market channel will be discussed in the remainder
of this section.

– – ©
Proposed solutions for reducing the exposure to longevity risk of pension
funds and annuity providers are conceptually simple, as they require the
construction of capital market instruments linked to a reliable longevity index.
Given a suitable index it would be possible to construct longevity bonds with
either the coupon or principal (or both) at risk of default if longevity
improvements in excess of expectations occurred.33
These instruments can then
be used to hedge mortality and longevity risk.34
However, most longevity
products that are currently being developed or offered offer a hedge against
current longevity risk. Pension funds are also interested in hedging future
longevity risk (the likelihood that someone who is of 25 years old to-day will
live 5 years longer is substantially higher than for someone who is already 80).
Although life insurers and pension funds have similar liabilities, they have
different perspectives.35
Insurance companies are concerned about potential
catastrophic losses, while pension plans aim to protect corporate cash flows from
incremental losses.
However, in practice it is unlikely that the private-sector will be successful
in the short-term. Research has identified a number of key obstacles that explain
why a large scale private-sector driven market in longevity products is unlikely
to develop in the near future.36
For this reason many analyst have proposed a
central capital market role for public policy by issuing longevity-indexed bonds.
However, this public policy role is hampered by the fact (as noted above) that –
on a balance sheet basis - governments themselves are already exposed to
significant longevity risk. This means that issuing longevity-indexed government
bonds (LIBs) would further increase their current exposure. Earlier one of us had
concluded that the prospects for a successful, large scale market in LIBs seem
not favourable at this stage.37
It is also doubtful whether relatively small
government issues of LIBs would suffice to create a benchmark around which
large-scale capital-market solutions by the private sector could develop.
But perhaps the government can play an important role in overcoming a
number of important difficulties related to market practices and conventions
such as indices and types of indexation.38
Indices need to be developed so they
can be embedded in LIBs. Since these indices provide the benchmark against
which future mortality will be measured, they need to be simple and transparent,
based on robust data, statistically credible, and calculated in an unbiased
manner.39
Statistics produced by government agencies can meet these criteria as
long as they can act as independent professional institutions (i.e. they need to be
free from day-to-day political pressures). Another practical problem is related to
market scepticism around the stochastic mortality models to predict future
mortality. Overcoming these obstacles will support finding capital market
solutions (e.g. new products) by private agents.

– ©
NOTES
1 This preference for DB plans usually abstracts from possible downsides such as lack of portability and the possible
absence of an acceptable protection against insolvency of the plan sponsor that guarantees the benefits. In
addition, McCarthy (2003) has argued that for younger workers, with large human to financial capital
ratios, final pay DB plans may not be optimal.
2 See Pugh and Yermo (2008).
3 But implicitly employees are paying, because with total remuneration fixed, higher employer contributions imply
lower (other) employee benefits.
4 One criticism of this method is that it incorporates wage increases in benefits (liabilities), while offsetting future
contributions on the asset side of the balance sheet are not included. This leads to an inconsistency in
valuation methods between assets and liabilities.
5 There seems also to be a substantial redistribution from lower social (income) classes to higher income classes and
from immigrants to autochthonous (see for example CPB study,
http://www.cpb.nl/nl/pub/cpbreeksen/discussie/81/disc81.pdf).
6 For the first pillar this is not necessary, because risk sharing is already incorporated (since first pillar pensions are
paid out as annuities), although the government (society) still bears macro longevity risk (see below).
7 Bohn (2005).
8 However, even if future generations could be included, potential conflicts cannot be ruled out. For example, let us
assume that we can arrange an ex ante fair pension arrangement for all generations, including future ones at
t=T. But by the time that future generations actually join the pension fund at t=T+1 that „fair pension deal‟
(which by the passage of time has become partly ex post) can have either a positive or a negative value for
that pension fund-joining generation. If that ex post negative value is considered too large, future
generations may opt-out when they are joining the fund at t=T+1 [even though it was considered ex ante (at
t=T) a fair pension deal]. This implies that the expected ex post redistributions should not be „too large‟
from the perspective of future generations, because the larger their size, the larger the probability that
future generations will opt-out.
9 Brown and Orszag (2006).
10 See Ball and Mankiw (2007).
11 Bohn (2005).
12 The capital-labour ratio will not be directly affected when retirement ages are fixed. If the retirement age is fixed, a
higher life expectancy does not immediately have a direct impact on the labour market. However, financial
pressures (including budgetary ones) and the (expected) influence of a permanent macro longevity shock
on both financial market prices and output during the retirement stage, may lead to changes in the
retirement age. There will also be a direct impact on consumption (savings) and prices.
There is also another secondary impact. With a fixed retirement age and an increasing life span, pension
benefits will become lower or pension contributions will become more expansive (if we keep pension
payments on the same level). The latter implies higher contributions, possibly affecting the price of labour.

– – ©
13
Brown and Orszag (2006); note that via these general equilibrium effects future generations would already share
(partially) in longevity risk.
14 Brown and Orszag (2006).
15 Naturally, (future) politicians can always break these contracts. Pension reform is to a large degree synonymous
with breaking inter-generational contracts. But, hopefully, these reforms engineer a move away from the
existing non-optimal degree of inter-generational risk-sharing.
16 Bohn (2005).
17 Brown and Orszag (2006).
18 See Ball and Mankiw (2007) for the use of an overlapping-generations model to show how the government
influences the allocation of risk among generations through the social security system.
19 Heller (2003). This situation is likely to worsen in response to population ageing. A greater number of retirees will
be able to use their voting power to put extra pressure on the next (smaller) generation.
20 From 25 to 65, the assumed retirement age. We use 60 years scenarios to include 20 years of retirement.
21 These simulations are available upon request from the authors. They show higher funding ratios and replacement
rates at all risk levels.
22 The ageing society makes this insecurity even larger. The risk of a growing, larger number of pensioners is borne
by a small, declining number of workers.
23 Another problem is that in low inflation situations, steering with indexation is not very powerful.
24 However, some buffers may be needed for risk borne by the pension fund, as required by regulators in some
European countries.
25 In the collective DC plan, we assumed cutting benefits below a nominal funding ratio of 95% and increasing them
above 180% (see paragraph 29.). A wider interval (without cutting and increasing benefits), will lead to
more secure benefits and a wider dispersion of the funding ratio. We have not tried to optimise the various
pension systems.
26 It can be argued that an important intermediary function of pension funds is to absorb and manage longevity risk.
This means that, in principle, active member take over the risk from the pensioners. Pension funds would
then make markets more complete by delivering this risk-management service to pensioners. Naturally, this
risk should be properly priced and pension funds (in particular the larger ones) should have the required
expertise and comparative advantage in managing longevity risk. In this way, active members (and other
stakeholders taking over these risks) are (and indeed can be) properly rewarded.
27 Longevity risk faced by pension funds can also be managed via a forward-looking contribution policy (e.g. by
including improved longevity in the calculation of future liabilities and by including margins). A forward-
looking contribution policy acts to some extent also as a hedge.
28 Schroeder and Clark (2005); Richards and Jones (2004); Morgan Stanley (2005).
29 Some pension funds have bought (general) protection for downside risks (e.g. put options to protect against
deficits).

– ©
30
Richards and Jones (2004).
31 Byrne and Harrison (2005).
32 Other financial market products can in principle also provide a (partial) hedge. For example, with people living
longer, they will also consume longer. As a result, many companies will make more profits, in particular
the medical sector and other ageing-related companies. This in turn would imply that that also equity
markets would provide (to some degree at least) a hedge against longevity risk.
33 Stephen Richards and Jones (2004).
34 This is likely to be a partial hedge as in practice significant basis risk – a portfolio of annuitants or members of
pension plans or insurance schemes may exhibit a very different pattern of longevity improvements
compared to the underlying index for a bond – will remain in portfolios or pension and insurance schemes.
For example, Fernandes (2005) argues that basis risk could be of the order of 20%. More in general, an
index linked to the general population will imply a basis risk for the pension plan, since the longevity of
members of a pension fund is generally higher. (Note that the working part of the population has a higher
life expectancy than the total population because the latter also includes „sick‟ people.)
35 Roberts (2005).
36 Blommestein (2006).
37 Blommestein (2006).
38 Since the government is one of the stakeholders, it is desirable that an independent government agency is involved
in setting market standards (as suggested below). Also professional, highly reputable organisations can be
involved. For example, in the Netherlands, the Actuarial Society (Actuarieel Genootschap) produces
mortality tables (including expected trends).
39 Roberts (2005).
REFERENCES
Aarssen, K. and Kuipers, B.J. (2007), “Everyone gains, but some more than others”, in O.W. Steenbeek
and S.G. van der Lecq (ed), Costs and Benefits of Collective Pension Schemes, Springer.
Antolin, P. and H. Blommestein (2007), “Governments and the market for longevity indexed bonds”
OECD Working Paper on Insurance and Private Pensions 4.
Ball, L. and N. G. Mankiw, (2007), “Intergenerational Risk Sharing in the Spirit of Arrow, Debreu, and
Rawls, with Applications to Social Security Design”, Journal of Political Economy, Vol. 115 no. 4.
Boeijen, T.A.H., Jansen, C., Kortleve, C.E. and J.H. Tamerus (2007), ”Intergenerational solidarity in the
uniform contribution and accrual system”, in O.W. Steenbeek and S.G. van der Lecq (ed), Costs and
Benefits of Collective Pension Schemes, Springer.

– – ©
Blommestein, Hans J. (2006), “What are the factors for a successful market in longevity-indexed
government bonds (LIBs)? A public debt management perspective”, Pensions Management – An
International Journal, Volume 11, Issue 2, Palgrave McMillan.
Bohn, Henning (2005), "Who Bears What Risk? An Intergenerational Perspective, Pension Research
Council Working Paper PRC WP 2005-7.
Brown, J.R. and Peter R. Orszag (2006), “The Political Economy of Government Issued Longevity
Bonds”, Paper presented at the Second International Longevity Risk and Capital Market Solutions
Conference, April.
Byrne, Alistair and Debbie Harrison (2005), Is longevity risk a one-way market? Report of the First
International Conference on Longevity Risk and Capital Market Solutions, held on 18 February
2005, London.
Continuous Mortality Investigation, CMI, (2005a), “Projecting future mortality: Towards a proposal for a
stochastic methodology”, Mortality Committee, Working Paper 15.
Continuous Mortality Investigation, CMI, (2006), “Stochastic projection methodologies: Further progress
and P-spline model features, example results and implications”, Mortality Committee, Working
Paper 20.
European Commission (2006), “The Impact of Ageing on Public Expenditure: Projections for the EU25
Member States on pension, health care, long-term care, education and unemployment transfers
(2004-2050)” European Economy Special Report 1/2006.
Fernandes, Francis (2005), “Longevity Bond: A pension fund perspective”, Presentation at the First
International Conference on Longevity Risk and Capital Market Solutions, held on 18 February
2005, London.
Heller, Peter (2003), “Who Will Pay? Coping with Aging Societies, Climate Change and Other Long-Term
Fiscal Challenges” IMF, Washington D.C.
McCarthy, D. (2003), “A Life-Cycle Analysis of Defined Benefit Pension Plans”, Journal of Pension
Economics and Finance, Volume 2, Issue 2, July 2003.
Morgan Stanley (2005), Challenges to Market Development, Presentation at the First International
Conference on Longevity Risk and Capital Market Solutions, 18 February 2005, London.
OECD (2009), Private Pensions Outlook, OECD: Paris.
Pugh, C. and Yermo, J. (2008), “Funding Regulations and Risk Sharing”, OECD Working Paper on
Insurance and Private Pensions No. 17, April 2008.
Richards, Stephen and Gavin Jones (2004), Financial aspects of longevity risk, Paper presented to the
Staple Inn Actuarial Society, London, 26 October 2005.
Roberts, Philip (2005), A practical framework for facilitating longevity risk transfer, Presentation at the
First International Conference on Longevity Risk and Capital Market Solutions, 18 February 2005,
London.

– ©
Schroeder, Thomas and David Clark (2005), What are the key factors that will drive the longevity bond
market? Paper presented at the Seventh Annual OECD-World Bank Global Bond Market Forum,
held on 23-24 May 2005 in Washington, D.C.