Embed Size (px)
Citation preview
MULTIEMPLOYER PENSION PLANS Report to Congress Required by
the Pension Protection Act of 2006
ii
• f1V(\
PBGC JAN 2 2 2013
The Honorable Joseph Biden President of the Senate Washington, D.C. 20510
Dear Mr. President:
We are pleased to submit to the Congress the multiemployer pension plan report required by section 221 of the Pension Protection Act of 2006 (PPA). Section 221 directs the Secretary of Labor, the Secretary of the Treasury, and the Director of the Pension Benefit Guaranty Corporation (PBGC) to study the effects of the PP A's amendments to the Employee Retirement Income Security Act of 1974, as amended (ERISA), and the Internal Revenue Code of 1986, as amended, on the operation and funding status of multiemployer plans, and to report to the Congress the results of such study.
~~~M;~~ ~2r~ <S~~ Hilda L. Solis Timothy F. Geithner Joshua Gotbaum Secretary of Labor Secretary of the Treasury Director, PBGC
iii
• n
,v~
PBGC JAN 2 2 2013
The Honorable John Boehner Speaker of the House of Representatives Washington, D.C. 20515
Dear Mr. Speaker:
We are pleased to submit to the Congress the multiemployer pension plan report required by section 221 of the Pension Protection Act of 2006 (PP A). Section 221 directs the Secretary of Labor, the Secretary of the Treasury, and the Director of the Pension Benefit Guaranty Corporation (PBGC) to study the effects of the PP A's amendments to the Employee Retirement Income Security Act of 1974, as amended (ERISA), and the Internal Revenue Code of 1986, as amended, on the operation and funding status of multiemployer plans, and to report to the Congress the results of such study.
~if-M.; ~F.' ~a-~r- Go116~ Hilda L. Solis Timothy F. Geithner Joshua Gotbaum Secretary of Labor Secretary of the Treasury Director, PBGC
iv
Table of Contents
I. INTRODUCTION AND SUMMARY 1
II. ABOUT MULTIEMPLOYER PLANS 10
Determining Plan Benefits 10
Industries in which Plans Operate 11 Plan Size and Employer Concentration 12
Active Employees Now a Minority 13
Orphan Participants 15
Withdrawn Employers and Withdrawal Liability 19
Underfunding Status and Concentration 22
III. FUNDING RULES 25
Overview 25
Basic Funding Rules 26 Additional Rules for Plans in Endangered or Critical Status 36
Administrative Issues Presented by PPA 50
Subsequent Funding Relief Legislation 53
Assessing the Effects of PPA on Plan Decision-Making 58
IV. REPORTING AND DISCLOSURE REQUIREMENTS 59
Annual Funding Notices 59
Notice of Endangered or Critical Status 60
Multiemployer Pension Plan Information Made Available Upon Request 62 Notice of Potential Withdrawal Liability 63
Summary Plan Information for Employer and Employee Representatives of Multiemployer Plans 64
Administrative Issues Presented by PPA 65
V. SMALL BUSINESS PARTICIPATION IN MULTIEMPLOYER PLANS 67
Why Small Businesses Use Multiemployer Plans 68
Construction Industry Plans 70
Effect of PPA Changes 72
Small Businesses and Incidence of Defined Benefit Multiemployer Pension Plans 72 Employer Costs for Retirement and Savings Plans 73

v
VI. FURTHER STEPS TO STRENGTHEN PLANS AND PROTECT PENSIONERS 75
LIMITATIONS OF THIS REPORT 77
ACKNOWLEDGEMENTS 78
vi
Tables
Table 1. Multiemployer Plan Zone Status Certifications (2009) ................................................. 6
Table 2. Numbers of Participants and Plans in Selected Industries (2010) ............................. 12 Table 3. Numbers of Plans, Participants and Employers (2010) .............................................. 13 Table 4. Contributions and Benefit Payments (2006 and 2010) ............................................... 14 Table 5. Active, Retired, and Separated Vested Participants (Percentages, 1980-2010) ....... 15 Table 6. Orphan Participants by Plan Status (2010) ................................................................. 17 Table 7. Plans with 5,000 or More Orphan Participants (2009) ............................................... 18 Table 8. Employer Withdrawals in 2008 and Withdrawal Liability Assessments ....................... 21 Table 9. Funding of Multiemployer Plans During Selected Years ($ in millions) ..................... 22 Table 10. Concentration of Underfunding by Plan and Industry (2010) .................................. 24 Table 11. Plans with Accumulated Funding Deficiencies (2010) .............................................. 29 Table 12. Amortization Extensions 2008 to 2010 ........................................................................ 31 Table 13. Use of Automatic Extensions / Approved Extensions (2010) .................................... 32 Table 14. Triggers for Critical and Endangered Zone Status .................................................... 37 Table 15. Multiemployer Plan Zone Status Certifications (2008-2011) ................................... 40 Table 16. Standards for Funding Improvement ......................................................................... 42 Table 17. Restrictions During Plan Adoption Period and After Adoption of a Funding
Improvement or Rehabilitation Plan .......................................................................... 44 Table 18. Reductions in Future Benefits/Adjustable Past Benefits (2010) ............................... 47 Table 19. Average Contributions by Plan Status (2010) ........................................................... 48 Table 20. WRERA Elections ......................................................................................................... 54 Table 21. Plans Using PRA 2010 Relief ....................................................................................... 56 Table 22. Status Notices to DOL and PBGC ................................................................................ 62
Introduction and Summary
More than 10 million Americans working in a wide range of industries depend on about 1,500 private-sector multiemployer defined benefit plans to secure their retirement income.1 Multiemployer plans provide portability for workers as they move to different employers or job sites within the same industry.
A multiemployer plan pools contributions, benefits, and risks for the contributing employers’ unionized workers and other beneficiaries, rather than requiring that they be borne by the individual employer or individual employee. Multiemployer plans are maintained under collective bargaining agreements between labor unions and two or more employers, and are typically governed by joint boards of trustees appointed by sponsoring unions and employers.
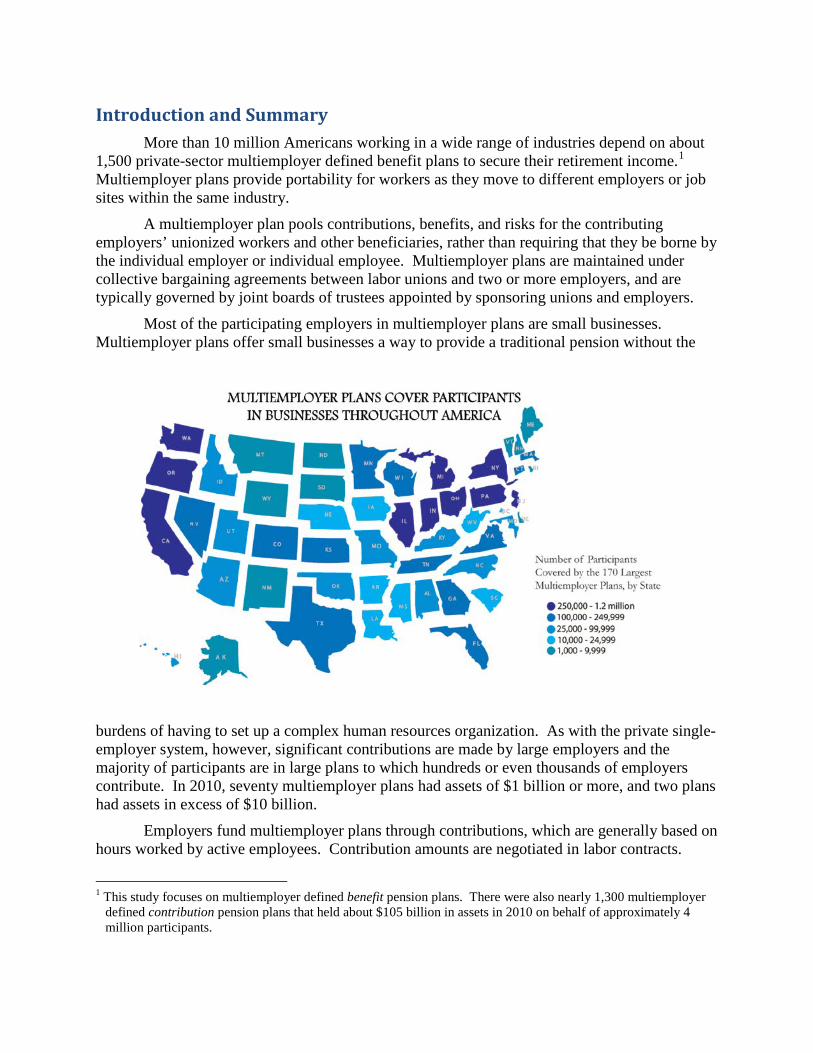
Most of the participating employers in multiemployer plans are small businesses. Multiemployer plans offer small businesses a way to provide a traditional pension without the
burdens of having to set up a complex human resources organization. As with the private single-employer system, however, significant contributions are made by large employers and the majority of participants are in large plans to which hundreds or even thousands of employers contribute. In 2010, seventy multiemployer plans had assets of $1 billion or more, and two plans had assets in excess of $10 billion.
Employers fund multiemployer plans through contributions, which are generally based on hours worked by active employees. Contribution amounts are negotiated in labor contracts.
1 This study focuses on multiemployer defined benefit pension plans. There were also nearly 1,300 multiemployer
defined contribution pension plans that held about $105 billion in assets in 2010 on behalf of approximately 4 million participants.

2
Typically, the trustees of each plan determine the level of benefits the plan will provide based on the level of contributions and the funding status of the particular plan. A plan can be amended to increase benefits both prospectively and retroactively for active employees, and for retired or separated vested employees, but generally cannot be amended to reduce benefits once they have been earned.
There are multiemployer plans and participants in every state. The map above estimates the approximate number of multiemployer plan participants, by state, for the 170 largest multiemployer plans in 2009, which collectively covered 7.9 million participants.2
Underfunding Following 2008 Market Crisis As of the first day of the plan year beginning in 2009, the value of vested benefits promised by all multiemployer plans was $673 billion; to cover those liabilities, multiemployer plans had only $327 billion in assets.3 This translates to an aggregate funding level of only 49 percent. Although asset values recovered to some extent during the 2009 and 2010 plan years, climbing from $327 billion at the beginning of the 2009 plan year to nearly $400 billion by the end of the 2010 plan year, aggregate underfunding remained significant.
This situation appears to be the result of several factors. Many plans had counted on unusually favorable investment earnings through the 1990s to finance expanded retirement benefits. Employers often were not called upon to increase their contribution rates to keep pace with benefit increases. In some cases, plans increased benefits to protect the tax deductibility of employer contributions already agreed to in multi-year collective bargaining agreements.
The 2000-2002 market downturn exposed weaknesses in the multiemployer plan funding rules, the effects of which were particularly noticeable for “mature” plans with a large proportion of retirees and significant unfunded liabilities. Benefit increases based on past service were subject to very slow funding under statutory rules that allowed amortization over 30 or 40 years and actuarial losses attributed to lower than expected asset returns were subject to a 15-year amortization. With asset losses and the materialization of significant underfunding in the early 2000s, plans were compelled to increase contributions.
Actives/Retirees and Other Demographic Factors The demographics of participant populations complicated the situation of many multiemployer plans. Many of these plans are seeing a declining percentage of active employees for whom contributions are being made: By 2010, only 39% of all participants in multiemployer plans were active employees, while 61% were retired or separated vested participants.
2 These 170 plans, each of which had more than 10,000 participants in 2009, cover three-quarters of all
multiemployer plan participants. The distribution of participants on this map is a rough approximation based on the state in which each plan is headquartered or administered. In addition, for some regional and national plans, a portion of the participants are assumed to be located in neighboring states or spread among all states, based on the Survey of Income and Program Participation, (SIPP), Wave 7, U.S. Census Bureau. Because participants’ addresses are not reported to the ERISA agencies, in the case of regional and national plans, the map relies on incomplete data to approximate the geographic distribution of participants among the states.
3 The source of these asset and liability figures is the Form 5500 series annual report filings. Assets are based on market value as of the beginning of the plan year. Vested liabilities, also reported as of the beginning of the plan year, are adjusted to a standardized interest factor (see Footnote 44), unless otherwise noted.
3
Available Remedies Because benefits generally cannot be reduced after they are earned,4 underfunding can be made up only with prospective actions affecting active workers: contributions can be increased and/or accruals of future benefits for active employees can be reduced so that future contributions exceed the cost of future benefit accruals. The difference between future contributions and the cost of future benefit accruals is effectively an additional charge imposed on employees’ earnings and/or employers’ profits. The larger the needed charge, the more difficult it is to attract new employers and employees into the plan (which in turn increases the per participant charge) and the more likely employers are to withdraw.
Employers and active employees agree to implement such an additional charge with great reluctance, especially if the bulk of the benefit goes to retirees. The employers and employees are even less likely to support such a charge if many of these retirees are “orphan participants” (i.e., they formerly worked for companies that no longer contribute to the plan).
The situation is made worse by withdrawing employers that often do not pay their full obligations. Although plans can and do assess withdrawal liability, the law limits the annual amounts that an employer must pay and caps the number of annual payments at 20 years; in cases of bankruptcy, the outstanding withdrawal liability is often unpaid. The more employers that withdraw without paying their share of underfunding, the larger the underfunding burden placed on employers and employees who remain.
For all these reasons, many plans’ benefit obligations continued to grow even as asset values plummeted,5 and the level of underfunding in multiemployer plans – which had remained well below $50 billion for the previous 30 years – jumped to just over $100 billion in 2002 and exceeded $200 billion for the first time in 2004. In 2003, the multiemployer insurance program at the Pension Benefit Guaranty Corporation (PBGC) went from a positive to a negative net position (i.e., its liabilities now exceeded its assets), due to an increasing number of plans that were classified as likely to require financial assistance in the future. By 2004, PBGC’s financial statements for its multiemployer insurance program included recognized liabilities of nearly $1.3 billion but total assets of only $1 billion.
Federal Actions to Date Congress acted repeatedly in the past decade to help multiemployer plans. The Pension Funding Equity Act of 2004 (PFEA) was enacted to address the increased funding requirements resulting from the 2000-2002 market downturn by providing for a deferral of the charges related to investment losses for certain multiemployer plans.
Many stakeholders in the multiemployer community worried that the short-term funding relief offered under PFEA would be inadequate. Some plans faced minimum funding requirements that far exceeded bargained-for contributions and employers faced excise taxes on funding deficiencies. Employer and union representatives, plan trustees, participants, and professional advisors developed proposals that they hoped would alleviate the strains 4 Under the Pension Protection Act of 2006 (PPA), plans in critical status must limit lump sums and may reduce
certain benefits earned to date for active and separated vested participants (but not retired participants whose benefit commencement date is before the plan provides notice of critical status).
5 Total assets in all multiemployer plans increased at an average rate of 11% per year during the last half of the 1990s – increasing from $210 billion in 1995 to $357 billion in 2000. By 2003, however, plan assets fell to approximately $309 billion, before recovering to $347 billion in 2004. Benefit liabilities, on the other hand, increased from $218 billion in 1995, to $340 billion in 2000, to $487 billion in 2003, and to $556 billion in 2004.
4
experienced by plans and strengthen plan funding in the long term. The Pension Protection Act of 2006 (PPA) enacted significant changes to the funding rules for multiemployer plans.
PPA aimed to impose greater financial discipline on multiemployer plans, while also providing funding relief for plans with moderate and severe funding problems. New requirements include annual plan status certifications based on standardized funding and liquidity measures for determining the financial health of plans. These standardized measures are used to identify multiemployer plans in acute financial distress, known as “critical” (“red”) status plans, those plans experiencing financial difficulty, known as “endangered” (“yellow”) or “seriously endangered” (“orange”) status plans, and those plans in “green,” non-distressed status.
The plan’s status in turn would facilitate trustee recognition of the plan’s funding problems and lead to the development of long-term economic plans to improve funding, including quantifiable benchmarks for measuring funding progress. PPA provides more tools for plans to bring assets and liabilities into balance, but generally leaves decisions on how to solve a plan’s funding problems to the plan’s trustees and collective bargaining parties. The PPA changes also bolstered disclosure rules to enable participants and beneficiaries to better understand the funding status of their plans, expand employer accessibility to withdrawal liability estimates and other information, and allow the bargaining parties and the Department of Labor (DOL), the Internal Revenue Service (IRS), and the PBGC to monitor the response of plans to the new funding requirements.
After the market decline in 2008, Congress enacted other pension relief legislation, the Worker, Retiree, and Employer Recovery Act of 2008, P.L. 110-458 (WRERA) and the Preservation of Access to Care for Medicare Beneficiaries and Pension Relief Act of 2010, P.L. 111-192 (PRA 2010). WRERA permitted multiemployer plans to elect a temporary forbearance from certain of the requirements of PPA. The vast majority of these plans certified to be in critical, seriously endangered, and endangered status in 2009 elected to defer actions otherwise required by their status certifications and/or to extend the time for demonstrating progress under their funding improvement or rehabilitation plans. As permitted under PRA 2010, more than 700 multiemployer plans chose to amortize investment losses incurred in the 2008 market crisis over a 29-year period (nearly twice as long as otherwise required under PPA) and/or to lessen the impact of investment losses on the actuarial value of plan assets used to determine their future funding requirements and funding status.6
Funding Status The condition of multiemployer plans varies widely. Some large and small plans have been able to ameliorate the steep contribution rate increases and benefit cuts that typically are required for plans in endangered and critical status. These tend to be plans that regularly adjusted accrual rates to reflect plan contributions and funding levels, limited past service benefit increases, restrained investment return assumptions, and mandated increases in
6 In the Deficit Reduction Act of 2005, P.L. 109-171 (DRA), Congress increased the annual premium plans pay for
PBGC insurance from $2.60 per participant to $8 per participant, effective for plan years beginning in 2006 (indexed to the National Average Wage Index). The Moving Ahead for Progress in the 21st Century Act, P.L. 112-141 (MAP-21) increased the premium to $12 per participant in 2013 (indexed thereafter). The current guarantee limit, which was last set by Congress in 2001 (Consolidated Appropriations Act, 2001, P.L. 106-554), provides a maximum guarantee for a participant with 30 years of service of $1,072.50 per month (not indexed).

5
contributions even during periods of elevated investment returns. These plans responded promptly to investment losses by capping their plans’ liabilities.
Other plans have not fared so well, showing precariously weak funding levels. Many of these plans (some already terminated by the mass withdrawal of all employers from the plan) are in declining industries that have high rates of employer bankruptcies, such as textiles, typographical and graphic arts, furniture, and fishing. Some plans are concentrated in a single industry that is facing challenges from other factors, such as: deregulation, non-union competition, or severe business cycles, which can cause large numbers of contributing employers (or a significant employer) to exit the plan, leaving the remaining employers responsible for the plan’s underfunding.
Pre-PPA funding rules enabled many multiemployer plans to delay addressing their funding problems. Many plans in distress today provided frequent benefit increases for past and future service: vested benefit liabilities collectively more than doubled during the 1990s, and then nearly doubled again between 1999 and 2009. Among some plans contribution holidays were common, sparked by low ceilings on deductible contributions and favorable returns from a bullish stock market; plans regularly relied on excess investment returns to support benefits. At the same time, rising health care costs under tandem multiemployer welfare benefit plans, which historically captured a larger share of the employer’s contributions, crowded out the longer-term need to cover pension costs. By the 2000s decade, plans were forced to confront the need for increased contributions. Local and regional plans had a particularly hard time avoiding market volatility and achieving efficiencies.
By 2009, the growth and magnitude of benefit liabilities and underfunding in multiemployer pension plans had reached staggering levels. Underfunding, which had hovered in the $200 billion range between 2004 and 2008, ballooned to $346 billion in 2009.7
When plans first certified their funding status to the IRS for the beginning of their 2008 plan year, 77% of all plans were in “green,” non-distressed, status. For the 2009 plan year, “green” status certifications plummeted to 32% of plans. The percentage of plans certifying that they were in critical status or seriously endangered status grew from 12% to 44% between 2008 and 2009.
The 2009 Form 5500 Annual Report, filed by employee benefit pension plans with DOL, IRS, and PBGC, revealed that multiemployer plans sustained investment losses that averaged 21.3% of their portfolios during the plan year beginning in 2008 – which for most plans includes the 2008 market crisis.8 For many of these plans, the losses totaled hundreds of millions of dollars; some plans lost billions of dollars. As a result of these investment losses, plans suffered precipitous drops in their funded percentages for 2009 and plan actuaries projected funding
7 Plan assets, which had swelled to $440 billion in 2008, plummeted to $327 billion in 2009. Liabilities grew to
$673 billion in 2009, nearly doubling from a decade earlier, in 1999. (While a decline in interest rates beginning in 2003 had the effect of inflating the value of liabilities generally, rates in 1999 and 2009 were comparable.)
8 The 2008 weighted average return on investment, based on market value of assets for all plans as reported on the 2009 Schedule MB, Form 5500, is -21.3% (an investment loss). Plans with valuation dates of January 1, 2009 (return measured on December 31, 2008) lost somewhat more (24.9%), while non-calendar year plans lost less (15.6%). These averages are weighted by plan assets. (The unweighted average return on investment as reported on the 2009 Schedule MB for all plans is -18.2%.)
6
deficiencies over the next few years. Minimum required contributions skyrocketed, and there were fears that hourly contribution rates would have to triple or quadruple in order to avoid a funding deficiency.
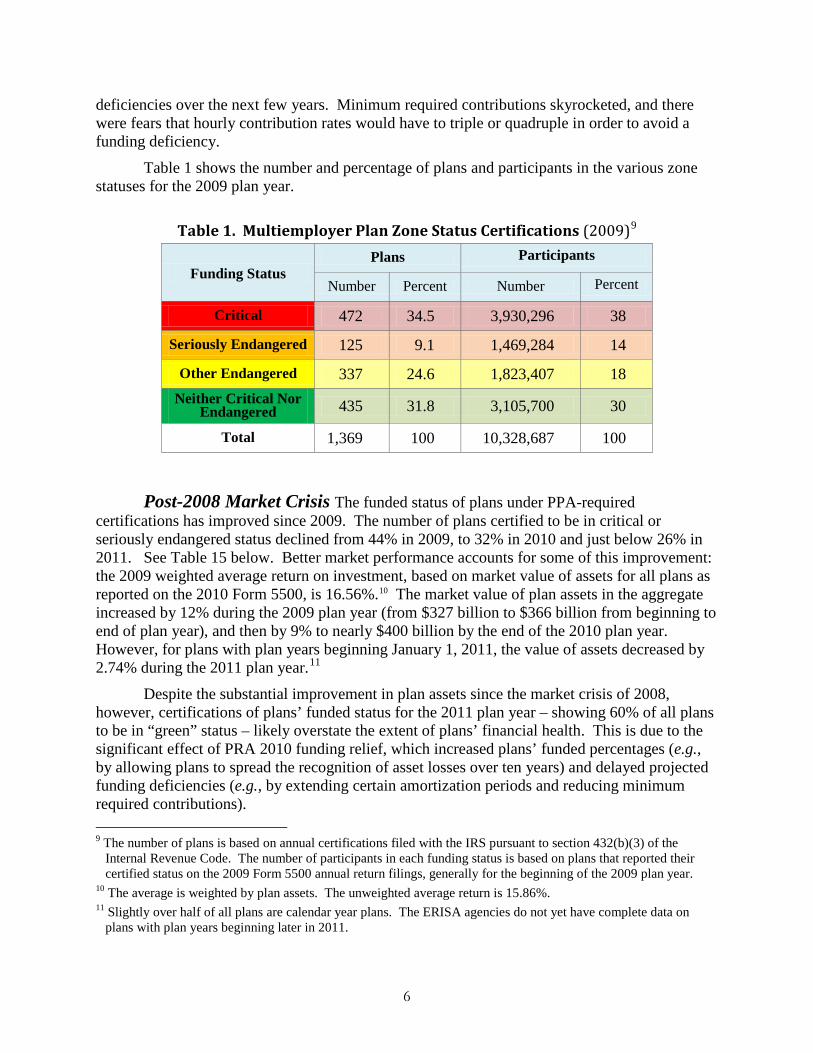
Table 1 shows the number and percentage of plans and participants in the various zone statuses for the 2009 plan year.
Table 1. Multiemployer Plan Zone Status Certifications (2009)9
Funding Status Plans Participants
Number Percent Number Percent
Critical 472 34.5 3,930,296 38
Seriously Endangered 125 9.1 1,469,284 14
Other Endangered 337 24.6 1,823,407 18 Neither Critical Nor
Endangered 435 31.8 3,105,700 30
Total 1,369 100 10,328,687 100
Post-2008 Market Crisis The funded status of plans under PPA-required
certifications has improved since 2009. The number of plans certified to be in critical or seriously endangered status declined from 44% in 2009, to 32% in 2010 and just below 26% in 2011. See Table 15 below. Better market performance accounts for some of this improvement: the 2009 weighted average return on investment, based on market value of assets for all plans as reported on the 2010 Form 5500, is 16.56%.10 The market value of plan assets in the aggregate increased by 12% during the 2009 plan year (from $327 billion to $366 billion from beginning to end of plan year), and then by 9% to nearly $400 billion by the end of the 2010 plan year. However, for plans with plan years beginning January 1, 2011, the value of assets decreased by 2.74% during the 2011 plan year.11
Despite the substantial improvement in plan assets since the market crisis of 2008, however, certifications of plans’ funded status for the 2011 plan year – showing 60% of all plans to be in “green” status – likely overstate the extent of plans’ financial health. This is due to the significant effect of PRA 2010 funding relief, which increased plans’ funded percentages (e.g., by allowing plans to spread the recognition of asset losses over ten years) and delayed projected funding deficiencies (e.g., by extending certain amortization periods and reducing minimum required contributions). 9 The number of plans is based on annual certifications filed with the IRS pursuant to section 432(b)(3) of the
Internal Revenue Code. The number of participants in each funding status is based on plans that reported their certified status on the 2009 Form 5500 annual return filings, generally for the beginning of the 2009 plan year.
10 The average is weighted by plan assets. The unweighted average return is 15.86%. 11 Slightly over half of all plans are calendar year plans. The ERISA agencies do not yet have complete data on
plans with plan years beginning later in 2011.
7
In fact, as of the beginning of the 2010 plan year, the average funding level for all plans remained relatively depressed. Liabilities measured $757 billion and underfunding stood at $391 billion. Both historically and in real terms the extent of underfunding in multiemployer plans now is unprecedented.12 Data available through November 2012 indicate that 52% of participants are in moderately or severely distressed plans (plans in endangered, seriously endangered, or critical status under PPA);13 this percentage has declined from over 70% two years ago, due in part to improvements in some plans but also due to the effects of funding relief calculations which made it easier for plans to avoid endangered, seriously endangered or critical status. Although many plans are slowly recovering, the long-term financial condition of multiemployer plans does not appear to have improved as substantially as the change in plans’ certified statuses might suggest.
Encouraging Signs for Most Plans Plans began in 2009 to take advantage of several PPA provisions that have the potential to substantively improve plans’ funded status in the aggregate over time. As a result of entering endangered or critical status, many plans were required to adopt funding improvement or rehabilitation plans that will put them on a disciplined path toward better funding. In 2009, nearly 200 plans reported that they reduced future benefits (e.g., future accrual rates), and 115 critical status plans reported that they reduced adjustable past benefits. In 2010, future benefit reductions were made by 172 plans and adjustable benefit reductions were made by 149 plans, or nearly 40% of critical status plans in 2010. At the same time, plans frequently require substantial increases in contributions through funding improvement and rehabilitation plans, especially where only minor reductions in benefits are made.
Plans also benefitted from other PPA provisions: in 2010, 178 plans operated under a 5-year automatic amortization extension to reduce minimum required contributions, and 90 plans reported accumulated funding deficiencies14 totaling $1.9 billion but were generally exempt from the otherwise applicable excise tax. In addition, PPA provisions restrict plans in distressed statuses from undertaking certain actions, which would decrease the plan’s funded status, such as amendments increasing benefits or paying lump sum benefits.
Because funding improvement and rehabilitation plans will take time to be implemented – contribution and benefit schedules are generally adopted through collective bargaining – many more plans are expected in the near future to take advantage of PPA tools and provisions that will strengthen plans financially. PBGC projections suggest that PPA provisions will help improve some plans’ funded percentages over time, relative to pre-PPA law. However, it is not possible to estimate with confidence either how many plans will take advantage of the provisions or the effect of their actions on their financial condition.
12The increase in underfunding for the 2010 plan year is largely attributable to a decrease in the standardized interest
factor from 5.38% in 2009 to 4.52% in 2010. Using the 2009 factor, liabilities would have measured $699 billion in 2010, resulting in aggregate underfunding closer to the 2009 level.
13 The figure does not reflect the most recent zone status certifications provided to IRS. Rather, status certifications (and the number of participants) are drawn from each plan’s most recent Form 5500 filing, supplemented by more recent endangered or critical status notices or annual funding notices, if any.
14 This was more than four times the annual average of plans showing a minimum funding deficiency prior to the effective date of PPA.

8
Nevertheless, some severely distressed plans may not be able to recover using PPA tools and authorities. In some cases, these plans have reported that they are not making the scheduled progress required by law in meeting the requirements of their rehabilitation plans. A number of plans indicate that they have exhausted all “reasonable measures” for contribution increases and reductions in adjustable benefits and do not reasonably expect to emerge from critical status within a 10-year period or at a later time, and are taking measures to forestall possible insolvency.
About This Report PPA amended the Employee Retirement Income Security Act of 1974 (ERISA) and the Internal Revenue Code (the Code) to substantially revise the funding rules and disclosure requirements applicable to multiemployer plans and to make other related changes.
Some of these provisions will sunset after 2014. To assist Congress in determining what actions should be taken, section 221(a) of PPA directs the Secretary of Labor, the Secretary of the Treasury, and the Director of the Pension Benefit Guaranty Corporation to conduct a study of the effect of the funding amendments and related changes on the operation and funding status of multiemployer plans and to report to the Congress the results of such study, including any recommendations for legislation. The study must include an evaluation of the funding difficulties faced by small businesses participating in multiemployer plans and the impact of PPA changes on small employers.
This document provides the information required under section 221(a) of PPA.15 It offers information on multiemployer plans that may be useful as Congress considers the effect of the multiemployer funding provisions under PPA and contemplates possible future action. The Chapters in this report focus on data reported by plans in their 2009 and 2010 Form 5500 series annual report filings, as supplemented by limited information from other recent notices to the federal government.
This report contains no recommendations. The many changes that have occurred since 2006, including major changes in economic conditions, financial markets, regulations, and funding requirements, make it difficult to assess with any specificity either the use by plans of the tools and authorities provided in PPA or the need for further changes. This is exacerbated by the fact that, until October 2012, the most recent plan year for which the Government had complete information was the 2009 plan year, with only limited information on plan actions since then. Nonetheless, the information provided can inform and assist a dialogue about multiemployer funding issues.
The following is a brief description of the Chapters in this report.
Chapter II, About Multiemployer Plans, describes the structure of multiemployer plans and the benefits they provide, the current demographic characteristics of plans, including numbers of orphan participants (whose employers no longer contribute to the plan) and
15 Every five years, PBGC is required to analyze and report on the adequacy of its multiemployer premiums (ERISA
section 4022(A)). That report is being submitted separately. That report recommends PBGC premiums be evaluated in the context of and during the broader multiemployer legislative review prior to the 2014 sunset of some of the PPA provisions.
9
withdrawn employers derived from new reporting requirements under PPA, and the underfunding levels of multiemployer plans over time and in various industries.
Chapter III, Funding Rules, contains a description of the funding rules for multiemployer plans (including the special rules enacted under PPA) and comprehensive tabular data and analysis that describe the effects of the funding rule changes under that law. The data show the significant deterioration in plan funding health since the market downturn in the fall of 2008. For example, they show the depletion of credit balances under plans’ funding standard accounts, the downgrading of many plans to endangered or critical status in 2009, the widespread use of benefit reductions under funding improvement and rehabilitation plans, the adoption of other self-help measures available under PPA – such as automatic amortization extensions – to adjust minimum required contributions, and the effects of the elimination of excise taxes for the many plans that suffered funding deficiencies after 2008. The data also demonstrate the heavy reliance of plans on funding relief provided under WRERA and PRA 2010.
Chapter IV, Reporting and Disclosure Requirements, describes additional reporting and disclosure requirements to which multiemployer plans are subject under PPA. These generally concern the provision of financial information and actuarial data to contributing employers, participating unions, plan participants, and ERISA agencies.
Chapter V, Small Business Participation in Multiemployer Plans, describes the benefits to small employers of participation in multiemployer plans, offers the results from surveys of trade representatives and industry representatives on small employer participation in construction industry multiemployer plans, and provides background data on the incidence of various types of retirement and savings plans among private industry employers of different sizes and the employer costs for plans of different-size employers.
Chapter VI, Further Steps to Strengthen Plans and Protect Pensioners, describes the importance of multiemployer plans as a source of retirement security for millions of workers, and the danger to some distressed plans, contributing employers, and participants and beneficiaries unless steps are taken to provide additional tools for trustees to stabilize the financial conditions of their plans. It urges a serious collaborative effort by all of the stakeholders, the Administration and Congress to discuss the current and potential future problems faced by multiemployer plans and to work toward consensus around the best ways to solve them.
* * *
As we noted above, this report makes no recommendations. There is now a wide range of circumstances under which multiemployer plans operate. Some will handle the challenges of the past years with the tools they already have. Others will require additional tools, but there is no consensus as to what those are. We hope this report contributes to a necessary dialogue over the next few years with all parties and to the development of a consensus like those of the past that enables the Congress to legislate with confidence and enhance the retirement security of the many workers who depend on these plans, while minimizing the burden on businesses that employ them.
10
About Multiemployer Plans
Determining Plan Benefits Under a multiemployer plan, the plan’s trustees are generally empowered to establish
benefit levels, types of benefits, and eligibility rules for benefits. Design flexibility in defined benefit plans has allowed plans to offer a broad array of benefits. All plans provide life annuities at normal retirement age for participants with at least 5 years of service, and many plans offer retirement-type subsidies that reward long years of service (e.g., unreduced benefits at age 55 after 30 years of service) and early retirement benefits that are reduced for early commencement. Surviving spouse annuities are required by law, unless the spouse consents to a form of payment that does not include a spousal survivor annuity or otherwise waives the survivor annuity. Common formulas for determining benefits include a benefit based on a monthly dollar unit per year of service (e.g., a monthly benefit of $30 per each year of service) or a percentage of the employer’s contributions (e.g., the accrual for a year is 1.5% of the contributions made on the participant’s behalf for that year). In 2010, the average monthly benefit received by retirees in all multiemployer plans was $922.16
Plans may offer disability benefits at an earlier age or at a higher level than retirement benefits available under the plan, as well as incidental death benefits to cover, for example, funeral expenses. Social Security supplements may be payable prior to a participant’s eligibility for Social Security, and plans may provide automatic or ad hoc post-retirement cost-of-living adjustments. In addition, benefits are payable in a variety of forms, usually with an actuarial adjustment in the participant’s benefit. These forms include life annuities with 60- or 120-month guarantees, a variety of joint and survivor benefits with a spouse or other beneficiary, “pop-up” benefits after a spouse’s death, full or partial lump-sum options, and an option that provides a level income to a participant before and after Social Security retirement age (taking into account Social Security payments).
The contributions that are needed to support these benefits are determined by the plan’s actuary and are made by contributing employers. The employer’s contribution rate (e.g., dollars per hour, day, or week of covered work or unit of production) is typically specified in a collective bargaining agreement, usually negotiated by the bargaining parties from a schedule of varying contribution rates and corresponding benefit levels offered by the plan’s trustees (smaller plans often have a single contribution rate and benefit schedule). The contribution rate is commonly part of a total compensation package that includes the worker’s wage, and a contribution to the pension plan, the health and welfare plan, and possibly other benefit plans on behalf of the worker.
In a multiemployer plan, all contributions and assets are available to pay the benefits of all participants (workers and former workers) and beneficiaries (spouses and dependents of participants) under the plan. Assets are pooled for investment purposes, and all administrative 16 This is determined by dividing benefits paid under all plans by the number of retired participants under all plans.
The average is somewhat inflated because benefits paid during the year include lump sum payments (mostly de minimis lump sums of $5,000 or less). The average monthly benefit received in 2010 is higher in transportation industry plans ($1,324), where an annual benefit can reach $30,000 or more for a participant with 30 years of service, and in construction industry plans ($1,279); it is lower in retail trade and service industry plans ($620).

11
costs are paid from plan assets. If an employer withdraws from a multiemployer plan, the participants attributable to that employer continue to participate in the plan as retired or terminated vested participants, or as active participants of another contributing employer.
To protect contributing employers from shouldering the liabilities of employers that withdraw from the plan, the Multiemployer Pension Plan Amendments Act of 1980 (MPPAA) required plans (under certain circumstances) to assess withdrawal liability on employers that cease to have an obligation to contribute to the plan. Withdrawal liability, which represents an employer’s allocable share of the plan’s unfunded vested benefits, is payable as a lump sum or over a period of up to 20 years in an amount comparable to the employer’s contribution level under the plan. If some of the withdrawal liability is determined to be uncollectible for reasons arising, for example, out of an employer’s bankruptcy, the burden of that unfunded liability falls upon the employers remaining in the plan.17
Industries in which Plans Operate Traditionally, employers in a multiemployer plan were mainly in a common industry with
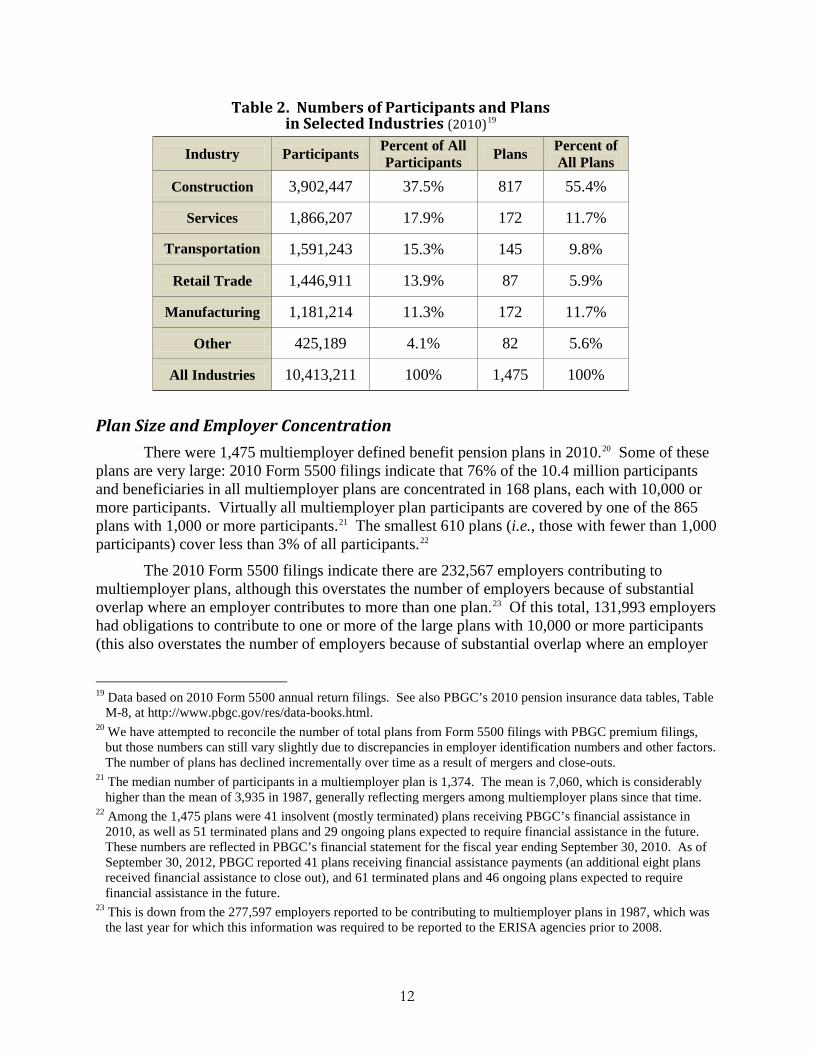
a high degree of union representation. Among industries with multiemployer plans, the construction and transportation industries have the highest rates of employees represented by unions.18 Construction industry plans – including workers in building and heavy construction, plumbing and pipefitting, heating, air conditioning, and electrical work – account for 55% of all plans and 37.5% of all participants. Plans in the construction industry generally rely on a large number of small contributing employers. About 15% of all multiemployer plan participants are in transportation industry plans, and 11% are in manufacturing (e.g., aerospace construction). See Table 2 below. In addition to many small contributing employers, these industries also include bigger employers whose financial health can significantly influence the plan. Other industries in which multiemployer plans operate include retail food, health care, information and entertainment, public utilities, hotel and restaurant, mining, manufacturing, and retail trade. Many plans have become diversified over time, bringing in employers from other industries or merging with plans that were originally established in different industries.
17 Withdrawn employers and withdrawal liability are discussed below. 18 In 2011, unions represented 21.4% of employees in the transportation and warehousing industry, and 14.9% of
employees in the construction industry. Union Members — 2011, Bureau of Labor Statistics, Table 3. Union affiliation of employed wage and salary workers by occupation and industry.
12
Table 2. Numbers of Participants and Plans in Selected Industries (2010)19
Industry Participants Percent of All Participants Plans Percent of
All Plans Construction 3,902,447 37.5% 817 55.4%
Services 1,866,207 17.9% 172 11.7%
Transportation 1,591,243 15.3% 145 9.8%
Retail Trade 1,446,911 13.9% 87 5.9%
Manufacturing 1,181,214 11.3% 172 11.7%
Other 425,189 4.1% 82 5.6%
All Industries 10,413,211 100% 1,475 100%
Plan Size and Employer Concentration There were 1,475 multiemployer defined benefit pension plans in 2010.20 Some of these
plans are very large: 2010 Form 5500 filings indicate that 76% of the 10.4 million participants and beneficiaries in all multiemployer plans are concentrated in 168 plans, each with 10,000 or more participants. Virtually all multiemployer plan participants are covered by one of the 865 plans with 1,000 or more participants.21 The smallest 610 plans (i.e., those with fewer than 1,000 participants) cover less than 3% of all participants.22
The 2010 Form 5500 filings indicate there are 232,567 employers contributing to multiemployer plans, although this overstates the number of employers because of substantial overlap where an employer contributes to more than one plan.23 Of this total, 131,993 employers had obligations to contribute to one or more of the large plans with 10,000 or more participants (this also overstates the number of employers because of substantial overlap where an employer
19 Data based on 2010 Form 5500 annual return filings. See also PBGC’s 2010 pension insurance data tables, Table
M-8, at http://www.pbgc.gov/res/data-books.html. 20 We have attempted to reconcile the number of total plans from Form 5500 filings with PBGC premium filings,
but those numbers can still vary slightly due to discrepancies in employer identification numbers and other factors. The number of plans has declined incrementally over time as a result of mergers and close-outs.
21 The median number of participants in a multiemployer plan is 1,374. The mean is 7,060, which is considerably higher than the mean of 3,935 in 1987, generally reflecting mergers among multiemployer plans since that time.
22 Among the 1,475 plans were 41 insolvent (mostly terminated) plans receiving PBGC’s financial assistance in 2010, as well as 51 terminated plans and 29 ongoing plans expected to require financial assistance in the future. These numbers are reflected in PBGC’s financial statement for the fiscal year ending September 30, 2010. As of September 30, 2012, PBGC reported 41 plans receiving financial assistance payments (an additional eight plans received financial assistance to close out), and 61 terminated plans and 46 ongoing plans expected to require financial assistance in the future.
23 This is down from the 277,597 employers reported to be contributing to multiemployer plans in 1987, which was the last year for which this information was required to be reported to the ERISA agencies prior to 2008.
13
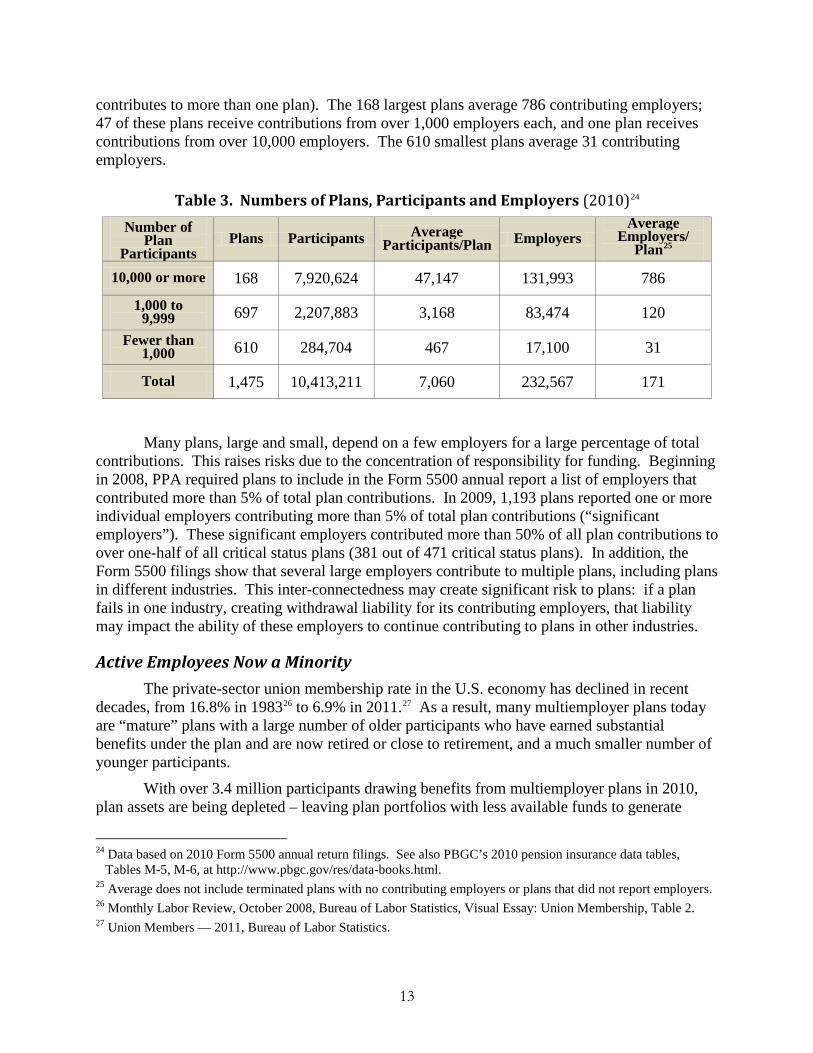
contributes to more than one plan). The 168 largest plans average 786 contributing employers; 47 of these plans receive contributions from over 1,000 employers each, and one plan receives contributions from over 10,000 employers. The 610 smallest plans average 31 contributing employers.
Table 3. Numbers of Plans, Participants and Employers (2010)24 Number of
Plan Participants
Plans Participants Average Participants/Plan Employers
Average Employers/
Plan25
10,000 or more 168 7,920,624 47,147 131,993 786
1,000 to 9,999 697 2,207,883 3,168 83,474 120
Fewer than 1,000 610 284,704 467 17,100 31
Total 1,475 10,413,211 7,060 232,567 171
Many plans, large and small, depend on a few employers for a large percentage of total contributions. This raises risks due to the concentration of responsibility for funding. Beginning in 2008, PPA required plans to include in the Form 5500 annual report a list of employers that contributed more than 5% of total plan contributions. In 2009, 1,193 plans reported one or more individual employers contributing more than 5% of total plan contributions (“significant employers”). These significant employers contributed more than 50% of all plan contributions to over one-half of all critical status plans (381 out of 471 critical status plans). In addition, the Form 5500 filings show that several large employers contribute to multiple plans, including plans in different industries. This inter-connectedness may create significant risk to plans: if a plan fails in one industry, creating withdrawal liability for its contributing employers, that liability may impact the ability of these employers to continue contributing to plans in other industries.
Active Employees Now a Minority The private-sector union membership rate in the U.S. economy has declined in recent
decades, from 16.8% in 198326 to 6.9% in 2011.27 As a result, many multiemployer plans today are “mature” plans with a large number of older participants who have earned substantial benefits under the plan and are now retired or close to retirement, and a much smaller number of younger participants.
With over 3.4 million participants drawing benefits from multiemployer plans in 2010, plan assets are being depleted – leaving plan portfolios with less available funds to generate
24 Data based on 2010 Form 5500 annual return filings. See also PBGC’s 2010 pension insurance data tables,
Tables M-5, M-6, at http://www.pbgc.gov/res/data-books.html. 25 Average does not include terminated plans with no contributing employers or plans that did not report employers. 26 Monthly Labor Review, October 2008, Bureau of Labor Statistics, Visual Essay: Union Membership, Table 2. 27 Union Members — 2011, Bureau of Labor Statistics.
14
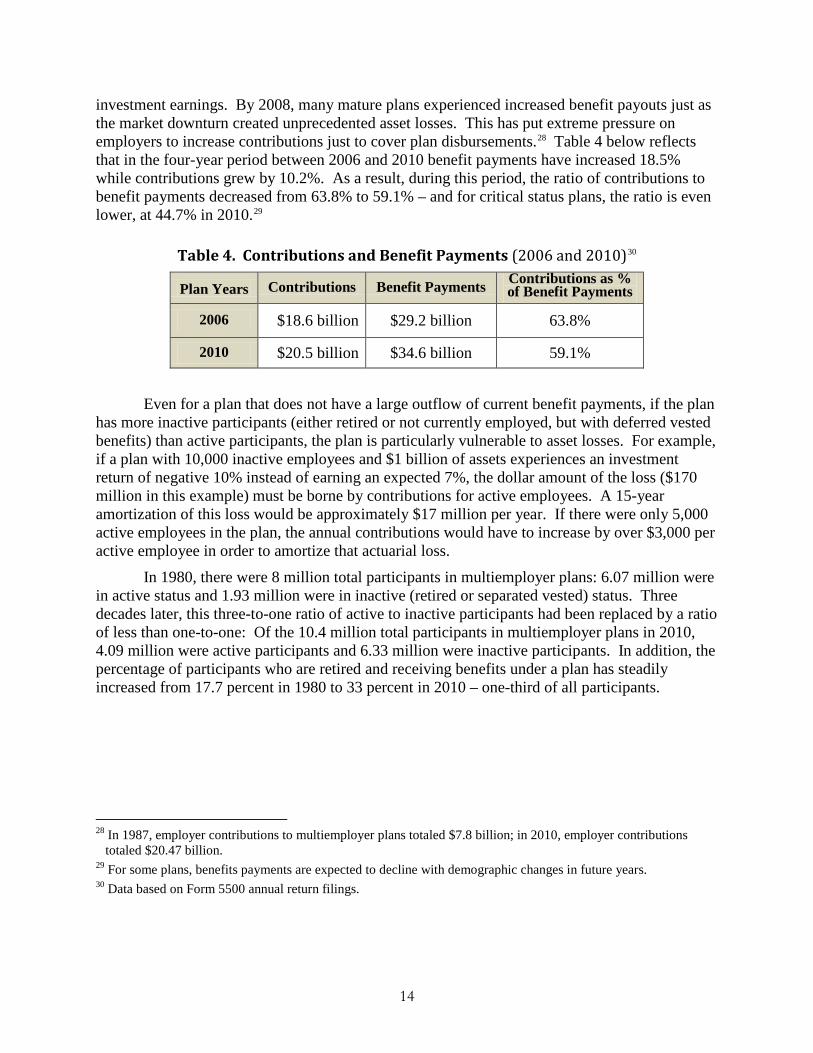
investment earnings. By 2008, many mature plans experienced increased benefit payouts just as the market downturn created unprecedented asset losses. This has put extreme pressure on employers to increase contributions just to cover plan disbursements.28 Table 4 below reflects that in the four-year period between 2006 and 2010 benefit payments have increased 18.5% while contributions grew by 10.2%. As a result, during this period, the ratio of contributions to benefit payments decreased from 63.8% to 59.1% – and for critical status plans, the ratio is even lower, at 44.7% in 2010.29
Table 4. Contributions and Benefit Payments (2006 and 2010)30
Plan Years Contributions Benefit Payments Contributions as % of Benefit Payments
2006 $18.6 billion $29.2 billion 63.8%
2010 $20.5 billion $34.6 billion 59.1%
Even for a plan that does not have a large outflow of current benefit payments, if the plan
has more inactive participants (either retired or not currently employed, but with deferred vested benefits) than active participants, the plan is particularly vulnerable to asset losses. For example, if a plan with 10,000 inactive employees and $1 billion of assets experiences an investment return of negative 10% instead of earning an expected 7%, the dollar amount of the loss ($170 million in this example) must be borne by contributions for active employees. A 15-year amortization of this loss would be approximately $17 million per year. If there were only 5,000 active employees in the plan, the annual contributions would have to increase by over $3,000 per active employee in order to amortize that actuarial loss.
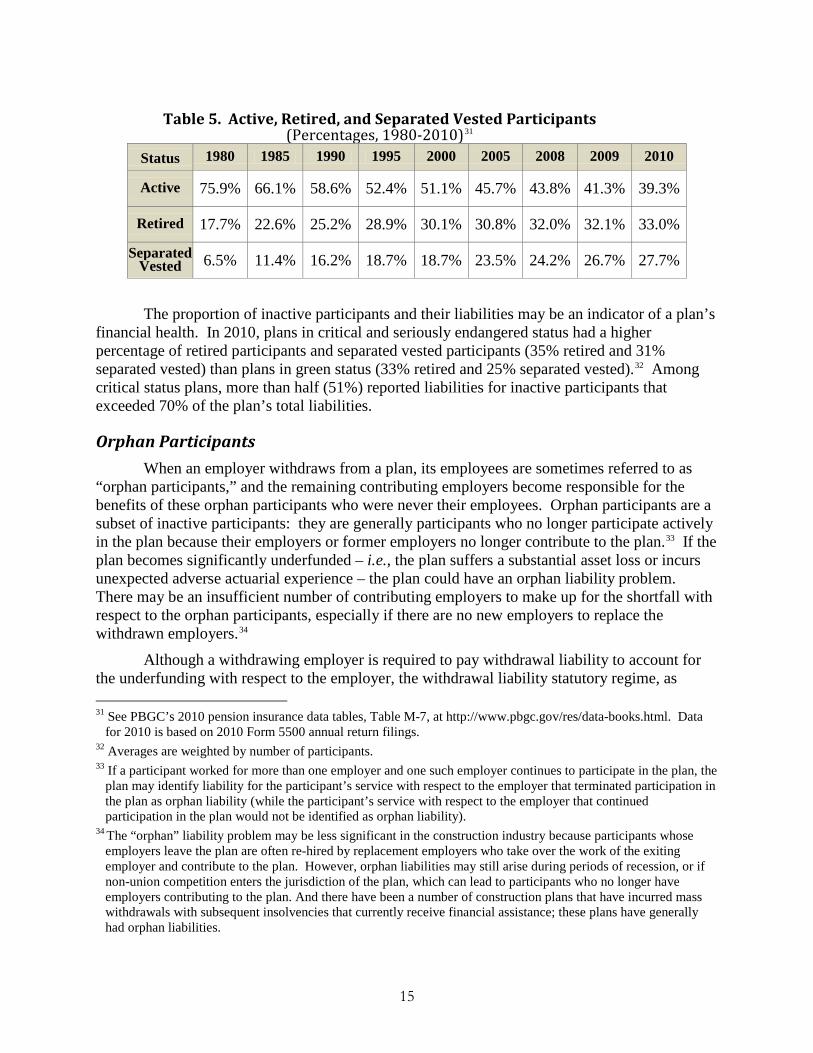
In 1980, there were 8 million total participants in multiemployer plans: 6.07 million were in active status and 1.93 million were in inactive (retired or separated vested) status. Three decades later, this three-to-one ratio of active to inactive participants had been replaced by a ratio of less than one-to-one: Of the 10.4 million total participants in multiemployer plans in 2010, 4.09 million were active participants and 6.33 million were inactive participants. In addition, the percentage of participants who are retired and receiving benefits under a plan has steadily increased from 17.7 percent in 1980 to 33 percent in 2010 – one-third of all participants.
28 In 1987, employer contributions to multiemployer plans totaled $7.8 billion; in 2010, employer contributions
totaled $20.47 billion. 29 For some plans, benefits payments are expected to decline with demographic changes in future years. 30 Data based on Form 5500 annual return filings.
15
Table 5. Active, Retired, and Separated Vested Participants (Percentages, 1980-2010)31
Status 1980 1985 1990 1995 2000 2005 2008 2009 2010
Active 75.9% 66.1% 58.6% 52.4% 51.1% 45.7% 43.8% 41.3% 39.3%
Retired 17.7% 22.6% 25.2% 28.9% 30.1% 30.8% 32.0% 32.1% 33.0%
Separated Vested 6.5% 11.4% 16.2% 18.7% 18.7% 23.5% 24.2% 26.7% 27.7%
The proportion of inactive participants and their liabilities may be an indicator of a plan’s financial health. In 2010, plans in critical and seriously endangered status had a higher percentage of retired participants and separated vested participants (35% retired and 31% separated vested) than plans in green status (33% retired and 25% separated vested).32 Among critical status plans, more than half (51%) reported liabilities for inactive participants that exceeded 70% of the plan’s total liabilities.
Orphan Participants When an employer withdraws from a plan, its employees are sometimes referred to as
“orphan participants,” and the remaining contributing employers become responsible for the benefits of these orphan participants who were never their employees. Orphan participants are a subset of inactive participants: they are generally participants who no longer participate actively in the plan because their employers or former employers no longer contribute to the plan.33 If the plan becomes significantly underfunded – i.e., the plan suffers a substantial asset loss or incurs unexpected adverse actuarial experience – the plan could have an orphan liability problem. There may be an insufficient number of contributing employers to make up for the shortfall with respect to the orphan participants, especially if there are no new employers to replace the withdrawn employers.34
Although a withdrawing employer is required to pay withdrawal liability to account for the underfunding with respect to the employer, the withdrawal liability statutory regime, as 31 See PBGC’s 2010 pension insurance data tables, Table M-7, at http://www.pbgc.gov/res/data-books.html. Data
for 2010 is based on 2010 Form 5500 annual return filings. 32 Averages are weighted by number of participants. 33 If a participant worked for more than one employer and one such employer continues to participate in the plan, the
plan may identify liability for the participant’s service with respect to the employer that terminated participation in the plan as orphan liability (while the participant’s service with respect to the employer that continued participation in the plan would not be identified as orphan liability).
34 The “orphan” liability problem may be less significant in the construction industry because participants whose employers leave the plan are often re-hired by replacement employers who take over the work of the exiting employer and contribute to the plan. However, orphan liabilities may still arise during periods of recession, or if non-union competition enters the jurisdiction of the plan, which can lead to participants who no longer have employers contributing to the plan. And there have been a number of construction plans that have incurred mass withdrawals with subsequent insolvencies that currently receive financial assistance; these plans have generally had orphan liabilities.
16
discussed below, has significant limitations. For instance, for many years until the 2000s decade, withdrawing employers in a large number of plans did not have withdrawal liability because the plans had no unfunded vested benefits (as determined under the plan’s assumptions) as of the end of the plan year preceding the one in which the employer withdrew. In cases where plans did assess withdrawal liability, collections could be minimal if the plan operated in an industry suffering from high employer bankruptcy rates. Whether or not an orphan-heavy plan collected withdrawal liability, however, the plan could be well-funded in one year and subsequently become underfunded due to later events; such plans would also have an orphan liability problem not caused by non-payment of withdrawal liability.
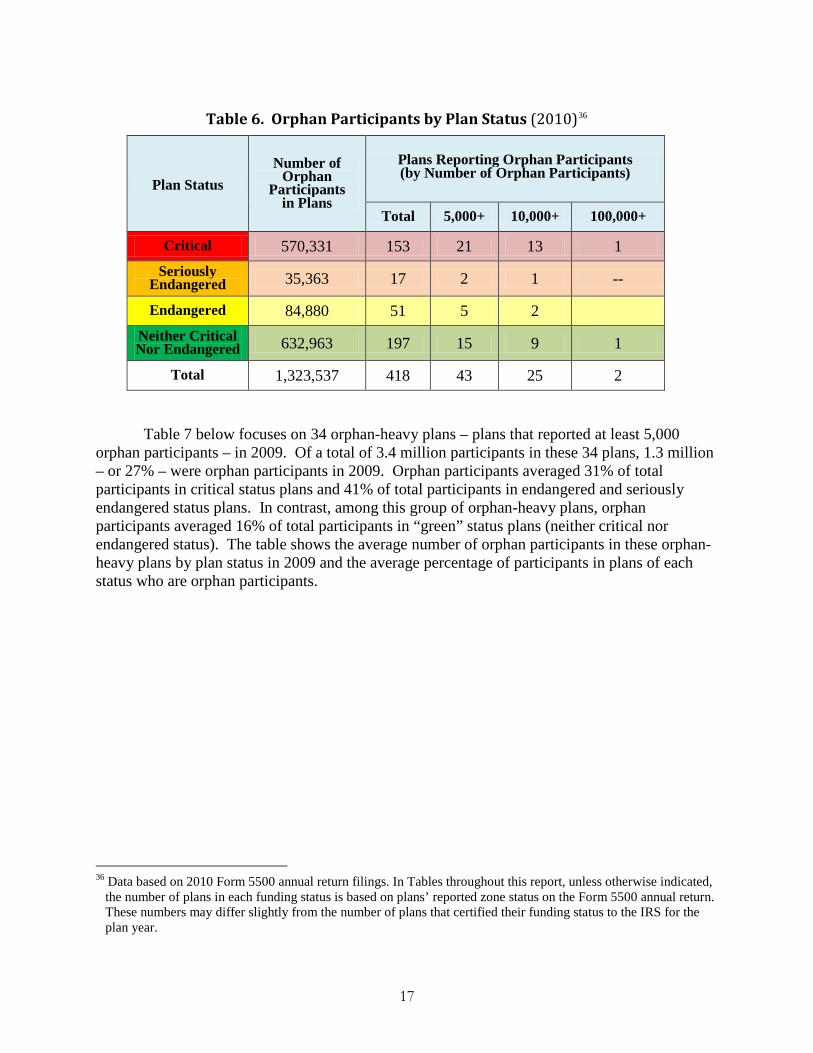
Historically, reporting information did not differentiate between orphan participants and inactive participants, generally, making it difficult to identify plans with significant numbers of orphan participants. PPA requires multiemployer plans to include in the annual report filed with the ERISA agencies information regarding orphan participants. On the 2010 Form 5500, Schedule R, more than 400 plans reported having over 1.3 million orphan participants out of 6.7 million total participants.35 About 43% of these orphan participants were in 153 critical status plans. Twenty-five plans reported over 10,000 orphan participants each, one “green” status plan reported just over 100,000 orphan participants (plan was in endangered status for 2009), and one critical status plan had nearly 200,000 orphan participants. Table 6 below describes the size of the orphan participant population in plans by plan status for the 2010 plan year.
35 To reduce recordkeeping burdens, PBGC guidance permits plans to report as orphan participants only those
participants whose most recent contributing employer had withdrawn from the plan, even if an employer with whom the participant earned earlier service credit continues to participate in the plan. (Alternatively, under the reporting rules, a plan may report as orphan participants those who have no former employers with a continuing obligation to contribute to the plan.) In addition, for the 2009 plan year, plans were permitted to give a reasonable approximation of the number of orphan participants either by conducting a random sampling of participants or by reporting the number of employers that withdrew since 1998 and the number of their participants.
17
Table 6. Orphan Participants by Plan Status (2010)36
Plan Status Number of
Orphan Participants
in Plans
Plans Reporting Orphan Participants (by Number of Orphan Participants)
Total 5,000+ 10,000+ 100,000+
Critical 570,331 153 21 13 1 Seriously
Endangered 35,363 17 2 1 --
Endangered 84,880 51 5 2 Neither Critical Nor Endangered 632,963 197 15 9 1
Total 1,323,537 418 43 25 2
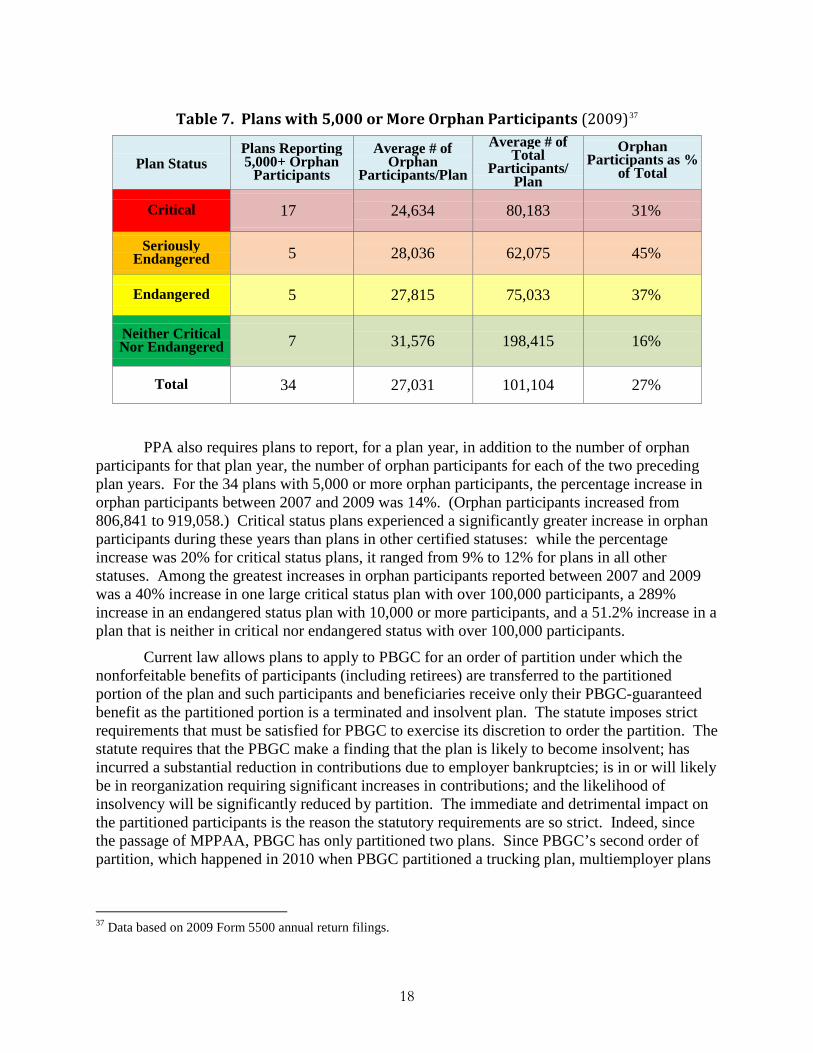
Table 7 below focuses on 34 orphan-heavy plans – plans that reported at least 5,000 orphan participants – in 2009. Of a total of 3.4 million participants in these 34 plans, 1.3 million – or 27% – were orphan participants in 2009. Orphan participants averaged 31% of total participants in critical status plans and 41% of total participants in endangered and seriously endangered status plans. In contrast, among this group of orphan-heavy plans, orphan participants averaged 16% of total participants in “green” status plans (neither critical nor endangered status). The table shows the average number of orphan participants in these orphan-heavy plans by plan status in 2009 and the average percentage of participants in plans of each status who are orphan participants.
36 Data based on 2010 Form 5500 annual return filings. In Tables throughout this report, unless otherwise indicated,
the number of plans in each funding status is based on plans’ reported zone status on the Form 5500 annual return. These numbers may differ slightly from the number of plans that certified their funding status to the IRS for the plan year.
18
Table 7. Plans with 5,000 or More Orphan Participants (2009)37
Plan Status Plans Reporting 5,000+ Orphan
Participants
Average # of Orphan
Participants/Plan
Average # of Total
Participants/ Plan
Orphan Participants as %
of Total
Critical 17 24,634 80,183 31%
Seriously Endangered 5 28,036 62,075 45%
Endangered 5 27,815 75,033 37%
Neither Critical Nor Endangered 7 31,576 198,415 16%
Total 34 27,031 101,104 27%
PPA also requires plans to report, for a plan year, in addition to the number of orphan participants for that plan year, the number of orphan participants for each of the two preceding plan years. For the 34 plans with 5,000 or more orphan participants, the percentage increase in orphan participants between 2007 and 2009 was 14%. (Orphan participants increased from 806,841 to 919,058.) Critical status plans experienced a significantly greater increase in orphan participants during these years than plans in other certified statuses: while the percentage increase was 20% for critical status plans, it ranged from 9% to 12% for plans in all other statuses. Among the greatest increases in orphan participants reported between 2007 and 2009 was a 40% increase in one large critical status plan with over 100,000 participants, a 289% increase in an endangered status plan with 10,000 or more participants, and a 51.2% increase in a plan that is neither in critical nor endangered status with over 100,000 participants.
Current law allows plans to apply to PBGC for an order of partition under which the nonforfeitable benefits of participants (including retirees) are transferred to the partitioned portion of the plan and such participants and beneficiaries receive only their PBGC-guaranteed benefit as the partitioned portion is a terminated and insolvent plan. The statute imposes strict requirements that must be satisfied for PBGC to exercise its discretion to order the partition. The statute requires that the PBGC make a finding that the plan is likely to become insolvent; has incurred a substantial reduction in contributions due to employer bankruptcies; is in or will likely be in reorganization requiring significant increases in contributions; and the likelihood of insolvency will be significantly reduced by partition. The immediate and detrimental impact on the partitioned participants is the reason the statutory requirements are so strict. Indeed, since the passage of MPPAA, PBGC has only partitioned two plans. Since PBGC’s second order of partition, which happened in 2010 when PBGC partitioned a trucking plan, multiemployer plans
37 Data based on 2009 Form 5500 annual return filings.
19
have expressed an increased interest in seeking partitions. To date, however, no other plans have satisfied the strict requirements necessary for an order of partition.
Withdrawn Employers and Withdrawal Liability An employer withdrawal from a multiemployer plan occurs when an employer
permanently ceases to have an obligation to contribute under the plan or permanently ceases all covered operations under the plan.38 Such a cessation may occur as a result of a company going out of business, an employer’s liquidation in bankruptcy or the rejection of a collective bargaining agreement in bankruptcy, the sale of assets to another employer (if the purchaser does not assume the collective bargaining agreement and comply with other statutory requirements), or the bargaining parties declining to renew a collective bargaining agreement requiring contributions to the plan.39
An employer that withdraws from the plan is assessed withdrawal liability, which represents the employer’s share of unfunded vested benefits (UVBs) as determined under the withdrawal liability method adopted by the plan.40 The recent increase in plan underfunding has caused withdrawal liability assessments to soar. Also, because an employer’s annual withdrawal liability payments are based on the employer’s highest contribution rate in the last ten years, recent contribution rate increases have generally added to the amount an employer would be obligated to pay in annual withdrawal liability payments. Contributing employers to a plan may weigh the cost of contribution increases against potential withdrawal liability in deciding whether to withdraw, taking into account that the employer’s withdrawal liability may be higher if the withdrawal occurs after a period of significantly higher contributions.
38 There are separate rules for partial withdrawals, which may occur if an employer’s contribution base shrinks by at
least 70% or under similar circumstances. Special withdrawal liability rules apply for some industries, such as construction, where a cessation of contributions is not by itself considered a withdrawal. Generally, under these special rules, withdrawal liability is incurred if the employer’s obligation to contribute ceases but the employer continues (or within five years resumes) the same type of work in the same area as was covered by the collective bargaining agreement and does not contribute on that work. A special provision under MPPAA permits a plan meeting certain requirements to allow a new employer to come into the plan for five years with no withdrawal liability. In addition, to encourage employers to join multiemployer plans, new PBGC regulations permit plans to designate a plan year with respect to which the plan’s unfunded vested benefits would not be allocable to new employers joining thereafter.
39 Special limitations apply in circumstances such as business reorganizations and insolvency liquidations. 40 The MPPAA prescribes four methods that a plan may use to determine the amount of UVBs allocable to a
withdrawing employer, as well as optional modifications to those methods. Under two statutory methods, the modified presumptive and rolling-5 methods, employers are generally responsible for one UVB pool determined as of the end of the plan year preceding the employer’s withdrawal. Under the presumptive method, a withdrawing employer is liable for a share of the change in each year’s UVBs during which the employer had an obligation to contribute. (Construction industry plans are limited to the presumptive method.) Under these methods, an employer’s proportional share of the UVBs is based on a fraction equal to the sum of the employer’s contributions over total contributions made by all employers for the five plan years preceding the plan year in which the UVBs arose. Under a fourth method, the direct attribution method, an employer’s withdrawal liability is based generally on the benefits and assets attributable to participants’ service with the employer, as well as a proportional share of the UVBs which are not attributable to service with the employer or other employers who are obligated to contribute in the plan year preceding the plan year the employer withdraws.
20
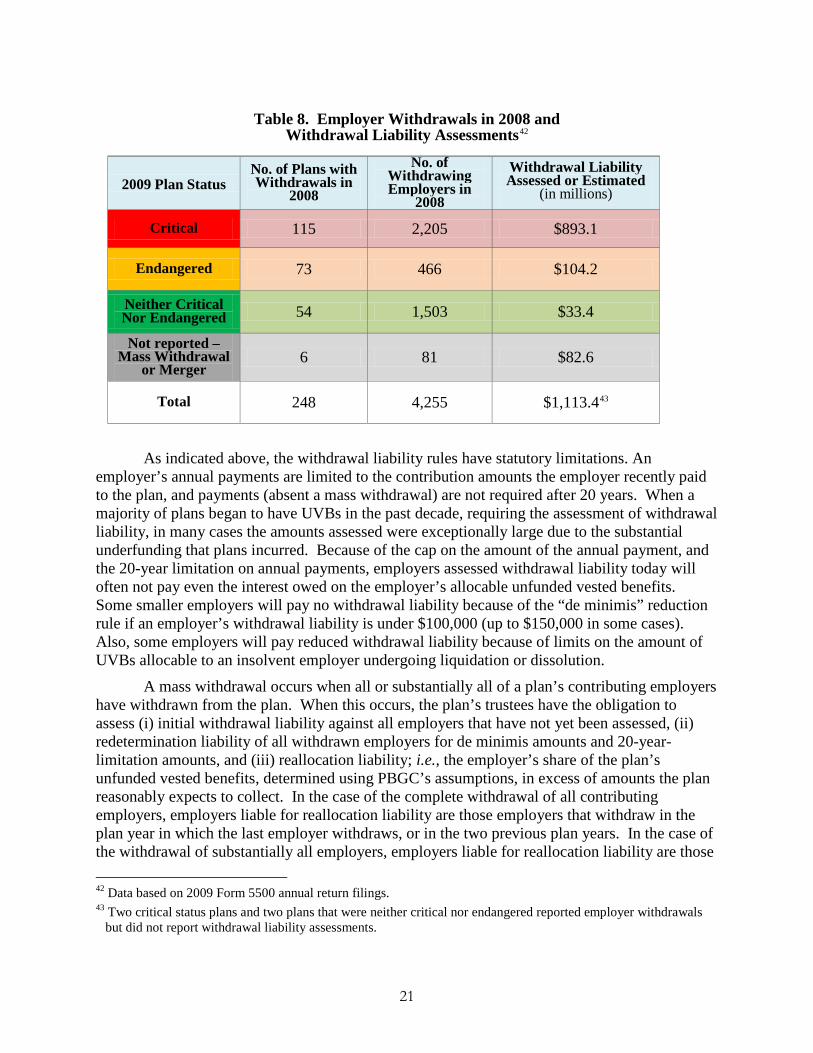
Under PPA, multiemployer plans are required to include in the annual report filed with the ERISA agencies the number of employers that withdrew from the plan during the preceding plan year. On the 2009 Form 5500, Schedule R, 248 plans reported that 4,255 employers withdrew in the prior plan year. See Table 8 below. Nearly one-half of all the plans reporting withdrawals in the 2008 plan year were in critical status in the 2009 plan year, and one-half of all withdrawing employers withdrew from plans that were in critical status in the 2009 plan year. Over one-third of withdrawing employers in 2008 withdrew from ongoing plans that were in neither critical nor endangered status for the 2009 plan year. Five plans reported withdrawals related to mass withdrawal terminations and one plan was merged into another plan. Most plans experienced fewer than ten employer withdrawals in 2008; of course, a small number of withdrawals from a small plan, or even a significant withdrawal from a bigger plan, can cause funding difficulties. (Less than 10% of all plans reporting withdrawals had fewer than 500 participants, and all but one of these plans reported fewer than 10 withdrawals.) Based on 2010 Form 5500 filings, the number of employers reported to have withdrawn from plans in 2009 was comparable to the number in 2008.
Under PPA, a plan must also report the aggregate amounts of withdrawal liability assessed (or estimated to be assessed) against employers that withdrew from the plan during the preceding plan year.41 This amounted to over $1 billion for employers that withdrew in the 2008 plan year. See Table 8 below. Although 50% of all withdrawing employers were in plans that were in critical status in 2009, they were assessed about 80% of the total withdrawal liability resulting from withdrawals in the prior plan year (87% if mass withdrawals are excluded). In contrast, the 35% of all withdrawing employers that withdrew in 2008 from plans that were neither critical nor endangered in 2009 were assessed 3% of the total withdrawal liability that was assessed for withdrawals occurring in the prior plan year. About 7.5% of total withdrawal liability assessed in 2009 related to mass withdrawal terminations of plans in 2008 and 2009.
In 2010 Form 5500 filings, 248 plans reported that 4,126 employers withdrew in the previous year. Plans reported withdrawal liability assessments of nearly $1.35 billion.
41 Withdrawal liability is determined based on the plan’s UVBs ending at the plan year preceding the plan year in
which the employer withdrew (or, under the presumptive method, the end of each plan during the employer’s participation through the plan year preceding the withdrawal). Accordingly, assessments for employers withdrawing in 2008 are based on unfunded vested benefits as of the end of the 2007 plan year (or earlier).
21
Table 8. Employer Withdrawals in 2008 and Withdrawal Liability Assessments42
As indicated above, the withdrawal liability rules have statutory limitations. An employer’s annual payments are limited to the contribution amounts the employer recently paid to the plan, and payments (absent a mass withdrawal) are not required after 20 years. When a majority of plans began to have UVBs in the past decade, requiring the assessment of withdrawal liability, in many cases the amounts assessed were exceptionally large due to the substantial underfunding that plans incurred. Because of the cap on the amount of the annual payment, and the 20-year limitation on annual payments, employers assessed withdrawal liability today will often not pay even the interest owed on the employer’s allocable unfunded vested benefits. Some smaller employers will pay no withdrawal liability because of the “de minimis” reduction rule if an employer’s withdrawal liability is under $100,000 (up to $150,000 in some cases). Also, some employers will pay reduced withdrawal liability because of limits on the amount of UVBs allocable to an insolvent employer undergoing liquidation or dissolution.
A mass withdrawal occurs when all or substantially all of a plan’s contributing employers have withdrawn from the plan. When this occurs, the plan’s trustees have the obligation to assess (i) initial withdrawal liability against all employers that have not yet been assessed, (ii) redetermination liability of all withdrawn employers for de minimis amounts and 20-year-limitation amounts, and (iii) reallocation liability; i.e., the employer’s share of the plan’s unfunded vested benefits, determined using PBGC’s assumptions, in excess of amounts the plan reasonably expects to collect. In the case of the complete withdrawal of all contributing employers, employers liable for reallocation liability are those employers that withdraw in the plan year in which the last employer withdraws, or in the two previous plan years. In the case of the withdrawal of substantially all employers, employers liable for reallocation liability are those 42 Data based on 2009 Form 5500 annual return filings. 43 Two critical status plans and two plans that were neither critical nor endangered reported employer withdrawals
but did not report withdrawal liability assessments.
2009 Plan Status No. of Plans with Withdrawals in
2008
No. of Withdrawing Employers in
2008
Withdrawal Liability Assessed or Estimated
(in millions)
Critical 115 2,205 $893.1
Endangered 73 466 $104.2
Neither Critical Nor Endangered 54 1,503 $33.4
Not reported – Mass Withdrawal
or Merger 6 81 $82.6
Total 248 4,255 $1,113.443
22
who withdraw from the plan as part of a plan or arrangement (presumed to be all employers who withdraw in a three consecutive plan year period in which substantially all employers withdraw). When the plan faces serious financial difficulties, the withdrawal of a few employers or the bankruptcy of a major employer, and the discharge of that employer’s liability, can trigger a mass withdrawal. However, only those employers that withdraw are liable; employers that continue contributing to the plan have no withdrawal liability unless they withdraw.
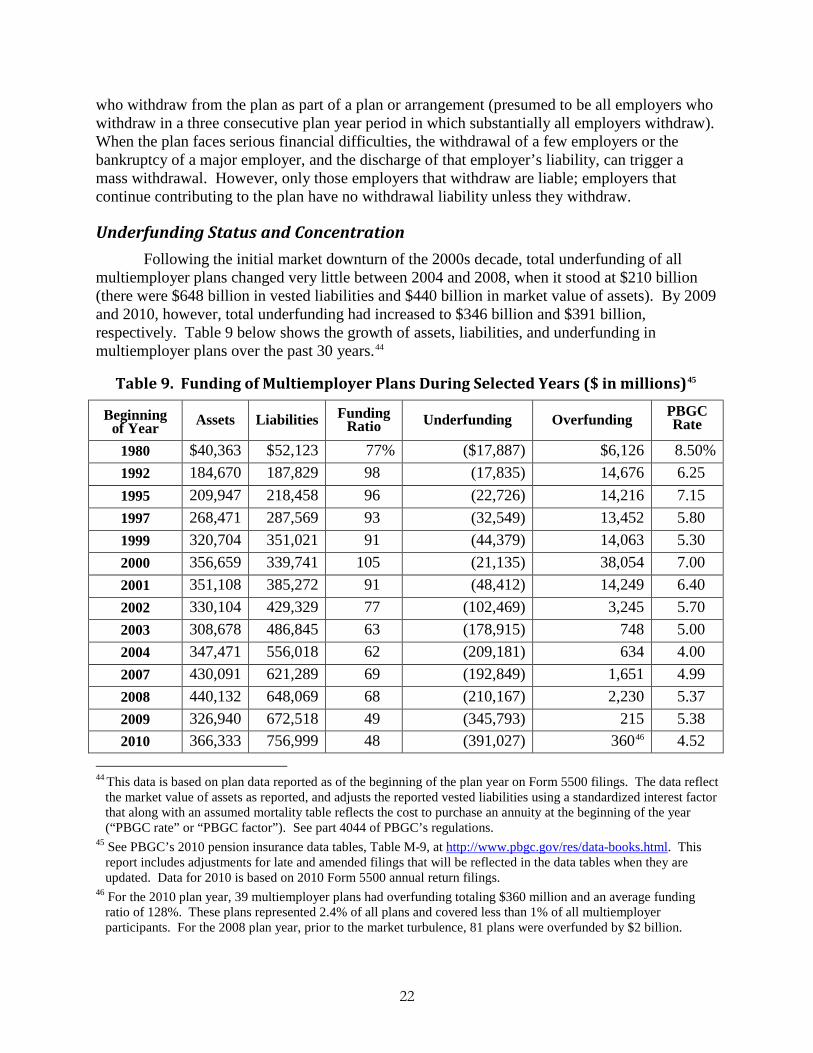
Underfunding Status and Concentration Following the initial market downturn of the 2000s decade, total underfunding of all
multiemployer plans changed very little between 2004 and 2008, when it stood at $210 billion (there were $648 billion in vested liabilities and $440 billion in market value of assets). By 2009 and 2010, however, total underfunding had increased to $346 billion and $391 billion, respectively. Table 9 below shows the growth of assets, liabilities, and underfunding in multiemployer plans over the past 30 years.44
44 This data is based on plan data reported as of the beginning of the plan year on Form 5500 filings. The data reflect
the market value of assets as reported, and adjusts the reported vested liabilities using a standardized interest factor that along with an assumed mortality table reflects the cost to purchase an annuity at the beginning of the year (“PBGC rate” or “PBGC factor”). See part 4044 of PBGC’s regulations.
45 See PBGC’s 2010 pension insurance data tables, Table M-9, at http://www.pbgc.gov/res/data-books.html. This report includes adjustments for late and amended filings that will be reflected in the data tables when they are updated. Data for 2010 is based on 2010 Form 5500 annual return filings.
46 For the 2010 plan year, 39 multiemployer plans had overfunding totaling $360 million and an average funding ratio of 128%. These plans represented 2.4% of all plans and covered less than 1% of all multiemployer participants. For the 2008 plan year, prior to the market turbulence, 81 plans were overfunded by $2 billion.
Table 9. Funding of Multiemployer Plans During Selected Years ($ in millions)45
Beginning of Year Assets Liabilities Funding
Ratio Underfunding Overfunding PBGC Rate
1980 $40,363 $52,123 77% ($17,887) $6,126 8.50% 1992 184,670 187,829 98 (17,835) 14,676 6.25 1995 209,947 218,458 96 (22,726) 14,216 7.15 1997 268,471 287,569 93 (32,549) 13,452 5.80 1999 320,704 351,021 91 (44,379) 14,063 5.30 2000 356,659 339,741 105 (21,135) 38,054 7.00 2001 351,108 385,272 91 (48,412) 14,249 6.40 2002 330,104 429,329 77 (102,469) 3,245 5.70 2003 308,678 486,845 63 (178,915) 748 5.00 2004 347,471 556,018 62 (209,181) 634 4.00 2007 430,091 621,289 69 (192,849) 1,651 4.99 2008 440,132 648,069 68 (210,167) 2,230 5.37 2009 326,940 672,518 49 (345,793) 215 5.38 2010 366,333 756,999 48 (391,027) 36046 4.52
23
Underfunding is highly concentrated within a small proportion of plans. Ten plans accounted for more than a quarter ($106 billion) of the 2010 underfunding. Each of those 10 plans was underfunded by at least $5.1 billion, and those ten plans covered 2.47 million participants and beneficiaries. Fifty plans (including the above-mentioned ten) covering 5.28 million participants and beneficiaries were responsible for more than half ($209 billion) of the underfunding in 2010.
In 2008, the average funding ratio47 for all plans was 68%, and more than half of all multiemployer plan participants (60%) were in plans that had a funding ratio of less than 70%. The average funding ratio for all plans fell to 49% in 2009 and 48% in 2010. In 2010, nearly 90% of all plans – which cover 96% of all plan participants – had a funding ratio of less than 70%.48
For 2010, construction industry plans, which cover 37.5% of total participants, represented 49.4% of the total underfunding at $193 billion. Transportation industry plans, which cover 15.3% of all participants, represented 22.7% of the total underfunding at $89 billion. Plans in retail trade and services, which cover 31.8% of all participants, represented 17.2% of the total underfunding at $67 billion. Plans in manufacturing industries cover 11.3% of all participants and represent 6.3% of the total underfunding at $25 billion. Table 10 below summarizes data on underfunding concentration.
47 The terms “funding ratio” and “funded percentage” are distinct. Funding ratio is based on the plans’ market value
of assets and reported vested liabilities, adjusted to reflect PBGC’s interest factor. “Funded percentage” is used in PPA as a basis for determining whether a plan is subject to additional funding requirements. Funded percentage is based on liabilities as measured by plans for funding purposes using varying interest rate assumptions and smoothed asset values.
48 The PBGC interest rate used to determine funding ratios was 5.37% for the 2008 plan year, 5.38% for the 2009 plan year, and 4.52% for the 2010 plan year. The weighted average valuation liability interest rate reported by plans on line 6d of Schedule MB, Form 5500, was 7.52% for both the 2009 and the 2010 plan years (average weighted by plan liabilities). Liabilities using a rate of 7.52% total $575 billion for 2010, resulting in a funding ratio of 63.7%.

24
Table 10. Concentration of Underfunding by Plan and Industry (2010)49
Plans Underfunding (in millions)
Percent of Total Underfunding
Percent of Total
Participants
Average Funding
Ratio
All Plans (1,475) ($391,027) 100% 100% 48%
10 plans with greatest underfunding ($106,143) 27.1 23.7 46
50 plans with greatest underfunding ($208,738) 53.3 50.7 46
Construction industry Plans ($193,303) 49.4 37.5 48
Transportation industry plans ($88,768) 22.7 15.3 46
Retail Trade and Services plans (67,132) 17.2 31.8 51
Manufacturing plans ($24,788) 6.3 11.3 52
During the 2010 plan year, underfunding declined by $1.0 billion for the 10 most underfunded plans, going from $106 billion at the beginning of the 2010 plan year to $105 billion at the beginning of the 2011 plan year.50 Their market value of assets increased $7.4 billion, to reach $99.4 billion by the end of the period. Their aggregate liabilities increased $6.4 billion, to reach $204.5 billion as of January 1, 2011.
During the 2011 plan year, the asset values for seven of these 10 plans for which 2011 Form 5500 filings are available remained fairly level (going from $87.6 billion at beginning of the 2011 plan year to $85.3 billion at the end of the 2011 plan year).
49 Data based on 2010 Form 5500 annual return filings. See also PBGC’s 2010 pension insurance data tables,
Tables M-8, M-12, M-14, at http://www.pbgc.gov/res/data-books.html. 50 The change in liabilities and underfunding from the beginning of the 2009 plan year to the beginning of the 2010
plan year were measured using the 4.52% PBGC factor in effect for the 2010 plan year. Values are based on 2011 Form 5500 data for seven of the 10 plans and 2010 Form 5500 data (liabilities projected to the end of the year) for three of the plans.
25
Funding Rules
Overview Multiemployer and single-employer defined benefit plans are subject to minimum
funding requirements under the Code,51 with parallel requirements under ERISA. In the past, the funding rules for multiemployer and single-employer plans had similar structures, but over time they have diverged, particularly since PPA.
The funding rules have historically provided multiemployer plans with considerable flexibility in determining minimum funding requirements each plan year. There is broad discretion for the selection of funding methods and assumptions used to measure the plan’s liabilities and assets. A number of actuarial funding methods can be used, as well as “smoothed assets” – an actuarial value of assets that is used to determine funding costs and funded status – recognizing gains or losses in the market value of assets each year over a period of up to 5 years (and in some cases longer), but generally not more than 20% above or below market value. There are relatively long amortization periods for unfunded liabilities. PPA preserved much of this flexibility for multiemployer plans, and even expanded it, as discussed further below, by providing automatic approval of certain amortization period extensions and of adoption of an alternative funding method, the “shortfall” method.
By contrast, single-employer plans have considerably less funding discretion and flexibility, particularly after PPA. The funding rules mandate most of the assumptions for single-employer plans – including the interest rate (based on an investment-grade corporate bond yield curve) and mortality assumptions – used in determining liabilities and funding requirements. Single-employer plans are required to use asset values more closely aligned with the market value of assets (limited to a 10-percent corridor around market value), and the maximum smoothing period allowed is 25 months. Also, single-employer plans are generally required under PPA to amortize unfunded liabilities over seven years.52
Single-employer plans and multiemployer plans have been held to different standards because of the perceived difference in their exposure to risk. For single-employer plans, ongoing fiscal discipline is critical because the plan is dependent on a sole sponsor whose deteriorating health may not allow it to fully fund the plan before the plan terminates.
The funding of multiemployer plans is quite different from the funding of single-employer plans. Contribution rates are fixed by collective bargaining agreements and generally stay in effect for the duration of the contract period. The funding rules therefore permit multiemployer plans to be funded over longer periods. It was assumed that the risks of a longer time horizon are mitigated by the pooling of employer contributions, plan assets, and liabilities,
51 In this section, “the Code” refers to the Internal Revenue Code unless otherwise stated. 52 The funding rules for single-employer plans were tightened many times through the 1980s and 1990s. The
funding rules for multiemployer plans remained steady during that period. For example, under special rules referred to as the “deficit reduction contribution rules,” from 1989 through 2007, single-employer plans were required to make additional contributions if the plan’s funded current liability percentage (based on mandated interest rate and mortality table assumptions) was less than 90 percent; in that case, a four-to-seven-year amortization period applied.
26
which spreads the risk of fully funding plan benefits among numerous employers. The multiemployer plan rules are designed to allow some employers to exit the plan (possibly with withdrawal liability) and others to enter on the expectation that the long-term funding prospects for the plan would not be affected.
It is now apparent, however, these expectations for multiemployer plans are unlikely to hold true in the foreseeable future. A shrinking pool of active participants over the past 20 years caused the contribution base of many plans to decline, reducing funds available to pay for previously earned but unfunded benefits,53 while ongoing benefit accruals continued at previous levels. As a result, these plans struggled to pay down liabilities for retirees and separated vested participants. During the strong performance of plan assets in the 1990s, many plans raised benefits for all participants and some increased their stock market exposure. These plans became significantly underfunded when asset values plummeted in the early 2000s, causing minimum contribution requirements to spiral well above amounts specified in collective bargaining agreements and raising the specter of funding deficiencies. This happened at a time when the industries in which multiemployer plans were predominant were experiencing downturns leading to fewer hours worked and, accordingly, lower contributions, to these plans. Ultimately, success in funding these plans will depend on economic improvement in these industries which leads to increased contributions, as well as positive investment returns.
PPA addressed funding problems in multiemployer plans by introducing a new statutory framework for strengthening their financial health and increasing disclosure of information about multiemployer plans. Multiemployer plan trustees are required to identify and confront potential funding problems early, before those problems become too severe. Under PPA, plans are sorted into categories that reflect their funding difficulties – plans in critical status, endangered status, and neither critical nor endangered status.54 Trustees of a plan in endangered or critical status are required to develop a package of measures, including increased contributions and reduced benefits as needed, to enable the plan to achieve certain statutory targets for improved funding over a period of years. PPA also provided plans with additional tools and flexibility to avoid undue stress on contributions and benefits.
PPA made a number of changes to the excise tax rules for plans in endangered and critical status. For plans in critical status with funding deficiencies, PPA suspended the excise taxes that would otherwise apply to contributing employers. (For plans in endangered or critical status, PPA created a new 100% excise tax for failure to make a contribution in accordance with the funding improvement or rehabilitation plan, as applicable.)
Basic Funding Rules Defined benefit plans use actuarial funding to estimate the costs of promised benefits
under the plan. The costs are dependent on many factors regarding the future – such as the
53These plans have a history of increasing plan benefits, including past service benefits for active and inactive
participants—at times in response to healthy investment returns and sometimes to comply with the limits on deductibility of employer contributions—and the increased liabilities are funded over future years.
54 Some special rules apply to certain endangered plans, referred to as “seriously endangered.” The actuary for a multiemployer plan is required to report its status on Form 5500, which lists seriously endangered as a separate category.

27
number of employees, the number of hours worked, life expectancy, retirement and disability rates, and the rate of investment return. The actuary is responsible for providing reasonable assumptions to develop the estimated costs. Actuaries also use a number of actuarial funding methods and methods for valuing assets and investment income that affect the timing of contributions and the level of required contributions. Actuaries conduct plan valuations on an annual basis to determine the extent to which the plan’s experience was consistent with the assumptions and may modify the assumptions to the extent necessary to properly fund the plan.
Funding Standard Account Under the basic funding rules, the minimum required contribution to a multiemployer
plan is determined each year based on an actuarial valuation of the benefits promised by the plan. For purposes of determining the minimum required contribution, a “funding standard account” must be maintained for the plan. Specified charges and credits are made to the funding standard account every year.55
Charges include the plan’s normal cost for the year (the annual cost associated with service for the current year for active employees under the funding method used by the plan), plus the cost of amortizing the plan’s unfunded liability (e.g., changes in liability due to amendments increasing past service benefits) with interest, in equal installments over a period of years. Charges also reflect the amount needed to amortize losses attributable to plan experience (e.g., investment losses) or to changes in funding methods or actuarial assumptions.
Credits include employer contributions made to the plan every year. Credits also include the amount needed to amortize experience gains, gains from changes in actuarial assumptions, and reductions in plan liabilities resulting from amendments reducing benefits over a period of years. If, as described below, there is a credit balance, then assumed interest on the credit balance is added to the funding standard account.
Credit Balances and Funding Deficiencies If the total credits to the funding standard account exceed the total charges, a “credit
balance” results, and no further contributions are required under the statutory minimum funding rules until future charges eliminate the credit balance.56 If the total charges to the funding standard account exceed the total credits, a funding “deficiency” results, and additional contributions must be made – generally above the amounts employers are obligated to pay in their collective bargaining agreements – so that the plan can meet its minimum funding requirements. If additional contributions are not made by the time required, contributing
55 As a means for enforcing the funding requirements, information about the funding standard account is reported by
the plan’s actuary on Schedule MB of Form 5500. 56 However, this does not relieve employers of their obligations to make the contributions provided for under
collective bargaining agreements.
28
employers are required to pay an excise tax to the IRS of five percent of the deficiency, increasing to 100 percent if the deficiency goes uncorrected.57
Many plans built up credit balances in years during which contributions required under collective bargaining agreements exceeded required minimum contribution levels. Credit balances also expanded with the run up of asset values in the late 1990s (as a result of the amortization credits with respect to the actuarial gains resulting from better than expected asset returns during that period). Because credit balances are often used in lieu of cash contributions, the existence of these credit balances has masked a declining contribution base. In the aftermath of massive asset losses during the 2000s, credit balances were rapidly depleted – in just two years, between 2007 and 2009, aggregate credit balances fell by $10 billion, from $63 billion to $53 billion.58
Many plans are projecting imminent funding deficiencies in the absence of a significant increase in contribution rates. For the 2009 plan year, 80 plans reported funding deficiencies.59 This was more than four times the annual average over the previous decade. Funding deficiencies for all 80 plans totaled $1.0 billion. For the 2010 plan year, 90 plans reported funding deficiencies totaling $1.9 billion. As shown in Table 11 below, 57 of these plans had an accumulated funding deficiency in excess of $1 million, 19 plans reported deficiencies in excess of $10 million, and three plans had deficiencies in excess of $100 million. Many of these plans with funding deficiencies are large: 10 plans have 10,000 or more participants, and an additional 7 plans have at least 5,000 participants each.
57 If certain conditions are met, the Secretary of the Treasury may grant a funding waiver of all or a portion of the
contributions required for the year. No plans reported obtaining a funding waiver for the 2009 or 2010 plan years. As discussed below, a common tool used by multiemployer plans to avoid funding deficiencies is an extension of the amortization period for certain plan liabilities.
58 Credit balances increased to $56.3 billion for the 2010 plan year. However, up to $2 billion of this improvement may be related to trustee elections of PRA 2010 relief. On the Form 5500 annual return filings for the 2010 plan year, more than 650 plans showed revised “prior year” credit balances for the 2009 plan year and most plans attributed the increase in credit balance to lowered amortization charges due to the application of PRA 2010 relief. See Chapter III, section entitled “Subsequent Funding Relief Legislation.”
59 Seven plans that were not in critical status reported a funding deficiency for the year (five reported being in endangered status and two reported being in neither endangered nor critical status). Perhaps these plans certified their status incorrectly on the basis of their WRERA elections rather than certifying their status irrespective of the WRERA election.

29
Table 11. Plans with Accumulated Funding Deficiencies (2010)60
Plan Size by Participants
# of Plans with
Funding Deficiency
Funding Deficiency
< $1 Million
Funding Deficiency
$1 Million to $10 Million
Funding Deficiency
>$10 Million to $35 Million
Funding Deficiency
>$35 Million to
$99 Million
Funding Deficiency
> $100 Million
90
< 1,000 Participants 28 11 1 1,000 to 4,999 Participants 5 22 4 2
5,000 to 9,999 Participants 2 4 1
10,000+ Participants 3 2 3 2
Amortization Periods Historically, liabilities under multiemployer plans were permitted to be amortized over
long periods. Specifically, when a plan increased benefits in years immediately prior to PPA, the resulting past service liability was amortized over 30 or 40 years (depending on when the liability arose); gains and losses from changes in actuarial assumptions were amortized over 30 years; and experience gains and losses were amortized over 15 years.
PPA shortened the amortization periods for all types of unfunded liabilities to 15 years.61
The change from 30 years to 15 years for amortizing plan benefit amendments and changes in actuarial assumptions are significant because they recognize the need for plans to fund new liabilities more quickly.62 Adequate pre-funding reduces the risk that a market downturn in the future will deplete the plan’s assets and weaken the plan so significantly that it cannot reasonably make up the losses through future contributions and earnings. It also compels the plan’s trustees to carefully deliberate about whether the plan and its contributing employers can afford a benefit increase or a change in assumptions that produces an actuarial loss.
Under PPA, the shortened 15-year amortization period does not apply to plan liabilities that arose before 2008. Many plans with large existing liabilities for older participants continue to be governed by the old rules for those liabilities, which allow the liabilities to be paid off at a very slow pace (over 30 or 40 years). For those plans, higher underfunding will continue for longer, exposing plan participants to a greater risk of insolvency in the event the fixed amortization charges become unaffordable as a result of a decline in the number of active participants (and a resulting decline in the contribution base) before benefits are fully funded. In addition, slower funding deprives the plan of a cushion, which is important in the event that the plan’s portfolio loses value. 60 Data based on 2010 Form 5500 annual return filings. 61 If a benefit increase will be paid out over a period shorter than 15 years, the applicable amortization period is the
shorter period. 62 PPA also shortened from 30 to 15 years the period for amortizing a decrease in liability resulting from benefit
reductions, including adjustable benefit reductions by plans in critical status, as discussed below. This speeds up the plan’s recognition of reduced liabilities for purposes of the minimum funding requirements.

30
Amortization Extensions Before PPA, the amortization periods applicable in determining charges to the funding
standard account could be extended up to ten additional years, with IRS approval. The extension of an amortization period is a type of funding relief that reduces charges to the funding standard account and thus can have the effect of avoiding contribution increases or benefit reductions that would otherwise be required. Applications for such relief increased noticeably after the 2000 to 2002 market downturn. To obtain an extension, the plan was required to show that failure to permit an extension would: (i) result in a substantial risk to the voluntary continuation of the plan or a substantial curtailment of pension benefit levels or employee compensation, and (ii) be adverse to the interests of plan participants in the aggregate. Multiemployer plans were subject to a lower rate of interest on an extension than the assumed rate of return that would usually apply, which had the effect of reducing required contributions far more than the reductions produced by the extension itself. Finally, during the time an extension was in effect, benefit increases of more than a de minimis amount were not permitted.
PPA provided for automatic approval for a 5-year extension of amortization periods. The eligibility requirements for a 5-year extension are much easier to satisfy than previous requirements — in an application filed with the IRS, the plan’s actuary must certify that, (i) absent the extension, the plan would have an accumulated funding deficiency in the next nine years; (ii) the plan sponsor has adopted a plan to improve the plan’s funding status; (iii) the plan is projected to have sufficient assets to cover expenses over the extended amortization period; and (iv) notice has been provided to affected parties. While PPA reduced amortization periods to 15 years for nearly all charge bases under a plan’s funding standard account, the effect of the shorter period is offset to some extent by the availability of an automatic 5-year extension in cases where an extension under prior law would not have been granted. Plans may also request an additional 5-year extension from the IRS under criteria similar to those under pre-PPA law. In addition, the IRS is now required to act within 180 days of the plan’s application. For both types of extensions, PPA eliminated the special interest rate for applications filed with IRS on or after July 1, 2005. Instead, the valuation interest rate is used (which is generally higher than the interest rate that applied in the case of extensions requested previously).
Six multiemployer plans were operating under amortization extensions for the 2005 plan year.63 This number surged after PPA: in 2008, 53 plans were operating under an automatic extension of the amortization periods and 11 plans were operating under IRS-approved extensions; in 2009 – following the market downturn – upwards of 125 plans were operating under an automatic 5-year extension,64 and 9 plans were operating under extensions approved by the IRS. By 2010, there were 190 plans operating under amortization extensions: 178 plans used the automatic 5-year extension and 12 plans used an approved extension. Plans seized on this relief after investment losses added millions in amortization charges each year to their funding standard accounts. In particular, PPA’s automatic 5-year amortization extension was 63 More plans likely would have needed such extensions to counteract steep increases in contributions that were
occurring in the 2000s decade: contributions barely topped $8 billion in 2000, but increased to $16 billion by 2005. (The 2000 plan year may have some underreporting due to processing difficulties.)
64 All extensions were taken for the full five years. The number of plans adopting automatic extensions could be slightly more because some plans that received IRS-approved extensions did not indicate whether or not they also adopted automatic extensions.

31
heavily utilized: in 2010, nearly all plans (94%) operating under any extension used the automatic extension.
Table 12. Amortization Extensions 2008 to 2010
Plans Using Amortization
Extensions 2008 2009 2010
Automatic Extension 53 125 178
Approved Extension 11 9 12
Total Extensions 64 134 190
For the 2010 plan year, the following percentages of plans by zone status were operating under an amortization extension: 23% of all critical status plans, 24% of all seriously endangered plans, 17% of all other endangered plans, and 8% of all “green” plans. There was a significant increase in the percentage of plans using amortization extensions between 2009 and 2010 in all zone statuses. As indicated in Table 13 below, nearly half of all plans using amortization extensions in 2010 were in critical status.
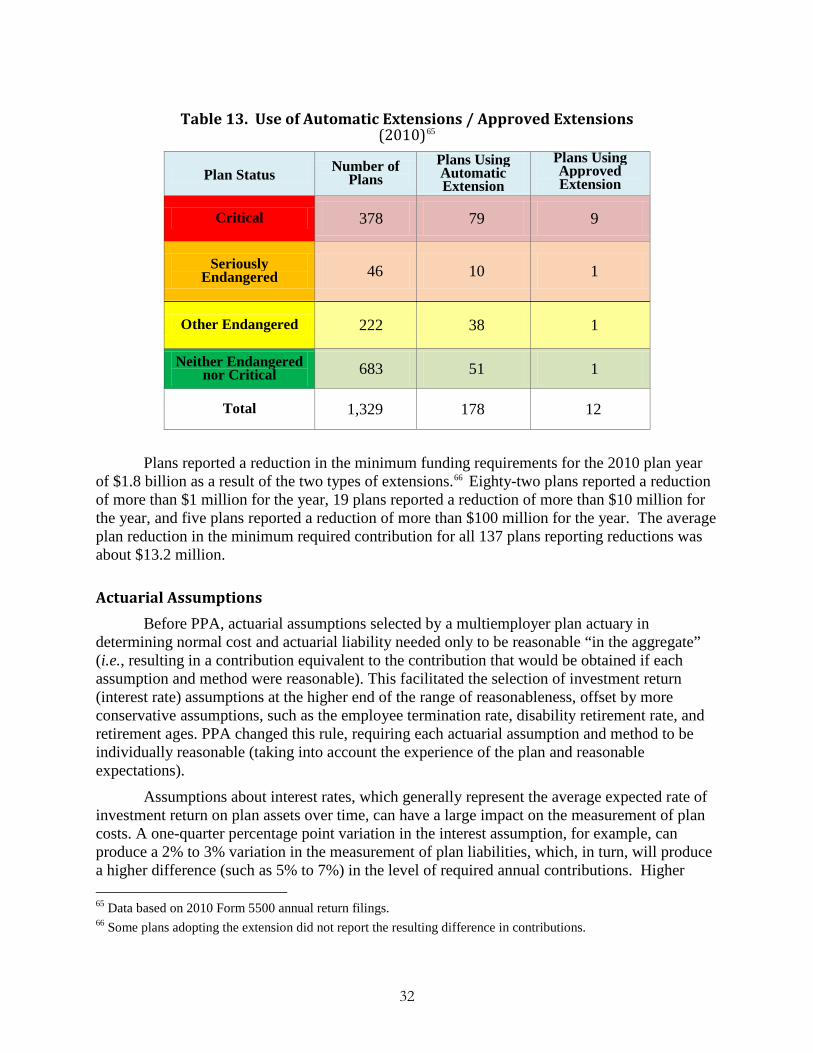
32
Table 13. Use of Automatic Extensions / Approved Extensions (2010)65
Plan Status Number of Plans
Plans Using Automatic Extension
Plans Using Approved Extension
Critical 378 79 9
Seriously Endangered 46 10 1
Other Endangered 222 38 1
Neither Endangered nor Critical 683 51 1
Total 1,329 178 12
Plans reported a reduction in the minimum funding requirements for the 2010 plan year of $1.8 billion as a result of the two types of extensions.66 Eighty-two plans reported a reduction of more than $1 million for the year, 19 plans reported a reduction of more than $10 million for the year, and five plans reported a reduction of more than $100 million for the year. The average plan reduction in the minimum required contribution for all 137 plans reporting reductions was about $13.2 million.
Actuarial Assumptions Before PPA, actuarial assumptions selected by a multiemployer plan actuary in
determining normal cost and actuarial liability needed only to be reasonable “in the aggregate” (i.e., resulting in a contribution equivalent to the contribution that would be obtained if each assumption and method were reasonable). This facilitated the selection of investment return (interest rate) assumptions at the higher end of the range of reasonableness, offset by more conservative assumptions, such as the employee termination rate, disability retirement rate, and retirement ages. PPA changed this rule, requiring each actuarial assumption and method to be individually reasonable (taking into account the experience of the plan and reasonable expectations).
Assumptions about interest rates, which generally represent the average expected rate of investment return on plan assets over time, can have a large impact on the measurement of plan costs. A one-quarter percentage point variation in the interest assumption, for example, can produce a 2% to 3% variation in the measurement of plan liabilities, which, in turn, will produce a higher difference (such as 5% to 7%) in the level of required annual contributions. Higher 65 Data based on 2010 Form 5500 annual return filings. 66 Some plans adopting the extension did not report the resulting difference in contributions.
33
interest rates also implicitly assume that a greater proportion of the plan’s benefit costs will be paid from investment earnings rather than contributions. This implicit assumption becomes riskier as a plan matures and disbursements increase, leaving fewer assets to generate earnings.
Historically, multiemployer plan actuaries have often selected relatively high valuation liability interest rates of 7.5% or higher, which had the effect of reducing minimum required contributions.67 Between 1995 and 2007, plans with more than $1 billion in liabilities used an average valuation liability interest rate (weighted by plan liabilities) of 7.57%.68 The 2010 Form 5500 filings indicate that the valuation liability interest rates used by plans ranged from 5% to 8.5%. Out of 141 plans with liabilities in excess of $1 billion, 121 plans used rates between 7.5% and 8.5%, and the remaining 20 plans used rates ranging from 6.75% to 7.25%.69 The average valuation liability interest rate for all plans, weighted by plan liabilities, was 7.52% for the 2010 plan year.70 The extent to which the new PPA standard for assumptions will affect the selection of valuation liability interest rates remains unclear.
Shortfall Funding Method Among the funding methods available to multiemployer plans is the shortfall method.
Although, under some funding methods, normal cost charges can be adjusted automatically for fluctuations in base units (e.g., hours of service or units of production), charges to amortize losses and benefit increases are normally fixed. Under the shortfall method, rather than fixed charges to the funding standard account, charges increase or decrease as base units, on which contributions are based, vary from assumed levels. This allows short-term fluctuations in employment levels to be reflected in charges to the plan’s funding standard account. For example, if the base units under the plan are substantially less than the estimated base units, charges and credits are adjusted to reflect the actual hours worked. Any difference in charges and credits (resulting from differences between actual and expected base units) is amortized over a period generally beginning with the expiration of the current collective bargaining agreement and ending 20 years after the difference occurred. The shortfall method can substantially reduce a plan’s minimum required contributions for a plan year, particularly in slow economic periods when hours of service or units of production are lower than assumed. However, the plan’s funded status would be worsened in such a case. While the shortfall funding method protects employers against funding deficiencies in the short term, it does not provide relief when a plan’s workforce has permanently declined.
67 Many plans adopted high earnings assumptions during the period of high returns in the 1990s. 68 The comparable average rate for large single-employer plans over this period was 8.34%. However, under pre-
PPA law, single-employer plans were also subject to deficit reduction contribution rules if they met certain thresholds, such as a current funded liability percentage of less than 90% using the RPA ’94 interest rate; RPA ’94 rates averaged 6.43% between 1995 and 2007. In 2005 through 2007, years when these thresholds were most often met, about 10% of large single-employer plans were subject to the rules.
69 Using the plans’ valuation liability interest rates to measure liabilities, there are 102 plans with over $1 billion in liabilities; 85 of these plans used valuation liability interest rates of between 7.5% and 8.5%.
70 The unweighted average liability interest rate reported on the 2010 Schedule MB for all plans is 7.35%. The RPA ’94 interest rate, used to report a plan’s current liabilities on line 1d of Schedule MB, Form 5500, was 4.62% for the 2010 plan year (average rate, based on plan year commencement date, is weighted by plan liabilities).

34
Prior to PPA, IRS approval was required before a plan that was not using the shortfall funding method could adopt that method (or before a plan that was using the shortfall funding method could cease using the method). In Form 5500 filings between 2002 and 2007, 130 plans reported using the shortfall method.
PPA allows plans to adopt the shortfall funding method (or to stop using the shortfall funding method) once every five years, without IRS approval. As a condition of this automatic approval, plans must not have operated under other relief measures within the past five years and may not increase their liabilities by amendment during any period they are on the shortfall method. For 2009, Form 5500 filings indicate that only 39 plans were using the shortfall funding method. The average annual reduction in minimum required contributions for the 2009 plan year was $2.7 million; eleven plans had reductions of over $1 million, and one plan had a reduction of $42.7 million for the year. Of the 39 plans, 11 were in critical status, 4 were in seriously endangered status, 9 were in other endangered status, and 14 were in “green” status, and the status of one plan was unclear. Forty-one plans reported using the shortfall method in 2010, and 14 plans reported total reductions of $63.6 million in their minimum funding requirements.
Increase in Maximum Deductible Contribution Amounts The Code has for many years provided limits on employer deductions for contributions to
qualified defined benefit plans. If plan assets were less than accrued liabilities determined under the plan’s funding method, contributions were deductible to the extent they did not exceed the amount necessary to amortize the shortfall over a specified period, generally 10 years. If plan assets exceeded accrued liabilities, the plan was considered “fully funded” and no deductible contributions were permitted. The Omnibus Budget Reconciliation Act of 1987 limited the deduction by providing that the plan was also considered fully funded if the assets exceeded 150% of “current liability,” even if that was less than the accrued liability under the plan’s funding method. The Taxpayer Relief Act of 1997 provided for a phase-in of an increase of this alternative determination of when the plan was considered fully funded to 170% of current liability. Nonetheless, many plans still were considered fully funded at the end of the 1990s. Such a plan would be compelled to increase benefits and/or decrease contributions.71 In practice, plans increased benefits, which diminished the cushion of overfunding available to withstand a decline in investment returns.72 Another means of avoiding the maximum deductible limit on contributions was to forego scheduled increases in contributions to the plan under collective bargaining agreements.
The Economic Growth and Tax Relief Reconciliation Act of 2001 (EGTRRA) eliminated the alternative determination of when the plan was considered fully funded. EGTRRA also provided that contributing employers to a multiemployer plan can make deductible contributions at a faster rate than 10-year amortization (potentially in an amount above accrued liability under a plan’s funding method) provided that assets are less than 100 percent of current liability. PPA raised this limit by allowing employers to make deductible contributions provided that assets are
71 If a plan did neither of these, contributions would be nondeductible and a 10 percent excise tax would apply. 72 In some cases, plans tried to avoid the maximum deductible limit by adopting amendments making the benefit
formula more generous. In other cases, plans tried to avoid this limit without creating ongoing liability, for example, providing a one-time check to retirees (sometimes known as a 13th check).

35
less than 140 percent of current liability. This allows employers to continue to make deductible contributions during periods when the plan is well funded (but not significantly overfunded), which will create a funding cushion for less favorable economic cycles.
Reorganization and Insolvency Even before PPA, the basic funding rules for multiemployer plans were augmented by
special rules for certain plans experiencing financial difficulty. Such plans are referred to as being in “reorganization” status. If a plan is in reorganization, the plan’s minimum contribution requirement is generally statutorily increased (in certain circumstances, an overburden credit prevents undue impact on contributing employers). Also, despite the general “anti-cutback” prohibition under the Code and ERISA that protects previously accrued benefits, plans in reorganization may reduce or eliminate benefits or benefit increases in effect under the plan for less than 60 months and must cease paying lump sum benefits in excess of $1,750. However, the reorganization index that makes plans subject to the special funding rules is rarely triggered, even by plans with serious financial difficulties.73 Four plans in 2009 and seven plans in 2010 reported that they were in reorganization status for the plan year.74
Special rules also apply if a multiemployer plan becomes insolvent, that is, all of a plan’s available resources – including its assets, cash, contributions, earnings, and withdrawal liability payments, less reasonable administrative expenses – are insufficient to cover benefit payments when due for the plan year. In that case, the plan must reduce nonforfeitable benefits and suspend other benefits to the level that can be covered by plan assets, but not below the benefit level guaranteed by PBGC. The plan is eligible for financial assistance from the PBGC if needed to pay benefits and expenses after benefits have been reduced to the guaranteed level.
A few plans become insolvent while they are still ongoing, i.e., providing accrual or vesting service credit to participants and receiving contributions from employers. The vast majority of insolvent plans, however, are plans that terminated (generally by the mass withdrawal of all employers from the plan long before becoming insolvent). Such plans operate as wasting trusts, paying benefits and expenses as they come due and collecting withdrawal liability payments.75 In contrast to an underfunded single-employer plan that is trusteed by PBGC when it terminates, an insolvent multiemployer plan – whether it is ongoing or terminated – is not taken over by PBGC, but receives financial assistance when it is unable to pay the guaranteed level of benefits.
73 The reorganization index is triggered if the net charge under the plan’s funding standard account is insufficient to
amortize retired participants’ benefits over ten years and all other participants’ vested benefits over 25 years. This calculation arises in extreme situations.
74 Multiemployer practitioners have questioned the applicability of the reorganization rules if a plan is otherwise subject to the PPA rules.
75 Terminated plans operate as wasting trusts for an average period of ten to eleven years before they exhaust assets to pay guaranteed benefits. At that point, the plans continue to pay benefits at the guarantee level using the financial assistance they receive from PBGC.

36
Additional Rules for Plans in Endangered or Critical Status Under pre-PPA law, multiemployer plans were not required to take actions to improve
their funded status unless they triggered the “reorganization” requirements of ERISA. PPA establishes earlier thresholds for addressing funding problems and timeframes for trustee actions. It imposes benchmarks for funding improvements (although plans generally have discretion to design their own action plans for achieving those benchmarks) and provides certain enforcement mechanisms. The new regime includes additional flexibility for plans facing financial problems.
Annual Accelerated Certification of Funded Status In the case of a multiemployer plan in effect on July 16, 2006, PPA requires the plan’s
actuary to certify the plan’s status within the zones established under PPA, to the plan’s trustees and the Secretary of the Treasury within 90 days after the beginning of each plan year. The certification states whether or not the plan has triggered any of the tests to be in critical status or endangered status and, for a plan already in critical or endangered status, whether the plan is progressing as scheduled toward the applicable statutory target for improved funding. A failure by the plan actuary to timely certify the plan’s status is treated as a failure by the plan administrator to file the Form 5500 and can result in a civil penalty under ERISA of up to $1,100 per day.76
The applicable statuses are “endangered” and “critical.” Within the category of endangered, there is a subcategory of “seriously endangered.” The zone statuses and triggers for those statuses are described in Table 14 below:
76 DOL, in conjunction with the IRS, is pursuing a PPA related enforcement initiative to identify plans that have
failed to file with IRS an actuarial certification of their funding status. DOL is sending the IRS and PBGC summaries of its findings with respect to missing certification cases. As of the beginning of November 2012, DOL has observed substantial compliance with the PPA’s certification requirement.
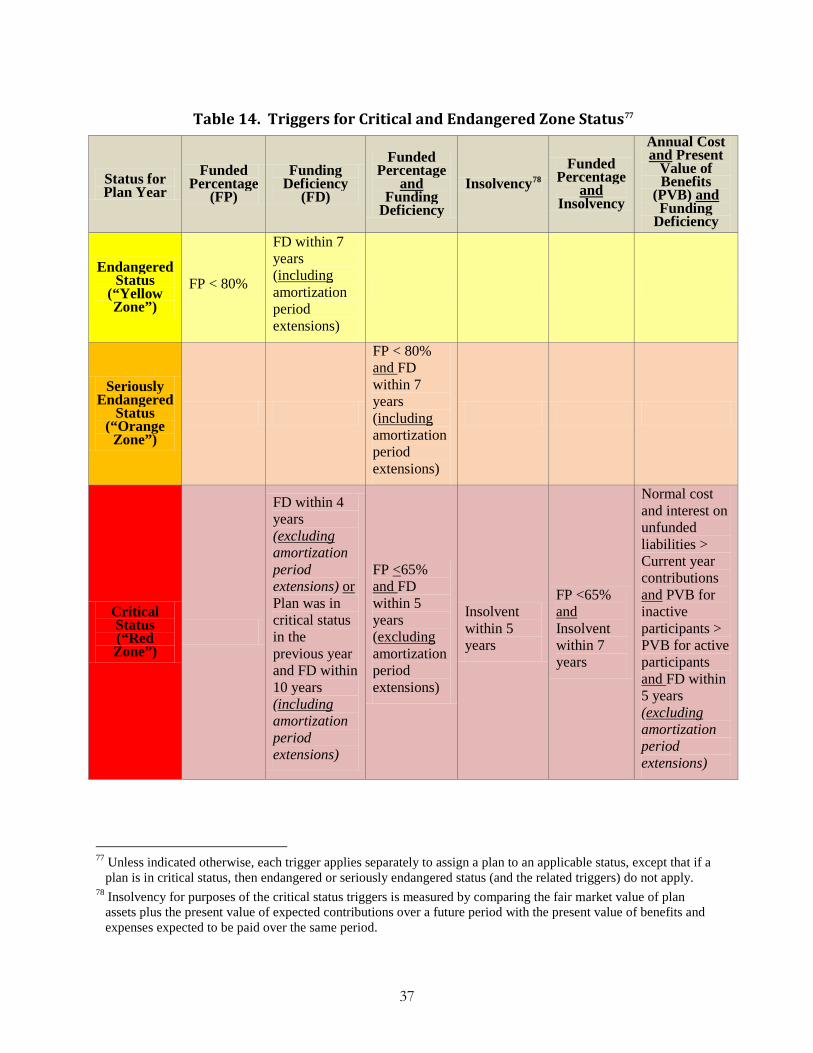
37
Table 14. Triggers for Critical and Endangered Zone Status77
Status for Plan Year
Funded Percentage
(FP)
Funding Deficiency
(FD)
Funded Percentage
and Funding
Deficiency
Insolvency78 Funded
Percentage and
Insolvency
Annual Cost and Present
Value of Benefits
(PVB) and Funding
Deficiency
Endangered Status
(“Yellow Zone”)
FP < 80%
FD within 7 years (including amortization period extensions)
Seriously Endangered
Status (“Orange
Zone”)
FP < 80% and FD within 7 years (including amortization period extensions)
Critical Status (“Red Zone”)
FD within 4 years (excluding amortization period extensions) or Plan was in critical status in the previous year and FD within 10 years (including amortization period extensions)
FP <65% and FD within 5 years (excluding amortization period extensions)
Insolvent within 5 years
FP <65% and Insolvent within 7 years
Normal cost and interest on unfunded liabilities > Current year contributions and PVB for inactive participants > PVB for active participants and FD within 5 years (excluding amortization period extensions)
77 Unless indicated otherwise, each trigger applies separately to assign a plan to an applicable status, except that if a
plan is in critical status, then endangered or seriously endangered status (and the related triggers) do not apply. 78 Insolvency for purposes of the critical status triggers is measured by comparing the fair market value of plan
assets plus the present value of expected contributions over a future period with the present value of benefits and expenses expected to be paid over the same period.
38
A plan’s “funded percentage” – one of the triggers for purposes of determining whether the plan is subject to the additional funding rules – is defined as the actuarial value of the plan’s assets divided by the plan’s accrued liability. The calculation of the plan’s accrued liability uses a single statutorily prescribed funding method, the unit credit funding method (whether or not that method is used to determine the plan’s minimum required contribution). A plan’s funded percentage is based on the asset valuation method selected by the plan for its actuarial valuation and for determining its costs. The actuarial assumptions used for the computation of funded percentage are also used in determining minimum funding requirements.
The methods used in determining the actuarial value of assets commonly involve five-year (or even longer) smoothing in recognizing investment gains and losses, which can result in asset valuations significantly above market in the aftermath of losses. In addition, plan actuaries have wide discretion in selecting interest rates for measuring plan liabilities, which, as discussed above, can have a significant effect on what the plan reports for its liabilities. In particular, the higher the rate, the lower the plan’s measured liabilities. The use of a plan’s methods and assumptions for determining funded percentage – rather than, for example, a market value of assets or a standardized interest rate for measuring plan liabilities – does not necessarily reflect the actual funded status of a plan.79 Two plans with the same market value of assets and the same future benefit payments can appear to have different funded percentages.
Nor does the use of a plan’s methods and assumptions for determining funded percentage facilitate an accurate comparison with other plans’ certified funded statuses. In the case of a plan close to the line between statuses (e.g., green and endangered or endangered and critical), the selection of the plan’s asset valuation method and interest rate may affect which side of the line the plan falls.
Determining a plan’s status also involves projections (used for determining whether the funding deficiency or insolvency tests have been triggered) as to future plan contributions and participation, which in turn involve projections of future employment in the industry or industries in which plan participants work. Projections of industry activity, including future covered employment and contribution levels, are based on information provided to the plan actuary by the plan trustees, acting reasonably and in good faith. Even under the reasonable,
79 The difference between a plan’s funded percentage and current liability percentage is often significant. In contrast
to the actuary’s selection of assumptions used to determine the plan’s actuarial accrued liability and funded percentage, plans must report current liability on the Schedule MB using the RPA ’94 interest rate (based on 30-year Treasury securities) and a specified mortality table; the average RPA ’94 interest rate for the 2009 plan year was 4.74%. For critical status plans in 2009, the average current liability percentage was 41.5%, and the average funded percentage was 71.9%. Three hundred critical status plans reported a difference of greater than 20 percentage points between their current liability percentage and funded percentage; nearly 200 critical status plans reported a difference of greater than 30 percentage points between these two funding measurements. (These averages are based on 375 critical status plans that reported a funded percentage on the 2009 Schedule MB, and 357 critical status plans that reported a current liability percentage on the 2009 Schedule MB (only plans with a current liability percentage of less than 70% are required to report the current liability percentage).) For 2009, plans other than critical status plans reported an average funded percentage of 91.0% (914 plans) and an average current liability percentage of 48.2% (859 plans).
39
good faith standard, in the case of a plan close to the line between statuses, variations in the information provided may similarly affect which side of the line the plan falls.80
Table 15 below summarizes the number of multiemployer plans in critical and endangered status for plan years 2008 through 2011, based on actuarial certifications received by IRS.81 It shows the substantial distress experienced by plans during the 2008 plan year, as first reflected in the 2009 certifications: The proportion of plans in critical status increased from 10.2% to 34.5% between 2008 and 2009, and two-thirds of all plans were in critical or endangered status in 2009. The 2010 plan year showed a marked decrease over 2009 in the number of distressed plans: critical status plans fell from 34.5% to 28.8% of all plans, and fewer than 50% of all plans were in critical or endangered status in 2010. (This translates to an 18% decline in critical status plans, a 41% decline in endangered and seriously endangered status plans, and a 57% increase in “green” status plans.) Improved market performance in 2009 may have contributed to the improvement in plans’ certified 2010 zone statuses.82
Certifications for the 2011 plan year show a continued increase in the number of “green” status plans, which represented 60% of all plans. This may give the wrong impression, however, about the extent of the actual improvement in plans’ funding condition. As explained in the section “Subsequent Funding Relief Legislation” below, PRA 2010 funding relief can have the effect of increasing a plan’s funded percentage or delaying a projected funding deficiency, which can improve a plan’s certified zone status without any real change in the plan’s funding levels. The ERISA agencies do not have data yet to separate out the effects of PRA 2010 relief from the financial health indicated in zone status certifications in both 2010 and 2011.
80 The desired outcome can also be influenced by the actions taken. In some cases, plans immediately recognized all
2008 investment losses in order to enter critical status and use the tools therein to allocate benefit reductions over more plan participants, with less stress on future accruals. Other plans in similar financial condition elected to avoid critical status by cutting future accruals and increasing contributions.
81 The total number of plan certifications is lower than the total number of plans due largely to terminated multiemployer plans that continue to pay benefits from the trust but do not file zone status certifications. As discussed above, these plans operate as wasting trusts after they terminate. While they are required to submit an annual Form 5500, they are not subject to the minimum funding requirements and do not file a Schedule MB.
82 These certifications may also, in some cases, reflect funding relief under PRA 2010 (discussed below), although many plans did not apply the relief to determine their certified zone status until 2011.
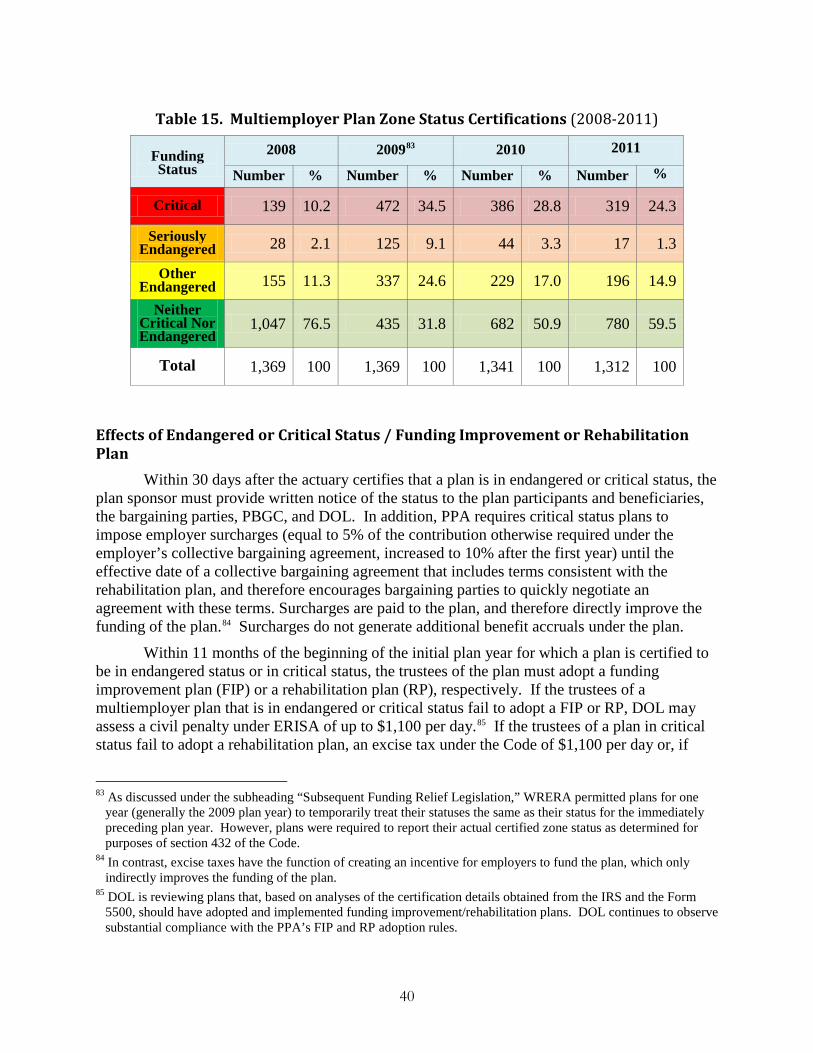
40
Table 15. Multiemployer Plan Zone Status Certifications (2008-2011)
Funding Status
2008 200983 2010 2011
Number % Number % Number % Number %
Critical 139 10.2 472 34.5 386 28.8 319 24.3
Seriously Endangered 28 2.1 125 9.1 44 3.3 17 1.3
Other Endangered 155 11.3 337 24.6 229 17.0 196 14.9
Neither Critical Nor Endangered
1,047 76.5 435 31.8 682 50.9 780 59.5
Total 1,369 100 1,369 100 1,341 100 1,312 100
Effects of Endangered or Critical Status / Funding Improvement or Rehabilitation Plan
Within 30 days after the actuary certifies that a plan is in endangered or critical status, the plan sponsor must provide written notice of the status to the plan participants and beneficiaries, the bargaining parties, PBGC, and DOL. In addition, PPA requires critical status plans to impose employer surcharges (equal to 5% of the contribution otherwise required under the employer’s collective bargaining agreement, increased to 10% after the first year) until the effective date of a collective bargaining agreement that includes terms consistent with the rehabilitation plan, and therefore encourages bargaining parties to quickly negotiate an agreement with these terms. Surcharges are paid to the plan, and therefore directly improve the funding of the plan.84 Surcharges do not generate additional benefit accruals under the plan.
Within 11 months of the beginning of the initial plan year for which a plan is certified to be in endangered status or in critical status, the trustees of the plan must adopt a funding improvement plan (FIP) or a rehabilitation plan (RP), respectively. If the trustees of a multiemployer plan that is in endangered or critical status fail to adopt a FIP or RP, DOL may assess a civil penalty under ERISA of up to $1,100 per day.85 If the trustees of a plan in critical status fail to adopt a rehabilitation plan, an excise tax under the Code of $1,100 per day or, if
83 As discussed under the subheading “Subsequent Funding Relief Legislation,” WRERA permitted plans for one
year (generally the 2009 plan year) to temporarily treat their statuses the same as their status for the immediately preceding plan year. However, plans were required to report their actual certified zone status as determined for purposes of section 432 of the Code.
84 In contrast, excise taxes have the function of creating an incentive for employers to fund the plan, which only indirectly improves the funding of the plan.
85 DOL is reviewing plans that, based on analyses of the certification details obtained from the IRS and the Form 5500, should have adopted and implemented funding improvement/rehabilitation plans. DOL continues to observe substantial compliance with the PPA’s FIP and RP adoption rules.

41
greater, five percent of the accumulated funding deficiency, also applies. Furthermore, PPA created a cause of action where a plan sponsor of a plan certified to be in endangered or critical status (1) has not adopted a FIP or RP within 240 days after the deadline for certification of endangered or critical status, or (2) fails to update or comply with the terms of the funding improvement or rehabilitation plan. In such case, a civil action may be brought under ERISA by a contributing employer or an employee organization that represents active participants, for an order compelling the plan sponsor to adopt a funding improvement or rehabilitation plan or to update or comply with the terms of the funding improvement or rehabilitation plan. To date, there is no indication that any civil actions have been brought under this provision.
A FIP or RP consists of actions that will enable the plan to achieve certain targets in improved funding, generally over a ten-year period, referred to as a funding improvement period for an endangered plan and a rehabilitation period for a critical plan.86 These long-term economic plans include various actions devised by the plan’s trustees. The trustees must provide the bargaining parties with one or more schedules that increase contribution rates and/or decrease future benefit accruals or other benefits to the extent necessary to achieve the required improvement in the plan’s funding. These schedules are generally adopted as part of the collective bargaining process.87 While the statute does not specify particular actions to be included in a FIP or RP, it specifies actions that should be considered. These include: applications for extensions of amortization periods, use of the shortfall funding method in making funding standard account computations, amendments to the plan’s benefit structure, reductions in plan expenditures (including plan mergers and consolidations), reductions in future benefit accruals, and increases in contributions. The trustees may also consider changes in the plan’s investment policy, the withdrawal liability policy, the plan’s administrative expenses, and other funding methods and assumptions.
Standards for FIPs and RPs Under PPA, the FIPs and RPs of plans in endangered, seriously endangered, and critical
status must provide for the attainment of certain minimum requirements. FIPs of endangered status plans (and certain seriously endangered plans) must be designed to achieve a one-third increase in the plans’ funded percentage and no funding deficiency (taking into account amortization extensions) over a 10-year funding improvement period. For certain seriously endangered plans, a lower target and longer period apply. RPs of critical status plans must provide for the plans to emerge from critical status over a 10-year rehabilitation period or, if the plan sponsors determine that, based on reasonable actuarial assumptions and upon exhaustion of all reasonable measures, the plans cannot reasonably be expected to emerge from critical status by that date, to emerge at a later time or forestall possible insolvency.88
86 A longer period may apply for plans electing WRERA relief and certain seriously endangered plans. In addition,
special rules apply for critical plans that cannot exit from critical status by the end of the rehabilitation period. 87 If the parties do not adopt one of the schedules within a certain period following the expiration of the collective
bargaining agreement that was in effect when the plan entered endangered or critical status, a default schedule is imposed automatically.
88 Under WRERA, plans certified to be in endangered, seriously endangered, or critical status for a plan year beginning in 2008 or 2009 could elect a three-year extension of their funding improvement or rehabilitation periods.

42
To accommodate the collective bargaining process, the beginning date of a plan’s funding improvement or rehabilitation period is deferred until the first plan year following the second anniversary of the adoption of the FIP or RP or, if earlier, the expiration of the collective bargaining agreements that are in effect on the due date for the initial certification of endangered or critical status and that cover 75 percent of participants as of that date.
A FIP or RP must set forth a projected path that a plan will take in meeting the standards for a FIP or RP. For example, in the case of a FIP, this would include a projection of the funded percentage and credit balance or deficiency for each year in the funding improvement period. A FIP or RP must also be updated each year.
Table 16 below summarizes the standards for plans in different zone statuses.
Table 16. Standards for Funding Improvement
Endangered
(and some Seriously Endangered)
Seriously Endangered89 Critical
Funding Improvement
Period/ Rehabilitation
Period
10-year period
(13 with WRERA election)
15-year period
(18 with WRERA election)
10-year period
(13 with WRERA election)
Beginning of Period
Plan year beginning after the 2nd anniversary of adoption of FIP (if earlier, expiration of CBAs covering 75% of actives as of due date for the initial endangered certification)
Same as endangered status Same as endangered status based on the adoption date of the RP
Targets for Improvement in
Funding
Reduce underfunding percentage by 33% by the end of the funding improvement period
and
Avoid funding deficiency during funding improvement period (including extensions)
Reduce underfunding percentage by 20% by the end of the funding improvement period
and
Avoid funding deficiency during funding improvement period (including extensions)
Emerge from critical status by end of rehabilitation period
or
If above standard cannot be met using all reasonable measures, use reasonable measures to emerge at a later time or to forestall possible insolvency
89 In the case of a seriously endangered plan with a funded percentage in excess of 70% as of the beginning of the
initial endangered year, this special standard applies (and continues to apply for later years) only if the plan’s actuary certifies that the plan is not projected to meet the regular standard for endangered plans.
43
Each year during the plan’s funding improvement or rehabilitation period, the plan’s actuary must certify the plan’s status and whether the plan is making the scheduled progress in meeting the requirements of its FIP or RP. For the 2011 plan year, the IRS received 319 critical status certifications: 26 plans reported they were not making the scheduled progress in meeting the requirements of their rehabilitation plans and 85 plans reported they were making the scheduled progress. There were 213 endangered and seriously endangered plans in 2011: three reported they were not making the scheduled progress in meeting the requirements of their funding improvement plans and 64 reported they were making the scheduled progress. Three hundred fifty-four (354) plans (208 critical status plans and 146 endangered and seriously endangered status plans) provided little or no information on their scheduled progress; in some cases, this may indicate that their rehabilitation periods or funding improvement periods had not yet commenced.
For many plans, it is too early to draw conclusions from the data reported to the ERISA agencies, and continued tracking of plans’ scheduled progress will be needed. PPA zone status certifications are the most recent sources of information on whether a plan is making the scheduled progress under a funding improvement or rehabilitation plan, but certifications are filed on a plan-by-plan basis only with the IRS. Other useful information for monitoring purposes would be whether a plan has exhausted all reasonable measures to emerge from critical status by the end of the rehabilitation plan period. While some of this information must be described in a plan’s rehabilitation plan, it is not required to be reported to the ERISA agencies.
Restrictions on Endangered or Critical Status Plans Plans in endangered and critical status are restricted with respect to the types of actions
they may take, the types of amendments they may adopt, and the collective bargaining agreements they may accept. Certain restrictions apply during the period beginning on the date of certification for the initial determination year and ending on the day before the first day of the funding improvement period (known as the “funding plan adoption period”) or the rehabilitation period (known as the “rehabilitation plan adoption period”). Other restrictions apply after the adoption date of the plan’s FIP or RP. See Table 17 below.
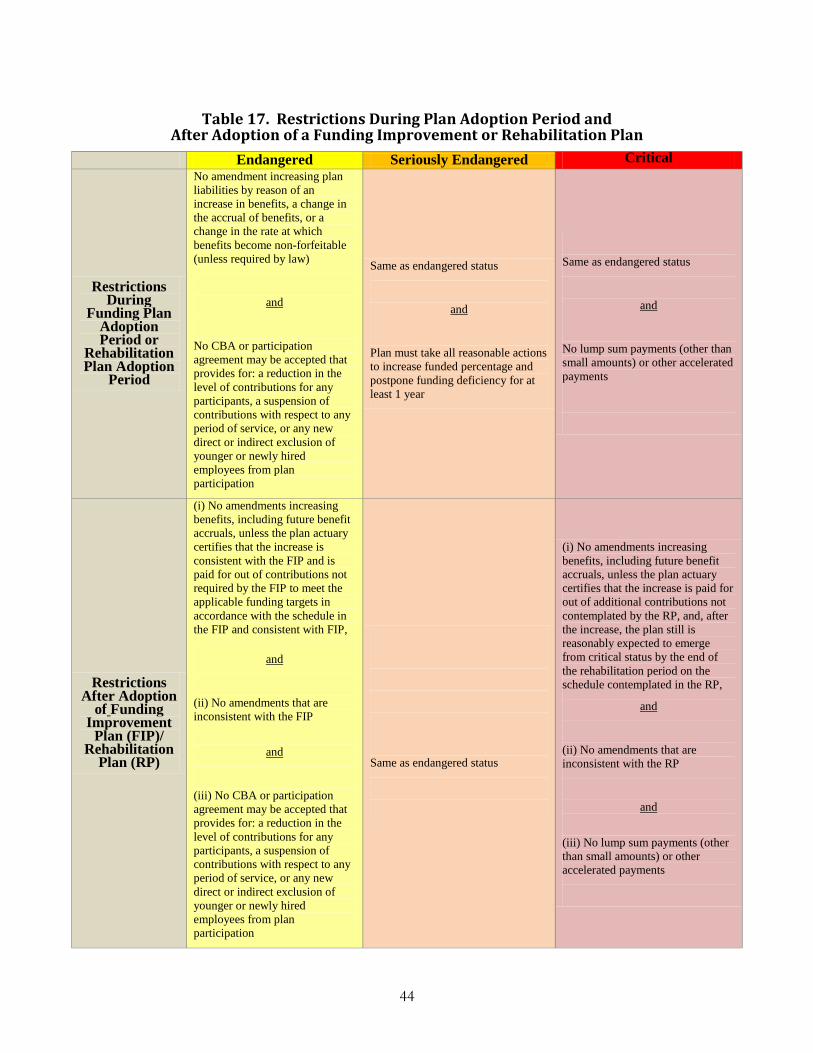
44
Table 17. Restrictions During Plan Adoption Period and After Adoption of a Funding Improvement or Rehabilitation Plan
Endangered Seriously Endangered Critical
Restrictions During
Funding Plan Adoption Period or
Rehabilitation Plan Adoption
Period
No amendment increasing plan liabilities by reason of an increase in benefits, a change in the accrual of benefits, or a change in the rate at which benefits become non-forfeitable (unless required by law)
and
No CBA or participation agreement may be accepted that provides for: a reduction in the level of contributions for any participants, a suspension of contributions with respect to any period of service, or any new direct or indirect exclusion of younger or newly hired employees from plan participation
Same as endangered status
and
Plan must take all reasonable actions to increase funded percentage and postpone funding deficiency for at least 1 year
Same as endangered status
and
No lump sum payments (other than small amounts) or other accelerated payments
Restrictions After Adoption
of Funding Improvement
Plan (FIP)/ Rehabilitation
Plan (RP)
(i) No amendments increasing benefits, including future benefit accruals, unless the plan actuary certifies that the increase is consistent with the FIP and is paid for out of contributions not required by the FIP to meet the applicable funding targets in accordance with the schedule in the FIP and consistent with FIP,
and
(ii) No amendments that are inconsistent with the FIP
and
(iii) No CBA or participation agreement may be accepted that provides for: a reduction in the level of contributions for any participants, a suspension of contributions with respect to any period of service, or any new direct or indirect exclusion of younger or newly hired employees from plan participation
Same as endangered status
(i) No amendments increasing benefits, including future benefit accruals, unless the plan actuary certifies that the increase is paid for out of additional contributions not contemplated by the RP, and, after the increase, the plan still is reasonably expected to emerge from critical status by the end of the rehabilitation period on the schedule contemplated in the RP,
and
(ii) No amendments that are inconsistent with the RP
and
(iii) No lump sum payments (other than small amounts) or other accelerated payments
45
A failure by an endangered status plan (which is not in seriously endangered status) to meet the applicable standards by the end of the funding improvement period can result in a civil penalty under ERISA of up to $1,100 per day. A plan in seriously endangered status that fails to meet the standards by the end of the funding improvement period is subject to an excise tax based on the greater of the amount of the contributions necessary to meet such standards, or the plan’s accumulated funding deficiency. An excise tax applies on this same basis in the case of a plan in critical status that fails to meet the requirements of section 432(e) of the Code by the end of the rehabilitation period or fails to make scheduled progress in meeting its requirements under the RP for three consecutive years. The IRS may waive these excise taxes based on a finding that the failure was due to reasonable cause and not to willful neglect.
Contribution Increases, Benefit Reductions, and Other Elements of FIPs and RPs Possible actions or measures for inclusion in a funding improvement or rehabilitation
plan are contribution increases and reductions in plan benefits and expenses. Extensions of amortization periods and adoption of the shortfall method may also be used to affect minimum required contributions and, thus, the plan’s zone status.
The trustees of a plan in endangered status are required to provide the bargaining parties with (i) a schedule that reflects reductions in future benefit accruals to the extent necessary to meet the targets for improvement in the plan’s funding, assuming no contribution increases (except as necessary to meet the targets once future benefit accruals have been reduced to the maximum extent permitted by law), and (ii) a schedule that increases contributions to the extent necessary to meet the targets, assuming no reductions in future benefit accruals.90 The schedule in (i) is also a “default” schedule that must be imposed by the plan’s trustees if the bargaining parties fail to adopt a schedule consistent with the plan’s FIP within 180 days after expiration of the collective bargaining agreement in effect when the plan entered endangered status. Other schedules of contributions and benefits may also be provided as options under the FIP.
Similar requirements apply with respect to schedules relating to a RP, except that only a schedule similar to (i) above is required to be provided to the bargaining parties, and such schedule may not reduce the rate of future accruals below a monthly benefit equal to 1% of contributions made with respect to a participant or, if lower, the rate in effect as of the first day of the initial critical year (this is the default schedule). However, additional schedules may reduce the rate of future accruals to zero. A RP may also include legally permissible reductions to previously earned benefits (see below).
To curtail plan costs, plans in endangered or critical status may reduce future benefits (i.e., benefits that have not yet been earned), as well as previously earned benefits that are not protected under the anti-cutback rules91 (such as certain disability or death benefits). Plans may, for example, reduce the future benefit accrual rate from 2 percent to 1 percent of contributions, or – with respect to future benefit accruals – eliminate an ongoing cost-of-living adjustment, an
90 Schedules of benefits and associated contributions must be updated annually to reflect the experience of the plan,
but the schedules in effect when the bargaining parties negotiate a collective bargaining agreement remain in effect for the duration of that collective bargaining agreement.
91 The Code and ERISA generally prohibit a reduction in accrued benefits or the accrued right to early retirement benefits, retirement-type subsidies, and optional forms of benefit.
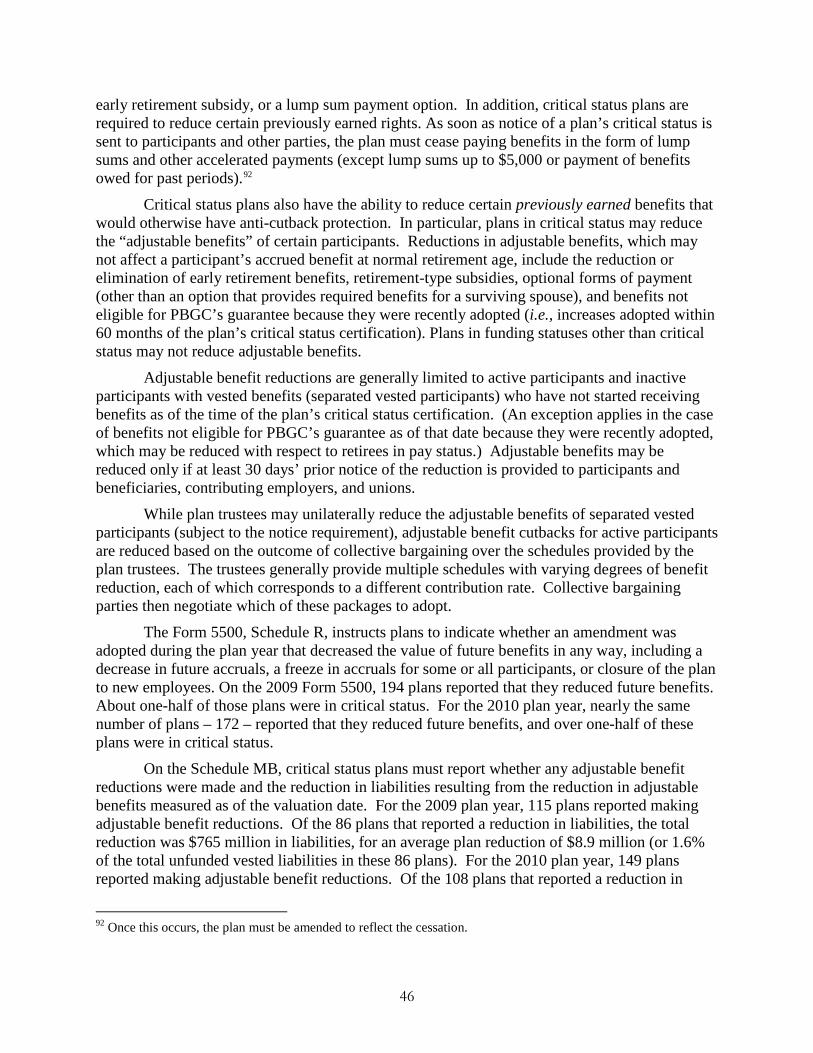
46
early retirement subsidy, or a lump sum payment option. In addition, critical status plans are required to reduce certain previously earned rights. As soon as notice of a plan’s critical status is sent to participants and other parties, the plan must cease paying benefits in the form of lump sums and other accelerated payments (except lump sums up to $5,000 or payment of benefits owed for past periods).92
Critical status plans also have the ability to reduce certain previously earned benefits that would otherwise have anti-cutback protection. In particular, plans in critical status may reduce the “adjustable benefits” of certain participants. Reductions in adjustable benefits, which may not affect a participant’s accrued benefit at normal retirement age, include the reduction or elimination of early retirement benefits, retirement-type subsidies, optional forms of payment (other than an option that provides required benefits for a surviving spouse), and benefits not eligible for PBGC’s guarantee because they were recently adopted (i.e., increases adopted within 60 months of the plan’s critical status certification). Plans in funding statuses other than critical status may not reduce adjustable benefits.
Adjustable benefit reductions are generally limited to active participants and inactive participants with vested benefits (separated vested participants) who have not started receiving benefits as of the time of the plan’s critical status certification. (An exception applies in the case of benefits not eligible for PBGC’s guarantee as of that date because they were recently adopted, which may be reduced with respect to retirees in pay status.) Adjustable benefits may be reduced only if at least 30 days’ prior notice of the reduction is provided to participants and beneficiaries, contributing employers, and unions.
While plan trustees may unilaterally reduce the adjustable benefits of separated vested participants (subject to the notice requirement), adjustable benefit cutbacks for active participants are reduced based on the outcome of collective bargaining over the schedules provided by the plan trustees. The trustees generally provide multiple schedules with varying degrees of benefit reduction, each of which corresponds to a different contribution rate. Collective bargaining parties then negotiate which of these packages to adopt.
The Form 5500, Schedule R, instructs plans to indicate whether an amendment was adopted during the plan year that decreased the value of future benefits in any way, including a decrease in future accruals, a freeze in accruals for some or all participants, or closure of the plan to new employees. On the 2009 Form 5500, 194 plans reported that they reduced future benefits. About one-half of those plans were in critical status. For the 2010 plan year, nearly the same number of plans – 172 – reported that they reduced future benefits, and over one-half of these plans were in critical status.
On the Schedule MB, critical status plans must report whether any adjustable benefit reductions were made and the reduction in liabilities resulting from the reduction in adjustable benefits measured as of the valuation date. For the 2009 plan year, 115 plans reported making adjustable benefit reductions. Of the 86 plans that reported a reduction in liabilities, the total reduction was $765 million in liabilities, for an average plan reduction of $8.9 million (or 1.6% of the total unfunded vested liabilities in these 86 plans). For the 2010 plan year, 149 plans reported making adjustable benefit reductions. Of the 108 plans that reported a reduction in
92 Once this occurs, the plan must be amended to reflect the cessation.
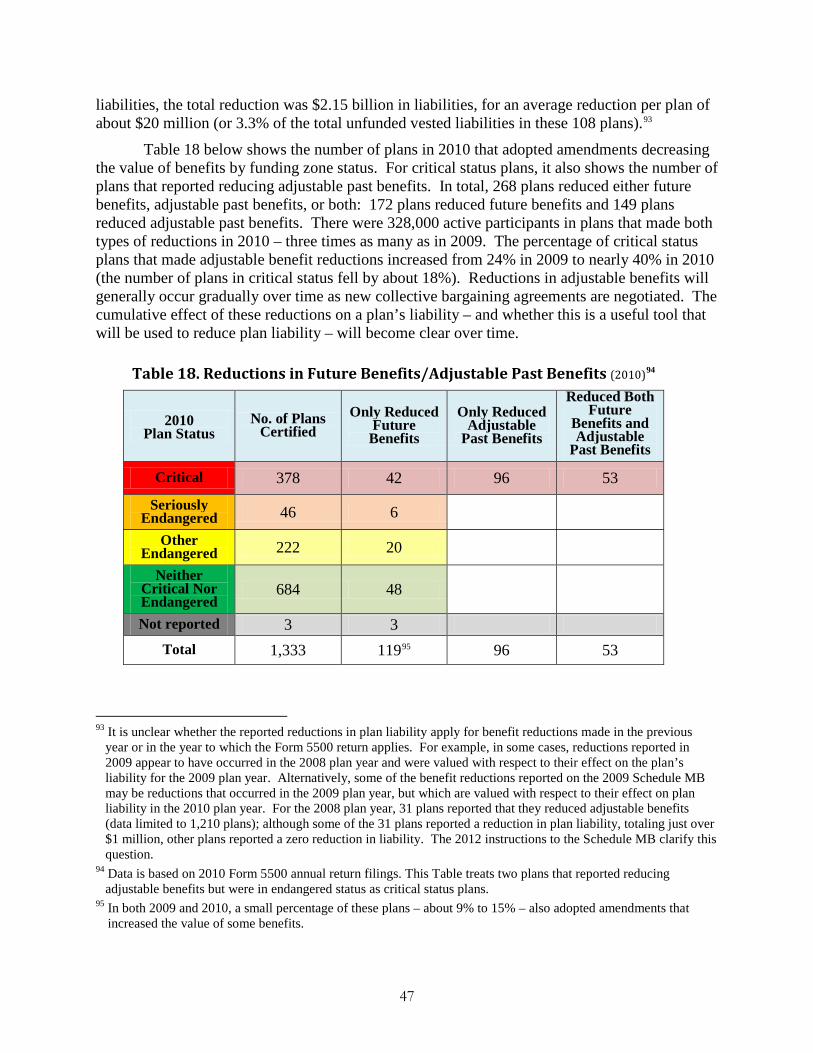
47
liabilities, the total reduction was $2.15 billion in liabilities, for an average reduction per plan of about $20 million (or 3.3% of the total unfunded vested liabilities in these 108 plans).93
Table 18 below shows the number of plans in 2010 that adopted amendments decreasing the value of benefits by funding zone status. For critical status plans, it also shows the number of plans that reported reducing adjustable past benefits. In total, 268 plans reduced either future benefits, adjustable past benefits, or both: 172 plans reduced future benefits and 149 plans reduced adjustable past benefits. There were 328,000 active participants in plans that made both types of reductions in 2010 – three times as many as in 2009. The percentage of critical status plans that made adjustable benefit reductions increased from 24% in 2009 to nearly 40% in 2010 (the number of plans in critical status fell by about 18%). Reductions in adjustable benefits will generally occur gradually over time as new collective bargaining agreements are negotiated. The cumulative effect of these reductions on a plan’s liability – and whether this is a useful tool that will be used to reduce plan liability – will become clear over time.
Table 18. Reductions in Future Benefits/Adjustable Past Benefits (2010)94
2010 Plan Status
No. of Plans Certified
Only Reduced Future Benefits
Only Reduced Adjustable
Past Benefits
Reduced Both Future
Benefits and Adjustable
Past Benefits
Critical 378 42 96 53
Seriously Endangered 46 6
Other Endangered 222 20
Neither Critical Nor Endangered
684 48
Not reported 3 3 Total 1,333 11995 96 53
93 It is unclear whether the reported reductions in plan liability apply for benefit reductions made in the previous
year or in the year to which the Form 5500 return applies. For example, in some cases, reductions reported in 2009 appear to have occurred in the 2008 plan year and were valued with respect to their effect on the plan’s liability for the 2009 plan year. Alternatively, some of the benefit reductions reported on the 2009 Schedule MB may be reductions that occurred in the 2009 plan year, but which are valued with respect to their effect on plan liability in the 2010 plan year. For the 2008 plan year, 31 plans reported that they reduced adjustable benefits (data limited to 1,210 plans); although some of the 31 plans reported a reduction in plan liability, totaling just over $1 million, other plans reported a zero reduction in liability. The 2012 instructions to the Schedule MB clarify this question.
94 Data is based on 2010 Form 5500 annual return filings. This Table treats two plans that reported reducing adjustable benefits but were in endangered status as critical status plans.
95 In both 2009 and 2010, a small percentage of these plans – about 9% to 15% – also adopted amendments that increased the value of some benefits.
48
Critical status plans often adopt RPs that call for significant increases in contribution rates, particularly under schedules that preserve the current benefit formula and all or most benefits under existing plan terms (known as “alternate” or “preferred” or “primary” schedules). Summaries of RPs in Form 5500 filings indicate that the schedules adopted by many bargaining parties require contribution rate increases of 7% or more each year for an extended period.
Employer contributions to multiemployer plans totaled about $20.0 billion for the 2009 plan year and $20.5 billion for the 2010 plan year. Average contributions per active participant climbed from $4,300 in 2008, to $4,500 in 2009, to $5,000 in 2010; the data show that contributions increased for plans in all zone statuses. Table 19 below shows average contributions per active participant by plans according to plan funding status for the 2010 plan year.
Table 19. Average Contributions by Plan Status 96 (2010)
Plan Status Contributions
Per Active
Participant
Did Not Reduce Benefits
Only Reduced Future
Benefits
Only Reduced
Adjustable Past
Benefits
Reduced Both Future
and Adjustable
Past Benefits Critical $4,000 $4,550 $5,800 $4,000 3,40097
Seriously Endangered $7,500
Other Endangered $7,600
Neither Critical Nor Endangered
$5,000
Critical status plans averaged lower contributions per active participant in 2010 than
plans in other funded statuses – about $4,000 per active participant as compared with about $5,500 per active participant. Critical status plans that did not reduce benefits in 2010 had average contributions per active participant of $4,550. In the case of critical status plans that reduced only future benefits, average contributions rose from $3,400 in 2008 to $5,800 in 2010. For critical status plans that reduced both future and past adjustable benefits in 2010, average contributions per active participant increased from $5,000 in 2008 to $5,400 in 2009, but then dropped to $2,100 in 2010 (see footnote 97).
According to representatives from the multiemployer plan community, many plans have taken significant actions to increase contributions and reduce benefits in response to the funding challenges of recent years. In some cases efforts to improve funding status have involved
96 Data based on 2010 Form 5500 annual return filings. Numbers are rounded. 97 Generally, a different set of plans reduced both types of benefits in 2010 than the set in 2009. The 2010 average
in this Table does not include two plans with unusually low contribution rates that covered 45% of all participants in 2010; by including those plans, the average contribution goes down to $2,100.
49
mergers of smaller plans into larger plans, which are expected to result in greater stability in future costs and benefits.98
Some plans in critical status have indicated, in summaries of RPs or informally, that there are natural constraints on the extent to which the bargaining parties will accept contribution rate increases and benefit reductions. In some cases, these plans contend that it would not be reasonable to require further contribution increases or benefit reductions, as that would induce employers and unions to cease bargaining for continued contributions to the plan.99 Under PPA, if the plan sponsor has determined that, based on reasonable actuarial assumptions and upon exhaustion of all reasonable measures, the plan cannot reasonably be expected to emerge from critical status by the end of the rehabilitation period (in some cases, there is a determination that the plan cannot reasonably be expected to emerge from critical status at any time), the plan sponsor is allowed to adopt a RP that will not lead to emergence from critical status by the end of the rehabilitation period. The ERISA agencies cannot easily determine whether the plan sponsor’s determination that the plan cannot reasonably be expected to emerge from critical status by the end of the rehabilitation period is appropriate and therefore are hard-pressed to determine whether a plan that adopts such a RP could have instead adopted a RP that is reasonably expected to lead to emergence by the end of the rehabilitation period.
A multiemployer plan that is in endangered or critical status is required to attach a summary of the plan’s FIP or RP, and any update, to the plan’s annual report, and to summarize the plan’s FIP or RP in the plan’s annual funding notice to participants and beneficiaries, and other parties. The ERISA agencies reviewed a sample of FIP and RP summaries submitted by plans with the 2009 Form 5500. The sample included plans of various sizes, with a slight bias towards larger plans. The sample included 14 FIP summaries and 15 RP summaries. FIP and RP summaries in the annual funding notices were examined as well, although they often provide fewer details.
In reviewing the sample, we documented what tools have been adopted by the plan’s trustees, as well as what tools are being proposed on at least one schedule being offered to the collective bargaining parties. Given that many plans are still waiting for the collective bargaining process to select a schedule, our review provides more of an indication of the tools being considered in the process rather than information on actions being adopted and implemented.
98 Some mergers involve a dominant employer participating in several plans that has an interest in consolidating the
plans and improving the funding of the remaining plan. Mergers may also help reduce administrative expenses, which can be substantially greater (on a per participant basis) in smaller plans. For 2009, in plans with fewer than 500 participants, administrative expenses per participant were 70% higher than in plans with 1,000 to 9,999 participants, and were three times as high as such expenses in plans with 10,000 or more participants. Many plans with fewer than 500 participants had average per participant administrative expenses that were four, five, and six times greater than those for large plans.
99 For example, we have heard that early retirement subsidies may be more important than the future accrual rate under the plan to active employees deciding whether to support the plan. Also, the fear of adjustable benefit reductions could push active employees to retire earlier than they otherwise would. These concerns may be more likely in plans with a large proportion of older participants, whereas plans with a greater proportion of younger participants may emphasize future accruals.
50
Approximately one-third of the FIPs project that the plan will recover on schedule, and no action was required. Of the remaining plans, virtually all are considering or have already implemented both an increase in the contribution rate and a reduction in benefits. None of the FIP summaries reviewed mention use of the amortization extension or the shortfall method.
Among the RPs reviewed, the vast majority propose for consideration, or have already implemented, an increase in the contribution rate and reductions in future benefits. Approximately a quarter of the plans mention an amortization extension, and none mention the shortfall method. The following adjustable benefits are proposed for reduction, or have already been reduced, by the vast majority of RPs reviewed: early retirement benefits, disability benefits, death benefits, as well as optional forms of payment, such as period certain guarantees and lump sums. Reductions in early retirement subsidies are proposed by about half of the RPs. A reduction in post-retirement benefit increases was not mentioned in any of the RPs reviewed.100
Administrative Issues Presented by PPA Since PPA, the ERISA agencies and members in the multiemployer plan community,
such as the American Academy of Actuaries Multiemployer Pension Plans Subcommittee, have identified a number of technical issues surrounding the operation of the PPA funding rules.
Uncertainty regarding application of sunset Section 221(c) of PPA provides that the special funding rules under section 432 of the
Code and section 305 of ERISA generally do not apply to plan years beginning after December 31, 2014. However, under section 221(c)(2) of PPA, if a multiemployer plan is operating under a FIP or RP for its last plan year beginning before January 1, 2015 it must continue to operate under that FIP or RP while the FIP or RP remains in effect and all the provisions of ERISA and the Code relating to the operation of the FIP or RP continue in effect.
The sunset raises a number of ambiguities that will need to be resolved, including the following:
• What does it mean for a multiemployer plan to be “operating under” a FIP or RP? If a plan enters endangered or critical status in the 2014 plan year, is the plan sponsor
subject to the requirement to adopt a FIP or RP before the sunset, and is the plan then considered to be “operating under” the FIP or RP for purposes of section 221(c)(2) of PPA?
If the answer to the question above is no, what actions cause a plan to be “operating under” a FIP or RP? For example, if a plan enters endangered or critical status in the 2013 plan year, is the plan “operating under” a FIP or RP even if no collective bargaining agreements have been adopted pursuant to the FIP or RP for the last plan year beginning before January 1, 2015?
100 PPA permits reductions in post-retirement adjustments only if the adjustment took effect less than 60 months
before the plan’s critical status. Plans adopted post-retirement adjustments more often before 2000, than after 2000.
51
• Which excise tax provisions “relate to the operation” of the FIP or RP and therefore remain in effect after the sunset with respect to plans operating under a FIP or RP for purposes of section 221(c)(2) of PPA?
Uncertainty regarding application of sanctions for “reasonable measures” plans Under section 432(e) of the Code, a rehabilitation plan must generally consist of actions
that would enable a multiemployer plan to emerge from critical status by the end of the rehabilitation period (generally, a 10-year period). If a plan sponsor determines that, based on reasonable actuarial assumptions and upon exhaustion of all reasonable measures, the plan cannot reasonably be expected to emerge from critical status by the end of the rehabilitation period (but can reasonably be expected to emerge after that time), the rehabilitation plan must consist of reasonable measures to enable the plan to emerge from critical status at a later time; if the plan cannot reasonably be expected to emerge from critical status at any time, the rehabilitation plan must consist of reasonable measures to forestall possible insolvency. However, while the statute recognizes that it would be unreasonable to expect these two types of plans (sometimes referred to as “reasonable measures plans”) to emerge from critical status by the end of the rehabilitation period, the statutory excise tax provisions do not provide special treatment for reasonable measures plans.
Section 4971(g)(3)(B)(ii) of the Code imposes an excise tax on a plan in critical status that “has received a certification under section 432(b)(3)(A)(ii) for three consecutive years that the plan is not making the scheduled progress in meeting the requirements of its rehabilitation plan.” Under section 432(b)(3)(A)(ii) of the Code, the requirement to certify that a multiemployer plan is making scheduled progress under its rehabilitation plan applies only in the case of a plan “which is in a . . . rehabilitation period.” Because section 432(b)(3)(A)(ii) requires a plan to certify its scheduled progress under a rehabilitation plan only for plan years during the rehabilitation period, a reasonable measures plan is not required to certify its progress after that period, even though its rehabilitation plan continues to be in effect.
Similarly, under section 4971(g)(3)(B)(i) of the Code, it is clear that a sanction applies if a plan fails to meet the requirements of section 432(e) of the Code by the end of the rehabilitation period, but it is not clear how it applies to reasonable measures plans that fail to emerge by that date.101
101 One possible interpretation would be to apply the section 4971(g)(3)(B)(i) to all plans (including reasonable
measures plans) that fail to emerge from critical status by the end of the rehabilitation period. The reference in that section to meeting the requirements of section 432(e) by the end of the rehabilitation period suggests that the relevant requirement for all plans is emergence from critical status, the only purpose under section 432(e) for which the end of the rehabilitation period is relevant. However, because section 432(e) does not require reasonable measures plans to emerge from critical status by the end of the rehabilitation period, such an interpretation would apply a sanction in the case of reasonable measures plans for failing to comply with a statutory requirement that the statute recognizes is unreasonable for them. Although the statute permits waivers in appropriate circumstances, the waiver process is uncertain and could result in significant administrative burdens.
52
Timing rules for improvements in funded status under a funding improvement plan Under current law, a multiemployer plan’s actuary must certify the plan’s status
(endangered, critical, or neither) by the 90th day of each plan year. Within 240 days of that due date, a plan that has received an initial certification of endangered status must adopt a FIP. The FIP must be formulated to provide for an increase in the plan’s funded percentage so that, as of the end of the funding improvement period, the plan’s funded percentage equals or exceeds the sum of: (i) the funded percentage as of the beginning of the funding improvement period, plus (ii) 33 percent102 of the difference between 100 percent and the plan’s funded percentage as of the beginning of the funding improvement period. The funding improvement period is the 10-year period103 that begins on the first day of the first plan year beginning after the earlier of (i) the second anniversary of the date on which the funding improvement plan is adopted, or (ii) the expiration of the collective bargaining agreements that were in effect on the due date for the plan’s initial endangered status certification and covering, as of such date, at least 75 percent of the active participants in the plan.
A FIP is designed to achieve a required increase in the multiemployer plan’s funded percentage, based on the plan’s funded percentage as of the beginning of the funding improvement period. However, the funding improvement period does not begin until after the FIP is adopted. Therefore, the FIP must use an estimate of what the funded percentage will be as of that date.
Administrative questions have been raised regarding whether the starting point for the required increase in the plan’s funded percentage should be based on the more certain funded percentage as of the plan’s initial endangered status certification, rather than an estimated funded percentage as of the date the funding improvement period begins.
Other administrative issues Groups in the multiemployer plan community have raised other administrative issues as
well:
• Whether a plan that is moving from endangered status to critical status should operate under a FIP or a RP during the period before the rehabilitation period begins.
• When is a default schedule imposed if a collective bargaining agreement expires before, rather than after, the plan enters endangered or critical status and how does the 180-day period apply.
Another interpretation regarding the application of section 4971(g)(3)(B)(i) in the case of a reasonable measures plan might involve determining whether the plan has met the requirements of section 432(e) by the end of the rehabilitation period by analyzing whether all reasonable measures have been taken to enable the multiemployer plan to emerge from critical status. However, in situations where all reasonable measures have not been taken, it would be difficult to determine the amount of the sanction, which is based in part on the “amount of contributions necessary to meet such . . . requirements.” Such an interpretation would make it more difficult to impose a sanction in the case of a reasonable measures plan, would result in disparate treatment of plans in critical status that are scheduled to emerge by the end of the rehabilitation period and those that are not (even if the plan were scheduled to emerge just one year after the rehabilitation period ends), and accordingly could create incentives for a plan to characterize itself as a reasonable measures plan.
102 For certain seriously endangered plans, 20% is substituted for 33%. 103 This period may be longer for plans that made WRERA elections and for certain seriously endangered plans.

53
• Whether a critical status plan may treat the restriction on lump sum payments as eliminating the lump sum form of payment, as opposed to simply suspending the form of payment, if such elimination is necessary for the plan to emerge from critical status.
• Whether the prohibition against a reduction in the level of contributions was intended to apply for endangered status plans but not critical status plans (after the rehabilitation plan adoption period), or whether the rules for such plans should be harmonized.
• Whether surcharges paid by employers in critical status plans should be included as part of the employer’s contribution rate for purposes of determining the annual payment withdrawal liability amount.
• How the rules for plans in reorganization status operate in interaction with the PPA rules.
Subsequent Funding Relief Legislation WRERA was signed into law on December 23, 2008, to give plans respite from the effect
of losses experienced during the 2008 stock market decline. With respect to the plan year beginning on or after October 1, 2008, and not later than September 30, 2009, plans were permitted to elect to temporarily freeze their prior plan year’s certified funding status,104 and/or to defer any updates or actions required under a FIP, RP, or schedule relating to the prior plan year.
(If the plan would have been in critical status but for the election to freeze the prior year’s status, the exemption from the excise tax for any funding deficiency continues to apply.) In addition, plans that were in endangered or critical status for a plan year beginning in 2008 or 2009 were permitted to extend any funding improvement period or rehabilitation period for an additional three years (i.e., from ten years to 13 years in the case of a plan in endangered or critical status, and 15 to 18 years in the case of a seriously endangered plan). Because multiemployer plan contributions are fixed in multi-year collective bargaining agreements, such an election bought the trustees and the bargaining parties time to increase contributions and adopt other changes needed to shore up plan assets.
The IRS received 764 WRERA elections. This represented most of the plans that were certified to be in endangered or critical status for the 2009 plan year. Of the 764 WRERA elections received, the vast majority – 638105 – were elections to freeze the prior year’s certified status (if the plan had the same status for both the election year and the prior year, the effect of that election was to defer an update of the plan’s rehabilitation or funding improvement plan for the year). About one-quarter of the elections extended the plan’s rehabilitation or funding improvement period by three years. One-half of WRERA elections were made by critical status plans, and the other half were made by endangered status and seriously endangered status plans.
104 If the prior plan year began before the plan was subject to PPA, the plan was permitted to submit an actuarial
certification of the plan’s status for the prior year in the same manner as if PPA had applied. 105 Of the 638 elections, 19 were applicable for the 2008 plan year and 619 were applicable for the 2009 plan year.

54
Table 20. WRERA Elections
Funding Status
(Certified)
Number of
WRERA Elections
Elections to Freeze Status or Defer FIP/RP
Election to Extend Funding Improvement/ Rehabilitation
Period
Both Elections
Critical 379
295
127 43
Frozen Green Status
Frozen Endangered
Status
Frozen Seriously
Endangered Status
Frozen Critical Status
Did not submit a
certification
195
32
11
47
10 Seriously
Endangered 109 102 16 9 Other
Endangered 267 232 45 10
Neither Endangered nor Critical
9106 9 0 0
Total 764 638 188 62
As shown in Table 20 above, 295 plans that were certified to be in critical status elected to freeze their prior year’s status: 195 of those plans were certified as being in “green” status, neither endangered nor critical status, for the prior plan year and 43 of those plans were certified as being in endangered or seriously endangered status for the prior plan year. Forty-seven of the plans certified to be in critical status elected to defer any updates or actions required under a rehabilitation plan, and 127 plans elected a three-year extension of the rehabilitation period.
106 Nine elections to freeze the prior year’s plan status were received from plans that reported they were neither
endangered nor critical for the plan year of the election. In some of these cases, the plan was eligible for WRERA relief but misreported the plan’s certified status for the year of election; in a few cases, elections reflected a misunderstanding of the effect of WRERA relief.
55
PRA 2010 Relief While WRERA provided short-term relief, a significant number of multiemployer plans
were still faced with increased funding obligations and the prospect of either falling into endangered or critical status or remaining in such status for a sustained period of time. In response, Congress enacted PRA 2010 in June 2010 in order to provide funding relief from the significant investment losses that occurred in and around 2008. PRA 2010 provided special funding rules that enable plans to decrease annual minimum required contributions, increase funding standard account credit balances, and improve zone statuses, which in turn alleviate pressures on contribution increases and benefit cuts under collective bargaining agreements.
Under a special amortization extension rule, plans that meet a solvency test may amortize net investment losses107 incurred during one or both plan years ending after August 31, 2008 over a 29-year period, rather than the shorter 15-year period that would otherwise apply (e.g., a plan may pay down 2008 investment losses through the plan year ending in 2037). This reduces the plan’s annual amortization charges relating to the 2008 losses (although the reduced charges continue for a longer time). One plan, for example, established an asset loss of $21.4 million during the 2008 plan year: a 15-year amortization schedule produced an annual charge of $2.3 million, but by adopting special funding relief, this charge was lowered to $1.7 million based on a 29-year schedule. Reducing a plan’s annual charges under the funding standard account has the effect of reducing the plan’s minimum required contribution. For a plan with a looming funding deficiency, the lower minimum required contribution will delay the date of that funding deficiency, which will impact the plan’s zone status under PPA.
Under a special asset valuation rule, plans that meet a solvency test may recognize investment losses incurred during one or both plan years ending after August 31, 2008, over a period of up to ten years, rather than the regular smoothing period of five years typically used by plans. By taking into account only one-tenth of the investment loss each year over 10 years, plans can spread the recognition of the huge drop in asset losses over a longer period. In addition, for purposes of smoothing, plans are permitted to use an actuarial value of assets that is as much as 30% greater than the market value of assets for one or both of the plan years beginning after August 31, 2008. Applying this rule will inflate the plan’s funded percentage for certification purposes because the actuarial value of plan assets will make the funded percentage for that plan year higher than what it otherwise would have been.
Plans have relied extensively on PRA 2010 relief. PRA 2010 required plans applying the special funding relief to give notice to participants and beneficiaries, and to PBGC. As shown in Table 21 below, PBGC received more than 700 plan notices of a decision to use the special funding rules: 556 plans used 29-year amortization of applicable losses, 587 plans used ten-year smoothing in determining the actuarial value of assets, and 358 used the 130% corridor for
107 Net investment losses are defined as the difference between the plan’s actual and expected returns (i.e., between
the market value of assets as of the end of an eligible plan year and the market value of assets as of the beginning of the eligible plan year, plus contributions less disbursements for the year, increased at the plan’s valuation interest rate).
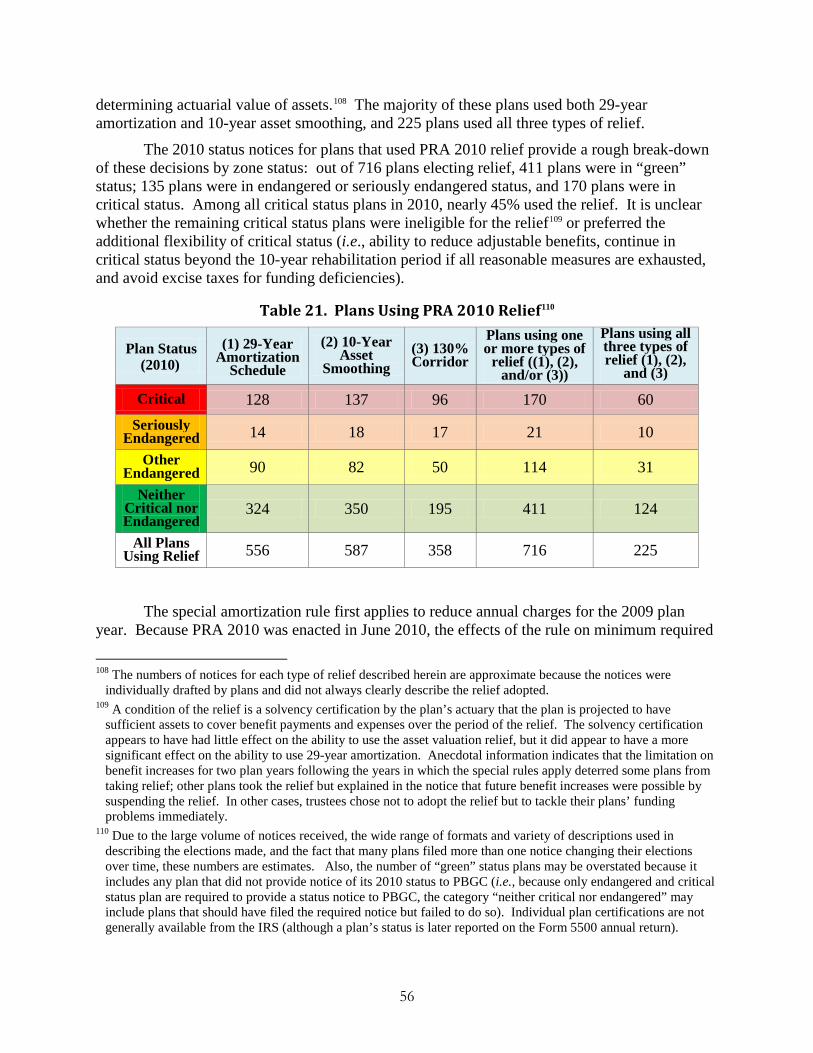
56
determining actuarial value of assets.108 The majority of these plans used both 29-year amortization and 10-year asset smoothing, and 225 plans used all three types of relief.
The 2010 status notices for plans that used PRA 2010 relief provide a rough break-down of these decisions by zone status: out of 716 plans electing relief, 411 plans were in “green” status; 135 plans were in endangered or seriously endangered status, and 170 plans were in critical status. Among all critical status plans in 2010, nearly 45% used the relief. It is unclear whether the remaining critical status plans were ineligible for the relief109 or preferred the additional flexibility of critical status (i.e., ability to reduce adjustable benefits, continue in critical status beyond the 10-year rehabilitation period if all reasonable measures are exhausted, and avoid excise taxes for funding deficiencies).
Table 21. Plans Using PRA 2010 Relief110
Plan Status (2010)
(1) 29-Year Amortization
Schedule
(2) 10-Year Asset
Smoothing (3) 130% Corridor
Plans using one or more types of
relief ((1), (2), and/or (3))
Plans using all three types of relief (1), (2),
and (3)
Critical 128 137 96 170 60 Seriously
Endangered 14 18 17 21 10
Other Endangered 90 82 50 114 31
Neither Critical nor Endangered
324 350 195 411 124
All Plans Using Relief 556 587 358 716 225
The special amortization rule first applies to reduce annual charges for the 2009 plan year. Because PRA 2010 was enacted in June 2010, the effects of the rule on minimum required
108 The numbers of notices for each type of relief described herein are approximate because the notices were
individually drafted by plans and did not always clearly describe the relief adopted. 109 A condition of the relief is a solvency certification by the plan’s actuary that the plan is projected to have
sufficient assets to cover benefit payments and expenses over the period of the relief. The solvency certification appears to have had little effect on the ability to use the asset valuation relief, but it did appear to have a more significant effect on the ability to use 29-year amortization. Anecdotal information indicates that the limitation on benefit increases for two plan years following the years in which the special rules apply deterred some plans from taking relief; other plans took the relief but explained in the notice that future benefit increases were possible by suspending the relief. In other cases, trustees chose not to adopt the relief but to tackle their plans’ funding problems immediately.
110 Due to the large volume of notices received, the wide range of formats and variety of descriptions used in describing the elections made, and the fact that many plans filed more than one notice changing their elections over time, these numbers are estimates. Also, the number of “green” status plans may be overstated because it includes any plan that did not provide notice of its 2010 status to PBGC (i.e., because only endangered and critical status plan are required to provide a status notice to PBGC, the category “neither critical nor endangered” may include plans that should have filed the required notice but failed to do so). Individual plan certifications are not generally available from the IRS (although a plan’s status is later reported on the Form 5500 annual return).
57
contributions and credit balances would first be reported in many cases on the 2010 Form 5500.111 In these 2010 filings, 666 plans reported a change in their credit balance for the 2009 plan year between the 2009 and 2010 annual reports; i.e., specifically, the aggregate credit balances of these plans increased by $2 billion – from $32.3 billion to $34.2 billion – for the 2009 plan year.112 For many of these plans, Schedule MB attachments explained the difference in the prior year’s credit balance, showing a decrease in the amortization charges and an increase in the amortization credits due to the application of PRA 2010 relief.113 On average, these plans reported a prior year increase that was 6% higher (an average increase of $2.9 million per plan) than what had been reported on the 2009 annual report.
The direct effects of the special amortization and the special asset valuation rules on plan status certifications may not be known immediately. Plans are permitted to apply the special rules in determining their zone status beginning with the 2010 plan year.114 While status certifications in 2010 and 2011 show a clear improvement in plans’ funding status (between 2009 and 2011, critical status plans dropped from more than one-third to fewer than one-quarter of all plans, and green status plans increased from nearly one-third to 60% of all plans), it is difficult to distinguish the effects of funding relief from other possible sources of funding improvement. Below are examples of the effects on zone status that many plans described in their election notices:
Endangered status plans – Notices from certain endangered and seriously endangered plans indicated that higher actuarial asset values would cause the plans to move into “green” status. For example, one plan certified as endangered for 2010, based on a funded percentage of 78%, was recertified as “green” in December 2010 based on a funded percentage of 83% after applying the special asset valuation rule.
Critical status plans – In some cases, notices from plans in critical status indicated that the plan was projected to move into “green” or endangered status due to increases in the plan’s credit balance and the number of years projected before a funding deficiency. In other cases, the notices explained that the plans remained in critical status despite the relief but were expected to emerge from critical status sooner as a result of the relief.
Green status plans – There were a large number of “green” status plans that applied one or both of the special funding rules. Notices from many of these plans explained that the relief provided a buffer against future adverse experience and made it easier to avoid endangered or critical status in future years.
111 IRS guidance provides that the effects of the special amortization rules need not be reflected in the 2009
Schedule MB, as long as the plan reflects those effects in an attachment to the 2010 Schedule MB. 112 An additional $20 billion in credit balances for the 2009 plan year is attributable to plans that did not report a
change in their 2009 credit balance on the 2010 Form 5500 annual report. 113 In some cases, the increase may be due to other sources, such as a plan merger or additional contributions not
previously reported. 114 It is not known how many plans with plan years beginning late in 2010 filed certifications that took into account
PRA 2010 relief. In addition, IRS guidance permits plans to re-certify their 2010 zone status before the end of the 2010 plan year: PBGC received 25 notices indicating the plan was recertifying its status for the 2010 plan year to take into account the special funding rules. About 23 of these re-certifications indicated that the plan moved into “green” status from endangered, seriously endangered, or critical status. Other notices described the special rules as first having an effect on the plan’s status in 2011 or later plan years.
58
Assessing the Effects of PPA on Plan Decision-Making In light of the substantial economic and market dislocations that have occurred since the
enactment of PPA, the repeated changes in legal funding requirements since enactment, and the substantial lag before plan information is reported to the ERISA agencies, one cannot draw conclusions about the effects of PPA with confidence.
Some things we do know. Many plans have since 2008 become subject to the additional funding requirements under PPA’s endangered and critical status rules, which compel the adoption of FIPs and RPs as a means toward orderly funding recovery. For the 2011 plan year, 41% of all plans were subject to these additional requirements. See Table 15. These requirements were in part responsible for the nearly 275 plans that reported reductions in future benefit accruals and/or past adjustable benefits in 2010. Disciplined increases in contributions have also been an outcome of FIPs and RPs. PPA has restricted plans in critical status (nearly 30% of all plans in 2010 and 25% of all plans in 2011) from payments of lump sums otherwise available under plan terms. It has also restricted benefit increases under plans in endangered or critical status. Many plans are beginning to report that they are making scheduled progress under the requirements of their funding improvement or rehabilitation plans. We also know that plans have widely benefitted from PPA provisions (such as automatic amortization extensions and the excise tax exemption for funding deficiencies) that helped relieve employers and participants from excessive funding pressures.
PBGC’s projection model provides additional support for the view that PPA authorities will improve future funding status for some plans. PBGC ran a series of simulations on a broad range of potential future economic scenarios to assess the effects of PPA (assuming no sunset) and funding relief enacted in 2010 on multiemployer plans. These were compared to simulations that did not include the PPA tools and authorities. There are many uncertainties about the extent to which plans will use the tools and authorities under PPA over the coming years to improve their financial standing, and about our ability to predict that use. Nonetheless, the simulations that included the PPA authorities (and funding relief in 2010) projected significantly better average 2022 funding levels, supporting the view that PPA authorities should continue to help in the future.115
115 For information on ME-PIMS, see PBGC 2012 Exposure Report.
59
Reporting and Disclosure Requirements PPA added a number of new disclosure and reporting requirements to provide a wider
dissemination of information about multiemployer plan funding. For example, the expanded disclosure requirements for the annual funding notice and the notice of endangered or critical status provide funding information to participants and beneficiaries, the bargaining parties, and the ERISA agencies. In particular, in enacting the new disclosure requirements, Congress believed that it was important that workers and retirees receive information about the funded status of their plan, including whether their pension plan was in endangered or critical status. Requiring disclosure of this information on a more timely and prominent basis was intended to make the information more useful to workers and retirees. To the extent that participants understood their benefits might be at risk, they would be motivated to bring pressure on the bargaining parties to ensure adequate plan funding.
This section describes some of the disclosure requirements added by PPA. While PPA provided for needed disclosure on plan funding, some of the required information is duplicative and some within the multiemployer community have reported that the information may cause confusion for workers and retirees.
Annual Funding Notices Effective for plan years beginning after December 31, 2004, the Pension Funding Equity
Act of 2004, P.L. 108-218 (PFEA ’04), amended ERISA to require administrators of multiemployer defined benefit pension plans to furnish an annual funding notice to each participant and beneficiary, to each labor organization representing such participants or beneficiaries, to each employer that has an obligation to contribute under the plan, and to the PBGC. PPA expanded the annual funding notice requirement for plan years beginning after December 31, 2007, to apply to both multiemployer and single-employer defined benefit pension plans, changed the information required to be provided in the notice, and shortened the time frame for furnishing the notice. For 2008 and 2009, PBGC received 1,083 and 1,000 annual funding notices from multiemployer plans.
For multiemployer defined benefit plans, the annual funding notice is required to include, among other information:
• the plan’s funded percentage on the valuation date116 of the plan year to which the notice relates (the “notice year”) and the preceding two years;
• a statement of the value of the plan’s assets and liabilities underlying each of these three funded percentages;
• a statement of the fair market value of assets on the last day of the notice year and the preceding two years;
• a description of any event that has a material effect on the plan’s liabilities or assets during the current year with a projection to the end of the year of the impact of such event on plan liabilities;
• demographic information;
116 The valuation date for virtually all of the multiemployer plan universe is the first day of the plan year.
60
• a statement of the funding policy and the asset allocation of investments (expressed as percentages of total assets) on the last day of the notice year;
• a description of the rules relating to the reorganization and insolvency of multiemployer plans under title IV of ERISA, including limits on benefit payments; and
• a description of plan benefits eligible to be guaranteed by the PBGC. If a multiemployer plan is in endangered or critical status, the funding notice must
include: a summary of the plan’s FIP or RP; a description of any updates or modifications to such FIP or RP adopted during the notice year; and an explanation of how to obtain a copy of the FIP or RP along with the actuarial and financial data that demonstrate any action taken toward fiscal improvement.
Administrators are required to furnish the annual funding notice generally within 120 days after the end of the notice year. Small plans covering 100 or fewer participants on each day during the plan year preceding the notice year have until the earlier of the date on which the Form 5500 annual report is filed or the latest date the report could be filed (with granted filing extensions).
In February 2009, DOL issued Field Assistance Bulletin (FAB) 2009-01 to provide interim guidance on the annual funding notice. Included with FAB 2009-01 was a model notice which plan administrators of multiemployer plans could use to satisfy the content requirements of the funding notice. In November 2010, DOL issued proposed regulations with new model notices. Plan administrators may use the model notices in FAB 2009-01 or in the proposed regulations until other funding notice guidance is published.117
Under section 502(c)(1) of ERISA, a plan participant or beneficiary may bring an action against a plan administrator who fails to meet the notice requirements. The court may hold the administrator personally liable to the participant or beneficiary for up to $110 per day from the date of such failure. A search of court decisions at the end of November 2012 revealed only two actions brought by participants or beneficiaries to enforce the annual funding notice requirement.118
DOL does not generally have any authority to issue penalties for failure to file the annual funding notice. However, ERISA permits DOL to obtain equitable relief from a plan administrator that fails to furnish a complete annual funding notice and permits private parties entitled to receive a funding notice to sue for the same relief.119 To date, DOL has not brought an action under ERISA to enforce the annual funding notice requirements.
Notice of Endangered or Critical Status Within 30 days after a certification of endangered or critical status, the plan sponsor must
provide written notice of the status to the plan’s participants and beneficiaries, the bargaining
117 In response to the proposed regulations, DOL received comments requesting that the final rule specifically
address the application of the funding notice requirement to multiemployer plans that had terminated by mass withdrawal.
118 See McDowell v. Price, 853 F. Supp. 2d 776 (E.D. Ark. 2012); and Legassie v. Raytheon Co. Emp. Benefits Admin. Cttee., No. CV 10-1850 ABC, 2011 WL 1296395 (C.D. Cal. Apr. 4, 2011).
119 See ERISA sections 502(a)(3), (a)(5), and (a)(8).
61
parties, the PBGC, and DOL. A notice of critical status must explain the possibility that adjustable benefits will be reduced and that such reductions may apply to participants whose benefit commencement date falls on or after the date the notice was given for the first year that the plan was in critical status. Under proposed Treasury regulations issued in March 2008, if the plan is in critical status, the notice must also advise participants that the plan is not permitted to pay lump-sums (or any other payment in excess of the monthly amount paid under a single life annuity) while it is in critical status.
DOL issued a model notice in 2008 before responsibility for the model notice was transferred to Treasury by WRERA.
Table 22 below shows submission patterns of these notices to DOL and the PBGC in 2009-2011. In general, only about 50% to 60% of the plans required to submit notices actually submitted them to both agencies. In 2009, a significant number of plans, 19%, did not submit a notice to either agency. Submission patterns improved in subsequent years, although 10% of all plans still failed to submit the required notice to either agency in 2011. Plans in critical status were slightly less likely to submit a notice to either agency than plans in endangered status. The reasons for non-compliance are unclear: they may relate to the fact that the notice is new and there are many recipients (participants and beneficiaries, the bargaining parties,120 and two ERISA agencies). Also, in 2009, many plans elected to freeze their prior year “green” status (neither endangered nor critical status) under WRERA (see “WRERA Relief” above). Although plans in green status are not generally subject to a notice requirement, WRERA required plans electing green status to provide a special notice; some plans may have overlooked the special notice.
120 Information is not available on compliance with the requirement to furnish the notices to participants and
beneficiaries, and the bargaining parties.

62
Table 22. Status Notices to DOL and PBGC
Critical or Endangered Status121
Plans sending critical status or endangered status notices (or any notice in connection
with a WRERA freeze election) to:
Plans certifying
status with IRS Both
agencies DOL only
PBGC only
Neither agency
2009
Critical 237 52 67 116 472
50% 11% 14% 25% 100%
Endangered 226 69 106 61 462
49% 15% 23% 13% 100%
Total 463 121 173 177 934
50% 13% 19% 19% 100%
2010
Critical 252 28 58 48 386
65% 7% 15% 12% 100%
Endangered 163 29 56 25 273
60% 11% 21% 9% 100%
Total 415 57 114 73 659
63% 9% 17% 11% 100%
2011
Critical 193 12 80 34 319
61% 4% 25% 11% 100%
Endangered 121 10 62 20 213
57% 5% 29% 9% 100%
Total 314 22 142 54 532
59% 4% 27% 10% 100%
Multiemployer Pension Plan Information Made Available Upon Request In response to an appeal to Congress for greater access to plan information, effective for
plan years beginning after December 31, 2007, PPA requires the administrator of a multiemployer plan to provide copies of certain actuarial and financial documents to participants,
121 Although WRERA permitted plans for one year (generally the 2009 plan year) to temporarily treat their status as
the same as their status for the immediately preceding plan year, plans were required to report their actual certified zone status.
63
beneficiaries, employee representatives and contributing employers upon written request. Under section 101(k) of ERISA and DOL final regulations issued on March 2, 2010, the following documents must be made available:
regularly recurring actuarial reports and any study, test (including a sensitivity test), document, analysis or other information (whether or not called a “report’’) prepared by the plan’s actuary that depicts alternative funding scenarios based on a range of alternative actuarial assumptions, whether or not such information is received by the plan at regularly scheduled, recurring intervals;
quarterly, semi-annual, or annual financial reports prepared for the plan by any plan investment manager, adviser or other fiduciary of the plan; and
any application filed with the Secretary of the Treasury requesting an extension of an amortization period under section 431(d) of the Code and the determination of the Secretary of the Treasury pursuant to such application.
Documents must be furnished not later than 30 days after receipt of the written request. A plan administrator is not required to furnish to any requester more than one copy of a document during any 12-month period or any actuarial or financial documents which have been in the plan’s possession for less than 30 days.
The plan administrator must delete any information from a requested document that it reasonably determines to be:
individually identifiable information regarding any participant, beneficiary, employee, contributing employer or fiduciary who is not an investment manager, adviser or other person (other than an employee of the plan) preparing a financial report for the plan; or
proprietary information regarding the plan, a contributing employer or a service provider.122
The Secretary of Labor may assess a civil penalty of not more than $1,000 a day for each violation of section 101(k) under section 502(c)(4) of ERISA. Because identifying violations of section 101(k) is complaint driven, DOL is coordinating with its regional enforcement offices of the Employee Benefits Security Administration to find and pursue plan administrators who fail to comply. As of the beginning of November 2012, DOL had not received any complaints regarding possible violations of section 101(k) and thus had not assessed a penalty for a violation of this provision.
Notice of Potential Withdrawal Liability Effective for plan years beginning after December 31, 2007, under section 101(l) of
ERISA, the plan sponsor or administrator of a multiemployer plan is required to provide to any employer having an obligation to contribute to the plan, within 180 days of a written request, notice of potential withdrawal liability. An employer is not entitled to more than one notice during any 12-month period. 122 In addition, documents in the plan’s possession for six years or more as of the date of the request need not be
provided. 29 CFR 2520.101-6(d)(2).
64
The notice is required to include:
the estimated amount of the employer’s withdrawal liability assuming such employer withdrew on the last day of the plan year preceding the date of the request; and
an explanation of how such estimated withdrawal liability was determined, including the actuarial assumptions and methods used to determine the value of the plan liabilities and assets, the data regarding employer contributions, unfunded vested benefits, annual changes in the plan’s unfunded vested benefits, and the application of any relevant limitations.
The Secretary of Labor may assess a civil penalty of not more than $1,000 a day for each violation of section 101(l) under section 502(c)(4) of ERISA. Because identifying violations of section 101(l) is complaint driven, DOL is coordinating with its regional enforcement offices of the Employee Benefits Security Administration to find and pursue plan administrators who fail to comply. As of the beginning of November 2012, DOL had not received any complaints regarding possible violations of section 101(l) and thus had not assessed a penalty for a violation of this provision.
Summary Plan Information for Employer and Employee Representatives of Multiemployer Plans
Under section 104(d) of ERISA, effective for plan years after December 31, 2007, the plan administrator of a multiemployer plan is required to provide a report containing certain summary plan information to each employee organization and each employer with an obligation to contribute to the plan within 30 days after the due date of the plan’s annual report.
The report must contain:
a description of the contribution schedules and benefit formulas under the plan, and any modification to such schedules and formulas, during such plan year;
the number of employers obligated to contribute to the plan;
a list of the employers that contributed more than 5 percent of the total contributions to the plan during such plan year;
the number of participants under the plan on whose behalf no contributions were made to the plan by an employer as an employer of the participant for such plan year and for each of the two preceding plan years;
whether the plan was in critical or endangered status for the plan year and, if so, a list of the actions taken by the plan to improve its funding status and a statement describing how to obtain a copy of the plan’s funding improvement or rehabilitation plan, as appropriate, and the actuarial and financial data that demonstrate any action taken by the plan toward fiscal improvement;
the number of employers that withdrew from the plan during the preceding plan year and the aggregate amount of withdrawal liability assessed, or estimated to be assessed, against such withdrawn employers, as reported on the annual report for the plan year;
65
if the plan has merged with another plan or if assets and liabilities have been transferred to the plan, the actuarial valuation of the assets and liabilities of each affected plan during the year preceding the effective date of the merger or transfer, based upon the most recent data available as of the day before the first day of the plan year, or other valuation method performed under standards and procedures as prescribed by regulation;
a description as to whether the plan sought or received an amortization extension or used the shortfall funding method for the plan year; and
notification of the right to obtain upon written request a copy of the annual report filed with respect to the plan and other documents.
Administrative Issues Presented by PPA
The multiemployer plan community and the ERISA agencies have raised administrative issues about the operation of certain notices and sanctions under PPA.
Funding Notices and Status Notices As explained above, PPA significantly changed the information required to be provided
in the annual funding notice for multiemployer defined benefit plans and created additional reporting and notice requirements. Some of the required information in the annual funding notice is either duplicative or could be consolidated with other notice requirements. For example, the annual funding notice requires disclosure of the plan’s endangered or critical status for the prior plan year, while the notice of endangered or critical status requires disclosure of the plan’s endangered or critical status for the current plan year. The funding notice has been described by some interest groups as too long, confusing, or not providing useful information. Information currently in the funding notice that may be better consolidated in the endangered or critical status notice includes: a summary of the FIP or RP, how to obtain a copy of the FIP/RP, actuarial and financial data that demonstrate any action taken by the plan toward fiscal improvement, a summary of the rules governing reorganization or insolvency, and a description of PBGC guarantees, including an explanation of the limitations on the guarantee.
Providing More Current Information A plan’s actuary is required to certify the plan’s status (endangered, critical, or neither)
for a plan year by the 90th day of the plan year. The zone certification is provided to the IRS and the plan sponsor. In addition, plans are required to disclose certain actuarial information in their annual report filed on Form 5500, including some of the details supporting the plan’s certification. However, the data reported on the Form 5500 is significantly out of date. For example, for a plan with a plan year that begins January 1, 2012, the results of the January 1, 2012 actuarial valuation will not be provided to the government until the Form 5500 is filed in 2013. If, as is commonly the case, the plan files for an extension, the deadline for filing this Form 5500 is October 15, 2013 (21 ½ months after the valuation date).
The ERISA agencies would have more timely access to plan information if certain actuarial information, including the details supporting a plan’s certification, were required to be included with the plan’s certification rather than the plan’s Form 5500 filing. The submission of information electronically to a database that all the ERISA agencies can readily access would
66
give DOL and PBGC faster access to the information. (The submission of certifications to the IRS requires the other ERISA agencies to go through certain procedures to obtain this information in order to satisfy statutory requirements regarding disclosure of taxpayer information.) Up-to-date information and documentation regarding certifications (e.g., cash flow projections, explanation of reasonable measures, copies of funding improvement and rehabilitation plans) would help identify plans that need assistance.
Inconsistency of Sanctions PPA imposes new sanctions with respect to multiemployer plans in endangered or critical
status. As discussed above, these include ERISA penalties and/or excise taxes for failure to timely certify the plan’s status; failure to timely adopt a funding improvement or rehabilitation plan; failure of contributing employers to timely remit contributions required by a funding improvement or rehabilitation plan; failure of a plan in critical status to make scheduled progress under its RP for three consecutive years; failure of an endangered status plan to meet the applicable funding targets by the end of a funding improvement period; and failure of a plan in critical status to meet the requirements of section 432(e) of the Code by the end of the rehabilitation period. A contributing employer or union may also file a lawsuit to compel the multiemployer plan to adopt, update, or comply with the terms of a funding improvement or rehabilitation plan.
There are other requirements and notice provisions under PPA that do not have a corresponding sanction or an adequate remedy for all affected parties.123 For example, under current law, there are no government sanctions for failure to provide the annual funding notice or the notice of endangered or critical status, even though the notices are required to be furnished to participants and beneficiaries, unions and contributing employers, the PBGC, and, in the case of the critical or endangered status notice, DOL. As discussed above, only a participant or beneficiary may bring an action for a civil penalty of up to $110 per day from the date of each failure against a plan administrator who fails to meet the annual funding notice requirement.124 There is no such penalty available for the failure to provide this notice to the employers or labor organizations that maintain the plan. The threat of a lawsuit under ERISA may not provide a sufficient enforcement mechanism because private parties may be unlikely to bring lawsuits against plans to enforce the notice and funding requirements. A claim that a plan has failed to comply with funding requirements may be difficult to detect and may have only attenuated consequences for any individual private party. Other requirements that are not backed up by any statutory sanctions include: the requirement that a plan sponsor of a plan in critical status notify contributing employers that the surcharge on contributions is in effect; the requirement that a plan sponsor provide bargaining parties with contribution and benefit schedules under a funding improvement or rehabilitation plan; and the requirement that a plan administrator provide a report of summary plan information to employee organizations or employers.
123 There is a general cause of action under section 502(a)(3) of ERISA, which authorizes a plan participant,
beneficiary, or fiduciary to bring a lawsuit to compel a plan to comply with ERISA. 124 This civil penalty does not apply to a failure to provide a notice of endangered or critical status.
67
Small Business Participation in Multiemployer Plans Most of the participating employers in multiemployer plans are small businesses.
Multiemployer plans offer small businesses a way to provide a pension plan with a minimum of administrative burden. They offer the employees of small businesses portability, a way to have an assured pension without being tied to a particular employer.
Congress directed the ERISA agencies to study: (i) the effect of multiemployer plans with funding difficulties on small businesses, and the effect of pre-and post-PPA funding rules, (ii) the effect on the financial status of small employers of funding targets under FIPs and RPs (and associated contribution increases), funding deficiencies, excise taxes, withdrawal liability, the possibility of alternative schedules and procedures for financially troubled employers, and other aspects of the multiemployer system, and (iii) the role of the multiemployer pension system in helping small employers to offer pension benefits.
There is limited information on these issues. The Federal government itself has little information on small businesses that participate in multiemployer plans.125 The ERISA agencies explored other sources: We examined available survey data, as well as information from trade associations and industry representatives.126 We consulted with both government and private sector researchers focused on small businesses. The information that was available is presented below.
The first part of this Chapter describes some of the benefits and drawbacks for small employers of participating in a multiemployer plan. It then focuses on construction industry plans because these plans are made up predominantly of small business employers, and employers’ associations can offer insights into the effect of multiemployer plan funding and operations on construction contractors. The remaining parts of this section present data compiled by the Bureau of Labor Statistics (BLS) and other sources that may be useful for commencing a discussion regarding small business participation in multiemployer plans. These include the incidence of multiemployer plans among private industry employers of different sizes and different industries, and the employer costs for retirement and savings plans generally (however, the data sources do not usually distinguish between multiemployer plans and single-employer plans for this purpose).
125 Multiemployer plans are not required to report any information to the ERISA agencies about how many of their
participating employers are small businesses. Pursuant to section 103 of ERISA, each multiemployer plan must now report annually the total number of employers obligated to contribute to the plan, and the identity of employers that contributed more than 5 percent of total contributions each year (“significant employers”). (The Form 5500 also requires the dollar amounts contributed by significant employers.) Presumably, because the burden of reporting was thought to exceed the value of the information, Congress did not require such reporting for other contributing employers. (The role of small businesses in multiemployer plans is generally limited to making contributions. The fact that small businesses do not have reporting obligations may make participation in multiemployer plans attractive to small businesses, as opposed to sponsoring their own single-employer plans.) The information that is reported is not useful for identifying small businesses participating in multiemployer plans, or evaluating the effects of multiemployer operations and requirements on the financial status of small employers.
126 Plans also often lack information on the size of contributing employers. They generally receive copies of collective bargaining agreements and contribution remittances from signatory employers, but little additional information. In some cases, separate reporting establishments operating at different sites (and perhaps contributing to different plans) may be part of a single employer.
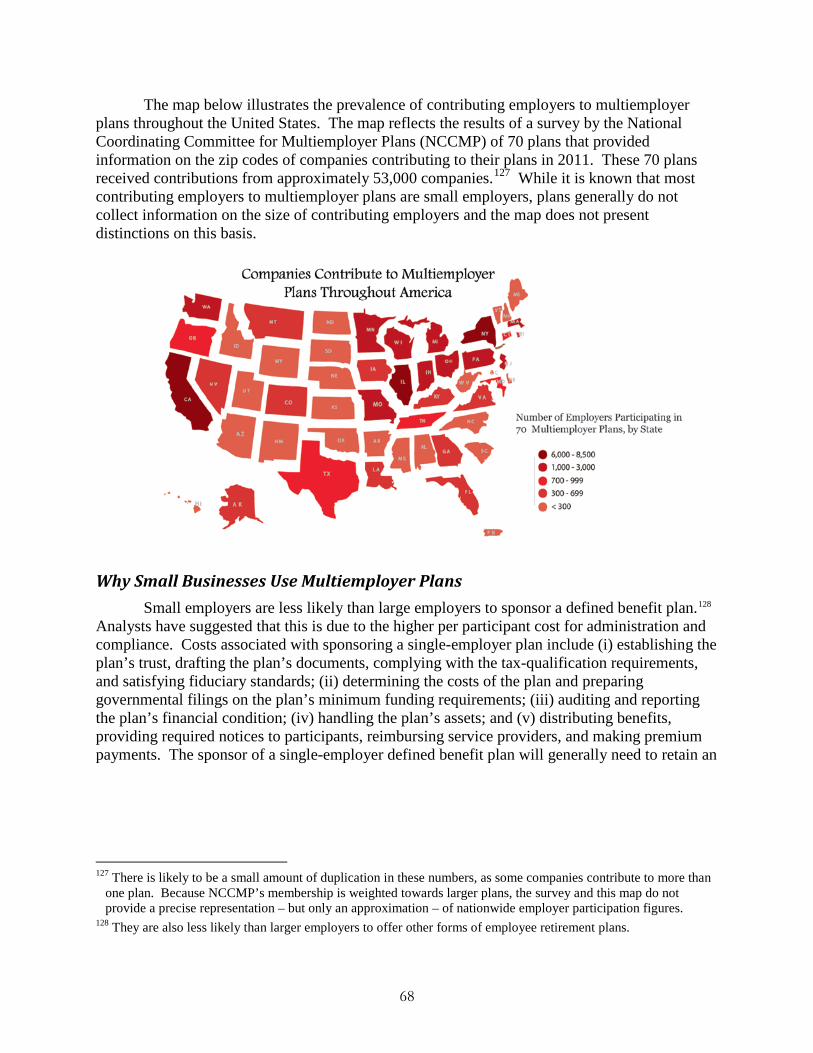
68
The map below illustrates the prevalence of contributing employers to multiemployer plans throughout the United States. The map reflects the results of a survey by the National Coordinating Committee for Multiemployer Plans (NCCMP) of 70 plans that provided information on the zip codes of companies contributing to their plans in 2011. These 70 plans received contributions from approximately 53,000 companies.127 While it is known that most contributing employers to multiemployer plans are small employers, plans generally do not collect information on the size of contributing employers and the map does not present distinctions on this basis.
Why Small Businesses Use Multiemployer Plans Small employers are less likely than large employers to sponsor a defined benefit plan.128
Analysts have suggested that this is due to the higher per participant cost for administration and compliance. Costs associated with sponsoring a single-employer plan include (i) establishing the plan’s trust, drafting the plan’s documents, complying with the tax-qualification requirements, and satisfying fiduciary standards; (ii) determining the costs of the plan and preparing governmental filings on the plan’s minimum funding requirements; (iii) auditing and reporting the plan’s financial condition; (iv) handling the plan’s assets; and (v) distributing benefits, providing required notices to participants, reimbursing service providers, and making premium payments. The sponsor of a single-employer defined benefit plan will generally need to retain an
127 There is likely to be a small amount of duplication in these numbers, as some companies contribute to more than
one plan. Because NCCMP’s membership is weighted towards larger plans, the survey and this map do not provide a precise representation – but only an approximation – of nationwide employer participation figures.
128 They are also less likely than larger employers to offer other forms of employee retirement plans.
69
attorney, actuary, independent qualified public accountant, trustee, and plan administrator to perform these functions.129
Employers participating in multiemployer plans are relieved from these responsibilities. Their role is limited to the payment of contributions to the plan, usually remitted on a monthly basis based on a unit measure, such as hours worked, in accordance with the terms of a collective bargaining contract. The plan’s board of trustees assumes responsibility for all of the plan’s administrative, fiduciary, investment, legal and accounting tasks (the operational and administrative functions are transferred to persons or firms specializing in those areas), and the costs are paid out of the plan’s assets. Economies of scale from pooling investment and administrative activities also have a lessening effect on costs, making these plans more affordable for small employers.
Also, in numerous industries, workers are employed by many employers in a locale over their working lifetimes. In the construction industry, for example, employment fluctuates on a project-by-project basis and many small employers depend on a ready supply of skilled workers for their changing needs. The administrative costs of offering pension benefits or health benefits to their employees would be prohibitive for employers in such industries in the absence of multiemployer plans.
However, small employers can be adversely affected by participating in a multiemployer plan. Generally, when a small employer participates in a multiemployer plan, it expects that its contributions will fluctuate depending on the employer’s business conditions – and, particularly, that contributions based on hours worked will decline as hours of work decline. But when a plan experiences funding difficulties, contributions may still rise – even though hours on which contributions are made have dropped. In this respect, an employer participating in a multiemployer plan may be subject to the vagaries of the economy as much as an employer sponsoring a single-employer plan. And small employers are often less able to absorb contribution rate increases than large employers in the same plan. Also, in industries where small employers bid for projects, increased costs related to their participation in multiemployer plans can put them at a competitive disadvantage against nonunion competitors.
Furthermore, small employers may have less influence than large employers over multiemployer plan operations, benefits, contributions, and investments. Large employers are more frequently represented in employer associations that negotiate master collective bargaining agreements and set contribution rates that affect all other employers. Also, large employers are more often appointed to a plan’s board of trustees that sets benefit levels and investment guidelines. Thus, small employers may give up control over factors such as benefits, contributions, and investments that could influence their costs if they sponsored a single-employer plan. In addition, because employers participating in a multiemployer plan must remit contributions monthly, small employers have less flexibility to control their cash flow than they would if they sponsored a single-employer plan.
129 Sponsors can save on administrative costs by utilizing a prototype plan (a qualified plan whose form has been
pre-approved by the IRS) offered by an insurance company, mutual fund or bank trust department. The vendor offering the prototype document may also offer other services, such as holding and investing the assets contributed to the plan, and performing record keeping and annual disclosure and reporting requirements.
70
Members of the multiemployer community also report that, despite increased disclosure requirements for plans, small employers are often unaware of the funding problems of the multiemployer plans in which they participate. Steep and unexpected contribution rate increases can appear particularly burdensome if they relate to the underfunding of benefit liabilities attributable to large employers or to orphan participants. In addition, small employers are often surprised by the presence of withdrawal liability when they are ready to close or sell their business or to retire. The cost of potential withdrawal liability – particularly if the plan’s unfunded liabilities are significant (due usually to events beyond the small employer’s control) – may discourage a prospective buyer from the purchase of a small business.
Construction Industry Plans There are nearly 3.9 million participants in construction industry multiemployer plans,130
and most contributing employers to these plans are small businesses.131 Construction industry employers in an area are often represented by an employers’ association that negotiates a collective bargaining agreement with the union on behalf of the employers in the association.132 For example, one of these employers’ associations, the Sheet Metal and Air Conditioning Contractors’ National Association (SMACNA), indicates that 80% of their members employ 20 or fewer employees, and 40% of their members employ ten or fewer employees. Their members also include some larger employers with as many as 250 to 500 employees that are engaged in larger projects, such as power plants, refineries, and big facilities.133 Through collective bargaining agreements, the members of these employers’ associations contribute to national, local, and/or regional construction industry multiemployer defined benefit pension plans; in addition, they generally contribute to multiemployer health and welfare benefit plans and, in some cases, to multiemployer defined contribution plans. Construction industry plans often have hundreds or thousands of participating employers, and may have no employers that contribute more than 5% of total contributions to the plan.
In 2009, there were 822 construction industry multiemployer defined benefit plans in the country: 66 are very large plans with 10,000 or more participants, and 51 plans cover 5,000 to 9,999 participants.134 These 117 plans with 5,000 or more participants cover 75.5% of all
130 Most construction industry workers are not, however, participants in multiemployer plans; only 14.9% of all
employees in the construction industry were represented by a union in 2011. Union Members – 2011, Bureau of Labor Statistics, Table 3. Union affiliation of employed wage and salary workers by occupation and industry.
131 According to the U.S. Census Bureau, 91% of the 712,977 construction establishments in the U.S. employ fewer than 20 employees. U.S. Census Bureau, Statistics of U.S. Businesses (last revised: January 9, 2012).
132 The employers often belong to a national contractors’ association with local chapters that negotiate collective bargaining agreements on behalf of area employers. National and local unions and plans are generally organized on a craft basis in areas such as industrial and architectural sheet metal, electrical work, heating, ventilating and air conditioning, carpentry, plumbing and pipefitting, bricklayers, boilermakers, painters, asbestos workers, cement masons, siding and decking, testing and balancing, and energy management and maintenance.
133 Employers’ associations for electrical contractors also report high percentages of small signatory contractors to multiemployer defined benefit plans. Likewise, the bulk of contractors in the mechanical construction industry (plumbers and pipefitters) are small privately-owned companies, although large firms will occasionally hire workers in an area to work on a major construction project and will contribute to the plan for the duration of the project.
134 These data are from the 2009 Form 5500 filings. 790 construction industry plans filed a Schedule MB.
71
participants in construction industry plans. On average, construction industry plans are smaller than multiemployer plans in other industries, with a mean of about 5,000 participants compared to 10,500 participants in non-construction industry plans. Construction industry plans represented nearly one-half of all multiemployer plan assets and nearly one-half of all multiemployer plan liabilities in 2009. The number of construction plans decreased slightly in 2010, to 817, but these plans continued to represent virtually one-half of the assets and liabilities in all plans.
The economic downturn has particularly hurt the construction industry, reducing significantly the hours of work on which contributions are made to multiemployer plans (a combination of both fewer active participants performing work and fewer hours of work for those working). Form 5500 filings between 2007 and 2010 show a decline in total contributing employers to construction industry plans. About 33% of the 66 very large construction industry plans were in critical status in 2009.135 In 2009, 17 critical status plans that covered 5,000 or more participants experienced an increase of 10% or more in the number of inactive vested participants, and three of these plans experienced at least a 20% decline in the number of active participants. The number of retired participants drawing benefits is growing; one national plan experienced a 30% increase in retired participants over the 2000s decade. Even under the best of circumstances, construction industry employer associations estimate that it would take 10 years or more for plans to recover from the 25%-plus market losses in 2008 and 2009.
Information provided from SMACNA indicates that, in the case of one national plan in critical status, a solid majority of collective bargaining agreements adopted an alternative “preferred schedule,” which is structured around an increase in contribution rates, rather than a default schedule, which relies more on reductions in benefits. These schedules often require contribution rate increases in the range of 7% or more per year for most of the next decade. Under this plan’s rehabilitation plan, a modest $3.00 hourly contribution rate in 2003 would be expected to increase to $8.87 by 2017 (assuming no further adjustments to the rate); for many locals, initial rates were higher. In one construction plan that was acutely affected, there was a reduction of more than 40% in the number of hours worked between the period just before the market decline in 2008 and 2011, and the hourly contribution rate was scheduled to increase from $8.40 in 2008 to $16.40 by 2014.
It is difficult to know what portion of the contribution increases required under these plans is borne by the employers as opposed to the employees. While contribution rate increases may in some cases result in an increase in total labor costs, in other cases contribution rate increases may be reallocated from other parts of the employees’ compensation package, such as contributions to a health or welfare plan or current wages.136 Over the long-term, however, there
135 Among all construction industry plans, 2009 Form 5500 data showed that 26.7% were in critical status, 9.2%
were in seriously endangered status, and 24.5% were in endangered (but not seriously endangered) status. 136 According to SMACNA, increases to wage and fringe benefit packages have declined each year since 2008; any
negotiated increases have largely gone for increased contributions to pension plans and health and welfare plans, and actual take-home wages increased very little or not at all (and in some cases may have declined). Employers’ association in the construction industry indicated that they traditionally had little or no input in the allocation of negotiated increases. Since PPA, they have increasingly included a provision in collective bargaining agreements requiring that all pension increases be paid out of the existing package and/or out of negotiated increases to ensure payment is made to the pension fund.
72
may be a limit on the extent to which pension costs may be shifted within the employee’s compensation package, leading to an increase in total labor costs.
Information from the construction multiemployer plan community also indicates that for larger contractors, demand is less price elastic than for small contractors. This means that large contractors are affected less by pension contribution increases because they can more easily pass on their labor costs to clients. In contrast, small employers, faced with more intense competition, generally cannot respond by shifting pension costs to clients, and must either reduce their employees’ wages and benefits or absorb the costs directly. Thus, employers of different sizes may have different interests within the same plan. In plans subject to FIPs and RPs, an increasing contribution burden is expected to have a disproportionate effect on small employers who operate on a thin profit margin and must maintain a positive cash-flow until completion of a construction project.137
Effect of PPA Changes Members of the multiemployer community report that small employers benefited directly
from certain PPA changes, such as the elimination of the excise tax for critical status plans’ funding deficiencies and enhanced plan disclosure requirements for employers and unions. They are also expected to benefit in the long run from a higher contribution deductibility limit.
Some analysts believe that, although small businesses do not pay a higher per-hour charge, nonetheless they may have less ability to handle increased contributions that have resulted from the economic downturn. When Congress enacted PPA, small employers may not have anticipated the onerous contribution increases and benefit reductions that came on the heels of PPA, particularly as a consequence of the economic downturn.
Although PPA requirements for FIPs and RPs led to increased contributions for small employers, they also provided funding relief that did not exist under prior law, including the automatic use of 5-year amortization extensions for certain plans, the elimination of excise taxes on employers for funding deficiencies in critical status plans, and a framework for plans to improve their funding status over an extended period of ten or fifteen years. In addition, certain plans will not have to take any steps that go beyond reasonable measures if those steps could risk the voluntary continuation of the plans by employers and unions.
Small Businesses and Incidence of Defined Benefit Multiemployer Pension Plans There is a possible correlation between employer size and the likelihood of participation
in a multiemployer plan rather than a single-employer plan. Among all workers participating in a defined benefit plan who work for companies with 1 to 99 employees, 64% are covered by a single-employer plan; this percentage increases to 86% for workers of companies with 100 or more employees.138 Presumably, multiemployer plans account for much of the remaining percentage of participants covered by a defined benefit plan. Thus, a defined benefit plan 137 Industry analysts indicate that smaller employers were slower to react to the market downturn after 2008 due to
more limited financial information, fewer loan financing possibilities, and leaner overhead costs that could not be cut as revenue and margins dropped.
138 National Compensation Survey: Health and Retirement Plan Provisions in Private Industry in the U.S., 2010 (August 2011). Table 30 - Defined benefit plans: Plan sponsor, private industry workers.
73
participant who works for an employer with fewer than 100 employees is more likely to participate in a multiemployer plan than a defined benefit plan participant who works for an employer with 100 or more employees. The data also indicate that multiemployer plans cover many lower-paid and part-time employees. A BLS survey reports that 23% of part-time workers participating in a defined benefit plan are covered by a multiemployer plan, and 26% of workers with an average wage within the lowest 25th percentile participating in a defined benefit plan are covered by a multiemployer plan.139 In addition, BLS reports that 16% of private industry workers in the construction industry participate in a defined benefit plan,140 and 99% of all such participants are covered by multiemployer plans.141
Employer Costs for Retirement and Savings Plans BLS reported that, in March 2012, 19% of private industry workers (22% for full-time)
had access to a defined benefit plan; access to a defined benefit plan was correlated with employer size, ranging from 7% for establishments with 1 to 49 workers, to 12% for establishments with 50 to 99 workers, to 21% for establishments with 100 to 499 workers, and 46% for establishments with 500 or more workers.142 Small employers spent substantially less than mid-size employers and large employers for defined benefit plans: defined benefit costs ranged from $0.23 per hour worked for small employers with 1 to 99 workers (1% of total average hourly compensation of $23.87), to $1.00 per hour worked for large employers with 500 or more workers (2.3% of total average hourly compensation of $42.39).143
In June 2012, average private industry costs for retirement and savings plans for all workers were $1.02 per hour worked (i.e., 3.5% of total average hourly compensation of $28.80). These are the costs for such plans across all employers – those that did contribute and those that did not contribute to retirement and savings plans (and across all workers, whether or not they were covered by a plan). Of this total average, the subset of costs for defined benefit plans was
139 Ibid. 140 National Compensation Survey: Employee Benefits Survey (March 2012). Table 2 - Retirement benefits:
Access, participation, and take-up rates, private industry workers. 141 Ibid. Footnote 138. 142 Ibid. Footnote 140. This source indicates that access to a defined benefit plan is also correlated with collective
bargaining status: 69% of union workers had access to a defined benefit plan, compared to only 14% of nonunion workers. ERISA permits a small number of non-union employees to participate in multiemployer plans, including owners of small businesses that came from the construction trade and previously earned a benefit in the plans to which they contribute as part of the bargaining unit, employees of the plan or an affiliated employee health or welfare plan, and employees of unions with members in the plan. Lastly, PPA permitted a one-time election of multiemployer plan status by plans sponsored primarily by international and local unions for the benefit of their officers and employees; pursuant to procedures prescribed by PBGC, 26 plans made elections.
143 Employer Costs for Employee Compensation – June 2012, Bureau of Labor Statistics (USDL-12-1830). Table 8 - Private industry workers, by establishment employment size.

74
$0.43 per hour worked (i.e., 1.5% of total average hourly compensation). The costs for defined benefit plans for union workers were higher than such costs for nonunion workers.144
Because defined benefit plan coverage varies widely in different sectors of the economy, these figures do not indicate the cost of retirement and savings plans per participating worker. They do provide an indication, though, of the relative costs of these plans across different sectors of the economy, between the union and nonunion sectors, and between small employers and larger size employers.
144 The average defined benefit plan cost for union workers is $2.11 per hour (i.e., 5.4% of total average hourly
compensation of $38.80), compared with $0.26 per hour for nonunion workers (i.e., 0.9% of total average hourly compensation of $27.76). (Employer Costs for Employee Compensation – June 2012, Bureau of Labor Statistics (USDL-12-1830). Table 5 - Private industry workers, by major occupational group and bargaining unit status.) This includes employer costs for employers that do not contribute to retirement and savings plans. Thus, the higher costs for union workers reflects the higher incidence of coverage for those workers and should not be interpreted as union plans being eight times more expensive as non-union plans. Compensation figures include full-time and part-time workers.
75
Further Steps to Strengthen Plans and Protect Pensioners The nation’s approximately 1,500 multiemployer defined benefit plans cover more than
10 million participants and beneficiaries. For decades, multiemployer plans have been an important source of retirement security, a mechanism to facilitate portability of pension benefits for millions of workers, and a useful way for small businesses to provide meaningful retirement benefits without the burdens of individual plan sponsorship.
The 2008 financial crisis and ensuing recession have had a harmful effect on the funding status of most plans, which has been exacerbated by a declining number of active participants. Data available through late 2012 indicate that a majority of participants –52%– are in moderately or severely distressed plans.145
The condition of multiemployer plans varies widely. Many plans have adjusted their income and expenses to respond to the funding challenges of the past few years and appear to be sustainable over the longer-term using the tools already provided under PPA.146 With the economic recovery may come an increase in the hours worked for which contributions are made and restoration of asset values, returning these plans to a sound financial footing.
For many other plans, however, funding levels remain depressed. These plans face sharp funding improvement requirements and have limited tools for restoring fiscal balance. The deteriorating financial condition of some critical status plans indicates that, without further changes, they will never recover and will become insolvent over time. Achieving long-term sustainability for this substantial minority of multiemployer plans is of paramount importance to the participants and contributing employers of such plans.
Participants and their families in once healthy multiemployer plans may face pension losses in the future if the financial status of their plans deteriorates further. Contribution increases negotiated by active participants are often used to fund the benefits of retired and separated vested participants, in some cases including large numbers of “orphan” participants whose employers have withdrawn from the plan. At some point, contributing employers in some plans may face a financial burden so high that they cannot continue their multiemployer contribution obligations and stay in business.
Furthermore, policymakers cannot ignore the possibility that the PBGC may be unable to meet its obligations to multiemployer beneficiaries in the future.
Stakeholders cannot ignore the danger to plans, contributing employers and participants and beneficiaries: unless steps are taken to provide additional tools for the trustees of multiemployer plans to stabilize the financial conditions of their plans, more costly and intrusive intervention may ultimately be necessary. That is a result everyone surely wants to avoid.
145 As described earlier in this report, under PPA, there are several triggers for “critical” status, including a funded
percentage of less than 65% and projected insolvency during the next 7 years, or a projected accumulated funding deficiency or insolvency within 4 years. Plans with a funded percentage of less than 80% or with a projected funding deficiency within the next 7 years are in “endangered” status; plans that have both are “seriously endangered.” Plans that are in neither endangered nor critical status are in “green” status.
146 Funding relief enacted in 2009 and 2010 has helped many plans postpone the strain of increased contributions, reduced benefits, and impending funding deficiencies.
76
In PPA, Congress gave plans in financial trouble and the bargaining parties associated with those plans significant new tools and incentives to get the plans back on a sounder financial footing. For some plans, those tools will be insufficient to do the job. Before the PPA changes sunset at the end of 2014, it is critical that all stakeholders undertake a serious effort to identify the current and potential future problems faced by multiemployer plans and to work to identify the best ways to address them.
Those efforts have already begun. The representatives of the ERISA agencies and Congressional staff are prepared to engage in ongoing discussion of these critical issues as Congress prepares to consider multiemployer funding rules in advance of the sunset of the PPA provisions.
Individuals and groups working in the multiemployer plan community, such as the National Coordinating Committee for Multiemployer Plans (NCCMP), stakeholders from the major pension funds, and the American Academy of Actuaries Multiemployer Pension Plans Subcommittee, have suggested a range of possible tools and approaches for strengthening these plans. Some of these ideas have been reflected in recent legislative initiatives; others arise from suggestions raised by constituencies in various discussions that have been held. Presently there is no consensus among the various constituencies concerning which approaches are desirable or effective.
Advances in pension policy benefit from a collaborative process among stakeholders, the Administration and Congress, to provide trustees, employers, and unions the tools to deal with the financial and other challenges they face. Ultimately such an approach can restore fiscal stability to multiemployer plans and the thousands of small and large businesses and millions of workers and retirees that depend on them.

77
Limitations of This Report Since the PPA was enacted and its funding provisions took effect, there have been
significant unforeseen changes to the economy and to financial markets. Some of the requirements for improving funding under PPA were modified by subsequent funding relief legislation due to the stock market downturn of 2008.
The ability of plans to defer actions that would normally have been required under PPA for 2009 has delayed the implementation of PPA. While this report includes information about the numbers of plans that applied for funding relief under WRERA and PRA 2010 and the possible impact on some PPA provisions, information on the actual effects of this relief on plans will generally not be available to the ERISA agencies until later years. This is because the data available to the ERISA agencies provide only preliminary indication of how plans are responding to the new rules: most of the data for this report is drawn from the 2010 Form 5500 series annual report filings (the last plan year for which we have complete data for all plans).147 Thus, plans that entered endangered or critical status for the first time in the 2008 or 2009 plan year were only beginning to implement actions to improve their funding status.
For example, many of the tools available to plans in endangered and critical status – such as contribution increases and reductions in future accruals (and reductions in adjustable benefits in the case of critical status plans) – are subject generally to collective bargaining over schedules provided by the plans’ boards of trustees. Due to multiple-year collective bargaining agreements, the outcome of such bargaining – i.e., the extent to which these tools will be employed – will not be known for several years to come when new collective bargaining agreements are entered into. The effects of those changes on the operation and status of plans will be reported in future Form 5500 filings. However, to the extent that PPA provisions were implemented in 2009 or 2010 – e.g., plans used the 5-year automatic amortization extension extensively following the market downturn – they are reported here.
Because multiemployer plans are not required to report any information to the ERISA agencies about many of their participating employers that are small businesses (and very little about any participating employers other than significant contributors), the report provides only general information on this subject. The ERISA agencies consulted with both government and private sector researchers working with small business issues, but found many of these avenues of investigation unfruitful with respect to the questions posed by section 221(a) of PPA. In lieu of more precise information, this report gathers data from trade associations and industry representatives, as well as available data from the National Compensation Survey of DOL’s Bureau of Labor Statistics. Additional information about participating employers would be useful to inform future analysis and understanding of the issues affecting multiemployer plans.
147 Many plans file the Form 5500 as late as nine and one-half (9½) months after the end of the plan year (making
use of a 2½ month extension under the law). For example, for a plan with a plan year that begins January 1, 2009, the extended deadline for filing the Form 5500 is October 15, 2010; in addition, much of the data reported relates to the plan’s status as of January 1, 2009. Similarly, for a plan with a plan year that begins December 1, 2010, the extended deadline for filing the Form 5500 is September 15, 2012, with data generally reported as of December 1, 2010. Limited supplemental data for more recent periods include funding status certifications submitted by plans to the IRS for the 2008 through 2011 plan years.
78
Acknowledgements This report represents the efforts of many individuals from many Federal agencies. The
analysis and discussion were undertaken by an interagency working group composed of career Federal staff from the Department of Labor, the Pension Benefit Guaranty Corporation, and the Department of the Treasury. From the Department of the Treasury: Harlan Weller, Linda Marshall, Jamie Dvoretzky, William Evans, Yaguo Zhang, Diane Bloom, Steven Klubock; from the PBGC: John Thompson, Marc Ness, Bruce Perlin, Eric Field, William James, James Bloch, Gail Sevin; from the Department of Labor: career staff from the Employee Benefits Security Administration. The Form 5500 data for the report were generally assembled by the Policy Research and Analysis Department and the Multiemployer Program Division, at PBGC, with input from the IRS/Department of the Treasury and the Department of Labor. Data from other sources were compiled by staff of the Department of Labor and the IRS/Department of the Treasury. The principal drafter of the report was Constance Markakis, attorney in the Legislative Department of PBGC.
The working group consulted extensively with individuals and organizations outside government that have an interest in multiemployer plans and retirement security generally. These include, but are not limited to, the National Coordinating Committee for Multiemployer Plans (NCCMP), the American Academy of Actuaries Multiemployer Pension Plans Subcommittee, and the Sheet Metal and Air Conditioning Contractors’ National Association (SMACNA). Of course, these organizations are not responsible for the information contained in the report.