Embed Size (px)
Citation preview
1
Evaluating Recycling Efficiency of Asphalt Plants
Submitted to the Tennessee Department of Transportation
Research Development and Technology Program
Baoshan Huang, Ph.D., P.E.
Xiang Shu, Ph.D.
Yongjie Ding, Ph.D.
Department of Civil and Environmental Engineering
The University of Tennessee, Knoxville
August 2019
2
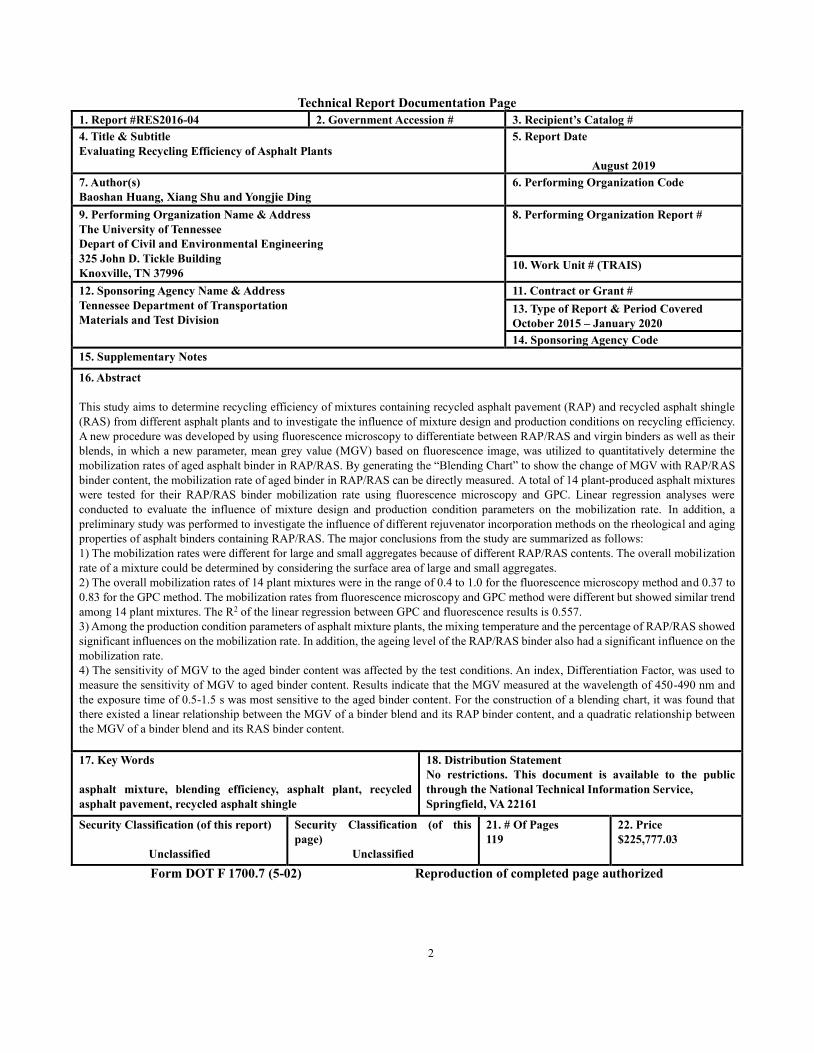
Technical Report Documentation Page
1. Report #RES2016-04 2. Government Accession # 3. Recipient’s Catalog #
4. Title & Subtitle
Evaluating Recycling Efficiency of Asphalt Plants
5. Report Date
August 2019
7. Author(s)
Baoshan Huang, Xiang Shu and Yongjie Ding
6. Performing Organization Code
9. Performing Organization Name & Address
The University of Tennessee
Depart of Civil and Environmental Engineering
325 John D. Tickle Building
Knoxville, TN 37996
8. Performing Organization Report #
10. Work Unit # (TRAIS)
12. Sponsoring Agency Name & Address
Tennessee Department of Transportation
Materials and Test Division
11. Contract or Grant #
13. Type of Report & Period Covered
October 2015 – January 2020
14. Sponsoring Agency Code
15. Supplementary Notes
16. Abstract
This study aims to determine recycling efficiency of mixtures containing recycled asphalt pavement (RAP) and recycled asphalt shingle
(RAS) from different asphalt plants and to investigate the influence of mixture design and production conditions on recycling efficiency.
A new procedure was developed by using fluorescence microscopy to differentiate between RAP/RAS and virgin binders as well as their
blends, in which a new parameter, mean grey value (MGV) based on fluorescence image, was utilized to quantitatively determine the
mobilization rates of aged asphalt binder in RAP/RAS. By generating the “Blending Chart” to show the change of MGV with RAP/RAS
binder content, the mobilization rate of aged binder in RAP/RAS can be directly measured. A total of 14 plant-produced asphalt mixtures
were tested for their RAP/RAS binder mobilization rate using fluorescence microscopy and GPC. Linear regression analyses were
conducted to evaluate the influence of mixture design and production condition parameters on the mobilization rate. In addition, a
preliminary study was performed to investigate the influence of different rejuvenator incorporation methods on the rheological and aging
properties of asphalt binders containing RAP/RAS. The major conclusions from the study are summarized as follows:
1) The mobilization rates were different for large and small aggregates because of different RAP/RAS contents. The overall mobilization
rate of a mixture could be determined by considering the surface area of large and small aggregates.
2) The overall mobilization rates of 14 plant mixtures were in the range of 0.4 to 1.0 for the fluorescence microscopy method and 0.37 to
0.83 for the GPC method. The mobilization rates from fluorescence microscopy and GPC method were different but showed similar trend
among 14 plant mixtures. The R2 of the linear regression between GPC and fluorescence results is 0.557.
3) Among the production condition parameters of asphalt mixture plants, the mixing temperature and the percentage of RAP/RAS showed
significant influences on the mobilization rate. In addition, the ageing level of the RAP/RAS binder also had a significant influence on the
mobilization rate.
4) The sensitivity of MGV to the aged binder content was affected by the test conditions. An index, Differentiation Factor, was used to
measure the sensitivity of MGV to aged binder content. Results indicate that the MGV measured at the wavelength of 450-490 nm and
the exposure time of 0.5-1.5 s was most sensitive to the aged binder content. For the construction of a blending chart, it was found that
there existed a linear relationship between the MGV of a binder blend and its RAP binder content, and a quadratic relationship between
the MGV of a binder blend and its RAS binder content.
17. Key Words
asphalt mixture, blending efficiency, asphalt plant, recycled
asphalt pavement, recycled asphalt shingle
18. Distribution Statement
No restrictions. This document is available to the public
through the National Technical Information Service,
Springfield, VA 22161
Security Classification (of this report)
Unclassified
Security Classification (of this
page)
Unclassified
21. # Of Pages
119
22. Price
$225,777.03
Form DOT F 1700.7 (5-02) Reproduction of completed page authorized

iii
DISCLAIMER This research was funded through the State Research and Planning (SPR) Program by the Tennessee
Department of Transportation and the Federal Highway Administration under RES #: 2016-04,
Research Project Title: Evaluating Recycling Efficiency of Asphalt Plants.
This document is disseminated under the sponsorship of the Tennessee Department of Transportation
and the United States Department of Transportation in the interest of information exchange. The State
of Tennessee and the United States Government assume no liability of its contents or use thereof.
The contents of this report reflect the views of the author(s) who are solely responsible for the facts and
accuracy of the material presented. The contents do not necessarily reflect the official views of the
Tennessee Department of Transportation or the United States Department of Transportation.
iv
Acknowledgements
We would like to begin by thanking the Tennessee Department of Transportation
(TDOT) for funding this research project. In this research, we have continued to collaborate
closely with regional engineers and local technicians at the TDOT Materials and Test
Division and local asphalt plants. They have provided valuable support towards the
fulfillment of the research objectives. Without their support, it would be impossible for us
to finish this research project. We would also like to thank the administrative staff from the
TDOT research office who have worked closely with our research team and kept the whole
project on the proposed schedule.

v
Executive Summary
The current trend in the paving industry is to increase the use of recycled asphalt
pavement (RAP) and recycled asphalt shingle (RAS). However, one of the reasons that
limit higher recycled content is the unknown blending process between virgin and
RAP/RAS binders. The Tennessee Department of Transportation (TDOT) Materials and
Tests Division has been collaborating with the University of Tennessee to investigate the
recycling efficiency of asphalt mixtures containing RAP/RAS, with an aim to address the
recycling efficiency of recycled asphalt mixtures from different asphalt plants in Tennessee.
The recycling efficiency in this study was quantified through the blending efficiency
developed in previous studies. The findings from this study will help maximize the use of
RAP/RAS in asphalt mixtures and enhance the properties and performance of the mixtures
containing RAP/RAS. The major research activities are summarized as follows:
1) A series of studies were conducted to evaluate the blending efficiency in asphalt
plant mixtures containing RAP and RAS. A new method was developed using
fluorescence microscopy to differentiate between RAP/RAS and virgin binders as
well as their blends, in which a new parameter, mean grey value (MGV) based on
fluorescence image, was utilized to quantitatively determine the mobilization rates
of aged asphalt binder in RAP/RAS. By generating the “Blending Chart” to show
the change of MGV corresponding to RAP/RAS binder content, the mobilization
rate of aged binder in RAP/RAS can be directly measured.
2) A total of 14 plant-produced asphalt mixtures were tested for their RAP/RAS binder
mobilization rate using fluorescence microscopy and Gel Permeation
Chromatography (GPC). Linear regression analyses were conducted to evaluate the
influence of mixture design and production condition parameters on the
mobilization rate.
vi
3) In addition, a preliminary study was performed to investigate the influence of
different rejuvenator incorporation methods on the rheological and aging properties
of the recycled asphalt binders.
Based on the results of the study, the following conclusions can be drawn:
1) The mobilization rates were different for large and small aggregates because of
different RAP/RAS contents. The overall mobilization rate of a mixture could be
determined by considering the surface area of large and small aggregates.
2) The overall mobilization rates of 14 plant mixtures were in the range of 0.4 to 1.0
for the fluorescence microscopy method and 0.37 to 0.83 for the GPC method.
3) The sensitivity of MGV to the aged binder content was affected by the test
conditions. An index, Differentiation Factor, was used to measure the sensitivity
of MGV to aged binder content. Results indicated that the MGV measured at the
wavelength of 450-490 nm and the exposure time of 0.5-1.5 s was most sensitive
to the aged binder content.
4) For the construction of a blending chart, it was found that there existed a linear
relationship between the MGV of a binder blend and its RAP binder content, and
a quadratic relationship between the MGV of a binder blend and its RAS binder
content. Therefore, the relationship between MGV and the aged binder content of
a binder blend could be different for asphalt from diverse sources.
5) The mobilization rates from fluorescence microscopy and GPC method were
different but showed a similar trend among the fourteen plant mixtures, which is
due to the fact that the fluorescence microscopy method tests the aged asphalt
content on the aggregate surface, whereas the GPC method tests the aged asphalt
content of the outer layer of asphalt film.
6) According to the large molecules content (LMS (%)) results from the GPC tests,
the mobilization rates for the inner layer and the outer layer were different,

vii
indicating that only a part of the aged binder in the RAP/RAS was mobilized in the
mixtures.
7) Among the production condition parameters of asphalt mixture plants, the mixing
temperature and the percentage of RAP/RAS showed significant influences on the
mobilization rate. In addition, the aging level of the RAP/RAS binder also had a
significant influence on the mobilization rate. In general, a higher mixing
temperature and less percentage of RAP/RAS may promote the mobilization rate,
whereas a higher aging level of the RAP/RAS binder may decrease the
mobilization rate.
8) By incorporating the rejuvenator with the aged binder first, the binder blends
showed a more beneficial change in rheological properties compared to the one
incorporating the rejuvenator with the virgin binder first, indicated by a lower
complex modulus and a higher phase angle of the binder blends.
viii
Table of Contents
Chapter 1 INTRODUCTION .............................................................................................. 1
1.1 Problem Statement ................................................................................................ 1
1.2 Objectives ............................................................................................................. 2
1.3 Scope of Study ...................................................................................................... 3
1.4 Overview of the Final Report ............................................................................... 3
Chapter 2 LITERATURE REVIEW ................................................................................... 4
2.1 Introduction of Recycling Efficiency .................................................................... 4
2.2 Recycling Efficiency for Asphalt Plants ............................................................... 5
2.3 Methods for Determining Recycling Efficiency ................................................... 6
2.4 Fluorescence of Asphalt ........................................................................................ 9
Chapter 3 DOTs SURVEY ................................................................................................. 11
3.1 DOT Survey ......................................................................................................... 11
3.2 Responses to the Survey ..................................................................................... 12
3.2.1 Responses to the RAP application ................................................ 12
3.2.2 Responses to the RAS application ................................................ 17
3.2.3 Responses to the RAP/RAS blending efficiency .......................... 20
3.3 Conclusions ......................................................................................................... 22
Chapter 4 METHODOLOGY FOR FLUORESCENCE MICROSCOPY METHOD ..... 24
4.1 Introduction ......................................................................................................... 24
4.2 Methodology of Fluorescence Microscopy Method ........................................... 25
4.2.1 Fluorescence intensity measurement ............................................ 25
4.2.2 Determination of rap binder blending efficiency .......................... 27
4.2.3 Building a blending chart in terms of MGV ................................. 30
4.2.4 RAP binder mobilization of a mixture .......................................... 30
Chapter 5 VALIDATING THE BLENDING EFFICIENCY TEST BY USING LAB AND
PLANT MIXTURES ........................................................................................................ 32
5.1 Lab and Plant Materials ...................................................................................... 32
5.1.1 Lab asphalt and mixtures .............................................................. 32
5.1.2 Plant mixtures ............................................................................... 35
5.2 Results and Discussions ...................................................................................... 36
5.2.1 Influence of test conditions on MGV ............................................ 36
5.2.2 MGV of virgin and aged asphalt ................................................... 38
5.2.3 Blending chart ............................................................................... 39
5.2.4 Determination of RAP binder blending efficiency for lab mixtures

ix
................................................................................................................ 40
5.2.5 Blending Efficiency of Plant Mixtures ......................................... 41
5.2.6 Discussions ................................................................................... 43
5.3 Conclusions ......................................................................................................... 45
Chapter 6 BLENDING EFFICIENCY OF PLANT MIXTURES .................................... 46
6.1 Plant Mixtures ..................................................................................................... 46
6.2 Laboratory Testing Procedures ........................................................................... 48
6.2.1 Procedure for determining blending efficiency ............................ 48
6.2.2 Fluorescence microscopy .............................................................. 49
6.2.3 Gel Permeation Chromatography (GPC) ...................................... 50
6.2.4 Mobilization rate of a mixture ...................................................... 52
6.2.5 Multiple Regression ...................................................................... 52
6.3 Results and Discussions ...................................................................................... 52
6.3.1 Mobilization rate of fluorescence microscopy and GPC method . 52
6.3.2 Mobilization rates for the inner and outer layers using GPC method
................................................................................................................ 54
6.3.3 Correlation between GPC and fluorescence results ...................... 55
6.3.4 Regression analysis on production condition ............................... 56
6.3.5 Discussions ................................................................................... 57
6.4 Conclusions ......................................................................................................... 59
Chapter 7 UTILIZING MECHANICAL PROPERTY METHOD TO INVESTIGATE
THE INFLUENCE OF REJUVENATOR ........................................................................ 61
7.1 Introduction ......................................................................................................... 61
7.2 Sample Preparation and Experiment Methods .................................................... 64
7.2.1 Raw materials ................................................................................ 64
7.2.2 Sample preparation ....................................................................... 64
7.2.3 Experiment method ....................................................................... 66
7.3 Results and analysis ............................................................................................ 67
7.3.1 Master curves for the unaged binders ........................................... 67
7.3.2 Rutting and fatigue resistance ....................................................... 71
7.3.3 Aging properties ............................................................................ 74
7.4 Discussions ......................................................................................................... 77
7.5 Conclusions ......................................................................................................... 79
Chapter 8 CONCLUSIONS AND RECOMMENDATIONS ........................................... 81
REFERENCES ................................................................................................................. 85
APPENDICES A: Survey Questions ................................................................................ 91
APPENDIX B: GPC Chromatograms of Test ................................................................... 97
APPENDIX C: Fluorescent image of Test ....................................................................... 118
x
List of Tables
Table 3-1. States response to the survey ................................................................ 12
Table 4-1. Example of mobilization rate calculation ........................................... 29
Table 5-1. Gradation of the aggregates used in the mixtures .............................. 35
Table 6-1. Mix design information of mixtures .................................................... 47
Table 6-2. Information of mixture production ................................................... 47
Table 6-3. Multiple regression of mobilization rate with design and production
parameters ....................................................................................................... 57
Table 6-4. Linear regression of mobilization rate with LMS and RAP content 58
Table 7-1. Typical properties of the rejuvenator used. ........................................ 64
Table 7-2. Binder blends and conditioning methods. ........................................... 65
Table 7-3. LMS (%) and mass changes during the aging process. ..................... 77
xi
List of Figures
Figure 3-1 The distribution of respondents ................................................................ 11
Figure 3-2 Percent of the aged asphalt binder on RAP that can be used .................. 13
Figure 3-3 Percent in state specification ................................................................... 14
Figure 3-4 Percent of aged asphalt binder on RAP can be used ............................... 15
Figure 3-5 Tools used to test the blending efficiency ............................................... 16
Figure 3-6 Efficacy of rejuvenator in RAP ............................................................... 16
Figure 3-7 Percent of reusable RAS binder .............................................................. 17
Figure 3-8 Rationality of state specification ............................................................. 18
Figure 3-9 Concerns about the current percentage in state specification ................. 18
Figure 3-10 Tools used to test the blending efficiency ............................................. 19
Figure 3-11 Efficacy of rejuvenator in RAS ............................................................. 20
Figure 3-12 Key factors for the blending efficiency ................................................. 21
Figure 3-13 Influence of high percentage on service life of pavement .................... 21
Figure 3-14 Linear blending charts ........................................................................... 22
Figure 4-1 The main steps of the test method ........................................................... 25
Figure 4-2 Fluorescence images of virgin and aged asphalt samples ....................... 26
Figure 4-3 Blending process between virgin and aged binder (a) aged asphalt on the
top of virgin asphalt; (b) binder blend stirred for 30 s; (c) binder blend stirred for
2 mins; (d) binder blend stirred for 5 mins ....................................................... 27
Figure 4-4 Partial blending scenario ...................................................................... 28
Figure 5-1 Asphalt mixture producing and test process (a) Glass cullet; (b) RAP; (c)
Virgin asphalt; (d) Virgin aggregate; (e) Asphalt mixture; (f) Glass cullet tested
by the fluorescence microscopy ........................................................................ 34
Figure 5-2 Particle size distribution curve of aggregate ........................................... 34

xii
Figure 5-3 Proportions of large and small aggregates by mass ................................ 36
Figure 5-4 MGVs of virgin and aged asphalt as a function of exposure time .......... 37
Figure 5-5 MGV ratios of aged and virgin binder at different conditions ................ 38
Figure 5-6 MGV of virgin and aged SHRP asphalt .................................................. 39
Figure 5-7 Blending chart generated with MGV ...................................................... 40
Figure 5-8 Test results of binder blends (a) Mean grey value (b) RAP binder content
(c)Mobilization rate .......................................................................................... 41
Figure 5-9 MGV for different mixing conditions ..................................................... 42
Figure 5-10 MGV for different mixing conditions ................................................... 42
Figure 5-11 Overall mobilization rates of the mixtures ............................................ 43
Figure 6-1 Contrast between the fluorescence microscopy and GPC method (in Figure,
agg represents aggregate) .................................................................................. 49
Figure 6-2 Blending chart built for the fluorescence microscopy method ............... 50
Figure 6-3 blending chart built for GPC method ...................................................... 51
Figure 6-4 Mobilization rates of the mixtures from the fluorescence microscopy
method ............................................................................................................... 53
Figure 6-5 Mobilization rates of the mixtures from the GPC method ...................... 54
Figure 6-6 Mobilization rate of inner layer and outer layer ...................................... 55
Figure 6-7 Linear regression between GPC and Fluorescence ................................. 56
Figure 6-8 Mobilization rate of mixtures from double barrel and drum plant .......... 57
Figure 6-9 LMS (%) of RAP/RAS binders ............................................................... 58
Figure 7-1 Complex modulus master curves of binder blends ................................. 69
Figure 7-2 Phase angle master curves of binder blends ............................................ 70
Figure 7-3 G*/sinδ parameter vs. temperature .......................................................... 72
Figure 7-4 G*sinδ parameter vs. temperature. .......................................................... 74
Figure 7-5 Aging properties of binder blends with two blending methods. ............. 76
1
Chapter 1 INTRODUCTION
1.1 Problem Statement
The Tennessee Department of Transportation (TDOT) has routinely incorporated
recycled asphalt pavement (RAP) in its asphalt paving mixtures and is now starting to allow
recycled asphalt shingles (RAS) in its construction. Use of RAP/RAS results in the
following benefits:
(a) Conservation of natural resources including aggregates and asphalt binder
(b) Cost savings
(c) Environmental benefits by eliminating landfills
However, one disadvantage of using RAP/RAS is that the asphalt binder in
RAP/RAS has experienced aging over its lifetime and become stiff and brittle. When
RAP/RAS is added into new aggregate and virgin binder during plant mixing, the aged
binder may not be able to be fully blended with virgin binder and thus negatively impacts
the performance of recycled asphalt mixtures. If not fully blended, what proportion of the
aged binder can be mobilized and blended into virgin binder? This is one critical question
that has to be answered so that the benefits of using RAP/RAS can be realized and durable
asphalt pavements can be ensured.
The research team of the University of Tennessee, Knoxville (UTK) led by Dr.
Huang has been collaboratively working with TDOT and conducted five RAP/RAS-related
studies since 2002. The team has determined the allowable percentages of RAP in different
asphalt mixtures for TDOT based on laboratory performance test results and field surveys
on test sections [1, 2]. They have conducted a comprehensive laboratory experiment and
investigated the factors affecting the blending efficiency of RAP/RAS [3, 4]. They also
developed a laboratory procedure to determine the proportion of aged asphalt binder in
2
RAP/RAS that can be mobilized and blended into virgin binder [5, 6].
This research project builds upon the previous TDOT-sponsored RAP/RAS studies,
determines the blending efficiency of different asphalt mixing technologies used by the
asphalt plants in Tennessee, and evaluates its impact on the performance of the resulting
asphalt mixtures. The UT studies have shown that method of mixing, mix time, storage
time, and additives can all affect blending efficiency, resulting in mixtures with different
effective asphalt binder than designed [3, 5, 6]. In other words, some asphalt plants may be
able to more efficiently recycle asphaltic materials into mixtures than others, or some
asphalt plants may be able to utilize higher recycle percentages than others. At current,
TDOT has 117 approved plants on its Approved Suppliers list, but minimal knowledge of
any of these plants’ ability to recycle materials. Consequently, TDOT specifications for
maximum allowable percentages of recycled materials are conservative, ultimately limiting
the ability of the more efficient facilities.
After the completion of the research project, a better understanding can be acquired
about the role of RAP/RAS in asphalt mixtures. How is the aged binder mobilized and
blended into the virgin binder? How does the aged binder interact with the virgin binder?
The findings from the project will help maximize the use of RAP/RAS in asphalt mixtures
and enhance the properties and performance of the mixtures containing RAP/RAS.
1.2 Objectives
The objectives of the research are:
(1) To evaluate the blending efficiency of typical plant mixtures containing
RAP/RAS.
(2) To explore the factors affecting the blending efficiency of RAP/RAS mixtures.
(3) To provide recommendations for improving the blending efficiency of
recycled mixtures.
3
1.3 Scope of Study
The scopes of the research work are:
⚫ To complete a synthesis of literature review on RAP/RAS recycling
technologies and a DOT survey on RAP/RAS recycling practices in the US,
especially in the Southeastern region;
⚫ To evaluate the blending efficiency of typical RAP/RAS recycling
technologies used in Tennessee;
⚫ To investigate the effects of plant mixing parameters on the blending
efficiency of plant mixtures.
1.4 Overview of the Final Report
The whole report was organized as follows: Chapter 1 gives a brief background of the
project. Chapter 2 performs a comprehensive literature review on recycling efficiency.
Chapter 3 summarizes the surveys sent out to the DOTs in the U.S. Chapter 4 introduces
the methodology for the fluorescence microscopy method. Chapter 5 validates the blending
efficiency test. Chapter 6 measures the blending efficiency of plant mixtures in Tennessee.
Chapters 7 performs a preliminary study on different rejuvenator incorporation methods.
The report concludes by summarizing the findings from the laboratory studies.

4
Chapter 2 LITERATURE REVIEW
2.1 Introduction of Recycling Efficiency
With the ever-increasing cost of aggregate and asphalt binder, the incorporation of
RAP/RAS into asphalt mixtures has become more and more popular [4, 7-9]. The use of
RAP/RAS can produce significant economic and environmental benefits. RAP/RAS has
experienced aging over its service life, and its binder has become highly stiff and brittle. In
the production process, RAP/RAS is usually heated by the hot virgin aggregate instead of
directly by fire to avoid further aging. Therefore, the stiff binder in RAP/RAS may not be
able to flow freely and be blended with hot virgin binder to coat aggregates. The lack of a
clear understanding of the recycling efficiency of recycled asphalt has been a major concern
in determining the effective asphalt binder in asphalt mixtures containing RAP/RAS.
How much of the aged binder in the RAP/RAS that can be mobilized and blended
into the virgin binder has been a critical question, and a rational solution to this question
will considerably boost the benefits of using RAP/RAS and promote more durable asphalt
pavements. The recycling efficiency was usually quantified through the blending efficiency
developed in previous studies, and these previous studies have shown that partial blending
may occur when RAP is mixed with virgin binder and aggregates [1, 10-13]. Soleymani et
al. simulated three blending conditions by preparing three mixtures, which represent the
scenarios of non-blending, true mixture, and total blending [14]. Their study concluded that
at least partial blending occurs in the true mixture.
Recently, many researchers reported that the asphalt binder in the RAP/RAS was
only partially blended into the virgin binder. In the NCHRP Project 9-12, for incorporating
RAP into the Superpave system, McDaniel et al. stated that the partial blending does occur
to a significant extent, and the insufficient blending affects the performance of mixtures
containing a high percentage of RAP [15]. Therefore, the assumption of 100% blending

5
may result in insufficient asphalt content in asphalt paving mixtures as the resulting coating
film of virgin aggregate will be too thin to reach the target film thickness. Additionally, the
binder on RAP aggregate will be stiffer than expected, reducing the resistance to fatigue
and low temperature cracking. These changes will lead to poor pavement performance or
a shorter pavement service life. Therefore, it is critical to accurately determine blending
efficiency of RAP mixtures.
2.2 Recycling Efficiency for Asphalt Plants
Extensive laboratory studies have demonstrated that the blending efficiency of
recycled mixtures is influenced by material properties and the mixture preparation process
[3, 6, 16]. Factors such as mixing methods, mixing time, storage time, and additives all
potentially affect the blending efficiency, resulting in mixtures with different effective
asphalt binder than designed [3, 6, 16]. The production conditions are essential to the
blending efficiency which typically vary among contractors and asphalt plants. Currently,
there is limited knowledge on the influence of the production conditions on the blending
efficiency of plant-produced mixtures containing RAP/RAS. Hence, it is highly desirable
to investigate the effects of plant production conditions on the blending efficiency of the
resulting asphalt mixtures.
Mogawer et al. investigated the influence of production process on the degree of
blending between the RAP and virgin binders and the performance of the mixtures in 2012
[17]. Their study concluded that certain production parameters such as discharge
temperature may have an impact on the blending efficiency. Recently, the mobilization rate,
which quantifies the amount of aged binder mobilized into with the virgin binder, has been
adopted to characterize the blending efficiency of mixture produced in laboratory [3, 4].
By using the mobilization rate as a target variable, it is also possible to evaluate the effect
of production conditions on the blending efficiency of plant-produced mixtures.
6
Previous studies usually mixed RAP/RAS with virgin aggregates of particular sizes
and shapes to prepare mixture samples, and the RAP/RAS particles could be visually
detected and separated from the virgin aggregates for the mobilization rate testing. This
approach is based on the fact that the virgin and RAP/RAS aggregates could be readily
separated after the mixing process. However, this is not the same for plant-produced
mixtures, especially when both types of particles have similar sizes and shapes. Therefore,
improvements on the laboratory procedures are needed to adapt to the characteristics of
plant mixtures, in which the virgin and RAP aggregates are difficult to be separated
visually.
2.3 Methods for Determining Recycling Efficiency
The blending efficiency can be quantified using what is termed the mobilization
rate, which is defined as the percentage of aged binder that can be mobilized and blended
into virgin binder to coat aggregate particles. Analytical methods have been used to
investigate the blending efficiency of virgin and aged binder, which can be classified into:
1) microscopy methods including atomic force microscopy (AFM) and environmental
scanning electron microscopy (ESEM), 2) chemical dissolution methods including gel
permeation chromatography (GPC) and Fourier transform infrared spectroscopy (FTIR),
3) mechanical property methods including dynamic shear rheometer (DSR) and bending
beam rheometer (BBR), and other methods such as X-ray computer tomography (CT) [3,
18-25].
The chemical dissolution method is widely used to investigate the blending process
of aged binder. It involves lixiviating binder blend using a chemical solvent, collecting the
resulting solute gradually and using it to determine the mass fraction of the virgin and aged
binder. This experimental technique is able to assess the extent to which the aged binder is
blended into the virgin binder in the production process as well as the effects of different

7
factors on blending, including processing temperature and mixing time [1, 3, 22, 26]. The
most widely used test instrument in the dissolve method is GPC, which is used to test the
molecular distribution of asphalt. The feasibility of utilizing GPC method for blending
efficiency is due to the fact that the aged asphalt exhibits a higher molecular weight than
the virgin asphalt. Karlsson et al. studied the influence of asphalt layer thickness, asphalt
type, and temperature on the diffusion of rejuvenator by FTIR- Attenuated Total Reflection
(ATR), and they also investigated the diffusion of rejuvenator by measuring the carbonyl
content in asphalt [27]. Jia et al. utilized FTIR to analyze the blending degree of the aged
and virgin asphalt in recycled asphalt mixtures, and the results showed that the recycled
asphalt extracted from different layers had an uneven blend of aged and virgin asphalt [28].
In order to avoid the chemical dissolution process used in chemical dissolution
methods, a mechanical property method has been developed to assess the blending
efficiency by comparing the measured dynamic modulus of recycled mixtures with that
predicted from binder testing of as-recovered binders [21, 23]. The degree of blending
between RAP, RAS, and virgin binder can also be evaluated by comparing the dynamic
modulus of mixtures to a dynamic modulus predicted using the complex modulus of the
recovered binders and the Hirsch model [18, 29]. Another method has been developed to
evaluate the blending efficiency by modifying the analysis procedure for estimating the
low-temperature properties of RAP binder and binder blend [30, 31].
The optical microscopy methods have been proven to be effective in directly
distinguishing between virgin and aged binders [24, 32]. AFM is used to probe the change
of microstructural properties from a RAP [32], or RAS [12] binder and virgin bitumen to
the blending zone of these two. With this visualization technique, the virgin binder could
be differentiated from the aged binder qualitatively using grey level. Xu et al. used a
combination of staged extraction method and AFM to investigate the interaction and extent
of blending between RAP and virgin binders under different mixing temperature and
residence time [33]. Elseifi et al. adopted optical microscopy and SEM to determine the

8
effective asphalt film thickness [34].
These studies improved the understanding of the blending process of recycled
asphalt materials. However, there are still no commonly accepted methods available to
determine the blending efficiency. Among the above-mentioned chemical techniques, GPC
and FTIR methods need to extract asphalt binder from aggregate particles to make samples
for further testing. Therefore, the heterogeneity of binder on aggregate cannot be
determined. In addition, the process of using a chemical solvent to dissolve asphalt binder
makes the test time-consuming and complicated. The extraction and recovery process may
also affect the accuracy of the test result. It is desired to develop a convenient method for
determining the blending efficiency of RAP/RAS. A new visual observation tool without
the tedious binder extraction process is desirable for distinguishing virgin from aged
binders so that it would be much easier and more practical to quantify the blending
efficiency of the recycled asphalt binder in an asphalt mixture.
Navaro et al. [35] utilizes fluorescence microscopy to investigate the degree of
blending between virgin and aged binders. In the fluorescence photograph, the aged binder
could be distinguished from the virgin binder due to their difference in fluorescence, which
provides the basis for determining blending efficiency of RAP with fluorescence
microscopy. However, the fluorescent intensity of binders is controlled by multiple factors
such as their chemical composition and the experimental conditions. Therefore, to
efficiently use this method in asphalt blending, the fluorescent characteristics of virgin and
aged binders need to be further examined, and the quantitative relationship between the
fluorescent intensity and the aged binder content also needs to be investigated. In addition,
the test methods mentioned above are based on different properties of asphalt binders, so
the comparability of different methods is still a concern.
9
2.4 Fluorescence of Asphalt
Fluorescence is a phenomenon in which ultraviolet or visible light is absorbed by
an organic molecule, thus causing excitation of an electron from an initially occupied, low-
energy orbital to a high-energy, previously unoccupied orbital (Khorasani 1987).
Fluorescence in asphalt molecules is essentially related to electronic excitation of the
conjugated π-systems (aromatic components) and of C=O groups [36-38]. Research
indicates that the extractable C=O groups exhibit a weak fluorescence, whereas the
aromatic hydrocarbon fractions show a moderate fluorescence. Highly condensed systems,
such as those present in asphaltenes, are virtually non-fluorescent because many energy
exchanges are possible through large conjugated π-systems, thus giving rise to nonradiative
de-excitation [36-38].
Saturate fractions are expected to exhibit no fluorescence. Therefore, dilution in a
saturated hydrocarbon matrix is the most favorable case for aromatics to emit fluorescence.
The molecular environment, such as the proportion of saturates to aromatics, the polarity,
and the intermolecular interactions, have a decisive effect on the fluorescence intensity of
asphalt. The fluorescence intensity of asphalt is thus primarily controlled by the type and
concentration of aromatic molecules relative to the concentration of saturate compounds
[39, 40].
The fluorescence microscopy is an optical microscopy that uses the emission of
fluorescence to study the properties of organic or inorganic substances [41]. Fluorescence
microscopy has been used to visualize voids and cracking of asphalt mixtures, and to
observe the state of asphalt binders when they are modified with polymers [42-44]. The
polymer-rich phase that is swelled by the oily aromatic part of the asphalt appears to be
yellow-colored, whereas the asphaltene phase is dark [19, 45, 46].
For the asphaltenes and maltenes fractions, the asphaltenes produce little to no
fluorescence, but the maltenes exhibit strong fluorescence in the observed spectral region
10
[47]. For the saturated, aromatic, resin, and asphaltenic (SARA) fractions, the aromatics
and resin phases are the only components capable of sufficiently intense fluorescent
emission [47]. Research has also indicated that as bitumen ages, its fluorescence emission
intensity decreases [48]. Therefore, the fluorescent intensity can be used to distinguish
virgin binders from aged binders.
11
Chapter 3 DOTs SURVEY
3.1 DOT Survey
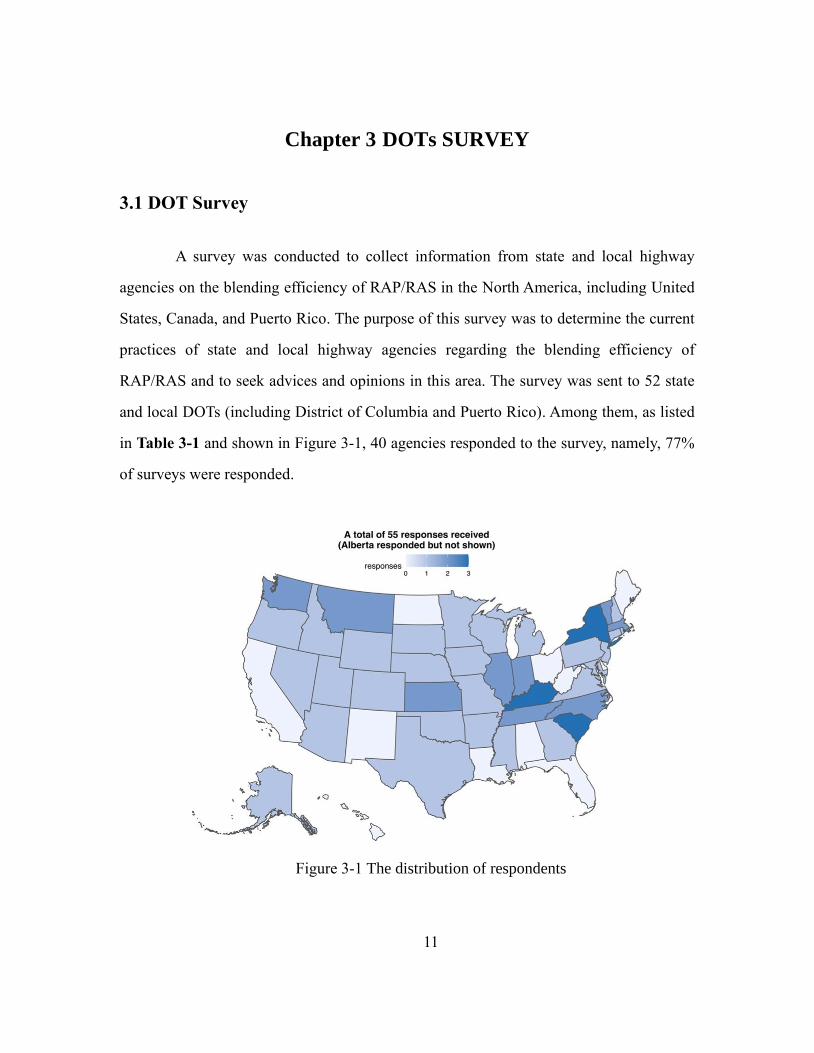
A survey was conducted to collect information from state and local highway
agencies on the blending efficiency of RAP/RAS in the North America, including United
States, Canada, and Puerto Rico. The purpose of this survey was to determine the current
practices of state and local highway agencies regarding the blending efficiency of
RAP/RAS and to seek advices and opinions in this area. The survey was sent to 52 state
and local DOTs (including District of Columbia and Puerto Rico). Among them, as listed
in Table 3-1 and shown in Figure 3-1, 40 agencies responded to the survey, namely, 77%
of surveys were responded.
Figure 3-1 The distribution of respondents

12
Table 3-1. States response to the survey
No. State Responded No. of
Respondents
No. State Responded No. of
Respondents
1 Alaska 1 21 North Carolina 2
2 Alberta 1 22 Texas 1
3 Arizona 1 23 Nebraska 1
4 Arkansas 1 24 Nevada 1
5 Colorado 1 25 New Hampshire 1
6 Connecticut 1 26 New York State 3
7 Georgia 1 27 New Jersey 1
8 Idaho 1 28 Oklahoma 1
9 Illinois 2 29 Oregon 1
10 Indiana 2 30 Pennsylvania 1
11 Iowa 1 31 Rhode Island 1
12 Kansas 2 32 South Carolina 3
13 Kentucky 3 33 South Dakota 1
14 Maryland 1 34 Tennessee 2
15 Massachusetts 2 35 Utah 1
16 Michigan 1 36 Vermont 2
17 Minnesota 1 37 Virginia 1
18 Mississippi 1 38 Washington,
D.C.
2
19 Missouri 1 39 Wisconsin 1
20 Montana 2 40 Wyoming 1
Total number of
respondents
55
Survey results were shared with industry and government agencies and officials to
promote recycling and sustainable paving technologies. The collected information was
analyzed, and the results are summarized below.
3.2 Responses to the Survey
3.2.1 Responses to the RAP application
Among the states and agencies that responded, 63% of the respondents indicated
13
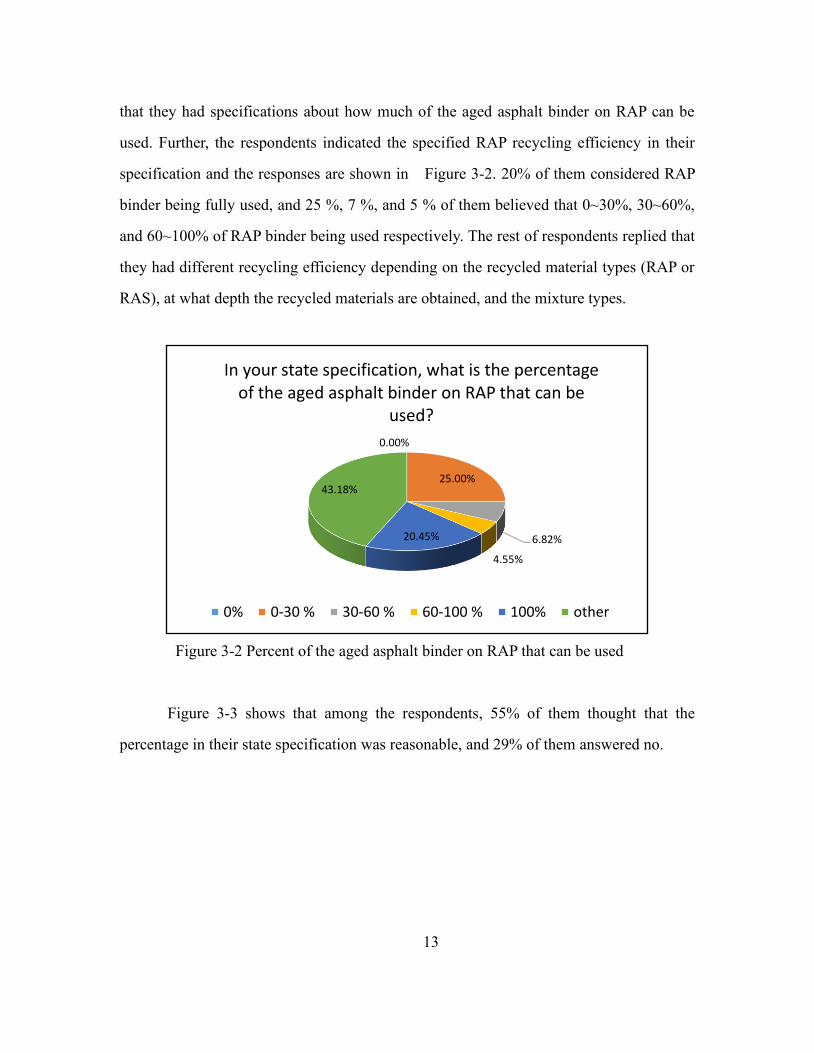
that they had specifications about how much of the aged asphalt binder on RAP can be
used. Further, the respondents indicated the specified RAP recycling efficiency in their
specification and the responses are shown in Figure 3-2. 20% of them considered RAP
binder being fully used, and 25 %, 7 %, and 5 % of them believed that 0~30%, 30~60%,
and 60~100% of RAP binder being used respectively. The rest of respondents replied that
they had different recycling efficiency depending on the recycled material types (RAP or
RAS), at what depth the recycled materials are obtained, and the mixture types.
Figure 3-2 Percent of the aged asphalt binder on RAP that can be used
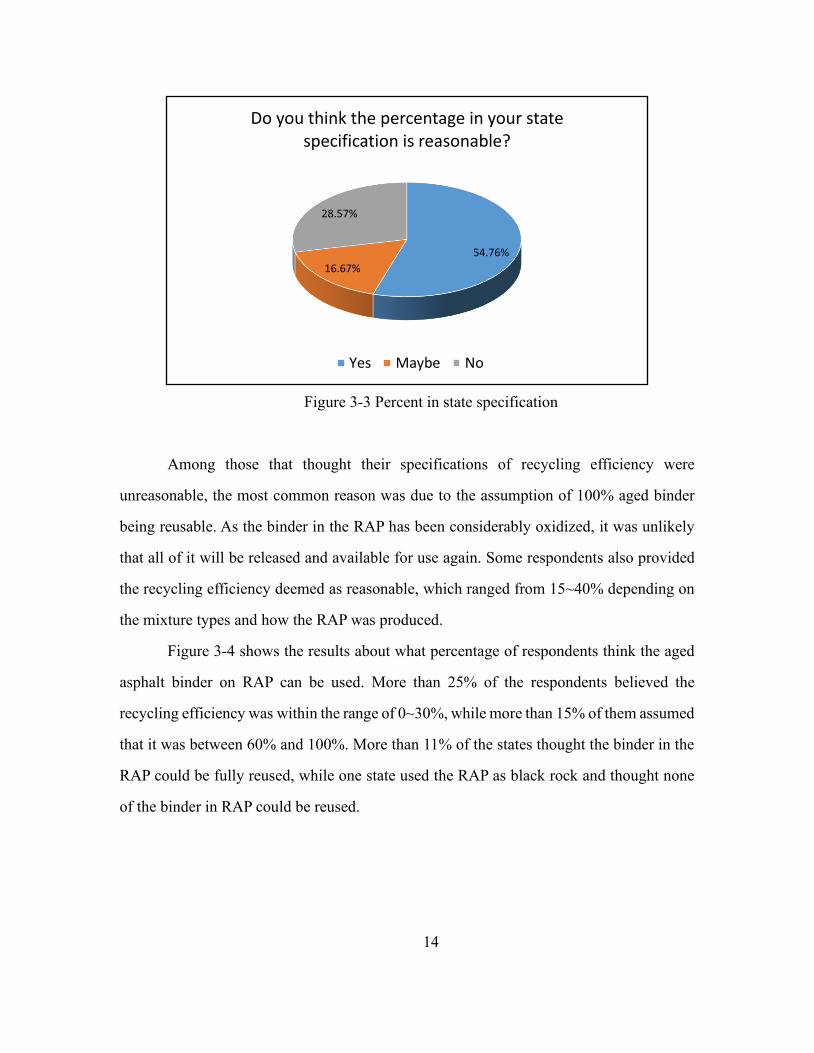
Figure 3-3 shows that among the respondents, 55% of them thought that the
percentage in their state specification was reasonable, and 29% of them answered no.
0.00%
25.00%
6.82%
4.55%
20.45%
43.18%
In your state specification, what is the percentage of the aged asphalt binder on RAP that can be
used?
0% 0-30 % 30-60 % 60-100 % 100% other
14
Figure 3-3 Percent in state specification
Among those that thought their specifications of recycling efficiency were
unreasonable, the most common reason was due to the assumption of 100% aged binder
being reusable. As the binder in the RAP has been considerably oxidized, it was unlikely
that all of it will be released and available for use again. Some respondents also provided
the recycling efficiency deemed as reasonable, which ranged from 15~40% depending on
the mixture types and how the RAP was produced.
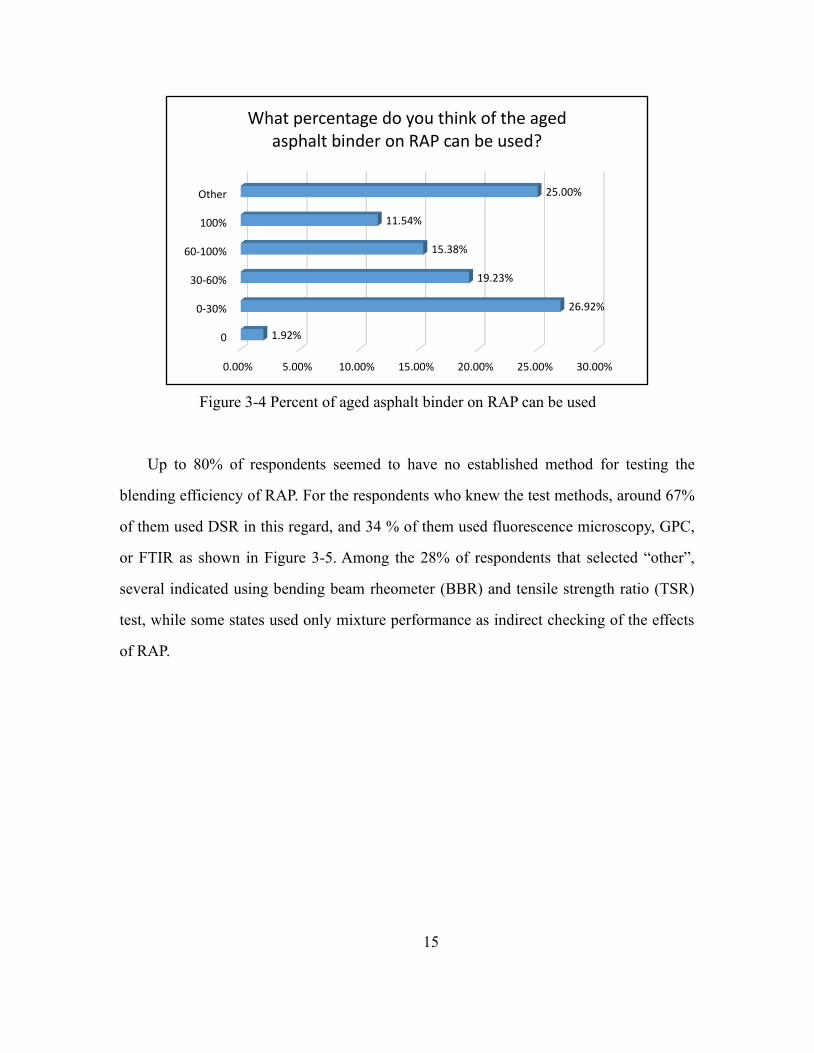
Figure 3-4 shows the results about what percentage of respondents think the aged
asphalt binder on RAP can be used. More than 25% of the respondents believed the
recycling efficiency was within the range of 0~30%, while more than 15% of them assumed
that it was between 60% and 100%. More than 11% of the states thought the binder in the
RAP could be fully reused, while one state used the RAP as black rock and thought none
of the binder in RAP could be reused.
54.76%
16.67%
28.57%
Do you think the percentage in your state specification is reasonable?
Yes Maybe No
15
Figure 3-4 Percent of aged asphalt binder on RAP can be used
Up to 80% of respondents seemed to have no established method for testing the
blending efficiency of RAP. For the respondents who knew the test methods, around 67%
of them used DSR in this regard, and 34 % of them used fluorescence microscopy, GPC,
or FTIR as shown in Figure 3-5. Among the 28% of respondents that selected “other”,
several indicated using bending beam rheometer (BBR) and tensile strength ratio (TSR)
test, while some states used only mixture performance as indirect checking of the effects
of RAP.
0.00% 5.00% 10.00% 15.00% 20.00% 25.00% 30.00%
0
0-30%
30-60%
60-100%
100%
Other
1.92%
26.92%
19.23%
15.38%
11.54%
25.00%
What percentage do you think of the aged asphalt binder on RAP can be used?

16
Figure 3-5 Tools used to test the blending efficiency
Only 16.3% of the respondents indicated using rejuvenator for asphalt mixture
containing RAP. As shown in Figure 3-6, for the respondents using rejuvenator, less than
30% of them were confident in that adding rejuvenator would benefit the blending of RAP
with new materials, while about 10% of them believed that the addition of rejuvenator had
no connection to the blending efficiency.
Figure 3-6 Efficacy of rejuvenator in RAP
0.00% 20.00% 40.00% 60.00% 80.00%
Gel Permeation Chromatography (GPC)
Fourier Transform Infrared Spectroscopy(FTIR)
Fluorescence Microscopy
Dynamic Shear Rheometer (DSR)
Other (Please specify)
9.52%
14.29%
9.52%
66.67%
28.57%
Which tools do know are used to test the blending efficiency of RAP?
28.85%
61.54%
9.62%
Do you think rejuvenator improves RAP blending efficiency?
Yes Maybe No

17
3.2.2 Responses to the RAS application
63% of respondents showed they had specified allowable percentage of RAS binder
replacement while up to 37% of them did not. This is similar to the situation for RAP. For
respondents who had specifications, 15% of respondents believed RAS contributed no
binder to the resulting mixture as shown in Figure 3-7. Most of them (around 40%) thought
the percentage was less than 30%. Less than 9% of the responders thought the blending
efficiency of RAS was in the range of 30~100%, and about 9% of them thought that all
binder in the RAS could be reused.
Figure 3-7 Percent of reusable RAS binder
Figure 3-8 shows that 49% of the respondents believed that the percentage in the
state specification was reasonable. Four of the respondents answered “no” to this question,
mainly because it is unlikely all binders in the RAS could be released under a regular
mixing temperature.
15.22%
39.13%
2.17%
6.52%
8.70%
28.26%
In your state specification, what is the percentage of the aged asphalt binder on RAS that can be
used?
0% 0-30 % 30-60 % 60-100 % 100% other

18
Figure 3-8 Rationality of state specification
There were 48 responses to the concerns about the current percentage in state
specification. As shown in Figure 3-9, 35% of them had no concern about the current
percentage in state specification.
Figure 3-9 Concerns about the current percentage in state specification
48.84%
32.56%
18.60%
Do you think the percentage in your state specification is reasonable?
Yes Maybe No
35.42%
29.17%
35.42%
Do you have concerns about the current percentage in your state specification?
Yes Maybe No
19
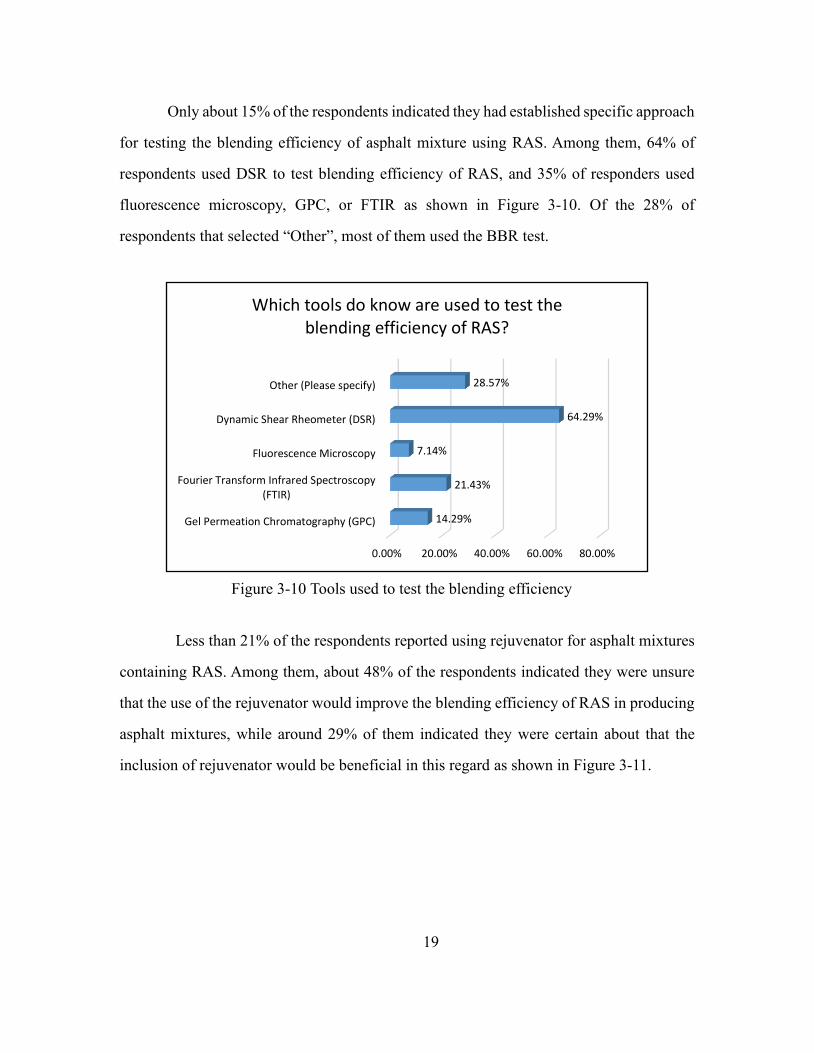
Only about 15% of the respondents indicated they had established specific approach
for testing the blending efficiency of asphalt mixture using RAS. Among them, 64% of
respondents used DSR to test blending efficiency of RAS, and 35% of responders used
fluorescence microscopy, GPC, or FTIR as shown in Figure 3-10. Of the 28% of
respondents that selected “Other”, most of them used the BBR test.
Figure 3-10 Tools used to test the blending efficiency
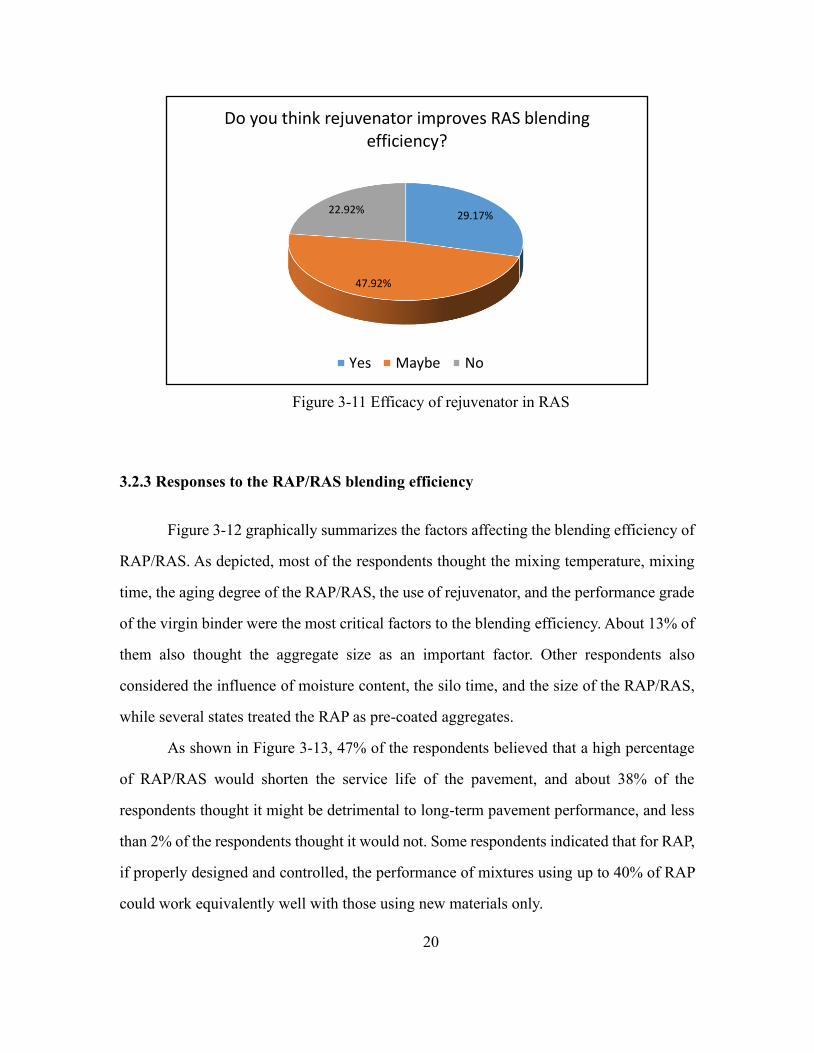
Less than 21% of the respondents reported using rejuvenator for asphalt mixtures
containing RAS. Among them, about 48% of the respondents indicated they were unsure
that the use of the rejuvenator would improve the blending efficiency of RAS in producing
asphalt mixtures, while around 29% of them indicated they were certain about that the
inclusion of rejuvenator would be beneficial in this regard as shown in Figure 3-11.
0.00% 20.00% 40.00% 60.00% 80.00%
Gel Permeation Chromatography (GPC)
Fourier Transform Infrared Spectroscopy(FTIR)
Fluorescence Microscopy
Dynamic Shear Rheometer (DSR)
Other (Please specify)
14.29%
21.43%
7.14%
64.29%
28.57%
Which tools do know are used to test the blending efficiency of RAS?
20
Figure 3-11 Efficacy of rejuvenator in RAS
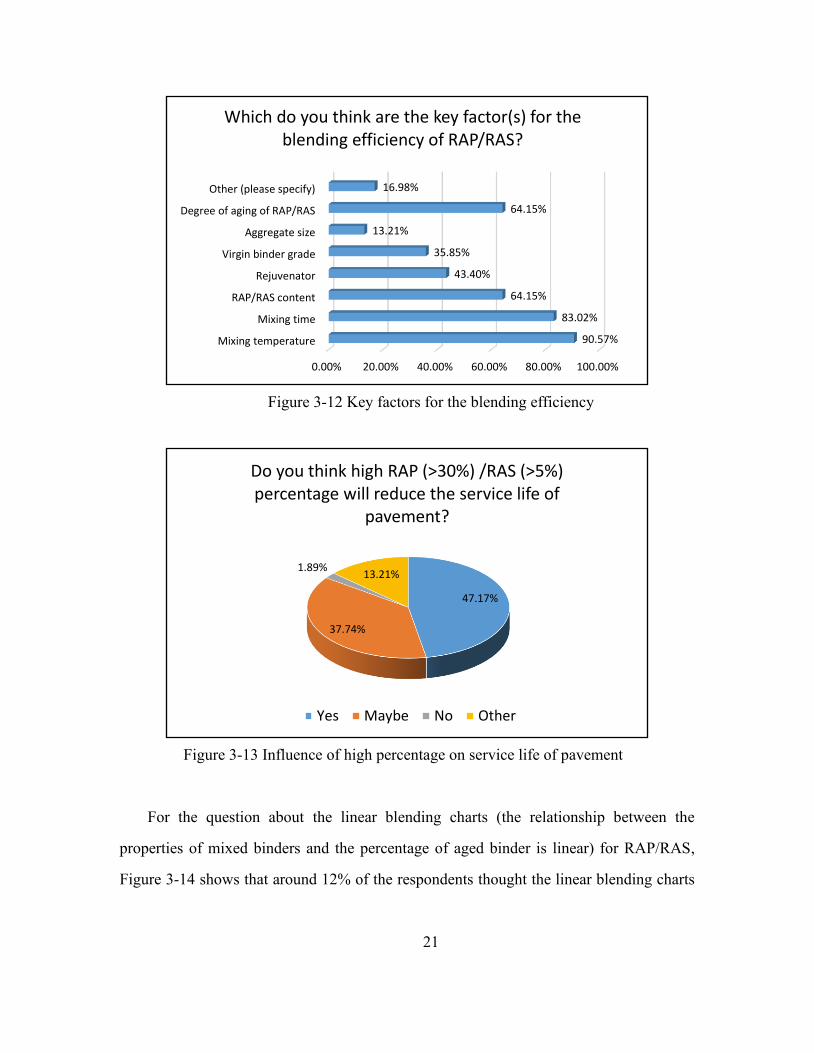
3.2.3 Responses to the RAP/RAS blending efficiency
Figure 3-12 graphically summarizes the factors affecting the blending efficiency of
RAP/RAS. As depicted, most of the respondents thought the mixing temperature, mixing
time, the aging degree of the RAP/RAS, the use of rejuvenator, and the performance grade
of the virgin binder were the most critical factors to the blending efficiency. About 13% of
them also thought the aggregate size as an important factor. Other respondents also
considered the influence of moisture content, the silo time, and the size of the RAP/RAS,
while several states treated the RAP as pre-coated aggregates.
As shown in Figure 3-13, 47% of the respondents believed that a high percentage
of RAP/RAS would shorten the service life of the pavement, and about 38% of the
respondents thought it might be detrimental to long-term pavement performance, and less
than 2% of the respondents thought it would not. Some respondents indicated that for RAP,
if properly designed and controlled, the performance of mixtures using up to 40% of RAP
could work equivalently well with those using new materials only.
29.17%
47.92%
22.92%
Do you think rejuvenator improves RAS blending efficiency?
Yes Maybe No
21
Figure 3-12 Key factors for the blending efficiency
Figure 3-13 Influence of high percentage on service life of pavement
For the question about the linear blending charts (the relationship between the
properties of mixed binders and the percentage of aged binder is linear) for RAP/RAS,
Figure 3-14 shows that around 12% of the respondents thought the linear blending charts
0.00% 20.00% 40.00% 60.00% 80.00% 100.00%
Mixing temperature
Mixing time
RAP/RAS content
Rejuvenator
Virgin binder grade
Aggregate size
Degree of aging of RAP/RAS
Other (please specify)
90.57%
83.02%
64.15%
43.40%
35.85%
13.21%
64.15%
16.98%
Which do you think are the key factor(s) for the blending efficiency of RAP/RAS?
47.17%
37.74%
1.89%13.21%
Do you think high RAP (>30%) /RAS (>5%) percentage will reduce the service life of
pavement?
Yes Maybe No Other
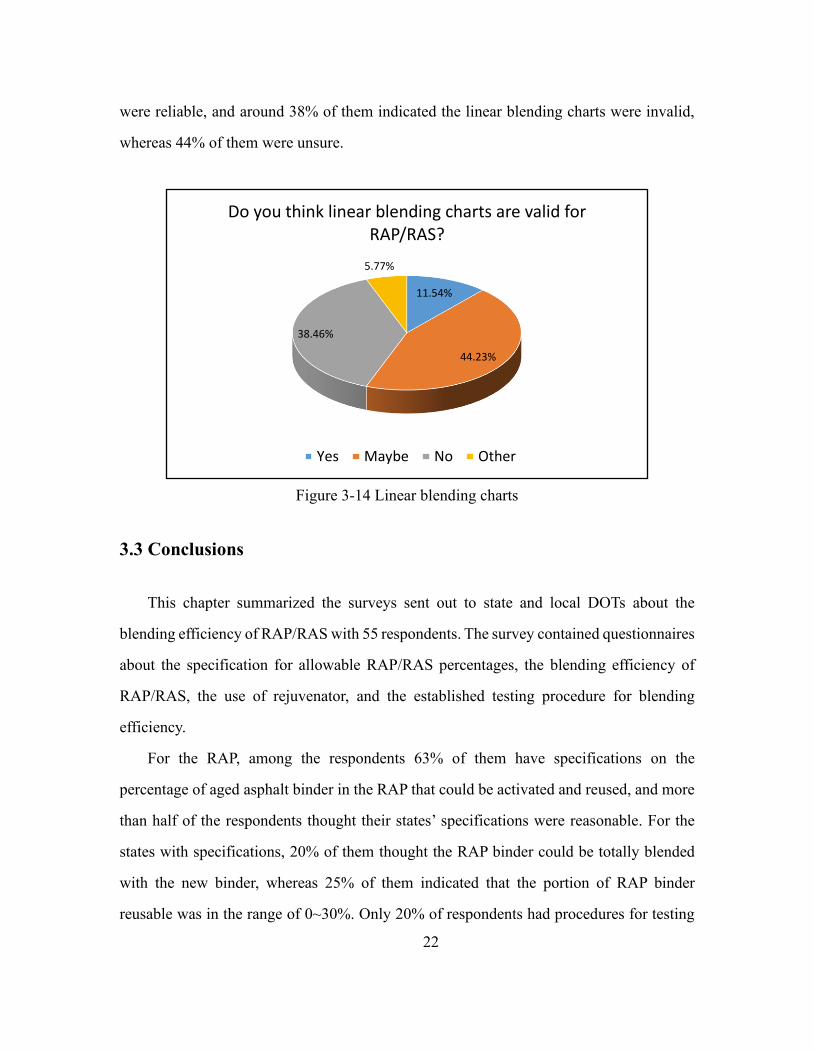
22
were reliable, and around 38% of them indicated the linear blending charts were invalid,
whereas 44% of them were unsure.
Figure 3-14 Linear blending charts
3.3 Conclusions
This chapter summarized the surveys sent out to state and local DOTs about the
blending efficiency of RAP/RAS with 55 respondents. The survey contained questionnaires
about the specification for allowable RAP/RAS percentages, the blending efficiency of
RAP/RAS, the use of rejuvenator, and the established testing procedure for blending
efficiency.
For the RAP, among the respondents 63% of them have specifications on the
percentage of aged asphalt binder in the RAP that could be activated and reused, and more
than half of the respondents thought their states’ specifications were reasonable. For the
states with specifications, 20% of them thought the RAP binder could be totally blended
with the new binder, whereas 25% of them indicated that the portion of RAP binder
reusable was in the range of 0~30%. Only 20% of respondents had procedures for testing
11.54%
44.23%
38.46%
5.77%
Do you think linear blending charts are valid for RAP/RAS?
Yes Maybe No Other
23
blending efficiency, and most of them used the DSR as a tool. Based on the responses, it
seemed not to be a typical practice to use rejuvenator for mixture containing RAP, as only
around 16% of the respondents reported using a rejuvenator in tandem with RAP for
producing asphalt mixtures.
For the RAS, 63% of respondents reported that their states specified the percentage of
aged asphalt binder in RAS could be recycled into the new mixture. For the states had
specifications on this, only 9% of them thought the RAS binder could be totally blended
with the new materials, whereas 39% of them thought that less than 30% of the binder in
RAS could be released and reused. Regarding the procedures for testing the blending
efficiency of RAS with new binders, 85% of respondents reported that they had no method
in this regard. Also, similar to RAP, more than 79% of the respondents indicated that they
did not use rejuvenators when producing mixtures containing RAS.
For the critical factors influencing the blending efficiency of RAP/RAS with new
materials, most of the respondents selected the mixing temperature, mixing time, the
content of RAP/RAS, and the aging degree of RAP/RAS as critical factors. 47% of
respondents believed that a high RAP (>30%) /RAS (>5%) percentage in binder would
reduce the pavement service life. In summary, there currently exists no consensus among
states about the blending efficiency of RAP/RAS and the standard testing procedure for
this. The use of rejuvenator with RAP/RAS for producing asphalt mixtures is also
questionable. Based on the survey, the test method for blending efficiency, the factors
affecting blending efficiency and the usage of rejuvenators were further investigated in this
study.
24
Chapter 4 METHODOLOGY FOR FLUORESCENCE
MICROSCOPY METHOD
4.1 Introduction
The fluorescence microscopy is an optical microscopy that uses the emission of
fluorescence to study properties of organic or inorganic substances [36, 49, 50].
Fluorescence microscopy has been used for the analysis of oil and petroleum products since
the 1980s [51]. Navaro et al. utilized fluorescence microscopy first to investigate the degree
of blending between virgin and aged binders [35]. They analyzed fluorescence microscope
images by using a pair of photographs taken under white light (WL) and ultraviolet light
(UVL) at the same position of recycled asphalt mixtures sample, and then utilized an image
processing software to quantify the degree of blending between the virgin and RAP binders.
To eliminate the influence of aggregate, two masks were used to hide the aggregate from
the binder in an image. In the UVL photograph, the aged binder can be distinguished from
the virgin binder, as the latter is fluorescent. However, the threshold value to distinguish
between mastic and aggregate can only be chosen by experience in their study. There is not
a quantified index available to determine whether all the aggregate have been hidden. In
addition, the test procedure proposed by Navaro et al. [35] seems too complex to be used
in the field.
In this study, a new method is proposed to determine the RAP/RAS binder
mobilization rate based on the fluorescence effect, which is suitable for the plant mixtures
with varied mixing condition. To achieve this, a fluorescent parameter is developed that is
suitable for the study of virgin and RAP binder blending, and this new parameter is adopted
to build a blending chart between the virgin and RAP binders. The detailed methodology
of the new method is described below.
25
4.2 Methodology of Fluorescence Microscopy Method
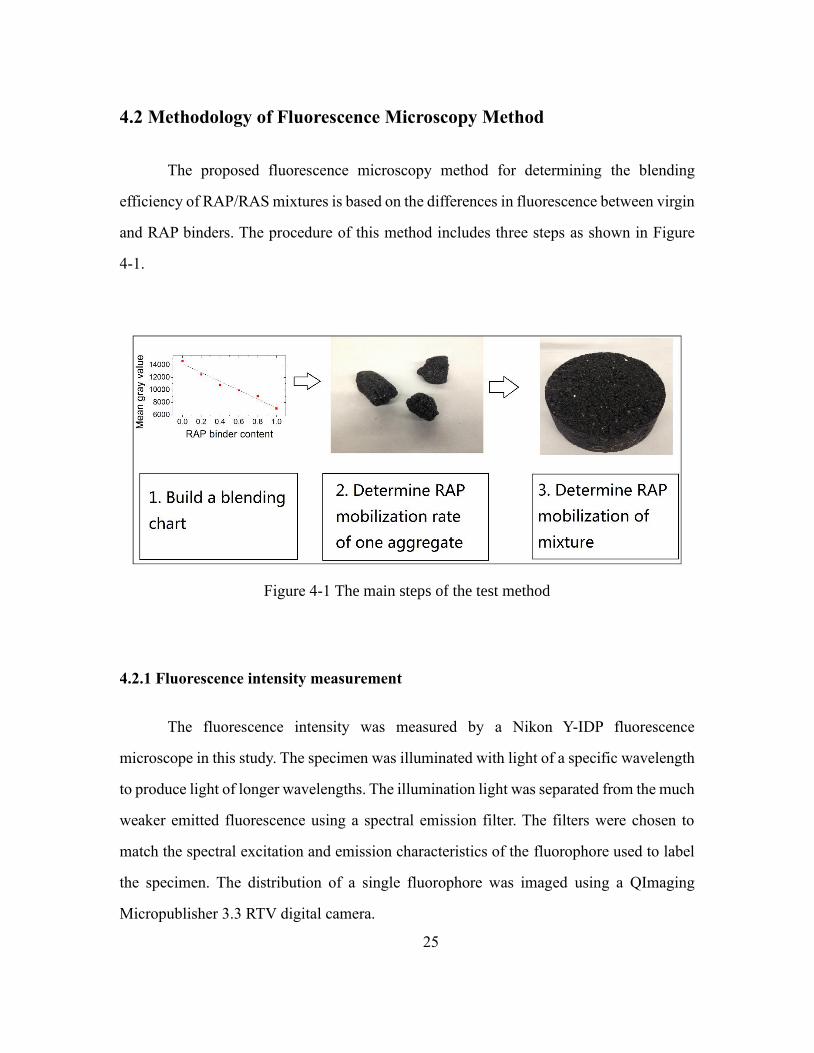
The proposed fluorescence microscopy method for determining the blending
efficiency of RAP/RAS mixtures is based on the differences in fluorescence between virgin
and RAP binders. The procedure of this method includes three steps as shown in Figure
4-1.
Figure 4-1 The main steps of the test method
4.2.1 Fluorescence intensity measurement
The fluorescence intensity was measured by a Nikon Y-IDP fluorescence
microscope in this study. The specimen was illuminated with light of a specific wavelength
to produce light of longer wavelengths. The illumination light was separated from the much
weaker emitted fluorescence using a spectral emission filter. The filters were chosen to
match the spectral excitation and emission characteristics of the fluorophore used to label
the specimen. The distribution of a single fluorophore was imaged using a QImaging
Micropublisher 3.3 RTV digital camera.

26
The charge coupled device (CCD) technology was used to produce quantitative
digital images by fluorescence microscopy. The input light incident on the CCD creating
output electronic charge is an intrinsically linear process. Each pixel is an independent
linear photometer. The grey value of the pixel can be used to measure the brightness of the
image which is linearly dependent on the input fluorescent intensity. In this study, the mean
grey value (MGV) of the image was developed to characterize the fluorescence intensity
of a material. MGV was defined as the mean of the grey value of a set area of the
fluorescence image and can be easily obtained through post-processing of the image. The
virgin binder exhibited a higher grey value than the aged binder as shown in Figure 4-2, so
that the MGV of binder blend would decrease with the increasing of aged binder content.
It can be expected that the MGV of one image would be affected by experimental
conditions and material properties. Therefore, the variations of MGV with the factors such
as exposure time, material properties were investigated in this study. The digital image
collection process followed the procedure of ASTM F2998 [52].
Figure 4-2 Fluorescence images of virgin and aged asphalt samples
27
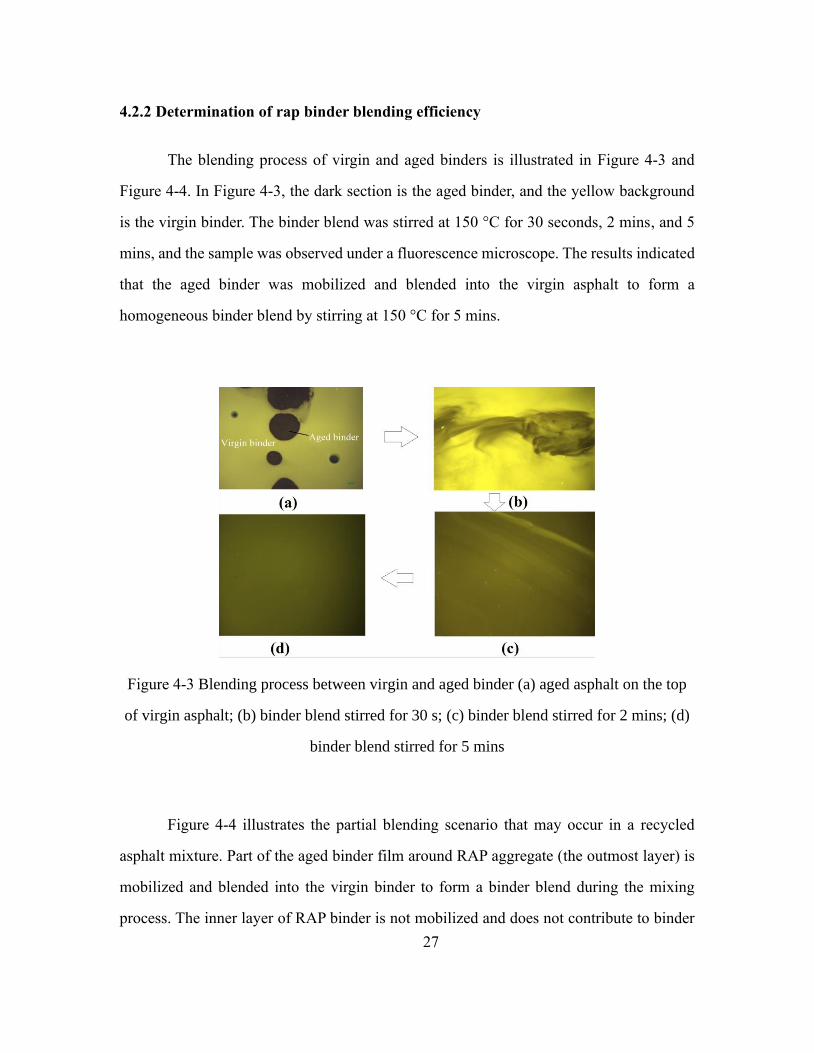
4.2.2 Determination of rap binder blending efficiency
The blending process of virgin and aged binders is illustrated in Figure 4-3 and
Figure 4-4. In Figure 4-3, the dark section is the aged binder, and the yellow background
is the virgin binder. The binder blend was stirred at 150 °C for 30 seconds, 2 mins, and 5
mins, and the sample was observed under a fluorescence microscope. The results indicated
that the aged binder was mobilized and blended into the virgin asphalt to form a
homogeneous binder blend by stirring at 150 °C for 5 mins.
Figure 4-3 Blending process between virgin and aged binder (a) aged asphalt on the top
of virgin asphalt; (b) binder blend stirred for 30 s; (c) binder blend stirred for 2 mins; (d)
binder blend stirred for 5 mins
Figure 4-4 illustrates the partial blending scenario that may occur in a recycled
asphalt mixture. Part of the aged binder film around RAP aggregate (the outmost layer) is
mobilized and blended into the virgin binder to form a binder blend during the mixing
process. The inner layer of RAP binder is not mobilized and does not contribute to binder
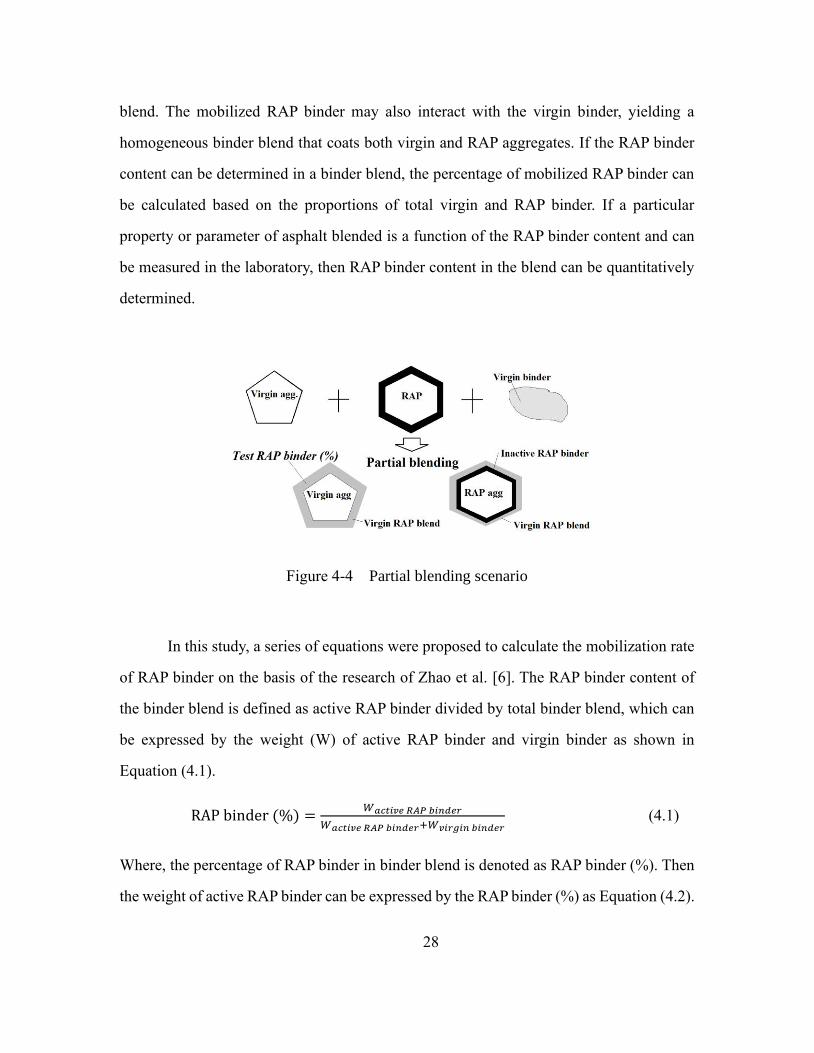
28
blend. The mobilized RAP binder may also interact with the virgin binder, yielding a
homogeneous binder blend that coats both virgin and RAP aggregates. If the RAP binder
content can be determined in a binder blend, the percentage of mobilized RAP binder can
be calculated based on the proportions of total virgin and RAP binder. If a particular
property or parameter of asphalt blended is a function of the RAP binder content and can
be measured in the laboratory, then RAP binder content in the blend can be quantitatively
determined.
Figure 4-4 Partial blending scenario
In this study, a series of equations were proposed to calculate the mobilization rate
of RAP binder on the basis of the research of Zhao et al. [6]. The RAP binder content of
the binder blend is defined as active RAP binder divided by total binder blend, which can
be expressed by the weight (W) of active RAP binder and virgin binder as shown in
Equation (4.1).
RAP binder (%) =𝑊𝑎𝑐𝑡𝑖𝑣𝑒 𝑅𝐴𝑃 𝑏𝑖𝑛𝑑𝑒𝑟
𝑊𝑎𝑐𝑡𝑖𝑣𝑒 𝑅𝐴𝑃 𝑏𝑖𝑛𝑑𝑒𝑟+𝑊𝑣𝑖𝑟𝑔𝑖𝑛 𝑏𝑖𝑛𝑑𝑒𝑟 (4.1)
Where, the percentage of RAP binder in binder blend is denoted as RAP binder (%). Then
the weight of active RAP binder can be expressed by the RAP binder (%) as Equation (4.2).

29
𝑊𝑎𝑐𝑡𝑖𝑣𝑒 𝑅𝐴𝑃 𝑏𝑖𝑛𝑑𝑒𝑟 =RAP binder (%)×𝑊𝑣𝑖𝑟𝑔𝑖𝑛 𝑏𝑖𝑛𝑑𝑒𝑟
1−RAP binder (%) (4.2)
Finally, the mobilization rate can be expressed as the active RAP binder divided by
the total RAP binder as shown in Equation (4.3).
𝑀𝑜𝑏𝑖𝑙𝑧𝑖𝑎𝑟𝑡𝑖𝑜𝑛 𝑟𝑎𝑡𝑒 =𝑊𝑎𝑐𝑡𝑖𝑣𝑒 𝑅𝐴𝑃 𝑏𝑖𝑛𝑑𝑒𝑟
𝑊𝑡𝑜𝑡𝑎𝑙 𝑅𝐴𝑃 𝑏𝑖𝑛𝑑𝑒𝑟=
RAP binder (%)×𝑊𝑣𝑖𝑟𝑔𝑖𝑛 𝑏𝑖𝑛𝑑𝑒𝑟
(1−RAP binder (%))×𝑊𝑡𝑜𝑡𝑎𝑙 𝑅𝐴𝑃 𝑏𝑖𝑛𝑑𝑒𝑟 (4.3)
Table 4-1 presents an example of the calculation of mobilization rate for an actual
case. Assuming RAP binder (%) is determined in the laboratory as 30%, the weight (W) of
RAP and virgin binder expressed as the percentage of total mixture. The mobilization rate
can be calculated based on the weight of RAP and virgin binder and RAP binder (%). In
the case in Table 4.1, mobilization rate is calculated as 45%, which means 45% of the RAP
binder can be mobilized during mixing and contribute to coating the aggregates.
Table 4-1. Example of mobilization rate calculation
Parameter Description Value
RAP binder (%) RAP binder percentage by binder blend 30%
𝑊𝑡𝑜𝑡𝑎𝑙 𝑅𝐴𝑃 𝑏𝑖𝑛𝑑𝑒𝑟 RAP binder percentage by total mixture 2.2%
𝑊𝑣𝑖𝑟𝑔𝑖𝑛 𝑏𝑖𝑛𝑑𝑒𝑟 Virgin binder percentage by total mixture 2.3%
𝑊𝑎𝑐𝑡𝑖𝑣𝑒 𝑅𝐴𝑃 𝑏𝑖𝑛𝑑𝑒𝑟 Active RAP binder percentage by total mixture 0.99%
𝐵𝑙𝑒𝑛𝑑𝑖𝑛𝑔 𝑟𝑎𝑡𝑒 Active RAP binder percentage by total RAP binder 45%
In this case, the key point in the calculation of mobilization rate is the determination
of the RAP binder (%). A straightforward method to determine RAP binder (%) is to build
a blending chart with one certain parameter and interpolating the laboratory-testing result
of the sample. This study developed a blending chart for blending research using MGV
derived from the fluorescence intensity of binder blend.
30
4.2.3 Building a blending chart in terms of MGV
If all the MGVs of a binder blend have a linear relationship with the aged binder
content, the construction process of a blending chart only needs to test MGVs of virgin and
aged binder and will be significantly simplified. To build a blending chart, samples with
RAP/RAS binder content ranging from 0 to 100% in 10% increments should be enough to
be tested for their MGV. The mixtures of virgin binder and recovered RAP/RAS binder are
first heated to 170 °C (for RAP) and 190 °C (for RAS) and stirred for 30 minutes; then,
they are placed into a vacuum oven (170 °C for RAP and 190 °C for RAS) for another 2
hours. Finally, the mixed binder is spread on a microscope slide and tested.
4.2.4 RAP binder mobilization of a mixture
In order to obtain an accurate overall blending efficiency for a RAP mixture, different
aggregate sizes need to be taken into account. In this study, the overall mobilization rate of
a mixture could be obtained based on the surface area proportions of aggregates with
different sizes, such as large and small aggregates. The use of aggregate surface area instead
of aggregate weight is due to the fact that the surface area is directly related to the asphalt
film around aggregate particles. The mobilization rate of large and small aggregates is
measured separately first, then the overall mobilization rate of a mixture could be
calculated according to Equation 4.4.
𝑀𝑜𝑏𝑖𝑙𝑖𝑧𝑎𝑡𝑖𝑜𝑛 𝑟𝑎𝑡𝑒 = 𝑀𝑜𝑏𝑖𝑙𝑖𝑧𝑎𝑡𝑖𝑜𝑛 𝑟𝑎𝑡𝑒𝑙𝑎𝑟𝑔𝑒 𝑎𝑔𝑔𝑟𝑒𝑔𝑎𝑡𝑒 ×
𝑆𝑢𝑟𝑓𝑎𝑐𝑒 𝑎𝑟𝑒𝑎 𝑝𝑒𝑟𝑐𝑒𝑛𝑡𝑎𝑔𝑒𝑙𝑎𝑟𝑔𝑒 𝑎𝑔𝑔𝑟𝑒𝑔𝑎𝑡𝑒 + 𝑀𝑜𝑏𝑖𝑙𝑖𝑧𝑎𝑡𝑖𝑜𝑛 𝑟𝑎𝑡𝑒𝑠𝑚𝑎𝑙𝑙 𝑎𝑔𝑔𝑟𝑒𝑔𝑎𝑡𝑒 ×
𝑆𝑢𝑟𝑓𝑎𝑐𝑒 𝑎𝑟𝑒𝑎 𝑝𝑒𝑟𝑐𝑒𝑛𝑡𝑎𝑔𝑒𝑠𝑚𝑎𝑙𝑙 𝑎𝑔𝑔𝑟𝑒𝑔𝑎𝑡𝑒 (4.4)
Following the steps mentioned in this section, the mobilization rate of different lab

31
and plant mixtures will be identified in the following chapters.
32
Chapter 5 VALIDATING THE BLENDING EFFICIENCY
TEST BY USING LAB AND PLANT MIXTURES
To verify the proposed method, lab mixtures and three plant-produced asphalt
mixtures were obtained. One RAP binder and one highly-aged asphalt binder from RAS
were used to build an example blending chart and, thereby, determine the blending
efficiency of mixtures in this study.
5.1 Lab and Plant Materials
5.1.1 Lab asphalt and mixtures
To investigate whether the fluorescence intensity can be used to distinguish virgin
and aged binders, four Strategic Highway Research Program (SHRP) asphalt binders
including AAD-1, AAG-1, AAK-1, AAM-1 were used in this study. The SHRP asphalt
binders were aged by using the rolling thin-film oven (RTFO) [53] and pressurized aging
vessel (PAV) methods [54]. The virgin binder used to build the blending chart was a typical
PG 64-22 binder from Marathon Petroleum Company, located in Findlay, Ohio, which is
commonly used in Tennessee. To investigate the influence of aging degree on the
fluorescent property of the binder blend, in this study one RAP binder was extracted from
RAP materials which contained 4.6% asphalt content, and one highly aged binder was
extracted from tear-off RAS materials which contained 21% asphalt content. The extraction
method followed ASTM D 6847–02 “Standard Test Method for Quantitative Extraction
and Recovery of Asphalt Binder from Asphalt Mixtures” [55].
The blending efficiencies of a series of asphalt mixtures containing RAP/RAS were
evaluated to verify the proposed method. The mixing time and temperature were considered

33
as two key factors that affect the binder blending efficiency, as previous studies have
indicated that the blending efficiency of an aged binder would increase with an increase in
mixing time and temperature [56].
Figure 5-1 shows a detailed schematic for the asphalt mixture producing and testing
procedure. To observe the binder using a fluorescence microscope, glass cullet (Figure
5-1(a)) was used as a special aggregate and added into the mixture, because it has two
parallel planes and can be tested directly under a fluorescence microscope (Figure 5-1(f)).
This study used a mixture containing 50 % RAP content and 2.19 % virgin asphalt binder
content. Figure 5-2 shows the particle size distribution of the mixture. A mixture of 2,000g
was produced for each batch, covering 10g of glass cullet. The aggregates were heated to
10°C higher than target mixing temperature for more than 2 hours before mixing. The RAP
samples were heated to 110°C for 2 hours to avoid further aging. The virgin binder was
heated to the target mixing temperature for 2 hours. The aggregates were pre-blended with
the RAP samples for 10 seconds and then mixed with the virgin binder for a predetermined
mixing time. Two mixing temperatures, 130°C and 160°C were selected to represent hot
and warm mixing scenarios and three mixing times were used: 0.5, 3, and 6 minutes. The
glass cullet was separated from the mixture after mixing and then tested under a
fluorescence microscope (Figure 5-1(f)). For each batch of material, 10 samples were tested
and the mean value of 10 samples was used as the result of the batch.

34
Figure 5-1 Asphalt mixture producing and test process (a) Glass cullet; (b) RAP; (c)
Virgin asphalt; (d) Virgin aggregate; (e) Asphalt mixture; (f) Glass cullet tested by the
fluorescence microscopy
Figure 5-2 Particle size distribution curve of aggregate
35
5.1.2 Plant mixtures
The mixtures were produced in an asphalt plant in three different ways: hot mix
with rejuvenator, hot mix without rejuvenator, and warm mix with foaming technology.
The rejuvenator content was 0.4% by weight of asphalt binder. During the production
process, the rejuvenator was first added into virgin binder and then mixed with aggregates.
The mixing temperatures for warm mix and hot mix were 145 C and 155 C, respectively.
After production, the mixtures were stocked in a silo for another two hours.
One performance grade asphalt binder, PG 64-22, was used in all three mixtures.
The Marshall mix design procedure was employed design mixture. The asphalt content was
4.5% for all three mixtures, with 2.19% coming from virgin binder and 2.31% from RAP
binder.
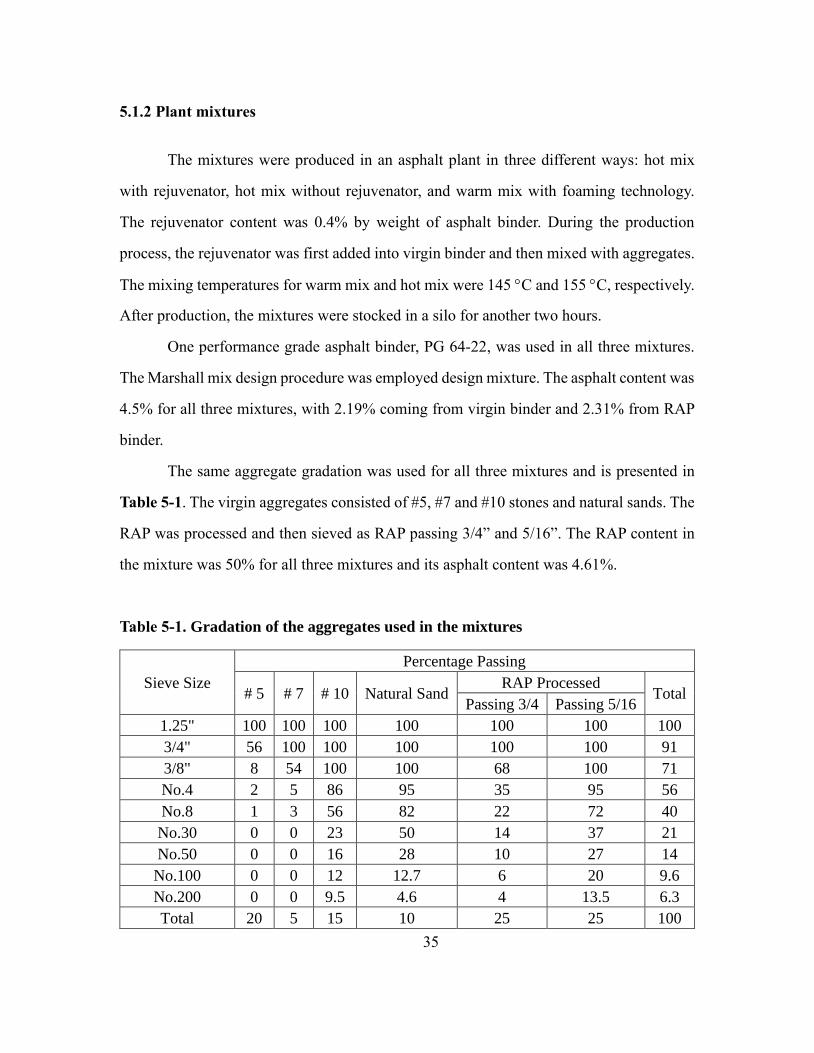
The same aggregate gradation was used for all three mixtures and is presented in
Table 5-1. The virgin aggregates consisted of #5, #7 and #10 stones and natural sands. The
RAP was processed and then sieved as RAP passing 3/4” and 5/16”. The RAP content in
the mixture was 50% for all three mixtures and its asphalt content was 4.61%.
Table 5-1. Gradation of the aggregates used in the mixtures
Sieve Size
Percentage Passing
# 5 # 7 # 10 Natural Sand RAP Processed
Total Passing 3/4 Passing 5/16
1.25" 100 100 100 100 100 100 100
3/4" 56 100 100 100 100 100 91
3/8" 8 54 100 100 68 100 71
No.4 2 5 86 95 35 95 56
No.8 1 3 56 82 22 72 40
No.30 0 0 23 50 14 37 21
No.50 0 0 16 28 10 27 14
No.100 0 0 12 12.7 6 20 9.6
No.200 0 0 9.5 4.6 4 13.5 6.3
Total 20 5 15 10 25 25 100

36
For the calculation of mobilization rate, the aggregate of the mixture could be
divided into two aggregate sizes as shown in Figure 5-3. The large aggregate was the
portion of aggregate retained on 3/4” sieve, and the rest was small aggregate. The
mobilization rate of virgin aggregate could be determined from large aggregate because
large aggregate was 100% virgin aggregate (Figure 5-3). The surface area was 28.4 ft2/lb
for small aggregate and 2.0 ft2/lb for large aggregate [57]. The surface area proportions
were 0.006 and 0.994 for the large and the small aggregates, respectively.
Figure 5-3 Proportions of large and small aggregates by mass
5.2 Results and Discussions
5.2.1 Influence of test conditions on MGV
It is expected that the MGV of an image is affected by experimental conditions.
Figure 5-4 shows the MGVs of virgin and aged asphalt as a function of exposure time and
wavelengths of excited light. It can be seen that the MGVs increased with an extended
exposure time. In the low MGV range (<50000), there was a linear relationship between

37
MGV and exposure time, but the trend became quadratic gradually in high MGV region
(>50000). The MGVs also varied under different excited lights. Therefore, the same excited
light and exposure time are required to keep the MGVs of binder being comparable.
Figure 5-4 MGVs of virgin and aged asphalt as a function of exposure time
It was also noticed that the MGVs of virgin and aged binder were almost the same
under excited wavelength of 330-380 nm, which indicates that the aged binder could not
be distinguished from virgin binder under this test condition. To differentiate between
virgin and aged binders as well as binder blends with varying aged binder content, it is
desirable that MGV is sensitive to the aged binder ratio, which means that virgin and aged
binders have a large MGV difference. Therefore, a differentiating factor (DF), which is
defined as the ratio of the MGV of aged binder to that of the virgin binder (Equation (5.1)),
was used to measure the sensitivity of MGV to the binders in this study. A lower DF means
a large MGV difference between virgin and aged asphalt binders, indicating that MGV is
more sensitive to the aged binder content in the binder blend.
Differentiation Factor =𝑀𝐺𝑉𝑎𝑔𝑒𝑑 𝑏𝑖𝑛𝑑𝑒𝑟
𝑀𝐺𝑉𝑣𝑖𝑟𝑔𝑖𝑛 𝑏𝑖𝑛𝑑𝑒𝑟 (5.1)
Figure 5-5 shows the variations of DF with exposure time and wavelength of input
light. It indicates that DF decreased first and then increased with exposure time. The
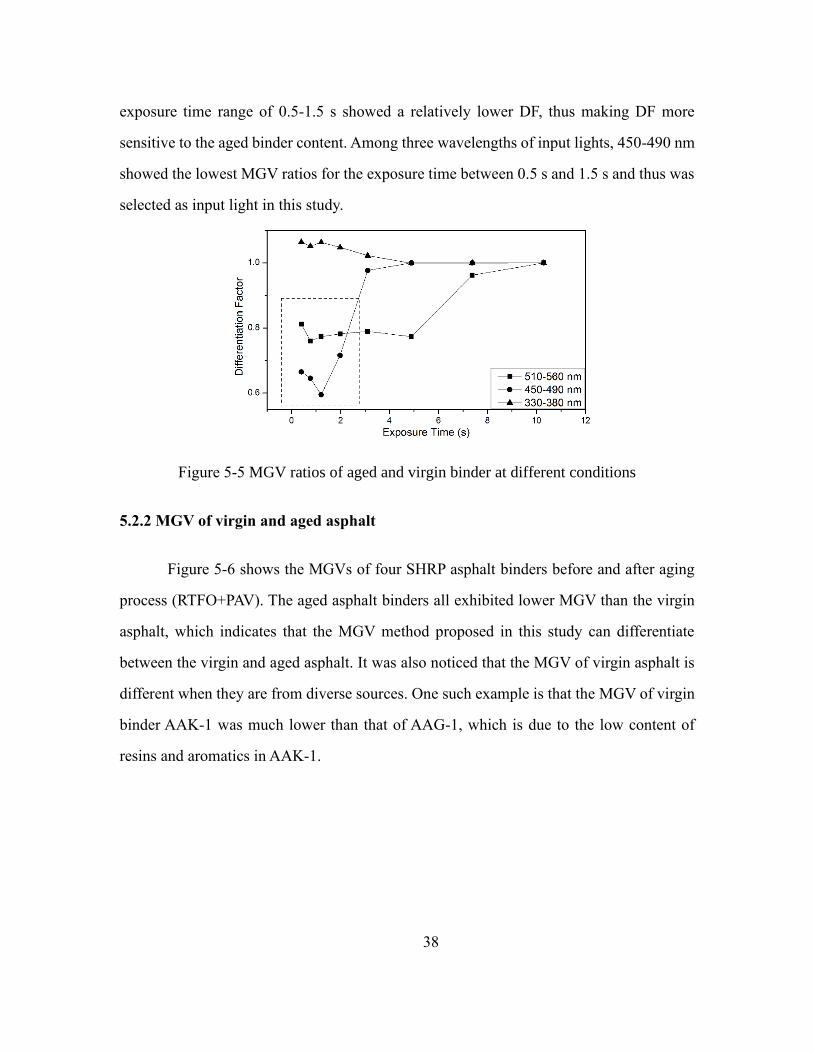
38
exposure time range of 0.5-1.5 s showed a relatively lower DF, thus making DF more
sensitive to the aged binder content. Among three wavelengths of input lights, 450-490 nm
showed the lowest MGV ratios for the exposure time between 0.5 s and 1.5 s and thus was
selected as input light in this study.
Figure 5-5 MGV ratios of aged and virgin binder at different conditions
5.2.2 MGV of virgin and aged asphalt
Figure 5-6 shows the MGVs of four SHRP asphalt binders before and after aging
process (RTFO+PAV). The aged asphalt binders all exhibited lower MGV than the virgin
asphalt, which indicates that the MGV method proposed in this study can differentiate
between the virgin and aged asphalt. It was also noticed that the MGV of virgin asphalt is
different when they are from diverse sources. One such example is that the MGV of virgin
binder AAK-1 was much lower than that of AAG-1, which is due to the low content of
resins and aromatics in AAK-1.

39
Figure 5-6 MGV of virgin and aged SHRP asphalt
5.2.3 Blending chart
The “blending chart” generated by blending one typical PG 64-22 binder with a
RAP binder is presented in Figure 5-7. Linear correlations between RAP binder content
and MGVs were revealed by a high R2 value (0.976) for virgin-RAP blend. Accordingly, a
linear regressive equation (Equation (5.2)) was obtained and can be used later to determine
the active RAP binder once the blended binder is tested for MGV. It should be noted that
Equation (5.2) was derived from the asphalt used in this study. For other asphalt, the
complete process of building a blending chart needs to be repeated because the MGV of
asphalt varies with its chemical composition.
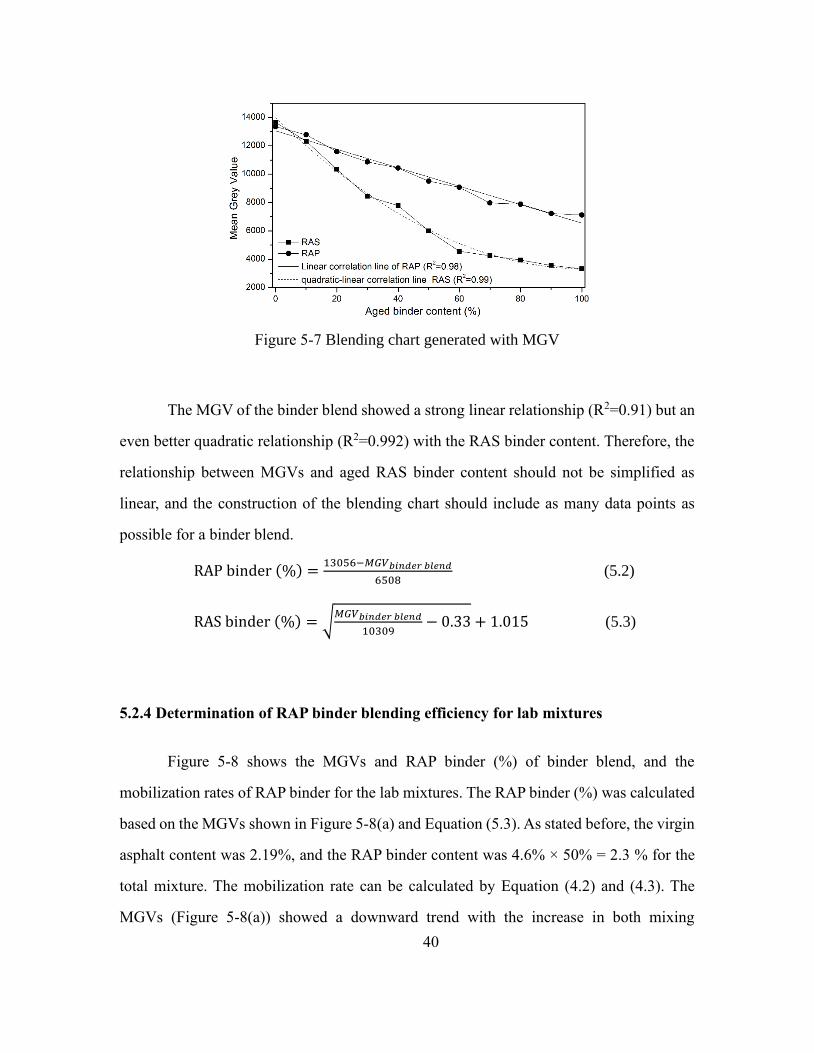
40
Figure 5-7 Blending chart generated with MGV
The MGV of the binder blend showed a strong linear relationship (R2=0.91) but an
even better quadratic relationship (R2=0.992) with the RAS binder content. Therefore, the
relationship between MGVs and aged RAS binder content should not be simplified as
linear, and the construction of the blending chart should include as many data points as
possible for a binder blend.
RAP binder (%) =13056−𝑀𝐺𝑉𝑏𝑖𝑛𝑑𝑒𝑟 𝑏𝑙𝑒𝑛𝑑
6508 (5.2)
RAS binder (%) = √𝑀𝐺𝑉𝑏𝑖𝑛𝑑𝑒𝑟 𝑏𝑙𝑒𝑛𝑑
10309− 0.33 + 1.015 (5.3)
5.2.4 Determination of RAP binder blending efficiency for lab mixtures
Figure 5-8 shows the MGVs and RAP binder (%) of binder blend, and the
mobilization rates of RAP binder for the lab mixtures. The RAP binder (%) was calculated
based on the MGVs shown in Figure 5-8(a) and Equation (5.3). As stated before, the virgin
asphalt content was 2.19%, and the RAP binder content was 4.6% × 50% = 2.3 % for the
total mixture. The mobilization rate can be calculated by Equation (4.2) and (4.3). The
MGVs (Figure 5-8(a)) showed a downward trend with the increase in both mixing
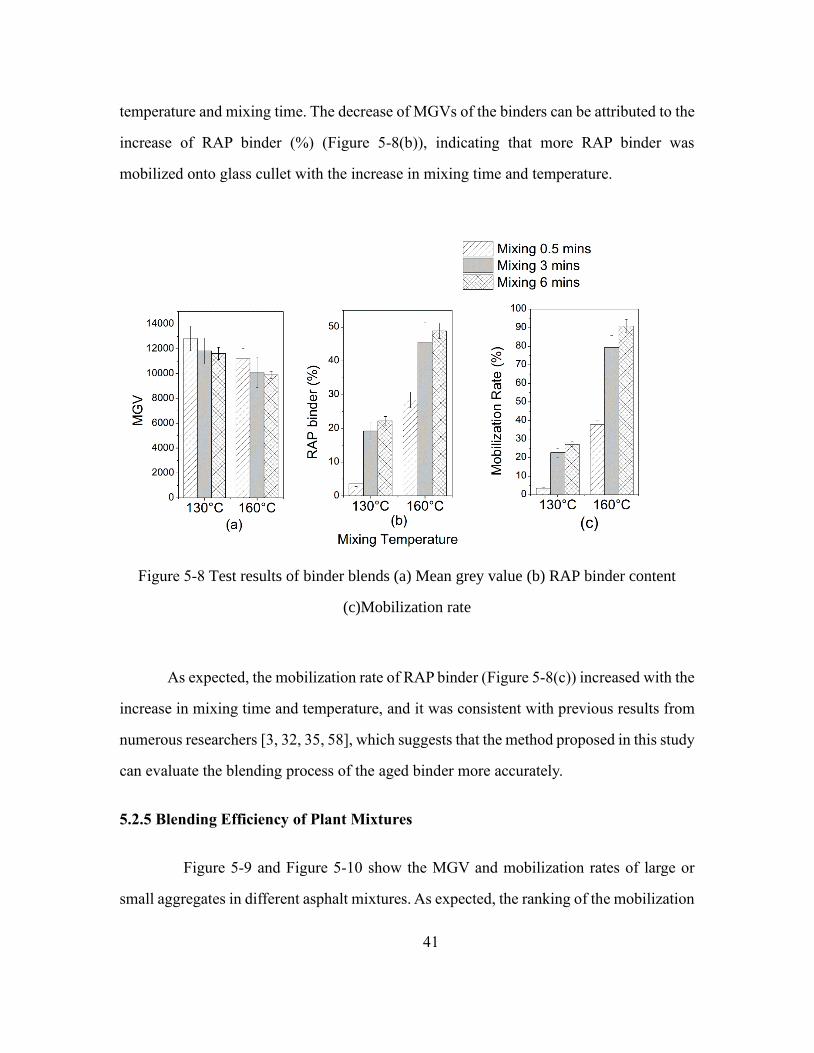
41
temperature and mixing time. The decrease of MGVs of the binders can be attributed to the
increase of RAP binder (%) (Figure 5-8(b)), indicating that more RAP binder was
mobilized onto glass cullet with the increase in mixing time and temperature.
Figure 5-8 Test results of binder blends (a) Mean grey value (b) RAP binder content
(c)Mobilization rate
As expected, the mobilization rate of RAP binder (Figure 5-8(c)) increased with the
increase in mixing time and temperature, and it was consistent with previous results from
numerous researchers [3, 32, 35, 58], which suggests that the method proposed in this study
can evaluate the blending process of the aged binder more accurately.
5.2.5 Blending Efficiency of Plant Mixtures
Figure 5-9 and Figure 5-10 show the MGV and mobilization rates of large or
small aggregates in different asphalt mixtures. As expected, the ranking of the mobilization
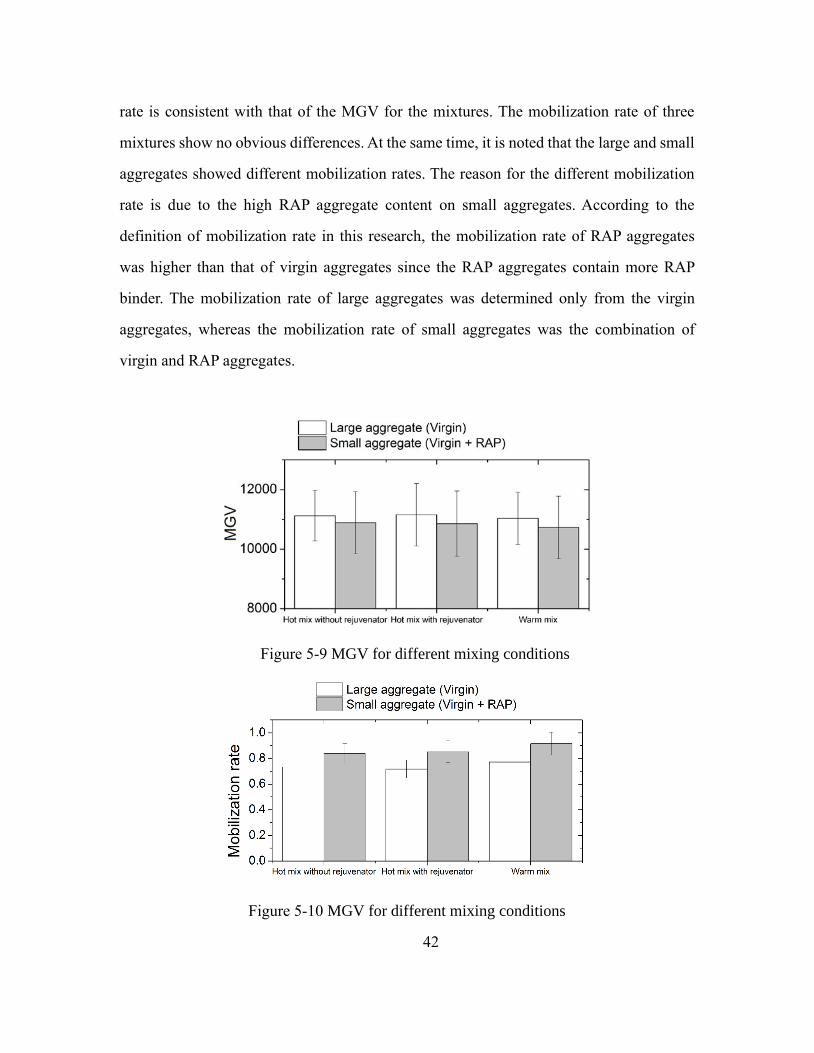
42
rate is consistent with that of the MGV for the mixtures. The mobilization rate of three
mixtures show no obvious differences. At the same time, it is noted that the large and small
aggregates showed different mobilization rates. The reason for the different mobilization
rate is due to the high RAP aggregate content on small aggregates. According to the
definition of mobilization rate in this research, the mobilization rate of RAP aggregates
was higher than that of virgin aggregates since the RAP aggregates contain more RAP
binder. The mobilization rate of large aggregates was determined only from the virgin
aggregates, whereas the mobilization rate of small aggregates was the combination of
virgin and RAP aggregates.
Figure 5-9 MGV for different mixing conditions
Figure 5-10 MGV for different mixing conditions
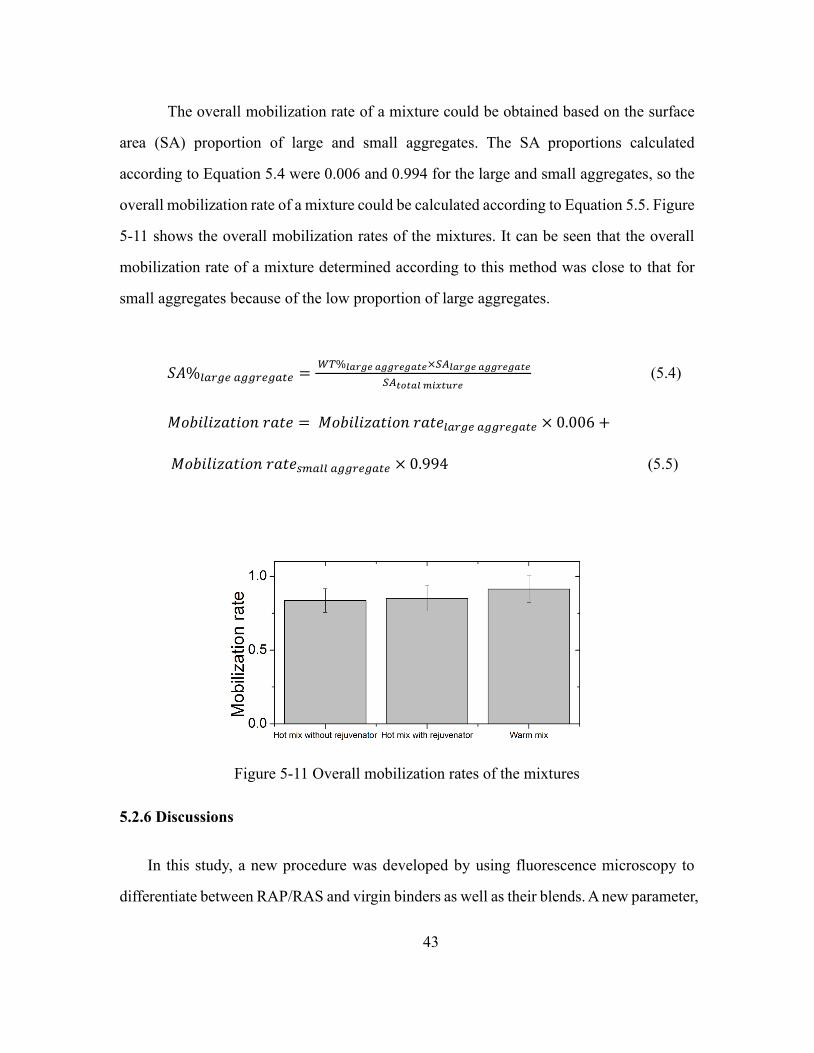
43
The overall mobilization rate of a mixture could be obtained based on the surface
area (SA) proportion of large and small aggregates. The SA proportions calculated
according to Equation 5.4 were 0.006 and 0.994 for the large and small aggregates, so the
overall mobilization rate of a mixture could be calculated according to Equation 5.5. Figure
5-11 shows the overall mobilization rates of the mixtures. It can be seen that the overall
mobilization rate of a mixture determined according to this method was close to that for
small aggregates because of the low proportion of large aggregates.
𝑆𝐴%𝑙𝑎𝑟𝑔𝑒 𝑎𝑔𝑔𝑟𝑒𝑔𝑎𝑡𝑒 = 𝑊𝑇%𝑙𝑎𝑟𝑔𝑒 𝑎𝑔𝑔𝑟𝑒𝑔𝑎𝑡𝑒×𝑆𝐴𝑙𝑎𝑟𝑔𝑒 𝑎𝑔𝑔𝑟𝑒𝑔𝑎𝑡𝑒
𝑆𝐴𝑡𝑜𝑡𝑎𝑙 𝑚𝑖𝑥𝑡𝑢𝑟𝑒 (5.4)
𝑀𝑜𝑏𝑖𝑙𝑖𝑧𝑎𝑡𝑖𝑜𝑛 𝑟𝑎𝑡𝑒 = 𝑀𝑜𝑏𝑖𝑙𝑖𝑧𝑎𝑡𝑖𝑜𝑛 𝑟𝑎𝑡𝑒𝑙𝑎𝑟𝑔𝑒 𝑎𝑔𝑔𝑟𝑒𝑔𝑎𝑡𝑒 × 0.006 +
𝑀𝑜𝑏𝑖𝑙𝑖𝑧𝑎𝑡𝑖𝑜𝑛 𝑟𝑎𝑡𝑒𝑠𝑚𝑎𝑙𝑙 𝑎𝑔𝑔𝑟𝑒𝑔𝑎𝑡𝑒 × 0.994 (5.5)
Figure 5-11 Overall mobilization rates of the mixtures
5.2.6 Discussions
In this study, a new procedure was developed by using fluorescence microscopy to
differentiate between RAP/RAS and virgin binders as well as their blends. A new parameter,
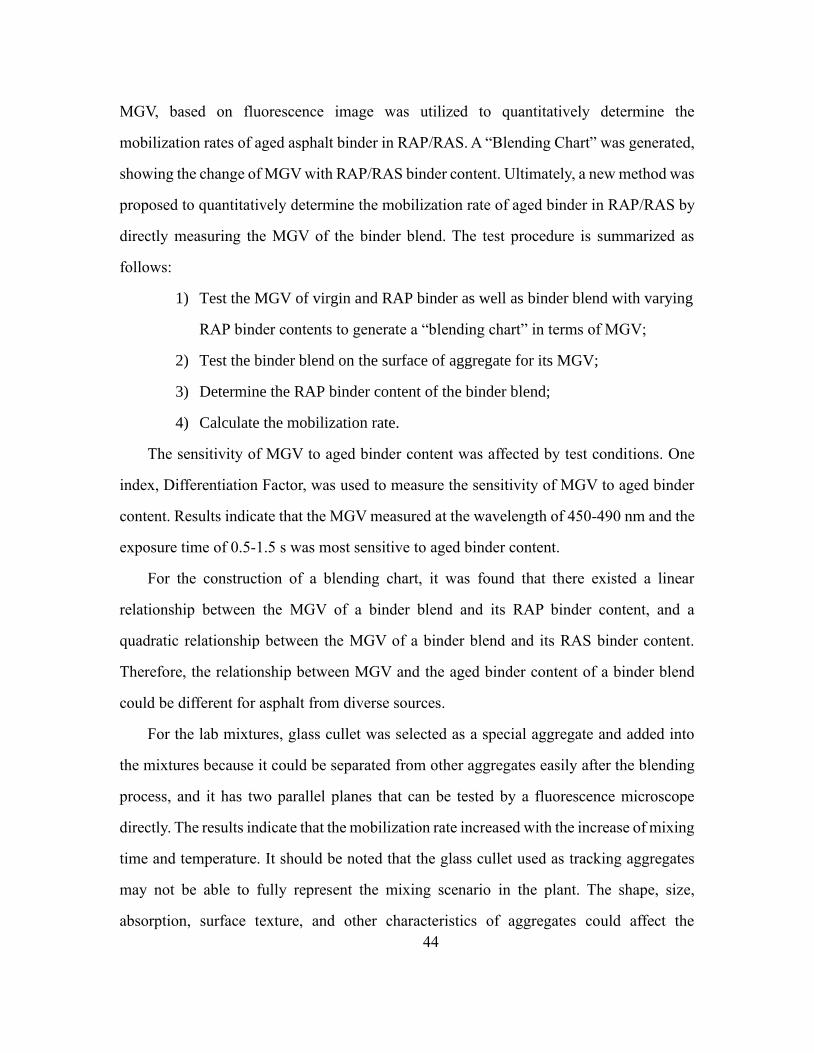
44
MGV, based on fluorescence image was utilized to quantitatively determine the
mobilization rates of aged asphalt binder in RAP/RAS. A “Blending Chart” was generated,
showing the change of MGV with RAP/RAS binder content. Ultimately, a new method was
proposed to quantitatively determine the mobilization rate of aged binder in RAP/RAS by
directly measuring the MGV of the binder blend. The test procedure is summarized as
follows:
1) Test the MGV of virgin and RAP binder as well as binder blend with varying
RAP binder contents to generate a “blending chart” in terms of MGV;
2) Test the binder blend on the surface of aggregate for its MGV;
3) Determine the RAP binder content of the binder blend;
4) Calculate the mobilization rate.
The sensitivity of MGV to aged binder content was affected by test conditions. One
index, Differentiation Factor, was used to measure the sensitivity of MGV to aged binder
content. Results indicate that the MGV measured at the wavelength of 450-490 nm and the
exposure time of 0.5-1.5 s was most sensitive to aged binder content.
For the construction of a blending chart, it was found that there existed a linear
relationship between the MGV of a binder blend and its RAP binder content, and a
quadratic relationship between the MGV of a binder blend and its RAS binder content.
Therefore, the relationship between MGV and the aged binder content of a binder blend
could be different for asphalt from diverse sources.
For the lab mixtures, glass cullet was selected as a special aggregate and added into
the mixtures because it could be separated from other aggregates easily after the blending
process, and it has two parallel planes that can be tested by a fluorescence microscope
directly. The results indicate that the mobilization rate increased with the increase of mixing
time and temperature. It should be noted that the glass cullet used as tracking aggregates
may not be able to fully represent the mixing scenario in the plant. The shape, size,
absorption, surface texture, and other characteristics of aggregates could affect the

45
mobilization rate of aged binder. Further research is needed to investigate the effects of
these factors and to find more suitable tracking materials.
5.3 Conclusions
A method was proposed to determine the mobilization rate of RAP asphalt mixtures
using fluorescence microscopy. By using this method, aggregate particles coated with
asphalt binder can be directly tested by fluorescence microscopy to estimate binder content.
There is no need to cut asphalt mixture samples and hide the aggregate as the method from
Navaro et al. [35]. Therefore, fluorescence microscopy is potentially a simple, effective
and efficient method for determining the RAP/RAS blending efficiency. To validate the
proposed method, lab mixtures and three plant-produced asphalt mixtures were tested for
their blending efficiency. The plant-produced mixtures included a hot mix with rejuvenator,
a hot mix without rejuvenator, and a warm mix with foaming technology. Based on the
results, the following conclusions can be drawn:
1) The new method was developed and validated for determining blending efficiency
of RAP/RAS asphalt mixtures using fluorescence microscopy.
2) The MGV of fluorescence image could be used to determine the mobilization rate
of RAP/RAS mixtures. There existed a linear relationship between the MGV of a
binder blend and its RAP binder content, and a quadratic relationship between the
MGV of a binder blend and its RAS binder content.
3) The mobilization rates were different for large and small aggregates because of
different RAP/RAS contents. The overall mobilization rate of a mixture could be
determined by considering the surface area of large and small aggregate.
4) Among the three plant-produced mixtures, the warm mix with foaming technology
showed the highest mobilization rate, which should be further investigated in the
future.

46
Chapter 6 BLENDING EFFICIENCY OF PLANT
MIXTURES
In this chapter, to evaluate the blending efficiency of recycled asphalt mixtures from
different types of asphalt plants and to achieve a better understanding of the effects of
production conditions on the blending efficiency, the blending efficiencies of 14 recycled
asphalt mixtures from different types of asphalt plants were evaluated by two methods, the
fluorescence microscopy and GPC. The findings in the present study can help maximize
the use of RAP/RAS in asphalt mixtures and improve the design of the mixtures containing
RAP/RAS.
6.1 Plant Mixtures
14 recycled asphalt mixtures were collected in Tennessee and tested for their
blending efficiency. Table 6-1 presents the information about their mix design.
The mixtures were collected from three different types of plant in terms of mixing
technologies including double barrel drum, regular drum, and batch mixing. Information
on the production conditions is presented in Table 6-2. The double barrel plant can heat
RAP/RAS aggregates and active RAP/RAS binders more efficiently because the inner
barrel can heat aggregates continually during the mixing process. For the mixtures from
the batch plants, RAP/RAS is weighed on its own separate scale or weigh hopper. The main
difference between the batch plant and the drum plant is that the RAP/RAS can only be
heated by virgin aggregates in the batch plant, which limits the amount of RAP/RAS that
can be used in the mixture and may have an influence on the blending efficiency.
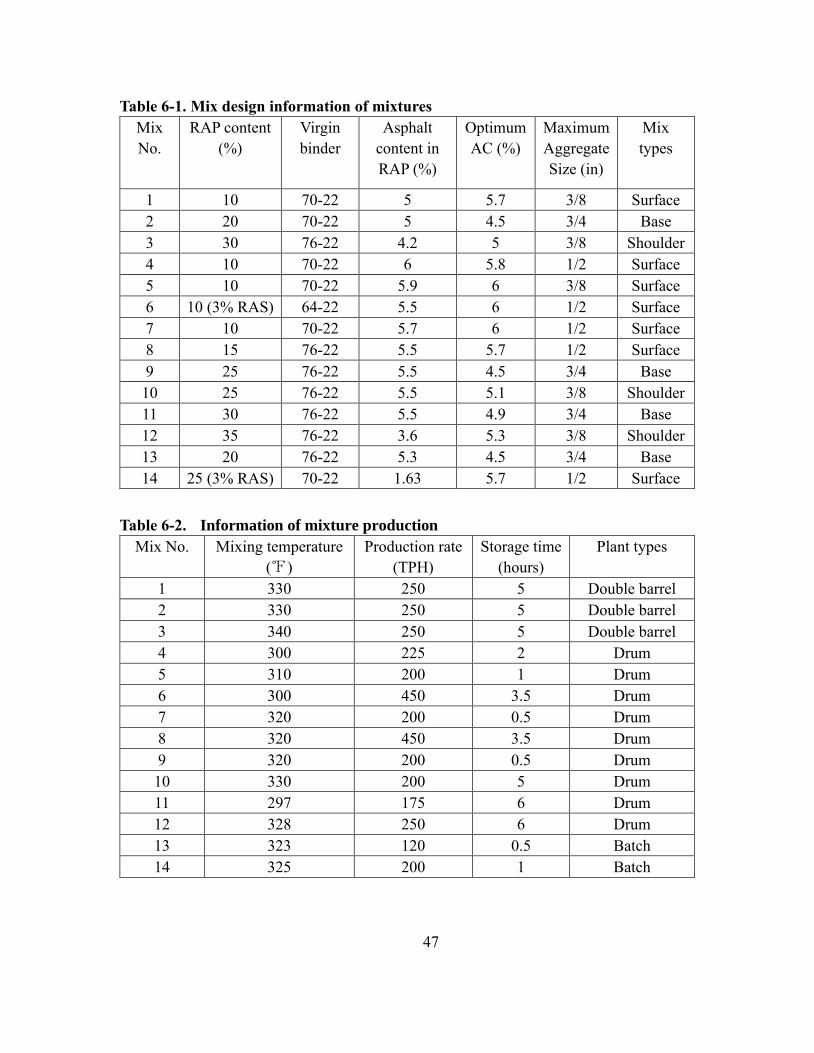
47
Table 6-1. Mix design information of mixtures
Mix
No.
RAP content
(%)
Virgin
binder
Asphalt
content in
RAP (%)
Optimum
AC (%)
Maximum
Aggregate
Size (in)
Mix
types
1 10 70-22 5 5.7 3/8 Surface
2 20 70-22 5 4.5 3/4 Base
3 30 76-22 4.2 5 3/8 Shoulder
4 10 70-22 6 5.8 1/2 Surface
5 10 70-22 5.9 6 3/8 Surface
6 10 (3% RAS) 64-22 5.5 6 1/2 Surface
7 10 70-22 5.7 6 1/2 Surface
8 15 76-22 5.5 5.7 1/2 Surface
9 25 76-22 5.5 4.5 3/4 Base
10 25 76-22 5.5 5.1 3/8 Shoulder
11 30 76-22 5.5 4.9 3/4 Base
12 35 76-22 3.6 5.3 3/8 Shoulder
13 20 76-22 5.3 4.5 3/4 Base
14 25 (3% RAS) 70-22 1.63 5.7 1/2 Surface
Table 6-2. Information of mixture production
Mix No. Mixing temperature
(℉)
Production rate
(TPH)
Storage time
(hours)
Plant types
1 330 250 5 Double barrel
2 330 250 5 Double barrel
3 340 250 5 Double barrel
4 300 225 2 Drum
5 310 200 1 Drum
6 300 450 3.5 Drum
7 320 200 0.5 Drum
8 320 450 3.5 Drum
9 320 200 0.5 Drum
10 330 200 5 Drum
11 297 175 6 Drum
12 328 250 6 Drum
13 323 120 0.5 Batch
14 325 200 1 Batch

48
6.2 Laboratory Testing Procedures
6.2.1 Procedure for determining blending efficiency
For the mixture with a lower blending efficiency, only a part of the aged binder film
around the RAP/RAS aggregate is mobilized and blended into the virgin binder to form a
binder blend during the mixing process. The inner layer of the RAP/RAS binder is not
mobilized and does not contribute to binder blend. The mobilized RAP/RAS binder may
also interact with the virgin binder, yielding a homogeneous binder blend that coats both
virgin and RAP/RAS aggregates. The mobilization rate, which was defined as the
percentage of RAP/RAS binder that can be mobilized from RAP/RAS to virgin asphalt,
has been used to evaluate the blending efficiency [59].
If the RAP/RAS binder content can be determined in a binder blend, similar to
Equation (4.3), the percentage of mobilized RAP/RAS binder can be calculated based on
the proportions of total virgin and RAP/RAS binder as shown in Equation 6.1.
Mobilization rate = P(b, Virgin) ∙ RAP/RAS binder (%)Blend
P(b, RAP) ∙ (1 − RAP/RAS binder (%)Blend) (6.1)
Where, P(b, RAP) means the percentage of RAP/RAS binder by total mixture, P(b,
virgin) means the percentage of virgin binder by total mixture. RAP/RAS Binder (%) Blend
means the aged asphalt content in the binder blend. A straightforward method to determine
RAP/RAS Binder (%) Blend is to build a blending chart with one certain parameter and
interpolate the laboratory-testing result of the sample.
As mentioned above, the virgin aggregates could not be separated from the
RAP/RAS aggregates in plant mixtures. Therefore, the key of the test method is how to
select the binder blend to best test blending efficiency. The aged asphalt content of a binder
blend can be determined by both the fluorescence microscopy and GPC methods. The
sketch of the two methods is illustrated in Figure 6-1. As indicated, the fluorescence
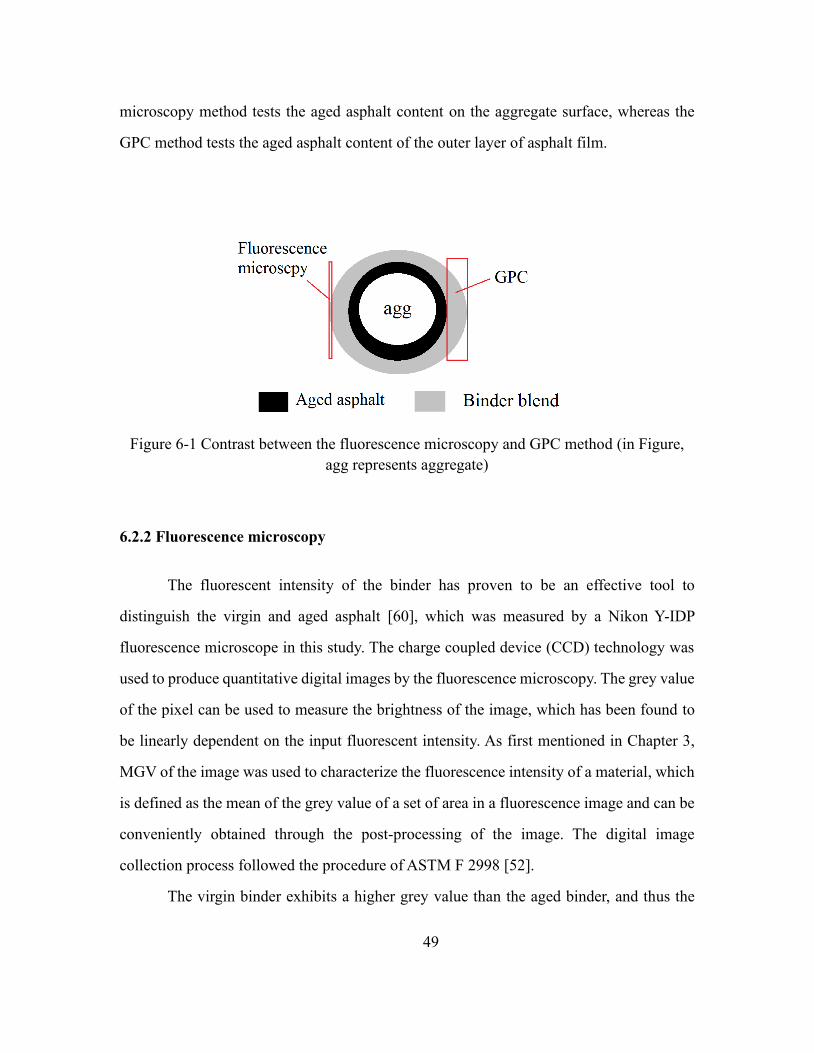
49
microscopy method tests the aged asphalt content on the aggregate surface, whereas the
GPC method tests the aged asphalt content of the outer layer of asphalt film.
Figure 6-1 Contrast between the fluorescence microscopy and GPC method (in Figure,
agg represents aggregate)
6.2.2 Fluorescence microscopy
The fluorescent intensity of the binder has proven to be an effective tool to
distinguish the virgin and aged asphalt [60], which was measured by a Nikon Y-IDP
fluorescence microscope in this study. The charge coupled device (CCD) technology was
used to produce quantitative digital images by the fluorescence microscopy. The grey value
of the pixel can be used to measure the brightness of the image, which has been found to
be linearly dependent on the input fluorescent intensity. As first mentioned in Chapter 3,
MGV of the image was used to characterize the fluorescence intensity of a material, which
is defined as the mean of the grey value of a set of area in a fluorescence image and can be
conveniently obtained through the post-processing of the image. The digital image
collection process followed the procedure of ASTM F 2998 [52].
The virgin binder exhibits a higher grey value than the aged binder, and thus the
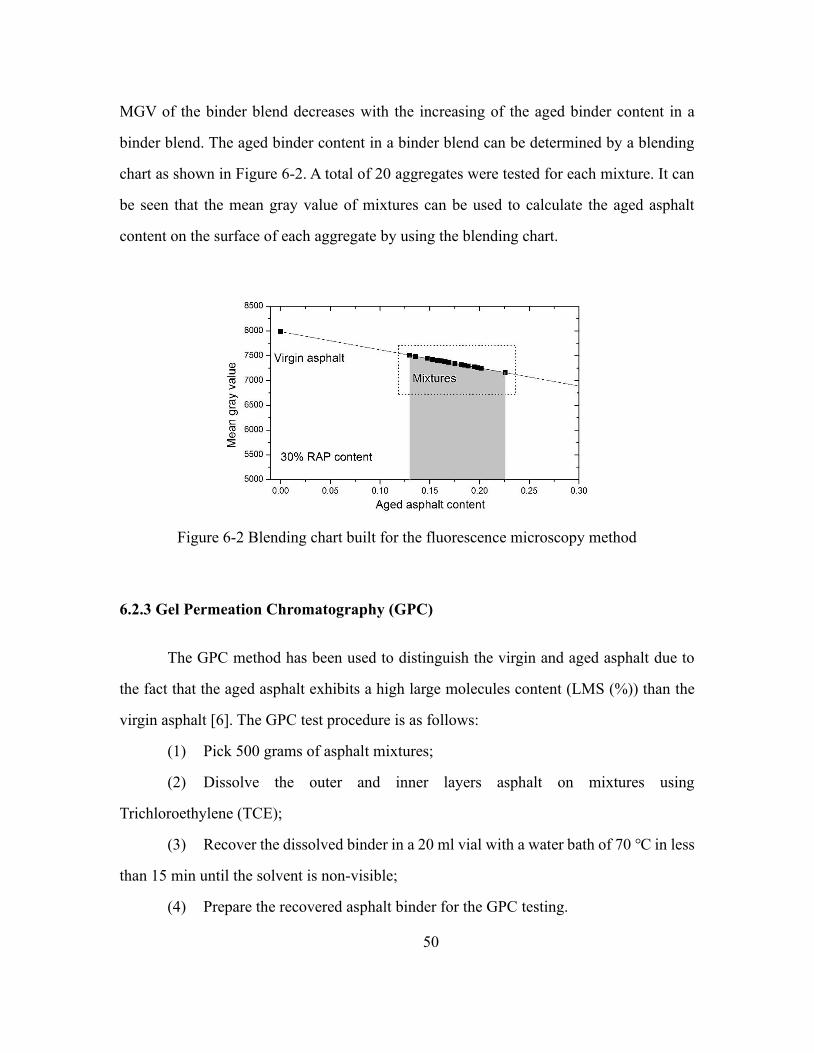
50
MGV of the binder blend decreases with the increasing of the aged binder content in a
binder blend. The aged binder content in a binder blend can be determined by a blending
chart as shown in Figure 6-2. A total of 20 aggregates were tested for each mixture. It can
be seen that the mean gray value of mixtures can be used to calculate the aged asphalt
content on the surface of each aggregate by using the blending chart.
Figure 6-2 Blending chart built for the fluorescence microscopy method
6.2.3 Gel Permeation Chromatography (GPC)
The GPC method has been used to distinguish the virgin and aged asphalt due to
the fact that the aged asphalt exhibits a high large molecules content (LMS (%)) than the
virgin asphalt [6]. The GPC test procedure is as follows:
(1) Pick 500 grams of asphalt mixtures;
(2) Dissolve the outer and inner layers asphalt on mixtures using
Trichloroethylene (TCE);
(3) Recover the dissolved binder in a 20 ml vial with a water bath of 70 ℃ in less
than 15 min until the solvent is non-visible;
(4) Prepare the recovered asphalt binder for the GPC testing.
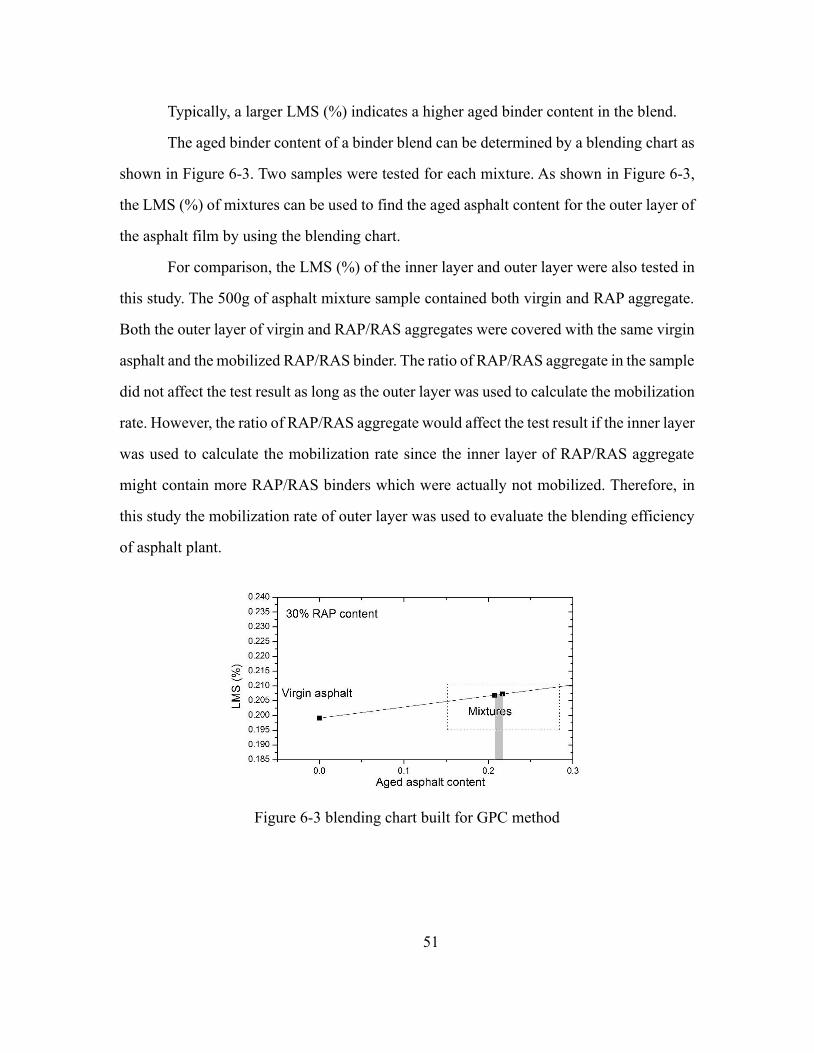
51
Typically, a larger LMS (%) indicates a higher aged binder content in the blend.
The aged binder content of a binder blend can be determined by a blending chart as
shown in Figure 6-3. Two samples were tested for each mixture. As shown in Figure 6-3,
the LMS (%) of mixtures can be used to find the aged asphalt content for the outer layer of
the asphalt film by using the blending chart.
For comparison, the LMS (%) of the inner layer and outer layer were also tested in
this study. The 500g of asphalt mixture sample contained both virgin and RAP aggregate.
Both the outer layer of virgin and RAP/RAS aggregates were covered with the same virgin
asphalt and the mobilized RAP/RAS binder. The ratio of RAP/RAS aggregate in the sample
did not affect the test result as long as the outer layer was used to calculate the mobilization
rate. However, the ratio of RAP/RAS aggregate would affect the test result if the inner layer
was used to calculate the mobilization rate since the inner layer of RAP/RAS aggregate
might contain more RAP/RAS binders which were actually not mobilized. Therefore, in
this study the mobilization rate of outer layer was used to evaluate the blending efficiency
of asphalt plant.
Figure 6-3 blending chart built for GPC method
52
6.2.4 Mobilization rate of a mixture
To obtain an accurate estimation of the overall blending efficiency for a RAP/RAS
mixture, the aggregate size needs to be considered. For the fluorescence microscopy
method, the requirement for the test sample is that the aggregate has a plane larger than 1
square millimeter. Therefore, the aggregates retained on No. 4 sieve was selected as the test
sample. The overall mobilization rate of a mixture was obtained by the mean value of 20
aggregates considering both the test efficiency and accuracy. For the GPC method, 500
grams of mixtures were selected as one sample and the average of two samples served as
the total mobilization rate of the mixture.
6.2.5 Multiple Regression
To gain insight into the factors affecting the binder mobilization rate of RAP/RAS,
a multiple regression model was adopted to examine the potential correlations between the
mobilization rate and the mix design parameters as well as the production conditions. The
following factors were considered in the multiple regression model: the RAP/RAS content,
the performance grade of the virgin binder (higher temperature), the virgin binder content,
the mixing temperature, the production rate of asphalt plant, and the silo storage time.
6.3 Results and Discussions
6.3.1 Mobilization rate of fluorescence microscopy and GPC method
Figure 6-4 and Figure 6-5 show the overall mobilization rate of 14 mixtures by
using the fluorescence microscopy and GPC. It was found that the overall mobilization
rates of the mixtures were in the range of 0.4 to 1.0 for the fluorescence microscopy method
and 0.37 to 0.83 for the GPC method. The difference between the fluorescence microscopy
and GPC methods was probably due to the surface of asphalt being aged during the
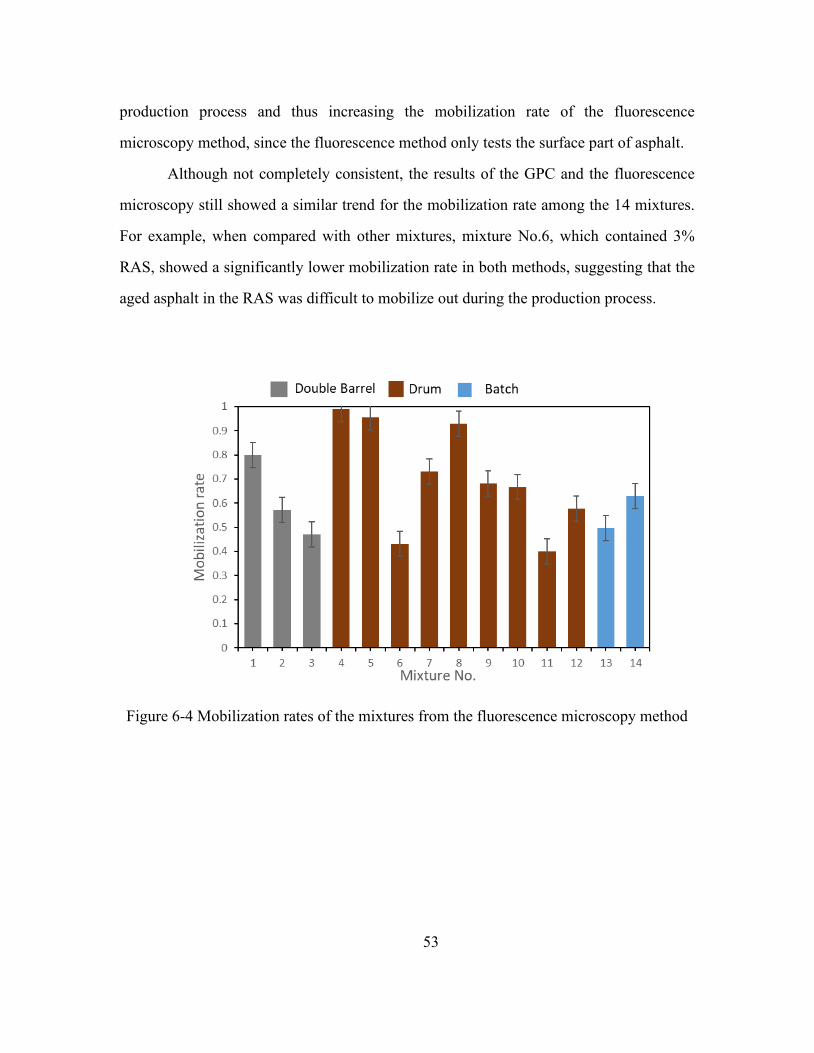
53
production process and thus increasing the mobilization rate of the fluorescence
microscopy method, since the fluorescence method only tests the surface part of asphalt.
Although not completely consistent, the results of the GPC and the fluorescence
microscopy still showed a similar trend for the mobilization rate among the 14 mixtures.
For example, when compared with other mixtures, mixture No.6, which contained 3%
RAS, showed a significantly lower mobilization rate in both methods, suggesting that the
aged asphalt in the RAS was difficult to mobilize out during the production process.
Figure 6-4 Mobilization rates of the mixtures from the fluorescence microscopy method
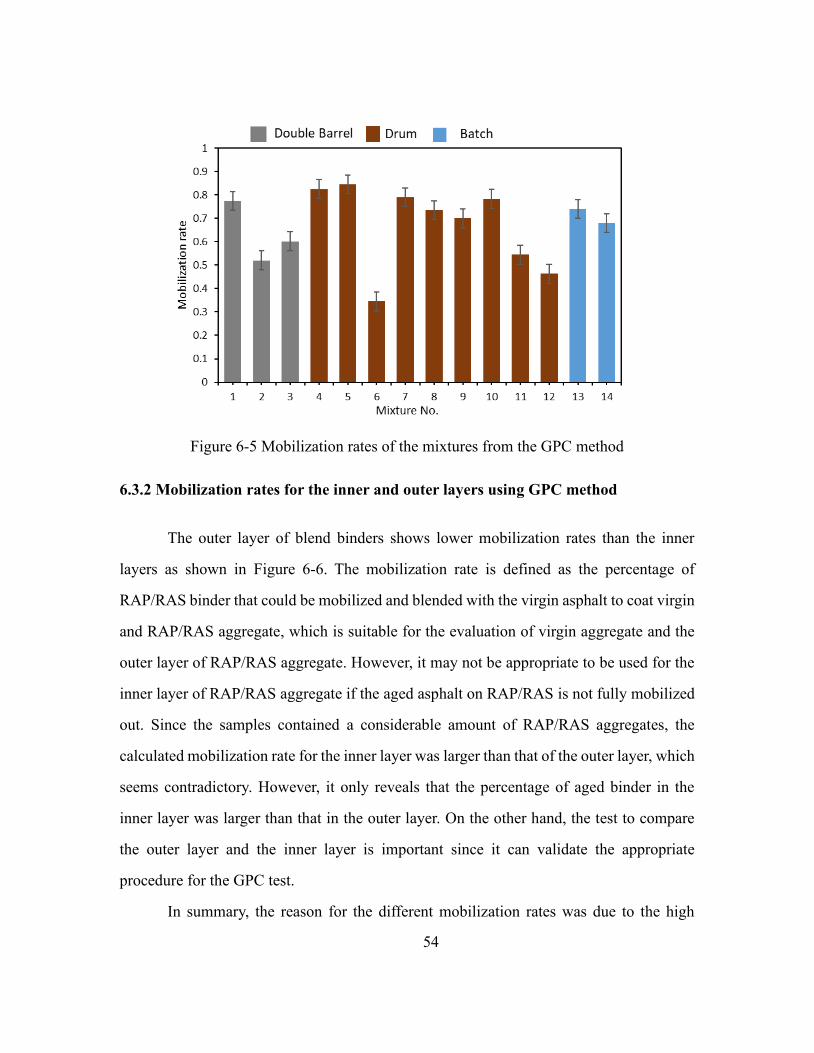
54
Figure 6-5 Mobilization rates of the mixtures from the GPC method
6.3.2 Mobilization rates for the inner and outer layers using GPC method
The outer layer of blend binders shows lower mobilization rates than the inner
layers as shown in Figure 6-6. The mobilization rate is defined as the percentage of
RAP/RAS binder that could be mobilized and blended with the virgin asphalt to coat virgin
and RAP/RAS aggregate, which is suitable for the evaluation of virgin aggregate and the
outer layer of RAP/RAS aggregate. However, it may not be appropriate to be used for the
inner layer of RAP/RAS aggregate if the aged asphalt on RAP/RAS is not fully mobilized
out. Since the samples contained a considerable amount of RAP/RAS aggregates, the
calculated mobilization rate for the inner layer was larger than that of the outer layer, which
seems contradictory. However, it only reveals that the percentage of aged binder in the
inner layer was larger than that in the outer layer. On the other hand, the test to compare
the outer layer and the inner layer is important since it can validate the appropriate
procedure for the GPC test.
In summary, the reason for the different mobilization rates was due to the high

55
content of RAP/RAS binder in the inner layer of the RAP/RAS aggregate. It can be
predicted that the distributions of virgin and RAP/RAS binders were not homogeneous in
the mixtures in this study.
Figure 6-6 Mobilization rate of inner layer and outer layer
6.3.3 Correlation between GPC and fluorescence results
A linear regression and one-way analysis of variance (ANOVA) were conducted
between the results from the fluorescence microscopy and the GPC method. The R2 of the
linear regression is 0.557 and the p-value of the ANOVA was 0.0022. As shown in Figure
6-7, the results of the fluorescence microscopy and the GPC method generally share the
similar trend.
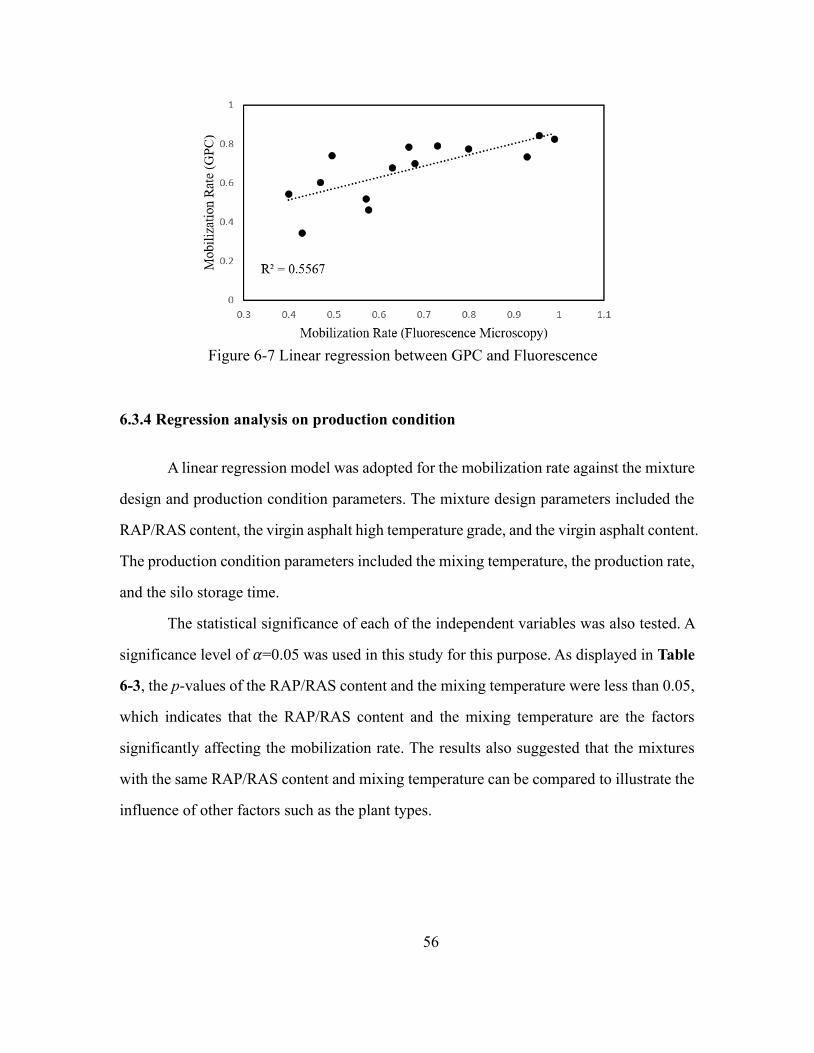
56
Figure 6-7 Linear regression between GPC and Fluorescence
6.3.4 Regression analysis on production condition
A linear regression model was adopted for the mobilization rate against the mixture
design and production condition parameters. The mixture design parameters included the
RAP/RAS content, the virgin asphalt high temperature grade, and the virgin asphalt content.
The production condition parameters included the mixing temperature, the production rate,
and the silo storage time.
The statistical significance of each of the independent variables was also tested. A
significance level of 𝛼=0.05 was used in this study for this purpose. As displayed in Table
6-3, the p-values of the RAP/RAS content and the mixing temperature were less than 0.05,
which indicates that the RAP/RAS content and the mixing temperature are the factors
significantly affecting the mobilization rate. The results also suggested that the mixtures
with the same RAP/RAS content and mixing temperature can be compared to illustrate the
influence of other factors such as the plant types.
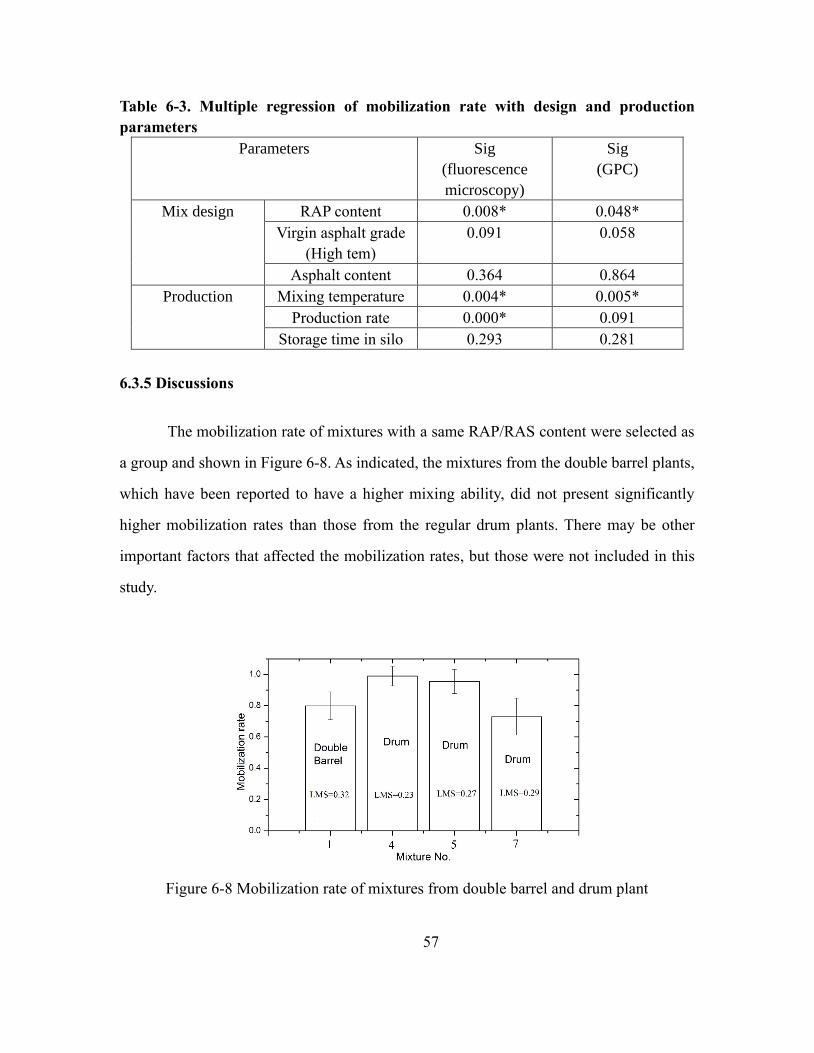
57
Table 6-3. Multiple regression of mobilization rate with design and production
parameters
Parameters Sig
(fluorescence
microscopy)
Sig
(GPC)
Mix design RAP content 0.008* 0.048*
Virgin asphalt grade
(High tem)
0.091 0.058
Asphalt content 0.364 0.864
Production Mixing temperature 0.004* 0.005*
Production rate 0.000* 0.091
Storage time in silo 0.293 0.281
6.3.5 Discussions
The mobilization rate of mixtures with a same RAP/RAS content were selected as
a group and shown in Figure 6-8. As indicated, the mixtures from the double barrel plants,
which have been reported to have a higher mixing ability, did not present significantly
higher mobilization rates than those from the regular drum plants. There may be other
important factors that affected the mobilization rates, but those were not included in this
study.
Figure 6-8 Mobilization rate of mixtures from double barrel and drum plant
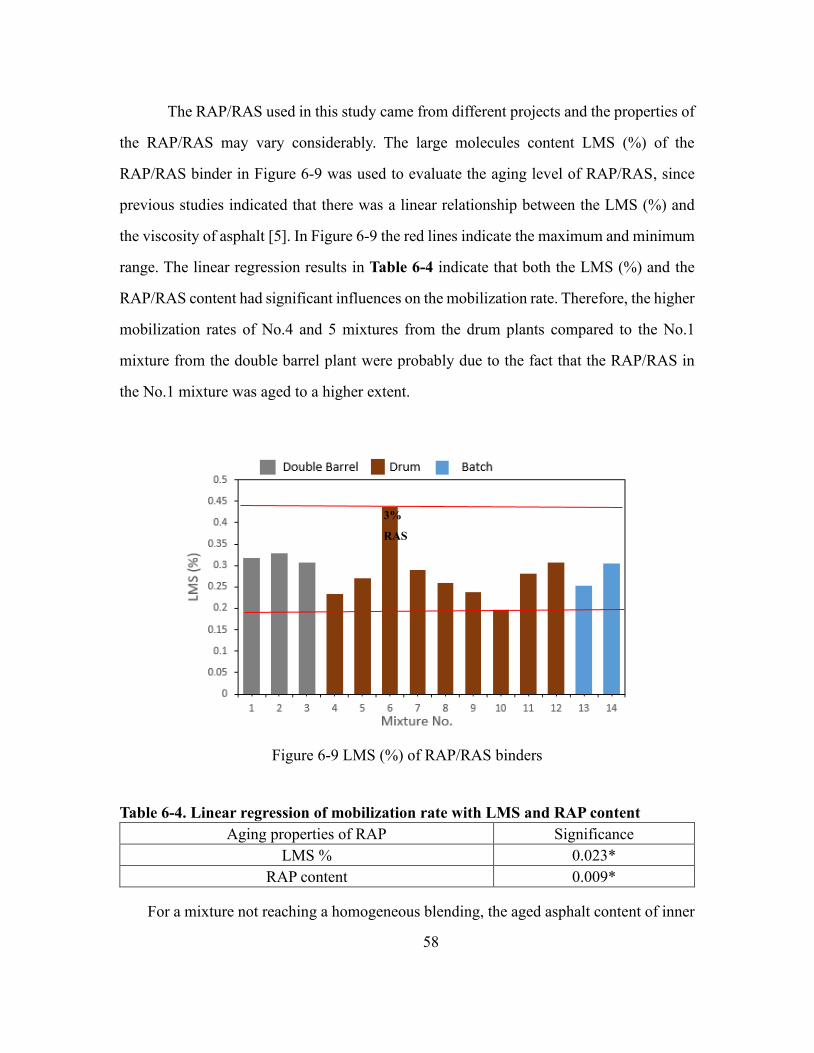
58
The RAP/RAS used in this study came from different projects and the properties of
the RAP/RAS may vary considerably. The large molecules content LMS (%) of the
RAP/RAS binder in Figure 6-9 was used to evaluate the aging level of RAP/RAS, since
previous studies indicated that there was a linear relationship between the LMS (%) and
the viscosity of asphalt [5]. In Figure 6-9 the red lines indicate the maximum and minimum
range. The linear regression results in Table 6-4 indicate that both the LMS (%) and the
RAP/RAS content had significant influences on the mobilization rate. Therefore, the higher
mobilization rates of No.4 and 5 mixtures from the drum plants compared to the No.1
mixture from the double barrel plant were probably due to the fact that the RAP/RAS in
the No.1 mixture was aged to a higher extent.
Figure 6-9 LMS (%) of RAP/RAS binders
Table 6-4. Linear regression of mobilization rate with LMS and RAP content
Aging properties of RAP Significance
LMS % 0.023*
RAP content 0.009*
For a mixture not reaching a homogeneous blending, the aged asphalt content of inner
3%
RAS
59
layer is higher than that of outer layer for the RAP/RAS aggregate. Therefore, when using
GPC method, the final calculated mobilization rate could vary based on the measuring
depth of asphalt film as shown in Figure 6-6. Caution should be taken in lixiviating binder
blend using a chemical solvent to reach a standard depth of asphalt film.
6.4 Conclusions
By using the fluorescence microscopy and GPC, this study tested a total of 14 plant-
produced asphalt mixtures for their RAP/RAS binder mobilization rates. The purpose of
the tests was to analyze the effects of production conditions on the blending efficiency of
different types of mixture plant. A multiple regression model was adopted to evaluate the
influence of the mixture design and the production condition parameters on the
mobilization rates. Based on the results from the study, the following conclusions can be
drawn:
1) The overall mobilization rates of 14 plant mixtures were in the range of 0.4 to 1.0
for the fluorescence microscopy method and 0.37 to 0.83 for the GPC method.
2) Although not the same, the mobilization rates obtained from the fluorescence
microscopy and the GPC methods showed a similar trend in the mobilization rate
among the 14 mixtures. The R2 of the linear regression between GPC and
fluorescence results is 0.557.
3) According to the LMS (%) results from the GPC tests, the mobilization rates for
the inner layer and the outer layer are different, indicating that only a part of the
aged binder in the RAP/RAS was mobilized in the mixtures.
4) Among the production condition parameters of asphalt mixture plants, the mixing
temperature and the percentage of RAP/RAS showed significant influences on the
mobilization rate. Other factors such as the virgin asphalt high temperature grade
and the virgin asphalt content did not exhibit a significant influence on the

60
mobilization rate in this study, which should be further investigated with more
samples.
5) According to the linear regression results, the aging level of the RAP/RAS binder
also had a significant influence on the mobilization rate.
61
Chapter 7 UTILIZING MECHANICAL PROPERTY
METHOD TO INVESTIGATE THE INFLUENCE OF
REJUVENATOR
This chapter reviews a preliminary study that was performed to investigate the
influence of different rejuvenator incorporation methods on the rheological and aging
properties of the recycled asphalt binders. To achieve this, the extracted RAS/RAP binders
were mixed with the virgin binder and the rejuvenator using different incorporation
methods, and dynamic shear rheometer (DSR) tests were performed to identify the
rheological properties of binder blends with various composition ratios. To analyze the
aging properties, the binder blends were subjected to short-term and long-term aging were
also tested by DSR. In addition, GPC tests and the mass loss tests were adopted in an
attempt to clarify this aging phenomenon.
7.1 Introduction
During the last decades, both RAP and, less commonly, RAS have been used in the
asphalt industry given their economic and environmental benefits [8, 61-63]. However,
utilizing RAP or RAS solely will produce stiff mixtures and, consequently, be less
workable for field compaction, which may lead to premature field failures [17]. One option
to reduce the stiffness of RAP and RAS mixtures is to incorporate the rejuvenators.
Generally, rejuvenators contain a high proportion of maltene components, which can
balance the loss of maltenes in aged binders during construction [64].
There are serval types of rejuvenators, which can be classified as aromatic extracts,
tall oils, fatty acids, paraffinic oils, napthenic oils based on National Center for Asphalt
Technology (NCAT) [65]. Composite recycling agents including bio-based oils and

62
modified vegetable oils are also currently available on the market. Previous studies
concluded that different rejuvenators can cause a various effect on binder blends and
asphalt mixtures [66]. Zaumanis et al. observed that the required amount of organic
products including the tall oil and the waste vegetable oil to reduce the Superpave
performance grading of recycled asphalt binders and mixtures is much lower than the
petroleum-based products, such as the aromatic extract and waste engine oil [67, 68].
Nabizadhe et al. compared the rejuvenating effect of tall oil, soybean oil, and aromatic
extract, summarizing that the aromatic extract was the most effective recycling agent to
increase the crack resistance and reduce the stiffness of a recycled mixture with a high
percentage of the RAP content [69].
The rejuvenation process is defined as the change of rheology and performance
characteristics of the aged binder by using recycling agents [70]. Typically, there are three
factors that can affect the rejuvenation mechanism: (a) dispersion of the virgin binder, aged
binder and rejuvenator in the mixture; (b) diffusion of the rejuvenator into the recycled
binder; and (c) compatibility between the rejuvenator and all the binder blends. Dispersion
is a physical mixing process that recycling agents go through the asphalt mixtures to
achieve a uniform blend with virgin and recycled binders, whereas diffusion is a process
where the aged binder tries to absorb the hydrocarbon-type liquid in the rejuvenators [71].
The diffusion process consists of the following four steps suggested by Carpenter and
Wolosick [22]:
1. The rejuvenator surrounds the highly aged binder layer coating the recycled
aggregates.
2. The rejuvenator starts to diffuse and soften the aged binder.
3. As the diffusion process continues, the recycling agent decreases the viscosity
of the aged binder, gradually mixed with the virgin binder.
4. An equilibrium is approached after a certain time.
The compatibility of the binder blends and rejuvenators is critical to create a
63
uniform composite. Yang et al. investigated the compatibility between the bio-asphalt and
petroleum asphalt by using an AFT test based on flocculation stability [72].
Aging is an important factor that leads to the degradation of road performance.
Chen et al. confirmed that the aging effect of asphalt binder is a sluggish process by altering
the content and microstructure of its internal components [73]. Regular binder tests
including DSR and the bending beam rheometer test are usually used to evaluate the aging
characteristics of the asphalt binders. When combining with rejuvenators, a different loss
of rejuvenating effectiveness has been observed on the asphalt mixtures and binder blends
based on the types and dosage of the rejuvenators [74]. It was also reported that aging can
reduce the maltene phase of the rejuvenated binder blends, which results in a change in
rheological properties [75].
Overall, the rejuvenation process is considered as a physical process, in which the
diffusion of the rejuvenator is expected to mix with the aged asphalt directly. However, for
most asphalt plants in the U.S., rejuvenators are usually mixed with the virgin binder first
and then coated on the virgin aggregates and the recycled materials. Unlike the practice in
the U.S., a new trial of recycled mixture production was reported in Japan that the
rejuvenator is directly mixed with the heated aged materials in a small pugmill first, which
allows the rejuvenator to quickly diffuse into the aged binder. Then the hot rejuvenated
aged mixture is transferred to a surge bin for a longer condition time, which may result in
varying dispersion and diffusion effects [76].
Aging of rejuvenated binder blends can also affect the recycling agent effectiveness.
Studies observed that the changes of rheological properties caused by aging depend on the
type and dosage of the rejuvenators [77, 78]. However, the effect of different incorporation
methods on the properties of final products, including the short-term aging and the long-
term aging has been rarely studied. In addition, the hot in-place recycling (HIR) technology
for 100% recycled materials is becoming more and more popular in the U.S. HIR
technology consists of in situ heating of the asphalt pavement, milling the surface layer,

64
remixing the recycled materials with the addition of rejuvenators and repaving the
combined mixtures. In this process, the rejuvenators are directly incorporated into the
recycled materials during the remixing step. Such technology is similar to the rejuvenator
incorporation method in Japan. Thus, in order to improve the utilization of RAP and RAS,
it is necessary to characterize the properties of the rejuvenated blends using different
incorporation methods.
7.2 Sample Preparation and Experiment Methods
7.2.1 Raw materials
One asphalt base binder, PG 64-22, was selected in this study. The raw RAP was
collected from the Rogers Group and RAS materials used for aged binder extraction were
collected from the Tennessee Shingle Recycling. One type of rejuvenator, which was
formulated for high compatibility with the aged and oxidized asphalt, was selected for
blending. The typical properties of the rejuvenator are summarized in Table 7-1.
Table 7-1. Typical properties of the rejuvenator used.
Typical properties Value Method
Appearance Brown liquid Visual
Color 14+ AOCS Td 1a-64
Density @ 20 °C, g/ml 0.92 – 0.95 ASTM D1475
Viscosity @ 40°C, cSt 45 – 60 AOCS Ja 10-87
Flash point °C, open cup >290 AOCS Cc 9a-48
7.2.2 Sample preparation
The RAS and RAP binders were extracted following ASTM 2172 (test method A:
centrifuge extraction) and then recovered according to the ASTM D5404 procedure. Two
rejuvenator incorporation methods were used to prepare the binder blends (40g). One
65
method, denoted as Incorporation Method A, was to combine the preheated base binder
(PG 64-22) with the rejuvenator at the selected dosage first, and then manually mix it with
the RAP/RAS at different ratios. The other method, named Incorporation Method B, was
to blend the rejuvenator with the RAP/RAS binder first and then mix with the virgin binder
at the selected temperature afterwards. The blending temperature for the virgin binder and
rejuvenator was 150°C. Considering the different viscosity of the RAP and RAS binder,
165°C and 210°C were set as the blend temperature to mix the RAP/ RAS binder blends
with rejuvenator, respectively.
In order to evaluate the aging properties of the binders, some selected binder blends
were subjected to short-term and long-term aging. Rolling Thin Film Oven (RTFO) aging
was used to simulate the short-term aging in accordance with the ASTM D2872 at 163°C
for 85 min, while Pressure Aging Vessel (PAV) aging was performed on the RTFO aged
binders for 20 h at 100 °C and 2.1 MPa pressure followed by the long-term aging procedure
ASTM D6521. The work plan with varying blending ratios and blending methods is listed
in Table 7-2. The content of the rejuvenator is indicated by the percentage of the total
binder blends. The original (aging condition) in table means blends without any aging
process.
Table 7-2. Binder blends and conditioning methods.
Binder/Blend
label
Blend
proportions
Rejuvenator (%) Incorporation
method
Aging condition
Virgin
PG 64-22 - - Original, RTFO,
RTFO+ PAV
0.2 RAS 0.8 PG 64-22
0.2 RAS
- - Original, RTFO,
RTFO+ PAV
0.2 RASR2B1 2 Method A Original, RTFO,
RTFO+ PAV
0.2 RASR2B2 2 Method B Original, RTFO,
RTFO+ PAV
0.2 RASR5B1
5 Method A Original
66
0.2 RASR5B2
5 Method B Original
0.2 RASR10B1
10 Method A Original
0.2 RASR10B2 10 Method B Original
0.2 RAP 0.8 PG 64-22
0.2 RAP
- - Original, RTFO,
RTFO+ PAV
0.2 RAPR2B1 2 Method A Original, RTFO,
RTFO+ PAV
0.2 RAPR2B2 2 Method B Original, RTFO,
RTFO+ PAV
0.2 RAPR5B1
5 Method A Original
0.2 RAPR5B2 5 Method B Original
7.2.3 Experiment method
The DSR frequency sweep test was performed on all the binder blends to explore
the rheological properties at three different temperatures of 10 °C, 25°C and 40°C and
angular frequency of 0.1-100 rad/s for two replicates. The master curves were created at a
reference temperature of 25 °C. The rheological properties are characterized by complex
shear modulus (G*) and phase angle (δ) at a different reduced frequency. G* is considered
as the sample’s total resistance to deformation when repeatedly sheared. Larger complex
modulus usually has better resistance to flow deformation. The phase angle, defined as the
time lag between the applied shear stress and resulting shear strain, reflects the viscous
response of the asphalt.
The GPC test was conducted to detect the change of molecular size distribution of
the asphalt. The solution for GPC testing was prepared at a concentration of 1mg of asphalt
per 1mL of tetrahydrofuran (THF), followed by being injected into a 2mL vial. The vial
was inserted in an automatic sample injector, and the concentration of the components was
recorded in the eluant during the testing. The chromatogram, which shows the relationship

67
between the elution time and the refractive index was obtained from GPC testing.
7.3 Results and analysis
7.3.1 Master curves for the unaged binders
The time-temperature superposition principle is used to construct the master curves
of the binder blends. Asphalt is considered as a viscoelastic material and is highly related
to the temperature change. The shift factor (𝛼𝑇) is defined as the ratio between the reduced
frequency at the reference temperature (𝜔𝑟) and the frequency at the desired temperature
(𝜔), which can be expressed as:
𝛼𝑇 = 𝜔𝑟
𝜔 (7.1)
A second-order polynomial relation mode is used to expresses log (𝛼𝑇) in terms
of temperature [79]:
𝑙𝑜𝑔(𝛼𝑇) = 𝑎1𝑇2 + 𝑎2𝑇 + 𝑎3 (7.2)
where a1, a2 and a3 are regression coefficients.
A sigmoidal model is utilized to construct the master curves:
𝑙𝑜𝑔|𝐺∗|) = 𝛿 +𝛼
1+𝑒𝛽+𝛾(𝑙𝑜𝑔 𝑓) (7.3)
where G*= dynamic modulus (Pa); f = reduced frequency (Hz); δ = the minimum
value of G*; δ + α = the maximum value of G
*; β and γ = constants.
As the shift factors are calculated, a master curve of the binder is plotted at a
reference temperature.
Figure 7-1 compares the complex modulus master curves at the reference
temperature of 25 °C for different binder blends. It is obvious that adding rejuvenators will
reduce the complex modulus of the binders. Basically, both incorporation methods can
decrease the complex modulus especially at low frequency (high temperature). Using a

68
high rejuvenator dosage in the binder blends resulted in a remarkable softening effect. For
example, the complex moduli of the RAS binder with 10% rejuvenator and the RAP binder
with 5% rejuvenator were even lower than that of the virgin binder, which indicated that
the addition of such dosages of the rejuvenator may be overdosed. Thus, there existed an
optimum dosage of the rejuvenator for each method to soften the aged binder to a target
value. Compared to Method A, Method B led to a more significant reduction of complex
modulus. In addition, it was observed that the gap of the complex modulus curves between
Method A and Method B for the RAS binder was larger than that of the RAP binder,
especially at low frequency. In other words, compared to Incorporation Method A,
Incorporation Method B can have a more notable rejuvenation effect on the RAS binder
than the RAP binder.
(a) 0.2 RAS
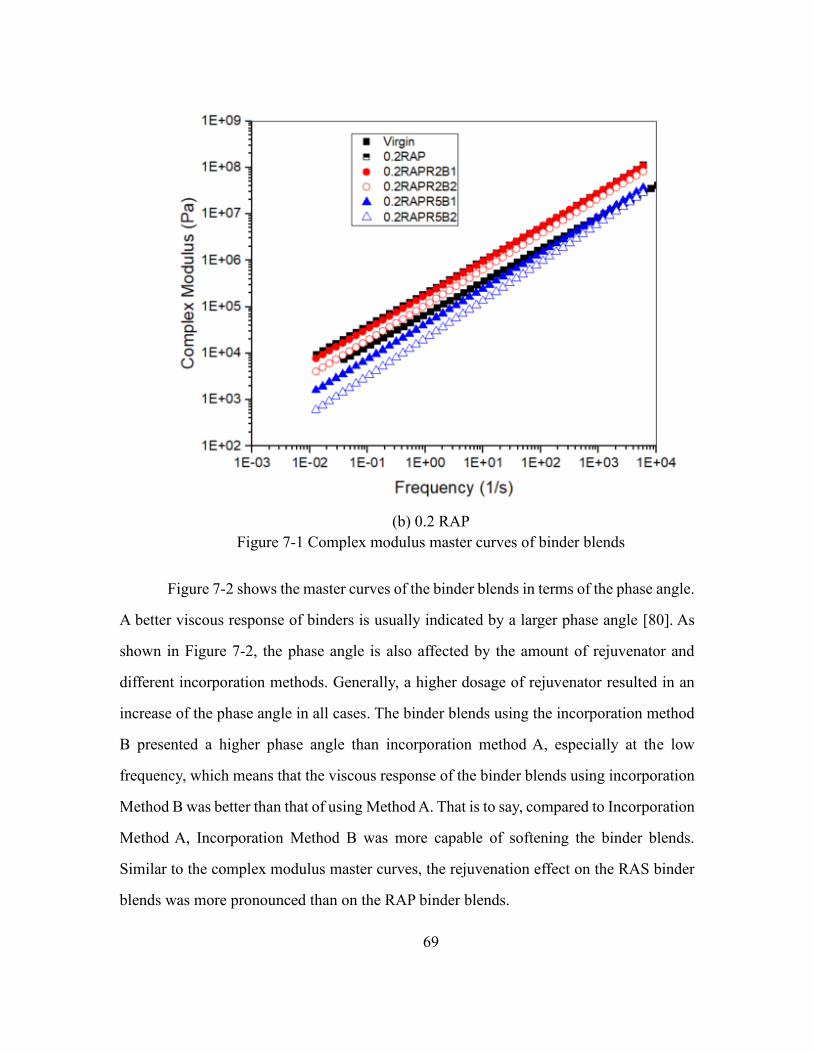
69
(b) 0.2 RAP
Figure 7-1 Complex modulus master curves of binder blends
Figure 7-2 shows the master curves of the binder blends in terms of the phase angle.
A better viscous response of binders is usually indicated by a larger phase angle [80]. As
shown in Figure 7-2, the phase angle is also affected by the amount of rejuvenator and
different incorporation methods. Generally, a higher dosage of rejuvenator resulted in an
increase of the phase angle in all cases. The binder blends using the incorporation method
B presented a higher phase angle than incorporation method A, especially at the low
frequency, which means that the viscous response of the binder blends using incorporation
Method B was better than that of using Method A. That is to say, compared to Incorporation
Method A, Incorporation Method B was more capable of softening the binder blends.
Similar to the complex modulus master curves, the rejuvenation effect on the RAS binder
blends was more pronounced than on the RAP binder blends.
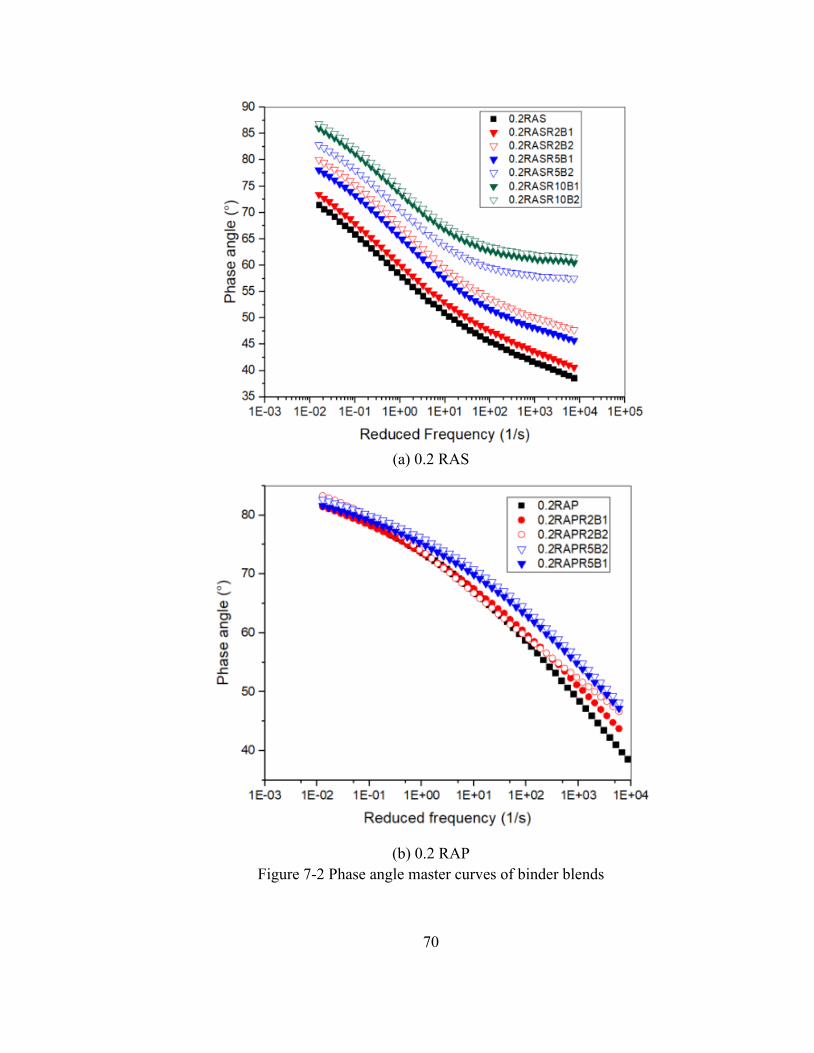
70
(a) 0.2 RAS
(b) 0.2 RAP
Figure 7-2 Phase angle master curves of binder blends
71
7.3.2 Rutting and fatigue resistance
The rutting and fatigue resistance of the binder blends was assessed according to
AASHTO M320. The rutting parameter G*/sinδ, reflecting the irrecoverable deformation
of asphalt during loading, was determined from the DSR test at a frequency of 10 rad/s. A
higher value represents a higher rutting resistance of the asphalt. Figure 7-3 plots G*/sinδ
parameter against the temperature of 0.2 RAS and 0.2 RAP binder blends with two different
incorporation methods. As for the unaged binder, a rutting parameter (G*/sinδ > 1 kPa) is
created to determine the critical high temperature of the asphalt according to AASHTO
T315. It was obvious that the rutting parameter of the rejuvenated binder blends was
strongly affected by the amount of rejuvenator and test temperatures. Generally, the rutting
parameter decreased with the increase of rejuvenator concentrations and test temperatures.
Compared with Incorporation Method A, using Incorporation Method B resulted in a larger
difference of the rutting parameter between the rejuvenated binder blends and the
unconditioned ones. Thus, there still exists an optimum dosage of rejuvenators for each
incorporation method, which can minimize the rutting to an acceptable value.

72
(a) 0.2 RAS
(b) 0.2 RAP
Figure 7-3 G*/sinδ parameter vs. temperature
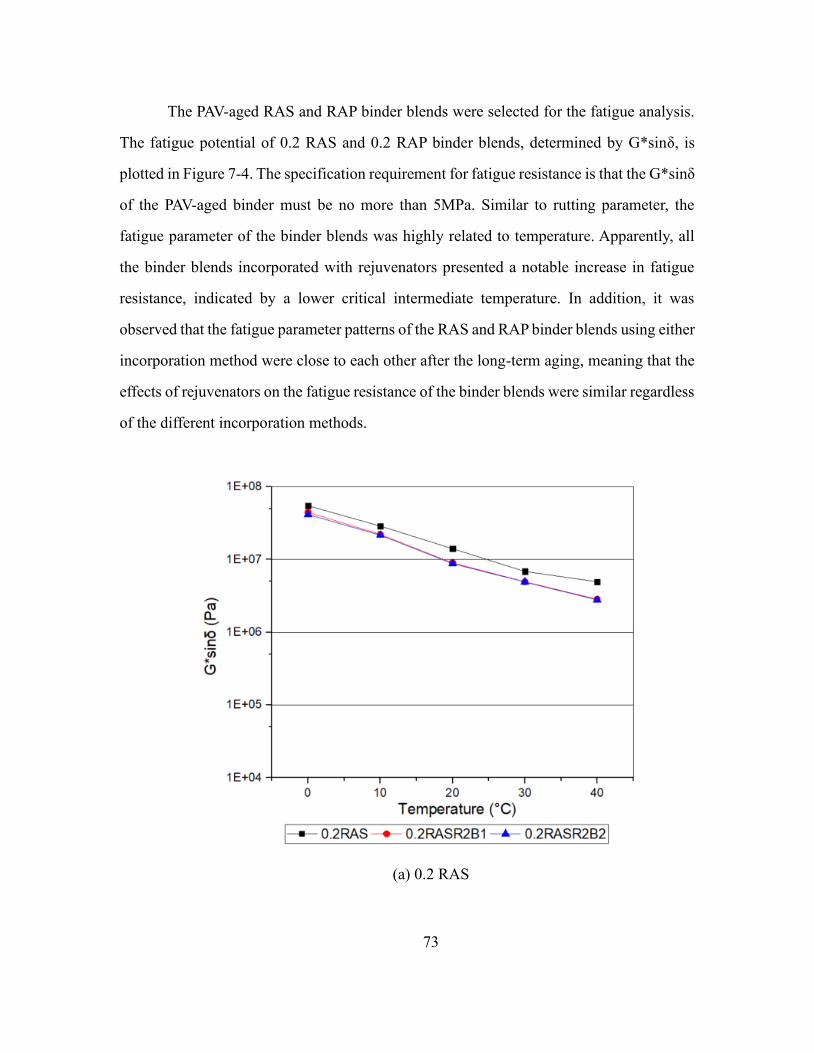
73
The PAV-aged RAS and RAP binder blends were selected for the fatigue analysis.
The fatigue potential of 0.2 RAS and 0.2 RAP binder blends, determined by G*sinδ, is
plotted in Figure 7-4. The specification requirement for fatigue resistance is that the G*sinδ
of the PAV-aged binder must be no more than 5MPa. Similar to rutting parameter, the
fatigue parameter of the binder blends was highly related to temperature. Apparently, all
the binder blends incorporated with rejuvenators presented a notable increase in fatigue
resistance, indicated by a lower critical intermediate temperature. In addition, it was
observed that the fatigue parameter patterns of the RAS and RAP binder blends using either
incorporation method were close to each other after the long-term aging, meaning that the
effects of rejuvenators on the fatigue resistance of the binder blends were similar regardless
of the different incorporation methods.
(a) 0.2 RAS
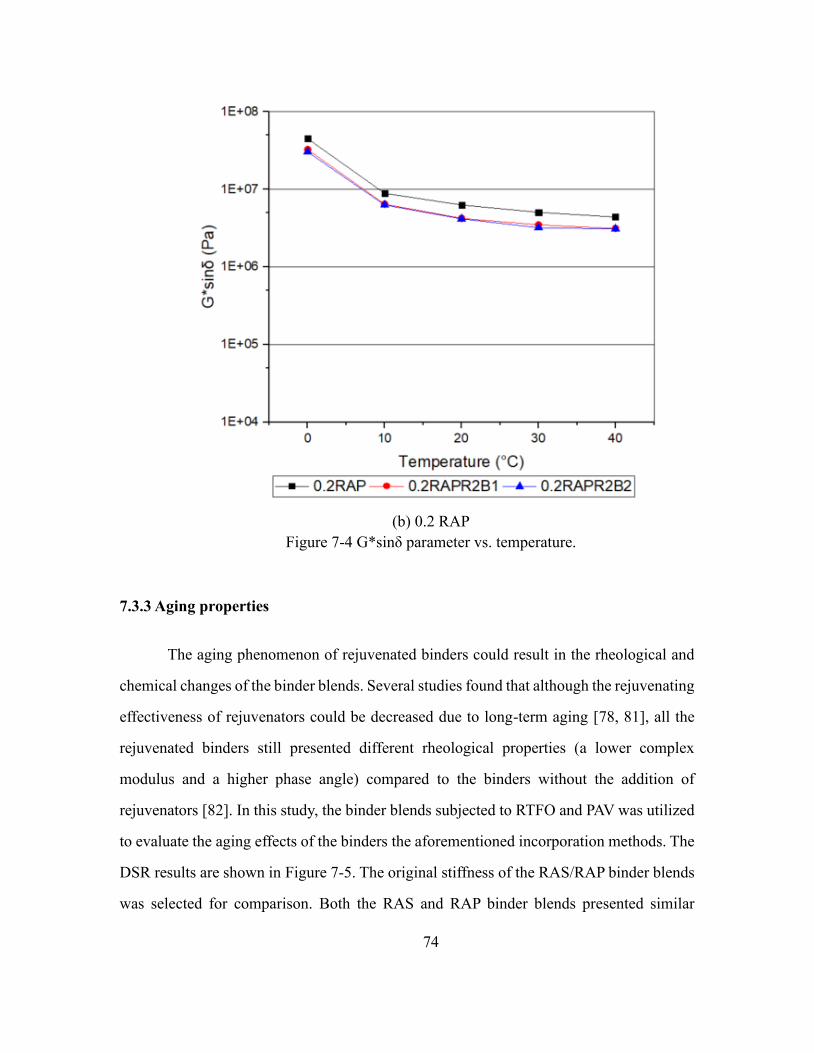
74
(b) 0.2 RAP
Figure 7-4 G*sinδ parameter vs. temperature.
7.3.3 Aging properties
The aging phenomenon of rejuvenated binders could result in the rheological and
chemical changes of the binder blends. Several studies found that although the rejuvenating
effectiveness of rejuvenators could be decreased due to long-term aging [78, 81], all the
rejuvenated binders still presented different rheological properties (a lower complex
modulus and a higher phase angle) compared to the binders without the addition of
rejuvenators [82]. In this study, the binder blends subjected to RTFO and PAV was utilized
to evaluate the aging effects of the binders the aforementioned incorporation methods. The
DSR results are shown in Figure 7-5. The original stiffness of the RAS/RAP binder blends
was selected for comparison. Both the RAS and RAP binder blends presented similar
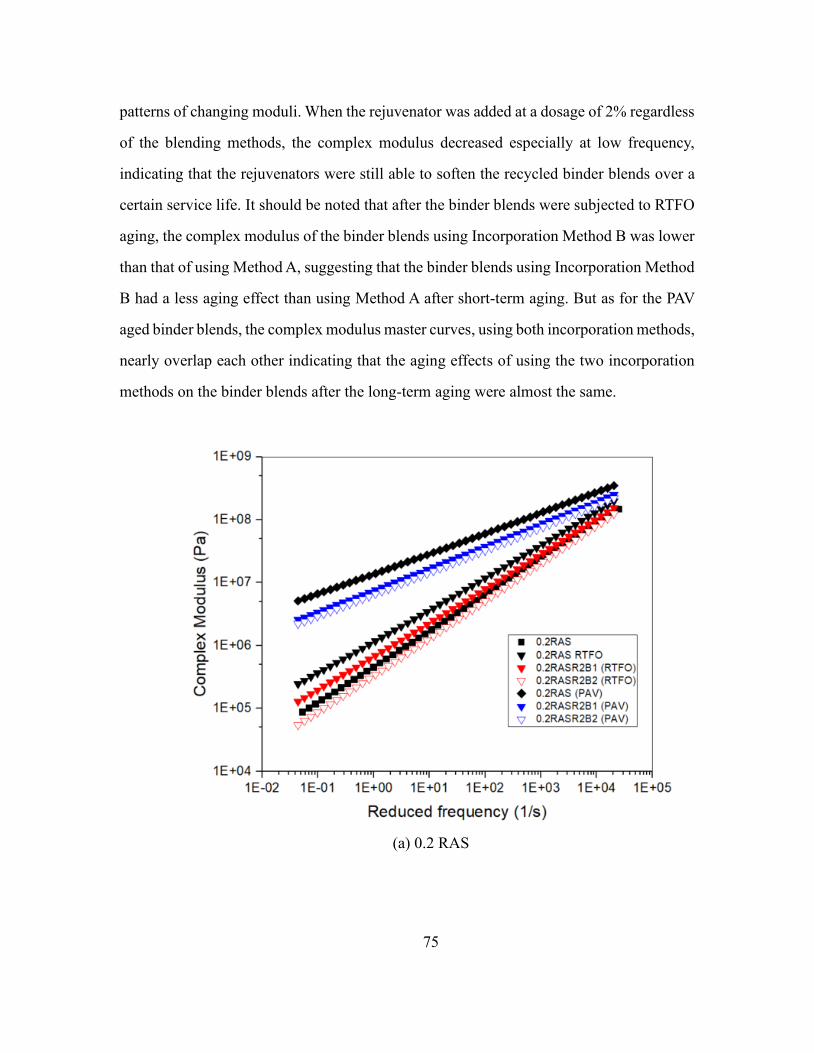
75
patterns of changing moduli. When the rejuvenator was added at a dosage of 2% regardless
of the blending methods, the complex modulus decreased especially at low frequency,
indicating that the rejuvenators were still able to soften the recycled binder blends over a
certain service life. It should be noted that after the binder blends were subjected to RTFO
aging, the complex modulus of the binder blends using Incorporation Method B was lower
than that of using Method A, suggesting that the binder blends using Incorporation Method
B had a less aging effect than using Method A after short-term aging. But as for the PAV
aged binder blends, the complex modulus master curves, using both incorporation methods,
nearly overlap each other indicating that the aging effects of using the two incorporation
methods on the binder blends after the long-term aging were almost the same.
(a) 0.2 RAS
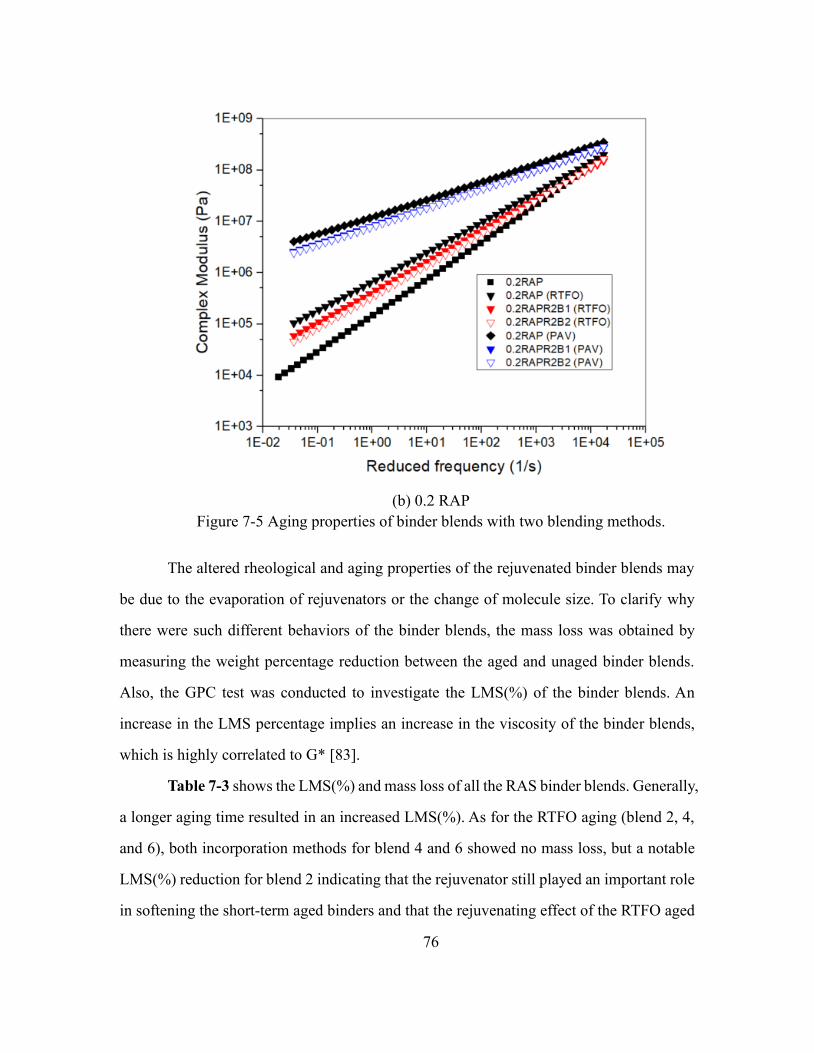
76
(b) 0.2 RAP
Figure 7-5 Aging properties of binder blends with two blending methods.
The altered rheological and aging properties of the rejuvenated binder blends may
be due to the evaporation of rejuvenators or the change of molecule size. To clarify why
there were such different behaviors of the binder blends, the mass loss was obtained by
measuring the weight percentage reduction between the aged and unaged binder blends.
Also, the GPC test was conducted to investigate the LMS(%) of the binder blends. An
increase in the LMS percentage implies an increase in the viscosity of the binder blends,
which is highly correlated to G* [83].
Table 7-3 shows the LMS(%) and mass loss of all the RAS binder blends. Generally,
a longer aging time resulted in an increased LMS(%). As for the RTFO aging (blend 2, 4,
and 6), both incorporation methods for blend 4 and 6 showed no mass loss, but a notable
LMS(%) reduction for blend 2 indicating that the rejuvenator still played an important role
in softening the short-term aged binders and that the rejuvenating effect of the RTFO aged

77
binders can be attributed to a decrease of LMS(%). For the PAV aging (blend 3, 5 and 7),
the two incorporation methods for blend 5 and 7 presented a slight decrease of LMS(%)
and a more pronounced mass loss of the rejuvenated binder blends than blend 3, reflecting
that the rejuvenating effect of the PAV aged binders may be mainly due to the evaporation
of the rejuvenator. In accordance with the complex modulus master curves under different
aging conditions, the RTFO aged binder blends using incorporation method B showed a
more pronounced rejuvenating effect than using the method A because of the existing
rejuvenator, whereas the PAV aged binder blends using both two incorporation methods
presented the similar rejuvenating effect due to the evaporation of the rejuvenator.
Therefore, consistent with the fatigue parameter curves of the PAV aged binder blends,
using the different incorporation methods had a similar effect on the fatigue resistance of
the rejuvenated binder blends.
Table 7-3. LMS (%) and mass changes during the aging process.
Blend number Type LMS (%) Mass Loss (%)
1 0.2 RAS 22.08 0
2 0.2 RAS RTFO 27.01 0
3 0.2 RAS PAV 34.45 0.26
4 0.2 RASR2B1 RTFO 21.94 0
5 0.2 RASR2B1 PAV 32.37 0.70
6 0.2 RASR2B2 RTFO 21.31 0
7 0.2 RASR2B2 PAV 31.40 0.67
7.4 Discussions
Two incorporation methods were used to blend the virgin and aged binders with
rejuvenators. The rheological and aging properties were investigated in this preliminary
study. The test results showed that two rejuvenator incorporation methods perform different
rheological and aging properties of the binder blends. Considering the factors that affect
the rejuvenation mechanism, Incorporation Method B can probably better facilitate the
78
diffusion of the rejuvenator into the recycled binders, ending in a more compatible blend
between the rejuvenator and the binders. The loss of rejuvenating effectiveness was
observed during the aging process by the altered LMS(%) of the binder blends, which is
consistent with previous studies [73, 74]. In this study, mass loss of rejuvenator occurred
because of evaporation during the long-term aging process, while a study by Ding et al
found a change of mass both in the short-term and the long-term aging [63]. Such difference
may due to the different types of rejuvenators used for blending. Thus, other types of
rejuvenators, including the petroleum-based oil and aromatic extract, should be considered
in future studies. To further explain the rejuvenating mechanism, SARA analysis can be
used to investigate the chemical composition change of the rejuvenated asphalt binders
during the different aging conditions. [84].
Both incorporation methods improved rejuvenating effectiveness on the highly
aged binders. However, different rejuvenating effectiveness is expected in the recycled
asphalt mixtures when incorporating the rejuvenators directly into the preheated aged
binders. Further studies should be conducted for rejuvenated asphalt mixtures instead of
the binders based on Incorporating Method B. Such incorporating methods may need more
energy in the asphalt plant due to a higher temperature and longer mixing time required for
the preheating process. A cost-effectiveness analysis would optimize the utilization of
rejuvenators for recycled materials that provide adequate performance.
As mentioned above, rejuvenators are directly added into the recycled mixtures for
remixing and compaction in HIR recycling technology, which is similar to Incorporation
Method B. To improve the performance of the compacted recycled mixtures, several factors
should be optimized including the amount of rejuvenator, the type of rejuvenator, and the
mixing temperature. Efforts in such areas are necessary to achieve more sustainable
pavements in the future.
79
7.5 Conclusions
In this chapter, the rheological and aging properties of RAS/RAP binder blends with
rejuvenator using two different incorporated method were investigated. The RTFO and PAV
methods were used to simulate the short-term and long-term aging. DSR and GPC test were
performed to characterize the binder rheological properties and molecule size changes of
the binder blends at different aging periods, respectively. Rutting and fatigue resistance
parameters were also obtained by temperature sweep test. Based on the test results, the
following conclusions can be drawn:
1) By incorporating the rejuvenator with the aged binder first, the binder blends
showed a more pronounced change of rheological properties compared to the one
incorporating the rejuvenator with the virgin binder first, indicated by a lower
complex modulus and a higher phase angle of the binder blends.
2) By incorporating the rejuvenator with the aged binder first, the binder blends
showed greater reduction in the rutting parameter, G*/ sinδ, than when using the
other method.
3) The two incorporation methods presented a similar fatigue parameter, G*sinδ, of
the PAV aged binder blends.
4) By incorporating the rejuvenator with the aged binder first, the binder blends
presented a lesser aging effect after the short-term aging, but a similar aging effect
after the long-term aging, compared with the one using the other method.
5) Based on the binder rheological difference between the two incorporating
procedures of rejuvenator, it is expected that the mixture’s performance should be
different for asphalt mixtures obtained through these two different procedures. A
subsequent mixture study is necessary.
6) Due to the sample preparation procedure in which all binder components were
dissolved into a stronger solvent (THF), GPC was not able to capture the

80
microstructural differences of binders prepared through the two rejuvenator
incorporating procedures. Additional methods such as FTIR or AFM should be
investigated in the future.

81
Chapter 8 CONCLUSIONS AND RECOMMENDATIONS
A series of studies were conducted to evaluate the recycling efficiency in asphalt
plant mixtures containing RAP and RAS. A new method was developed using fluorescence
microscopy to differentiate between RAP/RAS and virgin binders as well as their blends,
in which a new parameter, MGV, based on fluorescence image, was utilized to
quantitatively determine the mobilization rates of aged asphalt binder in RAP/RAS. By
generating the “Blending Chart” to show the change of MGV with RAP/RAS binder
content, the mobilization rate of aged binder in RAP/RAS can be directly measured.
Fourteen plant-produced asphalt mixtures were tested for their RAP/RAS binder
mobilization rates using fluorescence microscopy and GPC. Linear regression analyses
were conducted to evaluate the influence of mixture design and production condition
parameters on the mobilization rate. In addition, a preliminary study was performed to
investigate the influence of different rejuvenator incorporation methods on the rheological
and aging properties of the recycled asphalt binders. The findings from this study will help
maximize the use of RAP/RAS in asphalt mixtures and enhance the properties and
performance of the mixtures containing RAP/RAS. Based on the findings, the following
conclusions can be drawn:
1) The mobilization rates were different for large and small aggregates because of
different RAP/RAS contents. The overall mobilization rate of a mixture could be
determined by considering the surface area of large and small aggregates.
2) The overall mobilization rates of 14 plant mixtures were in the range of 0.4 to 1.0
for the fluorescence microscopy method and 0.37 to 0.83 for the GPC method.
3) The sensitivity of MGV to the aged binder content was affected by the test
conditions. An index, termed Differentiation Factor, was used to measure the
sensitivity of MGV to aged binder content. Results indicated that the MGV
82
measured at the wavelength of 450-490 nm and the exposure time of 0.5-1.5 s was
most sensitive to the aged binder content.
4) For the construction of a blending chart, it was found that there exists a linear
relationship between the MGV of a binder blend and its RAP binder content, and
a quadratic relationship between the MGV of a binder blend and its RAS binder
content. Therefore, the relationship between MGV and the aged binder content of
a binder blend could be different for asphalt from diverse sources.
5) The mobilization rates from fluorescence microscopy and GPC method were
different but showed a similar trend among the fourteen plant mixtures, which is
due to the fact that the fluorescence microscopy method tests the aged asphalt
content on the aggregate surface, whereas the GPC method tests the aged asphalt
content of the outer layer of asphalt film.
6) According to the LMS (%) results from the GPC tests, the mobilization rates for
the inner layer and the outer layer are different, indicating that only a part of the
aged binder in the RAP/RAS was mobilized in the mixtures.
7) Among the production condition parameters of asphalt mixture plants, the mixing
temperature and the percentage of RAP/RAS showed significant influences on the
mobilization rate. In addition, the aging level of the RAP/RAS binder also had a
significant influence on the mobilization rate. In general, a higher mixing
temperature and less percentage of RAP/RAS may promote the mobilization rate,
whereas a higher aging level of the RAP/RAS binder may decrease the
mobilization rate.
8) By incorporating the rejuvenator with the aged binder first, the binder blends
showed a more beneficial change in rheological properties compared to the one
incorporating the rejuvenator with the virgin binder first, indicated by a lower
complex modulus and a higher phase angle of the binder blends.
83
Recommendations
On the basis of the conclusions obtained in this study, the following
recommendations can be made:
1) Among mixture design and production parameters, the RAP content and the mixing
temperature have a greater impact on the mobilization rate. It is recommended that
these two parameters should be considered carefully in the mixture design and
production process, especially for the mixtures with a high RAP/RAS content.
2) The aging properties of RAP/RAS asphalt have significant influence on the
mobilization rate. It is recommended that more studies should be conducted to
evaluate the aging properties of RAP/RAS binder.
3) The utilization of RAS could reduce the mobilization rate significantly, indicating
that less asphalt can be used to cover new aggregates with RAS. Therefore, the
designed asphalt content should be raised correspondingly for the mixture
containing RAS.
4) The quadratic relationship between the MGV of a binder blend and its RAS binder
content could relate to the highly aged properties of RAS binder. The aging process
increases the polarity of molecules, which might cause some intermolecular
interactions between the RAS binder and virgin asphalt. The interaction makes the
blending chart deviate linear relationship.
5) This study indicates that the mobilization rate of aged asphalt varied with mixtures.
The relationship between the mobilization rate and the performance of mixtures has
not been addressed thoroughly. Therefore, the role of un-mobilized aged asphalt in
mixture needs to be further investigated.
6) This study focuses on the mobilization rate of plant hot mix asphalt. The
mobilization rate for the mixtures using different mixing approaches such as cold
recycling could be varying. Therefore, the blending efficiency for other mixing
methods need to be investigated in the future.
84
7) The test methods applied in this study are still time consuming and cannot directly
reflect the mixture performance. More methods which can extrapolate blending
efficiency based on the performance of recycling mixtures should be further
investigated.
8) This study indicates that the production conditions vary among asphalt plants,
which would affect both the blending efficiency and mixtures performance. It is
recommended that more information on the production condition should be
collected, and the influence of production conditions on the mixture performance
should be further investigated.

85
REFERENCES
1. Huang, B., et al., Laboratory investigation of mixing hot-mix asphalt with reclaimed
asphalt pavement. Transportation Research Record: Journal of the Transportation
Research Board, 2005(1929): p. 37-45.
2. Xu, J., et al., The impact of cement contents on the properties of asphalt emulsion
stabilized cold recycling mixtures. International journal of pavement research and
technology, 2011. 4(1): p. 48-55.
3. Bowers, B.F., et al., Investigation of Reclaimed Asphalt Pavement blending
efficiency through GPC and FTIR. Construction and Building Materials, 2014. 50:
p. 517-523.
4. Zhao, S., et al., Characterizing rheological properties of binder and blending
efficiency of asphalt paving mixtures containing RAS through GPC. Journal of
Materials in Civil Engineering, 2013. 26(5): p. 941-946.
5. Zhao, S., Blending Issues of Hot and Warm Mix Asphalt containing Recycled
Asphalt Pavement and Recycled Asphalt Shingle. 2014.
6. Zhao, S., et al., Quantitative Characterization of Binder Blending: How Much
Recycled Binder Is Mobilized During Mixing? Transportation Research Record:
Journal of the Transportation Research Board, 2015(2506): p. 72-80.
7. Huang, B., X. Shu, and D. Vukosavljevic, Laboratory investigation of cracking
resistance of hot-mix asphalt field mixtures containing screened reclaimed asphalt
pavement. Journal of Materials in Civil Engineering, 2010. 23(11): p. 1535-1543.
8. Shu, X., B. Huang, and D. Vukosavljevic, Laboratory evaluation of fatigue
characteristics of recycled asphalt mixture. Construction and Building Materials,
2008. 22(7): p. 1323-1330.
9. Zhao, S., et al., Laboratory performance evaluation of warm-mix asphalt
containing high percentages of reclaimed asphalt pavement. Transportation
Research Record: Journal of the Transportation Research Board, 2012(2294): p. 98-
105.
10. Ding, Y., B. Huang, and X. Shu, Characterizing blending efficiency of plant
produced asphalt paving mixtures containing high RAP. Construction and Building
Materials, 2016. 126: p. 172-178.
11. Shirodkar, P., et al., A study to determine the degree of partial blending of reclaimed
asphalt pavement (RAP) binder for high RAP hot mix asphalt. Construction and
Building Materials, 2011. 25(1): p. 150-155.
12. Zhao, S., et al., Investigation on the microstructure of recycled asphalt shingle
binder and its blending with virgin bitumen. Road Materials and Pavement Design,
2015. 16(sup1): p. 21-38.
13. Zofka, A., et al., Development of simple asphalt test for determination of rap
86
blending charts. 2004.
14. Soleymani, H.R., et al. INVESTIGATION OF THE BLACK ROCK ISSUE FOR
RECYCLED ASPHALT MIXTURES. in Association of Asphalt Paving
Technologists Proc. 2000.
15. McDaniel, R.S. and R.M. Anderson, Recommended use of reclaimed asphalt
pavement in the Superpave mix design method: technician's manual. 2001, National
Research Council (US). Transportation Research Board.
16. Ding, Y., B. Huang, and X. Shu, Blending efficiency evaluation of plant asphalt
mixtures using fluorescence microscopy. Construction & Building Materials, 2018.
161: p. 461-467.
17. Mogawer, W., et al., Performance characteristics of plant produced high RAP
mixtures. Road Materials and Pavement Design, 2012. 13(sup1): p. 183-208.
18. Bennert, T. and R. Dongré, Backcalculation method to determine effective asphalt
binder properties of recycled asphalt pavement mixtures. Transportation Research
Record: Journal of the Transportation Research Board, 2010(2179): p. 75-84.
19. D'Angelo, J. and R. Dongré, Practical use of multiple stress creep and recovery test:
Characterization of styrene-butadiene-styrene dispersion and other additives in
polymer-modified asphalt binders. Transportation Research Record: Journal of the
Transportation Research Board, 2009(2126): p. 73-82.
20. Bonaquist, R., Laboratory evaluation of hot mix asphalt (HMA) mixtures
containing recycled or waste product materials using performance testing. 2005,
Publication FHWA-PA-2005-006+ 98-32 (19), Pennsylvania Department of
Transportation, Office of Planning and Research.
21. Booshehrian, A., W.S. Mogawer, and R. Bonaquist, How to construct an asphalt
binder master curve and assess the degree of blending between RAP and virgin
binders. Journal of Materials in Civil Engineering, 2012. 25(12): p. 1813-1821.
22. Carpenter, S.H. and J.R. Wolosick, Modifier influence in the characterization of
hot-mix recycled material. Transportation research record, 1980(777).
23. Copeland, A., Reclaimed asphalt pavement in asphalt mixtures: state of the practice.
2011.
24. Druta, C., L. Wang, and T. Zhu, Laboratory investigation of reclaimed asphalt
pavement mixed with pure binder using x-ray CT scanner, in ICCTP 2009: Critical
Issues In Transportation Systems Planning, Development, And Management. 2009.
p. 1-10.
25. Hajj, E., L. Loria, and P. Sebaaly, Estimating effective performance grade of asphalt
binders in high RAP mixtures using different methodologies: case study.
Transportation Research Board, Washington DC, 2012.
26. Zearley, L.J., Penetration characteristics of asphalt in a recycled mixture. 1979.
27. Karlsson, R. and U. Isacsson, Application of FTIR-ATR to characterization of
bitumen rejuvenator diffusion. Journal of Materials in Civil Engineering, 2003.

87
15(2): p. 157-165.
28. Jia, X., et al., Infrared spectra and rheological properties of asphalt cement
containing waste engine oil residues. Construction and Building Materials, 2014.
50: p. 683-691.
29. Mogawer, W.S., et al., Evaluating the effect of rejuvenators on the degree of
blending and performance of high RAP, RAS, and RAP/RAS mixtures. Road
Materials and Pavement Design, 2013. 14(sup2): p. 193-213.
30. Swiertz, D., E. Mahmoud, and H. Bahia, Estimating the effect of recycled asphalt
pavements and asphalt shingles on fresh binder, low-temperature properties
without extraction and recovery. Transportation Research Record: Journal of the
Transportation Research Board, 2011(2208): p. 48-55.
31. Swiertz, D.R. and H.U. Bahia. Test Method to Quantify the Effect of RAP and RAS
on Blended Binder Properties without Binder Extraction. in The Fifty-sixth Annual
Conference of the Canadian Technical Asphalt Association. 2011.
32. Nahar, S., et al., First observation of blending-zone morphology at interface of
reclaimed asphalt binder and virgin bitumen. Transportation Research Record:
Journal of the Transportation Research Board, 2013(2370): p. 1-9.
33. Xu, J., et al., Investigation of reclaimed asphalt pavement blending efficiency based
on micro-mechanical properties of layered asphalt binders. Construction and
Building Materials, 2018. 163: p. 390-401.
34. Elseifi, M.A., et al., Validity of asphalt binder film thickness concept in hot-mix
asphalt. Transportation Research Record, 2008. 2057(1): p. 37-45.
35. Navaro, J., et al., Observation and evaluation of the degree of blending of reclaimed
asphalt concretes using microscopy image analysis. Construction and Building
Materials, 2012. 37: p. 135-143.
36. Khorasani, G.K., Novel development in fluorescence microscopy of complex
organic mixtures: application in petroleum geochemistry. Organic Geochemistry,
1987. 11(3): p. 157-168.
37. Mills, J. and R. White, Organic chemistry of museum objects. 2012: Routledge.
38. Zhang, X., et al., Relationship between heterogeneity of source rocks and genetic
mechanism of abnormally high pressure. Science China Earth Sciences, 2013.
56(11): p. 1971-1976.
39. Dennis, A.M., et al., Quantum dot–fluorescent protein FRET probes for sensing
intracellular pH. ACS nano, 2012. 6(4): p. 2917-2924.
40. Stasiuk, L. and L. Snowdon, Fluorescence micro-spectrometry of synthetic and
natural hydrocarbon fluid inclusions: crude oil chemistry, density and application
to petroleum migration. Applied Geochemistry, 1997. 12(3): p. 229-241.
41. Petryayeva, E., W.R. Algar, and I.L. Medintz, Quantum dots in bioanalysis: a
review of applications across various platforms for fluorescence spectroscopy and
imaging. Applied spectroscopy, 2013. 67(3): p. 215-252.

88
42. Eriksen, K. and V. Wegan, Optical methods for the evaluation of asphalt concrete
and polymer-modified bituminous binders. 1993.
43. Buisine, J., et al., Thermodynamic behavior and physicochemical analysis of eight
SHRP bitumens. Transportation Research Record, 1993(1386).
44. Daly, W.H., Z. Qui Chiu, and I. Negulescu, Preparation and Characterization of
Asphalt-Modified Polyethylene Blends. Transportation Research Record,
1993(1391).
45. Brûlé, B., Y. Brion, and A. Tanguy. Paving asphalt polymer blends: relationships
between composition, structure and properties (with discussion). in Association of
Asphalt Paving Technologists Proc. 1988.
46. Lu, X. and U. Isacsson, Chemical and rheological characteristics of styrene-
butadiene-styrene polymer-modified bitumens. Transportation Research Record:
Journal of the Transportation Research Board, 1999(1661): p. 83-92.
47. Handle, F., et al., The bitumen microstructure: a fluorescent approach. Materials
and Structures, 2016. 49(1-2): p. 167-180.
48. Grossegger, D., et al., Fluorescence spectroscopic investigation of bitumen aged by
field exposure respectively modified rolling thin film oven test. Road Materials and
Pavement Design, 2017: p. 1-9.
49. Hagemann, H. and A. Hollerbach, The fluorescence behaviour of crude oils with
respect to their thermal maturation and degradation. Organic Geochemistry, 1986.
10(1): p. 473-480.
50. Rost, F.W., Fluorescence microscopy. Vol. 2. 1995: Cambridge University Press.
51. Spadafora, A., et al., Fluorescence of petroleum products I. Three-dimensional
fluorescence plots of motor oils and lubricants. Journal of Forensic Science, 1985.
30(3): p. 741-759.
52. ASTM, Guide for Using Fluorescence Microscopy to Quantify the Spread Area of
Fixed Cells, in F2998-14. 2014.
53. ASTM, Standard Test Method for Effect of Heat and Air on a Moving Film of
Asphalt (Rolling Thin-Film Oven Test), in D 2872-12. 2010.
54. ASTM, Standard Practice for Accelerated Aging of Asphalt Binder Using a
Pressurized Aging Vessel (PAV), in D6251-13. 2010, American Society for Testing
and Materials.
55. ASTM, Standard Test Method for Quantitative Extraction and Recovery of Asphalt
Binder from Asphalt Mixtures, in 6847-02. 2010.
56. Zhao, S., et al. Characterizing blending efficiency of recycled asphalt shingle (RAS)
and virgin binder. in 51st Petersen Asphalt Research Conference. Laramie,
Wyoming, USA. 2014.
57. Ishai, I. and J. Craus, A method for the determination of the surface area of fine
aggregate in bituminous mixtures. Journal of testing and evaluation, 1977. 5(4): p.
284-291.
89
58. Kriz, P., et al., Blending and diffusion of reclaimed asphalt pavement and virgin
asphalt binders. Road Materials and Pavement Design, 2014. 15(sup1): p. 78-112.
59. Ding, Y., B. Huang, and X. Shu, Blending efficiency evaluation of plant asphalt
mixtures using fluorescence microscopy. Construction and Building Materials, 2018.
161: p. 461-467.
60. Ding, Y., B. Huang, and X. Shu, Utilizing fluorescence microscopy for quantifying
mobilization rate of aged asphalt binder. Journal of Materials in Civil Engineering,
2017. 29(12).
61. Huang, B., X. Shu, and D. Vukosavljevic, Laboratory Investigation of Cracking
Resistance of Hot-Mix Asphalt Field Mixtures Containing Screened Reclaimed
Asphalt Pavement. Journal of Materials in Civil Engineering, 2011. 23(11): p. 1535-
1543.
62. Zhao, S., et al., Laboratory Performance Evaluation of Warm-Mix Asphalt
Containing High Percentages of Reclaimed Asphalt Pavement. Transportation
Research Record: Journal of the Transportation Research Board, 2012. 2294(1): p.
98-105.
63. Ding, Y., et al., Utilizing recycled asphalt shingle into pavement by extraction
method. Journal of Cleaner Production, 2019. 236.
64. Terrel, R. and J. Epps, Using additives and modifiers in hot mix asphalt. Section A.
1989.
65. NCAT, NCAT researchers explore multiple uses of rejuvenators. Asphalt Technol.
News, 2014. 26(1): p. 7-8.
66. Zaumanis, M., R.B. Mallick, and R. Frank, Evaluation of Rejuvenator's
Effectiveness with Conventional Mix Testing for 100% Reclaimed Asphalt
Pavement Mixtures. Transportation Research Record: Journal of the Transportation
Research Board, 2013. 2370(1): p. 17-25.
67. Zaumanis, M., R.B. Mallick, and R. Frank, Determining optimum rejuvenator dose
for asphalt recycling based on Superpave performance grade specifications.
Construction and Building Materials, 2014. 69: p. 159-166.
68. Kaseer, F., et al., Practical tools for optimizing recycled materials content and
recycling agent dosage for improved short-and long-term performance of
rejuvenated binder blends and mixtures. Journal of the Association of Asphalt
Paving Technologists, 2018. 87: p. 513-550.
69. Nabizadeh, H., et al., Effects of rejuvenators on high-RAP mixtures based on
laboratory tests of asphalt concrete (AC) mixtures and fine aggregate matrix (FAM)
mixtures. Construction and Building Materials, 2017. 152: p. 65-73.
70. Tabatabaee, H.A. and T.L. Kurth, Analytical investigation of the impact of a novel
bio-based recycling agent on the colloidal stability of aged bitumen. Road Materials
and Pavement Design, 2017. 18(sup2): p. 131-140.
71. Kaseer, F., A.E. Martin, and E. Arámbula-Mercado, Use of recycling agents in
90
asphalt mixtures with high recycled materials contents in the United States: A
literature review. Construction and Building Materials, 2019. 211: p. 974-987.
72. Yang, X., J. Mills-Beale, and Z. You, Chemical characterization and oxidative
aging of bio-asphalt and its compatibility with petroleum asphalt. Journal of
Cleaner Production, 2017. 142: p. 1837-1847.
73. Chen, A., et al., Research on the aging and rejuvenation mechanisms of asphalt
using atomic force microscopy. Construction and Building Materials, 2018. 167: p.
177-184.
74. Kaseer, F., et al., Stiffness Characterization of Asphalt Mixtures with High Recycled
Material Content and Recycling Agents. Transportation Research Record: Journal
of the Transportation Research Board, 2017. 2633(1): p. 58-68.
75. Cavalli, M.C., et al., Effect of ageing on the mechanical and chemical properties of
binder from RAP treated with bio-based rejuvenators. Composites Part B:
Engineering, 2018. 141: p. 174-181.
76. <IS139_High_RAP_Asphalt_Pavements_Japan_Practice-lr.pdf>.
77. Ali, H., L.M. McCarthy, and A. Welker, Performance of hot in-place recycled
Superpave mixtures in Florida. Construction and Building Materials, 2013. 49: p.
618-626.
78. Yin, F., et al., Characterising the long-term rejuvenating effectiveness of recycling
agents on asphalt blends and mixtures with high RAP and RAS contents. Road
Materials and Pavement Design, 2017. 18(sup4): p. 273-292.
79. Kutay, M.E. and A. Jamrah, Preparation for implementation of the mechanistic-
empirical pavement design guide in Michigan: part 1-HMA mixture
characterization. 2013, Michigan. Dept. of Transportation.
80. Shen, J., et al., Influence of surface area and size of crumb rubber on high
temperature properties of crumb rubber modified binders. Construction and
Building Materials, 2009. 23(1): p. 304-310.
81. Garcia Cucalon, L., et al., Compatibility of Recycled Binder Blends with Recycling
Agents: Rheological and Physicochemical Evaluation of Rejuvenation and Aging
Processes. Industrial & Engineering Chemistry Research, 2017. 56(29): p. 8375-
8384.
82. Arámbula-Mercado, E., et al., Evaluation of recycling agent dosage selection and
incorporation methods for asphalt mixtures with high RAP and RAS contents.
Construction and Building Materials, 2018. 158: p. 432-442.
83. Kim, K.W., et al., Estimation of RAP’s binder viscosity using GPC without binder
recovery. Journal of materials in civil engineering, 2006. 18(4): p. 561-567.
84. Yu, X., et al., Rheological, microscopic, and chemical characterization of the
rejuvenating effect on asphalt binders. Fuel, 2014. 135: p. 162-171.

91
APPENDICES
92
APPENDIX A: Survey Questions
The University of Tennessee
RAP/RAS recycling technologies survey
The University of Tennessee (UT) is performing a research project entitled “Evaluating
Recycling Efficiency of Asphalt Plants” along with the Tennessee Department of
Transportation (TDOT). One of the research objectives is to determine the blending
efficiency of recycled asphalt pavement (RAP) or recycled asphalt shingle (RAS) in asphalt
mixtures. The blending efficiency is defined as the percentage of the aged asphalt binder
in RAP/RAS that can be blended into virgin asphalt binder and thus is available to coat
aggregate. If RAP/RAS is not 100% blended with virgin binder, the effective asphalt
content would be lower than the design asphalt content and the performance of asphalt
mixtures be compromised. The purpose of this survey is to determine the current
practices of state DOTs regarding blending efficiency of RAP/RAS and to seek advice and
opinion in this area. Survey results will be shared with industry and government agencies
and official to promote recycling and sustainable paving technologies.
By completing this survey, you will be eligible to receive a complimentary copy of the
final report. Your participation is greatly appreciated.
Please complete the following information on the RAP usage.
Q 1 Does your state have a specification about how much of the aged asphalt binder on
RAP can be used? If so, please answer the next two questions.
(1) Yes
(2) No
Q 2 In your state specification, what is the percentage of the aged asphalt binder on RAP
that can be used.
(1) 0
(2) 25%
(3) 50%
(4) 75%
(5) 100%
(6) Other (Please provide the percentage) ____________________
Q 3 Do you think the percentage in your state specification is reasonable? If no, please list
your reasons.
(1) Yes

93
(2) Maybe
(3) No ____________________
Q 4 Do you have concerns about the current percentage in your state specification?
(1) Yes
(2) Maybe
(3) No
Q 5 What percentage do you think of the aged asphalt binder on RAP can be used?
(1) 0
(2) 25%
(3) 50%
(4) 75%
(5) 100%
(6) Other (Please provide the percentage) ____________________
Q 6 Are you aware of a method for testing the blending efficiency of RAP? If so, please
answer the next question.
(1) Yes
(2) No
Q 7 Which tools do know are used to test the blending efficiency of RAP?
(1) Gel Permeation Chromatography (GPC)
(2) Fourier Transform Infrared Spectroscopy (FTIR)
(3) Fluorescence Microscopy
(4) Dynamic Shear Rheometer (DSR)
(5) Other (Please specify) ____________________
Q 8 Does your state use rejuvenator in RAP containing asphalt mixtures?
(1) Yes
(2) No
Q 9 Do you think rejuvenator improves RAP blending efficiency?
(1) Yes
(2) Maybe
(3) No
Please complete the following information on the RAS usage.
Q 10 Does your state have a specification about how much of the aged asphalt binder on
94
RAS can be used? If so, please answer the next two questions.
(1) Yes
(2) No
Q 11 In your state specification, what is the percentage of the aged asphalt binder on RAS
that can be used.
(1) 0
(2) 25%
(3) 50%
(4) 75%
(5) 100%
(6) Other (Please provide the percentage) ____________________
Q 12 Do you think the percentage in your state specification is reasonable? If no, please
list your reasons.
(1) Yes
(2) Maybe
(3) No ____________________
Q 13 Do you have concerns about the current percentage in your state specification?
(1) Yes
(2) Maybe
(3) No
Q 14 What percentage do you think of the aged asphalt binder on RAS can be used?
(1) 0
(2) 25%
(3) 50%
(4) 75%
(5) 100%
(6) Other (Please provide the percentage) ____________________
Q 15 Are you aware of a method for testing the blending efficiency of RAS? If so, please
answer the next question.
(1) Yes
(2) No
Q 16 Which tools do know are used to test the blending efficiency of RAS?
(1) Gel Permeation Chromatography (GPC)
(2) Fourier Transform Infrared Spectroscopy (FTIR)
95
(3) Fluorescence Microscopy
(4) Dynamic Shear Rheometer (DSR)
(5) Other (Please specify) ____________________
Q 17 Does your state use rejuvenator in RAS containing asphalt mixtures?
(1) Yes
(2) No
Q 18 Do you think rejuvenator improves RAS blending efficiency?
(1) Yes
(2) Maybe
(3) No
Please provide the following information about blending efficiency between virgin
and aged binders.
Q 19 Among the factors listed, which do you think are the key factor(s) for the blending
efficiency of RAP/RAS. (You may choose more than one options)
(1) Mixing temperature
(2) Mixing time
(3) RAP/RAS content
(4) Rejuvenator
(5) Virgin binder grade
(6) Aggregate size
(7) Degree of aging of RAP/RAS
(8) Other (please specify) ____________________
Q 20 Do you think high RAP (>30%) /RAS (>5%) percentage will reduce the service life
of pavement?
(1) Yes
(2) Maybe
(3) No
(4) Other (please specify) ____________________
Q 21 Do you think linear blending charts (the relationship between the properties of mixed
binders and the percentage of aged binder is linear) are valid for RAP/RAS?
(1) Yes
(2) Maybe
(3) No
(4) Other (please specify)

96
Q 22 Would you like a complimentary copy of the final report?
(1) Yes
(2) No
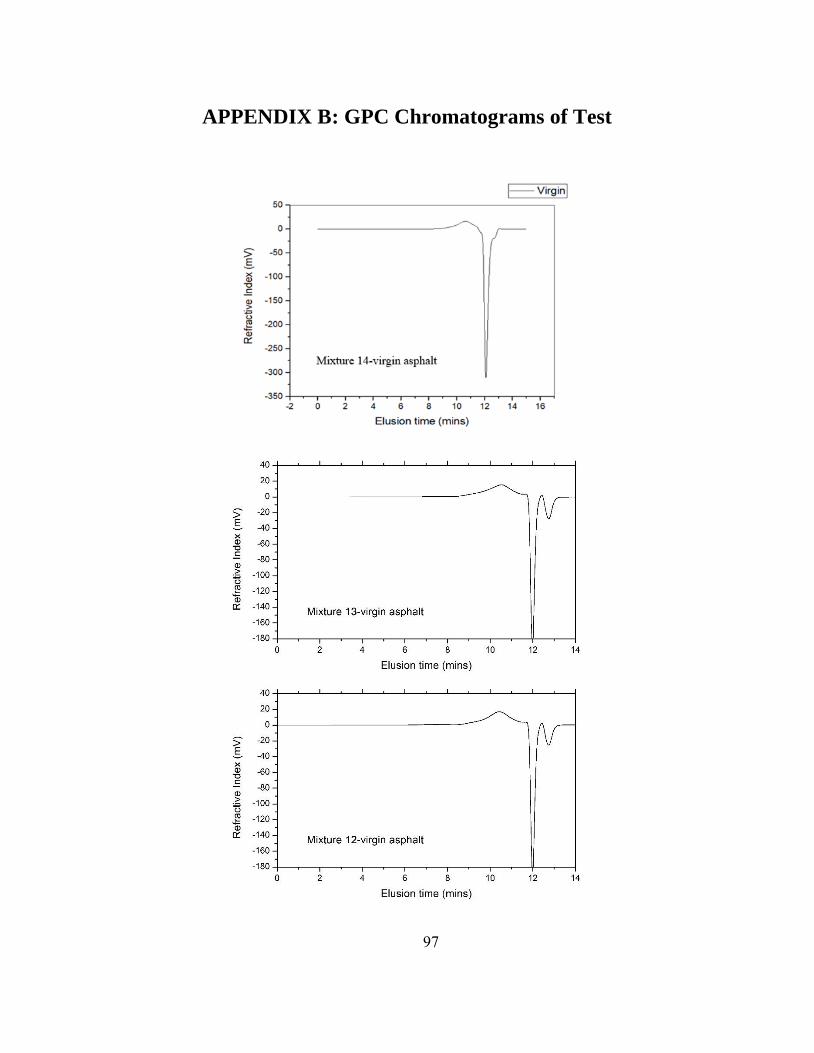
97
APPENDIX B: GPC Chromatograms of Test
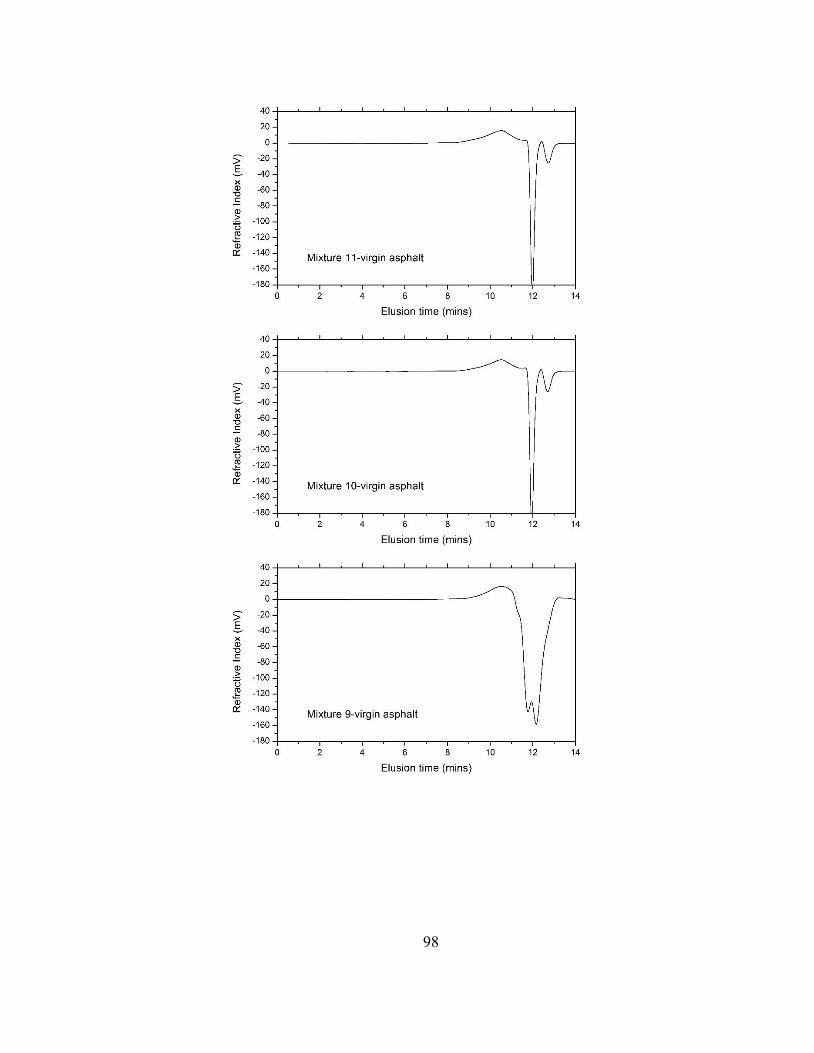
98
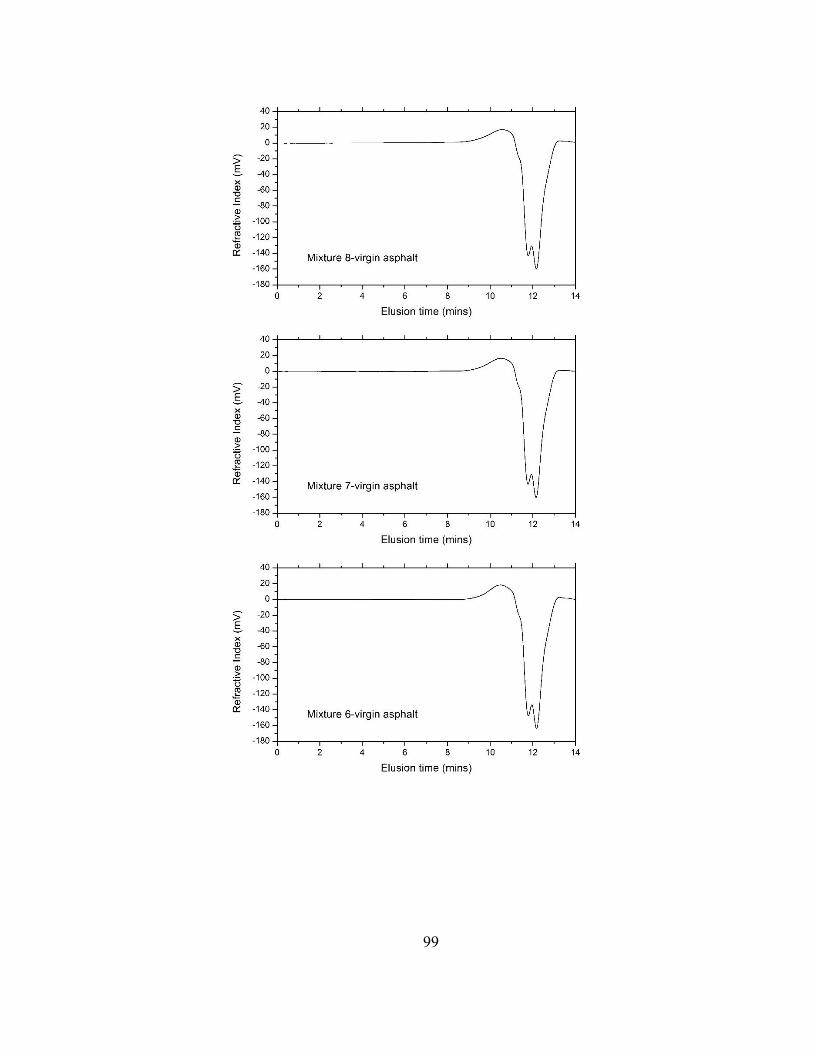
99

100
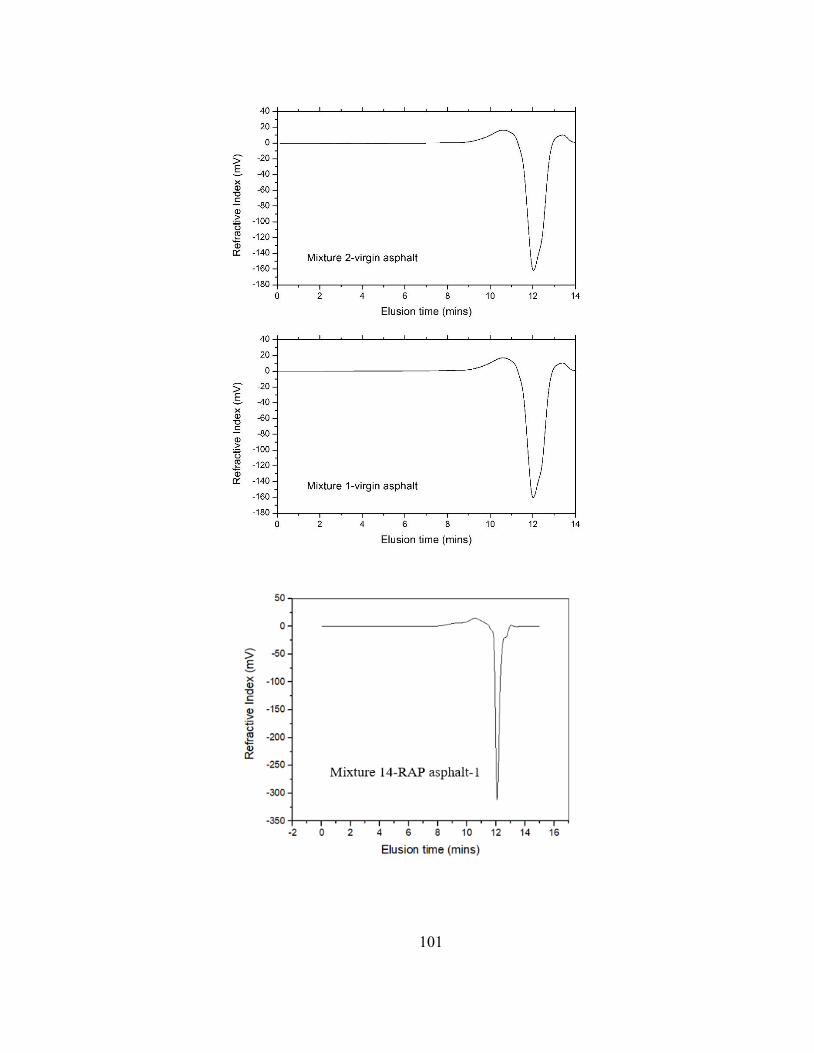
101
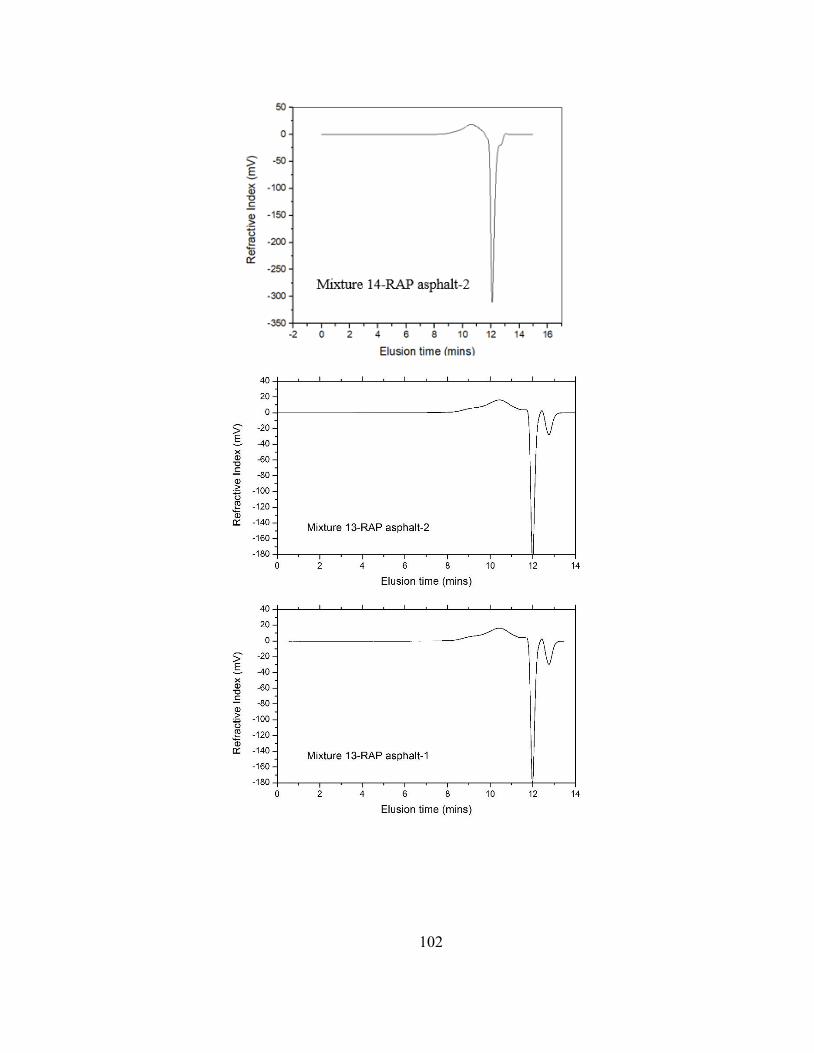
102

103
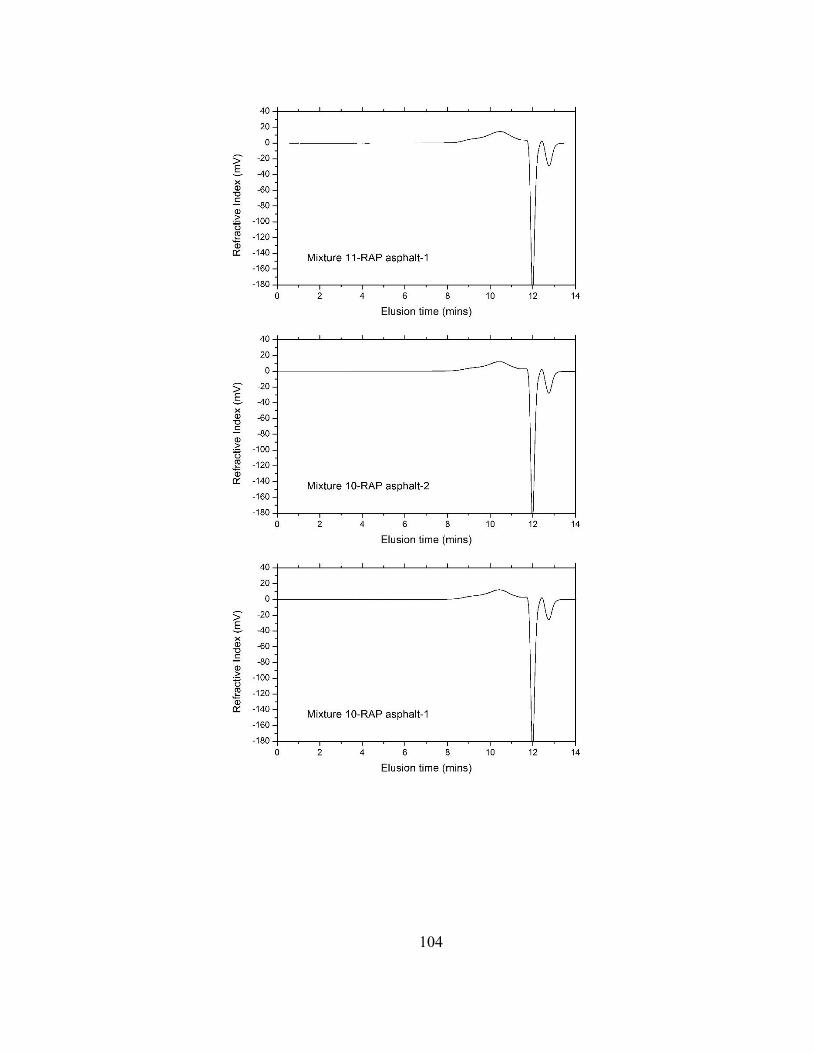
104
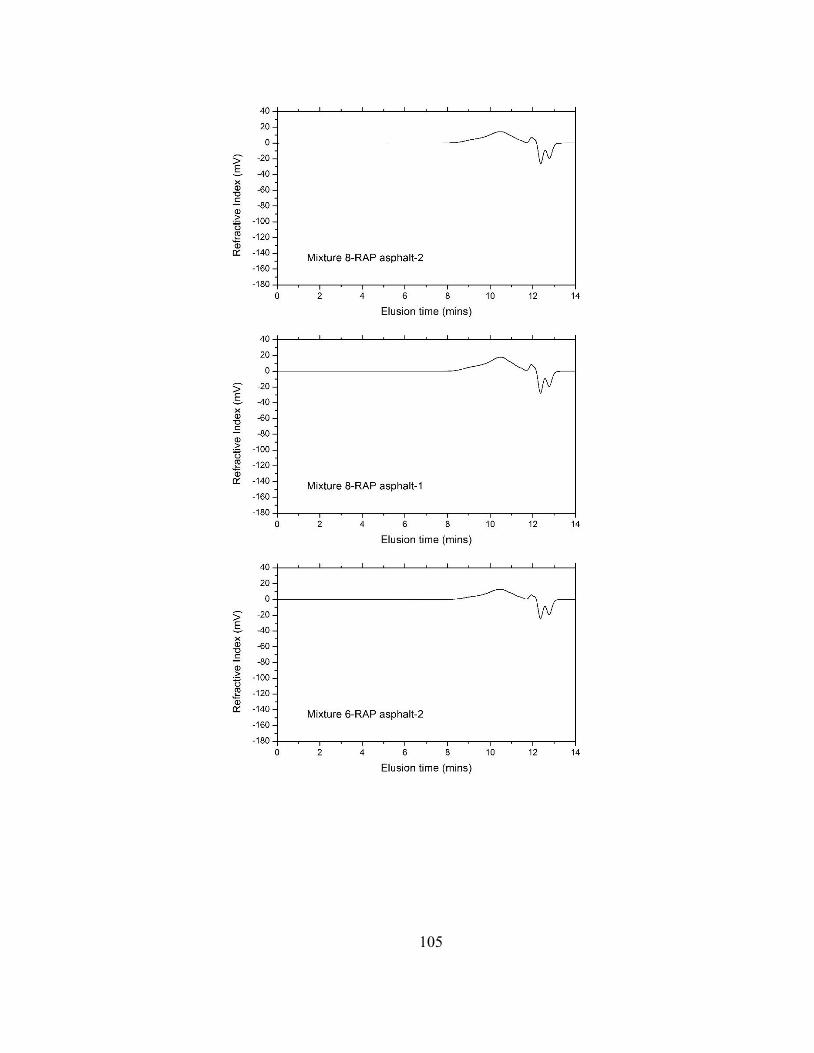
105
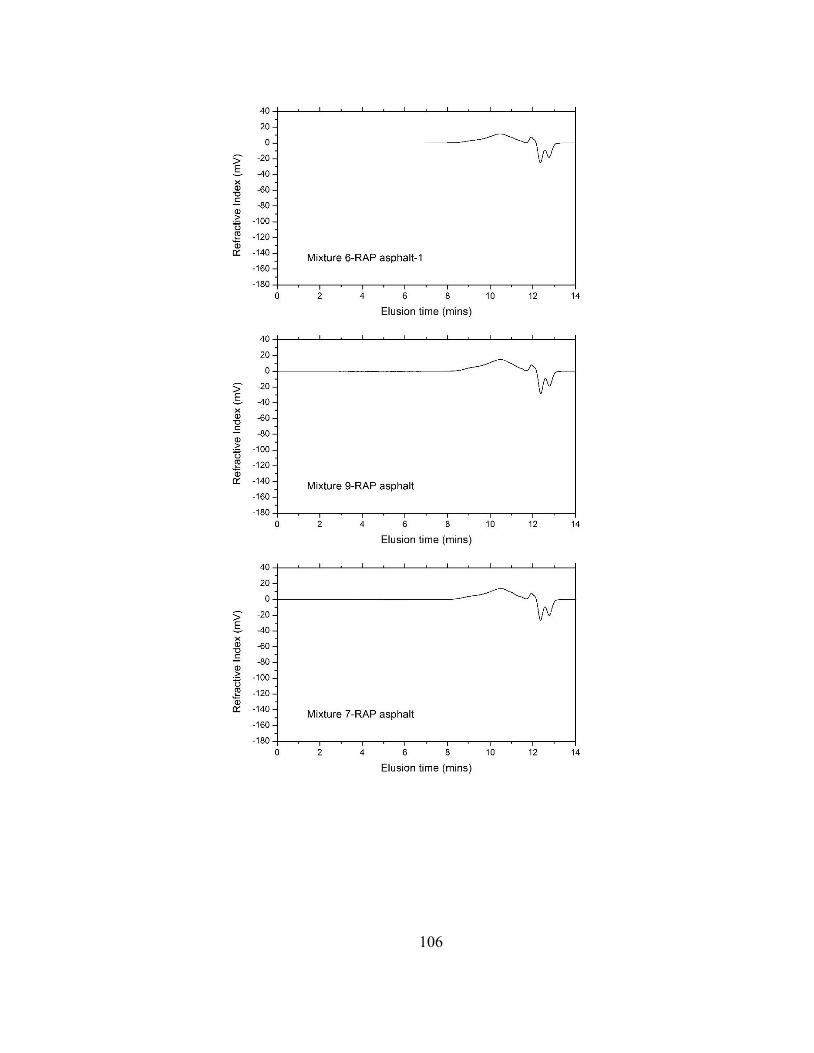
106

107

108
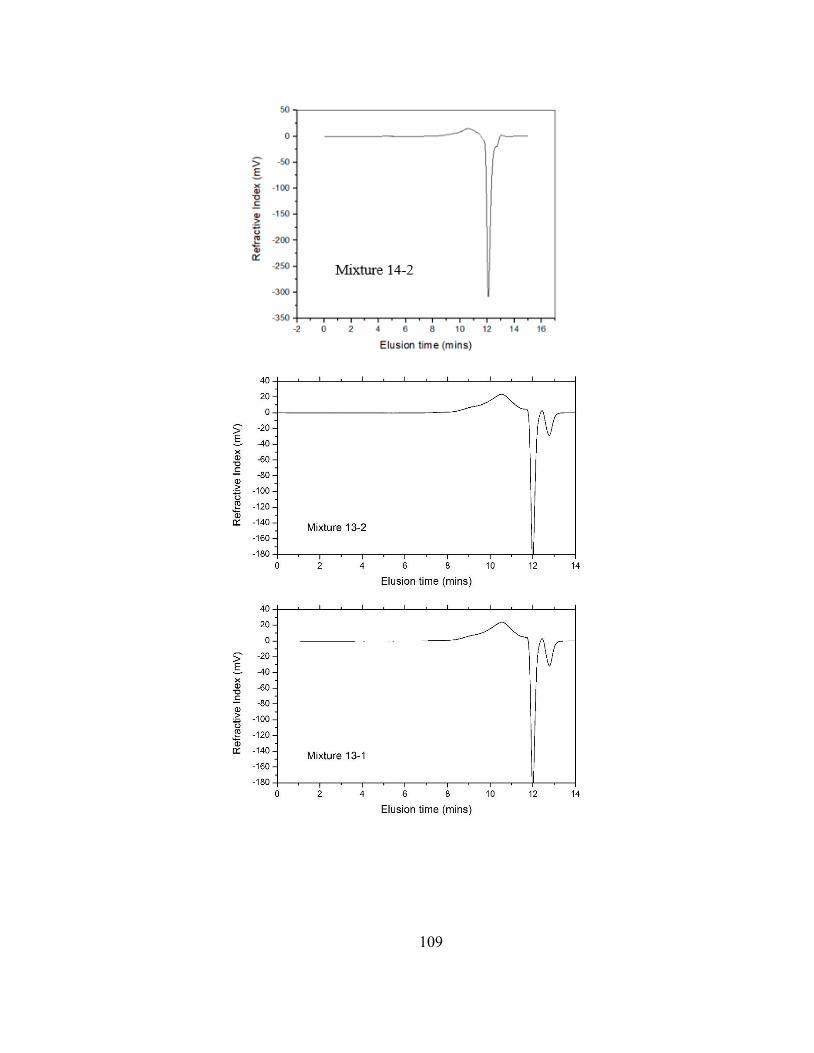
109

110

111

112

113
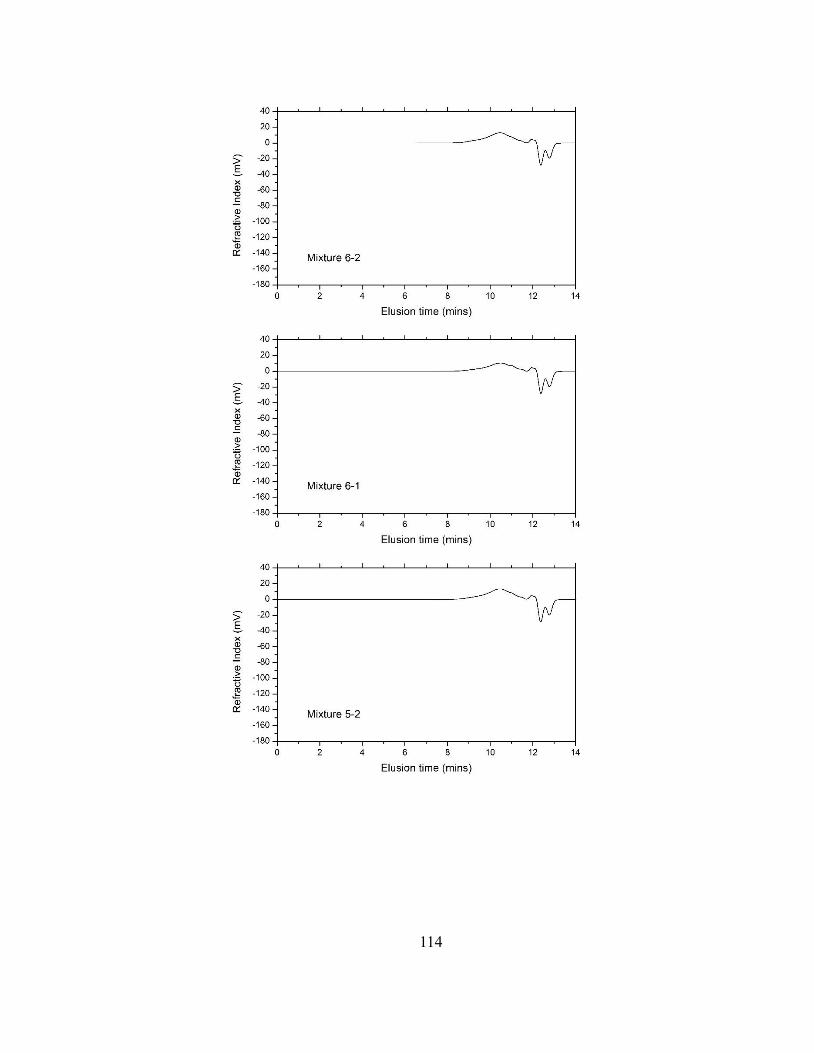
114

115
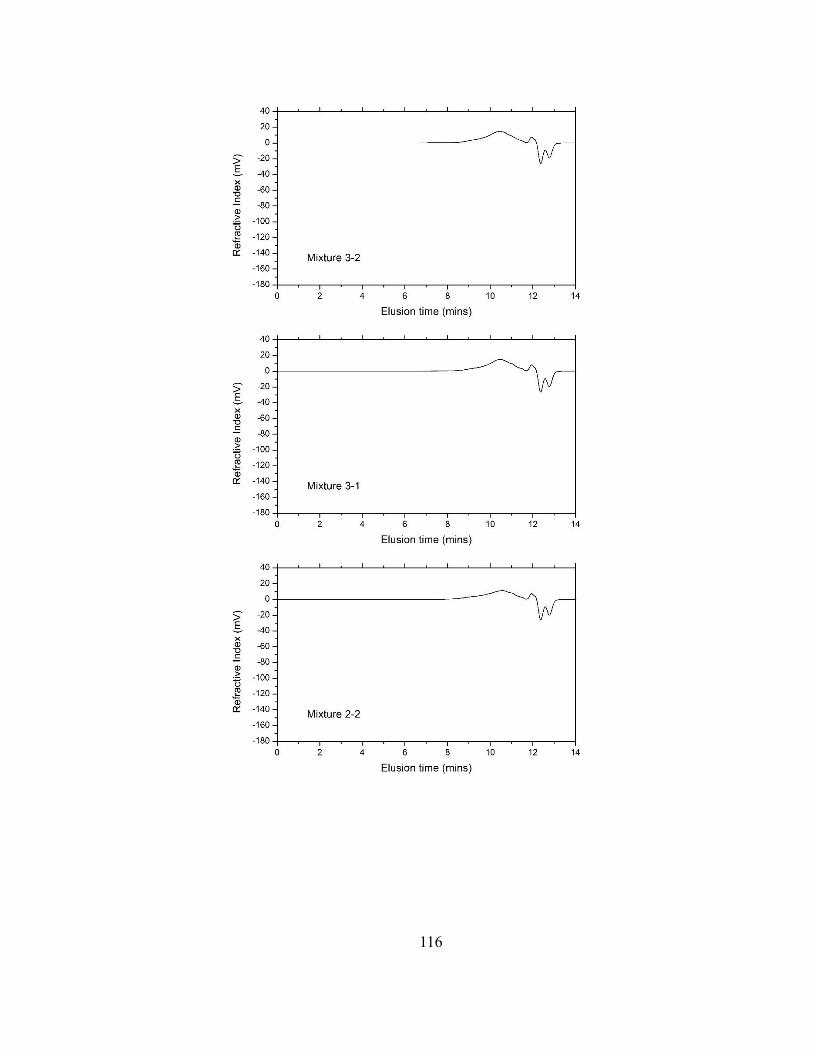
116

117
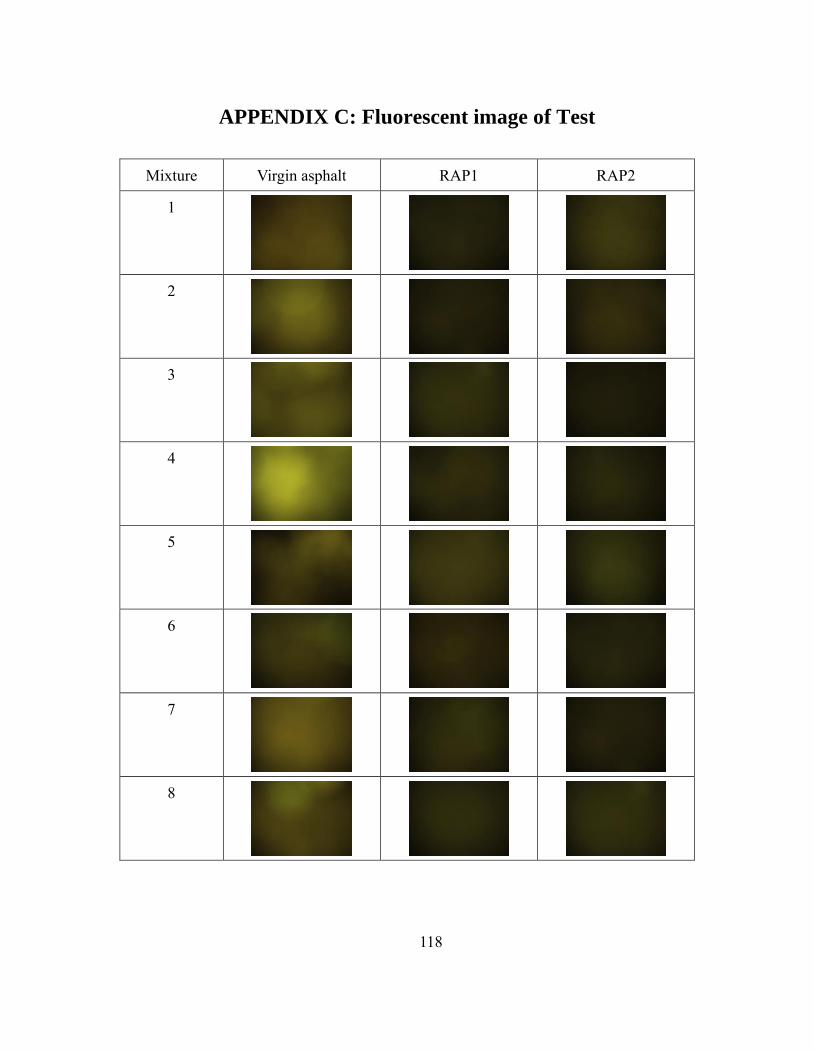
118
APPENDIX C: Fluorescent image of Test
Mixture Virgin asphalt RAP1 RAP2
1
2
3
4
5
6
7
8
119
9
10
11
12
13
14