Embed Size (px)
Citation preview

Ev
alu
ati
ng
pro
ac
tive
po
licin
g
MarylandJune 6, 2006
Evaluating proactivepolicing in the Netherlands
Evidence from a victimization survey
Ben Vollaard
CPB Netherlands Bureau for Economic Policy Research
Tuesday, June 6th, 2006
Ev
alu
ati
ng
pro
ac
tive
po
licin
g
MarylandJune 6, 2006
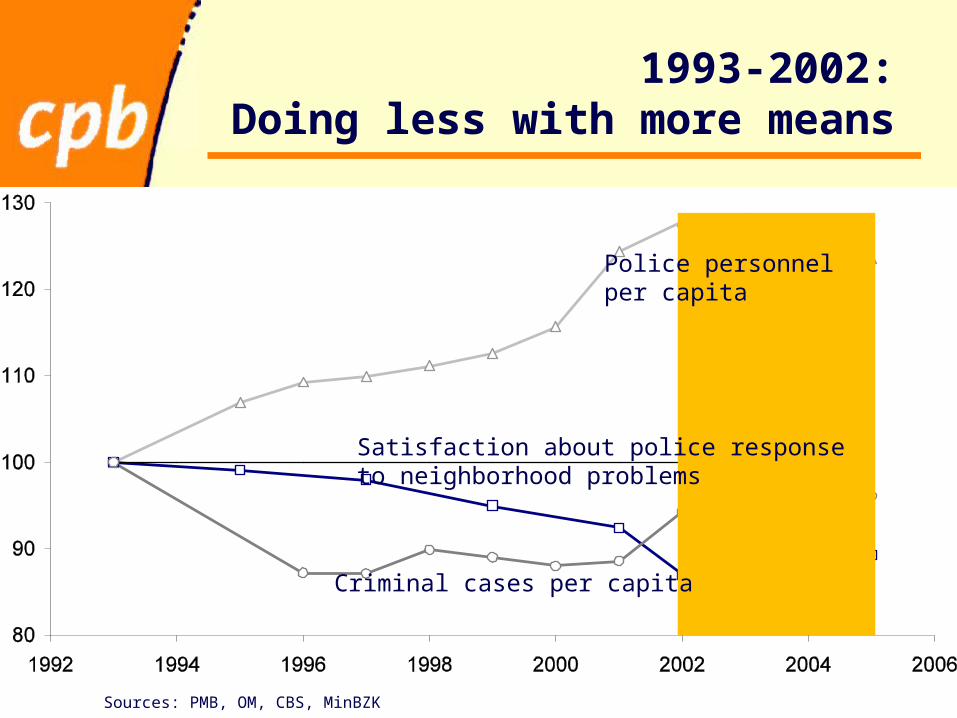
1993-2002:Doing less with more means
Police personnelper capita
Satisfaction about police responseto neighborhood problems
Criminal cases per capita
Sources: PMB, OM, CBS, MinBZK

Ev
alu
ati
ng
pro
ac
tive
po
licin
g
MarylandJune 6, 2006
Research question
Has the push for proactive policing contributed to a decline in crime, disorder and fear of crime during the period 2003-2005?

Ev
alu
ati
ng
pro
ac
tive
po
licin
g
MarylandJune 6, 2006
Outline
Dutch Victimization Survey Research design Estimation results Conclusions

Ev
alu
ati
ng
pro
ac
tive
po
licin
g
MarylandJune 6, 2006
Data

Ev
alu
ati
ng
pro
ac
tive
po
licin
g
MarylandJune 6, 2006
Dutch Victimization Survey:a unique source of data
Hard to get good data on style of policing► Police statistics incomplete, unreliable or simply not
available► Observations of researchers for only one or a few
locations
Survey includes questions about style of policing of local police department, provides data for 472 municipalities during 1993-2005

Ev
alu
ati
ng
pro
ac
tive
po
licin
g
MarylandJune 6, 2006
How do we measureproactive policing?
Police style Survey question
Disorder policing: aggressive law enforcement
Do you agree with the statement: ‘the police do not intervene sufficiently forcefully in your neighborhood’?
Hot spots policing: targeted visible presence
‘Do you agree with the statement: ‘the police are too little visible in your neighborhood’?
Do you see the police at least once a week in your neighborhood

Ev
alu
ati
ng
pro
ac
tive
po
licin
g
MarylandJune 6, 2006
Hot spots policing City of The Hague, 1993-2005
‘See police at least once a week’ (%)
‘See
pol
ice
too
little
’ (%
)
Actual visibility equallower dissatisfaction with police visibility

Ev
alu
ati
ng
pro
ac
tive
po
licin
g
MarylandJune 6, 2006
How reliable are citizens’ observations of police work?
Dissatisfaction with police fining related to actual police fines (at the municipality level)
Citizens’ picture of well/poorly performing police forces confirmed by other sources
Citizens’ response not simply based on local safety situation (‘it is safe, the police must be doing a good job’ and vice versa):► Dissatisfaction was growing during crime drop► Degree of urbanization (as proxy of crime) not
related to citizen satisfaction

Ev
alu
ati
ng
pro
ac
tive
po
licin
g
MarylandJune 6, 2006
Research design

Ev
alu
ati
ng
pro
ac
tive
po
licin
g
MarylandJune 6, 2006
Δ Local style of policing
Relate variation in changes in local style of policing to individual data on victimization
Control for overall visible police resources Heterogeneity:
► Individual background characteristics (employment, age, education, ethnicity, housing type, household size)
► Dissatisfaction with style of policing► Municipality fixed effects
Simultaneity► 1993-2001: neither resources nor policing styles
responsive to changes in local safety situation 5 waves (1993, 1995, 1997, 1999, 2001),
370,000 respondents; 472 municipalities

Ev
alu
ati
ng
pro
ac
tive
po
licin
g
MarylandJune 6, 2006
What do we estimate?
P(Crimeijt) = α Hot spotsjt+β Disorderjt + γ Visibilityjt + Xijt δ + ηj + μt + εijt
Victimization {0,1}
‘Too little aggressive’? {0...1}
See police weekly? {0...1}
Individual backgroundcharacteristics {0,1}
Municipality fixed effects {0,1}
Year fixed effects {0,1}
‘Too little visible’? {0...1}

Ev
alu
ati
ng
pro
ac
tive
po
licin
g
MarylandJune 6, 2006
Estimation results

Ev
alu
ati
ng
pro
ac
tive
po
licin
g
MarylandJune 6, 2006
Incentives affect style of policing:disorder policing

Ev
alu
ati
ng
pro
ac
tive
po
licin
g
MarylandJune 6, 2006
Incentives affect style of policing:hot spots policing

Ev
alu
ati
ng
pro
ac
tive
po
licin
g
MarylandJune 6, 2006
Effect on disorder, 2003-2005
Disorder policing Hot spots policing
Youth nuisance – 5 % – 3 %
Drugs nuisance – 7 % .
Public intoxication – 4 % – 2 %
Vandalism – 4 % – 4 %
Graffiti – 3 % – 4 %
Aggressive driving – 2 % – 1 %

Ev
alu
ati
ng
pro
ac
tive
po
licin
g
MarylandJune 6, 2006
Effect on fear of crime, 2003-2005
Disorder policing Hot spots policing
Feels unsafe – 2 % – 2 %
Avoids unsafe places
– 1 % – 2 %
Keeps child at home
– 2 % .
Fear of theft . – 3 %

Ev
alu
ati
ng
pro
ac
tive
po
licin
g
MarylandJune 6, 2006
Effect on property crime and violent crime, 2003-2005
Disorder policing Hot spots policing
Burglary – 3 % – 3 %
Theft out of car, car theft
– 1 % .
Bicycle theft – 3 % – 4 %
Purse theft . .
Threat with violence
– 3 % .
Assault – 4 % .

Ev
alu
ati
ng
pro
ac
tive
po
licin
g
MarylandJune 6, 2006
Robustness
Simultaneity:► Including host of municipality characteristics does
not affect estimated effects (employment, ethnicity, demography, etc.) for 1993-2001
► 2003-2005: greater responsiveness of style of policing to local trends in crime and disorder
Alternative source of data:► Actual police fines produces similar results for
aggressive driving, somewhat higher estimates for disorder and property crime

Ev
alu
ati
ng
pro
ac
tive
po
licin
g
MarylandJune 6, 2006
Conclusions

Ev
alu
ati
ng
pro
ac
tive
po
licin
g
MarylandJune 6, 2006
(1) Push for proactive policing enhanced police effectiveness
Performance contracts and accompanying local initiatives affected style of policing and contributed to decline in crime and disorder:► disorder – 3 to – 8 %► fear of crime – 2 to – 4 %► property crime – 1 to – 7 %► violent crime – 3 % to – 4 %

Ev
alu
ati
ng
pro
ac
tive
po
licin
g
MarylandJune 6, 2006
(2) Strengthening incentives cost-effective way of improving safety
Performance only improved with outside intervention
Similar drop in crime also possible with more police personnel
Would cost some 5600 FTEs additional police personnel = € 380 million annually (Vollaard en Koning, 2005)
More cost-effective to put existing resources to better use by strengthening incentives

Ev
alu
ati
ng
pro
ac
tive
po
licin
g
MarylandJune 6, 2006
(3) Citizen satisfaction meaningful indicator of police performance
Other sources confirm picture based on citizens’ observations
Important determinants of police effectiveness Could be used to hold the police accountable to
results (benchmarking)