Embed Size (px)
Citation preview

The InsTITuTe for sysTems research
ISR develops, applies and teaches advanced methodologies of design and
analysis to solve complex, hierarchical, heterogeneous and dynamic prob-
lems of engineering technology and systems for industry and government.
ISR is a permanent institute of the University of Maryland, within the
A. James Clark School of Engineering. It is a graduated National Science
Foundation Engineering Research Center.
www.isr.umd.edu
evaluating Design optimization models
Jeffrey W. herrmann
Isr TechnIcal reporT 2007-11
Evaluating Design Optimization Models
Jeffrey W. Herrmann Department of Mechanical Engineering and Institute for Systems Research
University of Maryland College Park, MD 20742
ABSTRACT
Design optimization is an important engineering design activity. Research on design optimization has considered better solution methods as well as novel formulations. Although there exist well-established measures for evaluating solution methods (both exact algorithms and heuristics), attributes for evaluating a design optimization model do not exist. This paper presents a comprehensive approach for evaluating a design optimization model along the following dimensions: scope, variable set, objective function, and model structure. Using these attributes distinguishes design optimization models from each other and helps one locate relevant design optimization models. Moreover, they may lead to a comprehensive classification scheme. Finally, they will be useful for assessing design optimization research.
1. Introduction
Design optimization is an important engineering design activity. In general, design optimization determines values for design variables such that an objective function is optimized while performance and other constraints are satisfied [1, 2, 3]. The use of design optimization in engineering design continues to increase, driven by more powerful software packages and the formulation of new design optimization problems motivated by the decision-based design (DBD) framework [4, 5].
Like other types of modeling, formulating a design optimization model is a subjective process that requires engineering judgment and technical skills. In a given design situation, there are likely to be many variables, parameters, constraints, and criteria related to different performance attributes, costs, and customer preferences. Thus, there are a variety of relevant optimization models from which to choose. Moreover, a large problem can be decomposed into smaller problems, and, instead of a traditional optimization model, heuristics and rules of thumb can be applied to further simplify matters.
Consider, for example, the design of a motor. The overall product development objective is to maximize the profitability of the motor, which depends upon attributes such as the motor’s mass and efficiency. These attributes are functions of the motor design variables. Given sufficient information about how the design variables affect the attributes and how the attributes affect profitability, a design engineer can formulate an integrated design optimization model to maximize profitability (such a problem is sometimes called an “enterprise model”). On the other hand, the design engineer could, as a heuristic for maximizing profitability, choose to minimize mass (or maximize efficiency) and formulate a simpler optimization problem that does not require detailed knowledge about how mass (or efficiency) affects profitability.
The research community has spent a great deal of effort working on better algorithms for solving design optimization problems. Exact algorithms are designed to find optimal solutions,
1
while heuristics attempt to find near-optimal solutions quickly. When proposing a new algorithm, it is customary to evaluate the computational effort of the algorithm and the quality of the solutions generated (for heuristics). The computational effort can be determined theoretically as a function of the size of the problem instance or measured empirically by recording how long it takes a computer to execute the algorithm on typical problem instances.
Historically, design optimization models have concentrated on maximizing the performance (or minimizing the cost) of a component or product. The DBD framework has inspired researchers to develop new optimization models that include variables from the marketing and manufacturing domains.
As research continues in this field, an important question arises. How can one compare a new design optimization model to those that have been presented earlier? The investigator proposing the model will need to answer this question to indicate how the new model compares to the previous literature. Related to this, a design engineer who needs to optimize a design will want some guidance to find the most appropriate model.
Standard optimization texts focus on the nature of the constraints and objective function and distinguish between linear programming problems and nonlinear programming problems (see, for example, Arora [3]). Although this is important for learning about optimization techniques, it does not completely address the above question.
A different approach is to classify design optimization models based on the nature of the problem being solved. Brochtrup and Herrmann [6] propose a three-field classification scheme for product design optimization problems. The three fields are the product type (either single product or product family), variables type (engineering, manufacturing, or price), and objective function type (performance, cost, or profit). Scott et al. [7] propose a scheme for classifying product platform design optimization problems based on the following attributes: platform architecture selection and the presence of marketing demand. Simpson [8] classifies 40 product family optimization approaches using nine categories that describe not only the problem but also the solution technique: the type of product family, the number of objectives, market demand, manufacturing cost, uncertainty, specified platform variables, number of solution stages, optimization algorithm, and example product family.
In contrast to the classification approach, this paper identifies key attributes for evaluating a design optimization model. These attributes are based on theoretical and practical considerations. According to Ravindran et al. [2], formulating an optimization problem requires the following tasks: 1. Determining the boundaries of the engineering system, 2. Defining the criterion on which to rank solutions, 3. Selecting the system variables that characterize the candidate solutions, 4. Defining the relationships between the variables.
By covering the areas of scope, variable set, objective function, and model structure, the proposed attributes describe the boundaries, criteria, variables, and relationships of the design optimization model. Some of the proposed attributes are similar to the categories used by Simpson [8]. However, the proposed attributes focus on the model, not the solution technique.
Our goals for the proposed attributes include both scientific and practical ones. First, the attributes help us to organize and understand design optimization models, an important step in any scientific discipline. While these measures are not the only conceivable ones, we believe that this list includes the most important attributes without becoming unnecessarily unwieldy. Second, the attributes provide practical help for design engineers considering design
2

optimization. Using them, a design engineer can locate similar design optimization problems, which can be useful guides for formulating a new problem. Moreover, the set of similar design optimization problems indicates the range of potential solution techniques. Of course, the design engineer must still choose a problem formulation and a solution technique. The attribute list does not replace modeling skill, but it does provide information that can help one develop it.
Third, these attributes could form the basis of a more comprehensive classification scheme for design optimization models that extends previous work [6, 7, 8]. Finally, these attributes could be used for assessing design optimization research, as discussed below.
Before describing the attributes, it will be useful to discuss decomposition briefly. This technique is used to divide a large optimization model into a set of subproblems that are related to each other. Solving the subproblems yields a solution to the original optimization problem. Because decomposition can be considered as a solution technique, this paper, which focuses on the attributes of design optimization models, does not attempt to evaluate such methods.
2. Design Optimization Model Attributes
This section presents a list of attributes for evaluating a design optimization model. They can be grouped into four areas: scope, variable set, objective function, and model structure. Each attribute is defined precisely below.
Scope. Design optimization models have been used for designing a wide variety of parts, complete products, and product families. This wide variety indicates an obvious attribute.
Attribute 1: Model scope. Model scope describes the object or system that is being optimized. The possible values are defined as follows: • Component: an object that has no separable components. • Subassembly: an arrangement of parts fastened together that goes into a product. Typically
(except in the case of spares), it is not sold or used independently. • Product: a device or system that is manufactured, sold, and used independently of other
devices. Typically, it is designed with no regard to similar products. Component sharing and interconnection with other products do not influence the design decisions.
• Product family: a set of common elements, modules, or parts from which a stream of derivative products can be efficiently developed and launched; or a collection of common elements, especially the underlying core technology, implemented across a range of products; or a collection of assets (i.e., components, processes, knowledge, people and relationships) that are shared by a set of products [9].
Variable set. A design optimization model is used to set the values of specific variables. Variables are sometimes referred to as parameters, design variables, and design parameters [10]. A designer must select the values for variables. Optimization is used to help find appropriate values of variables. The following attributes describes the variables in a model.
Attribute 2: Number of variables. The number of different variables that need to be determined. This is a single value for a specific instance and a range of values for a set of instances.
Attribute 3: Type of variables. Traditionally, design optimization has concentrated on the size and shape of the product. Design optimization models now include other types of variables that relate to manufacturing and other domains. This attribute will be a subset of the following list, the components of which are described below: {product architecture, engineering, product platform, manufacturing, price}.
3

• Product architecture: variables that describe how the physical elements of a design are arranged and how they interact.
• Engineering: variables specific to the product being designed. Typical engineering variables include product geometry, features, and material selection. If the optimization occurs during conceptual or preliminary design, the variables may be critical system parameters.
• Platform: variables that describe attributes and features that are common across some part of a product family.
• Manufacturing: variables specific to the manufacturing domain. Every facility will have different manufacturing variables specific to the machine types and facility layout. Examples include number of machines, time allotment per machine, number of operations per part, force and energy requirements, feed rate, and depth of cut.
• Price: the price of the product or system being designed. Pricing is a critical but complex issue. For a new product, a successful pricing approach first determines the price that customers can be convinced to pay for the product concept, and then the firm designs a satisfactory product that can be manufactured profitably at the expected sales volume [11]. While the initial pricing strategy may be used to set a cost target for the product design, the product price will certainly change over time as the firm’s pricing strategy influences their response to market forces. The product development team does not need to make pricing decisions that have not yet arrived. However, optimizing product profitability at the design stage requires understanding what the firm is likely to do. If alternative strategies are feasible (such as skim pricing or penetration pricing), the team may want to evaluate these strategies, since they control future prices.
Objectives. The objective function is a key feature of the design optimization model. The number of objective functions affects the solution techniques that need to be considered. The type of objective functions affects the types of data that are needed to formulate the problem, because the model must state the relationships between the design variables and the objective function(s).
Attribute 4: Number of objectives. The number of objectives that need to be simultaneously optimized. This is a single value. Note that many design optimization models combine two or more objectives into a single aggregate objective function (as a weighted sum, for example). In such cases, the number of objectives is still one.
Attribute 5: Type of objectives. Traditional design optimization focuses on performance optimization or cost minimization. The influence of DBD has inspired researchers to optimize profit and related measures. This attribute will be a subset of the following list, the components of which are described below: {performance, unit cost, manufacturing, demand, profit, cost of ownership}. • Performance: objective functions that are related to product performance or product
characteristics that are typically quantitative measures related to the object or system being designed. The objective is to maximize or minimize a characteristics or performance measure, based on the product being designed. Examples: minimize weight, minimize size, minimize stress, and maximize range. Alternatively, the objective may be to minimize the deviation from a target attribute value.
• Unit cost: objective functions generally related to the unit cost of manufacturing a single item. The goal is to minimize the overall cost of the product based on one or more cost models. Generally this type of optimization will be more complex than the performance objectives because cost models will be necessary along with the design models. While one
4

can consider a cost objective to be a performance measure equivalent to any attribute-based objective, we treat cost separately because product performance and product cost are fundamentally different and very important objectives [12]. Therefore it is useful to the designer if a distinction is made between the two types of objectives. As before, these include situations where the objective is to minimize the deviation from a cost target.
• Manufacturing: objective functions related to the performance of the manufacturing system, such as capacity or manufacturing cycle time. Generally, designing a product to optimize such measures is the area of Design for Production [13].
• Demand: objective functions related to the number of units that are sold. Demand and objectives such as market share are surrogates for profit, since profit depends upon sales. Demand is a key performance metric in the DBD framework [4].
• Profit: objective functions that are directly related to revenue. Maximizing this is one of the fundamental objectives of a commercial firm. Examples: maximize revenue, maximize profit, maximize expected utility of profit, maximize net present value, and maximize return on investment.
• Cost of ownership: objective functions related to the long-term costs of purchasing, building, installing, operating, maintaining, or disposing of a product or system. Typically, this objective is important when the eventual owner is involved in the design process, as in weapons systems and civil infrastructure. Optimizing this objective requires a different set of models than those described above.
Structure. The last set of attributes describes the structure of the design optimization model. The size of the problem, the nature of the variables, and the types of relationships in the model all affect the feasibility of different solution techniques and the computational effort required to solve the problem. There are many ways to model uncertainty as well.
Attribute 6: Variable characteristics. Although continuous variables are most common, other types are possible. This attribute will be a subset of the following list, the components of which are described below: {continuous, integer, binary, discrete}. • Continuous: there are variables that can be set to any value within a given range. • Integer: there are variables that can be set to any integer within a given range. • Binary: there are variables that can be set to either 0 or 1. • Discrete: there are variables that can be set to any element in a given set of discrete elements.
Attribute 7: Model relationships. Design optimization models use a variety of methods to define the relationships between the variables and the objective functions. This attribute will be a subset of the following list, the components of which are described below: {linear, nonlinear, simulation}. • Linear: the model has relationships that are linear equations of the variables. • Nonlinear: the model has relationships that are nonlinear equations of the variables. • Simulation: an objective is computed based on one or simulation models, such as a finite
element analysis; no explicit analytical form is available. Attribute 8: Number of constraints. Design optimization models use constraints to
express relationships that must be satisfied. These come from different sources, including the underlying physical phenomena, performance requirements, and resource limitations. Constraints are also used to avoid bad solutions when an objective function cannot be expressed precisely. This attribute states the number of constraints. This is a single value for a specific instance and a range of values for a set of instances.
5

Attribute 9: Uncertainty. Uncertainty has many sources, and many approaches have been used to model uncertainty. This attribute will be a subset of the following list, the components of which are described below: {none, averages, probabilistic constraints, expected performance, worst-case}. • None: the model does not account for uncertainty explicitly. • Averages: the model uses averages for uncertain parameter values. • Probabilistic constraints: the model includes constraints on the probability of certain events. • Expected performance: the model replaces an uncertain objective function by its expected
value. • Worst-case: the model replaces an uncertain objective function by its worst-case value.
3. Textbook Examples
To begin demonstrating the use of these attributes, this section will evaluate design optimization models from two engineering design optimization textbooks. (Additional examples are provided in later sections.) The first set of problems is from Ravindran et al. [2]. Table 1 lists the results.
In the oxygen supply system design problem, the objective is to minimize the total annual costs, which includes the oxygen production cost, the compressor operating cost, and the fixed costs of the compressor and storage vessel. The design variables are the production rate, the capacities, and the maximum tank pressure, which are critical system parameters. The objective of the welded beam design problem is to minimize the manufacturing costs (welding labor and material) of the beam. The compressed air energy storage system design problem is to minimize the operating cost of the plant. It includes discrete variables such as the turbine pressure ratio, which must take on one of two practical values.
Table 1. Selected design optimization models from Ravindran et al. [2]
Problem Oxygen supply system
Welded beam Compressed air energy storage system
1. Model scope Product Component Product 2. Number of variables
4 4 24
3. Type of variables
Engineering Engineering Engineering
4. Number of objectives
1 1 1
5. Type of objectives
Performance Unit cost Life cycle cost
6. Variable characteristics
Continuous Continuous Continuous, Discrete
7. Model relationships
Linear, Nonlinear
Linear, Nonlinear
Linear, Nonlinear
8. Number of constraints
4 8 48
9. Uncertainty None None None
6

Table 2. Selected design optimization models from Arora [3] Problem Can Insulated
spherical tank Two-bar bracket Coil springs
1. Model scope Product Product Component Component 2. Number of variables
2 1 6 3
3. Type of variables
Engineering Engineering Engineering Engineering
4. Number of objectives
1 1 1 1
5. Type of objectives
Performance Life cycle cost Performance Performance
6. Variable characteristics
Continuous Continuous Continuous Continuous
7. Model relationships
Linear, Nonlinear
Linear, Nonlinear
Linear, Nonlinear
Linear, Nonlinear
8. Number of constraints
5 1 15 10
9. Uncertainty None None None None Next, we evaluate selected design optimization models from Arora [3]. Table 2 lists the
results. In the can design problem, the objective is to minimize the can’s surface area as a surrogate for minimizing manufacturing cost. The objective of the insulated spherical tank problem is to minimize the cost of insulation, the cost of refrigeration equipment, and cost of operations for 10 years. In the two-bar bracket design problem, the objective is to minimize the bracket’s total mass as a surrogate for minimizing manufacturing cost. The coil spring design problem is to find the minimal mass spring that can carry a given axial load without material failure. The deflection surge wave frequency must be greater than specified minimums.
4. Research Examples
This section evaluates selected design optimization models from research publications. These were selected to represent a range of problem types, and the publications contained sufficient information to evaluate the design optimization model. Tables 3, 4, and 5 list the results.
Kroo et al. [14] describe a system level aircraft design problem. The objective function is to minimize direct operating cost, which is a component of life cycle cost. The design variables include wing area, sweep, aspect ratio, wing position, and weight, altitude, and size variables, which are critical system parameters. The description mentions no attempt to model uncertainty and states that the objective is evaluated using a set of analysis subroutines.
Sobieski and Kroo [15] present a wing design optimization problem that has forty-two design variables: twenty twists, twenty thicknesses, the root angle of attack, and the wing span. The objective is to maximize the wing performance factor. Evaluating this requires using a vortex lattice code.
7

The automobile chassis design optimization problem presented by Kim et al. [16] attempts to minimize the total deviation from handling and ride quality targets. This can be formulated as a single optimization problem with 12 design variables and 54 constraints, including a kinematic and dynamics simulation of the suspension (see the appendix).
Wassenaar and Chen [17] present a motor design optimization problem with uncertainty. There are eight continuous design variables (each with upper and lower bounds) and 26 linear and nonlinear relationships between these and the motor performance attributes and costs. Demand is a function of the performance attributes and price, which is the ninth independent variable. Two design variables and three parameters are modeled as random variables, and Monte Carlo simulation samples values from these distributions. The objective function is to maximize the expected utility of net revenue.
Renaud and Gu [5] present two versions of a modified aircraft sizing (ACS) problem. The first version minimizes gross take-off weight, and the second version maximizes net revenue. Both versions include three analysis routines for evaluating aerodynamics, weight, and performance. There are bounds on the range and stall speed. The demand model is a multiplicative model that uses two linear and four nonlinear functions to relate performance to demand multipliers. The total cost function is a nonlinear function of demand and cost-related variables. Net revenue equals the price multiplied by the demand minus the total cost.
Azarm and Narayanan [18] present a fleet design optimization problem. The objectives are to minimize the cost of the fleet of identical ships and to maximize its cargo capacity. There are nine design variables and 21 linear and nonlinear constraints. The engineering variables are: breadth, depth, deadweight, length, number of ships, draft, utilization factor, speed, and displacement.
Table 3. Selected design optimization models.
Problem Aircraft [14] Wing [15] Automobile chassis
Motor design [17]
1. Model scope Product Subassembly Subassembly Product 2. Number of variables
13 42 12 9
3. Type of variables
Engineering Engineering Engineering Engineering, Price
4. Number of objectives
1 1 1 1
5. Type of objectives
Life cycle cost Performance Performance Profit
6. Variable characteristics
Continuous Continuous Continuous Continuous
7. Model relationships
Nonlinear, Simulation
Nonlinear, Simulation
Linear, Nonlinear, Simulation
Linear, Nonlinear
8. Number of constraints
9 21 51 44
9. Uncertainty None None None Expected performance
8

Table 4. Selected design optimization models.
Problem ACS (1) [5] ACS (2) [5] Fleet of ships [18] 1. Model scope Product Product Product 2. Number of variables
7 8 9
3. Type of variables
Engineering Engineering, Price
Engineering
4. Number of objectives
1 1 2
5. Type of objectives
Performance Profit Peformance, Cost
6. Variable characteristics
Continuous Continuous Continuous, Discrete
7. Model relationships
Nonlinear, Simulation
Nonlinear, Simulation
Linear, Nonlinear
8. Number of constraints
5 7 21
9. Uncertainty None None None Gupta and Samuel [19] describe an exercise machine design optimization problem,
although the complete optimization model is not presented. The problem includes selecting between alternative design concepts as well as selecting physical components. The objective is to maximize profit.
Li and Azarm [20] present a cordless screwdriver design optimization problem. The problem has five design variables and three objectives. Three design variables are discrete (the motor type, cell type, and gear type), one is integer (the number of cells), and one is continuous (the gear ratio). The objectives are to maximize battery life, minimize operation time, and minimize tool weight; all are evaluated using simulation.
Sues et al. [21] discuss reliability-based design optimization models. Here we will evaluate the axial compressor blade design problem. The design variables are two twist parameters and a thickness scaling factor, which determine the geometry of the component. Uncertainty in the design variables and seven parameters exists due to manufacturing process uncertainty and model errors. The constraints set lower bounds on the probability that stress, fatigue, and deflection thresholds are met. The objective is to minimize unit cost, which is a function of the expected efficiency and component weight.
9

Table 5. Selected design optimization models. Problem Exercise
machine [19] Cordless screwdriver [20]
Axial compressor blade [21]
1. Model scope Product Product Component 2. Number of variables
n.a. 5 3
3. Type of variables
Product architectures, engineering, price.
Engineering Engineering
4. Number of objectives
1 3 1
5. Type of objectives
Profit Performance Cost
6. Variable characteristics
Discrete Continuous, Discrete, Integer
Continuous
7. Model relationships
Nonlinear Simulation Nonlinear, Simulation
8. Number of constraints
n.a. 10 4
9. Uncertainty None None Probabilistic constraints, Expected performance
5. Product Family Examples
This section evaluates two product family design optimization models. Table 6 lists the results. Hernandez et al. [22] studied a family of absorption chillers and presented a model for optimization the design of the absorber-evaporator module. The size of the module in the family can range from 600 to 1300 tons. The objective function was a weighted combination of minimizing deviations from cost and cycle time targets and minimizing cost and cycle time variance. (The module size is treated as an uncertainty.) The design variables are the tube length, the type of absorber tube, and the type of evaporator tube. The model includes a heat transfer model of the absorber-evaporator.
Simpson [8] optimized a product family of ten universal electric motors using different approaches; here we’ll consider the single-stage approach with platform variables specified a priori. There are two platform design variables (motor radius and stator thickness) that will be the same for all ten motors. For each of the ten motors, the optimization model has six design variables, two objectives (minimizing mass and maximizing efficiency), and 18 linear and non-linear constraints.
10
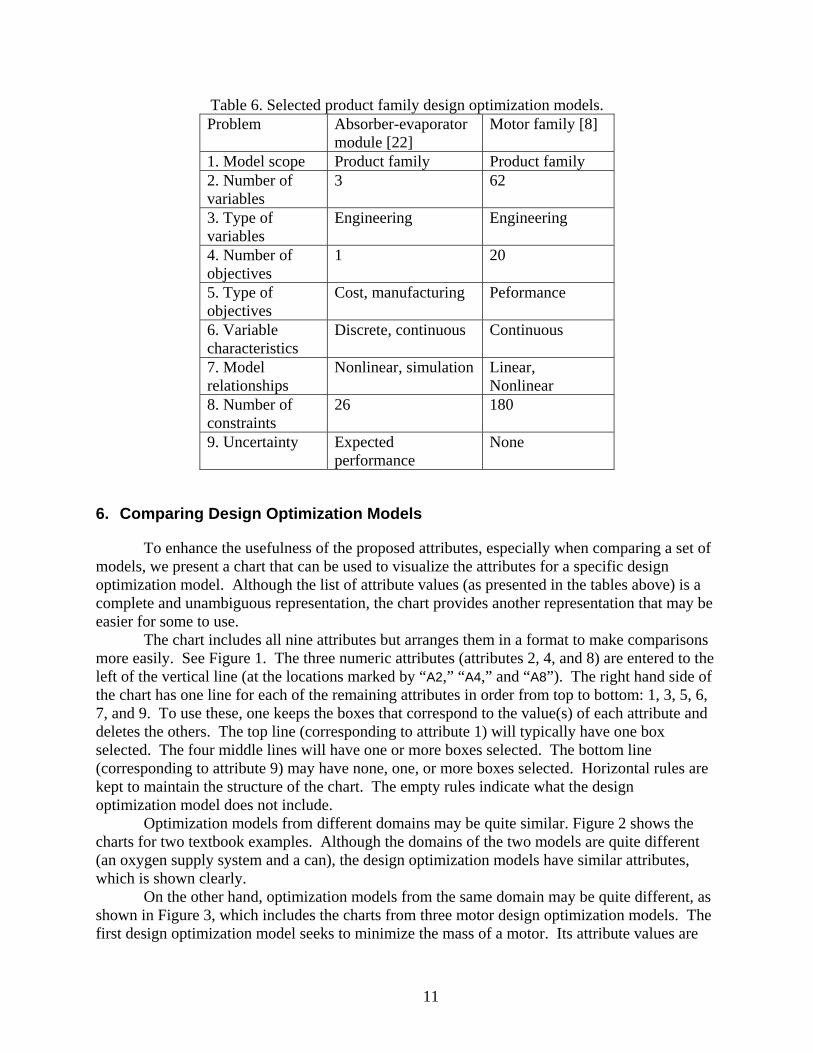
Table 6. Selected product family design optimization models. Problem Absorber-evaporator
module [22] Motor family [8]
1. Model scope Product family Product family 2. Number of variables
3 62
3. Type of variables
Engineering Engineering
4. Number of objectives
1 20
5. Type of objectives
Cost, manufacturing Peformance
6. Variable characteristics
Discrete, continuous Continuous
7. Model relationships
Nonlinear, simulation Linear, Nonlinear
8. Number of constraints
26 180
9. Uncertainty Expected performance
None
6. Comparing Design Optimization Models
To enhance the usefulness of the proposed attributes, especially when comparing a set of models, we present a chart that can be used to visualize the attributes for a specific design optimization model. Although the list of attribute values (as presented in the tables above) is a complete and unambiguous representation, the chart provides another representation that may be easier for some to use.
The chart includes all nine attributes but arranges them in a format to make comparisons more easily. See Figure 1. The three numeric attributes (attributes 2, 4, and 8) are entered to the left of the vertical line (at the locations marked by “A2,” “A4,” and “A8”). The right hand side of the chart has one line for each of the remaining attributes in order from top to bottom: 1, 3, 5, 6, 7, and 9. To use these, one keeps the boxes that correspond to the value(s) of each attribute and deletes the others. The top line (corresponding to attribute 1) will typically have one box selected. The four middle lines will have one or more boxes selected. The bottom line (corresponding to attribute 9) may have none, one, or more boxes selected. Horizontal rules are kept to maintain the structure of the chart. The empty rules indicate what the design optimization model does not include.
Optimization models from different domains may be quite similar. Figure 2 shows the charts for two textbook examples. Although the domains of the two models are quite different (an oxygen supply system and a can), the design optimization models have similar attributes, which is shown clearly.
On the other hand, optimization models from the same domain may be quite different, as shown in Figure 3, which includes the charts from three motor design optimization models. The first design optimization model seeks to minimize the mass of a motor. Its attribute values are
11

quite different from those of the second model, which includes a price variable, optimizes a profit-related objective, and uses expected values to capture uncertainty. Interestingly, the first model’s attribute values are more similar to those of the motor product family optimization model, though the latter contains many more design variables, objective functions, and constraints.
Comp. Sub. Prod. Fam.
Arch. Eng. Plat. Mfg. PriceA2
Perf. Cost Mfg. Dmd. ProfitA4 COO
Cont. Int. Binary Disc.
Lin. Non-L Sim.A8
Avg. P.C. Exp. W.C.
Figure 1. Chart of attributes before selecting values.
(a) Oxygen Supply System [2]
4
1
4
Prod.
Eng.
Perf.
Cont.
Lin. Non-L
(b) Can [3]
2
1
5
Prod.
Eng.
Perf.
Cont.
Lin. Non-L
Figure 2. Charts for two textbook design optimization models.
(a) Motor [23]
Prod.
Eng.8
Perf.1
Cont.
Lin. Non-L28
(b) Motor [17]
Prod.
Eng. Price9
Profit1
Cont.
Lin. Non-L44
Exp.
(c) Motor Family [8]
Fam.
Eng.62
Perf.20
Cont.
Lin. Non-L180
Figure 3. Charts for three motor design optimization models.
12

7. Assessing Design Optimization Model Research
The proposed attributes will be useful when assessing design optimization model research. Consider, for example, the key features of papers appearing in this journal: originality, significance, completeness, acknowledgement, organization, and clarity [24].
The attributes can help distinguish a new optimization model from others that have been proposed before, establishing its originality. On the other hand, the attributes can help identify similar optimization models, if any exist, so that the researcher must show how the proposed model is a better approach to that type of problem to establish its significance. Finally, the attributes provide guidelines that help the researcher describe the problem completely and with clarity. To be complete, the researcher should include sufficient detail about the optimization model and discuss these attributes.
Of course, the proposed attributes are not the only way to assess design optimization model research. Work on solution methods should discuss the tradeoff between computational effort and solution quality. Related to computational effort is the issue of populating or assembling the optimization model. Some models require a small number of parameters, while others need a large set of coefficients. Some models use response surfaces that must be generated from the experimental, simulation, or survey data [2]. While data collection and processing is related to the number and type of constraints, researchers should address the effort needed explicitly.
Finally, the validity of the research is extremely important. Validation determines that the model adequately represents the phenomenon of interest [25]. Unlike scientific domains such as physics, where mathematical models can be validated by comparing their predictions to the real world, validating optimization models in design is more difficult. In operations research, a domain that uses optimization models widely and faces the same kind of validation problem, Meredith [25] has addressed the question of validation. He argues that a researcher should create a model that helps a real-world decision-maker understand a problem and generates a solution that this person can implement. Otherwise, the researcher may formulate an optimization model that seems valid but is actually irrelevant to the decision-makers whom the real-world problem confronts.
In the domain of design, Frey and Dym [26] have suggested validation techniques based on analogies with medical research and development. Seepersad et al. [27] present an approach based on establishing the validity of a method’s constructs, usefulness, and performance. These papers discuss the issue in more detail and provide pointers to the extensive discussion of this topic.
8. Summary
This paper’s brief review of design optimization models highlights the incredible variety of models that have been studied. The DBD framework has inspired research into design optimization models that are different from traditional performance-optimizing approaches. The discussion has moved from developing better solution techniques to formulating more comprehensive problems. Consequently, the way that we think about design optimization models is changing. No longer is the structure of the model (whether it is linear or nonlinear) the only important characteristic. Instead, the extent to which the optimization model considers all of the important variables (including price) and addresses the bottom line (profit) has become
13

important. The proposed attributes respond to this changing environment by offering a way to evaluate design optimization models based on their content as well as their structure.
Outside the scope of this paper are issues related to manufacturing plans (which determine which facilities will produce which products) and marketing plans (which assign products to market segments). The relationship between these and product family optimization is discussed by de Weck [28]. If researchers begin extending design optimization models to include these aspects (or others), then we will need to extend the attributes proposed here to describe those.
Acknowledgements
The author acknowledges the work of Brad Brochtrup, who investigated the motor design problem in his M.S. thesis, and the valuable help and encouragement of Linda Schmidt and Joe Donndelinger.
References
[1] Papalambros, P.Y., and Wilde, D.J., 2000, Principles of Optimal Design, 2nd edition, Cambridge University Press, Cambridge.
[2] Ravindran, A., K.M. Ragsdell, and G.V. Reklaitis, Engineering Optimization: Methods and Applications, 2nd edition, John Wiley & Sons, Hoboken, New Jersey, 2006.
[3] Arora, Jasbir S., Introduction to Optimum Design, 2nd edition, Elsevier Academic Press, Amsterdam, 2004.
[4] Hazelrigg, G.A., 1998, “A framework for decision-based engineering design,” Journal of Mechanical Design, 120, pp. 653-658.
[5] Renaud, J.E., and X. Gu, 2006, “Decision-based collaborative optimization of multidisciplinary systems,” in Decision Making in Engineering Design, W. Chen, K. Lewis, and L.C. Schmidt, editors, ASME Press, New York.
[6] Brochtrup, Brad M., and Jeffrey W. Herrmann, 2006, “A classification framework for product design optimization,” Proceedings of IDETC/CIE 2006, ASME International Design Engineering Technical Conferences & Computers and Information in Engineering Conference, September 10-13, 2006, Philadelphia, Pennsylvania, DETC2006-99308.
[7] Scott, Michael J., Juan Carlos Garcıa Arenillas, Timothy W. Simpson, Somasundaram Valliyappan, and Venkat Allada, “Towards a suite of problems for comparison of product platform design methods: a proposed classification,” Proceedings of IDETC/CIE 2006, ASME 2006 International Design Engineering Technical Conferences & Computers and Information in Engineering Conference, September 10-13, 2006, Philadelphia, Pennsylvania.
[8] Simpson, T.W., 2006, “Methods for optimizing product platforms and product families,” in Simpson, T.W., Z. Siddique, and J. Jiao, eds., Product Platform and Product Family Design, Springer Science+Business Media, New York.
[9] Simpson, T.W., 2003. “Product Platform Design and Optimization: Status and Promise,” DETC03/DAC-48717, Proceedings of DETC ASME Design Engineering Technical Conference, Chicago, IL.
[10] Messac, A. and Chen, W., 2000. “The Engineering Design Discipline. Is its Confounding Lexicon Hindering its Evolution?” Journal of Engineering Evaluation and Cost Analsyis, Decision-based Design: Status and Promise, 3, pp. 67-83.
14

[11] Nagle, T. and Holden, R.K., 2002. The Strategy and Tactics of Pricing, 3rd edition, Prentice Hall, Upper Saddle River, New Jersey.
[12] Smith, P.G. and Reinertsen, D.G., 1991. Developing Products in Half the Time, Van Nostrand Reinhold, New York, NY, pp. 17-42.
[13] Chincholkar, M.M., J.W. Herrmann, and Yu-Feng Wei, 2003, “Applying design for production methods for improved product development,” DETC2003/DFM-48133, proceedings of the ASME 2003 International Design Engineering Technical Conferences and Computers and Information In Engineering Conference, Chicago, Illinois, September 2-6, 2003.
[14] Kroo, I., Altus, S., Braun, R.D., Gage, P., and Sobieski, I., 1994. “Multidisciplinary Optimization Methods for Aircraft Preliminary Design,” AIAA-94-4325-CP, Proceedings of the 5th AIAA/NASA/USAF/ISSMO Symposium on Multidisciplinary Analysis and Optimization, Panama City, FL, pp. 697-707, http://aero.stanford.edu/Reports/MDO94.html, accessed March 29, 2007.
[15] Sobieski, I. and Kroo, I., 1996. “Aircraft Design Using Collaborative Optimization,” AIAA-96-0715, AIAA Meeting Papers, Reno, NV.
[16] Kim, H.M., Rideout, D.G., Papalambros, P.Y., and Stein, J.L., 2003. “Analytical Target Cascading in Automotive Vehicle Design,” Transactions of ASME: Journal of Mechanical Design, 125(3), pp. 481-489.
[17] Wassenaar, H.J. and Chen, W., 2001. “An Approach to Decision-Based Design,” DETC01/DTM-21683, Proceedings of DETC ASME Design Engineering Technical Conference, Pittsburgh, PA.
[18] Azarm, S. and Narayanan, S., 2000. “A Multi-objective Interactive Sequential Hybrid Optimization Technique for Design Decision Making,” Engineering Optimization, 32, pp. 485-500.
[19] Gupta, S.K. and Samuel, A.K., 2001. “Integrating Market Research with the Product Development Process: A Step Towards Design for Profit,” DETC01/DFM-21202, Proceedings of DETC ASME Design Engineering Technical Conference, Pittsburgh, PA.
[20] Li, H. and Azarm, S., 2000. “Product Design Selection Under Uncertainty and with Competitive Advantage,” Journal of Mechanical Design, 122 (4), pp. 411-418.
[21] Sues, R.H., Shin, Y., and Wu, Y.T., 2005. “Applications of Reliability-Based Design Optimization,” Engineering Design Reliability Handbook, CRC Press, Boca Raton, Florida.
[22] Hernandez, Gabriel, Timothy W. Simpson, Janet K. Allen, Eduardo Bascaran, Luis F. Avila and Fabian Salinas, 1998. “Robust Design of Product Families for Make-to-Order Systems,” Proceedings of DETC98, 1998 ASME Design Engineering Technical Conference, September 13-16, 1998, Atlanta, Georgia.
[23] Brochtrup, B.M., 2006, “Classifying and Comparing Design Optimization Problems,” M.S. Thesis, University of Maryland, College Park.
[24] “Definitions of Paper Features,” http://journaltool.asme.org/Help/AdminHelp/WebHelp/Administrators/Reviewers/Paper_Feature_Definitions.htm, accessed April 2, 2007.
[25] Meredith, Jack R., “Reconsidering the philosophical basis of OR/MS,” Operations Research, Volume 49, Number 3, pages 325-333, 2001.
[26] Frey, D.D., and C.L. Dym, 2006, “Validation of design methods: lessons from medicine,” Research in Engineering Design, 17:45-57.
15

[27] Seepersad, C.C., K. Pedersen, J. Emblemsvag, R. Bailey, J.K. Allen, and F. Mistree, “The validation square: how does one verify and validate a design method?” in Decision Making in Engineering Design, W. Chen, K. Lewis, and L.C. Schmidt, editors, ASME Press, New York.
[28] de Weck, Olivier L., “Determining product platform extent,” in Simpson, T.W., Z. Siddique, and J. Jiao, eds., Product Platform and Product Family Design, Springer Science+Business Media, New York, 2006.
Appendix: Automobile Chassis Design Optimization Problem
This design optimization model follows the notation of Kim et al. [16], who provide a
decomposition technique for solving it. There are twelve design variables: a, the center of
gravity distance to front; b, the center of gravity distance to rear; sfZ and srZ , the front and rear
suspension travel; and , the front and rear tire inflation pressure; ifP irP fd and , the front and
rear wire diameter;
rd
fD and , the front and rear coil diameter; and rD fp and rp , the front and
rear pitch. The objective is to minimize the total deviation from target values for five chassis
performance measures.
Minimize U U U U U
sf sf sr sr tf tf tr tr us usk kω ω ω ω ω ω ω ω− + − + − + − + − :
/
/
/
/
sf sf sf
sr sr
tf tf usf
tr tr usr
K M
K M
K M
K M
ω
ω
ω
ω
=
=
=
=
sr
usf r
Mb MakLC LCα α
= −
( )( )
0
0
AutoSim , , ,
AutoSim , , ,sf sf Lf B
sr sr Lr Br r
K Z K K
K Z K K
=
=
f fL
L
16

( )( )( )( )
( )
( )
6 2 3 2
6 2 3 2
0.9 0.1839 9.2605 110119
0.9 0.1839 9.2605 110119
1802.668 10 1.605 10 3.86 10
1802.668 10 1.605 10 3.86 10
9.81
tf if m
tr ir m
f m if if
r m ir ir
m
K P F
K P F
C F P P
C F P P
MbFa b
α
α
π
π
− −
− − −
= − +
= − +
= − × + × − ×
= − × + × − ×
=+
−
( )
( )
4
03
4
3 2
3
38
16 2
8 4
8
4 / 2 2 / 14 / 3 2 /
fLf
f ff
f
fBf
f
f f
f sua m
f f s
su se f
ff
f f f fa su m se
f f f f
GdK
L dD
p
EgdK
D G E
p d
D SF Fd d n
S S dD
nD d D d
F S F SD d D d
π π
π
=⎛ ⎞−⎜ ⎟⎜ ⎟⎝ ⎠
=+
≤
⎛ ⎞+ × + ≤⎜ ⎟⎜ ⎟
⎝ ⎠⎛ ⎞⎜ ⎟⎜ ⎟⎝ ⎠≤
⎛ ⎞ ⎛ ⎞+ ++⎜ ⎟ ⎜ ⎟⎜ ⎟ ⎜ ⎟−⎝ ⎠ ⎝ ⎠
( )
( )
4
3 0
4
3 2
3
38
16 2
8 4
84 / 2 2 / 14 / 3 2 /
rLr
r rr
r
rBr
r
r r
sura m
r r s
su se r
rr
r r r ra su m se
r r r r
GdKL dD
p
EgdKD G E
p d
SDF Fd d n
S S dD
nD d D dF S F SD d D d
π π
π
=⎛ ⎞−⎜ ⎟⎝ ⎠
=+
≤
⎛ ⎞+ × + ≤⎜ ⎟
⎝ ⎠⎛ ⎞⎜ ⎟⎝ ⎠≤
⎛ ⎞ ⎛ ⎞+ ++⎜ ⎟ ⎜ ⎟−⎝ ⎠ ⎝ ⎠
17

min max
min max
min max
min max
if if if
ir ir ir
a a ab b b
P P P
P P P
≤ ≤≤ ≤
≤ ≤
≤ ≤
min max
min max
min max
min max
f f f
r r r
f f f
r r r
D D D
D D D
d d d
d d d
≤ ≤
≤ ≤
≤ ≤
≤ ≤
min max
min max
min max0 0 0
min max
Lf Lf Lf
Bf Bf Bf
f f f
sf sf sf
K K K
K K K
L L L
Z Z Z
≤ ≤
≤ ≤
≤ ≤
≤ ≤
min max
min max
min max0 0 0min max
Lr Lr Lr
Br Br Br
r r r
sr sr sr
K K K
K K K
L L L
Z Z Z
≤ ≤
≤ ≤
≤ ≤
≤ ≤
18