Embed Size (px)
Citation preview

No 2 / 2004
ISSN 0379-0991
EUROPEANECONOMY
EUROPEAN COMMISSIONDIRECTORATE-GENERAL FOR ECONOMIC
AND FINANCIAL AFFAIRS
Economic forecastsSpring 2004
EURO
PEAN
ECON
OM
YN
o 2
/ 2004
Price (excluding VAT) in Luxembourg: EUR 50
European Economy (6 issues minimum per year): EUR 150
The annual subscription runs from 1 January to 31 December of each year.
Payments to be made only to the agents in the countries listed on page 3 of the cover of European Economy.
These are surface mail rates; for air subscription rates please apply to the sales offices.
http://europa.eu.int/comm/economy_finance
10K
C-A
R-04-002-E
N-C
,!7IJ2I9-eejfhb! ISBN 92-894-4957-8
CL_CoverEN_404049 26/04/04 14:14 Page 1

European Economy appears six times a year. It contains important reportsand communications from the Commission to the Council and theParliament on the economic situation and developments ranging from theBroad economic policy guidelines and its implementation report to theEconomic forecasts, the EU Economic review and the Public financereport. As a complement, Special reports focus on problems concerningeconomic policy.
Subscription terms are shown on the back cover and the address of thesales offices are shown on the inside back cover.
Unless otherwise indicated the texts are published under the responsibilityof the Directorate-General for Economic and Financial Affairs of theEuropean Commission, BU1, B-1049 Brussels, to which enquiries otherthan those related to sales and subscriptions should be addressed.
BELGIQUE/BELGIË
Jean De LannoyAvenue du Roi 202/Koningslaan 202B-1190 Bruxelles/BrusselTél. (32-2) 538 43 08Fax (32-2) 538 08 41E-mail: [email protected]: http://www.jean-de-lannoy.be
La librairie européenne/De Europese BoekhandelRue de la Loi 244/Wetstraat 244B-1040 Bruxelles/BrusselTél. (32-2) 295 26 39Fax (32-2) 735 08 60E-mail: [email protected]: http://www.libeurop.be
Moniteur belge/Belgisch StaatsbladRue de Louvain 40-42/Leuvenseweg 40-42B-1000 Bruxelles/BrusselTél. (32-2) 552 22 11Fax (32-2) 511 01 84E-mail: [email protected]
DANMARK
J. H. Schultz Information A/SHerstedvang 4DK-2620 AlbertslundTlf. (45) 43 63 23 00Fax (45) 43 63 19 69E-mail: [email protected]: http://www.schultz.dk
DEUTSCHLAND
Bundesanzeiger Verlag GmbHVertriebsabteilungAmsterdamer Straße 192D-50735 KölnTel. (49-221) 97 66 80Fax (49-221) 97 66 82 78E-Mail: [email protected]: http://www.bundesanzeiger.de
ELLADA/GREECE
G. C. Eleftheroudakis SAInternational BookstorePanepistimiou 17GR-10564 AthinaTel. (30) 21 03 25 84 40Fax (30) 21 03 25 84 99E-mail: [email protected]: www.books.gr
ESPAÑA
Boletín Oficial del EstadoTrafalgar, 27E-28071 MadridTel. (34) 915 38 21 11 (libros), 913 84 17 15(suscripción)Fax (34) 915 38 21 21 (libros), 913 84 17 14(suscripción)E-mail: [email protected]: http://www.boe.es
Mundi Prensa Libros, SACastelló, 37E-28001 MadridTel. (34) 914 36 37 00Fax (34) 915 75 39 98E-mail: [email protected]: http://www.mundiprensa.com
FRANCE
Journal officielService des publications des CE26, rue DesaixF-75727 Paris Cedex 15Tél. (33) 140 58 77 31Fax (33) 140 58 77 00E-mail: [email protected]: http://www.journal-officiel.gouv.fr
IRELAND
Alan Hanna’s Bookshop270 Lower Rathmines RoadDublin 6Tel. (353-1) 496 73 98Fax (353-1) 496 02 28E-mail: [email protected]
ITALIA
Licosa SpAVia Duca di Calabria, 1/1Casella postale 552I-50125 FirenzeTel. (39) 05 56 48 31Fax (39) 055 64 12 57E-mail: [email protected]: http://www.licosa.com
LUXEMBOURG
Messageries du livre SARL5, rue RaiffeisenL-2411 LuxembourgTél. (352) 40 10 20Fax (352) 49 06 61E-mail: [email protected]: http://www.mdl.lu
NEDERLAND
SDU Servicecentrum UitgeversChristoffel Plantijnstraat 2Postbus 200142500 EA Den HaagTel. (31-70) 378 98 80Fax (31-70) 378 97 83E-mail: [email protected]: http://www.sdu.nl
PORTUGAL
Distribuidora de Livros Bertrand Ld.a
Grupo Bertrand, SARua das Terras dos Vales, 4-AApartado 60037P-2700 AmadoraTel. (351) 214 95 87 87Fax (351) 214 96 02 55E-mail: [email protected]
Imprensa Nacional-Casa da Moeda, SASector de Publicações OficiaisRua da Escola Politécnica, 135P-1250 -100 Lisboa CodexTel. (351) 213 94 57 00Fax (351) 213 94 57 50E-mail: [email protected]: http://www.incm.pt
SUOMI/FINLAND
Akateeminen Kirjakauppa/Akademiska BokhandelnKeskuskatu 1/Centralgatan 1PL/PB 128FIN-00101 Helsinki/HelsingforsP./tfn (358-9) 121 44 18F./fax (358-9) 121 44 35Sähköposti: [email protected]: http://www.akateeminen.com
SVERIGE
BTJ ABTraktorvägen 11-13S-221 82 LundTfn (46-46) 18 00 00Fax (46-46) 30 79 47E-post: [email protected]: http://www.btj.se
UNITED KINGDOM
The Stationery Office LtdCustomer ServicesPO Box 29Norwich NR3 1GNTel. (44-870) 60 05-522Fax (44-870) 60 05-533E-mail: [email protected]: http://www.tso.co.uk
ÍSLAND
Bokabud Larusar BlöndalEngjateigi 17-19IS-105 ReykjavikTel. (354) 552 55 40Fax (354) 552 55 60E-mail: [email protected]
NORGE
Swets Blackwell ASHans Nielsen Hauges gt. 39Boks 4901 NydalenN-0423 OsloTel. (47) 23 40 00 00Fax (47) 23 40 00 01E-mail: [email protected]
SCHWEIZ/SUISSE/SVIZZERA
Euro Info Center Schweizc/o OSEC Business Network SwitzerlandStampfenbachstraße 85PF 492CH-8035 ZürichTel. (41-1) 365 53 15Fax (41-1) 365 54 11E-mail: [email protected]: http://www.osec.ch/eics
B@LGARIJA
Europress Euromedia Ltd59, blvd VitoshaBG-1000 SofiaTel. (359-2) 980 37 66Fax (359-2) 980 42 30E-mail: [email protected]: http://www.europress.bg
CYPRUS
Cyprus Chamber of Commerceand IndustryPO Box 21455CY-1509 NicosiaTel. (357-22) 88 97 52Fax (357-22) 66 10 44E-mail: [email protected]
EESTI
Eesti Kaubandus-Tööstuskoda(Estonian Chamber of Commerce and Industry)Toom-Kooli 17EE-10130 TallinnTel. (372) 646 02 44Fax (372) 646 02 45E-mail: [email protected]: http://www.koda.ee
HRVATSKA
Mediatrade LtdStrohalov Prilaz 27HR-10000 ZagrebTel. (385-1) 660 08 40Fax (385-1) 660 21 65E-mail: [email protected]
MAGYARORSZÁG
Euro Info ServiceSzt. István krt.12IIl emelet 1/APO Box 1039H-1137 BudapestTel. (36-1) 329 21 70Fax (36-1) 349 20 53E-mail: [email protected]: http://www.euroinfo.hu
MALTA
Miller Distributors LtdMalta International AirportPO Box 25Luqa LQA 05Tel. (356) 21 66 44 88Fax (356) 21 67 67 99E-mail: [email protected]
POLSKA
Ars PolonaKrakowskie Przedmiescie 7Skr. pocztowa 1001PL-00-950 WarszawaTel. (48-22) 826 12 01Fax (48-22) 826 62 40E-mail: [email protected]
ROMÂNIA
EuromediaStr.Dionisie Lupu nr. 65, sector 1RO-70184 BucurestiTel. (40-21) 260 28 82Fax (40-21) 260 27 88E-mail: [email protected]
SLOVAKIA
Centrum VTI SRNámestie Slobody 19SK-81223 Bratislava 1Tel. (421-2) 54 41 83 64Fax (421-2) 54 41 83 64E-mail: [email protected]: http://www.cvtisr.sk
SLOVENIJA
GV Zalozba d.o.o.Dunajska cesta 5SI-1000 LjubljanaTel. (386) 13 09 1800Fax (386) 13 09 1805E-mail: [email protected]: http://www.gvzalozba.si
TÜRKIYE
Dünya Aktüel A.SGlobus Dünya Basinevi100, Yil Mahallessi 34440TR-80050 Bagcilar-IstanbulTel. (90-212) 440 22 27Fax (90-212) 440 23 67E-mail: [email protected]
ARGENTINA
World Publications SAAv. Córdoba 1877C1120 AAA Buenos AiresTel. (54-11) 48 15 81 56Fax (54-11) 48 15 81 56E-mail: [email protected]: http://www.wpbooks.com.ar
AUSTRALIA
Hunter PublicationsPO Box 404Abbotsford, Victoria 3067Tel. (61-3) 94 17 53 61Fax (61-3) 94 19 71 54E-mail: [email protected]
BRASIL
Livraria CamõesRua Bittencourt da Silva, 12 CCEP20043-900 Rio de JaneiroTel. (55-21) 262 47 76Fax (55-21) 262 47 76E-mail: [email protected]: http://www.incm.com.br
CANADA
Les éditions La Liberté Inc.
3020, chemin Sainte-FoySainte-Foy, Québec G1X 3V6Tél. (1-418) 658 37 63Fax (1-800) 567 54 49E-mail: [email protected]
Renouf Publishing Co. Ltd
5369 Chemin Canotek Road Unit 1Ottawa, Ontario K1J 9J3Tel. (1-613) 745 26 65Fax (1-613) 745 76 60E-mail: [email protected]: http://www.renoufbooks.com
EGYPT
The Middle East Observer
41 Sherif Street11111 CairoTel. (20-2) 392 69 19Fax (20-2) 393 97 32E-mail: [email protected]: http://www.meobserver.com.eg
MALAYSIA
EBIC Malaysia
Suite 47.01, Level 47Bangunan AmFinance (letter box 47)8 Jalan Yap Kwan Seng50450 Kuala LumpurTel. (60-3) 21 62 62 98Fax (60-3) 21 62 61 98E-mail: [email protected]
MÉXICO
Mundi Prensa México, SA de CV
Río Pánuco, 141Colonia CuauhtémocMX-06500 México, DFTel. (52-5) 533 56 58Fax (52-5) 514 67 99E-mail: [email protected]
SOUTH KOREA
The European Union Chamber ofCommerce in Korea
Suite 2004, Kyobo Bldg.1 Chongro 1-Ga, Chongro-GuSeoul 110-714Tel. (82-2) 725-9880/5Fax (82-2) 725-9886E-mail: [email protected]: http://www.eucck.org
SRI LANKA
EBIC Sri Lanka
Trans Asia Hotel115 Sir ChittampalamA. Gardiner MawathaColombo 2Tel. (94-1) 074 71 50 78Fax (94-1) 44 87 79E-mail: [email protected]
T’AI-WAN
Tycoon Information Inc
PO Box 81-466105 TaipeiTel. (886-2) 87 12 88 86Fax (886-2) 87 12 47 47E-mail: [email protected]
UNITED STATES OF AMERICA
Bernan Associates
4611-F Assembly DriveLanham MD 20706-4391Tel. (1-800) 274 44 47 (toll free telephone)Fax (1-800) 865 34 50 (toll free fax)E-mail: [email protected]: http://www.bernan.com
ANDERE LÄNDER/OTHER COUNTRIES/AUTRES PAYS
Bitte wenden Sie sich an ein Büro IhrerWahl/Please contact the sales office ofyour choice/Veuillez vous adresser aubureau de vente de votre choix
Office for Official Publicationsof the European Communities2, rue MercierL-2985 LuxembourgTel. (352) 29 29-42001Fax (352) 29 29-42700E-mail: [email protected]: http://publications.eu.int
7/2003
Venta • Salg • Verkauf • Pvlèseiw • Sales • Vente • Vendita • Verkoop • Venda • Myynti • Försäljninghttp://eur-op.eu.int/general/en/s-ad.htm
CL_CoverEN_404049 26/04/04 14:14 Page 2

European Commission
EUROPEANECONOMY
Directorate-General for Economic and Financial Affairs
2004 Number 2

© European Communities, 2004
Printed in Belgium

Economic forecastsSpring 2004

Abbreviations and symbols used
Member States
BE BelgiumDK DenmarkDE GermanyEL GreeceES SpainFR FranceIE IrelandIT ItalyLU LuxembourgNL The NetherlandsAT AustriaPT PortugalFI FinlandSE SwedenUK United Kingdom
EU European Union EU-15 European Union, 15 Member States Euro area Member States currently participating in monetary union
Acceding countries
CY CyprusCZ Czech RepublicEE EstoniaHU HungaryLV LatviaLT LithuaniaMT MaltaPL PolandSK SlovakiaSO Slovenia
AC-10 The 10 acceding countries in May 2004 (CY, CZ, EE, HU, LV, LT, MT, PL, SK, SO)
Other candidate countries
BG BulgariaRO RomaniaTR Turkey
iv

Currencies
ECU European currency unitEUR euroATS Austrian schillingBEF Belgian francDEM German markDKK Danish crown (krone)ESP Spanish pesetaFIM Finnish markkaFRF French francGBP pound sterlingGRD Greek drachmaIEP Irish pound (punt)ITL Italian liraLUF Luxembourg francNLG Dutch guilderPTE Portuguese escudoSEK Swedish crown (krona)CAD Canadian dollarCHF Swiss francJPY Japanese yenRUB Russian roubleUSD United States dollarCYP Cyprus poundCZK Czech korunaEEK Estonian kroonHUF Hungarian forintLTL Lithuanian litasLVL Latvian latsMTL Maltese liraPLN Polish zlotySIT Slovenian tolarSKK Slovak korunaBGN (new) Bulgarian levROL Romanian leuTRL Turkish lira
v

Other abbreviations
bn, billion 1 000 millionCPI consumer price indexEC European CommissionECB European Central BankECSC European Coal and Steel CommunityEDF European Development FundEIB European Investment BankEMCF European Monetary Cooperation FundEMS European monetary systemEMU economic and monetary unionERM exchange rate mechanismEuratom European Atomic Energy CommunityEurostat Statistical Office of the European CommunitiesFDI foreign direct investmentGDP (GNP) gross domestic (national) productGFCF gross fixed capital formationHICP harmonised index of consumer pricesILO International Labour OrganisationIMF International Monetary FundLDCs less developed countriesMio millionMrd 1 000 millionNCI New Community InstrumentOCTs overseas countries and territoriesOECD Organisation for Economic Cooperation and DevelopmentOPEC Organisation of Petroleum Exporting CountriesPEP pre-accession economic programmesPPS purchasing power standardSCP stability and convergence programmesqoq quarter-on-quarter percentage changeSMEs small and medium-sized enterprisesVAT value added taxyoy year-on-year percentage change: not available– none
vi

Contents
Overview 1
Chapter 1: The world economy 91. Global growth strengthens 11 2. The outlook outside the EU 14
Chapter 2: The economies of the euro area and the EU 17 1. Global growth has supported economic activity 19 2. Capital formation should lead growth activity 24
2.1 Households: income developments come to the rescue 24 2.2 Firms: positive investment outlook 26 2.3 The balance of risks 29 3. Positive signs in the labour market 30 3.1 Recent developments 30
3.2 Employment growth picking up 30 3.3 Downside risks from excessive labour market resilience? 32 4. Inflation falls below 2% 33 4.1 Recent developments 33 4.2 Better prospects ahead 34
5. Diverse fiscal developments 37 5.1 No improvement in general government positions 37 5.2 Countries with high deficits 38
Chapter 3: Member States 39 1. Belgium: Moderate recovery ahead 40 2. Denmark: Steady recovery after zero growth 42 3. Germany: The economy has started to grow again 44 4. Greece: Despite strong growth, progress in fiscal consolidation is postponed 46
5. Spain: Growth gains momentum in 2004 48 6. France: The recovery is under way 50 7. Ireland: A broad-based recovery is under way 52
vii

8. Italy: Moderate recovery taking shape in 2004 54 9. Luxembourg: Turning the corner 56 10. Netherlands: Weathering the storm 58 11. Austria: Economy slowly picking up 60 12. Portugal: Export-led recovery from recession 62 13. Finland: Growth picking up on a broader base 64 14. Sweden: Steady recovery after a mild trough 66 15. United Kingdom: Above-trend growth, as investment and net exports revive 68
Chapter 4: Acceding countries 71 1. Cyprus: Continued moderate growth and fiscal slippage in 2003, renewed fiscal
consolidation efforts to start in 2004 74 2. Czech Republic: Worrying dynamics of public debt 76 3. Estonia: External account deficit set to narrow, with growth becoming more
export-driven 78 4. Hungary: Strengthening of economic growth, challenges ahead for fiscal consolidation 80 5. Latvia: Continued robust growth, widening current account deficit 82 6. Lithuania: A broad-based economic expansion 84 7. Malta: Fiscal challenges lie ahead 86 8. Poland: A broad-based recovery underpinned by an expansionary fiscal policy in 2004 88 9. Slovakia: Robust growth continues 90 10. Slovenia: Inflation continues to be on a declining trend 92
Chapter 5: Other candidate countries 95 1. Bulgaria: Rebalancing domestic and external demand 96 2. Romania: Sustained growth and pro-cyclical fiscal stance cause weak current account 98 3. Turkey: Realising its potential? 100
Chapter 6: Other non EU-countries 103 1. USA: High growth rates, but concerns about sustainability 104 2. Japan: Export-driven recovery starting to broaden 106
Statistical annex 109
Tables0.1 Main features of the Spring 2004 forecast - euro area 3 0.2 Main features of the Spring 2004 forecast - acceding countries 7 1.1 International environment 14 2.1 Composition of growth in 2003 - euro area 19
2.2 Sectoral breakdown of growth in 2003 - euro area 22 2.3 Composition of growth - euro area 24
viii

2.4 Balance sheet indicators for euro-area households and non-profit institutions serving households 25
2.5 Determinants of private consumption expenditure - euro area 25 2.6 Balance sheet indicators for euro area non-financial corporations 26 2.7 US affiliates of EU companies 29 2.8 Sectoral employment growth in the euro area 30 2.9 Labour market outlook - euro area 31 2.10 Inflation outlook - euro area 33 2.11 General government budgetary position – euro area 38 3.1 Main features of country forecast - Belgium 41 3.2 Main features of country forecast - Denmark 43 3.3 Main features of country forecast - Germany 45 3.4 Main features of country forecast - Greece 473.5 Main features of country forecast - Spain 49 3.6 Main features of country forecast - France 51 3.7 Main features of country forecast - Ireland 53 3.8 Main features of country forecast - Italy 55 3.9 Main features of country forecast - Luxembourg 57 3.10 Main features of country forecast - the Netherlands 59 3.11 Main features of country forecast - Austria 61 3.12 Main features of country forecast - Portugal 63
3.13 Main features of country forecast - Finland 65 3.14 Main features of country forecast - Sweden 67 3.15 Main features of country forecast - United Kingdom 69 4.0 Main features of country forecast – Acceding countries 73 4.1 Main features of country forecast - Cyprus 75 4.2 Main features of country forecast - Czech Republic 77 4.3 Main features of country forecast - Estonia 79 4.4 Main features of country forecast - Hungary 81 4.5 Main features of country forecast - Latvia 83 4.6 Main features of country forecast - Lithuania 85 4.7 Main features of country forecast - Malta 87 4.8 Main features of country forecast - Poland 89 4.9 Main features of country forecast - Slovakia 91 4.10 Main features of country forecast - Slovenia 93 5.1 Main features of country forecast - Bulgaria 97 5.2 Main features of country forecast - Romania 99 5.3 Main features of country forecast - Turkey 101 6.1 Main features of country forecast - USA 107 6.2 Main features of country forecast - Japan 107
Box2.1 Some specificities behind the forecasts 23
Graphs
1.1 Growth of world imports 11 1.2 Regional composition of world imports growth 11
1.3 Commodity prices 12 1.4 Oil price 121.5 Short-term interest rates 12
1.6 Major stock market indices 13
ix

1.7 Current account imbalances 13 2.1 Euro-area goods: export market shares 19 2.2 Euro-area investment and orders 20 2.3 Capacity utilisation 20
2.4 Household consumption and real disposable income in the euro area 21 2.5 Euro-area household debt ratio and real interest rates on household loans 21 2.6 Change in inventories in the euro area across cycles 21
2.7 Euro-area bank loans 25 2.8 Consumer survey results 26 2.9 Corporate bond spreads - euro area 27 2.10 Capacity utilisation rates in the euro area 27 2.11 Corporate mark-ups in the euro area 28 2.12 Exports of the euro area vs. world imports 28 2.13 Employment growth and unemployment rate in the euro area 31 2.14 GDP and labour productivity growth in the euro area 32 2.15 HICP and core inflation in the euro area 34 2.16 GDP, import and export deflators in the euro area 34 2.17 HICP inflation and compensation per head in the euro area 35 2.18 HICP inflation and inflation expectations in the euro area 35 2.19 Inflation differentials in the euro area 36 2.20 Euro-area fiscal stance and cyclical conditions 37 3.1 Belgium – General government budget balance 40 3.2 Denmark – GDP growth and private consumption growth 42 3.3 Germany – GDP, exports and expectations 44 3.4 Greece – Net lending & consolidated gross debt 46 3.5. Spain – Contributions to GDP growth 48
3.6 France – GDP and investment 50 3.7 Ireland – GDP growth compared to euro area and contributions to change 52
3.8 Italy – Private consumption and gross disposable income 54 3.9 Luxembourg – Employment and unemployment 56 3.10 The Netherlands – Unemployment rate 58 3.11 Austria – General government deficit/surplus 60
3.12 Portugal – Growth, demand and foreign balance 62 3.13 Finland – Contributions to GDP growth 64
3.14 Sweden – GDP growth 66 3.15 United Kingdom - GDP growth 68 4.0 Acceding countries – growth and GDP per capita 72 4.1 Cyprus – General government finances 74 4.2 Czech Republic – General government 76 4.3 Estonia – GDP growth and inflation 78 4.4 Hungary – GDP growth and inflation 80 4.5 Latvia – GDP growth and its contributors 82 4.6 Lithuania – GDP growth and its contributors 84 4.7 Malta – General government finances 86 4.8 Poland – General government finances 88 4.9 Slovakia – GDP growth and its contributors 90 4.10 Slovenia – Inflation trends 92
5.1 Bulgaria – GDP growth and contributions 96 5.2 Romania – Government balance and current account 98 5.3 Turkey – labour market 100 6.1 USA – Gross saving of households as a percentage of gross disposable income 104 6.2 Japan – Real GDP growth rates 106
x

Overview
Moderate recovery under way in Europe
After bottoming out in the first half of 2003, the economies of the euro area and EU turned around in the second half of the year. The average growth rate for the year as a whole is estimated to have been 0.4% in the euro area and 0.8% in the EU. In view of the buoyancy of global growth and trade, and the returning confidence of domestic producers and consumers, the recovery is set to gather momentum this year. A rebound to average growth rates of 1.7% for the euro area and 2% for the EU is projected for 2004, levelling off at around 2.4% in 2005.
Apart from the external stimulus from global demand, the main factors behind the outlook for the recovery include accommodative macroeconomic policy conditions, continued disinflation, supportive financial conditions, and progress in structural reforms.
The recovery is underpinned by a rise in investment expenditure, supported by a more gradual pick-up in private consumption. Despite this projected increase in the momentum of economic activity, the protracted downturn should continue to weigh on the performance of the labour market. Employment growth is expected to register 0.3% in 2004 and a somewhat better 0.9% in 2005.
Buoyant world economy boosts global trade
After the weak growth in world trade in 2002, a strong rebound of about 5% is estimated to have taken place in 2003. The near-term outlook is for a further acceleration to around 8% in 2004-2005.
World GDP growth is estimated to have been stronger-than-expected at 3.7% in 2003. This year, world economic activity should expand at a robust 4.5%, before levelling off in 2005. This acceleration is supported by a number of factors, including accommodative macroeconomic policies, supportivefinancial conditions and a return of confidence.
The regional distribution of world growth widened in 2003, with stronger than expected contributions coming from the US, the CIS, OPEC, Asia (especially China) and the acceding countries. In the US, helped by monetary and fiscal policy stimulus and solid underlying productivity growth, the recovery is expected to continue with growth at 4.2% in 2004. Nonetheless, in view of the high general government and current account deficits, this pace of economic expansion is viewed as unsustainable, and the growth rate is expected to decline to 3.2% in 2005.
Prospects for Japan have improved markedly with a sharp upward adjustment of growth from an estimated 2.7% in 2003 to 3.4% this year. Deflation
1

Economic Forecasts, Spring 2004
appears to be coming to an end, but the general government deficit is expected to remain above 7% of GDP in 2004 and 2005. The economic outlook for Asia (excluding Japan) remains buoyant with growth in the vicinity of 7% in 2004-2005. During this period, Hong Kong and Korea are expected to take up the slack created by a slight attenuation of the striking growth rates of China and India. Among the other emerging regions, Latin America is expected to double its growth rate in 2004 after a lacklustre performance in 2003. Economic activity is also expected to pick up speed in Africa. In the countries preparing for accession on 1 May 2004 and the other candidate countries, continued strong growth is expected throughout the forecast period, supported by domestic demand and structural change.
Rising commodity prices and recovering stock markets
The global recovery has put upward pressure on both fuel and non-fuel commodity prices. While the appreciation of the euro has shielded the euro area from many of the adverse effects of this trend, its implications for the world economy are less encouraging.
The assumed profile for oil prices has been revised upwards compared to the Autumn forecasts. From an average of USD 28.5 per barrel (Brent crude) in 2003, the price of oil is assumed to decline gradually from a high of USD 31.5 per barrel in the first and second quarters of this year, yielding an average of USD 31.1 per barrel for the year as a whole. Some easing is foreseen during the course of 2005, producing an average of USD 28.9 per barrel.
After stabilising in the middle of last year, equity prices continued their upward trend into the new year, before levelling off somewhat recently. Long-term government bond yields have remained low by historical standards, despite improving global growth prospects. Corporate bond spreads have also narrowed to historically low levels. Overall, these developments, which suggest that financing conditions in the global economy have improved compared to one year ago, should be supportive of the recovery.
Growth re-emerged in the euro area and EU economies in the second half of 2003 …
After stagnating during the first half of 2003, the economies of both the euro area and the EU as a whole experienced a turnaround in the third quarter of the year.
For the euro area, the rebound was driven by a surge in the growth of exports, while the growth-contribution of domestic demand was negative. The latter was due in particular to the negative performance of investment in the third quarter. Domestic demand took over from trade as the engine of growth in the last quarter of the year. Investment picked up considerably, breaking a prolonged downward trend. However, lacklustre private consumption provided no impulse to growth and the contribution of net exports turned negative due to a sharp rise in the growth of imports.
The recovery, which took place in the second half of 2003, was broadly in line with predictions in the Autumn forecast. However, the source of the turnaround was somewhat surprising as the stronger-than-expected growth in the third quarter was driven by external rather than internal demand. The outcome for the last quarter was closer to expectations both in terms of the magnitude and the composition of growth.
2

Overview
…and will gain momentum in 2004
Survey indicators have been sending out encouraging signals for the prospects of a recovery since the middle of last year. While the euro-area economic sentiment indicator has improved since summer 2003, capacity utilisation in manufacturing is still below its long-term average. Business sentiment in the manufacturing sector has hesitated somewhat recently, but the improvement in production expectations has been maintained.
In the services sector, confidence is still at a low ebb but demand expectations are advancing. The gradual rise in consumer confidence is based mainly on a better outlook for the economy and for the labour market. This should lead to greater optimism on the part of households regarding their own financial situation, which should in turn provide an impulse to consumer spending.
The projected recovery in business and household spending in the coming months stems in part from the particularly low real interest rates, both short-term and long-term. This has contributed to an easing of the balance-sheet constraints of households and businesses through a reduction in debt servicing costs. The rebound in stock markets since March of last year and the buoyant housing markets in some Member States have also helped to partially restore wealth lost following the bursting of the stock market bubble. Households’ real disposable income has been sustained by the resilience of employment and real wage growth. The projected decline in inflation should also provide a positive stimulus to consumption.
The average growth rate in the euro area is projected to rise to 1.7% in 2004 and 2.3% in 2005 (2.0% and 2.4% in the EU, respectively), barely unchanged from last autumn’s forecast. Growth is expected to be supported by domestic demand, which in turn will be sustained by an acceleration of capital formation during the course of 2004, followed by a more gradual recovery of private consumption expenditure.
Table 0.1
Main features of the Spring 2004 forecast ¹ - euro area (Real annual percentage change Spring 2004 Difference with unless otherwise stated) Autumn 2003 (a)
2000 2001 2002 2003 2004 2005 2004 2005 GDP growth 3.5 1.6 0.9 0.4 1.7 2.3 -0.1 0.0 Investment in equipment 8.0 -1.1 -4.9 -2.3 3.4 6.0 0.3 1.5 Employment 2.2 1.4 0.6 0.0 0.3 0.9 0.0 0.1 Unemployment rate (b) 8.5 8.0 8.4 8.8 8.8 8.6 -0.3 -0.3 Inflation (c) 2.1 2.4 2.3 2.1 1.8 1.6 -0.2 -0.1 Government balance (% GDP) (d) 0.1 -1.6 -2.3 -2.7 -2.7 -2.6 0.0 0.1 Government debt (% GDP) 70.4 69.4 69.2 70.4 70.9 70.9 0.2 0.2 Current account balance (% GDP) -0.2 0.5 1.3 0.5 0.7 0.6 -0.5 -0.7 p.m. GDP growth EU-15 3.6 1.7 1.1 0.8 2.0 2.4 0.0 0.0
¹ The Commission services' Spring 2004 Forecasts are based on available data up to March 29, 2004. (a) A "+" ("-") sign means a higher (lower) positive figure or a lower (higher) negative one compared to Autumn 2003. (b) Percentage of the labour force. (c) Harmonised index of consumer prices, nominal change. (d) Including proceeds relative to UMTS licences.
3

Economic Forecasts, Spring 2004
Encouraging labour market performance and outlook
Despite the prolonged downturn, the rise in the unemployment rate has been quite moderate in comparison to previous cycles. The euro area unemployment rate stabilised at 8.8% in the second quarter of 2003, after increasing by 0.8 of a percentage point during the slowdown in the current cycle. This contrasts with a rise of over 2 percentage points to above 10% in the trough of the early nineties. On the employment side, the picture is also more encouraging insofar as job losses are concerned. No jobs were lost in net terms in the recent downturn, while more than 2.5 million jobs disappeared in the 1992-93 recession.
In line with the gradual nature of the recovery and the usual lagged response of the labour market, about half a million jobs are expected to be created this year. However, this figure should more than double in 2005 as the recovery gathers pace. The euro area unemployment rate is expected to remain stable at 8.8% (8.1% in the EU) this year, before edging downwards in 2005.
Headline inflation set to fall below 2% this year
Notwithstanding the economic slowdown and the appreciation of the euro, headline inflation remained sluggish in 2003, buoyed up by such temporary factors as weather-induced food and energy price hikes and rises in indirect taxes. Compared to an estimated 2.1% in 2003, headline inflation is expected to fall to 1.8% this year, as a result of the lagged effects of the euro appreciation and weak domestic price pressures. Inflation should fall further to 1.6% in 2005.
Core inflation was also rather sticky during 2003. Services sector inflation was particularly sluggish in view of the sector’s relatively low productivity and less exposure to competition than the manufacturing sector. However, a reduction in the pace of unit labour cost growth, as labour productivity picks up and wage moderation continues, should also lead to a fall in core inflation.
Diverse fiscal developments
Following the estimated deterioration in 2003, the general government deficit in the euro area is expected to remain stable at 2.7% of GDP in 2004 (2.6% in the EU), before declining marginally in 2005. With respect to 2003, the general government balance is expected to deteriorate this year in all EU countries, except Germany, Spain, France, Austria and the UK. It should be noted that in the case of Denmark, Sweden and Finland, this deterioration refers to a fall in the surplus.
Among the six countries projected to exceed the 3% of GDP reference value in 2004, the deficit already exceeded 3% in Germany, France and the Netherlands in 2003. The figures for this year imply an improvement for Germany and France and a further slight deterioration for the Netherlands. In Greece, Italy and Portugal, the trends in public finances are foreseen to push the deficit beyond 3% this year. The forecasts for Italy and Portugal reflect the expiration of one-off measures that were instrumental in keeping the deficit below 3% in 2003. The forecast for Greece is based on the sharp revision of the deficit to 3% of GDP in 2003, recently communicated by the government. This is currently being scrutinized by Eurostat and is subject to possible revision. Among the other countries, which have a projected deficit below the reference value in 2004, this reflects a deterioration in the case of Belgium, Ireland and Luxembourg, no change in Austria, and an improvement from above 3% in the case of the UK. The remaining four countries, Denmark, Spain, Finland and Sweden, should continue to post a surplus.
4

Overview
In 2005, a slight improvement is expected for the euro area, with the general government deficit declining to 2.6% of GDP (2.4% for the EU). The forecast for 2005 is carried out on the basis of a “no policy change” assumption and, hence, does not include measures that may be adopted in the next budgets. Four countries (France, Italy, the Netherlands and Portugal) are, under such an assumption, projected to exceed the reference value of 3%.
Upside and downside risks to the forecast
Many regions of the world are sending out encouraging signals in support of a continuation of global growth. This reinforces the likelihood of a broad-based simultaneous acceleration of growth across the world, which would generate a mutually reinforcing growth momentum. However, long-standing macroeconomic imbalances may hold back growth in the US economy later in the forecast period. Rising oil and other commodity prices might also put a damper on global growth. On balance, however, the international environment implies an upside bias.
A renewed sharp appreciation in the euro exchange rate could undermine activity mainly in the euro-area manufacturing sector, especially in those Member States that have recently depended on external demand to generate economic growth. On the other hand, any further appreciation would ease inflationary pressures further and, accordingly, raise real disposable income.
The protracted nature of the downturn and uncertainties related to current and future income have undermined consumer confidence, leading to the postponement of consumption plans and sluggish private consumption. Survey indicators suggest that consumers are still wary about committing themselves to purchases of larger consumer durable goods. Furthermore, although geopolitical tensions diminished in the second half of 2003, the threat of terrorist attacks continues to weigh on consumer confidence, particularly in view of the events in Madrid in early March. With the resumption of confidence, the release of pent-up demand would accelerate the return to potential growth. The rise in house prices in a number of EU countries and the contribution of the rise in stock markets to restoration of household wealth should also support spending.
Although investment is being supported by favourable financing conditions and positive developments in earnings and profitability, possible constraints posed by the incomplete adjustment of balance sheets cannot be ruled out. It should also be recalled that confidence can be positively affected by visible progress on structural reforms.
Overall, the balance of risks appears to have shifted towards the downside in recent months.
Acceding countries A positive stimulus from EU integration
Despite weak growth in the EU, the economies of the new Member States are estimated to have expanded on average at a robust 3.6% in 2003, as accession unleashes favourable growth dynamics. In particular, private consumption supported growth, notably in the Baltic States, Hungary and the Czech Republic. Three factors underpinned household spending: (i) increased real disposable income, partly thanks to relatively low inflation close to the euro-area level in many countries; (ii) greater access to credit as a result of the development of the banking system; (iii) anticipated spending
5

Economic Forecasts, Spring 2004
ahead of expected price rises in 2004, linked to indirect tax hikes.
Investment activity was weak in 2003 (except in the Baltic States), reflecting the global situation, but also as a consequence of the stalling reform process in the acceding countries. Exports did very well, notably in Slovakia, which, given weak EU demand, is mostly explained by an export basket with a higher value-added content. In Poland, the depreciation of the zloty contributed significantly to the good export performance.
More investment, but the unemployment rate is slow to decrease
Interest rate convergence towards EU levels, the need to improve infrastructure and the recovery in the EU are the factors which should lift investment growth from a meagre 1.9% in the acceding countries last year to 7.3% in 2005. In general, economic activity will also be supported by the availability of EU funds (estimated at 3% of GDP in the acceding countries over the period 2004-2006, including pre-accession aid, and after the contribution to the EU budget). Average growth in the acceding countries should be around 4% in 2004 and 2005.
Catching-up should continue vigorously as the new Member States with the lowest per capita GDP are expected to grow the fastest. Benefiting from macroeconomic stability, the Baltic States are expected to post growth rates above 5% in 2004-2005. The strongest acceleration of growth is forecast in Poland (from 1.4% in 2002 to almost 5% in 2005) on the back of an expansionary fiscal policy. Among the high-income acceding countries, Cyprus is also expected to grow relatively strongly, but the prospects for re-unification entail both upside and downside risks.
In 2004-2005, employment is expected to increase moderately in the acceding countries as the economy picks up and new activities develop, compensating for jobs lost in the restructuring process. However, the unemployment rate is set to decline only slowly to 13.8% in 2005 in the acceding countries as a whole, compared to 14.3% in 2003.
Inflation set to increase Except in Hungary, Slovakia and Slovenia, inflation was particularly low in 2003 in the new Member States at about the same level as in the euro area, thanks to increased competition and low import prices. An acceleration is, however, expected in 2004 to 3.8% on average, linked to an increase in indirect taxes as tax rates are adjusted to the EU levels. A subsequent easing of inflation to 3.3% is projected for 2005.
High government deficits, but generally expected to decline
On average, the general government deficit in the acceding countries is estimated to be about 5.7% of GDP in 2003, worse than in 2002. In the Czech Republic, the deficit increased considerably because of the inclusion of some state guarantees. The deficit ranges from a surplus in Estonia to a deficit of 12.9% of GDP in the Czech Republic. Five other countries had deficits in excess of 3% of GDP in 2003: Cyprus, Hungary, Malta, Poland and Slovakia.
As fiscal consolidation resumes, government balances are expected to improve in most new Member States in 2004, with the notable exception of Poland. Despite strong growth, budgetary balances are also worsening in the Baltic States, because of accession-related expenditures. In Lithuania, the deficit is approaching the 3% of GDP threshold, while in Estonia the large surplus of 2.6% of GDP in 2003 should completely disappear in 2005.
6

Overview
Table 0.2
Main features of the Spring 2004 forecast ¹ - acceding countries (Real annual percentage change Spring 2004 Difference with unless otherwise stated) Autumn 2003 (a)
2000 2001 2002 2003 2004 2005 2004 2005 GDP growth 4.1 2.5 2.4 3.6 4.0 4.2 0.2 0.0 Investment total 3.5 -0.9 -0.6 1.9 5.7 7.3 -0.9 -0.5 Employment -0.1 -0.1 -0.7 -0.4 0.3 0.8 -0.3 -0.3 Unemployment rate (b) 13.6 14.5 14.8 14.3 14.1 13.8 -1.1 -1.0 Inflation (c) 8.5 5.7 2.7 2.1 3.8 3.3 0.1 0.0 Government balance (% GDP) -3.2 -4.1 -4.9 -5.7 -5.0 -4.2 0.0 -0.1 Government debt (% GDP) 36.4 38.5 39.4 42.2 44.4 45.2 -0.2 -0.7 Current account balance (% GDP) : : : -3.7 -3.9 -4.1 1.0 0.7 p.m. GDP growth EU-15 3.6 1.7 1.1 0.8 2.0 2.4 0.0 0.0
¹ The Commission services' Spring 2004 Forecasts are based on available data up to March 29, 2004. (a) A "+" ("-") sign means a higher (lower) positive figure or a lower (higher) negative one compared to Autumn 2003. (b) Percentage of the labour force. (c) Harmonised index of consumer prices, nominal change.
Other candidate countries
The other candidate countries will see a continued improvement in their macroeconomic performance. Growth is expected to amount to around 5% per year over the forecast period. Private domestic demand remains the driving force behind growth in each country.
In Turkey and Romania, disinflation should continue, driven by the trend real appreciation of the exchange rate of these countries, a strengthening of the supply side of their economies, driven by strong investment, and overall prudent fiscal and monetary policies. Towards the end of the forecasting horizon, inflation is foreseen to be in single digits in both countries, as is already the case in Bulgaria with quite low, but slightly accelerating, inflation.
Despite sustained gains in labour productivity, strong economic growth will lead to a rise in employment in all countries and falling unemployment, although the improvement will be very small in Turkey due to the strong rise in labour supply.
The general government deficit will see a moderate widening in Bulgaria and Romania, whereas Turkey will continue to experience a significant reduction of its deficit.
In all three countries, current account balances are set to widen further, driven by strong domestic demand and a slight deterioration in the price competitiveness of exports, which leads to rising deficits in their respective merchandise trade balances.
7


Chapter 1 The world economy


1. Global growth strengthens
The global economic recovery continues to gain momentum. Growth has surged, in particular, in the US and Japan and has remained strong in other Asian countries, especially in China and India. Building on the strong performance in the second half of 2003, world growth should increase significantly to rates of 4.5% in 2004 and 4.3% in 2005. Global growth is likely to be more broadly based, as activity in the Commonwealth of Independent States (CIS) and OPEC countries is also expected to be robust.
Strong world trade growth
The upturn in the global economy is evident in the growth of world trade, which increased substantially towards the end of 2003 (see graph 1.1).
Graph 1.1: Growth of world imports
-8
-4
0
4
8
12
16
92 93 94 95 96 97 98 99 00 01 02 03
yoy % ch.
Source: CPB (NL)
The robust trade performance was no doubt due to the stronger-than-expected growth in world demand, especially in China, which is estimated to have accounted for close to 30% of growth in world imports in 2003. In addition, a number of temporary factors contributed to the pick-up in growth in trade at the end of 2003, in particular an anticipation of tax changes in China in 2004, which meant that Chinese exports were front-loaded to the fourth quarter of 2003. World trade
is predicted to be strong in 2004 and 2005, growing by around 8% in both years. Graph 1.2 highlights the contribution of China to trade growth in 2003. Although remaining strong, China’s relative contribution to world trade growth will probably decline over the forecast period, in view of the rising contribution of the EU and the US.
0
1
2
3
4
5
6
7
8
9
2003 2004 2005
Graph 1.2: Regional composition of world imports growth
OtherOtherAsiaChinaJapanUS
AC10 andcandidate countries
EU 15
%
Upward pressure on commodity prices
The global recovery has put pressure on commodity prices: both fuel and non-fuel commodities prices have risen strongly. China and India have become significant net importers of energy commodities. Strong growth in non-Japan Asia, in particular China, has been driving global demand growth for non-fuel commodities in recent years, boosted by investment growth and the strong expansion of the manufacturing sector in particular. The upturns in the US and Japanese economies have added to this demand growth. The price of oil in USD has been higher than expected in the Autumn forecast. This is a result of both supply and demand impulses. The decision by OPEC to reduce production quotas and concerns about the level of
11

Economic Forecasts, Spring 2004
private reserves produced negative supply effects. On the other hand, demand has been supported by the cold winter in the US and rising demand for fuel from emerging Asia, especially China. The increase in oil prices is also putting upward pressure on other energy prices.
100
110
120
130
140
150
160
170
2002 2003 2004
Graph 1.3: Commodity prices (USD index)
Index
Non-fuel primarycommodities
Energy (crude oil, natural gas, coal)
Source: IMF
The assumed average oil price has been revised upwards, with Brent crude expected to average 31.1 USD/bl. in 2004 and 28.9 USD/bl. in 2005. For the euro area, the oil-price measured in euro has been roughly stable at around 25 EUR/bl. since the summer of 2003, as the appreciation of the euro has offset the increase in the dollar price.
15
19
23
27
31
35
2002 2003 2004
Graph 1.4: O il price (Brent crude, $ and € per bl.)
EUR
USD
Source: Datastream
Higher commodity prices, and oil prices in particular, should be viewed as one of the downside risks to the economic outlook.
Monetary and financial conditions are supportive
Monetary and financial conditions have been supportive of global growth as monetary policy has remained accommodative in US, Japan and the euro area. However, exchange rate movements have led to more expansionary monetary conditions in the US, while the opposite is true for the euro area.
0
1
2
3
4
5
6
7
8
1999 2000 2001 2002 2003 2004
Graph 1.5: Short-term interest rates (3 months, monthly averages)
%
EUR
UK
USA
With the exception of the UK, where the Bank of England has raised rates, short-term interest rates have remained low, leading to low short-term real interest rates, while inflation has remained subdued since 2002. Long-term bond yields remain low despite improving growth prospects. Sluggish employment growth in the US and the gradual decline in inflation in the euro area suggest that monetary policy will remain accommodative in both areas for the near future. The expected improvement in the labour market and the increase in commodity prices might, however, lead to a tightening of monetary policy in the US. Stock markets rose in 2003, with most major stock market indices trading around 30-35% higher, compared to February 2003. This is also indicative of improved financing conditions for firms, since higher stock prices have led to an increase in equity issuance and mergers and acquisitions. Although corporate earnings have grown, and stock prices remain below the previous historical highs reached in 2000, price levels appear high based on traditional indicators.
12

Chapter 1 The world economy
Graph 1.6: Major stock market indices
50
75
100
125
150
175
99 00 01 02 03
Jan-99=100
DJ Eurostoxx 50
Nikkei
S&P 500
Source: Datastream
Global imbalances persist
The US current account deficit is projected to increase to 5.2% of GDP this year and to fall slightly to 5% of GDP in 2005, as imports growth is expected to remain robust. In Japan, despite the expected stronger growth in imports, the current account surplus is set to widen. Exports, in particular to other Asian countries, are likely to be buoyant. In the longer-term, the imbalances remain a source of risk for the world economy, since an
adjustment of the US current account deficit has historically been accompanied by an adjustment of US domestic demand.
Graph 1.7: Current account imbalances
-700-600
-500-400
-300-200-100
0100
200300
1997 1998 1999 2000 2001 2002 2003 2004 2005
euro area
USA
Japan
Asia
bn USD
13

2. The outlook outside the EU
USA
The upturn in the US economy gained further momentum in the third and fourth quarters of 2003, with annualised growth rates of 8.2% and 4.1% respectively, leading to 3.1% growth in 2003. The stronger growth performance also reflects a better balance across GDP components. Although consumer spending and government consumption have remained strong, private investment growth picked up markedly on the back of high productivity growth and increasing corporate earnings. Positive effects on exports from the depreciation of the dollar have also been emerging, although robust growth in imports is expected to offset this in the current year. For 2004, a growth rate of 4.2% is projected, before declining to 3.2% in 2005, due in part to expected slower growth in consumer spending. Employment is
projected to grow by 0.9% in 2004 and by 0.6% in 2005, without any change in the unemployment rate.
Japan
In Japan, a sustained recovery has taken hold. Growth came out stronger than expected in 2003 at 2.7%, driven by the very robust annualised growth rate of 6.4% in the fourth quarter. Growth in main export markets, such as the US and China, is expected to remain firm. Profits growth should boost investment, while an improved wage and employment situation should lead to stronger private consumption. Overall, quarterly growth rates are projected to remain relatively firm at around 2.4% in annualised terms over the forecast horizon. The quarterly profile should result in annual average growth rates of 3.4% in 2004 (helped by a large overhang) and 2.3% in 2005.
Table 1.1
International environment (Real annual percentage change) Spring 2004 Difference with
Autumn 20032000 2001 2002 2003 2004 2005 2004 2005
Real GDP growth USA 3.7 0.5 2.2 3.1 4.2 3.2 0.4 -0.1 Asia (incl. Japan) 5.9 4.1 4.6 6.2 6.5 5.9 0.9 0.3 of which Japan 2.8 0.4 -0.4 2.7 3.4 2.3 1.7 0.8
China 8.0 7.3 8.0 9.1 8.7 8.1 0.7 0.2ASEAN4 + Korea (a) 6.4 2.8 4.6 3.8 5.2 5.3 0.0 0.1
Acceding Countries 4.1 2.5 2.4 3.6 4.0 4.2 0.2 0.0 CIS 9.0 6.3 5.3 7.5 6.4 5.1 1.2 0.4 of which Russia 10.0 5.1 4.7 7.3 6.5 5.4 1.5 0.4 OPEC-Indonesia 4.1 2.4 1.3 2.6 5.0 4.7 1.1 0.1 Latin America 4.5 0.4 0.3 1.7 3.5 4.3 0.1 -0.1 Africa 3.8 1.0 0.9 2.8 3.6 4.1 -0.6 -0.4 World 4.8 2.3 2.7 3.7 4.5 4.3 0.4 0.2 World excl. euro area 5.0 2.4 3.0 4.3 5.0 4.6 0.6 0.1
World trade World import growth : : : 5.6 8.3 7.8 1.1 -0.1 World import growth excl. euro area : : : 6.7 9.3 8.2 1.4 -0.2 Extra euro area export market growth 11.7 0.5 6.0 5.5 8.5 7.9 0.9 0.0
(a) ASEAN4 : Indonesia, Malaysia, Philippines, Thailand.
14

Chapter 1 The world economy
Canada
Final domestic demand is expected to remain relatively robust in 2004 and 2005, but growth will be held back by a negative contribution from net exports in the wake of the Canadian dollar’s recent appreciation. GDP growth is projected at 2.2% in 2004 and 3.0% in 2005. Domestic demand is being supported by monetary easing. Business investment is expected to strengthen in the period ahead, but private consumption should also pick up again after stagnating in the final quarter of 2003. Household spending should be underpinned by rising employment and disposable income.
Norway and Switzerland
After experiencing a contraction in 2003, the Swisseconomy is set to recover by growing at 2.4% in 2004 and 1.8% in 2005. The contraction in 2003 was due to the lagged effects of the global downturn, the strong Swiss franc and weakness in the tourism and financial services sectors. The healthy global outlook is expected to drive the recovery. In Norway, the combination of expansionary monetary and fiscal policy and more moderate wage settlements is contributing to the first signs of a resumption in growth. Fixed investment is expected to recover in 2004, after five successive years of contraction. Export demand is gradually picking up again, on the back of the global recovery and a weaker currency. Higher oil prices will also benefit the Norwegian economy. Real GDP growth is expected to pick up markedly, to 3% in 2004 and 2.7% in 2005.
Asia (excl. Japan)
Growth in the Asian countries should remain buoyant. In China, the SARS episode barely dented growth in 2003, which registered a strong 9.1%. Growth is expected to slow marginally to 8.7 % in 2004 and 8.1% in 2005. China’s exports and imports should grow strongly, whereas a modest decline in foreign investment is expected. Domestic demand is set to support growth over the forecast period. Besides continued government spending, there are signs of strong private investment and consumption expenditure. The investment-to-GDP ratio, already at 45% of GDP, is also one of the signs of overheating that are appearing in the Chinese economy. In India, GDP growth is expected to remain close to 7%, after nearing 8% last year. In addition, growth rates are set to reach 5-6% in Korea and most other dynamic Asian economies. These favourable results are fuelled by both exports and, increasingly, by domestic demand.
Russia, Ukraine and the other CIS
Hydrocarbon price levels have a significant impact on the economy of Russia, the world’s second largest oil exporter. In 2003, high world oil prices boosted GDP growth, which registered 7.3%. The high current account surplus and a decline in capital outflows have boosted liquidity and fuelled a boom in domestic demand and an appreciation of the rouble. Given the projected gradual decline in oil prices, growth is expected to slow down somewhat, but it should nevertheless remain robust at 6.5% in 2004 and 5.4% in 2005.Ukraine continues to be characterised by a healthy macroeconomic performance: GDP growth accelerated from 4.1% in 2002 to an estimated 8.5% in 2003. While remaining strong, it is projected to slow down somewhat in 2004-5. The current account surplus is expected to narrow as the impact of domestic demand on imports should more than offset exports growth. Most other CIS are continuing to benefit from a favourable external environment (sustained imports demand in Russia and high commodity prices). These countries are, accordingly, expected to experience growth in a range of 5-7% in 2004.
Latin America
Following a weak economic performance in 2002, GDP growth in Latin America is estimated to have recovered in 2003 to 1.7%. Weak domestic demand in Brazil and Argentina and the recessions in Venezuela and Uruguay prevented a faster acceleration of regional growth, despite a marked rebound in economic activity in Argentina and economic expansion in the 3-4% range in Chile, Colombia and Peru. The region’s overall rate of growth is projected to accelerate significantly in 2004 and 2005 (to 3.5% and 4.3%, respectively). This acceleration is supported by the recovery in the industrialised economies, improved investor sentiment towards emerging markets, and the effect on exports of the ongoing economic recovery in Argentina and Brazil.
Africa
Excluding the OPEC countries, growth in Africa is expected to have been just below 3% in 2003, supported mainly by domestic demand and some rebound in non-oil commodity prices. In general, improved political stability and the global economic upturn should improve prospects for 2004 and 2005, with GDP growth projected in the range of 3.6%-4.1%.
15


Chapter 2 The economies of the euro area and the EU


1. Global growth has supported economic activity
Turnaround in the second half of 2003
Economic growth in the euro area rose by 0.4% in the third quarter of 2003 (q-o-q) and by 0.3% in the fourth quarter. After three successive quarters of stagnation, the turnaround was driven by a moderate rise in domestic demand and a surge in exports. The strong increase in world demand outweighed the dampening effect of the euro appreciation. Private consumption remained relatively subdued. Confidence has, nevertheless, recovered from the lows of the first half of 2003.
Table 2.1
(Seasonally and workingday adjusted) 03Q1 03Q2 03Q3 03Q4
GDP 0.0 -0.1 0.4 0.3
Private consumption 0.4 0.0 0.2 0.1
Government consumption 0.5 0.6 0.6 0.6
Gross fixed capital formation -0.9 -0.4 -0.2 0.6
Changes in inventories (% of GDP) 0.2 0.3 -0.2 0.5
Export of goods and services -1.5 -0.9 2.3 0.2
Import of goods and services -0.6 -0.4 0.8 2.1
03Q1 03Q2 03Q3 03Q4
GDP 0.0 -0.1 0.4 0.3
Private consumption 0.2 0.0 0.1 0.0
Government consumption 0.1 0.1 0.1 0.1
Gross fixed capital formation -0.2 -0.1 0.0 0.1
Changes in inventories 0.2 0.1 -0.4 0.7
Net exports -0.4 -0.2 0.6 -0.7
Composition of growth in 2003 - euro area
Quarterly % change
% contribution
Exports lead the upturn
After a striking increase of 2.3% (q-o-q) in the third quarter, exports grew by only 0.2% in the last quarter of
2003. The momentum of world trade seems to have offset the dampening impact of an appreciating currency. World imports of goods are estimated to have increased by 6.5% in the last quarter of 2003, vis-à-vis the same quarter of the previous year. Compared to 2002, euro area exports (intra and extra) of goods and services did not grow at all in 2003, but the carryover for 2004 is 1.1 pp. In real effective terms (using the CPI deflator), the euro appreciated by 10% over the past year (and by 18% over 2 years).
90
95
100
105
110
99 00 01 02 03 0480
85
90
95
100
105
Graph 2.1: Euro area goods: export market shares (Jan 1999=100)
REER euro area (CPI deflator) (rhs)
euro area market shares
(lhs)
Sources: Commission services, IMF
In view of the import content of exports, a delayed upturn in imports (2.1%) resulted in a negative contribution of net exports to growth of 0.7 pp in the fourth quarter of 2003. Over the year, the contribution of net exports to growth was strongly negative at minus 0.6 pp in spite of sluggish domestic demand; this implies a carryover for 2004 of -0.2 pp.
Revival in investment
After three consecutive quarters of significant contraction in 2003, investment recorded a sharp upturn in the fourth quarter of 2003 at +0.6% q-o-q. In 2003,
19

Economic Forecasts, Spring 2004
capital spending contracted by 1.2% vis-à-vis the previous year, but the carryover for 2004 is nevertheless +0.3pp.
-8%
-4%
0%
4%
8%
12%
16%
20%
99 00 01 02 03 04-4%
-2%
0%
2%
4%
6%
8%
Graph 2.2: Euro area investment and ordersyoy % ch.
Capital goods new orders
Investment QNA
This break in the three-year long decline appears to stem from the accelerator effect of strong foreign demand on domestic industrial production. However, despite the increase in new orders of capital goods since the end of 2003, it is too soon to conclude that a firm upward trend has been established. Capacity utilisation has remained below average, which is unusual at this stage of the recovery, i.e. almost two years after the trough.
76
78
80
82
84
86
-4 -3 -2 -1 0 1 2 3 4 5 6 7 8
1995/96
2001/03
1998/99
1991/93
%
Graph 2.3: Capacity utilisation (manufacturing sector)
(relative trough in GDP growth set on quarter 0)
Average 1990-2004
Favourable financing conditions helped the recovery in investment: real (retail) interest rates and corporate bond yields bottomed out at low levels at the end of
2003. Bank loan growth has accelerated since last summer and profitability has been improving since the second half of 2003. The rally in stock markets, which began last spring, has reduced debt-to-equity ratios and the relative cost of equity financing. Corporate earnings have improved, leading to balance-sheet restructuring, not least due to cost cutting measures.
Adverse shocks and a possible structural break in household consumption
The contribution provided by household spending to GDP growth has stalled since the second quarter of 2003. The latest figures available (0.1% growth in the fourth quarter of 2003) suggest that private consumption has only tentatively recovered so far. Recent developments do not deviate from the sluggish pattern of consumption over the past three years. However, consumption growth (at +1%) is most likely to have outpaced real disposable income in 2003 as a whole, while the former grew at a slower pace than the latter in 2001 and 2002. But this does not provide conclusive evidence of a rebound, given that consumption can be more resilient than income during a recession. Moreover, substantial tax cuts were enacted which supported household spending in some large euro-area countries such as Germany and France. Inflation proved more stubborn than expected last year due to rises in oil, energy and administered prices. Perceptions of an increase in prices following the introduction of the euro may also have influenced savings behaviour. Employment declined over the past year in Germany, the Netherlands, Belgium, Finland, Denmark and the UK; in France, it did not increase sufficiently to curb unemployment. Prospects for a decline in unemployment have not brightened in the early part of 2004. The recent backtracking on the EU’s fiscal framework possibly weighed on confidence. The EC Business and Consumer Surveys pointed to a deterioration in consumer confidence coinciding with heightened geopolitical uncertainty early in 2003. Limited improvements in consumer confidence have been recorded since the second half of last year. The tentative improvement in retail trade confidence was not confirmed at the end of the year. Structural factors such as the non-sustainability of pay-as-you-go pension systems, and increased risk associated with some funded pension schemes might also have prompted households to increase their savings in the recent years. Major reforms to public pension systems (recently undertaken in France and Italy), resulting in a reduction of future pensions, may have heightened future pensioners' awareness of risks to the public pension system. In addition, the bursting of the equity market bubble may have triggered a need to
20

Chapter 2 The economies of the euro area and the EU
rebuild savings under other classes of assets such as housing, fixed income or cash in order to diversify risks. Increased savings were required in order to compensate for negative wealth effects from equities and also in order to reallocate savings to housing, since investments in stocks or mutual funds shares could not be liquidated without incurring large capital losses.
-1
0
1
2
3
4
-2 -1 0 1 2 3
1995
1999
1998
2000
20011997
2003
1996
2002
1994
1992
1993 Real disposable income growth (yoy % ch.)
Consumption growth (yoy % ch.)
Graph 2.4: Household consumption and real disposable income in the euro area
The strong increase in household mortgage borrowing, linked to house price increases, does not as such raise the issue of its sustainability, as the cost of servicing debt has not increased and the absolute level of indebtedness remains moderate according to international comparisons. However, it could have long-lasting effects. In an environment of low inflation and low interest rates, a higher level of indebtedness can be carried by the same level of debt servicing in the short run. Nevertheless, households are more vulnerable to declining real income, falling house prices and rising unemployment. Households that have variable interest rate mortgages (e.g. in Spain, Portugal, Greece or, to a lesser extent, Italy) are also more vulnerable to rising interest rates.
4546474849505152535455
99 00 01 02 03 04012345678910
Graph 2.5: Euro area household debt ratio (% of GDP) and real interest rates on household loans
% GDP % point (GDP growth defl.)
Interest rate on revolving loans (rhs)
Mortgage interest rate (rhs)
Total loans (lhs)
Source: ECB and Bank of France; euro area interest rates proxied by French rates
Mixed signals from inventories
The recent pattern of inventories is difficult to interpret. A slight depletion in the third quarter of 2003 (-0.2% of GDP) was followed by a surge in stock-building in the fourth quarter (0.5% of GDP). The latter may be different in nature than the technical corrections observed in the first half of 2003. Some special factors, such as increasing stocks of oil reserves prior to the war in Iraq, may also have played a role then. The latest increase might be a reflection of the upturn in industrial output against a background of not-so-strong demand. Past developments also show that higher expected production can trigger a rise in stocks through imports (e.g. commodities). The contribution of stock-building to growth in 2003 was 0.3 pp and the carryover for 2004 is already 0.3 pp. The results of the last four quarters should nevertheless be treated with the usual caution, as the change in inventories is a “residual” item in the quarterly national accounts.
-0.8
-0.6
-0.4
-0.2
0.0
0.2
0.4
0.6
0.8
0 1 2 3 4 5 6 7 8
1996/98 2002/04
1993/95
% of GDP
Graph 2.6: Change in inventories in the euro area across cycles
1998/20000
(relative trough in GDP growth set on quarter 0)
21

Economic Forecasts, Spring 2004
Strong government consumption
In contrast to private consumption, government spending continued to increase at an annualised rate of 2.4% in the second half of 2003. The financing of the social security deficit, the rescuing of highly indebted public or private companies (in particular in France or Italy), and the pick-up in public goods orders for infrastructure (especially in Greece for the forthcoming Olympic games) or defence are among the factors that contributed to growth in public spending.
Industrial sector back on track
The sector breakdown of GDP growth confirms that industrial production accounts for the bulk of the recovery. In the last quarter of 2003, industrial production increased by 0.5% compared to one year ago in the euro area and by 0.1% in the EU. The retail sector is still suffering from the sluggishness of consumption. After three consecutive quarters of sharp contraction, output in the agricultural sector expanded once again in the fourth quarter.
Table 2.2.
(Season. & working day adj.) 03Q1 03Q2 03Q3 03Q4GDP 0.0 -0.1 0.4 0.3
Agriculture -1.2 -1.0 -0.7 1.1
Industry 0.3 -0.8 0.5 0.7
Construction -0.6 0.1 0.0 0.1
Wholesale and retail trade -0.3 0.1 0.8 -0.3
Financial intermediation 0.1 0.1 0.6 0.1
Public administration and defence 0.2 0.2 0.3 0.5
Sectoral breakdown of growth in 2003 - euro areaQuarterly % change
Similar profile in the European Union
Demand components displayed a similar profile in the EU for 2003, with the notable exception of household consumption. The yearly growth rate for 2003 was 0.8% compared to 0.4% for the euro area. The difference is basically accounted for by consumption, which grew at a strong pace of 3% in the UK and was more resilient in Sweden than in the euro area. The carryover of private consumption growth for 2004 is 0.5%. The contribution of net exports to growth in 2003 was -0.5%. The growth contribution of investment, at -0.2%, is equal to that observed for the euro area. Government consumption increased at an annual rate of 1.9%.
22

Chapter 2 The economies of the euro area and the EU
Box 2.1: Some specificities behind the forecasts
Exchange rates
A constant nominal exchange rate in the ERMII (DKK/EUR rates) and constant real rates (nominal rates adjusted for changes in GDP deflators) for Sweden, the UK and non-EU currencies are assumed. The reference period used for the exchange rate constancy assumption is the average exchange rate of 23 February to 5 March 2004, which is attributed to the first quarter of 2004. The average USD/EUR rate for that period was 1.25 and the JPY/EUR rate 134.9. This leads to implied average USD/EUR rates of 1.25 in 2004 and 1.24 in 2005, and average JPY/EUR rates of 133.4 and 130.3 in 2004 and 2005 respectively. For the acceding countries, currencies are treated according to their policy regimes. Hence for the CYP (Cyprus pound), EEK (Estonian kroon), HUF (Hungarian forint) and the LTL (Lithuanian litas), constant nominal exchange rates vis-à-vis the euro are assumed. For the PLN (Polish zloty), CZK (Czech koruna), SIT (Slovenian tolar) and SKK (Slovakian koruna), constant real rates against the euro are assumed. For currencies pegged to a basket (Latvian lat and Maltese lira), the future rate is deduced from the evolution of the currencies constituting the basket.
Interest rates
Short-term interest rates are set in order to reflect the objective of monetary policy with respect to price stability. Long-term interest rate assumptions are based on developments in short-term rates and an assessment of economic conditions. Attention is paid to international financial linkages, market expectations and budgetary developments.
Commodity prices
Commodity prices are forecast taking into account market conditions. In the case of oil prices special attention is paid to futures prices. Prices for Brent oil are, accordingly, projected to be 31.1 USD/bl in 2004 and 28.9 USD/bl in 2005. Prices of primary commodities, excluding fuels, are assumed to increase by 15.6% in 2004 and to decline by 2.6% in 2005. The strongest price increases in 2004 apply to the group of metals, with a 25% annual rise. In 2005, the prices of all groups of non-fuel products are expected to decline compared to 2004.
Budgetary data
Estimates for 2003 are based on the Excessive Deficit Procedure notification, submitted by the Member States in March 2004. This information is found in a Eurostat Report of 16 March (press release 38/2004). It should be noted that Eurostat’s recent decision (2 March 2004) on the sectoral classification of funded pension schemes was not taken into account in this notification. The consequences of this decision, which could lead to a revision of the deficit and debt data in some countries, will be assessed on a case-by-case basis in time for the second 2004 notification next September. For 2004, budgets adopted or presented to parliaments and all other measures known in sufficient detail are taken into consideration. For 2005, the "no-policy change" assumption used in the forecasts implies the extrapolation of measures and trends that are known at the time of completion of the forecasts. The government balances reported in the notification may be different from those published in the national accounts because of an amendment to ESA95. According to Regulation (EC) N° 2558/2001 on the reclassification of settlements under swaps agreements and forward rate agreements, interest flows under swaps have been reclassified from “income property” to “financial account”. However, the Regulation states the need for specific treatment of these flows for data transmitted under the Excessive Deficit Procedure, allowing for interest expenditure to include swaps, contrary to the ESA95 new rules. In the forecasts, it is the EDP definition of general government balances that is presented. Therefore, the calculation of general government expenditure does include swap-related settlements.
Calendar effects on GDP growth and output gaps
Year 2004 is a leap year. The addition of one extra working day implies that EU annual output increases, other things being equal, by about 0.3 of a percentage point. Annual GDP figures are not adjusted for the number of working days, while quarterly national accounts figures of most countries are. This means that the simple addition of the four quarters of a single year may not add up exactly to the annual figure. Moreover, the calculation of potential GDP, from which the output gap is derived, does not involve any adjustment for the number of working days in the leap year, because this is considered to be a temporary phenomenon, which should not affect the cyclically adjusted balances that are calculated using these output gaps. Hence, for 2004, the increase in the negative output gap would be larger if it were not a leap year.
23

2. Capital formation should lead growth activity
While government consumption will continue to make a modest contribution to growth in 2004 and 2005, private consumption and investment in equipment will raise euro area GDP growth from 1.7% in 2004 to above 2% in 2005. The strength of the exchange rate is increasing the competitive pressure on European producers. Imports of goods and services will advance firmly, while exports will be sustained by stronger world trade. The external contribution to growth will be almost zero in 2004 and 2005. Stock-building is not foreseen to add to growth over the forecast horizon.
2.1. Households: income developments come to the rescue
Households have continued to borrow at a brisk pace, mainly to finance house purchases
Household debt expanded rapidly throughout 2003, and even accelerated at the end of the year. In January 2004, bank loans to euro area households grew at an annual rate of 6.5%. Loans for house purchases remained the most dynamic component, accelerating to an annual rate of 8.3% in January 2004. For the euro area as a whole, household debt exceeds 50% of GDP and is likely to have surpassed 80% of disposable income – although this is still well below the corresponding ratios (above 100%) in the United States and the United Kingdom. In general, those Member States, in which household debt has grown fastest, have experienced rapid rises in house prices (Portugal being an exception).
Table 2.3
Composition of growth - euro area (Real annual percentage change) Spring 2004
2002 1998 1999 2000 2001 2002 2003 2004 2005bn Euro curr. prices % GDP Real percentage change
Private consumption 4031.7 57.0 3.1 3.5 2.7 1.8 0.5 1.1 1.6 2.3 Government consumption 1441.2 20.4 1.4 1.8 2.1 2.6 2.9 2.0 1.2 1.3 Gross fixed capital formation 1430.8 20.2 5.3 6.0 5.0 -0.1 -2.5 -1.0 2.4 3.6 - of which : equipment 538.0 7.6 9.4 8.5 8.0 -1.1 -4.9 -2.3 3.4 6.0 - of which : construction 736.7 10.4 1.7 3.7 2.7 0.1 -1.3 -0.4 1.5 1.5 Change in stocks as % of GDP -12.7 -0.2 0.5 0.3 0.2 -0.3 -0.2 0.1 0.1 0.2 Exports of goods and services 2595.7 36.7 7.3 5.3 12.3 3.3 1.3 -0.1 4.9 5.9 Final demand 9486.6 134.1 4.5 4.0 5.4 1.6 0.5 0.8 2.6 3.4 Imports of goods and services 2413.8 34.1 10.0 7.6 11.0 1.7 -0.1 1.8 5.0 6.6 GDP 7072.9 100.0 2.9 2.8 3.5 1.6 0.9 0.4 1.7 2.3 GNI 7025.8 99.3 2.6 3.1 3.4 1.5 0.8 0.2 1.7 2.5 p.m. GDP EU-15 9186.8 129.9 2.9 2.9 3.6 1.7 1.1 0.8 2.0 2.4
Contribution to change in GDP Consumption 2.0 2.3 2.0 1.5 0.9 1.0 1.1 1.6 Investment 1.1 1.3 1.1 0.0 -0.5 -0.2 0.5 0.7 Inventories 0.4 -0.2 -0.1 -0.5 0.0 0.3 0.0 0.1 Exports 2.4 1.8 4.3 1.3 0.5 0.0 1.9 2.4 Final demand 5.9 5.3 7.2 2.2 0.7 1.0 3.5 4.8 Imports (minus) -3.0 -2.4 -3.7 -0.6 0.0 -0.6 -1.8 -2.5 Net exports -0.6 -0.6 0.6 0.6 0.5 -0.7 0.0 -0.1
24

Chapter 2 The economies of the euro area and the EU
The sustained accumulation of household debt may be a factor contributing to the weakness in consumer demand in the euro area, outweighing any positive wealth effect from higher asset prices. While debt-servicing costs have benefited from low interest rates, total repayments, i.e. amortisation and interest, have probably increased. In such circumstances, it cannot be excluded that the income and liquidity effects of heavy indebtedness would outweigh any positive wealth effects from higher house prices – particularly in continental Europe, where house equity withdrawal is unusual. The recovery in equity prices would also be expected to have positive wealth effects in the household sector. However, as equity prices remain below the peaks of 1999-2000 and, given the low propensity to consume out of wealth (compared to the UK and the US), positive effects on consumption will remain limited.
Table 2.4
1998 1999 2000 2001 2002 Q3-2003
Financial assets/GDP 198.0 213.7 208.1 198.5 187.0
Net financial assets/GDP 145.4 158.7 152.0 141.3 129.0
Debt/disposable income 69.1 72.6 74.4 73.7 75.7 77
Debt/GDP 44.6 46.5 47.7 48.8 50.2 52
Balance sheet indicators for euro-area households and non-profit institutions serving households
Source: ECB, Eurostat, and own calculations. Data for 2003-Q3 are estimates.
Housing valuations appear high in several euro area Member States (e.g., the Netherlands, Ireland, and Spain) and there is evidence that lending conditions are tightening. The annual rate of increase in house prices in the euro area has averaged about 7% in 2000-2003. The
ECB January 2004 Bank Lending Survey reports some tightening of (current and future) lending standards for loans to households for house purchase, partly due to worsening prospects in the housing market. Indeed, since last summer mortgage interest rates have risen somewhat. The macroeconomic risk stemming from a reversal in house prices appears limited at the level of the euro area. House price inflation has been relatively moderate in the larger euro-area Member States and the structure of household liabilities – mainly long-term and fixed-rate – would lessen the impact of a rise in interest rates. However, there might be strains in some of the smaller euro-area Member States where prices have risen fast and the size and maturity structure of household debt means that variations in interest rates would have a greater impact on household disposable income (such as Ireland, Greece, and Spain).
23456789
101112
1998 1999 2000 2001 2002 2003
yoy % ch.
Graph 2.7: Euro area bank loans
Source: ECB
Non-financial corporations
Households
Table 2.5Determinants of private consumption expenditure - euro area
(Annual percentage change) Spring 2004 Difference with Autumn 2003 (a)
2000 2001 2002 2003 2004 2005 2004 2005 Real private consumption expenditure 2.7 1.8 0.5 1.1 1.6 2.3 0.0 0.3 Compensation per employee 2.8 2.9 2.7 2.8 2.4 2.3 -0.1 -0.3 Real compensation per employee 0.6 0.5 0.4 0.9 0.6 0.7 0.1 -0.1 Employment 2.2 1.4 0.6 0.0 0.3 0.9 0.0 0.1 Real gross disposable income 2.0 2.4 0.8 1.1 1.6 1.9 0.4 0.2 Saving rate of households (b) : 14.9 15.2 15.2 15.3 15.0 0.5 0.5
(a) A "+" ("-") sign means a higher (lower) positive figure or a lower (higher) negative one compared to Autumn 2003.(b) As a percentage of gross disposable income.
25

Economic Forecasts, Spring 2004
Income gains will support private consumption growth
The euro-area labour market has shown greater resilience to the slowdown than in past economic cycles. Employment is expected to grow in 2004. Increasing employment, tax cuts in some Member States and growth in compensation per head exceeding the inflation rate bode well for the development of disposable income growth. The expected evolution of households’ wealth should also be supportive of private consumption expenditure. Information on the consumption of durable goods in France and Italy supports the hypothesis of the existence of pent-up demand. During 2002 and the first half of 2003, consumption of durable goods in France and Italy, taken together, shrank on average by 0.3% in each quarter, while total consumption increased by the same average rate. Assuming such a trend can be generalised to the whole euro area, this would suggest the existence of considerable pent-up demand. An analysis of recent survey evidence supports the view that more households intend to undertake major purchases. Up to now, the improvement in consumer confidence was mainly based on a better outlook for the economy and for the labour market. This is expected to lead to greater optimism on the part of households regarding their own financial situation.
-30
-25
-20
-15
-10
-5
0
5
99 00 01 02 03 04
consumer confidence
major purchasesat present
balance
Graph 2.8: Consumer survey results
2.2. Firms: positive investment outlook
Low interest rates and a recovering investor appetite for risk have brought down the cost of finance for companies
Financing costs in the euro-area corporate sector have declined further since autumn 2003. Equity prices have moved higher and corporate bond spreads have narrowed to historically low levels. Moreover, interest rates on bank loans, which are the largest source of corporate financing in the euro area, have fallen in the course of 2003, even though comparable risk-free interest rates have edged up since the mid-year. With the euro-area inflation rate expected to remain close to 2%, the real cost of corporate financing is now very low by historical standards.
Table 2.6
1998 1999 2000 2001 2002 Q3-2003
Net financial assets/GDP -91.9 -112.6 -102.7 -90.3 -76.2
Debt / GDP 64.1 68.6 75.0 78.2 77.7 79
Equity/GDP 118.6 154.7 145.8 126.7 99.3 101
Debt / equity 54.0 44.4 51.5 61.7 78.3 86
Short-term debt / Total debt 30.3 31.2 32.9 32.2 30.0 30
Balance sheet indicators for euro area non-financial corporations
Source: ECB, Eurostat, and own calculations. Data for 2003-Q3 are estimates.
By exploiting the favourable financing conditions to re-finance existing debt and by reducing capital expenditure, companies have been able to improve their balance sheets. Corporate debt levels have stabilised (relative to GDP) and the average maturity of corporate liabilities has been lengthened. A retrenchment in capital expenditure and a recovery in profits have allowed companies to reduce the financing gap. In consequence, the downgrade/upgrade ratio in the credit rating of companies fell in 2003 relative to 2002 and there has also been a decline in credit-risk premia. The ECB Bank Lending Survey for January 2004 points to a continued fall in the percentage of banks reporting a tightening of corporate credit standards, although the balance remains positive.Evidence of a modest acceleration in net corporate borrowing has been accompanied, more recently, by indications of increased investment activity. While MFI loans to the non-financial corporate sector slowed down to an annual rate of 3.1% in January 2004 (from a steady rate around 3.6% in the course of 2003), issuance of
26

Chapter 2 The economies of the euro area and the EU
corporate securities was considerably more buoyant, growing at annual rates close to 10% in the last three quarters of 2003. Moreover, there was a strong acceleration in securities issuance by non-monetary financial institutions (up by 23.3% on the previous year in December 2003). This largely reflects issuance by dedicated financial subsidiaries of non-financial corporations. Even lower-rated companies appear to have regained access to the bond market in the latter part of 2003. In contrast, however, issuance of quoted shares remained subdued. Recent data suggest that part of the increased financing is being used to expand capital investment. In addition to the pick-up in capital spending in the fourth quarter of 2003, the ECB bank lending survey provides evidence of increased financing needs for fixed investment, inventories and working capital. It is notable that the increase in lending demand was particularly pronounced among SMEs, which have limited access to direct financing channels and so far have not benefited from the lower cost of bond and equity financing.
0
50
100
150
200
250
99 00 01 02 03 04
Graph 2.9: Corporate bond spreads - euro area
Source: Datastream
BBB
A
AAA
Overall, financing constraints on capital expenditure appear much looser than one year ago, but the prospects for the corporate sector are still uncertain. In spite of the progress made, it is unclear whether the excess leverage accumulated during the 1990s has been completely worked out. Absolute levels of corporate debt and gearing ratios remain high, and the overall rating position of non-financial corporations is still considerably worse now than in 2000 (especially in sectors such as telecoms and automobiles). In addition, there are concerns that both equities and corporate bonds could be overpriced, suggesting the risk of a sharp reversal in prices. Recent financial reports have
indicated that the acceleration in output growth in the second half of 2003 has boosted earnings but, in a context of falling export profit margins and reduced scope for cost-efficiency improvements, sustained profitability will hinge on a pick-up in domestic demand.
Investment: healthy growth foreseen
The 0.6% q-o-q surge in gross fixed capital formation in the last quarter of 2003 was the fastest quarterly increase in three years. A further recovery in investment is expected, underpinned by the lower cost of financing and the increased availability of bank loans. Moreover, confidence has increased, as witnessed by business survey results, and technological progress will also support investment. Perceptions of current business conditions and business expectations in industry both rose in the second half of 2003. However, in the capital goods sector, the evolution of the two indicators is more synchronised compared to the industry aggregate, where a dichotomy between the assessment of current production trends and production expectations still persists. Investment in equipment is likely to benefit from the increased use of information and communication technology (ICT) in firms’ operations. The productivity-enhancing role and the continuous developments in ICT are shortening the average life-cycle of productive equipment.
80
82
84
86
88
90
95 96 97 98 99 00 01 02 03 04
Graph 2.10: Capacity utilisation rates in the euro area
%
capitalgoods
total manufacturing
Domestic demand will gradually take the place of external demand to bring capacity utilisation rates to a higher level. At 80.7% in 2004Q1, capacity utilisation in manufacturing is still below its long-term average. However, for the capital goods sector, the rate exceeds
27

Economic Forecasts, Spring 2004
already the long-term average, mainly as a result of strong foreign demand for European capital goods (mostly from East Asia and oil-producing countries). Although demand for capital goods is expected to improve, the growth pattern is unlikely to be sustained. Two factors may weigh on investment growth. First, despite the recent improvement in financial conditions, it appears that the level of debt in the corporate sector is rather high. Second, as a result of the resilience of the labour market during the downturn, labour productivity growth in the euro area has been below 0.5% per year during three consecutive years (it was somewhat higher in the EU, between 0.4% and 0.6%). Stronger demand will bring labour productivity growth in the euro area to about 1½% in 2004 and 2005. This is just above the average for 1996-2000, but still below the average of 1991-1995. Muted productivity growth will limit gains in profitability, gains that would otherwise easily trigger an acceleration in investment. Profitability may also suffer from the delayed effects of the stronger exchange rate.
-0.8
-0.4
0.0
0.4
0.8
1.2
99 00 01 02 03 04 05
yoy % ch.
forecast
Graph 2.11 : Corporate mark-ups in the euro area (approximated by GDP price deflator/ unit labour costs)
Exports: the income effect will smooth the impact of the lagged effect of the euro appreciation
Imports of the world excluding the EU are expected to grow at 9½% in 2004 and 8½% in 2005. Growth figures for GDP and trade for 2004 are boosted by substantial positive carry-over effects. The EU’s export markets are projected to grow at 7¼% in both 2004 and 2005, a pace not seen since 2000. However, it is unlikely that the EU will be able to benefit fully from the strength of the international environment. Given the technical assumptions regarding the exchange rates (see box 2.1
for details), the nominal effective exchange rate of the euro area should appreciate by about 4¼% in 2004 (and by 7% for the EU). Nevertheless, the lagged effects of the exchange rate evolution on trade are important since several factors have the potential to attenuate or delay the exchange rate impact on exports: e.g. the inertia of contracts, hedging and billing behaviour.
-5%
0%
5%
10%
15%
20%
92 93 94 95 96 97 98 99 00 01 02 0370
75
80
85
90
95
100
105yoy % ch.
Graph 2.12: Exports of the euro area vs. world imports (goods only)
index100=1995
Sources: CPB, Commission services; REER based on unit labour costs total economy
World imports (lhs)
REER (rhs)Extra EAexports (lhs)
An examination of past periods of appreciation in the nineties (1994-97 or 1997-1999) suggests that euro-area exports underperformed world trade growth by about 5 percentage points two years after the beginning of the appreciation phase.The EU might benefit from the strength of the international environment, as the income effect on trade flows is in general greater than the price effect. The impact arising from the increase in world demand is probably stronger than that stemming from the appreciation of the euro. The latter effect is likely to vary across the Member States according to the importance of exports to non-euro-area countries. Moreover, the extent of the impact of the euro appreciation is likely to be larger the greater the degree of openness of the country.
Role of affiliates’ sales
The international environment does not only affect the EU economy through international trade. In the case of the US, substantial inflows of European foreign direct investment into the US have pushed domestic US sales by US affiliates of euro-area firms to 12.8% of euro area GDP in 2001. This is much larger than exports of goods and services to the US, which amounted to 3.8% of euro area GDP in 2001. Because of this exposure, the
28

Chapter 2 The economies of the euro area and the EU
profitability and balance sheets of euro area companies were negatively affected by the US recession in 2001 and the subsequent rise in the bilateral EUR/USD exchange rate. Conversely, the recent strong recovery of profitability in the US should help European firms, even taking into account the unfavourable exchange rate conversion effect. A similar case could probably be made for affiliates of European firms in Asia.
Table 2.7
US affiliates of EU companiesDomestic sales in % of GDP
1993 1999 2000 2001Belgium 7.8 7.6 9.8 10.9
Germany 6.6 13.3 15.4 15.3
Spain 0.3 0.6 0.7 0.8
France 6.6 10.6 13.7 13.0
Ireland 12.0 14.1 17.2 16.5
Italy 1.2 1.6 1.9 2.0
Luxembourg 23.9 15.3 18.7 19.2
Netherlands 22.9 44.4 67.1 61.9
Austria 1.2 1.4 1.9 1.6
Finland 7.2 9.9 13.1 13.7
Euro area 5.8 10.3 13.3 12.8
Denmark 2.6 2.3 4.0 4.2
Sweden 12.4 15.3 16.0 16.9
UK 22.0 18.2 23.8 23.6
EU 8.1 11.6 15.1 14.7
No individual data for Greece and Portugal available
Source: Bureau of Economic Analysis, AMECO
2.3. The balance of risks The balance of risks has moved to the downside recently. The main risks relate to consumption, investment and exports.
Consumption
The risks to consumption are skewed to the downside. There is a risk of a bubble in some European housing markets, making consumer expenditure plans vulnerable to the consequences of interest-rate increases or declining house prices. Another downside risk is the persistence of negative confidence effects, stemming from the past stock market correction and from the uncertainties over the sustainability of pension and health care systems and government spending.
Nevertheless, an upside risk lies in the release of larger-than-assumed pent-up demand in combination with more favourable developments in real income growth and/or in wealth. If pent-up consumption demand were released, it could be financed through a reduction in the savings rate to historical levels.
Investment
The risks to investment are probably on the upside. The 3.5% growth rate for 2004 investment is still only at its long-term average. Stronger-than-expected demand could bring capacity utilisation rates more rapidly to a level that triggers additional investment. In combination with faster technological progress and more favourable financing conditions, the elements are in place for even stronger investment growth. On the downside, demand developments could disappoint. External demand may suffer from a further strengthening of the euro exchange rate or from a fall-off in growth in the US or in China. Moreover, the acceleration in European private consumption may be slower than foreseen. Finally, the uncertainty regarding the adjustment of corporate balance-sheets is a risk in both directions: it may have advanced less or more than indicated by the present assessment, which is based on limited data availability.
Exports (and affiliates’ sales)
The strength and the sustainability of the global recovery are key risk factors for European export growth. An important role is played in this by the US household sector and the timing of its balance-sheet adjustment. The lagged impact of the euro appreciation on exports could also be larger than expected. The high level and increased volatility of oil prices has also the potential to dampen world demand. The evolution of profitability of affiliates’ operations is an upside risk for the health of European firms. European firms have, on average, large operations in the US and could, as a result, benefit from the strong profitability recovery in the US, even after an unfavourable exchange-rate conversion. A similar case could be made for European firms’ operations in Asia.
29

3. Positive signs in the labour market
3.1. Recent developments
The slowdown in economic activity has taken its toll on the labour market
The euro-area labour market has gradually worsened since mid-2001, following the deceleration of economic activity with a relatively short lag. After years of strong job creation, employment growth fell below 1% (year-on-year) in the fourth quarter of 2001, and has further decelerated since then. Employment (measured in terms of job-holders rather than full-time equivalents) remained unchanged in the third quarter of 2003, extending the period of broadly flat employment growth to one and a half years. The standardised unemployment rate in the euro area rose from 8% in the first quarter of 2001, when it reached its lowest level for the last 10 years, to 8.8% in the second quarter of 2003. Since then it has remained stable at that level, according to the latest available figure for February 2004. On the basis of the Commission Survey results, households’ unemployment expectations improved in the second half of 2003 while remaining broadly unchanged at the beginning of 2004. All in all, labour market indicators have improved since the lows of the beginning of last year, but they remain soft.
Net job creation continued in the services sector
A breakdown of employment developments by sector shows that agriculture and industry have continued to lose jobs, while employment in the services sector has risen, albeit at a very modest pace of 0.2% (quarter-on-quarter) since mid-2002. Survey data suggest that overall employment growth remained weak at the turn of the year. According to the last Commission Business Survey, employment expectations in manufacturing recorded only a limited improvement over the last six months. However, employment expectations were more positive in March 2004 than in December of last year. By contrast, employment expectations in the Purchasing Managers' Index (PMI) weakened somewhat at the beginning of 2004. For the services sector, such expectations
improved in the fourth quarter and, according to the European Commission Survey, posted further gains in January and February 2004 before declining in March. The PMI paints a similar picture with a somewhat more marked deterioration at the beginning of 2004.
Table 2.8 Sectoral employment growth in the euro area
2001 2002 02Q3 02Q4 03Q1 03Q2 03Q3 Whole economy 1.4 0.5 0.0 0.0 0.0 0.1 0.0
Agriculture -0.6 -2.0 -0.6 -0.5 -0.7 -0.1 -0.3
Industry 0.4 -1.2 -0.4 -0.5 -0.3 -0.2 -0.6
- excl. constr. 0.3 -1.4 -0.4 -0.6 -0.4 -0.5 -0.5
- Constr. 0.5 -0.8 -0.4 -0.1 0.0 0.5 -0.7
Services 1.9 1.3 0.2 0.2 0.2 0.2 0.2
Quarterly ratesAnnual rates
3.2. Employment growth picking up The euro-area labour market is expected to benefit from the turnaround and pickup in overall economic activity, which took place in the second half of last year. After almost two years of stagnation, higher growth rates for employment are projected, while the unemployment rate should start to decelerate. Despite the upturn in economic growth, however, employment is expected to grow only by 0.3% in 2004. Several factors support this outlook. First, it takes time before an improvement in economic activity is reflected in the labour market. In view of the usual lagged response, no significant rise in employment should be expected before the second half of this year. This is important since a recovery in the labour market is, in turn, a prerequisite for a revival in private consumption and thus for a more broad-based recovery.Second, the acceleration of economic activity is expected to be fairly modest and insufficiently robust to create jobs on a large scale, in view of the weakness of domestic demand and the weak impetus from export growth. Should the strengthening of the euro continue, the tight control on labour costs, which are required by firms in order to remain competitive on both internal and export markets, would further delay the creation of new jobs.
30

Chapter 2 The economy of the euro area and the EU
Third, the reduction of surplus capacity and cost-cutting in the corporate sector have left their mark. And, although rising corporate earnings suggest that the worst is probably over, firms still need to increase their profits, fully restore their balance sheets and achieve stronger productivity gains before being able to take on new workers on a sustained basis. Overall, the moderate increase in employment would translate into only 0.4 million new jobs in the euro area, which would nevertheless represent a turnaround compared to 2003. The unemployment rate is projected to remain at 8.8% in 2004, unchanged vis-à-vis last year. Hence, the moderate increase in employment would be offset by a higher number of people without a job - 12.4 million in absolute terms - and a higher labour force participation rate. In parallel with the usual upswing in economic activity, labour productivity is expected to recover, reaching a year-on-year growth rate of around 1.4% in 2004, compared to 0.4% in 2003. In 2005, employment is expected to rise more strongly, thereby providing an impulse for stronger growth in domestic demand. Employment is projected to rise by 0.9%, implying that about 1.2 million new jobs will be created. Due to the more sustained pace of the recovery, the unemployment rate is seen to decline, albeit marginally, to 8.6% compared to the previous year. However, the stronger pace of economic activity is not expected to lead to a significant tightening of the labour market as better job prospects should trigger the entry of individuals into the labour force, which is projected to increase by 0.8%. By contrast, labour productivity growth is expected to average 1.4% also in 2005, reflecting the beneficial effect of output on employment.
The structural unemployment rate is estimated to be 8.7% this year and should ease further to 8.5% in 2005, thus continuing the downward trend started in 1997 when it was close to 10%. The employment rate, defined according to structural indicators as the share of the number of people aged 15-64 in the population of the same age group, is expected to reach a level of 63.1% in 2005, in line with its historical upward trend initiated in the middle of the eighties.
-2
-1
0
1
2
3
93 94 95 96 97 98 99 00 01 02 03 04 057
8
9
10
11
12yoy % ch. %
Graph 2.13: Employment growth and unemployment rate in the euro area
ForecastEmployment
Unemployment rate
The structural reforms undertaken over the past few years have made EU economies more resilient to shocks, but the employment goals of the Lisbon strategy have been seriously challenged by the strong impact of the economic downturn on the labour market situation. As the employment rate for the EU as a whole is projected at 64.6% for 2005, it is clear that the intermediate overall employment-rate target will be missed. Progress towards the 70% target for 2010 will depend crucially on the implementation of further labour market reforms.
Table 2.9
Labour market outlook - euro area (Annual percentage change) Spring 2004 Difference with
Autumn 20031991-95 1996-00 2002 2003 2004 2005 2004 2005
Population in working age (15-64) 0.4 0.2 0.2 0.2 0.2 0.2 0.0 0.0 Labour force 0.3 1.1 1.0 0.6 0.5 0.8 0.0 0.1 Employment -0.1 1.4 0.6 0.0 0.3 0.9 0.0 0.1 Employment (change in million) -2.5 8.4 0.8 0.0 0.4 1.2 0.1 0.1 Unemployment (levels in millions) 12.5 13.4 11.7 12.3 12.4 12.2 -0.3 -0.4 Unemployment rate (% of labour force) 9.6 9.9 8.4 8.8 8.8 8.6 -0.3 -0.3 Labour productivity, whole economy 1.7 1.1 0.3 0.4 1.4 1.4 -0.1 0.0 Employment rate (a) 58.6 59.5 62.4 62.4 62.6 63.1 0.6 0.6 p.m. Employment EU-15 -0.4 1.4 0.6 0.1 0.3 0.8 0.0 0.0
(a) As a percentage of population in working age. Definition according to structural indicators.
31

Economic Forecasts, Spring 2004
As regards labour market developments across the EU Member States, employment growth in Spain, Ireland and Luxemburg is expected to be stronger than in the euro area in both 2004 and 2005. Austria and Greece will also exceed the euro area average in 2004, and Belgium will be in this position in 2005. By contrast, employment is set to contract in the Netherlands this year, before rising again in 2005. In France, Germany and Finland employment is projected to remain broadly stable this year and to accelerate somewhat in 2005. Outside the euro area, employment is forecast to decline in 2004 in Sweden, while remaining broadly unchanged in Denmark and rising by about 0.3% in the UK. In 2005, the three countries should experience positive employment growth.
-3
-2
-1
0
1
2
3
4
5
92 93 94 95 96 97 98 99 00 01 02 03 04 05
yoy % ch.
Graph 2.14: GDP and labour productivity growth in the euro area
ForecastGDP
Labour productivity
In both 2004 and 2005, Germany, Greece, Spain and France are expected to record an unemployment rate at or above the euro-area average. By contrast, unemployment rates at 6% or below are anticipated for Ireland, Luxembourg, the Netherlands and Austria, as well as the three non-euro-area Member States.
3.3. Downside risks from excessive labour market resilience?
During the latest economic downturn (2001-2003), the euro area labour market showed greater resilience to the weakening of economic activity compared to past cycles. Despite below-trend economic growth since mid-2001, net job creation has remained positive. At the same time, the unemployment rate has worsened, although the rise has not been as great as might have been expected given the size and length of the downturn. Modest levels of economic activity for such
an extended period of time would normally result in a higher level of job destruction and in a sharper increase in the unemployment rate. The greater resilience of the euro-area labour market is partly the result of changes in the European labour market over the second half of the 1990s, which have facilitated the development of a more job-intensive economy and thus increased the job content of growth. These changes include a higher level of female participation in the labour market, a rising level of educational attainment of the workforce, greater availability of new types of working contracts, more employment-friendly wage setting, and cuts in non-wage labour costs. Of course, the strong deceleration of economic activity and the resilience of employment implied a marked reduction in average labour productivity which, in turn, materialised into deterioration in unit labour costs and firms’ profitability.While there is no apparent obstacle to the recovery of employment as economic activity picks up, it may happen, nevertheless, that the labour market exhibits the same slow reaction during the upswing as during the downturn with firms replacing labour with capital. This would be the case, for instance, if the euro area followed the US lead and productivity rose to such an extent as to have an adverse effect on the demand for labour. While productivity on an hourly basis is probably increasing more than productivity per person, as a result of the labour market reforms introduced in previous years, there is no indication to date that productivity is now rising at a much stronger pace than in the past.
32

4. Inflation falls below 2%
4.1. Recent developments
Limited easing of headline inflation in 2003
Despite falling below 2% in the middle of last year, HICP inflation remained slightly above this threshold for the remainder of the year. The turn of the year has shown more promise with a figure of 1.9% in January followed by a drop to 1.6% in February. The flash estimate for March is also 1.6%. However, the sharp decline in the recent headline figure is mainly due to special factors and does not fully reflect an improvement in the inflation outlook. Overall, despite a marked slowdown in real economic growth and the appreciation of the euro during 2003, the outlook for inflation has improved only marginally to date.
Temporary factors mattered…
Part of this disappointing development was due to the temporary influence of food and energy prices, the most volatile components of inflation. In particular, unprocessed food prices have boosted inflation since last summer and were up by 2.9% in January 2004. Processed food prices rose by 3.3% on average last year and this pace of increase was broadly confirmed by the January and February figures. Energy prices rose by 3.1% in 2003, while the contraction recorded in the first two months of 2004 was largely due to a strong base effect, since energy inflation was particularly high at the beginning of 2003.
…but core inflation was also resilient Core inflation has not improved either: it remained stable at around 2.0% in the second half of 2003 and was at the same level in February 2004. In the services sector, inflation has been particularly sluggish in recent years and prices have been running at an annual pace of 2.5% since last spring. While this development represents an improvement compared to the 3% recorded at the end of 2002, it also underlines the stickiness of inflation in the services sector. Among the different factors contributing to the downward rigidity of services inflation, low productivity growth and competition are widely recognized as important. The stickiness of wages, which in the services sector represent a relatively significant cost component, is also a crucial factor. By contrast, producer price inflation remained moderate in the euro area in the second half of 2003 and fell to an annual rate of 0.3% in January 2004. This means that the increase in producer prices was below 1.5% for the tenth consecutive month, indicating subdued price pressures at the producer level. The contrast between this decline and the stickiness in consumer prices also supports the view that the pass-through from movements in the exchange rate to euro-area consumer prices has proved to be weaker than expected.
Table 2.10
Inflation outlook - euro area (Annual percentage change) Spring 2004 Difference with
Autumn 20032000 2001 2002 2003 2004 2005 2004 2005
Private consumption deflator 2.2 2.3 2.3 1.9 1.8 1.6 -0.2 -0.1 GDP deflator 1.4 2.4 2.4 2.1 1.8 1.6 -0.2 0.0 HICP 2.1 2.4 2.3 2.1 1.8 1.6 -0.2 -0.1 Compensation per employee 2.8 2.9 2.7 2.8 2.4 2.3 -0.1 -0.3 Unit labour costs 1.4 2.6 2.4 2.4 1.0 1.0 0.0 -0.1 Import prices of goods 9.9 0.4 -2.1 -1.4 -1.2 0.6 -1.0 -0.5 p.m. HICP EU-15 1.9 2.2 2.1 2.0 1.8 1.7 -0.1 0.0
33

Economic Forecasts, Spring 2004
0
1
2
3
4
96 97 98 99 00 01 02 03 04 05
Core inflation
Graph 2.15: HICP and core inflation in the euro area
yoy % ch.
HICP inflationForecast
Inflation differentials narrowed
Over the last year, inflation differences within the euro area narrowed somewhat but there continues to be a broad spread of inflation rates across the constituent Member States. According to February 2004 figures, the harmonised inflation rate ranged from 0.4% in Finland to 2.6% in Greece. Headline inflation was above 2% in six out of the twelve euro area countries in February.
4.2. Better prospects ahead The recovery in the euro area is expected to be very moderate, with GDP growth set to reach potential towards the end of 2004. The negative output gap in both 2004 and 2005 and the related weak pressures from wage demands should keep domestic inflation low throughout the projection period. Inflation should also continue to benefit in 2004 from the effects of the euro appreciation. Overall, inflation in the euro area is expected to average 1.8% in 2004, twenty basis points lower than envisaged in the Autumn forecast. It is expected to ease further to 1.6% in 2005, slightly below the Autumn projection.
The short-term outlook for inflation benefits from the strong euro…
Headline inflation is forecast to average 1.7% in the first quarter of 2004 and to rise gradually to 1.9% in the third quarter of 2004, before resuming a downward trend to reach 1.6% by the end of the forecasting period. In the first part of 2004, inflation in the euro area is expected to benefit from the lagged effects of the significant past appreciation of the euro, especially against the dollar. This will help to keep import prices
low, containing rising energy prices in USD, thereby putting additional downward pressure on the overall inflation rate, on top of that stemming from the slackness in domestic demand. Consistent with this view, the import deflator for goods is projected to decline by 1.2% in 2004, after having declined by 1.4% in the previous year.
-3
-2
-1
0
1
2
3
02 03 04 05
Graph 2.16: GDP, import and export deflators in the euro area
yoy % ch.
GDP deflator
Import deflator (goods)
Export deflator (goods)
Forecast
… but external price pressure is expected to stay low
The technical assumption of a constant exchange rate implies that the beneficial effects of the currency appreciation will fade away slowly during 2004. However external price pressure is expected to remain fairly low over the whole forecast horizon. This implicitly assumes that the increased demand for commodities due to the world recovery will be matched by an increase in supply. For oil prices, in particular, this requires that there are no major disturbances to supply. Against this background, the implicit price index for imports is estimated to increase by only 0.6% in 2005. Hence, despite the reversal of the trend compared to the previous year, import prices are forecast to increase by less than the GDP deflator and the HICP index.
Weak domestic price impulses
On the domestic side, inflation pressures from the wage side are estimated to remain fairly subdued over the forecast period in view of several restraining factors. First, overall economic conditions are expected to be conducive to low inflation. This is mainly reflected by the size of the output gap, which is forecast to remain negative over the forecast period. According to the production function estimates, the output gap for the
34

Chapter 2 The economies of the euro area and the EU
euro area is set at 1.4% of potential GDP in 2004 and only marginally lower, at 1.2%, in 2005. Second, as a result of the persistent slackness of demand, the situation in the labour market will continue to be weak. The unemployment rate is projected to remain broadly stable over the forecast horizon, even showing a slight deterioration in 2004 compared to the previous year, before recovering somewhat in 2005. Net job creation is projected to continue, but the growth rate of employment, especially this year, is expected to be very small.
0
1
2
3
4
96 97 98 99 00 01 02 03 04 05
Forecast
yoy % ch.
Graph 2.17: HICP inflation and compensation per head in the euro area
HICP inflation
Compensation per head
Third, given the persistence of weak economic conditions in the euro area and the lagged reaction of the labour market to the upswing, it seems unlikely that wages will represent a significant source of inflationary pressures. Consistent with this view, wage moderation is expected to continue in the near term. The growth rate of nominal compensation of employee per head is projected to fall to 2.4% in 2004 (and 2.3% in 2005), down from an average increase of 2.8% in the previous three years. Since the projected decline in inflation is similar, the growth rate in real compensation per head is set to remain broadly unchanged compared to the recent past. The projected increase is 0.6% in 2004 and 0.7% in 2005. At the same time, the mark-up indicator, as proxied by the difference between the growth rate of the GDP deflator and that of unit labour costs, is expected to return to positive territory over the next two years, growing by 0.8% in 2004 and 0.7% in 2005. Fourth, unit labour costs rose above trend in recent years as growth of compensation increased and labour productivity fell. With the recovery gaining momentum, the cyclical pick-up of labour productivity, from 0.5% in 2003 to around 1.4% over the forecast period, will allow a deceleration of unit labour costs, which are expected to rise by 1% in both 2004 and 2005.
Inflation expectations in line with forecasts
Short-run inflation expectations, as measured by the Commission Consumer Survey, have been coming down for most of 2003; the Survey indicator fell from a level of 16 in March to a level of 3 in December. Although such expectations picked up somewhat at the beginning of 2004 to stand at 6 in March, the current level remains well below the long-term average (1985-2003) of 24. Long-term inflation expectations as measured by index-linked bonds (with an 8-year maturity) are also on a downward trend. Lastly, according the results of the Survey of Professional Forecasters conducted by the ECB in January 2004, inflation in 2004 is expected to average 1.8% in 2004 in the euro area and to ease to 1.7% in 2005. In turn, these figures are broadly in line with those reported in the March issue of Consensus Economics, which anticipates an inflation rate of 1.7% in 2004 and 1.9% in 2005.
1.5
2.0
2.5
3.0
3.5
01 02 03 04-10
0
10
20
30
40
50
Graph 2.18: HICP inflation and inflation expectations in the euro area
yoy % ch.
Inflation expectations (rhs)
HICP inflation (lhs)
balance
35

Economic Forecasts, Spring 2004
Inflation differentials remain Inflation rates differ across euro-area Member States substantially. In 2004, the lowest inflation rate is forecast for Finland (0.4%) and the highest rate for Greece (3.4%). Four euro area Member States are projected to have an inflation rate above 2% in 2004: Greece, Spain, Ireland and Italy. Outside the euro area, inflation is foreseen at 1.6% in the UK, 1.5% in Denmark and 1.2% in Sweden. In 2005, the highest inflation rates are anticipated for Greece (3.5%), Spain and Ireland (2.3%) and Portugal (2.2%). For the remaining countries, including non-euro-area Member States, an inflation rate below 2% is projected.
-2
-1
0
1
2
3
4
5
6
7
96 97 98 99 00 01 02 03 04 05
Maximum
Minimum
HICP
yoy % ch.
Forecast
Graph 2.19: Inflation differentials in the euro area
36

5. Diverse fiscal developments
5.1. No improvement in general government positions
After continuing their deterioration in 2003, the budgetary outcomes are expected to remain unchanged in 2004, for both the euro area and the EU as a whole, at 2.7% and 2.6%, respectively. Among the fifteen Member States, only five are expected to have budgetary positions in surplus or close to balance in 2004. These are Belgium, Spain, Finland, Denmark and Sweden. In the euro area, six countries are forecast to have deficits exceeding 3% of GDP, namely Germany, Greece, France, Italy, the Netherlands, and Portugal. In 2005, on an unchanged policy basis, only slight improvements in the general government balance are foreseen (of 0.1 pp and 0.2 pp for the euro area and the EU, respectively). France, Italy, Portugal and the Netherlands would continue to have a deficit above 3% of GDP.
-1.0
-0.5
0.0
0.5
1.0
-2.0 -1.5 -1.0 -0.5 0.0 0.5 1.0 1.5 2.0
Pro-cyclical fiscal t ightening
Pro-cyclical fiscal loosening
Counter-cyclical fiscal tightening
Counter-cyclical fiscal loosening
Graph 2.20 : Euro area fiscal stance and cyclical conditions
Cyclical conditions: output gap
Fiscal stance: change in CAPB
2001
2002
2003
2004
Compared with the updates of the Stability and Convergence Programmes, the Commission forecasts in general show a deterioration in the outlook for public finances. For 2005, apart from differences in growth
profiles, this could be explained by the fact that the Commission’s forecasts are based on the “no policy change” assumption, while the projections in the updates of the Stability and Convergence Programmes are based on announced policies, not all of which have yet been translated into specific measures. The sharp deterioration in the primary balance in the euro area, from a surplus of 4.2% of GDP in 2000 to 0.8% of GDP in 2003, is not expected to be reversed in 2004 (0.7% of GDP) and 2005 (0.8% of GDP). The cyclically-adjusted primary balance (CAPB) in the euro area is forecast to remain unchanged at 1.2% of GDP in both 2004 and 2005 (1.3% of GDP in 2003). This would imply a neutral fiscal stance over the forecast period.
The debt situation
In 2003, gross debt as a percentage of GDP increased in several countries, bringing the debt-to-GDP ratio for the euro area to 70.4% from 69.2% in 2002. In 2004, this ratio is expected to increase further, to 70.9% of GDP. This is, to a large extent, the result of the rising debt ratios foreseen in Germany and France (from 64.2% to 65.6% in the former and 63% to 64.6% in the latter). Among the high debt countries, Belgium will continue to see its debt-to-GDP ratio decline below 100%. By contrast, on current policies, the debt ratio would halt its decline in Italy and remain, at 106% of GDP, the highest in the euro area and the EU. In Greece, subject to a special caveat related to the corresponding deficit figures, the debt ratio is expected to decline only slightly over the forecast period (from 103% to 101.7% of GDP). Reflecting the differences in the deficit projections, the debt-to-GDP ratios for the euro area and the EU are slightly lower, according to the 2003 updates of the Stability and Convergence Programmes, than in the Commission’s forecasts in both 2004 and 2005. For the euro area, a debt-to-GDP ratio of 70.9% is forecast for both 2004 and 2005. The corresponding figure for the EU as a whole is 64.2%.
37

Economic Forecasts, Spring 2004
Composition of government accounts
The widening of the general government deficit in 2003 was mainly due to an increase in expenditure. In the euro area, expenditure increased from 48.4% of GDP in 2002 to 49% of GDP, while revenues rose at the same time by 0.2 percentage point to reach 46.3% of GDP in 2003. For the forecast period, revenues are expected to decline to 45.8% of GDP in 2004 and 45.5% of GDP in 2005 in the euro area. The expenditure-to-GDP ratio in the euro area is forecast to decline in both 2004 and 2005 in terms of GDP to 48.6% and 48.1% respectively.Over the forecast period, interest expenditure in the euro area is expected to remain broadly unchanged, moving from 3.5% of GDP in 2003 for the euro area to 3.4% of GDP in both 2004 and 2005.
5.2. Countries with high deficits In addition to Germany and France, the Netherlands and the United Kingdom saw their budget deficits exceed the 3% of GDP threshold in 2003. On current policies, the deficits are foreseen to remain above 3% of GDP in all these countries in 2004, with the exception of the UK.
In Italy, the deficit in 2003 was 2.4% of GDP, almost unchanged compared to 2002 (2.3%). The deficit increase was curbed through recourse to one-off measures. Reflecting the expiration of such one-off measures, the deficit is foreseen to rise above 3% of GDP from 2004. The effect of one-off deficit-reducing measures on 2003 also accounts for the reduction of the deficit below 3% of GDP in 2003 in Portugal and its rebound above it from 2004. Finally, the budget deficit is foreseen in 2004 to exceed the 3% of GDP threshold also in Greece. The forecast is based on the sharply revised 3.0% of GDP deficit for 2003 communicated by the government, which is currently being scrutinised by Eurostat and subject to possible further revisions. In 2005, on the basis of unchanged policies, the deficit is foreseen to rise further in Portugal and Italy. It should decline slightly, while remaining above the 3% of GDP threshold, in France and the Netherlands. For Germany, the fall should take the deficit below 3% of GDP.
Table 2.11
General government budgetary position - euro area (% of GDP) Spring 2004 Difference with
Autumn 20032000 2001 2002 2003 2004 2005 2004 2005
Total receipts (1) 47.3 46.6 46.1 46.3 45.8 45.5 0.1 0.1 Total expenditure (2) 47.1 48.2 48.4 49.0 48.6 48.1 0.2 0.1
Actual balance (3) = (1)-(2) 0.1 -1.6 -2.3 -2.7 -2.7 -2.6 0.0 0.1 Interest (4) 4.1 4.0 3.6 3.5 3.4 3.4 0.0 0.0 Primary balance (5) = (3)+(4) 4.2 2.3 1.4 0.8 0.7 0.8 0.0 0.0 UMTS 1.1 0.0 0.0 0.0 0.0 0.6 0.0 0.0 Cyclically adjusted balance (6) -1.8 -2.3 -2.5 -2.2 -2.2 -2.2 0.0 0.0 Cyclically adj. prim. balance = (6)+(4) 2.2 1.6 1.2 1.3 1.2 1.2 -0.1 0.0
Change in actual balance : 1.4 -1.7 -0.7 -0.4 0.0 0.1 -0.1 0.1
Due to - Cycle 0.6 -0.3 -0.5 -0.7 -0.1 0.1 0.0 0.0- UMTS 1.1 -1.1 0.0 0.0 0.0 0.6 0.0 0.0- Interest 0.2 0.1 0.4 0.1 0.1 0.0 -0.1 0.0- Cycl. adj. primary balance -0.4 -0.6 -0.4 0.1 -0.1 0.0 -0.2 0.1
Gross debt 70.4 69.4 69.2 70.4 70.9 70.9 0.2 0.2 p.m. Actual balance EU-15 1.0 -1.0 -2.0 -2.6 -2.6 -2.4 0.0 0.0
p.m. Primary balance EU-15 4.8 2.6 1.3 0.6 0.5 0.7 0.0 0.0 p.m. Cycl. adj. prim. balance EU-15 2.6 2.0 1.2 1.0 1.0 1.1 -0.1 -0.1
Note : Total expenditure, actual and primary balances include UMTS, while cyclically adjusted figures exclude UMTS proceeds.
38

Chapter 3 Member States
39

1. Belgium Moderate recovery ahead
The situation in 2003
After two years of economic growth below 1%, the Belgian economy staged a recovery in the second half of 2003. Real GDP is estimated to have grown by 1.1% in the whole year, a figure higher than those of the neighbouring countries. In 2003 economic growth was led by domestic demand whereas the external contribution was markedly negative, owing to low external demand and losses in competitiveness against non-EU countries. Private consumption increased by 1.7% and hence considerably faster than disposable income, which rose by 0.7%. This development is reflected in a substantial decline in the households’ savings rate spurred by a steady improvement in consumer confidence and possibly some catching-up, after two years of quite subdued consumption. Investment recovered from -2.5% in 2002 to 1.8% in 2003, under the impact of better business expectations, improving profit margins and continuous low cost of capital. Employment fell again last year, by 0.5%, as it has been reacting with a lag to the economic downturn. Despite the exchange rate appreciation and weak final demand, inflation remained somewhat resilient in the downturn. HICP inflation fell by only one decimal point in 2003, to 1.5%.
Prospects for 2004 and 2005
The recovery that started in the second half of 2003 is expected to strengthen moderately in 2004 and 2005,
mainly driven by stronger external demand.
It is assumed that the households’ savings rate would stabilise in the forecast period. However, the significant increase in real disposable income would secure a continued growth of private consumption in 2004 and 2005. The increase in disposable income, somewhat stronger in 2005 than in 2004, is due to higher wage increases, the income tax reform and a more favourable employment development.
Given the strengthening of final demand and historically low interest rates, investment would accelerate further. However, the rate of capacity utilisation is still relatively low and the expansion of investment is likely to remain modest, at least in 2004.
Hence, in 2004 and 2005 both domestic and external demand would contribute to growth in a more balanced way than in 2003.
Labour market, costs and prices
Employment has fallen steadily since mid 2001, leading to an increase in the unemployment rate by 2 percentage points, to 8.5% in February 2004. Employment should increase in 2004 and more substantially in 2005, which would result in a decline in the unemployment rate in 2005. This is due to the recovery and is supported by reductions in social contributions and continued moderate wage increases. The latest inter-sectoral wage agreement, covering 2003 and 2004, set wage cost increases considerably lower than in previous years. It has fixed an upper limit of 5.4% cumulated for both years, but given the slack in the labour market, the reductions in social contributions and lower-than-expected inflation this limit is unlikely to be reached. In this context of relatively modest unit labour cost increases, the impact of the appreciation of the euro, low interest rates and the abolition/reduction of the radio and television license fees is expected to keep inflation low in 2004. The effect of the exchange rate appreciation should fade out in 2005, at the same time as unit labour costs increase faster, the economy approaches potential output and the effect of reduced radio and TV fees is exhausted. All in all, this would translate into slightly higher inflation in 2005.
-1,2
-1,0
-0,8
-0,6
-0,4
-0,2
0,0
0,2
0,4
03 04 05
% of GDP Forecast
Graph 3.1: Belgium - General government budget balance
Net lending (borrowing)excluding one-off measures
Net lending (borrowing) EDPincluding one-off measures
40

Chapter 3 Member States, Belgium
Public finances
The general government accounts are estimated to have posted a surplus of 0.2% of GDP in 2003. However, this surplus was only possible due to substantial one-off measures, amounting to 1.2% of GDP in net terms. For 2004, a deficit of 0.5% of GDP is forecast. However, this figure also takes into account one-off measures of about 0.5% of GDP (the temporary tax regulation is not included). Thus, there is an underlying (excluding one-off measures) deficit of 1% of GDP in 2004, despite the cyclical improvement. This development is due to the continued impact of the income tax reform, reduced social contributions and a rapid increase in health costs. These factors also have an impact on the budget in 2005. However, thanks to a better cyclical position and a still-lower interest expenditure, the deterioration in the budget deficit in 2005 is expected to be contained. A more pronounced deterioration would
however take place in terms of the cyclically adjusted balance in 2005.
The debt ratio is projected to fall this year and next, coming below 100% already in 2004. However, there is some uncertainty in this respect as the value of the debt of the SNCB (Railway Company) that the authorities would take over next year is still unknown and this operation has therefore not been taken into account.
Table 3.1 Main features of country forecast - BELGIUM
2002 Annual percentage changebn Euro Curr. prices % GDP 1981-99 2000 2001 2002 2003 2004 2005
GDP at constant prices 260.0 100.0 2.0 3.8 0.6 0.7 1.1 2.0 2.5 Private consumption 141.5 54.4 1.9 3.4 0.8 0.4 1.7 1.5 2.0 Public consumption 58.1 22.3 1.3 2.7 2.7 1.9 1.8 1.7 1.2 GFCF 51.6 19.8 1.9 4.4 0.3 -2.5 1.8 2.3 4.7 of which : equipment 23.8 9.2 - 5.0 0.6 -2.7 -0.5 2.0 4.0 Change in stocks as % of GDP -0.6 -0.2 -0.1 0.4 -0.2 0.4 1.0 0.9 0.8 Exports (goods and services) 218.0 83.9 4.5 8.4 1.3 1.0 1.6 3.7 5.0 Final demand 468.6 180.2 2.8 5.9 0.8 0.9 2.0 2.6 3.6 Imports (goods and services) 208.5 80.2 4.1 8.5 1.1 1.2 3.1 3.4 4.9 GNI at constant prices (GDP deflator) 266.0 102.3 2.1 3.7 0.4 1.3 -1.2 2.0 2.5 Contribution to GDP growth : Domestic demand 1.8 3.4 1.1 0.1 1.7 1.7 2.3
Stockbuilding 0.0 0.3 -0.6 0.7 0.6 -0.1 -0.1Foreign balance 0.3 0.2 0.2 -0.1 -1.2 0.4 0.2
Employment 0.4 1.9 1.5 -0.3 -0.5 0.3 1.0 Unemployment (a) 9.1 6.9 6.7 7.3 8.1 8.3 7.9 Compensation of employees/head 4.4 2.1 3.6 4.3 2.3 2.8 3.0 Unit labour costs 2.8 0.2 4.5 3.2 0.7 1.1 1.5 Real unit labour costs -0.5 -1.0 2.6 1.5 -1.3 -0.5 -0.1 Savings rate of households (b) - - 15.4 16.2 15.4 15.4 15.4 GDP deflator 3.2 1.2 1.8 1.7 2.0 1.7 1.6 Private consumption deflator 3.1 2.3 2.5 1.7 1.8 1.5 1.7 Harmonised index of consumer prices - 2.7 2.4 1.6 1.5 1.5 1.6 Trade balance (c) 0.3 2.1 2.5 3.0 2.4 2.6 2.4 Balance on current transactions with ROW (c) 2.3 4.0 4.0 5.1 3.7 4.1 4.2 Net lending(+) or borrowing(-) vis-à-vis ROW (c) 2.2 3.9 3.9 4.9 3.5 4.0 4.1 General government balance (c)(d)(e) -6.5 0.2 0.5 0.1 0.2 -0.5 -0.7 General government gross debt (c) 124.1 109.1 108.1 105.8 100.5 97.4 94.3 (a) as % of civilian labour force. (b) gross saving divided by gross disposable income. (c) as a percentage of GDP. (d) Including proceeds relative to UMTS licences (see for more details note 10 on concepts and sources). (e) The figures include one-off measures at the amount of 1.2% of GDP in 2003, 0.5% in 2004 and -0.1% in 2005.
41

2. Denmark Steady recovery after zero growth
The economy in 2003
Economic activity in Denmark stagnated in 2003, and GDP growth for the year as a whole was zero. With two quarters of negative growth in the middle of the year, the economy was indeed in a technical recession. During the first three quarters of 2003, private consumption was sluggish, with significant falls in car sales. Business investments saw a sharp downturn in the second quarter, which can be linked to the geopolitical uncertainties, followed by a rebound in the third quarter. In the light of weak external demand and the effective appreciation of the krone, Danish exports were subdued.
The fourth quarter brought a changed picture. Domestic demand increased vigorously, led by private consumption which rose by 1¾% per cent on the quarter. Equipment and construction investments also expanded robustly, while software investments fell. Overall, the recovery in investments in the last part of the year was insufficient to stop total investments from falling markedly for the year as a whole. Exports also started to pick up in the fourth quarter. The recovery of domestic demand in the fourth quarter, was, however, largely offset by a markedly negative growth contribution from net exports, as imports grew strongly. The year thus ended on an overall positive note, paving the way for an assumed improved growth picture in 2004 and 2005.
Prospects in 2004 and 2005
Continuing the upswing from the end of 2003, private consumption should lead domestic demand to a marked recovery of economic activity in 2004. A number of factors contribute to boosting disposable incomes this year, laying the ground for a recovery of consumption: the full income tax cuts of the tax reform, the suspension of contributions to a mandatory savings scheme and reductions of excise duties on alcohol, tobacco and soft drinks. In addition, the very low inflation will enhance real disposable income and interest rates are set to remain low. Against this background, private consumption, which has been subdued for a number of years, is expected to grow vigorously, in particular in 2004.
With industry confidence indicators pointing upwards, business investments should continue the recovery in the first half of 2004, albeit growing slightly less than overall production for the year as a whole. On the back of increased overall demand, investment growth should then gather strength gradually in 2005.
As global markets are set to expand in the forecast period, Denmark's exports are foreseen to recover in 2004, but to grow less than export markets, resulting in a loss of market shares. Danish exports of goods are thus expected to grow by some 3% in 2004, increasing to 4¼% in 2005. Imports are foreseen to rise somewhat more than exports in 2004 and 2005, implying, respectively, a slightly negative and slightly positive contribution to GDP growth from net exports in the two years. All in all, the recovery of domestic demand should provide for a GDP growth of just above 2% in 2004 and 2005.
Labour market, costs and prices
The labour market weakened in 2003 as GDP growth stagnated. Employment fell markedly and unemployment increased to around 6 per cent of the labour force. As the expansion of economic activity gathers momentum in 2004, employment is set to increase again, but only with some lag. Unemployment should therefore peak in the second half of 2004, and decline gradually over the rest of the forecast period.
-1
0
1
2
3
4
5
6
7
94 95 96 97 98 99 00 01 02 03 04 05
Graph 3.2: Denmark - GDP growth and private consumtion growth
yoy % ch.
GDP
Private consumption
42

Chapter 3, Member States, Denmark
In a context of increasing slack on the labour market, statutory wage growth coming out the private sector wage negotiations in early 2004 point to a somewhat decelerating wage growth. However, wage growth is still higher than in the euro area.
The average HICP inflation in Denmark in 2003 was 2%. Towards the end of the year, consumer price inflation decelerated markedly and in early 2004, annual inflation was below 1%. This development is mainly due to falling import prices and energy prices. In addition, the reduction of excise duties on alcohol, tobacco and soft drinks in late 2003 will contribute to lower consumer price inflation in 2004. With some slack in the economy, inflation should overall continue to be low in the forecast period, with an average HICP rate of 1½% in 2004. However, inflation is set to increase somewhat at the end of the period as the effects of falling import prices and the cuts in excise duties disappear.
Public finances
In spite of the weak economic activity in 2003, the general government balance recorded a surplus of 1½% of GDP. In 2004, the general government surplus-to-GDP ratio is forecast to decline somewhat. The positive effects on revenues from increased GDP growth are largely offset by lower tax revenues due to the implementation of the tax reform. Expenditure related to unemployment will increase for the year as a whole. In 2005, a slightly higher general government surplus is foreseen as GDP growth is somewhat stronger and public expenditure reduced as the situation on the labour market improves. The government gross debt, which stood at 45% of GDP at the end of 2003, is set to fall to some 40% of GDP by 2005.
Table 3.2 Main features of country forecast - DENMARK
2002 Annual percentage changebn DKK Curr. prices % GDP 1981-99 2000 2001 2002 2003 2004 2005
GDP at constant prices 1360.7 100.0 1.9 2.8 1.6 1.0 0.0 2.1 2.2 Private consumption 641.9 47.2 1.5 -0.7 -0.2 0.6 1.1 3.4 2.7 Public consumption 358.5 26.3 1.5 0.9 2.7 2.1 1.2 0.9 0.5 GFCF 282.7 20.8 2.8 7.1 4.9 4.5 -2.9 2.0 3.4 of which : equipment 116.2 8.5 4.0 8.4 7.0 6.5 -1.2 1.6 3.6 Change in stocks as % of GDP 0.7 0.1 0.4 0.9 0.2 0.2 0.1 0.1 0.0 Exports (goods and services) 602.7 44.3 4.6 13.4 4.4 4.8 0.1 3.4 4.1 Final demand 1886.5 138.6 2.4 5.7 2.1 2.9 0.1 2.7 2.8 Imports (goods and services) 525.8 38.6 4.6 13.5 3.4 7.3 0.4 4.2 4.2 GNI at constant prices (GDP deflator) 1340.0 98.5 1.9 1.5 2.3 0.9 0.2 2.1 2.3 Contribution to GDP growth : Domestic demand 1.7 1.4 1.7 1.9 0.1 2.3 2.2
Stockbuilding 0.0 0.9 -0.7 0.0 0.0 0.1 -0.1Foreign balance 0.2 0.5 0.6 -0.8 -0.1 -0.2 0.1
Employment 0.4 0.5 0.4 -0.6 -1.3 0.1 0.6 Unemployment (a) 6.9 4.4 4.3 4.6 5.6 5.8 5.3 Compensation of employees/head 5.2 3.7 5.0 3.6 3.6 3.5 3.5 Unit labour costs 3.6 1.4 3.7 2.0 2.2 1.5 1.9 Real unit labour costs -0.5 -1.6 1.6 0.4 0.1 -0.6 -0.1 Savings rate of households (b) - - 7.0 8.2 8.6 8.2 8.3 GDP deflator 4.2 3.0 2.1 1.6 2.1 2.1 2.0 Private consumption deflator 4.2 2.6 2.5 2.1 1.8 1.8 1.7 Harmonised index of consumer prices - 2.7 2.3 2.4 2.0 1.5 1.8 Trade balance (c) 1.5 4.1 4.6 4.3 3.6 3.5 3.3 Balance on current transactions with ROW (c) -0.9 1.5 3.1 2.0 2.9 2.9 3.2 Net lending(+) or borrowing(-) vis-à-vis ROW (c) -0.9 1.4 3.0 2.1 2.9 2.9 3.0 General government balance (c)(d) -1.6 2.6 3.1 1.7 1.5 1.1 1.5 General government gross debt (c) 63.2 50.1 47.8 47.2 45.0 42.3 40.0 (a) as % of civilian labour force. (b) gross saving divided by gross disposable income. (c) as a percentage of GDP. (d) Including proceeds relative to UMTS licences (see for more details note 10 on concepts and sources).
43

3. Germany The economy has started to grow again
The situation in 2003
Growth in Germany has turned mildly positive in the second half to 2003, after a slight contraction in the first half of the year. Following the typical pattern of German recoveries, an acceleration in export growth provided a strong impulse likely to end the three-year-long stagnation, despite a still anaemic or even falling final domestic demand. While private consumption continued to decline into the fourth quarter, a brightened outlook has led to a remarkable turnaround in equipment investment, which after falling by one-fifth over the last three years started heading up again.
The end-of-year pick-up was, however, too weak for overall GDP growth to resume in 2003. It edged down by 0.1%, as a result of a sizable decline in both final domestic demand and net exports that was largely offset by a strong contribution from stocks.
Prospects for 2004 and 2005
Despite the negative overall growth in 2003, the year witnessed a number of changes that justify a more optimistic outlook for 2004. Germany’s exports benefit strongly from an accelerating world economy. Export demand has so far not been visibly dampened by the strong euro. Economic sentiment indicators, as well as the stock market, reflect a significantly more positive outlook than several months ago, although expectations have recently been toned down to fall closer in line with the present situation.
On this basis, a gradual recovery should take hold
over the next two years. Growth will gather momentum only gradually, as constraints start to ease. GDP growth is projected at 1.5% in 2004 and 1.8% in 2005. These figures understate the expected acceleration, because the profile is dominated by a positive calendar effect of ½ percentage point in the current leap year, which will be partly reversed next year.
At least initially, strong export demand should be the main driver, as order volumes for investment goods rose strongly. It is to be expected, however, that the strong euro will dampen export demand starting from the middle of the year. After that, export growth may be outstripped by imports, as an accelerating domestic demand replaces the external contribution as the main source of growth.
Domestic demand growth is likely to be broad-based. Equipment investment, which in recent years was largely confined to replacement, is picking up strongly and even the notoriously depressed construction sector will benefit somewhat from activity carried forward in anticipation of a subsidy being phased out.
Private consumption is also expected to resume, after bleak economic prospects led households to hold back spending even beyond the stagnation in real disposable income. The income tax reductions in January 2004 and 2005, rising consumer confidence and a sizable pent-up demand should be conducive to the expected turn-around in consumption. While reforms in the labour market, pensions and the health care sector might dampen the drive for consumption, such reforms should nevertheless prove crucial in supporting the economic upswing, as they increase industrial confidence, lower the social contribution burden and increase flexibility in an anaemic labour market.
Labour market, costs and prices
Already, labour market reforms have led to a sizable creation of mini-jobs and will become more effective as the economy picks up momentum. The creation of a low wage sector should also have positive spill-over effects on the rest of the economy. Related to this and to the high level of unemployment, the increase in effective wages will continue to be moderate and in line with productivity increases. Domestic inflationary pressure will therefore be very low, and
-1.2
-0.4
0.4
1.2
2.0
2.8
3.6
92 94 96 98 00 02 04-6
-3
0
3
6
9
12
15
18
GDP (lhs)
Exports goods & services(rhs) % yoy
Ifo expectations (rhs) (Index, rebased) 2004 only Jan-Mar
Graph 3.3 : Germany - GDP, exports and expectations
yoy % ch.
44

Chapter 3 Member States, Germany
Germany would continue to gain in price competitiveness vis-à-vis its European trading partners. This, together with a drop in import prices, should keep headline inflation below 1% annually were it not for special factors like the impact of the health care reform and increases in tobacco taxes.
Public finances
In 2003 the general government deficit widened from 3.5% to 3.9% of GDP, mainly due to growth turning out lower than expected. This was countered to some extent by consolidation measures introduced in 2003. In particular, social security contributions were raised and benefits to public sector employees were cut.
Legislation adopted in 1999 and 2000 committed Germany to several steps of income tax relief until 2005. The two steps taking effect in 2004 and 2005 will be partly counter-financed by a broadening of the tax base.
Within the reform programme “Agenda 2010” designed by the German government and following
the negotiations of the parliamentary Mediation Committee, a package of consolidation measures for the social transfer systems as well as cuts in subsidies and other transfers to households were passed into law in 2003. As their implementation will be continuing into 2005, the government expenditure share is predicted to be falling in 2004 and 2005.
Budgetary risks in 2004 mainly derive from some one-time measures such as the tax amnesty that might be less successful than planned, the postponed road toll for lorries and an unexpectedly low Bundesbank profit. The budgetary risks for 2005 result mainly from growth possibly being lower than expected by the German authorities. In 2004, the deficit will continue to be well above 3% of GDP. In 2005, the deficit is expected to fall below the reference value by a small margin. If growth turns out lower than forecast or if the structural measures do not have the expected budgetary effects, Germany clearly risks breaching, on unchanged policies, the 3% of GDP ceiling once more.
Table 3.3 Main features of country forecast - GERMANY
2002 Annual percentage changebn Euro Curr. prices % GDP 1981-99 2000 2001 2002 2003 2004 2005
GDP at constant prices 2110.4 100.0 2.1 2.9 0.8 0.2 -0.1 1.5 1.8 Private consumption 1236.5 58.6 2.0 2.0 1.4 -1.0 -0.1 0.9 2.2 Public consumption 404.4 19.2 1.6 1.0 1.0 1.7 0.9 0.2 -0.1 GFCF 392.0 18.6 1.6 2.7 -4.2 -6.7 -2.9 2.7 3.3 of which : equipment 151.9 7.2 1.8 10.1 -4.9 -9.1 -3.0 4.9 7.5 Change in stocks as % of GDP -13.2 -0.6 0.0 -0.4 -1.2 -1.1 -0.4 -0.4 -0.2 Exports (goods and services) 757.6 35.9 5.3 13.7 5.6 3.4 1.2 6.8 5.6 Final demand 2777.4 131.6 2.6 4.6 0.8 -0.3 0.5 2.7 3.2 Imports (goods and services) 667.0 31.6 4.7 10.5 0.9 -1.7 2.6 6.6 7.4 GNI at constant prices (GDP deflator) 2108.8 99.9 2.0 3.1 0.9 0.5 -0.5 1.3 1.7 Contribution to GDP growth : Domestic demand 1.8 1.9 0.1 -1.7 -0.5 1.1 1.9
Stockbuilding 0.0 -0.1 -0.8 0.1 0.7 0.0 0.2Foreign balance 0.3 1.1 1.6 1.7 -0.4 0.4 -0.3
Employment 0.6 1.8 0.4 -0.6 -1.1 -0.1 0.7 Unemployment (a) 6.9 7.8 7.8 8.6 9.3 9.1 8.8 Compensation of employees/head 3.4 2.1 1.7 1.5 1.6 1.6 1.9 Unit labour costs 1.9 1.0 1.3 0.7 0.6 0.0 0.8 Real unit labour costs -0.6 1.2 0.0 -0.8 -0.4 -1.1 -0.1 Savings rate of households (b) - - 15.8 16.2 16.5 16.4 15.9 GDP deflator 2.6 -0.3 1.3 1.6 1.0 1.1 0.9 Private consumption deflator 2.5 1.5 1.6 1.3 1.0 1.3 1.1 Harmonised index of consumer prices - 1.4 1.9 1.3 1.0 1.3 1.1 Trade balance (c) 3.7 3.1 4.9 6.3 6.2 6.6 6.4 Balance on current transactions with ROW (c) 1.0 -1.1 0.6 3.1 2.6 2.9 2.4 Net lending(+) or borrowing(-) vis-à-vis ROW (c) 1.0 -0.4 0.6 3.1 2.5 2.7 2.3 General government balance (c)(d) -2.4 1.3 -2.8 -3.5 -3.9 -3.6 -2.8 General government gross debt (c) 46.3 60.2 59.4 60.8 64.2 65.6 66.1 (a) as % of civilian labour force. (b) gross saving divided by gross disposable income. (c) as a percentage of GDP. (d) Including proceeds relative to UMTS licences (see for more details note 10 on concepts and sources).
45

4 Greece Despite strong growth, progress in fiscal consolidation is postponed
Economic activity in 2003
The economy continued to be buoyant in 2003, with real GDP growth estimated at 4.2%. Growth was driven by domestic demand, in particular investment in construction, linked to the preparation of the 2004 Olympic Games and assisted by financial flows from the EU Structural Funds. Private consumption, buttressed by easy monetary conditions and an improvement in disposable income, has also been a significant contributor to GDP growth. Owing to a sharp acceleration of imports, the current account deficit appears to have widened further in 2003, although export activity has started to recover.
The unemployment rate, still among the highest in the EU, was slightly reduced as employment growth started to respond to booming economic activity in recent quarters. Compensation per head slowed down partly due to the implementation of the 2002 wage agreement in the private sector. Inflation developments in 2003 point to the non-tradable sector and weather-related price increases in unprocessed food as the main sources of price pressures. Consumer prices growth averaged 3.5% in the year.
Prospects for 2004 and 2005
The economy is expected to continue to grow at fast rates in 2004 while a deceleration in economic activity is projected for 2005. The main factors that will contribute to growth in 2004 are still strong domestic demand and the recovery of the European
economy. Private consumption, supported by easy monetary conditions, is expected to continue to grow at a sustained pace to the forecast horizon, as a result of an increase in disposable income due to the 2002 tax reforms and the 2003 social package. Investment should continue to increase, albeit at a slower rate than in 2003, as investment associated with the Olympic Games will still be realized in the first half of 2004. However, the expected improvement of the international environment from 2004, the assumed low interest rates and continued financial flows from the EU Structural Funds may help in keeping economic activity relatively buoyant throughout the forecasting period.
The current account deficit is expected to narrow temporarily in 2004 as exports, in particular of services, are expected to increase considerably due to the international economic recovery and the Olympic Games. On the other hand, imports should slow down due to a relative deceleration of investment. Nonetheless, private consumption is expected to continue to be sustained by positive increases in disposable income and low interest rates, implying strong import growth throughout the forecasting period. As a result, the negative contribution of the external balance should narrow in 2004 but increase again in 2005, due to underlying macroeconomic imbalances and competitiveness losses.
Costs and prices
Consumer prices are expected to rise at a fast pace, with consumer price inflation (national definition) averaging marginally below 3.5% until the end of the forecasting period. While the contribution of imported inflation should remain small, wage developments are quite uncertain, as the negotiations for the new collective wage agreement have just started. The generous wage increases in the public sector may adversely affect the outcome of the negotiations. Finally, the output gap, albeit narrowing, is expected to remain positive.
Public finances
Despite strong growth, the situation of public finances worsened considerably as implementation of the 2003 State budget was completely off track.
-12-10
-8-6-4
-2
02468
95 96 97 98 99 00 01 02 03 04 0596
98
100
102
104
106
108
110
112
114
Deficit: gen.gov.Deficit excl. interest: gen. gov.CabConsolidated gross debt
Forecast
Graph 3.4: Greece - Net lending & consolidated gross debt
% of GDP % of GDP
46

Chapter 3 Member States, Greece
Although partly attributable to some extraordinary factors (the preparation of the Olympic Games, compensation for weather damage), the overshooting compared with the budget target suggests a lack of control over primary spending (social transfers and public sector wages) while budget revenues also fell short of projections.
The estimated budgetary outcome in 2003 is characterised by great uncertainty, with obvious implications for the making of 2004 budgetary projections. In a first EDP notification (1 March 2004), the general government deficit in 2003 was estimated at 1.7% of GDP against a target of 0.9% of GDP. Eurostat considered the data as provisional and subject to revision, due to ongoing discussion with the authorities in Greece. According to a second EDP notification (30 March), the general government deficit was revised upwards to 3%; the new figures are being scrutinised by Eurostat and not yet validated. The Commission forecast is built on this latest estimate of the 2003 deficit communicated by
the Greek authorities, although by no means does it represent a validation of this deficit figure.
Under the usual assumption of unchanged policy, the Commission forecasts a further deterioration in the budgetary position of the general government in 2004. This is due, first, to the significant base-year effects for 2004 from the higher deficit in 2003; second, to the impact of the 2003 social package (estimated at over 1% of GDP for 2004), which seems to have been understated in the expenditure projections; and finally, to the lower than officially projected growth in tax revenues, given the recent tax reforms. A marginal improvement is expected in 2005, assuming that some primary expenditure related to the preparation of the Olympic Games will not be recurring in 2005. The primary surplus should continue to shrink in 2004 while the debt ratio is expected to decline, albeit at a slow pace, given the still high stock-flow adjustments and debt-increasing financial transactions.
Table 3.4 Main features of country forecast - GREECE
2002 Annual percentage changebn Euro Curr. prices % GDP 1981-99 2000 2001 2002 2003 2004 2005
GDP at constant prices 141.3 100.0 1.4 4.4 4.0 3.9 4.2 4.0 3.3 Private consumption 94.8 67.1 2.2 2.0 2.9 2.8 4.0 3.6 3.4 Public consumption 22.1 15.7 1.3 2.2 -1.0 5.8 6.0 2.0 1.1 GFCF 33.8 23.9 1.6 8.0 6.5 5.7 12.6 6.0 5.0 of which : equipment 12.8 9.1 5.9 14.1 4.9 6.9 17.0 5.5 5.0 Change in stocks as % of GDP 0.2 0.2 0.0 0.4 0.1 0.2 0.3 0.1 0.1 Exports (goods and services) 29.5 20.9 4.2 14.1 -1.1 -7.7 1.6 7.3 4.5 Final demand 180.4 127.7 2.1 5.6 2.2 1.8 5.5 4.4 3.7 Imports (goods and services) 39.1 27.7 5.9 8.9 -3.4 -4.7 10.2 5.6 5.2 GNI at constant prices (GDP deflator) 141.5 100.1 1.1 4.0 3.2 3.9 3.7 4.0 3.3 Contribution to GDP growth : Domestic demand 1.6 3.6 3.5 4.1 6.8 4.4 3.8
Stockbuilding 0.0 0.5 -0.3 0.1 0.1 -0.2 0.0Foreign balance -0.6 0.4 0.9 -0.4 -2.7 -0.2 -0.7
Employment 0.9 0.3 -0.3 0.1 2.2 1.7 1.0 Unemployment (a) 7.8 11.0 10.4 10.0 9.3 8.4 8.0 Compensation of employees/head 15.1 5.8 5.3 8.7 7.6 7.0 6.2 Unit labour costs 14.6 1.6 0.9 4.7 5.6 4.6 3.9 Real unit labour costs -0.3 -1.7 -2.5 0.8 1.9 0.7 0.7 Savings rate of households (b) - - 16.6 14.8 13.9 13.4 12.2 GDP deflator 15.0 3.4 3.5 3.9 3.6 3.9 3.1 Private consumption deflator 14.6 3.3 3.3 3.4 3.5 3.4 3.3 Harmonised index of consumer prices - 2.9 3.7 3.9 3.4 3.4 3.5 Trade balance (c) -11.8 -16.8 -15.1 -14.8 -16.2 -15.8 -15.6 Balance on current transactions with ROW (c) -1.4 -6.3 -6.1 -5.2 -7.0 -6.4 -6.6 Net lending(+) or borrowing(-) vis-à-vis ROW (c) - -3.6 -3.8 -3.3 -4.9 -4.7 -5.0 General government balance (c)(d)(e) -9.3 -2.0 -1.4 -1.4 -3.0 -3.2 -2.8 General government gross debt (c) 77.2 106.2 106.9 104.7 103.0 102.8 101.7 (a) as % of civilian labour force. (b) gross saving divided by gross disposable income. (c) as a percentage of GDP. (d) Including proceeds relative to UMTS licences (see for more details note 10 on concepts and sources). (e) The figures for Greece are based on a second EDP notification (30.3.2004) not yet validated by Eurostat; hence, they are to be considered subject to revision.
47

5. Spain Growth gains momentum in 2004
Economic developments in 2003
In 2003, real GDP grew by 2.4%, marginally above the Commission’s autumn forecast. The main forces driving economic activity were private consumption and investment in dwellings, while the external sector posted a negative contribution to GDP growth of 1 percentage point. Growth was noticeably firm in the final quarter due to buoyant private consumption and a less negative external contribution, which involves a sizeable carry-over effect for 2004. In contrast, investment in equipment remained almost flat.
Prospects for 2004 and 2005
A slight deceleration on a quarterly basis is envisaged for the first quarter of 2004. Confidence indicators remain mixed and industrial production fell sharply at the beginning of the year. On the other hand, mortgage borrowing is accelerating. From the third quarter onwards, final demand is envisaged to gain dynamism, mainly due to growth of investment in equipment and of exports.
In 2004 as a whole, private consumption is envisaged to remain robust. Sound employment growth and residual impulses from the personal income tax cut implemented in 2003 coupled with lower inflation rates will sustain consumption while still allowing a rise in the saving ratio. The latter should help strengthen the financial position of households after the growing indebtedness registered in recent years, and inhibit a further acceleration of consumer
spending. These trends are expected to persist in 2005.
Based on a more positive international outlook and better business prospects, investment is foreseen to gain dynamism in 2004 and 2005, mainly due to stronger investment in equipment linked to a great extent to accelerating exports, which should more than offset the moderation envisaged for dwellings. The relatively healthy financial position of firms and rising profitability should help foster a recovery of investment in equipment. On the other hand, the forecast deceleration of construction is based on two elements, namely the weaker financial position of households deterring residential investment and less dynamic public investment linked to the electoral cycle.
The external sector is set to recover vigour during the forecast period stemming from the envisaged recovery of Spain’s main trading partners. Both exports and imports are expected to accelerate, which should entail a more moderate drag from the external sector.
As result, output growth is expected to gain dynamism and further accelerate to 2.8% in 2004, accelerating slightly from the second quarter of the year in quarterly terms. Based on higher investment in equipment and exports of goods and services, real GDP in 2005 is forecast to accelerate at the end of the year and grow by 3.3% on average, slightly above potential.
Labour market
Following the economic upturn throughout the forecasting period, employment creation should grow above 2% in terms of full-time equivalent jobs in both 2004 and 2005. Notwithstanding the envisaged increase in the active population, strong employment creation should help reduce unemployment to rates below 11.0% and 10.5% in 2004 and 2005, respectively (EUROSTAT definition).
Costs and prices
Both headline and core inflation are expected to moderate significantly in the first quarter of 2004 and pick-up slightly thereafter. On average, HICP inflation is expected to ease to 2.4% in 2004 (3.1% in 2003) and to fall marginally further to 2.3% in 2005,
-3
-2
-1
0
1
2
3
4
5
6
96 97 98 99 00 01 02 03 04 05
Forecast
yoy % ch.
(a) exclud ing s to ckb uild ing .
Graph 3.5: Spain - Contributions to GDP growth
External demand
Final domestic demand (a)
GDP
48

Chapter 3 Member States, Spain
provided the envisaged wage moderation is confirmed. Thus, compensation per head should decelerate in 2004 and 2005, supported by a much lower impact of wage indexation clauses. This wage moderation coupled with a rise in apparent labour productivity should imply decelerating unit labour costs in the projection period.
External sector
The current account deficit is forecast to widen further in 2004 and 2005. This deterioration stems mainly from the growing trade deficit, only partially offset by the services balance surplus. The trade deficit in turn reflects relatively higher domestic demand growth than in export markets, combined with ongoing worsening in cost competitiveness.
Public finances
In 2003, despite personal income tax cuts, the general government balance achieved a better result than expected, registering a surplus of 0.3% of GDP. The
fiscal forecast, particularly that for 2005, is clearly subject to policy changes that could be announced by the new government that gained office following the March 2003 general election. On the basis of policies as announced by the outgoing government, in 2004 indirect taxes and social security contributions are expected to remain buoyant, supported by strong job creation, while growth of direct tax revenue should regain some strength after the tax reform implemented in 2003, with corporate tax revenue expected to respond to firms’ higher profits. These elements together with moderate growth of expenditure items should enable the general government to register a surplus of 0.4% of GDP. In 2005 the government budget balance is foreseen to show a surplus of 0.6% of GDP. The debt-to-GDP ratio is expected to continue to decline during the forecasting period, falling to around 45% of GDP by end-2005.
Table 3.5 Main features of country forecast - SPAIN
2002 Annual percentage changebn Euro Curr. prices % GDP 1981-99 2000 2001 2002 2003 2004 2005
GDP at constant prices 696.2 100.0 2.7 4.2 2.8 2.0 2.4 2.8 3.3 Private consumption 405.3 58.2 2.3 4.0 2.8 2.6 3.0 3.0 3.3 Public consumption 123.8 17.8 4.1 5.1 3.6 4.4 4.6 4.2 4.0 GFCF 175.4 25.2 4.0 5.7 3.3 1.0 3.0 3.4 4.7 of which : equipment 43.7 6.3 4.3 4.7 -1.2 -5.4 1.9 3.5 7.7 Change in stocks as % of GDP 2.0 0.3 0.3 0.4 0.3 0.3 0.3 0.5 0.4 Exports (goods and services) 197.7 28.4 7.6 10.0 3.6 0.0 4.0 5.1 7.6 Final demand 904.1 129.9 3.7 5.7 3.1 2.0 3.5 3.9 4.6 Imports (goods and services) 207.9 29.9 8.8 10.6 4.0 1.8 6.7 7.1 8.4 GNI at constant prices (GDP deflator) 687.6 98.8 2.7 4.2 2.5 2.2 2.6 2.9 3.3 Contribution to GDP growth : Domestic demand 2.9 4.6 3.1 2.6 3.3 3.5 3.9
Stockbuilding 0.0 -0.1 -0.1 0.0 0.0 0.1 -0.1Foreign balance -0.2 -0.4 -0.2 -0.6 -1.0 -0.8 -0.6
Employment 1.1 3.6 2.4 1.5 1.8 2.1 2.3 Unemployment (a) 15.7 11.3 10.6 11.3 11.3 10.9 10.5 Compensation of employees/head 8.0 3.7 3.8 3.9 4.2 3.5 3.2 Unit labour costs 6.2 3.1 3.4 3.3 3.6 2.9 2.2 Real unit labour costs -0.6 -0.4 -0.7 -1.0 -0.5 -0.8 -1.0 Savings rate of households (b) - - 10.2 10.5 10.9 11.4 11.7 GDP deflator 6.9 3.5 4.2 4.4 4.2 3.7 3.2 Private consumption deflator 6.9 3.2 3.3 3.5 3.1 2.5 2.4 Harmonised index of consumer prices - 3.5 2.8 3.6 3.1 2.4 2.3 Trade balance (c) -4.1 -6.2 -5.7 -5.1 -5.4 -5.7 -6.1 Balance on current transactions with ROW (c) -1.3 -3.3 -3.1 -2.7 -3.2 -3.2 -3.4 Net lending(+) or borrowing(-) vis-à-vis ROW (c) -0.9 -2.5 -2.2 -1.6 -2.0 -2.3 -2.4 General government balance (c)(d) -4.5 -0.9 -0.4 0.0 0.3 0.4 0.6 General government gross debt (c) 47.7 61.2 57.5 54.6 50.8 48.0 45.1 (a) as % of civilian labour force. (b) gross saving divided by gross disposable income. (c) as a percentage of GDP. (d) Including proceeds relative to UMTS licences (see for more details note 10 on concepts and sources).
49

6. France The recovery is under way
The economic situation in 2003
With an increase of 0.2%, real GDP experienced in 2003 its worst performance since the 1993 recession (-0.9%). The slowdown in economic activity was primarily due to the sharp deterioration of the contribution of net exports to growth. However, the low growth figure hides a highly contrasted profile within 2003. After having skirted the recession in the first half of 2003, the French economy picked up in the second half of the year, when growth reached an annualised rate of about 2%. This acceleration was driven by a rebound in exports, after one year of continuous decline, and a pick up in demand from firms. In particular, private companies increased their investment flow for the first time in two years.
Prospects for 2004 and 2005
Recent business surveys confirm that a recovery is under way. In particular, business sentiment improved markedly in the service and the building sectors in recent months. In the manufacturing sector, expectations are also oriented upward, but their improvement seems more hesitant. In contrast with developments of business sentiment, consumer confidence has remained very low. French consumers are in particular concerned by developments in the labour market. All in all, developments in surveys are consistent with growth stabilising at a close to potential rate in the next few months.
On the back of the assumed improvement in the world economy and favourable monetary conditions, the recovery of economic activity in France is expected to develop further in 2004 and 2005. Real GDP growth
would resume to an above potential rate from next summer onwards with annual rates reaching 1.7% in 2004 and 2.4% in 2005.
The acceleration of exports would continue to support an upturn in demand expectations, and lead companies to reverse the ongoing de-stocking movement. In addition, equipment investment is expected to accelerate gradually. This development would also be supported by favourable financing conditions, reflecting the low level of interest rates, and by the introduction of tax incentives (abolition of the taxe professionnelle on new capital expenditure). The need for companies to adjust their balance sheets will however moderate the pick up in investment growth in the next few quarters.
The recovery of private consumption would be more gradual. Indeed, the increase in real gross disposal income of households is projected to remain subdued in 2004, before accelerating significantly in 2005 in line with a rebound in employment. The saving ratio of households is projected to edge down slightly in the next two years.
Labour markets, costs and prices
The past deterioration of economic activity is still impacting on the labour market: employment growth remains weak and it is not expected to accelerate significantly before next summer. The need for companies to restore their profit margins will probably delay the recovery in employment. The cyclical acceleration of productivity would therefore be particularly pronounced in 2004.
Wage moderation is projected to continue in 2004. This year, the impact of the harmonisation of the different levels of minimum wage created by the working time reduction laws will be counter-balanced by a cyclical deceleration in wages. A slight acceleration in real wages would occur in 2005, driven by the decline in the unemployment rate.
As a consequence of the moderation in unit labour costs expected for 2004 and 2005, underlying inflationary pressures are projected to remain subdued. The profile of consumer price inflation will however be strongly influenced by fluctuations in tobacco prices, which will increase the annual inflation rate by 0.5 percentage point in 2004, and by 0.1 percentage point in 2005.
Graph 3.6: France - GDP and investment
-8%
-6%
-4%
-2%
0%
2%
4%
6%
8%
10%
90 91 92 93 94 95 96 97 98 99 00 01 02 03 04 05
Forecast
Total investment growth
GDP growth
50

Chapter 3 Member States, France
Public finances
In 2003, the situation of French public finances deteriorated markedly, mainly due to growth turning out lower than expected. The general government deficit increased from 3.2% of GDP in 2002 to 4.1% of GDP in 2003. Due to the increase in the deficit, but also to low growth in nominal GDP and to debt-increasing stock-flow adjustments amounting to 1.3 percentage points of GDP, the general government gross debt-to-GDP ratio rose by 4.4 percentage points in 2003 to 63.0 percent of GDP.
In 2004, the general government deficit is projected to decline from 4.1% of GDP to 3.7% of GDP. This decline will be hampered by the lagged impact on fiscal revenues of the low 2003 real GDP growth. In this forecast, it is assumed that expenditure plans included in the Finance Law for 2004 will be respected, except for a slippage in health expenditures. On the revenue side, the forecast incorporates discretionary tax increases amounting to
0.15 percentage point of GDP. Based on the commonly agreed methodology for the calculation of potential output, this forecast is consistent with a decline in the cyclically-adjusted deficit by about 0.5 percentage point of GDP in 2004.
In 2005, the general government deficit is projected to decrease only marginally to 3.6% of GDP. Real general government expenditure is projected to increase by 2.2% in real terms in 2005, in line with the trend observed in the last five years. This forecast does not incorporate the potential positive impact of the reform of the health insurance system that is currently being designed.
Table 3.6 Main features of country forecast - FRANCE
2002 Annual percentage changebn Euro Curr. prices % GDP 1981-99 2000 2001 2002 2003 2004 2005
GDP at constant prices 1520.8 100.0 2.1 3.8 2.1 1.2 0.2 1.7 2.4 Private consumption 833.3 54.8 1.8 2.6 2.7 1.2 1.6 1.7 2.3 Public consumption 363.0 23.9 2.3 2.8 2.9 4.1 2.4 1.6 2.8 GFCF 296.0 19.5 2.1 7.8 1.9 -1.6 -0.8 2.2 3.3 of which : equipment 107.4 7.1 4.8 10.4 2.5 -3.2 -0.5 4.0 4.2 Change in stocks as % of GDP -2.8 -0.2 0.1 1.0 0.4 0.0 -0.3 -0.2 -0.1 Exports (goods and services) 411.6 27.1 5.1 12.6 1.6 1.5 -2.1 3.8 5.5 Final demand 1901.0 125.0 2.5 5.9 1.8 0.3 0.3 2.3 3.3 Imports (goods and services) 380.2 25.0 4.4 14.6 1.3 0.6 0.8 4.5 6.2 GNI at constant prices (GDP deflator) 1527.8 100.5 2.1 3.5 2.1 0.9 0.2 1.7 3.3 Contribution to GDP growth : Domestic demand 2.0 3.6 2.6 1.3 1.3 1.7 2.6
Stockbuilding 0.0 0.4 -0.6 -0.4 -0.3 0.1 0.0Foreign balance 0.2 -0.2 0.1 0.3 -0.8 -0.1 -0.2
Employment 0.2 2.7 1.8 0.7 0.0 0.1 0.7 Unemployment (a) 9.9 9.3 8.5 8.8 9.4 9.6 9.4 Compensation of employees/head 5.1 2.3 2.6 2.8 2.6 2.3 2.4 Unit labour costs 3.1 1.2 2.3 2.3 2.5 0.6 0.6 Real unit labour costs -0.8 0.2 0.6 0.5 0.8 -1.0 -1.0 Savings rate of households (b) - - 16.0 16.7 16.3 16.2 16.1 GDP deflator 3.9 1.0 1.8 1.8 1.7 1.7 1.6 Private consumption deflator 4.2 1.5 1.6 2.0 1.5 1.7 1.5 Harmonised index of consumer prices - 1.8 1.8 1.9 2.2 1.9 1.5 Trade balance (c) -0.8 -0.8 -0.2 0.1 -0.1 0.0 -0.1 Balance on current transactions with ROW (c) -0.7 1.3 1.5 1.6 0.9 0.9 0.7 Net lending(+) or borrowing(-) vis-à-vis ROW (c) -0.8 1.3 1.5 1.5 0.8 0.9 0.7 General government balance (c)(d) -3.0 -1.4 -1.5 -3.2 -4.1 -3.7 -3.6 General government gross debt (c) 40.0 57.2 56.8 58.6 63.0 64.6 65.6 (a) as % of civilian labour force. (b) gross saving divided by gross disposable income. (c) as a percentage of GDP. (d) Including proceeds relative to UMTS licences (see for more details note 10 on concepts and sources).
51

7. Ireland A broad-based recovery is under way
Activity in 2003
In line with preliminary national accounts for the first three quarters, real GDP growth is estimated to have averaged just above 1% in year 2003, representing a marked slowdown on 2002 (6.9%) and 2001 (6.2%). Consumption growth remained relatively healthy but there was a pronounced fall in all categories of investment bar housing. Overall domestic demand was therefore quite subdued. The dramatic drop in both exports and imports must be qualified as there was a very marked fall-off in merchandise trade with the UK, assumed to be related to the termination of UK-based VAT fraud schemes in the course of 2002. The external side is estimated to have made a fairly weak contribution to overall growth compared to previous years.
Growth in real GNI terms seems to have been much more buoyant in 2003 than in real GDP terms, on account of a decline in net factor outflows. This is exactly the opposite of the pattern observed in 2002, when real GDP growth pointed to a remarkable expansion (concentrated in the chemicals sector) in spite of the worldwide slowdown.
Prospects for 2004 and 2005
The Irish economy is expected to post a broad-based recovery over the forecast horizon. Real GDP growth is projected to reach 3.7% in 2004 and to strengthen to 4.6% in 2005, close to the rate commonly thought to be sustainable in the medium term, of up to 5%.
On the domestic side, private consumption is expected to benefit from nominal disposable income
-2
0
2
4
6
8
10
12
14
1996 1998 2000 2002 2004
Domestic demand Foreign balanceGDP (% ch.) GDP euro area (% ch.)
Forecast
Graph 3.7: Ire land - GDP growth compared to euro area and contributions to change
gains (albeit more moderate than in recent years) and a lower inflation rate than in the recent past. The contribution from public consumption should remain modest in view of further spending restraint and the envisaged cut in public sector employment. Investment in equipment should pick up in line with the general recovery, while construction is supported by significant public capital spending under the National Development Plan after a pause in 2003. However, growth in housing completions is expected to taper off after double-digit growth in 2003.
Building on the regained momentum of the last months of 2003, merchandise exports are expected to stage a strong recovery in line with the international upturn. External trade in services is also projected to return to the more dynamic growth rates of the period before 2003.
Labour market
The labour market was remarkably resilient in 2003 with a slight rise in the unemployment rate to 4.6% from 4.3% in 2002. Employment is estimated to have grown 1¾% but about two-thirds of the net gains are accounted for by the public sector. In view of the aforementioned cut in public sector employment, this will not be repeated over the forecast period. As a result, employment gains will be quite weak in 2004, while unemployment is projected to rise to some 5% before easing slightly the year after.
Costs and prices
The available data for the first three quarters of 2003 suggest that there has been no further moderation of per capita compensation growth since about mid-2002, when it broadly halved compared to a year earlier. Average income growth is thus estimated at around 5% on the year in 2003 and a similar rate is projected for 2004. Some further easing in the private sector in view of moderating inflationary pressures is expected to be partly offset by strong wage growth in the public sector given the gradual implementation of “benchmarking” (upward adjustments to public sector pay scales based on comparison with rates for similar jobs in the private sector).
52

Chapter 3 Member States, Ireland
HICP inflation averaged 4.0% in 2003, down from 4.7% in 2002. With downward pressures stemming from weak activity and a stronger currency, the annual rate eased significantly through 2003, from 4.7% in January to 2.9% in December. HICP inflation averaged 2.3% in the first two months of 2004 and is projected to trough in the third quarter before picking up in response to strengthening economic activity. HICP inflation is thus forecast to average 2.1% in 2004 and 2.3% in 2005. This would considerably narrow the positive inflation differential with the euro area.
Public finances
The main measures in the budget for 2004 are a further reduction of the growth rate of current discretionary expenditure (to 7.5% from 9.5% in 2003), a return to positive growth in discretionary capital spending after the cut in 2003 and, on the revenue side, a modest hike in indirect taxes and a partial adjustment to inflation of the personal income
tax system. The deficit is forecast to reach around 0.8% of GDP, somewhat better than planned by the authorities (1.1%), and to widen to 1.0% in 2005. Given the non-indexed nature of the tax and social benefit systems, the no-policy change assumption for 2005 is made operational, in the absence of previously announced measures, by freezing average tax rates and adjusting social transfer payments by the forecast CPI inflation rate (with a small top-up). Government debt is projected to stabilise at one-third of GDP.
Table 3.7 Main features of country forecast - IRELAND
2002 Annual percentage changebn Euro Curr. prices % GDP 1981-99 2000 2001 2002 2003 2004 2005
GDP at constant prices 129.3 100.0 5.1 10.1 6.2 6.9 1.2 3.7 4.6 Private consumption 58.3 45.1 3.4 8.5 5.3 2.6 2.4 3.2 3.7 Public consumption 19.5 15.1 1.9 7.6 11.6 8.9 3.0 2.3 2.3 GFCF 28.6 22.1 4.2 7.1 0.2 1.5 -4.8 3.1 3.5 of which : equipment 7.6 5.9 4.8 7.5 -6.4 -2.4 -20.0 7.0 7.0 Change in stocks as % of GDP 0.0 0.0 0.6 0.9 0.5 0.0 0.2 0.1 0.1 Exports (goods and services) 121.2 93.7 11.2 20.6 8.3 6.2 -4.0 5.5 8.1 Final demand 227.6 175.9 6.4 15.0 6.4 4.7 -1.8 4.4 6.1 Imports (goods and services) 97.0 75.0 8.7 21.3 6.5 2.3 -5.3 5.3 7.9 GNI at constant prices (GDP deflator) 104.7 80.9 4.3 9.9 4.3 1.9 4.0 3.8 4.0 Contribution to GDP growth : Domestic demand 3.1 6.9 4.2 2.9 0.7 2.4 2.7
Stockbuilding 0.2 0.5 -0.4 -0.4 0.2 -0.1 0.0Foreign balance 1.8 2.3 2.9 4.6 0.4 1.3 1.9
Employment 1.6 4.7 3.0 1.3 1.8 0.8 1.3 Unemployment (a) 13.4 4.3 3.9 4.3 4.6 5.0 4.9 Compensation of employees/head 7.0 8.1 9.0 5.2 5.1 5.0 4.2 Unit labour costs 3.3 2.8 5.7 -0.3 5.7 2.1 0.9 Real unit labour costs -1.8 -1.4 0.6 -5.5 3.7 0.1 -1.5 Savings rate of households (b) - - 12.8 14.1 15.5 16.1 15.6 GDP deflator 5.3 4.3 5.1 5.4 1.9 1.9 2.5 Private consumption deflator 5.1 4.1 4.3 6.0 3.8 1.8 2.3 Harmonised index of consumer prices - 5.3 4.0 4.7 4.0 2.1 2.3 Trade balance (c) 8.8 26.5 26.6 28.6 24.8 24.5 25.3 Balance on current transactions with ROW (c) -1.6 -0.4 -0.7 -0.7 -0.9 -1.0 -0.7 Net lending(+) or borrowing(-) vis-à-vis ROW (c) -0.7 0.8 0.0 -0.3 -0.5 -0.7 -0.4 General government balance (c)(d) -4.5 4.4 1.1 -0.2 0.2 -0.8 -1.0 General government gross debt (c) 86.3 38.4 36.1 32.3 32.0 32.4 32.6 (a) as % of civilian labour force. (b) gross saving divided by gross disposable income. (c) as a percentage of GDP. (d) Including proceeds relative to UMTS licences (see for more details note 10 on concepts and sources).
53

8. Italy Moderate recovery taking shape in 2004
The situation in 2003
Following a strong rebound in the third quarter economic growth declined marginally in the last quarter of 2003. This was in contrast with ongoing quarterly growth in the other large EU economies and can partly be explained by a general strike held in October. In 2003 as a whole growth was 0.3%, marginally below the euro area average. The negative impact from the external side more than halved the positive contribution from domestic demand.
Prospects in 2004 and 2005
The recovery in 2004 is expected to be mainly driven by domestic demand, which should benefit from positive fundamentals. Private consumption is likely to recover from the negative reading in Q4-2003 in view of moderate yet positive job creation, real wage increases, rising housing prices and an ongoing recovery of stock markets. After the contraction in 2003 triggered by the expiry of an important tax incentive at the end of 2002, investment is expected to gain strength, benefiting from low interest rates, rising profit margins and the improving growth outlook. The external side is likely to continue to act as a drag on economic growth, yet to a lesser extent than in 2003. Overall, real GDP is forecast to rise by 1.2% in 2004 as a whole, around ½ a percentage point less than in the euro area average. An acceleration to around 2.1% is projected in 2005, again mainly sustained by firm domestic demand coupled with an improving yet still marginally negative contribution from the external
side.
Labour market, costs and prices With a significant lag compared to the slowdown in economic activity, job creation came to a halt in the second half of 2003. However, thanks to the strong performance recorded in 2002 and the increase in the first half of 2003 employment was up 1% in the year as a whole. The rate of unemployment fell to 8.7%, closing the gap with the euro area average after more than 10 years. With the economic recovery taking hold in 2004, employment is expected to pick up gradually over the year. The number of full-time equivalents is forecast to rise by 0.3%, slightly less than the employment headcount due to the impact of part-timers, the legal basis of which was further liberalised by the ‘Biagi’ law at the end of 2003. Following the recent period of ‘growth-less job creation’ ensuing from successive steps of labour market reform since the mid-1990s, the job content of growth is projected to gradually return to lower levels in the medium term. In 2005 employment (full-time equivalents) is forecast to increase by 0.7%. The rate of unemployment is expected to continue its downward trend.
HICP inflation, which averaged 2.8% in 2003, has eased on the year at the beginning of 2004. Falling import prices, a sizeable negative output gap and ongoing wage moderation are expected to be conducive to declining inflationary pressures throughout the year. Annual inflation is forecast to average somewhat above 2% in 2004 and to stay below that threshold in 2005. The inflation differential vis-à-vis the euro area average is projected to narrow gradually.
Public finances
In 2003, the general government deficit was broadly unchanged compared to the previous year, bolstered by hefty inflows from a tax amnesty, which improved the budgetary outturn by around 1.5% of GDP. In total, the one-off improvement brought about by a series of measures implemented in 2003 is estimated to have been slightly more than 2% of GDP, about half a percentage point above the impact recorded in 2002. Nevertheless, the erosion of the primary surplus since 2001 continued. Interest expenditure was half a percentage point of GDP lower than the previous year.
-4
-3
-2
-1
0
1
2
3
4
90 91 92 93 94 95 96 97 98 99 00 01 02 03 04 05
Forecastyoy % ch.
Tax incentives car purchases
Graph 3.8: Italy - Private consumption and gross disposable income
Real private consumption
Real grossdisposable income
54
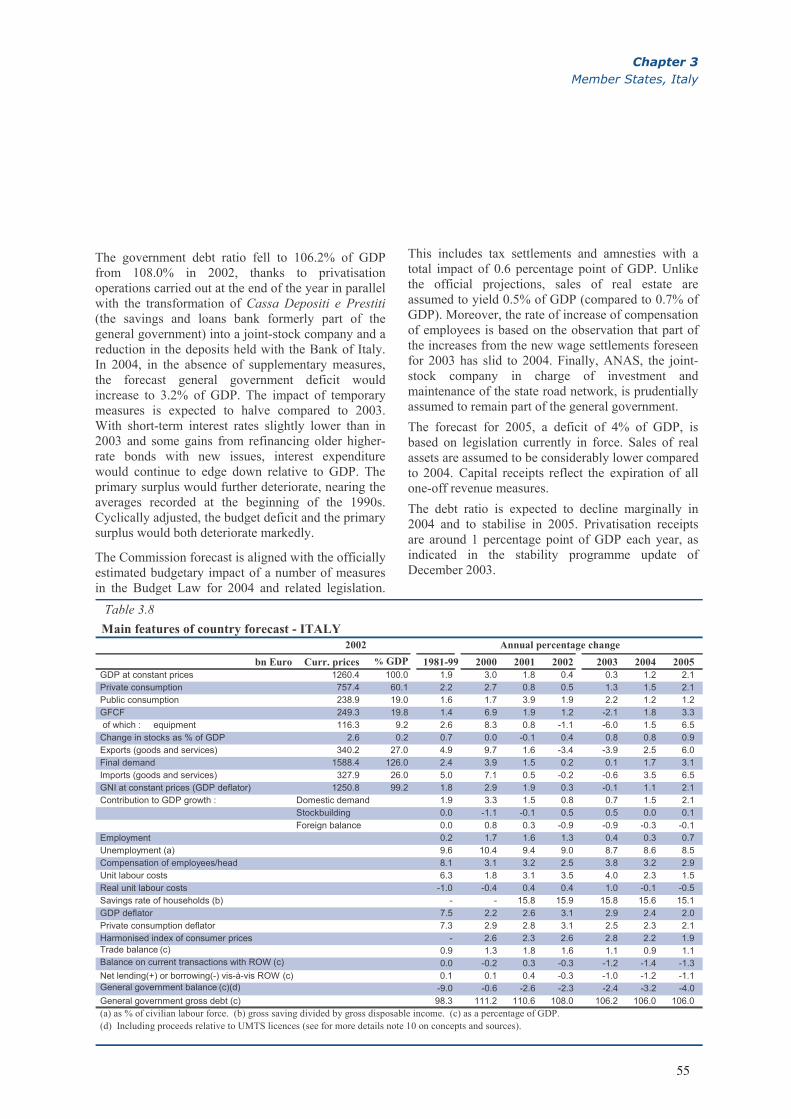
Chapter 3 Member States, Italy
The government debt ratio fell to 106.2% of GDP from 108.0% in 2002, thanks to privatisation operations carried out at the end of the year in parallel with the transformation of Cassa Depositi e Prestiti (the savings and loans bank formerly part of the general government) into a joint-stock company and a reduction in the deposits held with the Bank of Italy. In 2004, in the absence of supplementary measures, the forecast general government deficit would increase to 3.2% of GDP. The impact of temporary measures is expected to halve compared to 2003. With short-term interest rates slightly lower than in 2003 and some gains from refinancing older higher-rate bonds with new issues, interest expenditure would continue to edge down relative to GDP. The primary surplus would further deteriorate, nearing the averages recorded at the beginning of the 1990s. Cyclically adjusted, the budget deficit and the primary surplus would both deteriorate markedly.
The Commission forecast is aligned with the officially estimated budgetary impact of a number of measures in the Budget Law for 2004 and related legislation.
This includes tax settlements and amnesties with a total impact of 0.6 percentage point of GDP. Unlike the official projections, sales of real estate are assumed to yield 0.5% of GDP (compared to 0.7% of GDP). Moreover, the rate of increase of compensation of employees is based on the observation that part of the increases from the new wage settlements foreseen for 2003 has slid to 2004. Finally, ANAS, the joint-stock company in charge of investment and maintenance of the state road network, is prudentially assumed to remain part of the general government. The forecast for 2005, a deficit of 4% of GDP, is based on legislation currently in force. Sales of real assets are assumed to be considerably lower compared to 2004. Capital receipts reflect the expiration of all one-off revenue measures. The debt ratio is expected to decline marginally in 2004 and to stabilise in 2005. Privatisation receipts are around 1 percentage point of GDP each year, as indicated in the stability programme update of December 2003.
Table 3.8 Main features of country forecast - ITALY
2002 Annual percentage changebn Euro Curr. prices % GDP 1981-99 2000 2001 2002 2003 2004 2005
GDP at constant prices 1260.4 100.0 1.9 3.0 1.8 0.4 0.3 1.2 2.1 Private consumption 757.4 60.1 2.2 2.7 0.8 0.5 1.3 1.5 2.1 Public consumption 238.9 19.0 1.6 1.7 3.9 1.9 2.2 1.2 1.2 GFCF 249.3 19.8 1.4 6.9 1.9 1.2 -2.1 1.8 3.3 of which : equipment 116.3 9.2 2.6 8.3 0.8 -1.1 -6.0 1.5 6.5 Change in stocks as % of GDP 2.6 0.2 0.7 0.0 -0.1 0.4 0.8 0.8 0.9 Exports (goods and services) 340.2 27.0 4.9 9.7 1.6 -3.4 -3.9 2.5 6.0 Final demand 1588.4 126.0 2.4 3.9 1.5 0.2 0.1 1.7 3.1 Imports (goods and services) 327.9 26.0 5.0 7.1 0.5 -0.2 -0.6 3.5 6.5 GNI at constant prices (GDP deflator) 1250.8 99.2 1.8 2.9 1.9 0.3 -0.1 1.1 2.1 Contribution to GDP growth : Domestic demand 1.9 3.3 1.5 0.8 0.7 1.5 2.1
Stockbuilding 0.0 -1.1 -0.1 0.5 0.5 0.0 0.1Foreign balance 0.0 0.8 0.3 -0.9 -0.9 -0.3 -0.1
Employment 0.2 1.7 1.6 1.3 0.4 0.3 0.7 Unemployment (a) 9.6 10.4 9.4 9.0 8.7 8.6 8.5 Compensation of employees/head 8.1 3.1 3.2 2.5 3.8 3.2 2.9 Unit labour costs 6.3 1.8 3.1 3.5 4.0 2.3 1.5 Real unit labour costs -1.0 -0.4 0.4 0.4 1.0 -0.1 -0.5 Savings rate of households (b) - - 15.8 15.9 15.8 15.6 15.1 GDP deflator 7.5 2.2 2.6 3.1 2.9 2.4 2.0 Private consumption deflator 7.3 2.9 2.8 3.1 2.5 2.3 2.1 Harmonised index of consumer prices - 2.6 2.3 2.6 2.8 2.2 1.9 Trade balance (c) 0.9 1.3 1.8 1.6 1.1 0.9 1.1 Balance on current transactions with ROW (c) 0.0 -0.2 0.3 -0.3 -1.2 -1.4 -1.3 Net lending(+) or borrowing(-) vis-à-vis ROW (c) 0.1 0.1 0.4 -0.3 -1.0 -1.2 -1.1 General government balance (c)(d) -9.0 -0.6 -2.6 -2.3 -2.4 -3.2 -4.0 General government gross debt (c) 98.3 111.2 110.6 108.0 106.2 106.0 106.0(a) as % of civilian labour force. (b) gross saving divided by gross disposable income. (c) as a percentage of GDP.
(d) Including proceeds relative to UMTS licences (see for more details note 10 on concepts and sources).
55

9. Luxembourg Turning the corner
The situation in 2003
Economic activity in 2003 was subdued for the third year in a row, as Luxembourg is recovering only slowly from the negative impact of the global slowdown and the turmoil on financial markets. However, available data point to a recovery from the third quarter onwards. Industrial production was quite dynamic, and increased by 2.6% for the year as a whole. The trade balance showed a strong improvement in the last two quarters of the year. Real GDP growth is estimated to have reached 1.8% in 2003. The labour market deteriorated, in a lagged response to the economic slowdown. Whereas labour shedding took place in some sectors, notably manufacturing and financial services, overall employment growth held up rather well at around 2%. This, in turn, implied that overall labour productivity growth remained negative for the third year in succession. Despite the continued growth in employment, the unemployment rate increased, to slightly above 4% at the end of the year. The broad unemployment figure, counting also people in specific employment schemes, was even higher. However, the increase in the unemployment rate peaked in the summer of 2003 and unemployment has increased less rapidly afterwards. While compensation growth decelerated somewhat, HICP inflation remained broadly stable at around 2.5%. First estimates indicate that the general government balance deteriorated considerably, from a surplus of 2.7% of GDP in 2002 to a very small deficit of 0.1% of GDP in 2003. The
deterioration was cushioned somewhat by the collection of back taxes and some special factors with a positive impact on VAT receipts.
Prospects for 2004 and 2005
Real GDP growth is expected to increase over the projection horizon, in line with the expected improvement in economic conditions in the euro area. Economic growth should gradually pick up to slightly above 3% in 2005, which is still well below the average growth rates witnessed in the 1980s and 1990s. The modest upturn in 2004 would be primarily due to stronger domestic demand, with investment improving in response to more favourable external conditions. The financial sector, which accounts for around half of the exports from the Grand Duchy, was a drag on growth in the downturn but medium-term prospects in this sector should be more favourable. Consequently, net exports would be higher in 2005. Private consumption growth is expected to strengthen somewhat, in line with the development of real compensation per employee and a gradual improvement in employment. Nevertheless, the economic upturn would still have only a limited positive effect on unemployment. The unemployment rate is expected to increase from 3.7% on average in 2003 to 4.7% in 2004. Unemployment would continue rising somewhat in the course of 2005.
Underlying inflation is projected to decrease, in response to weak import prices, relatively moderate wage increases, and a cyclical upturn in labour productivity. Nevertheless, headline HICP inflation would fall only gradually, from 2.5% in 2003 to 1.7% in 2005 as HICP energy inflation will rise considerably in 2004 due to an increase in excise duties with effect from January 2004. The upward impact of the excise increase on HICP (which includes expenditure by non-residents) is much stronger than on the CPI due to the larger weight of fuel prices in the former.
Public finance
The general government balance is projected to deteriorate markedly in 2004 and 2005, by 2.2 percentage points of GDP in total. The deterioration in the balance from 2003 onwards can be attributed to a combination of weak revenues, not offset by a sufficiently large deceleration in public expenditure.
-2
-1
0
1
2
3
4
5
90 91 92 93 94 95 96 97 98 99 00 01 02 03 04 05
Forecast
Graph 3.9: Luxembourg - Employment and unemployment
Employment yoy % ch.
Unemployment rate
56

Chapter 3 Member States, Luxembourg
The sluggish development of revenues is driven both by the tax reforms implemented in 2001 and 2002, and by cyclical factors. In addition, the collection of substantial corporate back taxes will contribute less to overall revenue in 2004 and 2005 than in the two previous years. The deficit would increase somewhat in 2005, to 2.3% of GDP, as the positive impact of the economic upturn on the government accounts would become visible only with a delay. The low gross debt ratio would decrease somewhat further over the forecast horizon, from 4.9% of GDP in 2003 to 3.8% of GDP in 2005.
Table 3.9 Main features of country forecast - LUXEMBOURG
2002 Annual percentage changemio Euro Curr. prices % GDP 1981-99 2000 2001 2002 2003 2004 2005
GDP at constant prices 22376.5 100.0 5.0 9.1 1.2 1.3 1.8 2.4 3.1 Private consumption 9589.7 42.9 3.1 4.6 4.5 2.3 2.0 2.1 2.3 Public consumption 4015.3 17.9 4.2 4.8 7.0 4.2 4.5 2.0 2.7GFCF 5047.2 22.6 5.1 -3.5 10.1 -1.4 -1.8 3.1 4.5 of which : equipment 1936.1 8.7 6.8 -12.9 8.8 -1.2 -4.4 5.0 6.5 Change in stocks as % of GDP -161.3 -0.7 1.1 2.8 1.2 -0.7 -0.8 -0.8 -0.8 Exports (goods and services) 32718.2 146.2 7.3 16.8 2.6 -0.3 2.9 4.3 6.3 Final demand 51209.2 228.9 5.8 12.1 3.3 -0.4 2.5 3.6 5.1 Imports (goods and services) 28832.7 128.9 6.5 14.8 4.8 -1.6 3.0 4.6 6.6 GNI at constant prices (GDP deflator) 20217.8 90.4 5.1 1.2 4.0 -2.0 1.1 3.4 3.9 Contribution to GDP growth : Domestic demand 3.5 1.9 5.3 1.4 1.2 2.0 2.5
Stockbuilding 0.3 2.3 -1.6 -1.9 0.1 0.0 0.0Foreign balance 1.3 4.7 -2.3 1.6 0.4 0.4 0.6
Employment 2.4 5.6 5.6 3.2 2.0 0.9 1.2 Unemployment (a) 2.5 2.3 2.1 2.8 3.7 4.7 5.0 Compensation of employees/head 4.8 4.7 3.7 3.1 2.7 2.0 2.8 Unit labour costs 2.2 1.4 8.2 5.1 2.9 0.6 0.8 Real unit labour costs -1.4 -2.5 5.9 4.5 0.7 -1.5 -1.3 Savings rate of households (b) - - - - - - - GDP deflator 3.6 3.9 2.2 0.6 2.2 2.1 2.1 Private consumption deflator 3.7 2.6 3.3 2.3 2.1 1.7 1.6 Harmonised index of consumer prices - 3.8 2.4 2.1 2.5 2.0 1.7 Trade balance (c) -11.6 -11.8 -12.5 -11.6 -11.1 -11.2 -11.1 Balance on current transactions with ROW (c) - - - - - - - Net lending(+) or borrowing(-) vis-à-vis ROW (c) - - - - - - - General government balance (c) - 6.3 6.3 2.7 -0.1 -2.0 -2.3 General government gross debt (c) 8.3 5.5 5.5 5.7 4.9 4.5 3.8(a) as % of civilian labour force. (b) gross saving divided by gross disposable income. (c) as a percentage of GDP.
57

10. Netherlands Weathering the storm
The situation in 2003
In the fourth quarter of 2003 real GDP growth (quarter-on-quarter and seasonally adjusted) turned positive, after 5 previous quarters of negative or stagnant growth. However, for the year as a whole real GDP declined by 0.8%, the first absolute decline since 1982. Against a background of low confidence among producers and consumers, private consumption growth and investment were strongly negative. This was due to balance sheet adjustments of firms and households, weak profits, and weak purchasing power of households. Exports did not rise due to the weakness in global trade, aggravated by substantial losses in competitiveness. Employment declined and the unemployment rate increased markedly as the labour market responded with a lag to the economic downturn that had started in 2001. HICP inflation decreased from 3.9% in 2002 to 2.2% in 2003, mainly accounted for by lower import prices and falling profit margins.
According to provisional data for 2003, the general government deficit increased to 3.2% of GDP, from 1.9% of GDP in 2003. The deficit increased despite substantial consolidation efforts equivalent to more than 1% of GDP. The weakening of central government revenues in response to the economic slowdown was the main reason for this deterioration in the government balance but a larger-than-foreseen deficit of local authorities also played a role.
Prospects for 2004 and 2005
The Dutch economy is expected to recover from the
strong downturn experienced in the period 2001-2003, but only slowly compared to previous cyclical upswings. Over the projection horizon, economic activity would remain weaker than the EU average. In the course of 2004, economic growth is expected to pick up moderately to 1% on average for the year as a whole, following the 0.8% decrease of real GDP last year. Real GDP growth would strengthen somewhat in 2005, to 1.6%. The upturn would be mainly driven by the recovery in external trade but is expected to remain quite weak compared to previous upswings. Price competitiveness would start to improve only in 2005 as the negative impact of high price and wage increases in past years would fade away. The growth of exports would also be held back by the sensitivity to the appreciation of the euro in the near term, and the composition of Dutch exports (tilted towards markets with relatively weak growth and products which are especially in demand in the early stages of a recovery). Domestic demand would remain rather weak over the forecast period, reflecting the modest development of disposable income (due to losses in employment growth and wage moderation), ongoing balance sheet adjustments in the household and corporate sectors, and the impact of fiscal tightening. Private consumption will be held back by the combination of a deteriorating labour market, weak income growth and, in 2004, a further increase in the savings ratio. Most of the projected modest gains in private consumption reflect a shift from publicly financed health care expenditure to private funding. Starting from a relatively low rate of capacity utilization, business investment is expected to recover only gradually, as firms need to restore profitability.
The situation in the labour market is expected to worsen considerably in 2004 with the number of persons employed decreasing by around 1%. Job losses will be particularly pronounced in the market sector. The projected slight gain in employment in 2005 partly reflects the impact of the incipient recovery, but is also accounted for by statistical changes related to reforms in sickness and disability insurance. Hence, the unemployment rate is projected to rise substantially over the projection horizon, to 5.3% in 2004 and 6.0% in 2005. Wage inflation is
0
2
4
6
8
10
12
93 94 95 96 97 98 99 00 01 02 03 04 05-2
-1
0
1
2
3
4yoy % ch.
Forecast
Graph 3.10: The Netherlands - Unemployment rate
%
NL unempl. (rhs)
EU empl. (lhs)
EU unempl. (rhs)
NL empl. (lhs)
58

Chapter 3 Member States, Netherlands
expected to decline markedly in response to the deterioration in the labour market and the agreement among social partners to moderate wages. With contractual wage increases in newly concluded wage agreements close to zero for 2004 and 2005, total compensation per employee in 2005 would decelerate to zero as well, related to the reforms in sickness pay and the accompanying downward effect on the wage drift and upward effect on measured employment. Lower import prices coupled with a deceleration in unit labour costs account for the forecast decrease in the inflation rate. HICP inflation is set to decline further to 1.4% in 2004 and 0.7% in 2005. The deceleration of inflation is cushioned somewhat by a recovery in profit margins.
Public finance
Under the assumption of no changes in fiscal policy, the deficit would rise to 3.5% of GDP in 2004, despite a package of substantial savings of around 1.2% of GDP (primarily consisting of expenditure reductions) which was included in the 2004 budget. This expected further worsening of the government accounts in
2004, despite substantial fiscal tightening, illustrates the severity of the economic slowdown. Tax revenues would still suffer from weak economic activity. Whereas expenditure would slow down also due to substantial savings measures, some expenditure overruns have an upward effect on the deficit projection for 2004. As public finances respond with a lag to the cycle and fiscal tightening, the deficit is projected to decrease only somewhat in 2005, to 3.3% of GDP. The debt ratio is expected to rise from 54.8% of GDP in 2003 to around 58½% of GDP in 2005. In view of the severity of the economic downturn, the cyclically adjusted balance is expected to develop more favourably, reaching a deficit of 0.9% of GDP in 2005. In response to the projected worsening of public finances, the government has announced additional savings measures, intended to achieve a deficit of below 3% of GDP from 2004 onwards. However, at the time this report was finalised no details on the intended measures were known, and hence they were not incorporated in the baseline of the projections.
Table 3.10 Main features of country forecast - NETHERLANDS
2002 Annual percentage changebn Euro Curr. prices % GDP 1981-99 2000 2001 2002 2003 2004 2005
GDP at constant prices 444.6 100.0 2.5 3.5 1.2 0.2 -0.8 1.0 1.6 Private consumption 221.7 49.9 1.9 3.5 1.4 0.8 -1.3 0.4 1.1 Public consumption 109.1 24.5 2.5 2.0 4.2 3.8 2.4 0.5 -0.5 GFCF 92.2 20.7 2.6 1.4 -0.1 -4.5 -3.4 -0.6 2.1 of which : equipment 28.3 6.4 4.4 -3.5 -3.2 -4.2 -6.4 -0.8 2.7 Change in stocks as % of GDP -1.0 -0.2 0.4 0.1 0.1 -0.2 0.1 0.1 0.1 Exports (goods and services) 278.4 62.6 5.3 11.3 1.7 0.1 0.0 4.4 5.8 Final demand 700.4 157.5 3.2 6.1 1.7 0.1 -0.3 2.0 3.0 Imports (goods and services) 255.7 57.5 4.7 10.5 2.4 -0.2 0.5 3.7 5.2 GNI at constant prices (GDP deflator) 435.5 97.9 2.5 3.7 -0.1 -0.9 -1.5 2.6 2.1 Contribution to GDP growth : Domestic demand 2.0 2.5 1.6 0.3 -0.8 0.2 0.8
Stockbuilding 0.0 0.0 -0.1 -0.3 0.3 0.1 0.0Foreign balance 0.4 1.1 -0.4 0.2 -0.3 0.7 0.7
Employment 1.1 1.8 1.3 0.2 -1.0 -1.3 0.5 Unemployment (a) 6.8 2.9 2.5 2.7 3.8 5.3 6.0 Compensation of employees/head 2.7 4.7 5.5 4.9 5.1 2.7 0.0 Unit labour costs 1.3 3.1 5.5 4.9 4.9 0.4 -1.1 Real unit labour costs -0.7 -0.8 0.1 1.4 1.9 -0.8 -1.4 Savings rate of households (b) - - 14.0 13.7 15.2 17.3 17.0 GDP deflator 2.0 3.9 5.4 3.4 2.9 1.2 0.3 Private consumption deflator 2.3 3.3 4.7 3.1 2.0 1.0 0.9 Harmonised index of consumer prices - 2.3 5.1 3.9 2.2 1.4 0.7 Trade balance (c) 3.9 4.9 5.2 5.2 5.2 5.9 6.3 Balance on current transactions with ROW (c) 3.8 4.8 3.5 2.1 1.5 3.8 4.3 Net lending(+) or borrowing(-) vis-à-vis ROW (c) 3.6 4.6 3.3 1.9 0.7 2.7 3.1 General government balance (c)(d) -3.7 2.2 0.0 -1.9 -3.2 -3.5 -3.3 General government gross debt (c) 70.7 55.9 52.9 52.6 54.8 56.3 58.6 (a) as % of civilian labour force. (b) gross saving divided by gross disposable income. (c) as a percentage of GDP. (d) Including proceeds relative to UMTS licences (see for m oncepts and sources).
59

11. Austria Economy slowly picking up
The situation in 2003
Activity in 2003 was sustained by the domestic demand components, with household consumption expanding moderately and investment picking up after the slump in 2002. Exports grew moderately as demand from Central and Eastern Europe slackened considerably. Imports, by contrast, edged up strongly due to the pick-up of investment, resulting in a high negative external contribution to growth. All in all, real GDP growth slowed down considerably to 0.7% from 1.4% in 2002.
Prospects in 2004 and 2005
Supported by rebounding exports on the back of the international upswing together with strengthening domestic demand, GDP growth is projected to accelerate to 1.8% in 2004 and further to a rate of 2.5% in 2005.
Household real disposable income will rise only moderately in 2004. Nevertheless, pent-up demand and a revival of consumer confidence should stimulate private consumption. In 2005, real disposable income will be boosted by a pick-up in labour demand, slightly declining unemployment and a significant income tax relief. This should give further momentum to household demand, although the decline in the saving ratio is projected to be reversed. Public consumption is expected to remain subdued throughout the forecast period, provided the government implements the planned reduction in public personnel. Despite sufficient spare capacity, equipment investment expanded vigorously in 2003,
helped by a tax incentive, and should continue to accelerate in 2004, reflecting the improved export outlook. Also, construction investment is projected to remain fairly strong throughout the forecast period. In particular, civil engineering should continue to benefit from public investment in infrastructure. As for housing investment, an impressive upsurge after the downward trend occurred in 2003. With the number of building permits expected to go up in 2004 and slow down thereafter, housing investment should abate towards the end of the forecast period. Exports are projected to rebound in 2004 and gain momentum in 2005, but with imports accelerating at the same time, the contribution of net exports to GDP growth should remain negative in 2004 and turn neutral as of 2005.
Labour market, costs and prices
Dependent employment expanded moderately in 2003, as a consequence of the deceleration in overall output growth. Reflecting the usual time-lag, a more sustained pick-up in labour demand can be expected only as of 2004. Unemployment is likely to rise further, as labour supply remains elastic. Only by 2005, the increase in labour demand is estimated to outpace labour supply, translating into a, if small, reduction in unemployment.
Consumer price inflation is set to remain subdued throughout the forecast period. The increase in energy taxes and excise duties on tobacco in 2004 is being offset by a number of price dampening factors. While wage moderation in the private sector is expected to continue, nominal increases in contractual wages are estimated to pick up in line with the projected cyclical upswing. In the public sector, moderate wage agreements are expected to contain the expected deficit increase in 2005.
Public finances
In 2003, the budgetary position weakened. The deficit widened by almost a full percentage point from 0.2% of GDP in 2002 to 1.1%. Expenditure overshot the target, reflecting a sharper-than-expected rise in unemployment and additional discretionary spending such as an increase in social transfers, an extra pay-rise for public sector employees, additional labour market expenditure foreseen in the fiscal stimulus package, topped by deferred flood-related spending. Tax revenues, by contrast, developed more
Graph 3.11 : Austria - General government deficit/surplus
-2.3
-1.8
-1.3
-0.8
-0.3
0.22001 2002 2003 2004 2005
Forecast
Outturn
60

Chapter 3 Member States, Austria
favourably than budgeted, such that the deficit turned out slightly below the official target.
In January 2004, the first step of an income tax reform took effect. However, as tax cuts are largely offset by a rise in energy taxes and social contributions, the impact on the general government budget should be neutral. As regards deficit-decreasing effects, expected savings from the pension reform for private and federal employees are considerable, largely outpacing the increase in discretionary spending. However, several factors prevent a narrowing of the deficit. First, certain tax relief measures, originally planned for 2005 and worth some 0.1 percentage point of GDP, were brought forward. Second, the finance ministry revised downwards the expected surpluses of the sub-federal government levels by 0.2 percentage point to 0.5% of GDP. Last but not least, central bank profits (in 2003 but affecting the budget 2004) are projected to turn out considerably lower due to low interest rates and the depreciation of the US-dollar. As a result, and despite the expected acceleration in domestic demand, the general
government deficit is estimated to remain in the same order of magnitude as in 2003.
In 2005, the second step of the tax reform consisting of a sizeable income tax relief for both households and enterprises will take effect. The Austrian government has submitted a draft bill, whose main components can be expected to remain unchanged during the parliamentary decision making process. The wage and income tax relief and tax cuts for enterprises are planned to amount to some 0.5% of GDP each. In addition, excises duties with negligible revenue impact (“Bagatellsteuern”) will be abolished. In total, the tax cuts planned for 2005 are worth some 1.0% of GDP.
To some extent, these revenue shortfalls will be offset by continued structural savings from the pension and administrative reforms. Despite the projected strengthening of domestic demand and the closing of the output gap, the general government deficit is projected to widen to almost 2% of GDP.
Table 3.11 Main features of country forecast - AUSTRIA
2002 Annual percentage changebn Euro Curr. prices % GDP 1981-99 2000 2001 2002 2003 2004 2005
GDP at constant prices 218.3 100.0 2.3 3.4 0.8 1.4 0.7 1.8 2.5 Private consumption 123.9 56.8 2.5 3.3 1.4 0.8 1.3 1.8 2.4 Public consumption 40.7 18.6 1.9 -0.1 -1.4 0.1 0.7 0.4 0.4 GFCF 48.3 22.1 2.2 6.2 -2.3 -2.8 4.3 4.3 3.9 of which : equipment 18.3 8.4 2.5 11.6 -3.2 -6.7 6.2 6.3 5.4 Change in stocks as % of GDP 0.7 0.3 0.4 0.5 0.5 0.3 0.3 0.3 0.4 Exports (goods and services) 115.2 52.8 4.9 13.4 7.5 3.7 1.0 4.4 6.5 Final demand 328.8 150.6 3.0 6.0 2.5 1.1 1.5 2.9 4.0 Imports (goods and services) 110.4 50.6 4.6 11.6 5.9 1.2 3.0 5.1 6.7 GNI at constant prices (GDP deflator) 216.3 99.1 2.3 3.4 0.5 2.3 0.5 1.8 2.5 Contribution to GDP growth : Domestic demand 2.3 3.3 0.0 -0.2 1.8 2.1 2.4
Stockbuilding 0.0 -0.7 -0.1 -0.1 0.0 0.0 0.1Foreign balance 0.1 0.8 0.9 1.4 -1.0 -0.3 0.0
Employment 0.2 1.0 0.6 0.0 0.3 0.4 0.7 Unemployment (a) 3.4 3.7 3.6 4.3 4.4 4.5 4.3 Compensation of employees/head 4.4 2.2 1.4 2.2 2.7 2.6 2.7 Unit labour costs 2.2 -0.2 1.3 0.8 2.3 1.2 0.9 Real unit labour costs -0.6 -1.6 -0.7 -0.5 0.3 -0.3 -0.3 Savings rate of households (b) - - 12.1 12.8 12.6 12.5 13.1 GDP deflator 2.8 1.4 2.1 1.4 2.0 1.5 1.2 Private consumption deflator 2.9 1.4 2.2 1.1 1.8 1.4 1.3 Harmonised index of consumer prices - 2.0 2.3 1.7 1.3 1.4 1.3 Trade balance (c) -3.7 -1.3 -0.5 1.8 1.1 0.9 0.7 Balance on current transactions with ROW (c) -1.1 -2.6 -1.9 0.5 -0.4 -0.4 -0.4 Net lending(+) or borrowing(-) vis-à-vis ROW (c) -1.1 -2.8 -2.2 0.2 -0.4 -0.4 -0.4 General government balance (c)(d) -3.1 -1.5 0.2 -0.2 -1.1 -1.1 -1.9 General government gross debt (c) 56.9 67.0 67.1 66.6 65.0 65.5 65.3 (a) as % of civilian labour force. (b) gross saving divided by gross disposable income. (c) as a percentage of GDP. (d) Including proceeds relative to UMTS licences (see for more details note 10 on concepts and sources).
61

12. Portugal Export-led recovery from recession
Overall developments and prospects
Following the cyclical downturn since 2001, which ended in a recession with GDP falling by an estimated 1.3% in 2003, economic activity is projected to start recovering as from the first half of 2004.
Real GDP is forecast to gain about ½% in each quarter during 2004. However, given the negative carryover from 2003, GDP growth is projected to attain only ¾% on annual average. In 2005, the assumed sustained recovery of output is projected to raise annual growth of GDP to about 2¼%.
However, domestic demand is projected to lag behind GDP growth. Although both private consumption and investment are expected to gradually strengthen, both components are projected to grow at a moderate pace as private sector agents continue to redress their balance sheets. Government spending, for its part, will be constrained by continued efforts at budgetary consolidation.
The economic recovery is seen driven by dynamic export growth, reflecting the strengthening of foreign demand (from 2¾% in 2002-2003 to about 7% in the period 2004-2005) and supported by improved price-competitiveness. As a consequence of the differential pattern of external versus domestic demand, the current account (including net capital transactions) is expected to be close to balance by the end of the forecast period.
Prices
As a result of moderate import prices and low wage pressure, HICP inflation is set to decelerate further, to an average of just above 2% in the projection period.
Labour market
In the period 2002-2003, total employment declined by a cumulative 0.6%, while the unemployment rate increased from 4.1% in 2001 to 6.4% in 2003. In the period 2004-2005, the projected economic recovery is expected to generate a cumulative increase in employment of nearly 1%, keeping the unemployment rate below 7%, edging down at the end of the period.
The cyclical downturn, together with a quasi-freeze in government wages for the period 2003-2004, is expected to have a dampening impact also on wage settlements in the private sector of the economy. Growth of total wages per employee is projected to decelerate from 5½% in 2002 to about 2½% on average in the period 2004-2005, such that the trend decline in price-competitiveness looks set to come to a halt.
Households’ real disposable income is expected to grow by about ¾% per year. Given the assumptions for employment and wage behaviour, this is a relatively strong pace, reflecting to some extent also declining inflation and strong social transfers.
Public finance
According to the latest reporting of deficit and debt figures, which has been validated by Eurostat, the general government deficit reached an estimated value of 2.8% of GDP in 2003 (2.7% in 2002).
The economic recession of 2003, leading to a large negative output gap, has considerably hindered the process of budgetary consolidation. In fact, a massive shortfall in tax revenue developed during 2003 (excluding the one-off operation on the sale of tax and social security contributions arrears).
On the expenditure side, by contrast, the government has been broadly successful in securing the planned restraint. Growth of total current primary expenditure continued to decelerate from 8.9% in 2001 to 7.8% in 2002 and 4.1% in 2003. This basically reflects the sharp slowdown in government consumption due to
-3-2-101234567
95 96 97 98 99 00 01 02 03 04 05-10-9-8-7-6-5-4-3-2-101
Net external balance (rhs)
% of GDP%
Domestic demand growth (lhs)
GDP growth (lhs)
Graph 3.12 : Portugal - Growth, demand and foreign balance
62

Chapter 3 Member States, Portugal
the quasi-freeze of employment and nominal wages in 2003. However, these revenue and expenditure developments would have led to a government deficit clearly above 3% of GDP in 2003. In order to prevent this, the Portuguese authorities relied on two one-off measures, together worth 2.1% of GDP, namely a lump-sum payment from a public enterprise to the government in exchange of the transfer to the latter of the responsibility for paying pensions, and the sale to a financial institution of the right to the amounts collected in future concerning tax and social security contributions arrears.
The budget for 2004 targets a general government deficit of 2.8% of GDP. The forecast takes on board the measures included in the budget, including the one-off measures planned so far for 2004 worth € 1 billion (or 0.7% of GDP).
However, the Commission projects a general government deficit of 3.4% of GDP for 2004, thereby
above the official target. This difference can basically be accounted for by three elements: (i) a growth estimate ¼ pp lower in the Commission’s forecast; (ii) base effects due to the significant amount of one-off measures adopted in 2003, mainly affecting the revenue side; and (iii) the partial substitution of those one-off measures i.e. from 2.1% of GDP to so far a planned value of 0.7% of GDP.
For 2005, the forecast for the general government deficit is based on legislation currently in force (the “no-policy-change” assumption). The deficit is projected to rise to 3.8% of GDP, reflecting the persistence of a sizeable negative output gap, and the phasing out of all one-off measures.
Table 3.12 Main features of country forecast - PORTUGAL
2002 Annual percentage changebn Euro Curr. prices % GDP 1981-99 2000 2001 2002 2003 2004 2005
GDP at constant prices 129.2 100.0 3.0 3.4 1.7 0.4 -1.3 0.8 2.2 Private consumption 78.3 60.7 3.0 2.9 1.3 0.6 -0.7 0.7 1.2 Public consumption 27.4 21.2 4.1 4.1 3.5 2.4 -0.6 -0.8 0.0 GFCF 32.1 24.9 4.1 3.8 0.1 -5.6 -9.6 -0.9 5.0 of which : equipment 14.9 11.5 4.0 4.7 -3.8 -9.4 -6.8 1.3 7.6 Change in stocks as % of GDP 0.4 0.3 0.6 0.6 0.6 0.6 0.4 0.4 0.4 Exports (goods and services) 39.5 30.6 6.4 7.8 1.8 2.4 3.9 5.6 6.6 Final demand 177.8 137.6 4.0 4.1 1.4 0.1 -1.2 1.5 3.1 Imports (goods and services) 48.8 37.8 7.3 5.5 0.9 -0.6 -0.9 2.9 5.1 GNI at constant prices (GDP deflator) 127.0 98.3 3.1 2.5 1.5 0.7 -1.2 0.8 2.2 Contribution to GDP growth : Domestic demand 3.6 3.6 1.5 -0.7 -3.1 0.1 2.0
Stockbuilding 0.0 -0.3 0.0 0.0 0.0 0.0 0.0Foreign balance -0.6 0.1 0.2 1.1 1.8 0.8 0.2
Employment 0.3 2.1 1.3 0.3 -0.8 0.2 0.7 Unemployment (a) 6.6 4.1 4.1 5.1 6.4 6.8 6.7 Compensation of employees/head 14.4 6.7 5.7 4.0 3.3 2.3 2.7 Unit labour costs 11.4 5.5 5.3 3.8 3.8 1.6 1.2 Real unit labour costs -0.3 1.9 0.8 -1.2 1.4 -0.7 -0.9 Savings rate of households (b) - - 12.0 12.3 11.7 11.5 11.3 GDP deflator 11.8 3.5 4.5 5.1 2.3 2.4 2.1 Private consumption deflator 11.5 3.3 3.8 4.2 3.4 2.0 2.2 Harmonised index of consumer prices - 2.8 4.4 3.7 3.3 2.0 2.2 Trade balance (c) -11.7 -11.7 -10.7 -9.4 -8.5 -7.7 -7.3 Balance on current transactions with ROW (c) -4.1 -10.8 -9.7 -7.4 -5.0 -3.9 -3.6 Net lending(+) or borrowing(-) vis-à-vis ROW (c) - -9.0 -7.9 -5.6 -2.9 -1.7 -1.3 General government balance (c)(d) -5.8 -2.8 -4.4 -2.7 -2.8 -3.4 -3.8 General government gross debt (c) 56.5 53.3 55.6 58.1 59.4 60.7 62.0 (a) as % of civilian labour force. (b) gross saving divided by gross disposable income. (c) as a percentage of GDP. (d) Including proceeds relative to UMTS licences (see for more details note 10 on concepts and sources).
63

13. Finland Growth picking up on a broader base
The economy in 2003
Even though economic activity held up better than expected, growth of real GDP moderated to 1.9% from 2.3% in 2002. Domestic demand provided the main support, while the contribution from external demand was subdued. Household consumption, fuelled by higher earnings, tax cuts on income and automobiles, and low interest rates, grew by 3.6%. Purchases of durable consumer goods were particularly buoyant. Public consumption moderated from 2002 to 0.7%. Total investment contracted for the second consecutive year. Although residential construction increased strongly, this was more than offset by a slump in investment in equipment and commercial building. Due to uncertainties in the global economy and strong euro, demand for exports was weaker than anticipated. The growth contribution from net exports fell to 0.3 as exports and imports increased by 1.3% and 0.9%, respectively. The weakening in the terms of trade continued as export prices fell and import prices rose slightly.
Reflecting the subdued activity, employment declined by 0.3% from 2002. Nevertheless, unemployment remained broadly stable as labour supply contracted as well. Inflation (HICP) eased from an average of 2.0% in 2002 to 1.3% in 2003, on account of lower prices of services and the stronger euro holding import prices down.
Prospects for 2004 and 2005
Downside risks in the international economy seem to have abated during the latter part of 2003 and also
survey indicators seem to point to a more positive outlook. Growth in 2004, while again being mainly driven by private consumption, should receive increasing support from exports and investments. Consequently, activity is set to expand at a steady pace throughout the year, yielding average growth over 2½% in 2004 and 2.7% in 2005.
Job creation is expected to pick up slightly as from 2004, allowing some modest inroads into unemployment.
GDP components
Private consumption is expected to continue to drive the economy on the back of steady gains in disposable income following from wage increases and income tax cuts in 2004. In addition, higher dividend income of households, as dividends will be partly double taxed from 2005, together with low inflation will increase real disposable income. Public consumption is expected to increase modestly, given the efforts of the central government at expenditure control. Investment, seem to have bottomed out during the second half of 2003 and given the projected stronger stimulus from external demand and improving capacity utilisation, is projected to revive in 2004-2005.
Exports are expected to strengthen on the back of the improved international economic outlook and to further accelerate in 2005. In spite of tightening competition, the prospects for exports of telecommunication equipment appear promising. Also the outlook for the forest industry seems to be relatively favourable. However, higher consumer spending is expected to raise imports, squeezing the contribution from the external side to GDP growth.
Labour market, costs and prices
Alcohol tax cuts of 33% on average and lower import prices will reduce price pressures, bringing HICP inflation to below ½% in 2004. In 2005, inflation may rise to 1.5%, as the economy expands and the effect of the tax cut fades away. The centralised two-year wage agreement provides for general wage rises of 2.2% in 2004. Assuming the usual wage drift of about 1 percentage point, per-capita wages are expected to increase by about 3½% in 2004-05. However, accelerating productivity growth appears likely to curb the rise in unit labour costs.
-2
-1
0
1
2
3
4
5
6
7
96 97 98 99 00 01 02 03 04 05
yoy % ch.
Forecast
Graph 3.13 : Finland - Contributions to GDP growth
GDP
Fin. dom. demand
StocksExternal demand
64

Chapter 3 Member States, Finland
Public finances
The general government surplus turned out at 2.3% of GDP in 2003, broadly as anticipated. Central government finances were still in surplus, although they have been on a declining trend for three consecutive years, while municipalities continued to stay in deficit. Based on the government’s medium-term spending guidelines of Spring 2004 and the budget for 2004, the general government surplus is estimated to stay around 2% of GDP during the forecast period. Central government finances are seen to be in deficit in 2004-05. This results from rising expenditures and modestly growing overall revenue intake. Moreover, the financial position of local governments appears to stay in deficit due to weak growth in tax receipts and higher consumption expenditures. Overall, the general government surplus will be supported by the social security funds.
In 2003, general government gross debt rose by 2.7 percentage points to 45.3% of GDP due mainly to a technical change in the classification of central government debt as the repo portfolio was removed from the State Treasury’s balance sheet. The debt ratio is anticipated to ease to about 44.3% of GDP by the end of the forecast period.
Table 3.13 Main features of country forecast - FINLAND
2002 Annual percentage changebn Euro Curr. prices % GDP 1981-99 2000 2001 2002 2003 2004 2005
GDP at constant prices 139.8 100.0 2.3 5.1 1.1 2.3 1.9 2.6 2.7 Private consumption 71.1 50.9 2.2 3.1 1.8 1.5 3.6 3.0 2.4 Public consumption 30.3 21.7 2.1 0.0 2.4 3.8 0.7 1.3 1.3 GFCF 26.6 19.0 0.8 4.1 3.9 -3.1 -2.3 1.4 2.3 of which : equipment 8.0 5.7 1.1 -1.0 12.0 -9.1 -6.4 0.6 2.0 Change in stocks as % of GDP 0.0 0.0 0.1 0.9 0.2 0.4 0.0 0.0 0.0 Exports (goods and services) 54.1 38.7 5.2 19.3 -0.8 5.1 1.3 4.0 5.2 Final demand 182.2 130.3 2.5 8.2 0.9 2.5 1.6 2.8 3.1 Imports (goods and services) 42.4 30.3 4.0 16.9 0.2 1.9 0.9 3.3 4.3 GNI at constant prices (GDP deflator) 139.6 99.8 2.3 5.4 1.7 2.8 1.5 2.6 2.7 Contribution to GDP growth : Domestic demand 1.8 2.3 2.1 0.9 1.5 2.0 1.9
Stockbuilding -0.1 1.0 -0.7 0.2 0.1 -0.1 0.0Foreign balance 0.6 2.9 -0.5 1.8 0.3 0.6 0.9
Employment -0.2 2.3 1.5 0.9 -0.3 0.1 0.5 Unemployment (a) 8.5 9.8 9.1 9.1 9.0 8.9 8.6 Compensation of employees/head 6.5 3.7 4.7 1.9 3.3 3.3 3.4 Unit labour costs 3.8 0.9 5.1 0.6 1.1 0.8 1.1 Real unit labour costs -0.8 -2.2 2.1 -0.3 0.4 0.4 -0.2 Savings rate of households (b) - - 7.4 7.5 7.6 8.7 7.4 GDP deflator 4.6 3.2 3.0 0.9 0.7 0.4 1.3 Private consumption deflator 4.5 3.6 3.5 3.1 1.7 0.6 1.7 Harmonised index of consumer prices - 3.0 2.7 2.0 1.3 0.4 1.5 Trade balance (c) 4.3 11.4 10.4 9.7 8.3 8.2 8.3 Balance on current transactions with ROW (c) -0.5 7.2 6.9 7.4 5.5 5.5 5.6 Net lending(+) or borrowing(-) vis-à-vis ROW (c) -0.3 7.3 7.0 7.2 5.6 5.6 5.6 General government balance (c) 0.4 7.1 5.2 4.3 2.3 2.0 2.1 General government gross debt (c) 31.3 44.6 43.9 42.6 45.3 44.5 44.3 (a) as % of civilian labour force. (b) gross saving divided by gross disposable income. (c) as a percentage of GDP.
65

14. Sweden Steady recovery after a mild trough
The situation in 2003
Swedish economic growth decelerated mildly in 2003, with GDP growth of 1.6%, compared with 2.1% in 2002. Exports improved considerably after two years of poor growth. At the same time, imports rose faster but overall, net exports contributed positively to growth. On the domestic side, economic activity was mixed. Private consumption growth was relatively strong and grew faster than in 2002, despite negative employment growth. Relatively high consumer confidence, buoyed by a rise in share prices and in house prices is likely to have contributed to this. By contrast, investment developed very poorly and fell for the third year in a row. Public consumption growth eased considerably, reflecting some budgetary constraints. Inflation has come down markedly in recent months and as inflationary pressures should remain subdued, the Riksbank cut the repo-rate again in early 2004.
Prospects in 2004 and 2005
Recent indicators are positive, with both consumers and business expectations at relatively high levels. The consumer confidence indicator, and in particular consumers' expectations regarding their own economic situation, continued to give a positive picture in March, though slightly down from February. Business confidence indicators too are encouraging. The industrial confidence indicator has been rising since last autumn and stood above its long-term average in March. The purchasing
managers index too has risen in recent months and was well above the 50-mark in February. These prospects are expected to result in a continuation of the recovery in 2004. Domestic demand growth should become stronger and external demand growth should pick up further during 2004, resulting in stronger exports and a larger positive contribution from net exports. In 2005, economic growth is expected to continue to strengthen, as the recovery should be more firmly in place. Overall, GDP is expected to grow by 2.3% in 2004 and 2.6% in 2005.
Disposable income growth is expected to be stronger in 2004 compared with last year, providing for continued steady growth in private consumption. Consumer confidence has improved significantly recently. Financial wealth has partially recovered from the long slump in the stock markets, with the recent rise in equity prices. House prices have continued to rise steadily, contributing to a relatively strong wealth position of households. In 2005, a resumption of employment growth is expected to contribute to household disposable income. Moreover, the saving rate of households remained very high at 11% in 2003, though it was down compared with the previous year. An additional modest reduction of the saving rate is expected this year and next. All in all, this should result in stable consumption growth in the years to 2005. Public consumption is expected to continue to be relatively weak over the forecast period, in part due to budgetary constraints at the local and central level. The latest investment survey in industry point to a strong expansion in 2004 and the improved outlook for external demand, including for the ICT sector, suggest higher investment. A rise in investment is foreseen for 2004 and further in 2005, as economic activity gathers momentum and the productive capacity needs to be expanded, following a period of falling investment. In 2004 and 2005, a further recovery in exports is expected, as noted above. Imports too should continue to rise, in particular in 2005, as final demand recovers gradually, resulting in a positive contribution from net exports in 2004 and slightly so also in 2005.
Labour market, costs and prices
Employment growth has been negative since the latter half of 2003. During the same period the unemployment rate has risen, in part as a result of
0
1
2
3
4
5
6
94 95 96 97 98 99 00 01 02 03 04 05
Graph 3.14: Sweden - GDP growth
yoy % ch.
Sweden
Euro area
66

Chapter 3 Member States, Sweden
fewer people engaged in labour market programmes. The gradual increase in economic activity foreseen from 2004 onwards is expected to result in an improvement in the labour market only in 2005.
Inflation has come down considerably since the electricity and energy price hike last year and also reflecting relatively weak economic activity in 2003. Inflationary pressures should be very subdued this year and as demand and growth revives further in 2005, inflation is expected to gradually rise towards 2% at the end of 2005. With gradually stronger growth over this period, interest rates may start to rise next year. New wage agreements for most of the labour market are expected to be reached this spring and are likely to result in moderate wage increases. This can partly be attributed to the deterioration in the labour market since last year, expected to continue into this year and only revert in 2005.
Public finances
In 2004, the surplus in public finances is expected to remain relatively low. Despite stronger economic growth being projected this year, the continued poor developments in the labour market, with a rise in the unemployment rate, weigh on the public finances. In 2004, the expenditure ceiling on central government, announced in the Budget Bill for 2004, helps to contain expenditure. In 2005, a higher surplus in the public finances is projected on current policies, due to stronger economic activity and an expected improvement in the labour market. General government debt, which mainly lies in central government, is projected to rise as central government is expected to remain in deficit over the forecast period. The rise is however slower than nominal GDP over the forecast period, resulting in a fall in the debt ratio to a bit above 50% of GDP in 2005.
Table 3.14 Main features of country forecast - SWEDEN
2002 Annual percentage changebn SEK Curr. prices % GDP 1981-99 2000 2001 2002 2003 2004 2005
GDP at constant prices 2347.4 100.0 2.0 4.3 0.9 2.1 1.6 2.3 2.6 Private consumption 1143.8 48.7 1.4 4.9 0.4 1.4 2.0 2.3 2.5 Public consumption 658.5 28.1 1.4 -1.2 0.9 3.2 0.7 0.7 0.5 GFCF 391.4 16.7 1.9 5.7 -1.0 -3.0 -2.0 1.5 5.6 of which : equipment 167.8 7.2 5.3 5.0 -4.1 -5.7 -3.5 2.0 6.1 Change in stocks as % of GDP 2.1 0.1 0.2 0.7 0.3 0.1 0.3 0.4 0.4 Exports (goods and services) 1031.9 44.0 5.7 11.5 0.2 1.2 5.9 6.2 6.5 Final demand 3227.7 137.5 2.5 6.5 -0.1 1.0 2.7 3.2 3.8 Imports (goods and services) 880.3 37.5 4.3 11.3 -2.5 -1.9 5.4 5.4 7.0 GNI at constant prices (GDP deflator) 2338.0 99.6 1.9 4.5 0.8 2.5 1.9 2.3 2.6 Contribution to GDP growth : Domestic demand 1.4 3.0 0.2 0.9 0.8 1.6 2.3
Stockbuilding -0.1 0.5 -0.4 -0.2 0.2 0.1 0.0Foreign balance 0.6 1.1 1.1 1.4 0.5 0.7 0.3
Employment -0.1 2.4 1.9 0.2 -0.2 -0.4 0.4 Unemployment (a) 5.1 5.6 4.9 4.9 5.6 6.1 5.8 Compensation of employees/head 6.5 7.5 4.5 2.7 2.5 3.4 3.5 Unit labour costs 4.3 5.5 5.5 0.8 0.6 0.6 1.3 Real unit labour costs -0.8 4.1 3.2 -0.7 -1.6 -1.2 -0.8 Savings rate of households (b) - - 11.3 12.7 11.0 10.6 10.1 GDP deflator 5.2 1.3 2.3 1.4 2.3 1.9 2.1 Private consumption deflator 5.7 1.2 2.4 1.8 2.5 1.0 1.6 Harmonised index of consumer prices - 1.3 2.7 2.0 2.3 1.2 1.6 Trade balance (c) 3.5 6.5 6.7 6.5 6.3 6.7 6.8 Balance on current transactions with ROW (c) 0.6 4.2 4.4 5.1 5.5 6.0 6.1 Net lending(+) or borrowing(-) vis-à-vis ROW (c) -0.2 4.0 4.3 5.1 5.5 5.9 6.0 General government balance (c) -2.3 5.1 2.8 0.0 0.7 0.2 0.7 General government gross debt (c) 60.4 52.8 54.4 52.6 51.9 51.8 50.5(a) as % of civilian labour force. (b) gross saving divided by gross disposable income. (c) as a percentage of GDP.
67

15. United Kingdom Above-trend growth, as investment and net exports revive
The situation in 2003
The UK economy weathered the recent global slow-down relatively well, with growth slightly below trend at 2.2%. Strong household consumption and general government spending continued to drive growth, offset by weakness in net exports.
Though weaker overall than 2002, private consumption expenditure remained a significant driver of growth, particularly in the second half of the year. Fixed investment picked up strongly over the course of 2003, while general government consumption also remained firm. The pickup in the global economy meant that the drag on growth from net exports slowed, with firm export growth notable in Q4. However, weakness in the sterling effective exchange rate during the first half of the year was largely reversed by the subsequent appreciation, thus removing a potential stimulus to growth in export volumes.
Growth was strongest in the service and construction sectors, where continued strength in housing construction caused output to grow by 5%. Manufacturing output grew for 4 consecutive quarters for the first time since 2000.
The labour market has remained strong, with unemployment falling to around 5%. Despite this, inflationary pressures have remained subdued. In December 2003, the Government announced that the Bank of England would switch to a symmetric
inflation target based on the harmonised index of consumer prices, known in the UK as CPI. CPI remained comfortably below the new 2% target throughout 2003, within the permitted one-percentage-point symmetrical margin.
Autumn 2003 also saw extensive revisions to historical national accounts data by the Office for National Statistics following methodological improvements. The new numbers indicate that UK GDP growth was more robust between 1998 and 2000, and more balanced than previously thought, with less household and general government consumption and better corporate investment and exports.
Prospects in 2004 and 2005
Growth is forecast to be slightly above trend in both 2004 and 2005, reaching around 3% in 2004, before moderating to 2.8% in 2005. The current estimated negative output gap, of around ½% of GDP, should therefore close over the forecast horizon. Domestic demand is expected to strengthen in 2004, with continued strength in household consumption, and a significant pick-up in corporate investment. As the global outlook improves, exports should also improve.
Strong household consumption growth is expected to moderate over the forecast period from the robust growth reported in the second half of 2003, as house price growth slows and interest rate rises begin to bite. In line with the government’s plans, growth of government consumption will continue to support growth throughout the forecast period.
Fixed investment is expected to recover strongly following a prolonged period of weakness, due to improvements in business expectations. Construction growth is forecast to moderate, more than offset by markedly stronger investment in equipment.
Robust growth of investment in equipment should contribute to higher goods imports. However, despite strong growth in exports throughout the forecast period as the global outlook improves, net exports will continue to act as a drag on GDP growth in 2004.
Labour market, costs and prices
Unemployment is expected to remain low and stable at around 5%, close to its NAIRU level, throughout
0
1
2
3
4
5
94 95 96 97 98 99 00 01 02 03 04 05
Graph 3.15: United Kingdom - GDP growth
yoy % ch.
Euro area
United Kingdom
68

Chapter 3 Member States, United Kingdom
the forecast period. Employment should continue to grow, though more moderately than in recent years. In the face of strengthening demand, wage growth is expected to rise, particularly as bonus payments become more widespread. However, with productivity growth expected to improve from the low rate observed in 2003, unit labour cost rises should be moderate over the forecast period.
Both consumer and producer output price indices suggest inflationary pressures remain subdued. At 1.3% in December, CPI inflation is low, but is expected to rise toward its 2% target over the forecast period as the output gap closes. In taking a forward-looking approach to monetary policy, the Bank of England has raised interest rates twice, by 25 basis points in both November 2003 and February 2004.
Public finances
The public finances have deteriorated markedly since 2002. In 2003, the general government finances
recorded a deficit of 3.2% of GDP, significantly higher than the UK authorities’ forecasts in April 2003, in large part due to a downgrading of expected revenue linked to composition effects of GDP growth and to higher discretionary expenditure related to the Iraq war. The deficit is expected to narrow over the forecast period as discretionary expenditure growth is forecast to slow relative to 2003 - it is assumed that expenditure will turn out broadly as projected by the authorities, in nominal terms. Revenues, notably income and corporation tax, are expected to increase as a consequence of stronger GDP growth, but at a lower pace than in the Budget forecast. The projected deficits decline to around 2.8% of GDP in 2004, declining further to 2.6% in 2005. The ratio of gross debt to GDP, though increasing slightly, is expected to be close to 40% by the end of 2005.
Table 3.15 Main features of country forecast - UNITED KINGDOM
2002 Annual percentage changebn GBP Curr. prices % GDP 1981-99 2000 2001 2002 2003 2004 2005
GDP at constant prices 1043,3 100,0 2,5 3,8 2,1 1,6 2,2 3,0 2,8Private consumption 691,5 66,3 3,0 4,6 3,1 3,4 2,5 2,9 2,1Public consumption 210,1 20,1 1,0 1,9 1,7 2,5 1,8 2,1 2,6GFCF 170,2 16,3 3,5 3,6 3,6 1,8 2,9 6,4 5,6
of which : equipment 70,9 6,8 4,8 1,8 0,8 -6,7 -3,3 5,5 6,1Change in stocks as % of GDP 1,8 0,2 0,2 0,6 0,3 0,2 0,2 0,2 0,1Exports (goods and services) 273,3 26,2 4,5 9,4 2,5 -0,4 -0,1 5,1 6,7Final demand 1346,8 129,1 3,1 5,0 2,7 2,1 1,9 3,7 3,5Imports (goods and services) 304,7 29,2 5,7 9,1 4,5 4,0 0,9 5,9 5,8GNI at constant prices (GDP deflator) 1063,2 101,9 2,5 4,4 2,7 2,8 2,2 2,4 2,9
Contribution to GDP growth : Domestic demand 2,6 4,0 3,0 3,0 2,6 3,4 2,9Stockbuilding 0,1 -0,1 -0,2 -0,2 0,0 0,0 -0,1Foreign balance -0,2 -0,1 -0,6 -1,3 -0,3 -0,5 0,0
Employment 0,4 1,4 0,7 0,2 0,9 0,4 0,3Unemployment (a) 8,9 5,4 5,0 5,1 5,0 5,0 5,0Compensation of employees/head 6,7 5,6 5,1 4,3 4,3 5,0 5,0Unit labour costs 4,6 3,2 3,6 2,8 3,0 2,3 2,5Real unit labour costs -0,3 1,7 1,3 -0,5 -0,1 -0,5 -0,1Savings rate of households (b) - - 6,7 5,5 5,7 5,4 5,9GDP deflator 4,9 1,4 2,3 3,3 3,1 2,8 2,6Private consumption deflator 4,9 1,1 2,2 1,3 1,5 1,8 1,9
Harmonised index of consumer prices - 0,8 1,2 1,3 1,4 1,6 1,9Trade balance (c) -2,0 -3,5 -4,1 -4,5 -4,2 -4,1 -4,0Balance on current transactions with ROW (c) -1,4 -2,5 -2,4 -1,7 -1,7 -2,1 -1,8Net lending(+) or borrowing(-) vis-à-vis ROW (c) -1,2 -2,4 -2,2 -1,6 -1,6 -1,9 -1,7General government balance (c)(d) -2,8 3,9 0,7 -1,6 -3,2 -2,8 -2,6General government gross debt (c) 47,0 42,1 38,9 38,5 39,7 40,1 40,6(a) as % of civilian labour force. (b) gross saving divided by gross disposable income. (c) as a percentage of GDP.(d) Including proceeds relative to UMTS licences.
69


Chapter 4 Acceding countries

Acceding countries More investment ahead
The perspective of accession generated a positive growth stimulus in 2003 Private consumption, increasing at about 4½ % in the acceding countries as a whole was supporting growth with the notable exception of Slovakia. In particular, private consumption was strong in the Baltic States, Hungary and the Czech Republic. The purchasing power of households increased thanks to relatively low inflation which was at the level of the euro area in the acceding countries as a whole (2.1 %), while wage growth remained strong. Household spending was further underpinned by increased borrowing and a certain amount of consumer expenditure was brought forward in expectation of price rises in 2004.
By contrast, investment activity was weak (except in the Baltic States), reflecting not only the global situation, but also the stalling reform process in the acceding countries. Surprisingly, exports did very well, in spite of the lack of demand in the EU, the main trading partner of the new Member States. This can mainly be explained by an improved export basket as acceding countries reap the benefits from the foreign direct investment of the past. Slovakia is a clear example of this. In Poland, however, the depreciation of the zloty, contributed significantly to the good export performance.
Investment set to become a driver of growth
After the recent weak performance, total investment growth is expected to accelerate from 1.9 % last year to 5¾ % and 7¼ % in 2004 and 2005, respectively.
Favourable monetary conditions, the recovery in the EU and the need to improve infrastructure are the factors which should stimulate investment. In general economic activity will be supported by the availability of EU funds. Including pre-accession aid which is phased out, about EUR 31 billion (about 7% of GDP of the acceding countries) is available in payment appropriations in the period 2004-2006 for the 10 new Member States. A contribution to the EU budget of about EUR 13.5 billion (4 % of GDP) is expected from the acceding countries in the same period, leaving the new Member States as net beneficiaries overall.
Private consumption is forecast to remain robust, though weakening somewhat as inflation picks up eroding real disposable income. Exports are expected to benefit from the recovery in the EU, but the net external contribution to growth is likely to become negative as the strength of domestic demand in the acceding countries fuels imports.
The new Member States with the lowest per capita GDP are expected to grow the fastest, accelerating the process of catching up with the standard of living in the EU. Benefiting from macroeconomic stability, the Baltic States are expected to post growth rates above 5 % in 2004-2005. The strongest acceleration of growth is forecast in Poland (from 1½ % in 2002 to almost 5 % in 2005) on the back of an expansionary fiscal policy. Among the high-income acceding countries, Cyprus is also expected to grow relatively strongly, but the prospects of re-unification entails both upside and downside risks.
Labour market, costs and prices
In 2003, employment continued to decline, particularly in Poland. As a consequence, the unemployment rate remained high at 14.3 % on average. In 2004-2005, employment is expected to increase moderately as the economy picks up and new activities develop, compensating for the job losses in the restructuring process. The unemployment rate will decline only slowly to 13.8 % in 2005, in the acceding countries as a whole. In the wake of the significant wage increases in some new Member States (Estonia, Hungary, Latvia, Slovakia, Slovenia) in 2003, putting upward pressure on unit labour costs, compensation per employee is expected to increase more moderately this year and next.
Graph 4.0: Acceding countries - growth and GDP per capita
CY CZ
EE
HU
LV LT
MT
PL SK
SI
0
2
4
6
8
30 35 40 45 50 55 60 65 70 75 80
rea l GDP gro wth(average 2003-2005)
GDP /capita (P P S as % o f EU-15, average 1998-2002)
72

Chapter 4 Acceding Countries
At 2.1% on average, inflation was particularly low in 2003 in the new Member States (except in Hungary, Slovakia and Slovenia). An acceleration is, however, expected in 2004 to 3.8 % on average in the acceding countries as a result of an increase in excise taxes and VAT because levels have to be harmonised with the EU. Inflationary pressures should ease in 2005.
High government deficits, but generally declining
According to their first notification to the European Commission under the Excessive Deficit Procedure, most government balances in the acceding countries in 2003 turned out better than expected in the Commission’s autumn forecasts. Only in the Czech Republic was the deficit significantly revised upwards because of the inclusion of some state guarantees. On average, the general government deficit in the
acceding countries is estimated to be 5.7% of GDP in 2003, ranging from a surplus in Estonia to a deficit of 12.9 % of GDP in the Czech Republic. Five other countries have deficits in excess of 3% of GDP: Cyprus, Hungary, Malta, Poland and Slovakia.
In view of the importance of budgetary consolidation for the adoption of the euro, efforts are being stepped up and government balances are expected to improve in most new Member States in 2004, with the notable exception of Poland, where a major fiscal reform package (the Hausner plan) will start to have an effect only in 2005. Budgetary balances are also worsening in the Baltic Sates despite strong growth because of accession-related expenditures.
Table 4.0 Main features of country forecast - ACCEDING COUNTRIES
2002 Annual percentage change
bn Euro Curr. prices % GDP 1995-99 2000 2001 2002 2003 2004 2005 GDP at constant prices 439.4 100.0 4.4 4.1 2.5 2.4 3.6 4.0 4.2Private consumption 268.3 61.1 - 3.3 2.2 4.5 4.4 3.7 4.0Public consumption 86.7 19.7 - 1.2 2.7 2.8 1.7 1.0 1.4
GFCF 95.6 21.8 - 3.5 -0.9 -0.6 1.9 5.7 7.3 of which : equipment - - - - - - - - - Change in stocks as % of GDP 3.6 0.8 1.6 2.0 1.0 0.8 1.2 1.3 1.2Exports (goods and services) 208.0 47.3 - 18.5 7.1 4.4 9.6 8.9 8.5Final demand 662.2 150.7 - 8.0 2.8 3.2 5.6 5.7 6.0
Imports (goods and services) 222.8 50.7 - 15.1 4.2 4.6 8.6 8.1 8.4 GNI at constant prices (GDP deflator) 430.7 98.0 4.2 4.2 2.4 1.7 3.5 4.0 4.2 Contribution to GDP growth : Domestic demand - 3.1 1.6 3.0 3.4 3.8 4.5
Stockbuilding - 0.4 -0.9 -0.2 0.1 0.1 0.0Foreign balance - 0.8 1.1 -0.4 0.3 0.2 -0.2
Employment - -0.1 -0.1 -0.7 -0.4 0.3 0.8 Unemployment (a) 10.5 13.6 14.5 14.8 14.3 14.1 13.8Compensation of employees/head - 6.3 11.5 6.0 4.7 4.8 5.2
Unit labour costs - 2.1 8.7 2.8 0.7 1.1 1.6Real unit labour costs - -4.8 3.6 -0.1 -1.7 -2.1 -1.5Savings rate of households (b) - - - - - - -
GDP deflator 13.0 7.3 4.9 2.9 2.4 3.3 3.2Private consumption deflator - 7.9 5.9 2.1 1.9 3.5 3.2Harmonised index of consumer prices - 8.5 5.7 2.7 2.1 3.8 3.3Trade balance (c) -6.5 -7.8 -5.9 -5.1 -4.6 -4.6 -4.8Balance on current transactions with ROW (c) - - - - -3.7 -3.9 -4.1
Net lending(+) or borrowing(-) vis-à-vis ROW (c) - - - - -3.7 -3.7 -3.8 General government balance (c) - -3.2 -4.1 -4.9 -5.7 -5.0 -4.2 General government gross debt (c) - 36.4 38.5 39.4 42.2 44.4 45.2 (a) as % of total labour force. (b) gross saving divided by gross disposable income. (c) as a percentage of GDP.
73

1. Cyprus Continued moderate growth and fiscal slippage in 2003, renewed fiscal consolidation efforts to start in 2004
The situation in 2003
In 2003 the decline in tourist arrivals continued, as a result of the Iraq war, SARS, and low EU growth. GDP growth in 2003 is therefore estimated at a modest 2%, similar to 2002. From July onward a gradual restrained recovery seems to be on the way, with Q3 and Q4 growth at 2-2.5%. The expansion continued to be domestic-demand led, notably in construction investment and government consumption, as fiscal policy remained expansionary and the government deficit widened. Consumption growth was modest at 1.5% in 2003, following real wage growth, although disposable income increased due to tax reform and continuing full-employment conditions, and consumer confidence picked up somewhat. Investment declined by nearly 3.0%, although when corrected for ships/aircraft purchases in 2002, growth would still be above 4%, while construction investment remained buoyant. Demand was supported by lower interest rates after the Central Bank of Cyprus (CBC) lowered rates by 50 points to 4.5% in April 2003 which, together with somewhat higher inflation rates, reduced real interest rates.
Following a 10% decline in 2002, tourist arrivals dropped a further 5% in 2003 (although stabilising from the UK, Cyprus’ largest market). Total export growth was marginal while imports declined. Overall, and with slightly improved terms of trade, the current account deficit reached 4.4% of GDP, below the 2002 level but still relatively high and therefore remaining
a potential concern.
Prospects in 2004 and 2005
After a difficult international environment in 2001-2003, contributing to low growth and increasing economic imbalances in Cyprus, the outlook is cautiously positive. Tourist arrivals should revive gradually in 2004-5, in line with historical experience and reflecting global recovery and a positive spill-over of the 2004 Olympic Games in Athens. For 2004, GDP growth is projected to climb to 3.4%, strengthening further in 2005 to 4.1%, as external demand picks up. Investment growth should recover, encouraged by EU accession, liberalisation in financial and utilities markets, and infrastructure projects (airports in Larnaca and Paphos and a port in Larnaca), while consumption growth strengthens in line with real wage development. Domestic private demand therefore remains a driving force, although fiscal consolidation is expected to put downward pressure on total domestic demand. Higher domestic demand will stimulate import growth but the revival in tourism exports and fiscal consolidation should bring a lower current account deficit. Overall the forecast projects a decrease in the current account deficit in 2004 and 2005 to around 3.6% of GDP.
It must be noted that these projections are subject to unusual uncertainty: negotiations for a settlement of the Cyprus problem restarted in early 2004. In the event of reunification the island’s economic situation would fundamentally change.
Labour market, costs and prices With relatively low growth continuing in 2003, unemployment rose slightly to 4.4%, up from 3.9% in 2002. The relatively flexible labour market, linked to the service economy, has held up well and continued to operate at near full-employment levels. For this year and next unemployment is expected to inch lower again as GDP growth picks up. The peg to the euro with a closely managed monetary policy and relatively low wage pressures have been among the main factors keeping inflation in check. Prices in 2002 and 2003 were mainly pushed by higher VAT taxation related to EU accession. Inflation reached 2.8% in 2002 and climbed to 4% for 2003 (lower than originally expected) but is foreseen
-7
-6
-5
-4
-3
-2
-1
0
1
98 99 00 01 02 03 04 05
Forecast% of GDP
Graph 4.1: Cyprus - General government finances
current account
gvt. deficit
74

Chapter 4 Acceding Countries, Cyprus
to drop back to about 2% for 2004 and 2005, following similar VAT-hikes and inflation paths in the past; it stood at 1.4% y-o-y in February 2004. In November 2003, following publication of an academic paper containing a citizen’s opinion survey, newspaper articles discussing devaluation of the pound appeared in the Cyprus press. However, such speculation was strongly rejected by the CBC while the pound remained stable vis-à-vis the euro throughout. Real wage increases in 2002 exceeded productivity growth but are estimated to have remained below the latter for 2003 (1% and 1.5% respectively). For 2004-2005 real wage increases are expected to remain at or below productivity growth.
Public finance
After slipping in 2002, fiscal consolidation went further awry in 2003 and the consolidation programme was effectively abandoned in the course of the year. Increased spending through higher
defence outlays and expansionary measures to offset subdued external demand plus revenue shortfalls linked to low growth and tax avoidance led to a government deficit of 6.3% of GDP, even higher than the 5.2% Autumn forecast. The new fiscal consolidation plan adopted in September 2003 no longer targets a budget balance over the medium term (and was in the meantime revised upward). Even then, considerable corrective measures are required. Positively, investment will not be cut back. The quality of public finances should improve due to public finance reform to be finished end-2004. Measures will then be in place to improve revenues (e.g. increasing government service fees, reinforcing of tax compliance) and expenditures (reduction of military outlays, agricultural subsidies, containment of public sector wages). The forecast is for a gradually declining -but still relatively high- deficit of 4.6% of GDP for 2004 and 4.1% of GDP by 2005, somewhat above the government targets.
Table 4.1 Main features of country forecast - CYPRUS
2002 Annual percentage changemio CYP Curr. prices % GDP 1995-99 2000 2001 2002 2003 2004 2005
GDP at constant prices 6189.0 100.0 4.0 5.0 4.0 2.0 2.0 3.4 4.1 Private consumption 4287.1 69.3 7.2 10.1 4.8 2.5 1.5 3.3 3.5 Public consumption 1097.1 17.7 3.3 0.2 11.5 3.1 1.7 -3.5 2.2 GFCF 1157.4 18.7 1.4 4.1 2.5 10.1 -2.9 7.0 7.5 of which : equipment 480.9 7.8 6.8 16.2 3.9 16.4 -2.9 7.0 7.5 Change in stocks as % of GDP 95.1 1.5 1.7 2.2 1.0 1.2 1.8 0.8 0.4 Exports (goods and services) 3189.6 51.5 7.0 9.0 3.4 -5.1 0.6 5.5 5.8 Final demand 9826.3 158.8 5.5 7.6 3.8 1.2 0.7 3.1 4.4 Imports (goods and services) 3637.3 58.8 8.6 9.0 3.8 1.5 -1.3 2.6 4.8 GNI at constant prices (GDP deflator) 6261.2 101.2 3.9 4.9 4.2 2.4 1.1 3.3 4.1 Contribution to GDP growth : Domestic demand 5.4 7.5 5.6 4.1 0.8 3.0 4.2
Stockbuilding -0.6 0.9 -1.2 0.2 0.1 -1.0 -0.4Foreign balance -1.1 -0.4 -0.4 -3.8 1.1 1.3 0.2
Employment - 2.8 1.9 1.4 0.5 0.7 0.9 Unemployment (a) 4.6 5.2 4.4 3.9 4.4 4.1 4.0 Compensation of employees/head 5.8 7.2 4.7 5.3 4.9 4.3 4.2 Unit labour costs - 4.9 2.5 4.7 3.4 1.6 1.0 Real unit labour costs - 0.4 0.3 1.9 -0.9 -0.9 -1.3 Savings rate of households (b) - - - - - - - GDP deflator 2.4 4.5 2.3 2.8 4.3 2.5 2.3 Private consumption deflator 2.5 2.9 1.3 3.0 4.0 2.2 2.1 Harmonised index of consumer prices - 4.9 2.0 2.8 4.0 2.2 2.1 Trade balance (c) -25.6 -29.4 -29.0 -28.3 -26.0 -25.4 -25.4 Balance on current transactions with ROW (c) -4.1 -3.5 -4.0 - -4.4 -3.7 -3.5 Net lending(+) or borrowing(-) vis-à-vis ROW (c) -3.5 - - - -4.3 -3.6 -3.3 General government balance (c) - -2.4 -2.4 -4.6 -6.3 -4.6 -4.1 General government gross debt (c) - 61.7 64.4 67.1 72.2 74.6 76.9 (a) as % of total labour force. (b) gross saving divided by gross disposable income. (c) as a percentage of GDP.
75
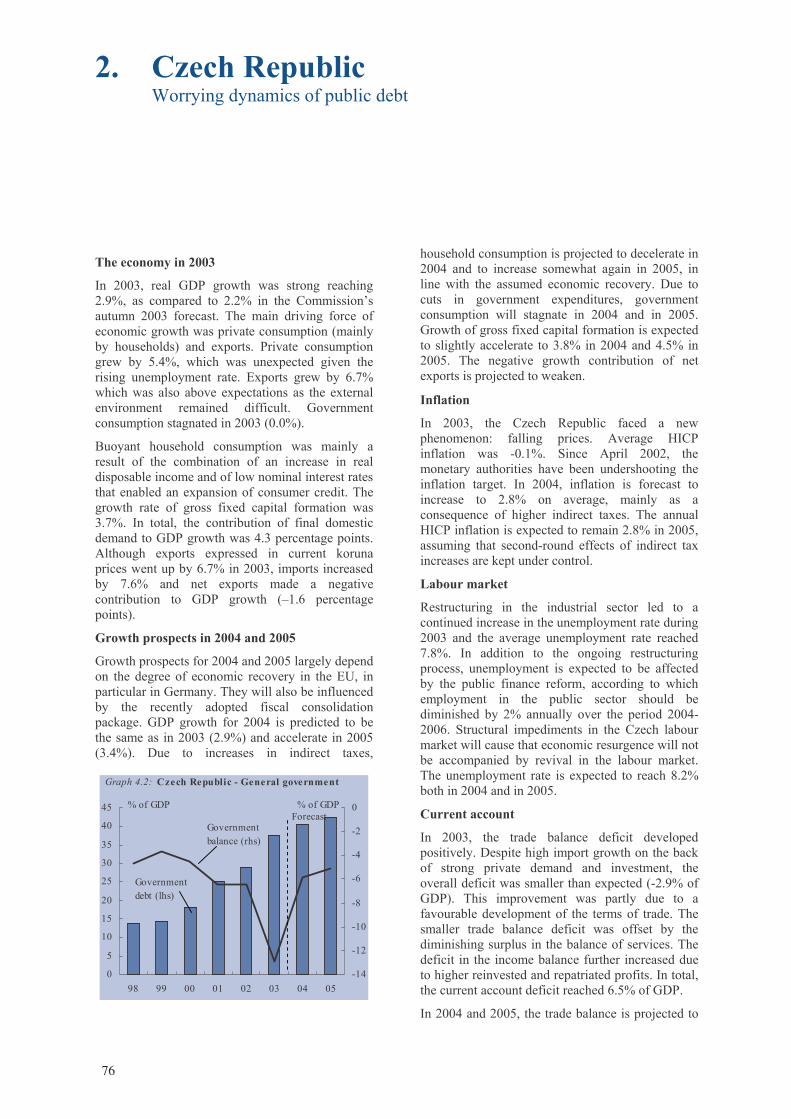
2. Czech Republic Worrying dynamics of public debt
The economy in 2003
In 2003, real GDP growth was strong reaching 2.9%, as compared to 2.2% in the Commission’s autumn 2003 forecast. The main driving force of economic growth was private consumption (mainly by households) and exports. Private consumption grew by 5.4%, which was unexpected given the rising unemployment rate. Exports grew by 6.7% which was also above expectations as the external environment remained difficult. Government consumption stagnated in 2003 (0.0%).
Buoyant household consumption was mainly a result of the combination of an increase in real disposable income and of low nominal interest rates that enabled an expansion of consumer credit. The growth rate of gross fixed capital formation was 3.7%. In total, the contribution of final domestic demand to GDP growth was 4.3 percentage points. Although exports expressed in current koruna prices went up by 6.7% in 2003, imports increased by 7.6% and net exports made a negative contribution to GDP growth (–1.6 percentage points).
Growth prospects in 2004 and 2005
Growth prospects for 2004 and 2005 largely depend on the degree of economic recovery in the EU, in particular in Germany. They will also be influenced by the recently adopted fiscal consolidation package. GDP growth for 2004 is predicted to be the same as in 2003 (2.9%) and accelerate in 2005 (3.4%). Due to increases in indirect taxes,
household consumption is projected to decelerate in 2004 and to increase somewhat again in 2005, in line with the assumed economic recovery. Due to cuts in government expenditures, government consumption will stagnate in 2004 and in 2005. Growth of gross fixed capital formation is expected to slightly accelerate to 3.8% in 2004 and 4.5% in 2005. The negative growth contribution of net exports is projected to weaken.
Inflation
In 2003, the Czech Republic faced a new phenomenon: falling prices. Average HICP inflation was -0.1%. Since April 2002, the monetary authorities have been undershooting the inflation target. In 2004, inflation is forecast to increase to 2.8% on average, mainly as a consequence of higher indirect taxes. The annual HICP inflation is expected to remain 2.8% in 2005, assuming that second-round effects of indirect tax increases are kept under control.
Labour market
Restructuring in the industrial sector led to a continued increase in the unemployment rate during 2003 and the average unemployment rate reached 7.8%. In addition to the ongoing restructuring process, unemployment is expected to be affected by the public finance reform, according to which employment in the public sector should be diminished by 2% annually over the period 2004-2006. Structural impediments in the Czech labour market will cause that economic resurgence will not be accompanied by revival in the labour market. The unemployment rate is expected to reach 8.2% both in 2004 and in 2005.
Current account
In 2003, the trade balance deficit developed positively. Despite high import growth on the back of strong private demand and investment, the overall deficit was smaller than expected (-2.9% of GDP). This improvement was partly due to a favourable development of the terms of trade. The smaller trade balance deficit was offset by the diminishing surplus in the balance of services. The deficit in the income balance further increased due to higher reinvested and repatriated profits. In total, the current account deficit reached 6.5% of GDP.
In 2004 and 2005, the trade balance is projected to
0
5
10
15
20
25
30
35
40
45
98 99 00 01 02 03 04 05-14
-12
-10
-8
-6
-4
-2
0% of GDP% of GDPForecast
Graph 4.2: Czech Republic - General government
Government debt (lhs)
Governmentbalance (rhs)
76

Chapter 4 Acceding Countries, Czech Republic
slightly improve, mainly has a result of improved non-price competitiveness of domestic producers. The surplus in the balance of services as a percentage of GDP is also expected to slightly increase, reaching 1.1% of GDP in 2005. Foreign investors’ profits are expected to the repatriated, which is partially linked to the effort of EU-based companies to improve their balance sheets. This is expected to worsen the income balance. As a result, the current account deficit should remain around 6¾% of GDP in 2004 and 2005.
Public finances
According to ESA95 data communicated by the Czech authorities, the general government deficit in 2003 reached 12.9% of GDP. Almost half of this deficit is due to one single imputed state guarantee (about 6.3% of GDP). Without this imputed guarantee the deficit would be about 6.6% of GDP, including other capital transfers (to the Czech Consolidation Agency and to the Railways Route Administration). This deficit would be better than
the 8.0% of GDP projected in the Commission’s Autumn forecast. Overall, the execution of the state budget was better than expected in 2003. Due to the high 2003 general government deficit, gross public debt jumped from 28.9% of GDP in 2002 to 37.6% of GDP in 2003.
In 2004 and in 2005, the general government deficit is projected to improve and to reach 5.9% of GDP and 5.1% of GDP, respectively. Diminishing deficits will mainly be a consequence of fiscal consolidation which focuses on the expenditure side. The envisaged expenditure savings should represent more than two thirds of total consolidation the remaining consolidation should be reached by increased revenues. However, there are fiscal risks linked to the remaining state guarantees which are currently estimated at about 7% of GDP. Gross public debt is expected to increase from 40.6% of GDP in 2004 to 42.4% of GDP in 2005.
Table 4.2 Main features of country forecast - CZECH REPUBLIC
2002 Annual percentage changebn CZK Curr. prices % GDP 1995-99 2000 2001 2002 2003 2004 2005
GDP at constant prices 2275.6 100.0 1.7 3.3 3.1 2.0 2.9 2.9 3.4 Private consumption 1200.6 52.8 3.2 2.5 3.6 4.0 5.4 3.8 4.1 Public consumption 487.1 21.4 -1.5 -1.0 5.3 5.7 0.0 0.0 0.0 GFCF 599.3 26.3 4.6 5.3 5.5 0.6 3.7 3.8 4.5 of which : equipment 293.1 12.9 7.2 11.8 -5.6 1.7 3.6 3.8 4.5 Change in stocks as % of GDP 41.2 1.8 1.5 1.6 2.2 2.4 2.6 2.7 2.7 Exports (goods and services) 1483.0 65.2 10.0 17.0 11.9 2.8 6.7 7.6 8.1 Final demand 3811.2 167.5 5.1 9.3 8.0 3.1 5.2 5.2 5.6 Imports (goods and services) 1535.6 67.5 10.8 17.0 13.6 4.3 7.6 7.4 7.7 GNI at constant prices (GDP deflator) 2151.8 94.6 1.2 3.2 1.9 0.7 2.4 2.7 3.2 Contribution to GDP growth : Domestic demand 2.8 2.9 4.8 3.4 4.3 3.5 3.9
Stockbuilding -0.1 1.3 0.7 0.3 0.3 0.2 0.1Foreign balance -0.9 -1.0 -2.3 -1.7 -1.6 -0.7 -0.6
Employment - 8.1 1.4 0.8 -0.7 -0.4 -0.2 Unemployment (a) 5.5 8.7 8.0 7.3 7.8 8.2 8.2 Compensation of employees/head - 3.0 9.2 6.4 4.0 4.0 4.0 Unit labour costs - 7.8 7.5 5.2 0.3 0.6 0.4 Real unit labour costs - -1.4 2.4 3.5 -2.5 -2.4 -2.5 Savings rate of households (b) - - - - - - - GDP deflator 8.1 9.3 5.0 1.7 2.9 3.1 3.0 Private consumption deflator 7.5 7.0 2.5 1.8 0.1 2.6 2.2 Harmonised index of consumer prices - 3.9 4.5 1.4 -0.1 2.8 2.8 Trade balance (c) -7.0 -5.6 -5.0 -3.1 -2.9 -2.8 -2.8 Balance on current transactions with ROW (c) -4.5 -4.9 -5.4 -5.8 -6.5 -6.8 -6.6 Net lending(+) or borrowing(-) vis-à-vis ROW (c) -4.5 -4.9 -5.3 -6.2 -6.5 -6.6 -6.3 General government balance (c) -5.0 -4.5 -6.4 -6.4 -12.9 -5.9 -5.1 General government gross debt (c) - 18.2 25.2 28.9 37.6 40.6 42.4(a) as % of total labour force. (b) gross saving divided by gross disposable income. (c) as a percentage of GDP.
77

3. Estonia External account deficit set to narrow, with growth becoming more export-driven.
The situation in 2003 GDP growth in 2003 decreased to a still respectable 4.8%. In contrast to 2002, growth was based upon a more balanced composition: investment growth of well above 10% and private consumption – supported by employment growth, rising real wages and increased bank lending – were the most important contributors. Export growth also picked up again, at a modest rate. However, with imports still growing far more rapidly than exports, the net foreign contribution remained negative. This resulted in a further widening of the current account deficit to 13.7% of GDP in 2003. CPI inflation came down to an annual average of only 1.3%, owing to exchange rate movements and other temporary factors. Labour market conditions continued to improve and the unemployment rate declined to 9.3% of the labour force in the 4th quarter, while employment increased by 1 % for the year as a whole. The general government surplus in 2003 increased further to 2.6% of GDP. Prospects for 2004 and 2005 Real GDP is expected to grow at around 5-6 % over 2004-05. Whereas private consumption and investment will remain the most important sources of growth also in 2004 and 2005, the overall outlook is for more balanced growth, given slowly decreasing domestic demand and a steady improvement in the external environment. Consequently, the current account deficit is forecast to narrow to around 9 % of GDP by 2005. Inflation is not expected to remain at its current low level, but to accelerate to around 3%.
Following the positive outturn in 2002/2003, the general government budget is forecast to remain balanced or in small surplus over the forecasting period. Labour market, costs and prices The strong growth performance over recent years has translated into sizeable employment gains, and unemployment came down to below 10% of the labour force at the end of 2003. Early figures for 2004 indicate a continuation of this positive trend. Even more encouraging, unemployment decreased significantly in North-eastern Estonia, where unemployment is twice as high as in the rest of the country. Unemployment is forecast to continue declining in the medium term, towards a rate around 9.5%, but a considerable skills mismatch will prevent a faster improvement in labour market conditions. Real wages grew by 8.3% in 2003, owing not least to rapid disinflation. Nonetheless, Estonia’s competitive position is expected to remain strong over the forecast period, since it is underpinned by robust productivity growth and a flexible labour market.
Inflationary pressure receded more than expected, to an annual average of just 1.3% in 2003, thanks largely to the strength of the euro to which the Kroon is pegged. Thus, inflation in Estonia at present is lower than in the euro-area. However, this strong drop in inflation was mainly due to temporary factors, and the trend is expected to reverse in 2004, with a number of tax measures and administered price hikes exerting upward pressure on prices. Given on the other hand the weakening impact of the US dollar on kroon prices for imported oil and consumer electronics goods, the inflation forecast for 2004 and 2005 remains below 3%.
Balance of payments
The global economic slowdown, and in particular its effects on the telecommunication sector continued to weaken Estonia's trade balance. In addition, the exceptionally cold winter and the freezing of the bay of Tallinn in 2002/2003 had a negative effect on services exports. The delayed recovery in the EU added to the drag on demand for Estonian goods and services, which grew by only 5.1% in 2003. At the same time, imports increased by 8.1%. As a consequence, in 2003 the current account deficit widened to an estimated 13.7% of GDP. As the re-
-2
0
2
4
6
8
10
98 99 00 01 02 03 04 05
Forecast
% change
Graph 4.3: Estonia - GDP growth and inflation
HICP inflationGDP
78

Chapter 4 Acceding Countries, Estonia
covery in the EU gathers momentum, export growth in Estonia is forecast to gradually accelerate over 2004 and 2005, while import growth is forecast to temporarily slow down in 2004, partly due to base effects. As the external environment improves further, and investment recovers, following a temporary slowdown in 2004, demand for imports both for consumer goods and for intermediate inputs will pick up again in 2005. The capital account is expected to remain in surplus, which along with sizeable FDI and portfolio inflows will help to better balance the external account of Estonia. On the whole, the current account is forecast to slowly come down to a deficit around 9% of GDP by 2005.
Public finance
The general government posted a surprise surplus of 2.6% of GDP in 2003. This was achieved mainly through improved tax collection, despite additional
election-induced spending in 2003. Certain local governments (notably Tallinn) reported considerable deficits. Tax cuts that are being implemented from 2004, along with increased social benefits, and EU accession-related expenditure are expected to weaken somewhat the budgetary position in 2004 and 2005. On the other hand, projected higher cyclical tax revenues, and strict expenditure control are expected to offset part of the revenue losses from the tax cut. On the whole, for 2004 a reduced surplus of around 0.7% of GDP is projected, whereas for 2005 a balanced budget is expected.
Table 4.3 Main features of country forecast - ESTONIA
2002 Annual percentage changebn EEK Curr. prices % GDP 1995-99 2000 2001 2002 2003 2004 2005
GDP at constant prices 108.0 100.0 4.3 7.3 6.5 6.0 4.8 5.4 5.9 Private consumption 61.9 57.3 4.3 6.7 5.2 9.4 6.4 6.2 5.8 Public consumption 19.6 18.2 4.9 1.5 0.9 5.0 6.0 6.5 4.0 GFCF 30.8 28.5 5.3 13.3 12.2 16.1 11.1 6.8 7.1 of which : equipment 10.2 9.5 - - - - - - - Change in stocks as % of GDP 4.1 3.8 0.9 2.8 2.0 3.5 3.6 2.3 1.9 Exports (goods and services) 86.4 80.0 9.5 28.6 -0.2 0.6 5.1 7.7 9.2 Final demand 202.8 187.7 6.6 18.5 3.1 6.0 6.5 6.4 7.2 Imports (goods and services) 96.5 89.3 9.3 27.9 2.1 5.4 8.1 7.3 8.2 GNI at constant prices (GDP deflator) 102.5 94.9 4.2 5.1 5.3 5.9 3.2 8.0 6.6 Contribution to GDP growth : Domestic demand 5.3 7.9 6.7 11.4 8.7 7.5 6.9
Stockbuilding -0.1 3.5 -0.7 1.8 0.3 -1.1 -0.3Foreign balance -0.9 -2.1 -2.7 -5.5 -4.2 -1.0 -0.6
Employment -3.0 -1.5 0.9 1.3 1.0 0.6 0.4 Unemployment (a) 9.9 12.5 11.8 10.5 10.0 9.7 9.6 Compensation of employees/head 22.9 9.7 7.5 6.7 9.7 9.5 8.0 Unit labour costs 14.2 0.8 1.9 2.0 5.8 4.6 2.4 Real unit labour costs -1.2 -5.6 -3.2 -2.1 3.0 0.9 -1.2 Savings rate of households (b) - - - - - - - GDP deflator 15.6 6.7 5.2 4.1 2.7 3.7 3.7 Private consumption deflator 14.5 3.9 5.7 3.4 1.3 2.8 2.9 Harmonised index of consumer prices - 3.9 5.6 3.6 1.4 2.8 2.9 Trade balance (c) -20.7 -15.0 -14.1 -16.9 -18.7 -18.4 -17.4 Balance on current transactions with ROW (c) -7.9 -5.8 -6.0 -12.2 -13.7 -11.5 -9.1 Net lending(+) or borrowing(-) vis-à-vis ROW (c) -7.9 -5.5 -5.9 -11.9 -13.5 -11.1 -8.7 General government balance (c) -0.9 -0.3 0.3 1.8 2.6 0.7 0.0 General government gross debt (c) - 5.0 4.7 5.7 5.8 5.4 5.3(a) as % of total labour force. (b) gross saving divided by gross disposable income. (c) as a percentage of GDP.
79

4. Hungary Strengthening of economic growth, challenges ahead for fiscal consolidation
The situation in 2003
In 2003 real GDP growth eased somewhat to 2.9% owing to sluggish investment activity and a negative contribution from net exports. The fiscal deficit significantly exceeded the authorities' target for the second year running, reaching 5.9% of GDP as a result of expenditure slippages (higher than expected current expenditures, including social benefits, and interest payments) and weaker tax revenues (especially from personal income and corporate taxes). The external position deteriorated significantly with the current account deficit widening to 5.7% of GDP. The successful disinflation process of the previous years came to a halt in mid-2003, and inflation picked up in the last months of the year reaching an annual average of 4.7%.
Prospects in 2004 and 2005
GDP growth, which had accelerated in the second half of 2003, is forecast to remain solid reaching 3.2% in 2004 and 3.4% in 2005. Strong investment growth and a recovery in external demand—and hence a positive contribution of net exports—are expected to underpin GDP growth in the near term. Private consumption, which had bolstered GDP growth in recent years, will slow down considerably in 2004-05, mainly due to a moderation in wage growth. Construction investment is expected to decline in the latter part of the forecast period on account of changes in the subsidised housing loan system, although that trend will be offset by buoyant business investment
activity, especially in the manufacturing sector. As the government strives to control the public sector deficit, public infrastructure investment will decline in 2004. However, spending pressure is likely to emerge, as commitments related to co-financing of EU- financed investments increase, particularly in 2005.
Labour market, costs and prices
A significant deceleration in wage growth is forecast following three years of hefty wage increases, reaching 50% in some cases. However, while public wages will remain broadly unchanged in real terms, private sector wages are expected to rise somewhat faster than the 7-8% nominal wage growth that was agreed in recent wage negotiations.
The unemployment rate is forecast to decline from 5.8% of the labour force in 2003 to 5.6% in 2005. Moderate employment growth of around ½% is likely to be offset by a growing civilian labour force.
Due to tax hikes, notably an increase in VAT and excises taxes, a further acceleration of inflation to 6.9% can be expected in 2004. Assuming no second-round effects, and no significant weakening of the currency from the present level, inflationary pressures are likely to dissipate and inflation is expected to decline to 4.6% in 2005.
Balance of payment developments
An improvement in the trade balance, slowing domestic demand growth, due to expected fiscal tightening and decelerating private consumption growth, will contribute to a gradual narrowing of the current account deficit from 5.4 % of GDP in 2004 to 5.1% in 20051.
Public finances
In addition to the recently revised budget deficit target for 2004 (from 3.8% to 4.6% of GDP), the government announced a series of measures for
1 The first figures on the new method of calculating the current account deficit were published end-March 2004. Therefore, the Commission’s forecast is still based on the old method (i.e. excluding reinvested earnings). With the new method, the deficit can be expected to be about 2 percentage points higher as a proportion of GDP.
0
2
4
6
8
10
12
14
16
98 99 00 01 02 03 04 05
Forecast
% change
GDP
HICP inflation
Graph 4.4: Hungary - GDP growth and inflation
80

Chapter 4 Acceding Countries, Hungary
expenditure cuts equivalent to around 1% of GDP. These measures are aiming at rationalising resource management, and the postponement of several large public investments projects. A real wage freeze in the public sector, and the ongoing reduction of the number of public employees should also contribute to the reduction of expenditures. Measures, such as the recent freezing of subsidized pharmaceutical products’ prices should prevent the overspending on drug subsidies, as seen in 2003. The substantial tightening of housing subsidies will only have substantial effect in 2005.
Due to the tax reform of last year, higher revenue from indirect taxes (VAT and excise taxes) can be expected. Direct tax’ rates (both personal income tax and corporate taxes) were lowered, while numerous tax allowances and credits were eliminated. This should contribute to a decline in the revenue of corporate taxes, while revenues from the personal income tax are expected to remain broadly stable.
These measures should provide a basis for a significant narrowing of the budget deficit. However, the revenue shortfall and the overspending of 2003 still indicate some risks to achieve the target for 2004. The risks of higher-than-envisaged housing subsidies, tax exemptions and interest payments remain. The additional revenues from an improvement in tax collection efficiency might also not materialize to the envisaged extent, as such measures are effective rather in the long term. Therefore the general government deficit forecast for 2004 is 4.9% of GDP.
In 2005, expenditure related to co-financing of EU-related investment projects, and the realisation of other postponed investment project might limit the scope for a deficit reduction. Therefore a narrowing of the deficit to 4.3% of GDP is forecast.
The gross debt ratio is estimated to have reached 59% of GDP in 2003 and is expected to decline to 58% by the end of 2005.
Table 4.4 Main features of country forecast - HUNGARY
2002 Annual percentage changebn HUF Curr. prices % GDP 1995-99 2000 2001 2002 2003 2004 2005
GDP at constant prices 16743.7 100.0 3.3 5.2 3.8 3.5 2.9 3.2 3.4 Private consumption 9003.5 53.8 0.3 5.5 5.7 10.3 9.0 2.9 3.0 Public consumption 3871.0 23.1 -0.6 1.9 4.3 5.2 4.5 -1.0 1.5 GFCF 3844.5 23.0 6.0 7.7 3.5 7.2 2.2 5.0 5.5 of which : equipment - - - - - - - - - Change in stocks as % of GDP 401.3 2.4 4.9 6.4 3.3 1.5 0.3 0.6 0.2 Exports (goods and services) 10944.7 65.4 22.1 21.0 8.8 3.8 9.0 8.6 8.7 Final demand 28065.1 167.6 8.3 11.2 4.9 4.7 7.4 5.6 5.7 Imports (goods and services) 11321.4 67.6 18.5 19.4 6.1 6.1 12.5 8.0 8.0 GNI at constant prices (GDP deflator) 16336.1 97.6 2.3 7.8 4.2 3.1 3.6 3.0 2.9 Contribution to GDP growth : Domestic demand 1.3 5.0 4.6 8.2 6.5 2.7 3.5
Stockbuilding 1.1 -0.3 -2.9 -1.8 -0.3 0.3 -0.4Foreign balance 0.7 0.5 2.1 -2.0 -3.3 0.2 0.3
Employment 0.2 1.0 0.4 0.7 0.5 0.6 0.7 Unemployment (a) 8.8 6.3 5.6 5.6 5.8 5.7 5.6 Compensation of employees/head 16.2 15.6 15.6 11.3 12.9 8.0 6.7 Unit labour costs 12.8 10.9 11.7 8.3 10.3 5.3 3.8 Real unit labour costs -3.9 0.9 2.9 -0.6 4.7 -1.1 -1.4 Savings rate of households (b) - - - - - - - GDP deflator 17.3 9.9 8.6 9.0 5.3 6.4 5.3 Private consumption deflator 18.3 9.1 8.2 3.8 4.7 6.9 4.7 Harmonised index of consumer prices - 10.0 9.1 5.2 4.7 6.9 4.6 Trade balance (c) -3.6 -6.3 -4.3 -3.2 -4.5 -4.1 -3.1 Balance on current transactions with ROW (c) - - - - -5.7 -5.4 -5.1 Net lending(+) or borrowing(-) vis-à-vis ROW (c) - - - - -5.8 -5.4 -5.2 General government balance (c) - -3.0 -4.4 -9.3 -5.9 -4.9 -4.3 General government gross debt (c) - 55.4 53.5 57.1 59.0 58.7 58.0(a) as % of total labour force. (b) gross saving divided by gross disposable income. (c) as a percentage of GDP.
81

5. Latvia Continued robust growth, widening current account deficit
The situation in 2003
Despite a weak external environment, GDP growth continued strongly at 6.1% in 2002 and accelerated further to 7.4% in the first three quarters of 2003 year-on-year. For 2003 as a whole, GDP growth is likely to have reached 7.5%. Private consumption and gross fixed capital formation were particularly buoyant and became driving factors for growth.
Private consumption is estimated to have grown by about 8% in 2003, supported by employment growth, rising real wages and increased bank lending. Gross fixed capital formation remained buoyant, growing by some 9.5%, as a result of favourable credit conditions and reinforced macroeconomic stability. Exports growth was strong at 12.7%; however, imports grew faster and this caused a widening of the current account deficit. The current account balance weakened by 30% and the deficit increased from 7.6% to 9.1% of GDP. During 2003, inflation accelerated to 2.9% from 2% in 2002. This was partly due to higher regulated prices on gas, heating and rent. Imports also become more expensive. While employment growth was sluggish, the unemployment rate went down to 10.5%. The general government deficit in 2003 decreased to 1.8% of GDP, largely owing to better-than-expected tax revenues.
Prospects for 2004 and 2005
Growth prospects for 2004 and 2005 are strong, with an expected growth rate of 6.2% each year. In both years final domestic demand is expected to be driving growth, primarily led by increases in private consumption on the back of sustained increases in real disposable income and better access to credit. In 2004 and 2005, private consumption is expected to continue to show healthy growth at a slightly lower pace of 7.1-6.5% as 2003 increase of disposable income is going to wear out. Overall investment growth is likely to remain high at 10% in 2004 and 2005. Housing investment is projected to increase over the entire forecast period. The large depletion of stocks in 2002 should come to an end, but no significant contribution to GDP growth from stocks is expected for the forecast period.
External demand will continue to be important for growth. The recovery of the EU economy and a further assumed depreciation of the lat against the euro will keep export growth strong. Import growth is expected to remain robust, albeit at a slower pace than exports growth, allowing for a narrowing of the trade balance. Thus, for 2005 the contribution from net exports will have recovered to –1.9 percentage points from –2.3 percentage points in 2003. Accordingly, real GDP is expected to grow at around 6.2% or close to potential in both forecast years.
Labour market, costs and prices
High growth has contributed to lowering the unemployment rate, which decreased from 11.3% in December 2002 to 10.5% in December 2003. However, upward pressure on unemployment from enterprise and rural restructuring is expected to remain.
In spite of a strong growth performance, and sizeable employment gains since 2001, the unemployment rate—which remains at around 10.5% of the labour force—is forecast to drop only slightly in the medium term, to around 10.1%. Moderate employment gains of 0.5% per year over the forecast period will contribute to the decline, although considerable regional development disparities will hold back a faster improvement in labour market conditions.During 2003, the inflation rate went up to 2.9% from a sharp rise in health care costs. Imports also became more expensive. Inflation is expected to increase to
-6
-4
-2
0
2
4
6
8
10
00 01 02 03 04 05
Forecast
Inventories External
Domestic(excl. Inventories)
Total growth
Graph 4.5: Latvia - GDP growth and its contributors
82

Chapter 4 Acceding Countries, Latvia
4.0% during the forecast period. This rise is linked to the expected adjustment of prices to EU levels and wage increases. In addition, there will be a new round of administrative price hikes. From 2004, an increase in excise duties on fuel and petrol will further push inflation. However, the full impact of the effect of the increase will only be visible in the second half of 2004 and beginning of 2005. Thereafter inflation is set to decelerate.
The current account
The growth of exports and imports in 2003 was buoyant. Exports increased by almost 13% in 2003 while imports increased by 14.3%. Exports are expected to expand by 10-8.5% in 2004 and 2005. Imports should grow broadly in line with final demand, resulting in a small negative contribution to GDP growth from net exports in both years.
The current account deficit increased to 9.1% of GDP in 2003. As the trade balance is expected to worsen,
this will result in a further rise of the current account deficit by about 2 percentage points during the forecast period.
Public finances
In 2003, the general government deficit notified by the Latvian authorities in March 2004, but subject to further verification by Eurostat is one percentage point lower than expected in autumn and represents 1.8% of GDP. This was mainly due to better-than-expected tax revenues and close monitoring of expenditure by the government. The total government expenditure did not reach the initially allocated amount. For the forecast period a broadening of the VAT base and the real estate tax base should outweigh the intended cut in the corporate income tax. Consequently, the deficit is expected to approach 2% of GDP in 2004 and 2005.
Table 4.5 Main features of country forecast - LATVIA
2002 Annual percentage changemio LVL Curr. prices % GDP 1995-99 2000 2001 2002 2003 2004 2005
GDP at constant prices 5194.7 100.0 3.6 6.8 7.9 6.1 7.5 6.2 6.2 Private consumption 3259.3 62.7 - 7.4 7.8 6.9 8.0 7.1 6.5 Public consumption 1008.1 19.4 1.9 -1.9 0.3 1.5 2.0 2.5 2.5 GFCF 1370.6 26.4 17.3 20.0 17.0 10.4 9.5 10.0 10.0 of which : equipment - - - - - - - - -Change in stocks as % of GDP 107.8 2.1 -1.1 -7.9 -4.7 -4.0 -2.7 -2.5 -2.4 Exports (goods and services) 2361.6 45.5 6.8 12.0 6.9 6.3 12.7 10.0 8.4Final demand 8107.3 156.1 5.4 6.6 9.3 5.6 10.2 8.4 7.6Imports (goods and services) 2912.6 56.1 9.4 4.9 12.6 4.5 14.3 11.5 9.6 GNI at constant prices (GDP deflator) 5189.9 99.9 3.4 8.1 8.2 5.4 7.1 6.2 6.2 Contribution to GDP growth : Domestic demand - 9.4 9.9 7.9 8.6 8.4 8.1
Stockbuilding -1.8 -4.9 2.8 0.5 1.2 0.0 0.0Foreign balance -1.8 3.2 -4.1 0.5 -2.3 -2.2 -1.9
Employment -2.1 -2.9 2.2 1.6 0.7 0.5 0.5 Unemployment (a) 16.6 13.7 12.9 12.6 10.5 10.3 10.1Compensation of employees/head 12.3 6.9 3.4 4.4 7.0 7.0 7.0 Unit labour costs 6.2 -2.9 -2.1 0.0 0.3 1.2 1.3 Real unit labour costs -3.4 -7.2 -4.6 -1.7 -2.1 -0.8 -0.5 Savings rate of households (b) - - - - - - -GDP deflator 9.8 4.6 2.5 1.8 2.4 2.0 1.8Private consumption deflator - 2.5 4.8 0.1 3.5 3.0 2.0Harmonised index of consumer prices - 2.6 2.5 2.0 2.9 4.0 3.5 Trade balance (c) -15.6 -14.8 -17.6 -17.1 -18.9 -20.7 -22.3 Balance on current transactions with ROW (c) -6.5 -6.9 -9.6 -7.6 -9.1 -10.1 -10.9 Net lending(+) or borrowing(-) vis-à-vis ROW (c) -6.3 -6.5 -9.0 -7.4 -8.9 -9.9 -10.7General government balance (c) -1.4 -2.7 -1.6 -2.7 -1.8 -2.2 -2.0General government gross debt (c) - 13.9 16.2 15.5 15.6 16.0 16.1
(a) as % of total labour force. (b) gross saving divided by gross disposable income. (c) as a percentage of GDP.
83

6. Lithuania A broad-based economic expansion
The situation in 2003
Lithuania’s macroeconomic performance remained particularly strong in 2003. Real output continued expanding rapidly and is provisionally estimated to have increased by 8.9% in 2003, in the absence of significant external and fiscal imbalances and inflationary pressures. Domestic demand consolidated as the major driver for growth. Private consumption is estimated to have grown by above 9% in 2003, fuelled by strong employment growth and low interest rates. Gross fixed capital formation remained buoyant and is forecast to have increased by some 12%, induced by favourable credit conditions and reinforced macroeconomic stability.
Notwithstanding a marked nominal effective appreciation of the litas, Lithuania’s export performance remained robust in 2003, although export growth stood below the impressive levels of previous years. Import growth also held strong and led to a negative contribution of net trade to growth in 2003 which, together with a marked deterioration of the income account, drove the current account deficit above 6% of GDP.
Prospects for 2004 and 2005
Real GDP growth is foreseen to remain robust at about 6.5-7% in 2004 and 2005. Gross fixed capital formation is expected to continue growing vigorously, stimulated by low interest rates and increasing investment grants from the EU, while the anticipated
recovery of external demand in Lithuania’s major trading partners and further productivity gains should ensure that the strong export performance is sustained. Public consumption growth is expected to edge up, partly associated with government’s increasing demand for goods and services related to the implementation of programmes co-financed by the EU. Private consumption is expected to remain firm due to sustained employment growth, higher income prospects and sharp credit growth. The savings-investment balance is likely to deteriorate slightly in 2004, reflecting robust domestic demand, but the current account deficit is expected to stabilise thereafter at around 6% of GDP, provided that the fiscal consolidation plans are attained. Nevertheless, the present credit growth dynamics is engendering uncertainty about the medium-term developments of the private savings-investment balance and increasing the risk for higher current account imbalances.
Labour market, costs and prices
Against the background of buoyant economic growth, the labour market has significantly improved in the last two years, experiencing high employment growth and a decrease in the unemployment rate from 16.1% in 2001 to 12.7% in 2003. Employment growth is expected to remain relatively high over the forecast horizon, induced by strong labour demand by the private sector. The unemployment rate is expected to decrease to 10.7% in 2005, sustained by strong employment growth and the effect of active labour market policies. Nevertheless, significant structural rigidities in the labour market related to low workforce mobility and mismatches between demand and supply of skills constitute a risk for the projections.
Strong productivity gains, moderate wage inflation and a large effective appreciation of the litas contributed to an annual average deflation rate of 1.1% in 2003 (as measured by HICP). The deflation trend is expected to start reversing in the second half of 2004 and inflation is expected to progressively pick up to about 2.2% by 2005. Higher prices will be initially influenced by tax alignments due to EU accession such as changes excise rates on fuel and tobacco products and the elimination of a reduced VAT rate on heating of residential buildings. Other factors are expected to add more pressure on prices, such as accelerating wage inflation, price increases
-4
-2
0
2
4
6
8
10
12
99 00 01 02 03 04 05
Forecast
Graph 4.6: Lithuania - GDP growth and its contributors
yoy % ch.
InventoriesExternal
Domestic (excl.Inventories)
Total growth
84

Chapter 4 Acceding Countries, Lithuania
among the regulated sectors and higher prices of public transport. Nevertheless, maintaining inflation at around the foreseen levels will largely depend on a rapid implementation of structural reforms that allow Lithuania to sustain the current productivity growth trend, so as to temper the impact on unit labour costs. The expected inflation scenario assumes that fiscal policy will shift away from the present pro-cyclical stance in 2005.
Public finance
The declining trend of the general government deficit reversed in 2003, when the deficit increased slightly to 1.7% of GDP, from 1.4 % in 2002. The increase was largely due to higher current expenditure (mainly
in the form of agricultural subsidies and compensations for the loss of rouble savings) allocated through a supplementary budget in July 2003.
The general government deficit is expected to increase further to 2.8% of GDP in 2004, primarily led by a surge in public investment, salary increases for non-civil servant public workers and the transition costs of the pension reform. Fiscal consolidation is expected to resume from 2005, when the deficit is expected to drop to 2.6% of GDP. The fiscal projections assume that government arrears on VAT refunds owned by the government to enterprises, which increased significantly in 2001 and 2002, are gradually reduced.
Table 4.6 Main features of country forecast - LITHUANIA
2002 Annual percentage changebn LTL Curr. prices % GDP 1995-99 2000 2001 2002 2003 2004 2005
GDP at constant prices 50.8 100.0 4.6 4.0 6.5 6.8 8.9 6.9 6.6Private consumption 32.2 63.4 - 6.6 3.9 6.5 9.5 6.7 5.9Public consumption 10.2 20.0 - 3.9 0.3 2.4 5.3 6.9 6.1GFCF 10.5 20.7 - -9.0 13.5 8.7 12.1 9.0 9.3
of which : equipment - - - -1.0 22.2 7.1 - - -Change in stocks as % of GDP 0.7 1.5 2.7 3.0 4.2 4.8 5.9 5.9 5.7
Exports (goods and services) 27.4 54.0 - 9.8 21.2 19.5 5.8 8.8 9.0Final demand 81.0 159.7 - 3.6 11.3 11.3 8.2 7.9 7.5Imports (goods and services) 30.3 59.7 - 4.7 17.7 17.6 7.4 8.9 8.5GNI at constant prices (GDP deflator) 50.1 98.7 4.1 4.7 6.8 7.0 8.2 7.1 7.1Contribution to GDP growth : Domestic demand - 2.5 6.4 7.3 11.0 8.5 8.0
Stockbuilding - -1.4 1.5 0.9 0.7 0.4 0.2Foreign balance - 1.6 -1.5 -2.4 -2.8 -2.0 -1.6
Employment -0.3 -3.7 -4.0 4.0 1.5 1.3 1.2Unemployment (a) 11.5 15.7 16.1 13.6 12.7 11.5 10.7
Compensation of employees/head 27.8 0.0 3.4 3.4 5.9 5.8 6.0 Unit labour costs 21.8 -7.4 -6.8 0.7 -1.3 0.3 0.7Real unit labour costs 5.9 -8.2 -6.6 0.7 -0.2 -1.1 -1.7Savings rate of households (b) - - - - - - -GDP deflator 15.0 0.9 -0.2 0.1 -1.2 1.4 2.4Private consumption deflator - -2.1 2.3 -0.9 -1.1 1.0 2.2
Harmonised index of consumer prices - 0.9 1.3 0.4 -1.1 1.0 2.2 Trade balance (c) -12.3 -9.9 -9.3 -9.6 -9.0 -9.1 -9.2Balance on current transactions with ROW (c) -10.5 -6.0 -4.8 -5.4 -6.1 -6.2 -5.9
Net lending(+) or borrowing(-) vis-à-vis ROW (c) -10.6 -6.0 -4.8 -5.0 -5.7 -5.8 -5.5General government balance (c) -3.1 -2.6 -2.1 -1.4 -1.7 -2.8 -2.6General government gross debt (c) - 24.3 23.4 22.8 21.9 22.8 23.2(a) as % of total labour force. (b) gross saving divided by gross disposable income. (c) as a percentage of GDP.
85

7. Malta Fiscal challenges lie ahead
The economy in 2003
The Maltese economy largely weathered the effects of the international deceleration in 2002, but failed to maintain speed in 2003. On the whole, real GDP grew by 1.7% in 2002 and 0.4% in 2003. Real growth contracted by 1.9% in the first quarter of 2003, but gathered momentum in the second and third quarters, increasing by 0.7% and 1.9% respectively. This trend was not entirely consolidated in the fourth quarter. Economic growth in 2003 was driven by high public expenditure and a sudden spark in gross fixed capital formation, which led to an increase in imports. Uncertainty in international markets, especially faltering demand for semiconductors, negatively influenced export growth in 2003, but it is likely to improve gradually as the expected strengthening of the technological sector in the United States and Asia occurs. Poor results in the tourist sector could not compensate for a deterioration of the current account balance by 1.3 percentage points. The consumer price index decelerated to 1.3% in 2003, stemming from subdued domestic demand and a low pass-through of the Maltese lira depreciation against the euro. Lower activity in the tourist sector and industrial restructuring in manufacturing caused considerable job losses and negatively influenced employment developments. The rate of unemployment worsened to 8.2% in 2003, from 7.5% in 2002. The general government deficit will jump to 9.7% of GDP in 2003 from 5.7% in 2002. This one-off rise is explained by the impact of the shipyards restructuring in 2003. As a
result, the debt ratio will soar around 7.8 percentage points, to 72.0% of GDP in 2003.
Prospects
The immediate outlook for the Maltese economy is for a gradual recovery in the growth rate to 1.4% in 2004, accelerating to 2% in 2005, supported by the improvement in external demand and capital formation. The accomplishment of the necessary structural reforms, coupled with the requirement to reduce the huge public finance imbalance and reduce public debt will set the pace for economic developments in Malta.
GDP components
Private consumption is foreseen to remain below historical rates as the situation in the labour market and, to a lesser extent, the recent VAT increase are likely to dampen eventual improvements in household disposable income. Despite previous high government consumption stemming from mandatory and quasi-mandatory expenditure, this variable is expected to decelerate in the forthcoming years as a response to maintain fiscal stringency to bring the public deficit down to sustainable levels. The key drivers of GDP growth will be external demand, where exports are projected to increase by 1.4% in 2004 and 2.8 % in 2005, reflecting better economic conditions in Malta’s main trading partners, and gross fixed capital formation expected to grow 4.2% and 2.6% in 2004 and 2005, respectively, induced by stronger demand in the manufacturing sector, public works and industrial restructuring. Due to the very open character of the Maltese economy, imports are estimated to grow by 2.7% in the period, while the current account balance will slightly improve in 2005, supported by a recovery in tourism revenue and net transfers from the EU.
Costs and prices
As a result of a VAT increase at the beginning of 2004, the rate of inflation is likely to increase in the first half of the year, but the removal of agriculture and food levies as from May 1st will ease pressures on the consumer price index (CPI). As long as world primary commodity prices and oil prices variations remain moderate, significant price increases are not expected, the CPI staying stable at slightly above 2% in the period.
0
10
20
30
40
50
60
70
80
98 99 00 01 02 03 04-12
-10
-8
-6
-4
-2
0Forecast% of GDP
% of GDP
Graph 4.7: Malta - General government finances
Government debt (lhs)
Governmentbalance (rhs)
86

Chapter 4 Acceding Countries, Malta
Labour market
The survey-based unemployment rate attained 8.2% in December 2003. This was due to poor economic growth, the implementation of early retirement schemes linked to industrial restructuring, notably in the shipyards. Furthermore, previous rises in public wages spilled over to the private sector and subsequently increased unit labour costs. The unemployment rate is forecast to further deteriorate in 2004 to 8.6%, to improve gradually in 2005, provided labour costs could be kept under control to regain competitiveness and accelerate employment creation.
Public finances
High mandatory and quasi-mandatory expenditures, healthcare and pension systems, early retirement schemes associated with shipyard restructuring, lower than expected tax collection due to the economic slowdown and large outlays connected to the construction of the new Mater Dei Hospital are
overloading public deficit and public debt figures. In addition to this, the shipyards restructuring in 2003 brought about a one-off rise in public liabilities which led general government deficit to 9.7% of GDP. As a result, the debt-to GDP ratio climbed to 72% of GDP in 2003. The recent tax rises and budgetary control streamlining, expected economic recovery and the impact of EU financing on the budget as from May 1st
should bring the down general government deficit to 5.9% and 4.5% of GDP in 2004 and 2005 respectively. As a result, a slowdown in the increase in the public debt ratio might be expected from 2004.
Table 4.7 Main features of country forecast - MALTA
2002 Annual percentage changemio MTL Curr. prices % GDP 1995-99 2000 2001 2002 2003 2004 2005
GDP at constant prices 1681.0 100.0 4.5 6.4 -1.2 1.7 0.4 1.4 2.0 Private consumption 1081.8 64.4 - 7.4 1.7 2.5 1.1 0.5 1.0 Public consumption 341.4 20.3 - 5.4 3.0 2.4 6.7 1.1 0.2 GFCF 350.7 20.9 - 17.5 -11.1 -13.3 13.4 4.2 2.6 of which : equipment 202.9 12.1 - - - - 2.6 2.6 2.8 Change in stocks as % of GDP -68.0 -4.0 0.0 2.1 -2.5 -4.0 -3.8 -2.6 -1.8 Exports (goods and services) 1472.9 87.6 - 5.6 -4.9 3.0 -1.1 1.4 2.8 Final demand 3178.9 189.1 - 8.4 -5.2 0.0 2.1 2.1 2.3 Imports (goods and services) 1498.0 89.1 - 10.4 -9.2 -2.0 3.9 2.7 2.7 GNI at constant prices (GDP deflator) 1687.4 100.4 4.3 1.8 3.1 1.4 0.4 1.4 2.0 Contribution to GDP growth : Domestic demand - 9.7 -1.4 -1.1 4.7 1.5 1.3
Stockbuilding - 1.6 -4.5 -1.6 0.2 1.2 0.8Foreign balance - -4.9 4.7 4.4 -4.5 -1.2 -0.1
Employment 0.9 2.3 1.8 -0.3 -1.4 -0.2 1.1 Unemployment (a) 6.7 7.0 6.7 7.5 8.2 8.6 8.1 Compensation of employees/head 6.0 2.1 6.5 2.3 1.4 1.3 1.4 Unit labour costs 2.4 -1.8 9.6 0.2 -0.5 -0.4 0.6 Real unit labour costs -0.2 -2.7 3.6 -0.8 -4.8 -1.5 -0.9 Savings rate of households (b) - - - - - - - GDP deflator 2.6 0.9 5.8 1.1 4.6 1.1 1.5 Private consumption deflator - 1.5 3.1 1.0 1.3 2.7 2.1 Harmonised index of consumer prices - - - - - - - Trade balance (c) -20.5 -23.8 -17.9 -13.6 -17.1 -18.3 -17.9 Balance on current transactions with ROW (c) - - - - -3.4 -4.3 -3.9 Net lending(+) or borrowing(-) vis-à-vis ROW (c) - - - - -3.4 -4.3 -3.9 General government balance (c) - -6.5 -6.4 -5.7 -9.7 -5.9 -4.5 General government gross debt (c) - 57.1 61.8 61.7 72.0 73.9 75.9(a) as % of total labour force. (b) gross saving divided by gross disposable income. (c) as a percentage of GDP.
87

8. Poland A broad-based recovery underpinned by an expansionary fiscal policy in 2004
Economic situation in 2003 After the economic slowdown experienced in 2001-02, the recovery gained strength in 2003. Real GDP growth accelerated to an impressive 4.7% year-on-year in the fourth quarter of 2003 from 2.2% in the first quarter, bringing growth for 2003 as a whole to 3.7% compared to 1.4% in 2002. The driving force behind growth last year was net exports, boosted by the sharp real effective depreciation of the zloty. Private consumption was held back by weak real income growth, while fixed investment contracted for the third consecutive year, although less than in previous years. The economic upswing was helped by an accommodative fiscal policy and more favourable monetary conditions, resulting from the easing of monetary policy and the depreciation of the currency against the euro. Prospects in 2004 and 2005 Real GDP growth is projected to gradually accelerate to 4.6% in 2004 and 4.8% in 2005. Net exports will continue to support growth this year but their contribution will turn negative next year. Domestic demand will strengthen over the forecast period, with rising consumer demand and an expected rebound in investment. In addition, against the background of easier monetary conditions, the substantial loosening of fiscal policy this year will provide an additional stimulus to growth.
GDP components
Boosted by increasing corporate profits, an improving economic outlook and EU accession, investment is projected to pick up in 2004 and grow more strongly in 2005, thus widening the base of the recovery. Investment activity began to recover, but only timidly, in the third quarter of 2003 and should gradually strengthen this year and next. Provided that access to finance improves for firms, investment growth could get close to 10% in volume terms in 2005.
Private consumption is projected to accelerate only moderately this year, as wage growth will remain subdued given the still difficult situation in the labour market. Another restraining factor is the pick-up in inflation that will reduce households’ real incomes. Growing consumer confidence and improved employment prospects should lead to faster consumer spending in 2005.
Export growth is expected to remain robust, supported by the depreciation of the zloty, productivity gains of Polish companies and the growth revival in Poland’s main trading partners. Import growth will rise in parallel with the recovery in investment activity and is projected to outpace export growth in 2005. Labour market, costs and prices The unemployment rate stabilised at the very high level of 19.8% of the labour force in 2003. Despite the acceleration of growth, employment growth is set to increase only moderately in a context of still large job losses linked to the ongoing restructuring process in industry and agriculture. Employment growth will not be strong enough to make a substantial dent in the level of unemployment, which is projected to stay high at 19.3% of the labour force in 2005.
The recovery will gradually increase inflationary pressures that remained subdued in 2003 in a context of moderate wage growth and weak domestic demand. The forecast predicts a sharp increase in inflation from the very low level of 0.7% on average in 2003 to 3.0% in 2005. The inflationary push will come from the acceleration of domestic demand, the pass-through of the currency depreciation and accession-related tax and price adjustments. However, inflation will remain within the target range set by the National Bank of Poland (2.5% +/- 1 percentage point).
0
10
20
30
40
50
60
98 99 00 01 02 03 04 05-6
-5
-4
-3
-2
-1
0Forecast
% of GDP% of GDPGvt. Debt (lhs)
Gvt. Balance (rhs)
Graph 4.8: Poland - General government finances
88

Chapter 4 Acceding Countries, Poland
External accounts Reflecting strong export growth and weak imports, the current account deficit narrowed to 2.0% of GDP last year. A still good performance from exports will limit the increase in the current account deficit in 2004, but following stronger import growth, the deficit is projected to widen more markedly in 2005, reaching 2.8% of GDP compared to 2.3% in 2004. Higher transfers from the EU will cushion the current account deficit and improve the balance on the capital account.
Public finances
In 2003, the general government deficit is estimated to be slightly lower than expected in the autumn and represents 4.1% of GDP. As the Eurostat communiqué (issued 2 March) on the classification of funded pension schemes is of a generic nature with the individual cases being analysed bilaterally, the forecast still considers the open pension funds as part of the government sector (reducing the deficit by
1.6% of GDP).
In 2004, notwithstanding the strengthening of economic growth, the general government deficit is projected to increase substantially to 6% of GDP (compared to a government target of 5.7%). Eventual savings, announced in the Hausner plan, will be offset by additional expenditures resulting from a higher indexation of disability pensions and the unforeseen magnitude of the zloty depreciation in 2003 inducing an increased contribution to the EU budget. Revenues would decrease following the lowering of the corporate income tax rate and the change in the VAT legislation.
It is projected that the deficit will fall in 2005 to 4.5% of GDP. The improvement of the deficit would be mainly cyclical and reflect positive net inflows from the EU budget. The forecast takes into account savings voted in Parliament in March 2004. The gross debt ratio is estimated to have reached 45.4% of GDP in 2003 and would increase to over 50% by the end of 2005.
Table 4.8 Main features of country forecast - POLAND
2002 Annual percentage changebn PLN Curr. prices % GDP 1995-99 2000 2001 2002 2003 2004 2005
GDP at constant prices 780.5 100.0 5.7 4.0 1.0 1.4 3.7 4.6 4.8 Private consumption 518.7 66.5 5.8 2.8 0.2 3.4 3.1 3.7 4.2 Public consumption 140.6 18.0 2.9 1.3 0.6 0.6 0.4 1.6 1.2 GFCF 148.3 19.0 15.7 2.7 -8.8 -5.8 -0.9 6.0 9.8 of which : equipment - - - 4.0 -10.4 -9.6 - - - Change in stocks as % of GDP -1.1 -0.1 1.0 1.2 0.1 -0.2 1.1 1.1 1.1 Exports (goods and services) 231.4 29.7 11.5 23.2 3.1 4.8 13.0 11.5 9.7 Final demand 1038.0 133.0 8.2 7.0 -1.5 1.7 4.8 5.9 6.3 Imports (goods and services) 257.5 33.0 18.2 15.6 -5.3 2.6 7.9 9.7 10.4 GNI at constant prices (GDP deflator) 772.8 99.0 5.8 3.7 1.1 1.2 3.2 4.3 4.8 Contribution to GDP growth : Domestic demand 7.2 2.7 -1.9 0.9 1.8 3.7 4.8
Stockbuilding 0.3 0.3 -1.2 -0.2 0.2 0.0 0.1Foreign balance -1.6 1.2 2.9 0.7 1.7 0.8 -0.1
Employment 1.2 -2.3 -0.6 -2.2 -1.1 0.4 1.1 Unemployment (a) 12.0 16.4 18.5 19.8 19.8 19.6 19.3 Compensation of employees/head 24.0 1.8 13.3 4.2 1.5 3.0 4.5 Unit labour costs 18.7 -4.4 11.5 0.5 -3.2 -1.1 0.9 Real unit labour costs 2.8 -10.4 7.2 -0.7 -3.9 -3.1 -1.7 Savings rate of households (b) - - 11.1 9.1 9.2 8.9 7.7 GDP deflator 15.5 6.7 4.0 1.2 0.7 2.1 2.6 Private consumption deflator 15.5 9.0 6.6 1.6 0.7 2.6 3.3 Harmonised index of consumer prices - 10.1 5.3 1.9 0.7 2.3 3.0 Trade balance (c) -4.7 -7.4 -4.1 -3.8 -2.9 -2.8 -3.5 Balance on current transactions with ROW (c) -2.4 -6.0 -2.9 -2.6 -2.0 -2.3 -2.8 Net lending(+) or borrowing(-) vis-à-vis ROW (c) -2.4 -6.0 -2.8 -2.6 -2.0 -1.9 -2.2 General government balance (c) -2.3 -1.8 -3.5 -3.6 -4.1 -6.0 -4.5 General government gross debt (c) - 36.6 36.7 41.2 45.4 49.1 50.3(a) as % of total labour force. (b) gross saving divided by gross disposable income. (c) as a percentage of GDP.
89

9. Slovakia Robust growth continues
Growth in 2003
In 2003, real GDP growth remained robust but slowed down slightly to 4.2% (from 4.4% in 2002) and its composition turned around. Whereas, in the year before, domestic demand had been the main growth engine, its growth contribution (including stock-building) became negative in 2003. Private consumption was dampened significantly by fiscal restraint and adjustments in administered prices and contracted. So did gross fixed capital formation. In spite of the lacklustre performance of Slovakia’s main export markets and reflecting the creation of significant new export capacity, exports of goods and services rose strongly by some 23%, outpacing import growth of about 14% and leading to a net external contribution to GDP growth of 6.5 percentage points.
Growth prospects
In 2004 and 2005, growth is predicted to stay at approximately the same level as in 2003. Domestic demand is expected to contribute positively to growth again (by some 3 to 4 percentage points), in consequence of a gradual acceleration of private consumption and a strong pick-up in gross fixed capital formation. The latter is not least due to already announced greenfield investments. Export growth rates are anticipated at close to 10%. In tandem with domestic demand, imports are expected to grow at similar rates. Altogether, the growth contribution by external demand should hover around zero.
Inflation
As the government continues to adjust administered prices and indirect taxes, headline inflation will prospectively be around 8% in 2004. In 2003, it reached 8½ %, while core inflation averaged 2.6 %. Assuming that second-round effects are kept under control, significant disinflation should be possible in 2005 -- leading to an inflation rate of around 4½ %.
Current account
Dominated by a very strong export performance, the current account deficit narrowed from slightly over 8% of GDP in 2002 to less than 1% of GDP in 2003. Foreign trade developments will continue to be the main factor behind the current account deficit. Accordingly, the current account deficit should widen again in 2004 and 2005, owing, inter alia, to higher investment-related imports. However, it is likely to stay significantly below 5 % of GDP.
Labour market
After a significant rise in 2002 resulting from a virtual halt in administered price adjustments, real wages declined again in 2003 (by roughly 1½ %). They are expected to continue to do so in 2004. A return of positive real wage growth rates is not forecast before 2005.
Unemployment has been slowly but steadily falling from its peak above 19% in 2001. It amounted to an average of around 17% in 2003. In spite of still continuing enterprise restructuring, it is set for a further decline to close to some 16 % in 2005 – the main reason being a more decisive policy stance in tackling the deep-seated structural labour market shortcomings.
Public finances
The general government deficit reached 5.7% of GDP in the election year 2002.
After the elections in September 2002, the new Slovak authorities initiated a fiscal turn-around, aiming at a general government deficit target of 5% of GDP for 2003. With a deficit of 3.6% of GDP, the government has substantially over-performed on this target. At the beginning of 2004, a far-reaching tax reform was implemented, consisting mainly of
-8
-6
-4
-2
0
2
4
6
8
10
98 99 00 01 02 03 04 05
Forecast
Domestic (excl. Inventories)
ExternalInventories
Totalgrowth
yoy % ch.
Graph 4.9: Slovakia - GDP growth and its contributors
90
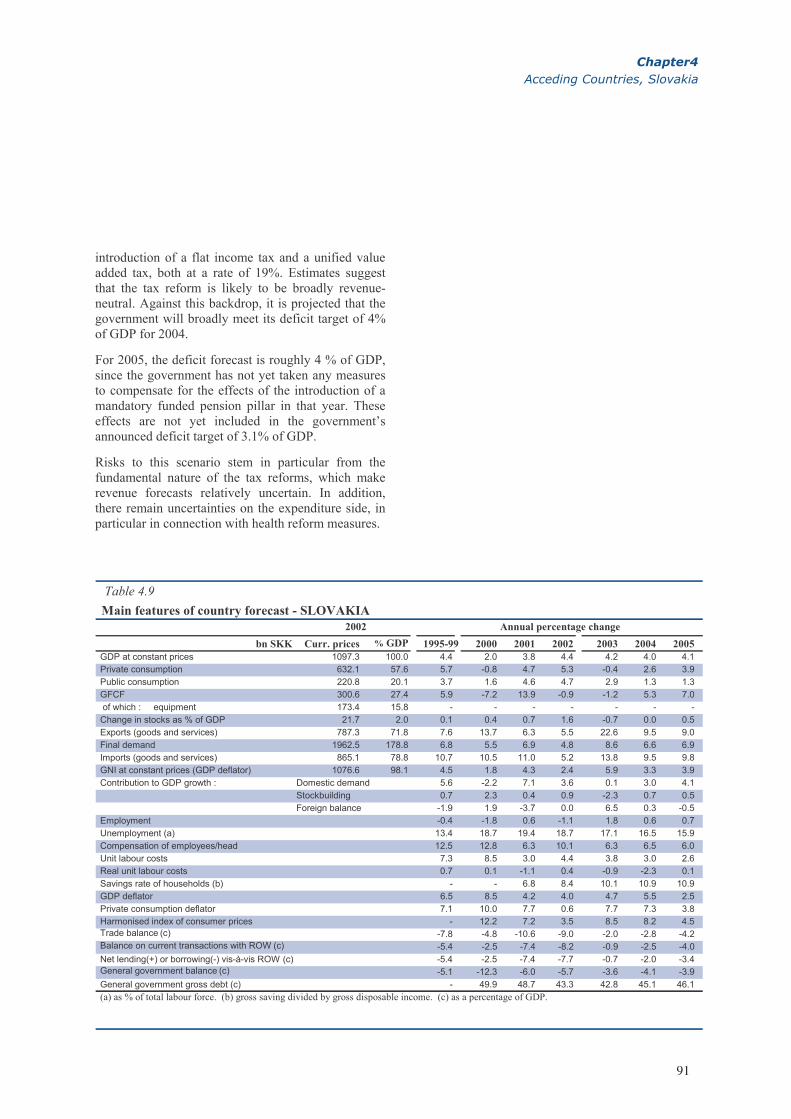
Chapter4Acceding Countries, Slovakia
introduction of a flat income tax and a unified value added tax, both at a rate of 19%. Estimates suggest that the tax reform is likely to be broadly revenue-neutral. Against this backdrop, it is projected that the government will broadly meet its deficit target of 4% of GDP for 2004.
For 2005, the deficit forecast is roughly 4 % of GDP, since the government has not yet taken any measures to compensate for the effects of the introduction of a mandatory funded pension pillar in that year. These effects are not yet included in the government’s announced deficit target of 3.1% of GDP.
Risks to this scenario stem in particular from the fundamental nature of the tax reforms, which make revenue forecasts relatively uncertain. In addition, there remain uncertainties on the expenditure side, in particular in connection with health reform measures.
Table 4.9 Main features of country forecast - SLOVAKIA
2002 Annual percentage changebn SKK Curr. prices % GDP 1995-99 2000 2001 2002 2003 2004 2005
GDP at constant prices 1097.3 100.0 4.4 2.0 3.8 4.4 4.2 4.0 4.1 Private consumption 632.1 57.6 5.7 -0.8 4.7 5.3 -0.4 2.6 3.9 Public consumption 220.8 20.1 3.7 1.6 4.6 4.7 2.9 1.3 1.3 GFCF 300.6 27.4 5.9 -7.2 13.9 -0.9 -1.2 5.3 7.0 of which : equipment 173.4 15.8 - - - - - - - Change in stocks as % of GDP 21.7 2.0 0.1 0.4 0.7 1.6 -0.7 0.0 0.5 Exports (goods and services) 787.3 71.8 7.6 13.7 6.3 5.5 22.6 9.5 9.0 Final demand 1962.5 178.8 6.8 5.5 6.9 4.8 8.6 6.6 6.9 Imports (goods and services) 865.1 78.8 10.7 10.5 11.0 5.2 13.8 9.5 9.8 GNI at constant prices (GDP deflator) 1076.6 98.1 4.5 1.8 4.3 2.4 5.9 3.3 3.9 Contribution to GDP growth : Domestic demand 5.6 -2.2 7.1 3.6 0.1 3.0 4.1
Stockbuilding 0.7 2.3 0.4 0.9 -2.3 0.7 0.5Foreign balance -1.9 1.9 -3.7 0.0 6.5 0.3 -0.5
Employment -0.4 -1.8 0.6 -1.1 1.8 0.6 0.7 Unemployment (a) 13.4 18.7 19.4 18.7 17.1 16.5 15.9 Compensation of employees/head 12.5 12.8 6.3 10.1 6.3 6.5 6.0 Unit labour costs 7.3 8.5 3.0 4.4 3.8 3.0 2.6 Real unit labour costs 0.7 0.1 -1.1 0.4 -0.9 -2.3 0.1 Savings rate of households (b) - - 6.8 8.4 10.1 10.9 10.9 GDP deflator 6.5 8.5 4.2 4.0 4.7 5.5 2.5 Private consumption deflator 7.1 10.0 7.7 0.6 7.7 7.3 3.8 Harmonised index of consumer prices - 12.2 7.2 3.5 8.5 8.2 4.5 Trade balance (c) -7.8 -4.8 -10.6 -9.0 -2.0 -2.8 -4.2 Balance on current transactions with ROW (c) -5.4 -2.5 -7.4 -8.2 -0.9 -2.5 -4.0 Net lending(+) or borrowing(-) vis-à-vis ROW (c) -5.4 -2.5 -7.4 -7.7 -0.7 -2.0 -3.4 General government balance (c) -5.1 -12.3 -6.0 -5.7 -3.6 -4.1 -3.9 General government gross debt (c) - 49.9 48.7 43.3 42.8 45.1 46.1(a) as % of total labour force. (b) gross saving divided by gross disposable income. (c) as a percentage of GDP.
91

10. Slovenia Inflation continues to be on a declining trend
The economy in 2003
The Slovene economy is showing a remarkable resilience; the real GDP growth rate averaged 4% in 1995-2002. For 2003, however, growth is estimated to have decelerated to 2.3%, mainly due to modest export expansion. Domestic demand, on the other hand, remained buoyant. Strong credit growth and moderate real wage increases kept private consumption robust. Investment expenditure was also booming, but it is doubtful whether the expansion in gross capital formation truly reflects investors’ optimism about future prospects as business confidence has been fading and stocks have increased. Imports of investment goods were exceptionally strong in the second half of 2003. Export growth, on the other hand, decelerated further in the unfavourable international environment; a weak EU economy, the main trade partner for Slovenia, failed to provide adequate demand while market growth of CEFTA (Central European Free Trade Agreement), Russia and former Yugoslavia did not compensate sufficiently, unlike in 2002. The net external demand contribution to growth turned negative while the current account surplus quickly eroded, coming close to a balance much sooner than expected. Moreover, in 2003 a net outflow of FDI was registered for the first time.
Outlook for 2004-2005
The forecast projects a gradual recovery of the economy. This year, an upturn is anticipated as export
growth picks up while domestic demand continues to strengthen. Both consumption and investment expenditure are expected to grow further, following a boost in construction activity stimulated by credit demand from the national housing saving scheme, and increasing exports, linked to a revived EU economy, market competition and enterprise restructuring. Imports are also set to rise slightly, in step with strengthened domestic (investment) demand and exports. All in all, real GDP growth should accelerate to 3.6% in 2005 whereas the current account will turn (marginally) negative in 2004 and 2005.
Prices and wages
Inflation has declined markedly in the last two years – the average rate of consumer price growth dropped from 8.6% in 2001 to 5.7% in 2003 – but is still relatively high. After adopting a programme on ERM-II participation and adoption of the euro, the government enforced co-ordination of economic policies so as to meet conditions for early EMU entry. An anti-inflationary policy commitment was met through caps on administered price rises and indirect taxes as well as frequent adjustments of excise duties on oil. Also, in pursuing the objective of a generalised de-indexation of the economy, backward-looking indexation mechanisms have been further weakened. After de-indexation of interest rates, a wage agreement for public sector wages was concluded in July 2003 introducing forward-looking indexation with anticipated rather than actual domestic inflation and also taking into account EU inflation and the euro/tolar exchange rate. Furthermore, monetary policy has been geared towards slowing the depreciation of the currency, thus somewhat compressing the inherent inflationary pass through. In 2003, the Bank of Slovenia lowered the interest rates by a cumulative 225 basis points. However, bringing down inflation sustainably might prove difficult to achieve as inflationary pressures continue to be fed by slow liberalisation in various sectors, inflexible labour markets, and remaining indexation mechanisms. In addition, steady disinflation might be under pressure in an environment of rallying private consumption. The public finance stance is therefore being further strengthened.
0
12
3
45
6
7
89
10
2001 2002 2003 2004 2005
Forecastyoy % ch.
Graph 4.10: Slovenia - Inflation trends
Unit labour costs
HICP inflation
92

Chapter 4 Acceding Countries, Slovenia
Labour market In 2003, the labour market remained weak with a slight fall in employment and an increase of unemployment. This year the unemployment rate is to return to past levels of slightly above 6% and then resume its gradual trend decline as GDP growth strengthens. External sector A slow recovery in the EU weighed on Slovenia’s external sector position. 2003 saw a larger trade deficit and a smaller surplus in services as compared to the year before, roughly balancing out the current account. The deterioration in the current account is expected to continue moderately in 2004 and 2005, partly attenuated by the capital transfers from the EU funds.
Public finance After unexpected setbacks in previous years, fiscal consolidation seemed to be well on track. Although the 2003 budget was amended during the year - a common practice in previous years, as well - the general government deficit was 1.8% of GDP, slightly better than projected, and this against the background of faltering growth. The general government budget deficit is projected to remain broadly stable, thanks to expenditure limits while a decline in revenues due to the direct tax reform is compensated by an inflow of EU funds. Nevertheless, a potential revision of the government accounts, linked to the sectoral re-classification of some public institutions, may improve or worsen the deficit marginally (about 0.2% of GDP).
Table 4.10 Main features of country forecast - SLOVENIA
2002 Annual percentage changebn SIT Curr. prices % GDP 1995-99 2000 2001 2002 2003 2004 2005
GDP at constant prices 5275.8 100.0 4.4 4.1 2.9 2.9 2.3 3.2 3.6 Private consumption 2879.8 54.6 4.6 0.3 2.4 1.1 3.0 3.5 3.7 Public consumption 1164.0 22.1 3.3 2.3 4.0 2.5 2.8 2.9 2.7GFCF 1193.2 22.6 14.8 2.6 -0.4 1.3 5.5 8.2 7.0 of which : equipment 555.4 10.5 15.7 3.0 5.3 3.9 6.3 7.6 5.9 Change in stocks as % of GDP 44.0 0.8 1.1 1.3 0.2 1.0 1.5 0.8 0.3 Exports (goods and services) 3055.2 57.9 4.8 13.0 6.4 6.5 3.4 5.5 5.8 Final demand 8336.1 158.0 6.0 5.4 2.8 3.8 3.9 4.6 4.7 Imports (goods and services) 2980.3 56.5 8.6 7.6 3.0 4.9 6.3 6.6 6.3 GNI at constant prices (GDP deflator) 5258.7 99.7 4.3 3.9 2.8 2.5 2.3 3.2 3.6 Contribution to GDP growth : Domestic demand 6.6 1.4 2.0 1.4 3.7 4.8 4.6
Stockbuilding 0.1 0.3 -1.1 0.7 0.5 -0.7 -0.5Foreign balance -2.2 2.4 1.9 0.8 -1.9 -0.9 -0.6
Employment - 3.8 0.5 -0.5 -1.4 0.1 0.4 Unemployment (a) 7.1 6.6 5.8 6.1 6.5 6.4 6.2 Compensation of employees/head - 15.1 11.6 10.5 7.5 6.5 6.3 Unit labour costs - 14.7 9.0 6.8 3.6 3.3 3.1 Real unit labour costs - 8.6 -0.1 -1.2 -1.4 -0.2 -0.4 Savings rate of households (b) - - - - - - - GDP deflator 10.8 5.6 9.1 8.1 5.1 3.5 3.4 Private consumption deflator 10.8 8.4 8.1 7.6 5.4 3.9 3.1 Harmonised index of consumer prices - 8.9 8.6 7.5 5.7 3.6 3.2 Trade balance (c) -4.6 -5.9 -3.2 -1.1 -2.2 -2.7 -2.7 Balance on current transactions with ROW (c) -0.8 -2.8 0.1 1.7 0.2 -0.5 -0.6 Net lending(+) or borrowing(-) vis-à-vis ROW (c) -0.8 -2.8 0.1 1.7 0.2 -0.3 -0.5 General government balance (c) - -3.0 -2.7 -1.9 -1.8 -1.7 -1.8 General government gross debt (c) - 26.7 26.9 27.8 27.1 28.3 28.2(a) as % of total labour force. (b) gross saving divided by gross disposable income. (c) as a percentage of GDP.
93


Chapter 5 Other Candidate Countries

1. BulgariaRebalancing domestic and external demand
The economy in 2003
Real GDP growth of 4.3% was based on very strong domestic demand, coming in particular from private consumption and investment. This was due to increases in employment and net income as well as, most importantly, a considerable surge in bank credits, although from a low base. Since many of the demanded products, mostly durable consumer goods and investment goods, are not produced domestically, imports increased by almost 20% in real terms. As a consequence, net exports had a very strong negative contribution to GDP growth.
Consumer price inflation was very low in the first half of 2003, also because of low import prices, but picked up again in the second half following increases in administered prices and food prices. This resulted in a low average inflation rate and a higher end-of-year inflation rate. Unemployment decreased significantly as a result of net job creation in both the private sector and government employment schemes. However, there is also a statistical effect from measures introduced to enforce the existence of labour contracts.
Preliminary data set the current account deficit at a record 8.6% of GDP, largely because of a high trade deficit. However, these figures might be subject to revision at a later stage since net errors and omissions are currently at 2.5% of GDP. Net inflows of foreign direct investment (FDI) have been very high at 6.8% of GDP. Since these are not only related to privatisation, but to a large part to the expansion of
existing or the creation of new production capacity, they have contributed to the import boom. In view of the deterioration of the current account and the revenue over-performance which had resulted in a cash surplus peaking at 2.8% of GDP in October, the general government deficit - initially targeted at 0.7% of GDP - was revised and turned out close to balance at the end of the year.
Prospects for 2004 and 2005
Real GDP growth is expected to accelerate further to rates of 5% in 2004 and 5½% in 2005 on the basis of a rebalancing of domestic and external demand. Main assumptions are an acceleration of activity in the economies of Bulgaria’s main trading partners, in particular in the enlarged EU, as well as a continued prudent economic policy oriented towards macroeconomic stability and structural reforms.
The acceleration of GDP growth is expected to go along with a significant change in its composition compared to 2003. Given that households and firms face increased indebtedness and that banks are becoming gradually more constrained in additional lending, private consumption and investment as well as imports should rise at more moderate rates than in 2003 while exports could increase more strongly. However, improved business opportunities expected from EU accession and rising net income should prevent domestic demand from decelerating more significantly.
Increases of excise taxes and of energy prices suggest a somewhat higher average inflation rate in 2004. If wage increases remain moderate, average consumer price inflation is likely to see rates of 6% in 2004 and of 4½% in 2005.
The projected GDP growth will allow net employment gains of 1.5% per year in 2004 and 2005. This will make it possible to lower the unemployment rate further if the active population remains broadly constant because the induced increasing participation rate corresponds to the declining share of the working-age population.
-12
-8
-4
0
4
8
12
98 99 00 01 02 03 04 05
Final domestic demand*Net exports StocksGDP
Graph 5.1: Bulgaria - GDP growth and contributions
% Forecast
* incl. stat . discrepancy
96
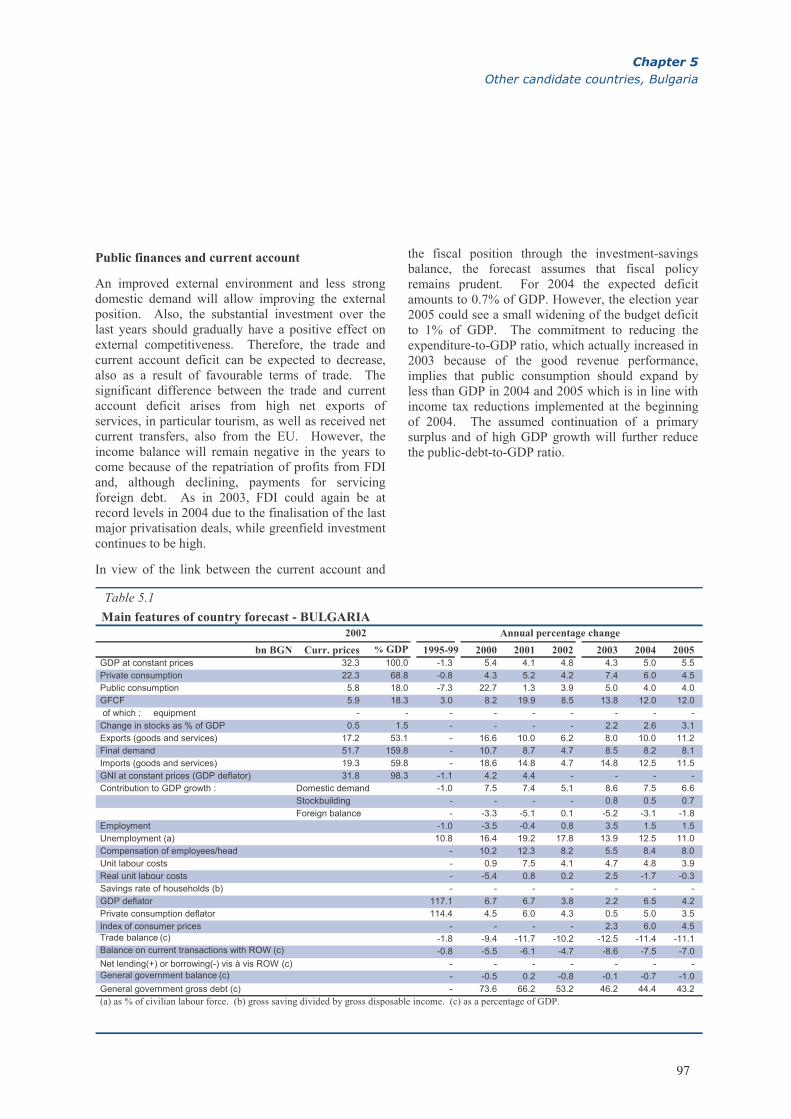
Chapter 5 Other candidate countries, Bulgaria
Public finances and current account
An improved external environment and less strong domestic demand will allow improving the external position. Also, the substantial investment over the last years should gradually have a positive effect on external competitiveness. Therefore, the trade and current account deficit can be expected to decrease, also as a result of favourable terms of trade. The significant difference between the trade and current account deficit arises from high net exports of services, in particular tourism, as well as received net current transfers, also from the EU. However, the income balance will remain negative in the years to come because of the repatriation of profits from FDI and, although declining, payments for servicing foreign debt. As in 2003, FDI could again be at record levels in 2004 due to the finalisation of the last major privatisation deals, while greenfield investment continues to be high.
In view of the link between the current account and
the fiscal position through the investment-savings balance, the forecast assumes that fiscal policy remains prudent. For 2004 the expected deficit amounts to 0.7% of GDP. However, the election year 2005 could see a small widening of the budget deficit to 1% of GDP. The commitment to reducing the expenditure-to-GDP ratio, which actually increased in 2003 because of the good revenue performance, implies that public consumption should expand by less than GDP in 2004 and 2005 which is in line with income tax reductions implemented at the beginning of 2004. The assumed continuation of a primary surplus and of high GDP growth will further reduce the public-debt-to-GDP ratio.
Table 5.1 Main features of country forecast - BULGARIA
2002 Annual percentage changebn BGN Curr. prices % GDP 1995-99 2000 2001 2002 2003 2004 2005
GDP at constant prices 32.3 100.0 -1.3 5.4 4.1 4.8 4.3 5.0 5.5 Private consumption 22.3 68.8 -0.8 4.3 5.2 4.2 7.4 6.0 4.5 Public consumption 5.8 18.0 -7.3 22.7 1.3 3.9 5.0 4.0 4.0 GFCF 5.9 18.3 3.0 8.2 19.9 8.5 13.8 12.0 12.0 of which : equipment - - - - - - - - - Change in stocks as % of GDP 0.5 1.5 - - - - 2.2 2.6 3.1 Exports (goods and services) 17.2 53.1 - 16.6 10.0 6.2 8.0 10.0 11.2 Final demand 51.7 159.8 - 10.7 8.7 4.7 8.5 8.2 8.1 Imports (goods and services) 19.3 59.8 - 18.6 14.8 4.7 14.8 12.5 11.5 GNI at constant prices (GDP deflator) 31.8 98.3 -1.1 4.2 4.4 - - - - Contribution to GDP growth : Domestic demand -1.0 7.5 7.4 5.1 8.6 7.5 6.6
Stockbuilding - - - - 0.8 0.5 0.7Foreign balance - -3.3 -5.1 0.1 -5.2 -3.1 -1.8
Employment -1.0 -3.5 -0.4 0.8 3.5 1.5 1.5 Unemployment (a) 10.8 16.4 19.2 17.8 13.9 12.5 11.0 Compensation of employees/head - 10.2 12.3 8.2 5.5 8.4 8.0 Unit labour costs - 0.9 7.5 4.1 4.7 4.8 3.9 Real unit labour costs - -5.4 0.8 0.2 2.5 -1.7 -0.3 Savings rate of households (b) - - - - - - - GDP deflator 117.1 6.7 6.7 3.8 2.2 6.5 4.2 Private consumption deflator 114.4 4.5 6.0 4.3 0.5 5.0 3.5 Index of consumer prices - - - - 2.3 6.0 4.5 Trade balance (c) -1.8 -9.4 -11.7 -10.2 -12.5 -11.4 -11.1 Balance on current transactions with ROW (c) -0.8 -5.5 -6.1 -4.7 -8.6 -7.5 -7.0 Net lending(+) or borrowing(-) vis à vis ROW (c) - - - - - - - General government balance (c) - -0.5 0.2 -0.8 -0.1 -0.7 -1.0 General government gross debt (c) - 73.6 66.2 53.2 46.2 44.4 43.2(a) as % of civilian labour force. (b) gross saving divided by gross disposable income. (c) as a percentage of GDP.
97

2. RomaniaSustained growth and pro-cyclical fiscal stancecause weak current account
The economy in 2003
In 2003, Romania’s four-year old economic recovery weathered the economic slowdown in the EU as growth remained robust. According to preliminary figures, real GDP growth reached 4.9% in 2003. However, growth was increasingly unbalanced and driven mainly by domestic demand. In particular, household consumption rose sharply at a pace of 7.1% on the back of surging consumer credit and high wage growth. Moreover, with a real growth of 4.6% government consumption expanded considerably more than expected. Gross fixed capital formation rose rapidly at 9.2%, pointing to the ongoing replacement of Romania’s capital stock.
The strong domestic demand led to a sustained import growth of 16.3%. With export growth decelerating, reaching 11.1% for the year, export performance appeared less vigorous compared to previous years. This was also reflected in industrial production growing at a significantly lower pace in 2003 than in previous years. Consequently, a significant deterioration of the trade balance occurred, and, after contributing positively to growth in 2002, net exports turned strongly negative during 2003. As a result, the current account deficit widened significantly over 2003. After dropping sharply to 3.5% of GDP in 2002, the cumulative current account deficit rose again to 5.9% of GDP in 2003.
Prospects for 2004 and 2005
The outlook for the Romanian economy points to sustained economic growth, slowly declining unemployment and further disinflation. Relative to the Autumn 2003 forecast, the significant deterioration in the trade balance in 2003 and a sharper acceleration in domestic demand cause an upward revision in the current account deficit over the forecast period. Based on a no-policy-change assumption, the continuation of a pro-cyclical fiscal stance leads to government expenditure for 2004 being revised upwards.
GDP growth and components
After reaching 4.9% in 2003, GDP growth is expected to accelerate due to sustained domestic demand. Household consumption is expected to decelerate slightly, although further real wage growth and a permanent effect on disposable income from lower social security contribution underpin demand. Consumer credits are expected to grow at a more moderate pace. Growth of investment is expected to remain high over the forecast period due to the ongoing modernisation of production facilities and a structural change towards less labour-intensive production. Export market growth, stronger inflows of FDI and improved access to financing will also support investments. For 2004 and 2005, net exports are expected to remain negative, but at a level more compatible with a sustainable current account deficit.
Inflation
In 2003, consumer price inflation remained on a downward path with the year-on-year inflation rate declining to 14.1% in December, thereby allowing the central bank’s target to be met. For 2004 and 2005, inflation is expected to be brought further down in line with the disinflation target of the authorities. In view of the robust activity, expectations of high wage growth, still insufficient financial discipline, some downward pressure on the currency and needed upwards adjustment of administered prices the target remains, however, ambitious. After accelerating in the first half of 2003, the pace of real wage growth moderated in the latter part of the year, resulting in an average real wage increase of 8.7% in 2003. Albeit lower, real wage growth is projected to remain robust in 2004 and 2005, due to further productivity gains.
-8
-7
-6
-5
-4
-3
-2
-1
98 99 00 01 02 03 04 05
% of GDP
Graph 5.2: Romania - government balance and current acccount
Forecast
current account balance
general government balance
98

Chapter 5 Other candidate countries, Bulgaria
Labour market
Continued growth in employment will allow the reduction in unemployment despite lay-offs incurred by continued economic restructuring. A broadly stable labour force supports this reduction. Labour market trends should be interpreted with caution as they are affected by revisions and changing methodology.
Public finances
The fiscal stance in 2003 turned pro-cyclical as revenue gains were largely spent towards the end of the year. Strong growth in tax revenue and further savings on interest payments resulted, however, in an undershooting of the deficit target for 2003, reaching 2.0% according to ESA 95 standards. The general government deficit is expected to reach 3.0% in 2004 and 2005 on the back of continued high spending and more subdued revenue growth. However, a more restrictive fiscal policy for 2004 than originally
intended might be the result of a planned pre-cautionary stand-by arrangement with the IMF.
External balance
For 2004 and 2005, the external balance is expected to improve. Private consumption and investment will continue to drive imports up, and the pro-cyclical fiscal stance also sustains high demand. Yet, import growth should, nevertheless, be moderate, as exceptional cereal imports in 2003 will not be repeated. Export markets are expected to progressively pick up and export growth is likely to outpace market growth. As higher transfers are expected to mitigate the worsening in net factor income and the services balance will remain in surplus, the current account deficit is expected to narrow gradually.
Table 5.2 Main features of country forecast - ROMANIA
2002 Annual percentage changebn ROL Curr. prices % GDP 1995-99 2000 2001 2002 2003 2004 2005
GDP at constant prices 1511381.2 100.0 -0.3 2.1 5.7 5.0 4.9 5.1 5.3 Private consumption 1151355.0 76.2 3.1 -0.6 6.2 3.0 7.1 4.5 4.2 Public consumption 91751.0 6.1 -1.8 11.9 5.2 -5.8 4.6 3.5 2.0 GFCF 322382.9 21.3 0.6 5.5 9.1 8.2 9.2 9.4 10.0 of which : equipment - - 1.6 7.4 - - - - - Change in stocks as % of GDP 33432.4 2.2 0.6 0.4 1.5 2.3 2.5 2.5 2.5 Exports (goods and services) 536051.4 35.5 7.6 23.4 11.1 17.6 11.1 12.2 11.8 Final demand 2134972.7 141.3 1.8 9.6 9.3 7.1 8.5 7.3 7.2 Imports (goods and services) 623591.5 41.3 10.7 27.1 17.2 12.0 16.3 11.5 10.5 GNI at constant prices (GDP deflator) 1495878.2 99.0 -0.6 2.6 - - - - - Contribution to GDP growth : Domestic demand 2.6 4.4 9.4 3.7 7.6 5.8 5.7
Stockbuilding -1.5 1.5 1.2 0.3 0.0 0.0 0.0Foreign balance -1.3 -3.8 -4.9 0.9 -2.8 -0.7 -0.3
Employment -3.4 2.5 -0.8 - 0.5 0.7 0.6 Unemployment (a) 5.2 6.8 6.6 8.4 7.9 7.6 7.3 Compensation of employees/head 73.0 74.9 -0.5 23.5 23.9 17.7 14.9 Unit labour costs 67.6 75.5 -6.6 19.4 18.8 12.7 9.7 Real unit labour costs 3.5 21.7 -32.0 -3.4 1.1 0.4 0.2 Savings rate of households (b) - - - - - - - GDP deflator 61.9 44.2 37.3 23.4 19.3 12.6 10.3 Private consumption deflator 61.6 39.7 35.5 21.8 17.7 12.3 9.5 Index of consumer prices - 45.7 34.5 22.5 15.3 12.0 8.5 Trade balance (c) -7.4 -4.8 -7.5 -5.7 -8.0 -7.8 -7.3 Balance on current transactions with ROW (c) -5.5 -4.1 - -3.5 -5.9 -5.6 -5.0 Net lending(+) or borrowing(-) vis à vis ROW (c) -5.1 -4.0 - - - - - General government balance (c) - -4.4 -3.5 -2.0 -2.0 -3.0 -3.0 General government gross debt (c) - 23.9 23.2 23.3 21.8 23.5 23.5(a) as % of civilian labour force. (b) gross saving divided by gross disposable income. (c) as a percentage of GDP.
99

3. Turkey Realising its potential?
The economy in 2003
During 2003, economic stabilisation has continued, with a marked broadening of the sources of growth. Economic activity accelerated particularly strong in the last quarter of the year, leading to an overall output growth of 5.8% in 2003. The main driving forces for this strong recovery have been private consumption and investment. However, the strength of domestic demand also translated into a substantial increase in imports, which led to a substantial widening of the trade deficit. Inflationary pressures continued to decline, reflecting weak domestic demand, the strength of the Turkish currency and the strict fiscal policy of the Turkish authorities. As a result, year-end consumer price inflation was markedly below the target of 20%. Restructuring and labour shedding in the manufacturing sector led to a further decline in employment by 0.3%. Unemploy-ment continued to increase. Public finances remained largely on track, achieving a primary surplus of 9.6% of GDP. This substantial surplus and strong GDP growth led to a sharp reduction in the debt ratio, from 94% of GDP in 2002 to 87% in 2003. The current account deficit widened considerably (from 0.8% of GDP in 2002 to about 2 ¾% of GDP in 2003), reflecting accelerating domestic demand and the strength of the currency.
Prospects in 2004 and 2005
The overall picture for the forecasting period looks favourable. The expected strengthening of inter-
national demand should help to maintain strong export growth, while the foreseen decline in import prices will support the current disinflation process. The continued decline in inflationary pressures will improve predictability and allow for a decline in interest rates and improve the environment for investment. Overall, economic output is expected to increase by about 4½% in 2004, after a rise of close to 6% in 2003. The slowdown in 2004 marks the ending of the post-crisis recovery and, possibly, the start of a more balanced growth path. In 2005, growth is expected to accelerate to 5% again. The decision of the European Council in December 2004 of whether or not to start negotiations might have an important impact on Turkey’s next year’s economic dynamics. However, any possible impact of this decision has not been incorporated into the current forecast.
GDP components
Output growth is expected to be increasingly driven by domestic demand components, in particular private consumption and private investment. Declining inflation will support disposable income and allow consumers to realise consumption, which had to be postponed during the first years after the crisis. As a result, private consumption is expected to increase by about 4¾% and 5% in 2004-2005 and will therefore be the most important source of growth. Fixed investment will benefit from reduced macroeconomic and political uncertainty, declining real interest rates and the need to modernise the capital stock after three years of weak investment. On the other hand, the build-up of stocks is expected to come to an end in 2004. The strong consumption and investment will lead to continued high growth of imports, in particular of consumer durables and capital goods. Exports should benefit from the improvement in Turkey’s main export markets. However, the relative strength of the Turkish currency will make it more difficult for exporters to benefit from the improving trade opportunities.
Inflation
The trend in declining inflationary pressures is likely to continue. Fiscal discipline, improving credibility of the Central Bank’s disinflation targets and the recent strength of the currency are important elements in this respect.
-1
0
1
2
01 02 03 04 058
9
10
11
Graph 5.3: Turkey - labour market
% %
Unemployment rate (rhs)
Employmentgrowth (lhs)
100

Chapter 5 Other candidate countries, Turkey
Labour market
So far, the economic acceleration has not yet fed through to the labour market. The forecast expects that the broadening of the economic expansion to more labour-intensive industries will lead to stronger employment creation. Turkey’s rapidly growing labour force will, however, outpace labour supply and only a further decline in the participation ratio will allow for a small reduction in open unemployment.
Public finances
The public sector imbalances are likely to decline markedly during 2004-2005, benefiting from the sustained recovery, declining interest rates driven by improved market confidence and a prudent fiscal policy stance. The ongoing public finance reforms will help to widen the tax base and to increase the efficiency of tax collection. Non-interest expenditures are seen to remain largely constant as a percentage of GDP. In view of the still considerable burden of debt servicing for Turkey’s fiscal policy, fiscal discipline
and the continuation of the current stability oriented policy approach is of utmost importance for maintaining the sustainability of Turkey’s public finances.
External balance
In view of the strengthening domestic demand, a deterioration of the external balance is expected. The current account deficit is expected to reach about 3¾% of GDP in 2005.
Table 5.3 Main features of country forecast - TURKEY
2002 Annual percentage change000 bn TRL Curr. prices % GDP 1995-99 2000 2001 2002 2003 2004 2005
GDP at constant prices 276003.0 100.0 3.9 7.4 -7.5 7.9 5.8 4.6 5.0 Private consumption 188201.7 68.2 3.8 6.7 -9.6 2.1 6.6 4.8 5.0 Public consumption 50197.4 18.2 6.8 7.1 -8.5 5.4 -2.4 1.0 2.0 GFCF 46031.2 16.7 3.0 16.9 -31.5 -1.1 10.0 9.0 9.6 of which : equipment 21181.3 7.7 6.3 34.5 -48.0 -24.5 18.9 9.0 10.0 Change in stocks as % of GDP -13408.1 -4.9 0.3 2.3 -1.4 4.9 7.5 6.9 6.5 Exports (goods and services) 82751.7 30.0 10.3 19.2 7.4 11.1 16.0 13.6 13.2 Final demand 353773.8 128.2 5.7 11.2 -11.9 9.9 11.3 7.4 7.8 Imports (goods and services) 83440.4 30.2 13.5 25.4 -24.8 15.8 27.1 14.1 13.8 GNI at constant prices (GDP deflator) 269139.8 97.5 - - - - - - - Contribution to GDP growth : Domestic demand 4.2 9.3 -15.2 1.6 5.9 4.9 5.3
Stockbuilding 0.9 1.0 -3.6 7.2 3.0 -0.2 -0.2Foreign balance -1.1 -2.9 11.3 -0.9 -3.1 0.0 -0.1
Employment 1.6 -0.4 -1.0 -0.8 -0.3 1.4 2.0 Unemployment (a) 6.8 6.5 8.3 10.3 10.8 10.7 10.5 Compensation of employees/head 84.7 53.1 40.5 46.4 31.4 17.8 15.6 Unit labour costs 80.6 42.1 50.3 34.8 23.7 14.2 12.3 Real unit labour costs 3.1 -5.2 -2.9 -2.9 -1.1 0.6 0.6 Savings rate of households (b) - - - - - - - GDP deflator 75.2 49.9 54.8 44.1 22.5 13.4 12.4 Private consumption deflator 75.1 59.5 53.0 37.6 24.8 13.6 11.7 Index of consumer prices - 54.9 54.4 45.0 25.3 13.5 11.0 Trade balance (c) -9.7 -13.5 -5.8 -4.5 -5.7 -6.3 -6.5 Balance on current transactions with ROW (c) -3.1 -6.7 1.3 -0.8 -2.8 -3.4 -3.7 Net lending(+) or borrowing(-) vis à vis ROW (c) - - - - - - - General government balance (c) - -6.1 -29.8 -12.6 -8.8 -7.1 -6.0 General government gross debt (c) - 57.4 105.2 94.3 87.4 83.4 77.5(a) as % of civilian labour force. (b) gross saving divided by gross disposable income. (c) as a percentage of GDP.
101


Chapter 6 Other non-EU countries

1. United States of America High growth rates, but concerns about sustainability
A strengthening and broadening recovery The recovery in the United States gained considerable momentum in the course of 2003. Annualized GDP growth advanced from a sluggish rate below 2% in the winter of 2002/03 to more than 4% at the end of the year. The annual growth rate for 2003 turned out to be 3.1%. Growth became also more balanced with business equipment investment and exports registering the first full-year gains since 2000. So far the recovery has not resulted in much employment growth. Non-farm payroll employment actually fell until August 2003 and has only advanced at an annualized rate of 0.6% since then. However, due to a fall in the labour force, the unemployment rate retreated to 5.6% in February 2004. In contrast to employment, labour productivity has continued to advance strongly. Output per hour in the non-farm business sector increased by 4.4% in 2003 on an annual basis. Due to strong productivity growth and a considerable slack in resource utilization, prices have been under downward pressure with overall and ‘core’ CPI inflation falling to 1.7%, respectively 1.2%, on a year-on-year basis by February 2004. With only small gains in hourly compensation, unit labour costs declined and profit margins surged to a long-time high. The “twin deficits” set new annual records in 2003: the current account deficit reached 4.7% of GDP on a national account basis (4.9% on a balance-of-payments basis) and the fiscal deficit of general government came in at 4.8% of GDP.
Can the momentum be sustained? The recovery continues to benefit from a very
expansionary macro-economic policy. Much of last year’s tax cuts are materializing in the form of tax rebates in the first half of 2004. Monetary policy remains very accommodative with the federal funds rate at 1%. Long-term interest rates resumed their downward trend last autumn which has prolonged the boom in mortgage refinancing activity. Financial market conditions have also been eased by large gains in equity prices since their trough in March 2003. The effects of the macro-economic expansion are bound to fade within the forecast period. By the second half of 2004 fiscal policy will turn more restrictive reflecting the one-off nature of the current tax refunds and the discontinuation of child tax credit checks. The Administration’s budget proposal for fiscal year 2005 does not promise additional stimulus from the federal budget. Although the recent easing of financial conditions in conjunction with the ongoing house price boom is likely to bolster household spending for a while, most of the monetary stimulus seems to have been spent. And the Federal Reserve’s next change of interest rates, although not imminent, is likely to be a tightening. Against this background, doubts remain whether the current expansion has become, or is about to become, self-sustaining. The broadening of growth to include business equipment investment and, to some extent, exports gives rise to optimism. Strong productivity growth and high profit margins should keep investment activity going. The recovery is also expected to benefit from a somewhat more substantial rise in payrolls and labour income. However, the household balance sheet situation has become precarious. Household debt has increased by 10% annually over the past two years, more than twice as fast as personal disposable incomes. Personal saving as a percentage of disposable personal income fell to 2.1% in 2003. A rising debt service burden and/or a cutback in debt accumulation is likely to reduce the growth rate of household spending later this year and in 2005. At the same time, high energy prices are sapping purchasing power from consumers.
Prospects for 2004 and 2005
The forecast sees growth remaining at an annual rate of 4% until the middle of 2004. Subsequently, a moderation in consumer spending growth is projected to lower the overall growth rate to the 2-3% range for a while before it returns to the 3-4% range in 2005.
0
1
2
3
4
5
6
7
8
9
90 91 92 93 94 95 96 97 98 99 00 01 02 03 04 05
Graph 6.1: US - Gross saving of households as a percentage of gross disposable income
Forecast
104

Chapter 6 Other non-EU countries, United States of America
Due to a large statistical overhang from last year, the annual growth rate would reach 4.2% this year. For 2005, the annual growth rate would be 3.2% which is close to the estimated long-term growth potential of the US economy. Inflation is expected to recede further since the output gap would not be closed completely by the end of the forecast period. Employment is projected to increase at a moderate rate with unemployment remaining broadly unchanged at the current level. Exports should pick up against the background of the dollar depreciation in 2002-03 and robust world economic growth. But import growth should also remain high this year resulting in a current account deficit of 5.2% of GDP. However, the external deficit should fall back to 5% in 2005 as import growth decelerates. The fiscal deficit of general government is projected to decline to 4.5% of GDP this year and to 4.2%% next year.
Risks to the forecast
The risks of this forecast with regard to growth seem to be evenly balanced. On the upside, it is possible that employment growth will take off more forcefully than predicted, creating stronger income growth and consumption. The wealth effect from the surge in equity and house prices may also turn out to be stronger than expected. On the downside, the major risk seems to be associated with the household balance sheet situation. Some of it has been built into the forecast, but households may try to improve their balance sheets more aggressively leading to a sharper retrenchment in consumer spending. This could particularly happen in conjunction with a reversal of the upward trend in asset prices. Both equities and houses seem to be richly valued in a long-term historical perspective.
Table 6.1 Main features of country forecast - UNITED STATES
2002 Annual percentage changebn USD Curr. prices % GDP 1981-99 2000 2001 2002 2003 2004 2005
GDP at constant prices 10480.9 100.0 3.2 3.7 0.5 2.2 3.1 4.2 3.2 Private consumption 7385.3 70.5 3.5 4.7 2.5 3.4 3.1 3.7 2.4 Public consumption 1595.4 15.2 1.9 1.9 3.0 4.0 3.7 2.1 2.9 GFCF 1921.0 18.3 4.3 6.2 -2.4 -2.6 3.9 7.4 4.3 of which : equipment 938.6 9.0 7.0 9.0 -4.6 -2.3 5.5 11.6 8.4 Change in stocks as % of GDP 5.4 0.1 0.4 0.6 -0.4 0.1 0.0 0.3 0.3 Exports (goods and services) 1006.8 9.6 6.2 8.7 -5.2 -2.4 2.0 9.2 9.6 Final demand 11913.9 113.7 3.6 4.8 0.1 2.3 3.2 4.8 3.5 Imports (goods and services) 1433.0 13.7 7.8 13.1 -2.6 3.3 4.0 9.0 5.4 GNI at constant prices (GDP deflator) 10502.4 100.2 3.2 3.7 0.5 2.1 3.3 4.1 3.2 Contribution to GDP growth : Domestic demand 3.4 4.7 1.6 2.5 3.5 4.3 3.0
Stockbuilding 0.1 -0.1 -0.9 0.4 0.0 0.3 0.1Foreign balance -0.2 -0.9 -0.2 -0.7 -0.4 -0.4 0.2
Employment (*) 1.7 1.9 -0.3 -0.3 0.9 0.9 0.6 Unemployment (a) 6.5 4.0 4.8 5.8 6.0 5.6 5.6 Compensation of employees/head 4.5 5.6 3.0 1.5 2.1 3.3 4.2 Unit labour costs 3.0 3.7 2.2 -1.0 -0.1 0.0 1.6 Real unit labour costs -0.3 1.5 -0.2 -2.5 -1.7 -1.0 0.7 Savings rate of households (b) - - 1.8 2.4 2.1 1.8 2.6 GDP deflator 3.2 2.2 2.4 1.5 1.6 1.1 0.9 Private consumption deflator 3.4 2.5 2.0 1.4 1.8 1.2 0.9 General index of consumer prices - 3.4 2.8 1.6 2.3 1.4 1.2 Trade balance (c) -2.3 -4.7 -4.3 -4.7 -5.1 -5.6 -5.4 Balance on current transactions with ROW (c) -1.5 -4.1 -3.8 -4.5 -4.7 -5.2 -5.0 Net lending(+) or borrowing(-) vis-à-vis ROW (c) -1.5 -4.1 -3.8 -4.5 -4.7 -5.3 -5.1 General government balance (c) -3.9 1.3 -0.5 -3.7 -4.8 -4.5 -4.2 General government gross debt (c) - - - - - - - (a) as % of total labour force. (b) gross saving divided by gross disposable income. (c) as a percentage of GDP. (*) Employment data from the BLS household survey.
105

2. JapanExport-driven recovery starting to broaden
The recovery surprised on the upside in 2003…
Real GDP growth in 2003 surprised on the upside (2.7%) and, in particular, the fourth quarter came out very strong, boosted by private investment and a continued sharp acceleration in export growth1.
In line with the acceleration in global trade in the second half of the year, export growth took off in the last two quarters. Japan is clearly benefiting from the dynamism in the rest of Asia and more than 80% of the increase in exports last year was destined to China, although the US remains the final destination for part of these goods.
The export-initiated recovery has started to permeate through the rest of the economy. Stronger corporate profits have supported robust growth in equipment investment. Employment growth has been slow in responding, but real wages have started to stabilize from their previous decline and as such backed moderate growth in private consumption.
… and should remain firm over the forecast years
Most indicators point to that the recovery should remain firm. Both corporate and consumer confidence have improved steadily and there are more and more signs that the rise in sales, profits and investment are spreading beyond the large manufacturing companies.
The strong acceleration in export growth that took place in the second half of 2003 is likely to continue in the short term, although at a somewhat slower pace,
as indicated by data on orders from abroad. However, the drive from external demand is heavily dependent on continued dynamism in the East-Asian region and, although to a lesser extent, the development of the exchange rate.
Indicators for private consumption, such as the household survey, shipments of consumer goods and retail sales, suggest a rebound in growth in the beginning of 2004. Prospects of employment growth in the short term together with an expected gradual rise in wages should support continued growth in household consumption.
A number of factors indicate that the recovery trend in private capital expenditure should be kept up over the forecast horizon. Corporate cash flow continues to develop strongly and the hike in both capacity utilization and expected demand should bode well for continued growth. Public investment, on the other hand, is forecast to remain a drag on growth, in an effort by the authorities to slowly consolidate the general government’s balance sheet.
Overall, prospects are for a fairly broad-based recovery. Quarterly growth rates are projected to remain relatively firm, at around 2.4% in annualised terms, over the forecast horizon. These quarterly rates translate into 3.4% on an annual basis in 2004 (helped by a sizeable overhang) and 2.3% in 2005.
The labour market responds with a lag
The labour market has been slow in responding to the upturn but is now gradually firming. Employment has risen only marginally up to now, but the strong rise in new job offers should translate into job creation in the coming months. Unemployment fell by half a percentage point over 2003 and stood at 5.0% of the labour force this February. Wages have stabilised from their previous decline, but the widely expected rise in end-of-year bonuses failed to materialise.
Deflation is petering out
Deflationary pressures are slowly abating as the economy continues to expand. The fall in core CPI ________________________
1 National account data for real economic growth and deflation (according to the GDP delator) need to be interpreted with caution as they continue to be overestimated as a result of the statistical method used.
-4
-3
-2
-1
0
1
2
3
4
2001 2002 2003
% ch
Graph 6.2: Japan - Real GDP growth rates
yoy
qoq
106

Chapter 6 Other non-EU countries, Japan
(excluding fresh food) decelerated from -0.8% year-on-year in January last year to turn flat 0.0% in February 2004, albeit helped by some one-off factors such as tax hikes. If the recovery continues at the projected pace, underlying deflation could come to an end in the course of this year.
Government debt continues to rise
The general government deficit is estimated to have stood at -7.7% of GDP in 2003 and the consolidated debt to have approached 160% of GDP. A moderate fiscal tightening is projected for the forecast years, in line with the authorities’ intention. Despite the mounting debt, any confidence crisis has been contained by the fact that 60% of government bonds are held by public institutions and less than 5% by foreigners.
Risks to the forecast
The risks to the forecast are balanced. On the upside, recent indicators increasingly suggest that the recovery is broadening resolutely. If this trend continues, domestic demand might respond in a more robust way than what has been incorporated in the forecast. On the downside, any faltering of the strong dynamism in China or the growth momentum in the US is likely to have an impact on the Japanese growth scenario. A further significant strengthening of the yen may also pose a risk to the forecast, even if the sensitivity of Japanese exports to an appreciation of the yen versus the US dollar has declined over the past decade as manufacturing capacity increasingly has moved overseas.
Table 6.2 Main features of country forecast - JAPAN
2002 Annual percentage changebn YEN Curr. prices % GDP 1981-99 2000 2001 2002 2003 2004 2005
GDP at constant prices 498102.0 100.0 2.7 2.8 0.4 -0.4 2.7 3.4 2.3 Private consumption 284623.0 57.1 2.7 1.0 1.7 0.9 1.1 2.4 2.0 Public consumption 87972.9 17.7 3.3 4.9 3.0 2.4 1.2 1.5 1.4 GFCF 120429.8 24.2 2.5 2.7 -1.1 -6.1 3.2 4.3 2.4 of which : equipment - - 4.9 7.4 1.0 - - - - Change in stocks as % of GDP -1335.6 -0.3 0.3 0.0 0.0 -0.2 0.1 0.1 0.1 Exports (goods and services) 55829.1 11.2 4.1 12.4 -6.1 8.0 10.0 12.1 7.7 Final demand 547519.2 109.9 2.9 3.3 0.4 -0.2 2.8 3.8 2.7 Imports (goods and services) 49417.2 9.9 4.9 9.2 0.1 2.0 4.8 8.4 7.3 GNI at constant prices (GDP deflator) 506295.4 101.6 2.8 2.8 0.8 -0.4 2.7 3.3 2.2 Contribution to GDP growth : Domestic demand 2.7 2.0 1.1 -0.8 1.6 2.7 1.9
Stockbuilding 0.0 0.3 0.0 -0.3 0.3 0.0 0.0Foreign balance 0.0 0.5 -0.7 0.7 0.7 0.7 0.3
Employment 0.7 -0.1 -0.6 -1.4 -0.2 0.4 0.3 Unemployment (a) 2.8 4.7 5.0 5.4 5.1 4.8 4.7 Compensation of employees/head 2.7 0.2 -0.5 -2.1 -0.7 1.1 0.8 Unit labour costs 0.6 -2.7 -1.5 -3.1 -3.4 -1.8 -1.1 Real unit labour costs -0.6 -0.7 0.0 -2.0 -1.0 -0.8 -0.7 Savings rate of households (b) - - 13.1 12.9 13.6 13.7 13.8 GDP deflator 1.3 -2.0 -1.5 -1.2 -2.5 -1.0 -0.4 Private consumption deflator 1.4 -1.3 -1.6 -1.3 -1.4 -0.4 -0.2 General index of consumer prices - -0.7 -0.6 -0.9 -0.3 0.0 0.2 Trade balance (c) 2.8 2.5 1.7 2.4 2.5 2.9 3.2 Balance on current transactions with ROW (c) 2.4 2.5 2.1 2.8 3.1 3.6 3.8 Net lending(+) or borrowing(-) vis-à-vis ROW (c) 2.6 2.3 2.0 2.8 3.0 3.5 3.7 General government balance (c) -2.0 -7.5 -6.1 -7.9 -7.7 -7.4 -7.2 General government gross debt (c) 79.5 133.6 142.3 149.4 157.3 161.5 166.1 (a) as % of total labour force. (b) gross saving divided by gross disposable income. (c) as a percentage of GDP.
107


Statistical annex
AN
NE
X


Contents
Output: GDP and its components 1. Gross Domestic Product 113 2. Profiles (qoq) of quarterly GDP 113 3. Profiles (yoy) of quarterly GDP 114 4. GDP per capita 114 5. Final domestic demand 115 6. Final demand 115 7. Private consumption expenditure 116 8. Government consumption expenditure 116 9. Total investment 117
10. Investment in construction 117 11. Investment in equipment 118 12. Public investment 118 13. Potential output gap 119 14. Trend output gap 119
Prices15. Deflator of GDP 120 16. Deflator of private consumption 120 17. Consumer prices index 121 18. Consumer prices quarterly profiles 121
19. Deflator of exports of goods 122 20. Deflator of imports of goods 122 21. Terms of trade of goods 123
Wages, population and labour market22. Compensation of employees per head 123 23. Real compensation of employees per head 124 24. Labour productivity 124 25. Unit labour costs, whole economy 125 26. Real unit labour costs 125 27. Total population 126 28. Total employment 126 29. Number of unemployed 127
Interest and exchange rates30. Nominal bilateral exchange rates 127 31. Nominal effective exchange rates 128 32. Relative unit labour costs 128 33. Real effective exchange rates 129 34. Short term interest rates 129 35. Long term interest rates 130
111
AN
NE
X

General Government36. Total expenditure 130 37. Total revenue 131 38. Net lending (+) or net borrowing (-) 131 39. Interest expenditure 132 40. Primary balance 132 41. Cyclically adjusted net lending (+) or net borrowing (-) 133 42. Cyclically adjusted primary balance 133 43. Gross debt 134
Saving44. Gross national saving 134 45. Gross saving of the private sector 135 46. Gross saving of general government 135
Trade and international payments47. Exports of goods 136 48. Imports of goods 136 49. Trade balance (% of GDP) 137 50. Current balance (% of GDP) 137 51. Trade balance (billion Ecu/euro) 138 52. Current balance (billion Ecu/Euro) 138 53. Export markets 139 54. Export performance 139
World economy55. World GDP 140 56. World exports 141 57. Export shares in EU trade 141 58. World imports 142 59. Import shares in EU trade 142 60. World trade balances (billion USD) 143 61. World current balances (billion USD) 143 62. Primary commodity prices 144
Note on concepts and sources 144
112
AN
NE
X

STATISTICAL ANNEX : SPRING 2004 ECONOMIC FORECASTS
TABLE 1 : Gross domestic product, volume (percentage change on preceding year, 1961-2005) 29.03.2004
long-term 2003 2004 2005average 5-year average estimate of forecast of forecast of1961-90 1991-95 1996-00 1999 2000 2001 2002 X-2003 III-2004 X-2003 III-2004 X-2003 III-2004
Belgium 3.4 1.6 2.7 3.2 3.8 0.6 0.7 0.8 1.1 1.8 2.0 2.3 2.5 Germany 3.2 2.0 1.8 2.0 2.9 0.8 0.2 0.0 -0.1 1.6 1.5 1.8 1.8 Greece 4.5 1.2 3.4 3.4 4.4 4.0 3.9 4.1 4.2 4.2 4.0 3.4 3.3 Spain 4.6 1.5 3.8 4.2 4.2 2.8 2.0 2.3 2.4 2.9 2.8 3.3 3.3 France 3.8 1.1 2.7 3.2 3.8 2.1 1.2 0.1 0.2 1.7 1.7 2.3 2.4 Ireland 4.2 4.7 9.8 11.3 10.1 6.2 6.9 1.6 1.2 3.7 3.7 4.9 4.6 Italy 3.9 1.3 1.9 1.7 3.0 1.8 0.4 0.3 0.3 1.5 1.2 1.9 2.1 Luxembourg 3.7 4.0 7.1 7.8 9.1 1.2 1.3 1.2 1.8 1.9 2.4 2.8 3.1 Netherlands 3.4 2.1 3.7 4.0 3.5 1.2 0.2 -0.9 -0.8 0.6 1.0 2.0 1.6 Austria 3.6 2.0 2.7 2.7 3.4 0.8 1.4 0.9 0.7 1.9 1.8 2.5 2.5 Portugal 4.8 1.7 3.9 3.8 3.4 1.7 0.4 -0.8 -1.3 1.0 0.8 2.0 2.2 Finland 3.9 -0.9 4.7 3.4 5.1 1.1 2.3 1.5 1.9 2.5 2.6 2.7 2.7 Euro area 3.6 1.5 2.6 2.8 3.5 1.6 0.9 0.4 0.4 1.8 1.7 2.3 2.3 Denmark 2.7 2.0 2.7 2.6 2.8 1.6 1.0 0.8 0.0 2.0 2.1 2.3 2.2 Sweden 2.9 0.7 3.2 4.6 4.3 0.9 2.1 1.4 1.6 2.2 2.3 2.6 2.6 United Kingdom 2.5 1.7 3.1 2.8 3.8 2.1 1.6 2.0 2.2 2.8 3.0 2.9 2.8 EU-15 3.4 1.5 2.7 2.9 3.6 1.7 1.1 0.8 0.8 2.0 2.0 2.4 2.4 Cyprus : 4.7 3.7 4.7 5.0 4.0 2.0 2.0 2.0 3.4 3.4 4.2 4.1 Czech Republic : -1.0 1.2 0.5 3.3 3.1 2.0 2.2 2.9 2.6 2.9 3.3 3.4 Estonia : : 4.9 -0.6 7.3 6.5 6.0 4.4 4.8 5.6 5.4 5.1 5.9 Hungary : -2.2 4.0 4.2 5.2 3.8 3.5 2.9 2.9 3.2 3.2 3.4 3.4 Latvia : -13.2 5.3 2.8 6.8 7.9 6.1 6.0 7.5 5.2 6.2 5.7 6.2 Lithuania : -9.8 4.2 -1.8 4.0 6.5 6.8 6.6 8.9 5.7 6.9 6.0 6.6 Malta : : 4.5 4.1 6.4 -1.2 1.7 0.8 0.4 2.7 1.4 2.9 2.0 Poland : 2.2 5.1 4.1 4.0 1.0 1.4 3.3 3.7 4.2 4.6 4.8 4.8 Slovakia : : 3.7 1.5 2.0 3.8 4.4 3.8 4.2 4.1 4.0 4.3 4.1 Slovenia : -0.6 4.4 5.9 4.1 2.9 2.9 2.1 2.3 3.1 3.2 3.7 3.6 AC-10 : : 4.1 3.2 4.1 2.5 2.4 3.1 3.6 3.8 4.0 4.2 4.2 EU-25 : : 2.7 2.9 3.6 1.7 1.1 0.9 0.9 2.1 2.1 2.5 2.5 USA 3.5 2.5 4.1 4.5 3.7 0.5 2.2 2.8 3.1 3.8 4.2 3.3 3.2 Japan 6.1 1.5 1.4 0.1 2.8 0.4 -0.4 2.6 2.7 1.7 3.4 1.5 2.3
TABLE 2 : Profiles (qoq) of quarterly GDP, volume (percentage change from previous quarter, 2003-2005)
2003/1 2003/2 2003/3 2003/4 2004/1 2004/2 2004/3 2004/4 2005/1 2005/2 2005/3 2005/4 Belgium 0.2 -0.1 0.5 0.6 0.4 0.5 0.6 0.8 0.5 0.6 0.7 0.7 Germany -0.2 -0.2 0.2 0.2 0.2 0.2 0.3 0.5 0.6 0.6 0.6 0.7 Greece 2.9 0.5 1.8 -0.3 : : : : : : : : Spain 0.5 0.7 0.6 0.7 0.6 0.7 0.8 0.8 0.8 0.8 0.9 0.9 France 0.0 -0.4 0.4 0.5 0.5 0.5 0.6 0.6 0.6 0.6 0.6 0.6 Ireland -1.4 2.3 -1.3 2.1 0.5 1.1 1.2 1.2 1.1 1.2 1.2 1.2 Italy -0.2 -0.1 0.4 0.0 0.1 0.5 0.7 0.6 0.4 0.4 0.5 0.4 Luxembourg : : : : : : : : : : : : Netherlands -0.3 -0.5 0.0 0.3 0.3 0.3 0.3 0.3 0.3 0.4 0.5 0.5 Austria 0.5 0.0 0.1 0.1 0.4 0.6 0.7 0.7 0.5 0.6 0.6 0.6 Portugal 0.2 0.0 -0.5 -0.2 0.4 0.5 0.6 0.6 0.6 0.5 0.5 0.5 Finland -0.3 0.8 0.8 0.3 0.6 0.8 0.9 0.4 0.5 0.9 0.7 0.7 Euro area 0.0 -0.1 0.4 0.3 0.3 0.4 0.6 0.6 0.6 0.6 0.6 0.6 Denmark 0.5 -0.5 -0.1 0.3 0.8 1.0 1.0 0.5 0.3 0.6 0.5 0.3 Sweden 0.4 0.3 0.5 0.7 0.5 0.7 0.6 0.7 0.6 0.7 0.7 0.6 United Kingdom 0.3 0.6 0.8 0.9 0.8 0.6 0.7 0.6 0.6 0.8 0.8 0.8 EU-15 0.0 0.0 0.4 0.4 0.4 0.5 0.6 0.6 0.6 0.6 0.7 0.7 Cyprus : : : : : : : : : : : : Czech Republic : : : : : : : : : : : : Estonia : : : : : : : : : : : : Hungary : : : : : : : : : : : : Latvia : : : : : : : : : : : : Lithuania : : : : : : : : : : : : Malta : : : : : : : : : : : : Poland : : : : : : : : : : : : Slovakia : : : : : : : : : : : : Slovenia : : : : : : : : : : : : AC-10 : : : : : : : : : : : : EU-25 : : : : : : : : : : : : USA 0.5 0.8 2.0 1.0 1.0 1.0 0.7 0.6 0.7 0.9 0.9 1.0 Japan 0.6 0.8 0.6 1.7 0.8 0.6 0.6 0.6 0.6 0.6 0.6 0.6
113
AN
NE
X

TABLE 3 : Profiles (yoy) of quarterly GDP, volume (percentage change from corresponding quarter in previous year, 2003-2005) 29.03.2004
2003/1 2003/2 2003/3 2003/4 2004/1 2004/2 2004/3 2004/4 2005/1 2005/2 2005/3 2005/4 Belgium 1.5 0.8 0.8 1.2 1.4 2.1 2.1 2.3 2.4 2.5 2.5 2.4 Germany 0.1 -0.3 -0.3 0.0 0.4 0.8 0.9 1.2 1.6 2.1 2.4 2.6 Greece 4.3 4.5 5.0 5.0 : : : : : : : : Spain 2.2 2.3 2.4 2.7 2.6 2.6 2.8 2.9 3.1 3.2 3.3 3.4 France 0.7 -0.4 -0.2 0.6 1.0 1.8 2.1 2.1 2.3 2.5 2.5 2.5 Ireland 0.8 2.4 0.0 1.7 3.6 2.3 4.9 3.9 4.5 4.6 4.6 4.6 Italy 0.6 0.2 0.5 0.1 0.4 1.0 1.3 1.9 2.2 2.1 1.9 1.7 Luxembourg : : : : : : : : : : : : Netherlands -0.2 -1.2 -1.2 -0.5 0.1 0.9 1.3 1.3 1.4 1.4 1.6 1.8 Austria 1.4 0.4 0.9 0.8 0.6 1.2 1.8 2.4 2.5 2.6 2.5 2.4 Portugal -1.4 -2.2 -1.0 -0.5 -0.3 0.2 1.3 2.1 2.3 2.3 2.2 2.1 Finland 2.4 1.4 2.0 1.6 2.5 2.5 2.6 2.7 2.7 2.7 2.6 2.9 Euro area 0.7 0.1 0.3 0.6 0.9 1.4 1.6 1.9 2.2 2.3 2.4 2.5 Denmark 0.3 -0.1 -0.4 0.3 0.4 1.9 3.0 3.1 2.7 2.4 1.9 1.8 Sweden 1.6 1.2 1.5 1.9 2.0 2.4 2.4 2.5 2.5 2.5 2.6 2.6 United Kingdom 1.9 2.2 2.2 2.7 3.1 3.1 3.0 2.7 2.5 2.7 2.8 3.0 EU-15 0.9 0.4 0.6 0.9 1.2 1.7 1.9 2.1 2.3 2.4 2.5 2.6 Cyprus : : : : : : : : : : : : Czech Republic 2.5 2.6 3.4 3.1 2.3 3.1 3.2 3.0 2.8 3.6 3.5 3.7 Estonia 5.2 3.5 4.6 5.8 5.9 4.2 5.2 6.1 6.3 5.3 5.4 6.5 Hungary 2.7 2.4 2.9 3.5 3.5 3.2 3.0 3.0 3.2 3.4 3.4 3.6 Latvia : : : : : : : : : : : : Lithuania 9.3 6.7 8.8 10.6 : : : : : : : : Malta : : : : : : : : : : : : Poland 2.3 3.9 4.0 4.7 5.3 : : : : : : : Slovakia : : : : : : : : : : : : Slovenia 2.2 2.1 2.3 2.5 3.1 3.0 3.2 3.3 3.5 3.7 3.9 3.4 AC-10 2.6 2.5 3.1 3.3 3.0 3.2 3.2 3.2 3.2 3.6 3.6 3.7 EU-25 : : : : : : : : : : : : USA 2.1 2.4 3.6 4.3 4.8 5.0 3.7 3.3 3.1 2.9 3.2 3.6 Japan 2.7 2.4 2.0 3.8 4.0 3.7 3.7 2.6 2.4 2.4 2.4 2.4
TABLE 4 : Gross domestic product per capita (percentage change on preceding year, 1961-2005)long-term 2003 2004 2005
average 5-year average estimate of forecast of forecast of1961-90 1991-95 1996-00 1999 2000 2001 2002 X-2003 III-2004 X-2003 III-2004 X-2003 III-2004
Belgium 3.1 1.2 2.5 3.0 3.6 0.3 0.2 0.5 0.7 1.6 1.7 2.1 2.2 Germany 2.7 1.4 1.7 2.0 2.7 0.7 0.0 0.0 -0.1 1.6 1.4 1.7 1.7 Greece 3.9 0.3 2.9 3.0 4.1 3.9 3.7 3.8 3.5 4.0 3.8 3.2 3.1 Spain 3.7 1.3 3.5 3.8 3.4 2.0 1.3 1.6 1.8 2.3 2.1 2.7 2.7 France 3.0 0.6 2.3 2.8 3.3 1.6 0.7 -0.3 -0.2 1.4 1.4 2.0 2.1 Ireland 3.4 4.1 8.7 10.1 8.8 4.7 5.4 0.3 -0.3 2.6 2.6 3.9 3.6 Italy 3.4 1.1 1.8 1.6 2.8 1.5 0.2 0.2 0.1 1.3 1.0 1.7 1.9 Luxembourg 3.0 2.5 5.6 6.3 7.7 0.5 0.2 0.2 0.7 1.0 1.3 1.9 2.2 Netherlands 2.5 1.4 3.1 3.3 2.7 0.5 -0.4 -1.5 -1.4 0.1 0.5 1.6 1.3 Austria 3.2 1.3 2.6 2.5 3.2 0.5 1.1 0.8 0.4 1.5 1.4 2.1 2.1 Portugal 4.4 1.5 3.5 3.4 2.8 1.0 -0.3 -1.5 -2.0 0.4 0.2 1.4 1.5 Finland 3.5 -1.4 4.4 3.1 4.9 0.8 2.0 1.3 1.7 2.3 2.4 2.6 2.6 Euro area 3.0 1.1 2.3 2.5 3.1 1.2 0.5 0.1 0.1 1.5 1.4 2.0 2.0 Denmark 2.3 1.6 2.3 2.3 2.5 1.2 0.7 0.6 -0.3 1.8 2.1 2.0 2.0 Sweden 2.5 0.1 3.1 4.5 4.2 0.7 1.8 1.0 1.2 1.8 1.9 2.1 2.1 United Kingdom 2.2 1.4 2.9 2.5 3.5 1.5 1.3 1.7 1.9 2.5 2.7 2.6 2.4 EU-15 2.9 1.2 2.4 2.6 3.2 1.2 0.6 0.5 0.4 1.7 1.7 2.1 2.1 Cyprus : 2.3 2.4 3.6 3.9 2.9 0.7 1.4 1.4 2.8 2.7 3.6 3.5 Czech Republic : -0.9 1.3 0.6 3.4 3.6 2.2 2.1 3.0 2.6 3.0 3.3 3.5 Estonia : : 5.9 0.6 7.8 6.9 6.4 4.8 5.0 6.0 5.6 5.4 6.2 Hungary : -2.1 4.3 4.5 5.5 4.1 3.8 3.3 3.4 3.7 3.6 3.7 3.7 Latvia : -12.0 6.3 3.7 7.6 8.8 6.8 6.3 7.8 5.4 6.4 5.9 6.4 Lithuania : -9.5 4.9 -1.1 4.7 7.1 7.2 6.8 9.2 6.0 7.2 6.4 6.9 Malta : : 3.9 3.5 5.7 -2.0 1.0 0.3 -0.1 2.2 0.9 2.4 1.5 Poland : 1.9 5.1 4.1 4.0 2.1 1.5 3.3 3.8 4.2 4.6 4.8 4.8 Slovakia : : 3.5 1.4 1.9 3.7 4.9 3.8 4.2 4.1 4.0 4.3 4.1 Slovenia : -0.5 4.4 5.8 3.8 2.7 2.8 2.1 2.2 3.1 3.2 3.7 3.5 AC-10 : : 4.2 3.4 4.2 3.1 2.5 3.2 3.7 3.8 4.1 4.3 4.3 EU-25 : : 2.5 2.7 3.3 1.4 0.8 0.6 0.6 1.8 1.8 2.2 2.2 USA 2.4 1.2 2.9 3.3 2.5 -0.7 1.2 1.9 2.1 2.9 3.2 2.4 2.2 Japan 5.2 1.2 1.2 -0.1 2.7 0.2 -0.5 2.4 2.6 1.6 3.3 1.4 2.2
114
AN
NE
X

TABLE 5 : Domestic demand, volume (percentage change on preceding year, 1961-2005) 29.03.2004
long-term 2003 2004 2005average 5-year average estimate of forecast of forecast of1961-90 1991-95 1996-00 1999 2000 2001 2002 X-2003 III-2004 X-2003 III-2004 X-2003 III-2004
Belgium 3.3 1.4 2.6 2.5 3.8 0.4 0.8 0.9 2.3 1.9 1.6 2.4 2.3 Germany 3.1 1.9 1.6 2.8 1.8 -0.8 -1.6 0.6 0.3 1.3 1.2 1.6 2.2 Greece 4.7 1.3 3.8 3.8 3.7 2.9 3.9 4.0 6.3 4.2 3.8 3.0 3.5 Spain 4.9 1.0 4.2 5.6 4.5 3.0 2.6 3.1 3.3 3.5 3.5 3.8 3.7 France 3.8 0.7 2.6 3.6 4.1 2.0 -1.7 1.0 1.0 1.6 1.9 2.2 2.6 Ireland 3.6 2.5 9.0 7.5 9.1 3.9 2.8 1.6 1.0 2.6 2.9 3.3 3.4 Italy 3.8 0.3 2.4 3.2 2.3 1.4 1.3 1.5 1.2 1.7 1.5 2.0 2.2 Luxembourg 3.5 2.3 6.1 6.6 5.1 4.2 -0.4 1.5 1.6 2.0 2.4 2.7 3.0 Netherlands 3.3 1.5 3.7 4.3 2.5 1.7 0.0 -1.0 -0.6 0.2 0.3 1.4 0.9 Austria 3.4 2.5 2.4 2.9 2.6 -0.2 0.0 0.9 1.8 1.7 2.1 2.3 2.5 Portugal 4.9 2.5 4.7 5.9 2.9 1.3 -0.6 -2.9 -2.8 0.7 0.1 1.7 1.8 Finland 4.1 -2.8 3.5 2.0 2.5 1.8 0.6 1.3 1.8 2.2 2.2 2.3 2.1 Euro area 3.6 1.1 2.6 3.5 2.9 1.0 -0.2 1.1 1.1 1.8 1.7 2.2 2.4 Denmark 2.5 2.3 2.7 0.1 2.4 1.0 1.9 0.5 0.1 2.3 2.4 2.4 2.1 Sweden 2.7 -0.7 2.6 3.3 3.6 -0.2 0.8 1.2 1.1 1.8 1.8 2.3 2.5 United Kingdom 2.6 1.2 3.9 3.8 3.8 2.7 2.8 2.4 2.5 2.8 3.3 2.8 2.7 EU-15 3.4 1.0 2.8 3.5 3.1 1.3 0.4 1.3 1.3 1.9 2.0 2.3 2.5 Cyprus : : 4.0 0.2 5.2 4.2 5.5 1.8 0.8 2.2 1.9 3.7 3.6 Czech Republic : -0.2 1.7 0.3 4.0 5.1 3.4 2.4 4.1 2.6 3.3 3.5 3.5 Estonia : : 5.5 -5.9 8.5 8.2 10.2 8.0 7.7 5.3 5.3 4.0 5.5 Hungary : -1.6 4.5 5.0 4.5 1.7 5.4 6.1 6.1 4.7 2.9 4.6 2.9 Latvia : -16.8 6.3 2.6 3.3 11.1 5.0 7.2 8.9 5.7 7.5 5.7 7.2 Lithuania : : 5.8 -1.5 1.9 6.7 7.7 5.9 9.6 6.3 7.3 5.8 6.6 Malta : : 3.6 5.8 10.8 -5.4 -2.6 3.2 4.9 2.8 2.6 2.9 2.0 Poland : 3.8 6.5 4.9 2.9 -2.9 0.6 2.6 2.0 4.3 3.8 5.1 4.9 Slovakia : : 4.3 -6.3 0.1 7.4 4.2 1.3 -2.2 3.2 3.8 3.5 4.7 Slovenia : 2.7 4.9 9.5 1.5 0.9 2.1 2.8 4.2 3.4 4.0 4.0 4.0 AC-10 : : 5.0 3.1 3.2 0.7 2.6 3.3 3.3 3.9 3.8 4.5 4.3 EU-25 : : 2.9 3.5 3.1 1.3 0.5 1.4 1.4 2.0 2.1 2.4 2.6 USA 3.4 2.5 4.7 5.4 4.4 0.7 2.8 3.0 3.3 4.1 4.4 3.5 2.9 Japan 6.1 1.5 1.2 0.2 2.4 1.2 -1.0 2.2 2.0 1.4 2.8 1.1 2.0
TABLE 6 : Final demand, volume (percentage change on preceding year, 1961-2005)long-term 2003 2004 2005
average 5-year average estimate of forecast of forecast of1961-90 1991-95 1996-00 1999 2000 2001 2002 X-2003 III-2004 X-2003 III-2004 X-2003 III-2004
Belgium 4.2 2.4 3.9 3.7 5.9 0.8 0.9 -0.1 2.0 2.0 2.6 3.2 3.6 Germany 3.6 2.4 3.1 3.4 4.6 0.8 -0.3 0.7 0.5 2.7 2.7 3.3 3.2 Greece 5.0 1.6 5.1 6.1 5.6 2.2 1.8 3.7 5.5 4.4 4.4 3.4 3.7 Spain 5.2 2.4 5.4 6.1 5.7 3.1 2.0 3.3 3.5 4.0 3.9 4.6 4.6 France 4.2 1.5 3.7 3.9 5.9 1.8 0.3 0.4 0.3 2.3 2.3 3.3 3.3 Ireland 4.9 6.8 13.1 11.9 15.0 6.4 4.7 -1.3 -1.8 4.5 4.4 5.9 6.1 Italy 4.3 1.6 2.8 2.5 3.9 1.5 0.2 0.7 0.1 2.4 1.7 2.9 3.1 Luxembourg 4.2 4.1 10.2 11.3 12.1 3.3 -0.4 1.1 2.5 3.1 3.6 4.8 5.1 Netherlands 4.0 3.1 5.2 4.6 6.1 1.7 0.1 -0.7 -0.3 1.9 2.0 3.2 3.0 Austria 4.2 2.5 4.5 4.7 6.0 2.5 1.1 1.0 1.5 3.2 2.9 4.3 4.0 Portugal 5.5 2.6 5.2 5.1 4.1 1.4 0.1 -1.4 -1.2 1.9 1.5 3.1 3.1 Finland 4.1 -0.5 5.7 3.0 8.2 0.9 2.5 1.4 1.6 2.8 2.8 3.4 3.1 Euro area 4.1 2.1 3.9 4.0 5.4 1.6 0.5 0.7 0.8 2.7 2.6 3.5 3.4 Denmark 3.1 2.4 4.1 3.4 5.7 2.1 2.9 1.0 0.1 2.9 2.7 3.1 2.8 Sweden 3.1 1.3 4.7 4.8 6.5 -0.1 1.0 2.2 2.7 3.1 3.2 3.8 3.8 United Kingdom 2.9 2.0 4.5 3.9 5.0 2.7 2.1 1.8 1.9 3.3 3.7 3.6 3.5 EU-15 3.8 2.0 4.0 4.0 5.3 1.8 0.8 1.0 1.0 2.8 2.8 3.5 3.5 Cyprus : : 4.3 2.4 7.6 3.8 1.2 1.3 0.7 3.0 3.1 4.4 4.4 Czech Republic : 1.9 4.8 2.6 9.3 8.0 3.1 3.5 5.2 3.5 5.2 4.3 5.6 Estonia : : 9.0 -2.5 18.5 3.1 6.0 6.7 6.5 7.3 6.4 7.6 7.2 Hungary : 0.9 9.2 7.9 11.2 4.9 4.7 5.2 7.4 5.2 5.6 5.8 5.7 Latvia : -15.1 6.9 -0.5 6.6 9.3 5.6 7.9 10.2 6.6 8.4 6.8 7.6 Lithuania : : 5.8 -6.1 3.6 11.3 11.3 7.1 8.2 6.8 7.9 6.4 7.5 Malta : : 3.7 6.9 8.4 -5.2 0.0 2.9 2.1 3.1 2.1 3.4 2.3 Poland : 4.8 7.6 3.3 7.0 -1.5 1.7 3.5 4.8 5.4 5.9 6.3 6.3 Slovakia : : 6.3 -2.1 5.5 6.9 4.8 7.9 8.6 6.8 6.6 5.9 6.9 Slovenia : -1.1 5.7 6.7 5.4 2.8 3.8 3.1 3.9 4.2 4.6 4.7 4.7 AC-10 : : 6.9 3.2 8.0 2.8 3.2 4.3 5.6 5.0 5.7 5.7 6.0 EU-25 : : 4.1 3.9 5.5 1.8 0.9 1.1 1.2 2.9 2.9 3.6 3.6 USA 3.6 2.8 4.9 5.3 4.8 0.1 2.3 2.8 3.2 4.2 4.8 3.8 3.5 Japan 6.3 1.6 1.6 0.3 3.3 0.4 -0.2 2.7 2.8 2.1 3.8 2.0 2.7
115
AN
NE
X

TABLE 7 : Private consumption expenditure, volume (percentage change on preceding year, 1961-2005) 29.03.2004
long-term 2003 2004 2005average 5-year average estimate of forecast of forecast of1961-90 1991-95 1996-00 1999 2000 2001 2002 X-2003 III-2004 X-2003 III-2004 X-2003 III-2004
Belgium 3.2 1.7 2.4 2.3 3.4 0.8 0.4 1.6 1.7 1.6 1.5 2.2 2.0 Germany 3.6 1.9 1.8 3.7 2.0 1.4 -1.0 0.7 -0.1 1.1 0.9 1.4 2.2 Greece 4.8 1.9 2.6 2.5 2.0 2.9 2.8 2.7 4.0 3.0 3.6 3.0 3.4 Spain 4.5 1.2 3.7 4.7 4.0 2.8 2.6 3.1 3.0 3.2 3.0 3.4 3.3 France 3.7 0.7 2.1 3.2 2.6 2.7 1.2 1.3 1.6 1.5 1.7 2.0 2.3 Ireland 3.1 3.1 7.8 9.6 8.5 5.3 2.6 2.0 2.4 2.8 3.2 3.8 3.7 Italy 4.4 0.9 2.6 2.6 2.7 0.8 0.5 2.0 1.3 1.9 1.5 2.0 2.1 Luxembourg 3.8 2.5 4.4 2.6 4.6 4.5 2.3 1.9 2.0 1.8 2.1 2.0 2.3 Netherlands 3.6 1.6 4.0 4.7 3.5 1.4 0.8 -1.1 -1.3 -0.1 0.4 1.4 1.1 Austria 3.6 2.3 2.7 2.4 3.3 1.4 0.8 1.1 1.3 1.8 1.8 2.2 2.4 Portugal 4.0 2.3 3.9 5.1 2.9 1.3 0.6 -0.9 -0.7 0.8 0.7 0.9 1.2 Finland 3.9 -1.1 3.6 3.5 3.1 1.8 1.5 3.2 3.6 2.5 3.0 2.6 2.4 Euro area 3.8 1.3 2.5 3.5 2.7 1.8 0.5 1.3 1.1 1.6 1.6 2.0 2.3 Denmark 2.1 2.3 1.5 0.7 -0.7 -0.2 0.6 1.0 1.1 2.9 3.4 2.6 2.7 Sweden 2.3 -0.2 3.2 3.8 4.9 0.4 1.4 1.8 2.0 2.3 2.3 2.3 2.5 United Kingdom 2.8 1.3 4.0 4.4 4.6 3.1 3.4 2.3 2.5 2.2 2.9 2.3 2.1 EU-15 3.5 1.3 2.8 3.6 3.1 2.0 1.1 1.5 1.4 1.8 1.9 2.1 2.3 Cyprus : : 5.3 0.8 10.1 4.8 2.5 2.8 1.5 3.3 3.3 3.6 3.5 Czech Republic : -0.4 2.5 1.7 2.5 3.6 4.0 4.8 5.4 3.3 3.8 4.2 4.1 Estonia : : 5.0 -2.7 6.7 5.2 9.4 6.5 6.4 5.0 6.2 3.5 5.8 Hungary : -1.5 2.8 5.6 5.5 5.7 10.3 9.8 9.0 4.0 2.9 4.6 3.0 Latvia : : 5.4 3.7 7.4 7.8 6.9 6.0 8.0 5.0 7.1 5.0 6.5 Lithuania : : 5.3 3.3 6.6 3.9 6.5 5.1 9.5 4.7 6.7 4.6 5.9 Malta : : 4.9 6.1 7.4 1.7 2.5 1.6 1.1 1.0 0.5 1.2 1.0 Poland : 4.4 5.7 5.2 2.8 0.2 3.4 3.0 3.1 3.3 3.7 3.7 4.2 Slovakia : : 4.4 3.2 -0.8 4.7 5.3 1.6 -0.4 2.6 2.6 3.2 3.9 Slovenia : 2.1 2.8 5.9 0.3 2.4 1.1 2.3 3.0 3.0 3.5 3.0 3.7 AC-10 : : 4.5 4.3 3.3 2.2 4.5 4.5 4.4 3.5 3.7 3.9 4.0 EU-25 : : 2.8 3.7 3.1 2.0 1.3 1.7 1.5 1.8 1.9 2.2 2.3 USA 3.7 2.6 4.4 5.1 4.7 2.5 3.4 3.0 3.1 3.5 3.7 2.5 2.4 Japan 5.8 2.3 0.9 0.2 1.0 1.7 0.9 1.2 1.1 1.3 2.4 1.2 2.0
TABLE 8 : Government consumption expenditure, volume (percentage change on preceding year, 1961-2005)long-term 2003 2004 2005
average 5-year average estimate of forecast of forecast of1961-90 1991-95 1996-00 1999 2000 2001 2002 X-2003 III-2004 X-2003 III-2004 X-2003 III-2004
Belgium 3.5 1.5 2.0 3.6 2.7 2.7 1.9 1.7 1.8 2.0 1.7 1.8 1.2 Germany 3.2 2.2 1.2 0.8 1.0 1.0 1.7 1.1 0.9 0.5 0.2 0.5 -0.1 Greece 4.6 0.5 2.0 2.1 2.2 -1.0 5.8 3.7 6.0 4.3 2.0 2.0 1.1 Spain 4.9 3.0 3.4 4.2 5.1 3.6 4.4 4.0 4.6 4.3 4.2 4.0 4.0 France 3.4 2.3 1.7 1.5 2.8 2.9 4.1 2.4 2.4 1.5 1.6 1.9 2.8 Ireland 3.6 2.7 5.8 7.7 7.6 11.6 8.9 3.8 3.0 2.0 2.3 2.0 2.3 Italy 3.4 -0.2 0.9 1.3 1.7 3.9 1.9 1.5 2.2 1.0 1.2 1.2 1.2 Luxembourg 3.6 3.6 4.4 7.3 4.8 7.0 4.2 3.6 4.5 3.6 2.0 3.8 2.7 Netherlands 3.1 2.1 2.2 2.5 2.0 4.2 3.8 0.7 2.4 -0.1 0.5 0.4 -0.5 Austria 2.7 3.0 1.1 3.0 -0.1 -1.4 0.1 -0.1 0.7 0.3 0.4 0.3 0.4 Portugal 7.6 2.7 3.9 5.6 4.1 3.5 2.4 -0.9 -0.6 -0.2 -0.8 0.1 0.0 Finland 4.4 -0.4 1.8 1.4 0.0 2.4 3.8 1.8 0.7 1.6 1.3 1.5 1.3 Euro area 3.5 1.8 1.6 1.8 2.1 2.6 2.9 1.7 2.0 1.3 1.2 1.4 1.3 Denmark 3.6 2.1 2.0 2.0 0.9 2.7 2.1 0.8 1.2 0.7 0.9 0.6 0.5 Sweden 3.5 0.8 0.7 1.7 -1.2 0.9 3.2 0.8 0.7 0.6 0.7 0.7 0.5 United Kingdom 1.8 1.1 1.4 3.1 1.9 1.7 2.5 3.6 1.8 2.1 2.1 2.0 2.6 EU-15 3.2 1.7 1.6 2.0 1.9 2.4 2.8 2.0 1.9 1.4 1.3 1.5 1.5 Cyprus : : 3.0 -7.7 0.2 11.5 3.1 3.3 1.7 -7.0 -3.5 2.0 2.2 Czech Republic : -4.1 -0.8 2.3 -1.0 5.3 5.7 3.0 0.0 -0.8 0.0 0.5 0.0 Estonia : : 2.1 3.8 1.5 0.9 5.0 5.7 6.0 3.9 6.5 5.8 4.0 Hungary : -1.8 1.2 1.5 1.9 4.3 5.2 3.3 4.5 1.2 -1.0 1.5 1.5 Latvia : 0.9 1.2 0.0 -1.9 0.3 1.5 1.9 2.0 2.2 2.5 2.0 2.5 Lithuania : : 2.0 -8.1 3.9 0.3 2.4 4.4 5.3 7.2 6.9 6.0 6.1 Malta : : 1.5 -0.6 5.4 3.0 2.4 5.1 6.7 0.1 1.1 0.2 0.2 Poland : 4.7 2.2 1.9 1.3 0.6 0.6 1.8 0.4 2.0 1.6 2.0 1.2 Slovakia : : 3.3 -7.1 1.6 4.6 4.7 -1.1 2.9 1.3 1.3 1.4 1.3 Slovenia : 1.5 3.3 2.9 2.3 4.0 2.5 2.4 2.8 2.8 2.9 2.7 2.7 AC-10 : : 1.6 0.6 1.2 2.7 2.8 2.3 1.7 1.3 1.0 1.9 1.4 EU-25 : : 1.6 1.9 1.9 2.4 2.8 2.0 1.9 1.4 1.3 1.5 1.5 USA 2.5 0.0 1.8 3.3 1.9 3.0 4.0 3.7 3.7 1.7 2.1 2.6 2.9 Japan 4.4 3.4 3.1 4.6 4.9 3.0 2.4 1.1 1.2 1.3 1.5 1.3 1.4
116
AN
NE
X

TABLE 9 : Total investment, volume (percentage change on preceding year, 1961-2005) 29.03.2004
long-term 2003 2004 2005average 5-year average estimate of forecast of forecast of1961-90 1991-95 1996-00 1999 2000 2001 2002 X-2003 III-2004 X-2003 III-2004 X-2003 III-2004
Belgium 3.4 -0.4 4.0 4.4 4.4 0.3 -2.5 -0.3 1.8 2.0 2.3 3.6 4.7 Germany 2.3 1.6 1.9 4.1 2.7 -4.2 -6.7 -1.7 -2.9 2.8 2.7 2.1 3.3 Greece 3.5 -0.2 9.0 11.0 8.0 6.5 5.7 8.7 12.6 7.1 6.0 3.5 5.0 Spain 6.0 -0.5 6.3 8.8 5.7 3.3 1.0 2.8 3.0 3.9 3.4 4.5 4.7 France 4.5 -1.2 4.5 8.3 7.8 1.9 -1.6 -1.3 -0.8 1.4 2.2 3.3 3.3 Ireland 5.2 2.6 14.3 14.0 7.1 0.2 1.5 -1.1 -4.8 2.5 3.1 3.0 3.5 Italy 2.9 -1.2 4.3 5.0 6.9 1.9 1.2 -2.1 -2.1 2.0 1.8 2.9 3.3 Luxembourg 3.3 3.2 7.7 14.6 -3.5 10.1 -1.4 -1.7 -1.8 1.0 3.1 3.2 4.5 Netherlands 3.0 0.8 5.2 7.8 1.4 -0.1 -4.5 -3.2 -3.4 0.5 -0.6 2.3 2.1 Austria 3.9 2.4 3.3 2.1 6.2 -2.3 -2.8 1.9 4.3 2.5 4.3 3.8 3.9 Portugal 4.6 2.2 8.2 6.4 3.8 0.1 -5.6 -9.2 -9.6 1.0 -0.9 5.2 5.0 Finland 3.3 -9.1 7.0 2.5 4.1 3.9 -3.1 -2.7 -2.3 0.5 1.4 2.3 2.3 Euro area 3.4 -0.1 4.0 6.0 5.0 -0.1 -2.5 -1.0 -1.0 2.4 2.4 3.0 3.6 Denmark 2.7 1.8 6.6 1.4 7.1 4.9 4.5 -2.0 -2.9 2.9 2.0 4.6 3.4 Sweden 3.1 -4.1 5.1 8.2 5.7 -1.0 -3.0 -1.1 -2.0 2.2 1.5 4.9 5.6 United Kingdom 3.3 -0.3 6.0 1.6 3.6 3.6 1.8 3.1 2.9 4.8 6.4 4.8 5.6 EU-15 3.4 -0.3 4.3 5.3 4.9 0.5 -1.7 -0.4 -0.5 2.7 2.9 3.4 3.9 Cyprus : : 2.6 -1.4 4.1 2.5 10.1 -4.5 -2.9 7.4 7.0 7.7 7.5 Czech Republic : 2.1 2.0 -1.0 5.3 5.5 0.6 -0.5 3.7 2.7 3.8 3.2 4.5 Estonia : : 7.1 -14.8 13.3 12.2 16.1 12.0 11.1 5.0 6.8 4.0 7.1 Hungary : -0.9 8.5 5.9 7.7 3.5 7.2 3.0 2.2 6.8 5.0 7.3 5.5 Latvia : -25.0 19.6 -4.0 20.0 17.0 10.4 9.5 9.5 9.5 10.0 9.5 10.0 Lithuania : : 8.3 -6.1 -9.0 13.5 8.7 8.1 12.1 8.5 9.0 8.7 9.3 Malta : : 0.6 4.0 17.5 -11.1 -13.3 5.3 13.4 2.4 4.2 3.9 2.6 Poland : 5.1 12.8 6.8 2.7 -8.8 -5.8 2.3 -0.9 9.0 6.0 11.5 9.8 Slovakia : : 4.2 -19.6 -7.2 13.9 -0.9 1.9 -1.2 5.0 5.3 5.4 7.0 Slovenia : 2.6 11.9 22.6 2.6 -0.4 1.3 5.2 5.5 5.5 8.2 7.0 7.0 AC-10 : : 8.5 2.6 3.5 -0.9 -0.6 2.4 1.9 6.6 5.7 7.8 7.3 EU-25 : : 4.5 5.2 4.8 0.5 -1.6 -0.2 -0.4 2.9 3.1 3.6 4.1 USA 3.6 4.2 8.2 8.3 6.2 -2.4 -2.6 2.8 3.9 5.8 7.4 6.2 4.3 Japan 7.9 -0.8 1.0 -0.9 2.7 -1.1 -6.1 3.8 3.2 1.6 4.3 0.4 2.4
TABLE 10 : Investment in construction, volume (percentage change on preceding year, 1971-2005)long-term 2003 2004 2005
average 5-year average estimate of forecast of forecast of1971-90 1991-95 1996-00 1999 2000 2001 2002 X-2003 III-2004 X-2003 III-2004 X-2003 III-2004
Belgium : : 2.3 -0.2 4.1 -0.6 -2.2 0.5 0.7 2.1 2.1 3.2 3.2 Germany 0.7 4.0 -1.3 1.4 -2.6 -4.8 -5.8 -3.9 -3.4 0.7 0.6 -1.2 -0.9 Greece 0.2 -2.8 5.4 5.4 3.6 7.0 3.7 8.7 10.0 7.8 6.5 4.0 5.0 Spain 3.1 0.1 4.6 9.0 6.1 5.8 4.2 3.4 3.7 3.1 3.3 3.0 2.9 France 1.1 -2.1 1.6 6.1 7.1 1.4 -1.0 -1.6 -0.9 1.5 1.9 3.1 2.9 Ireland 2.3 3.7 13.1 12.4 6.6 4.8 5.0 1.7 5.8 0.8 1.1 1.7 1.6 Italy 0.4 -2.4 1.9 2.6 5.9 3.0 3.3 3.0 1.8 0.4 1.0 1.7 0.8 Luxembourg 2.3 4.4 5.9 3.9 7.9 12.4 -0.1 0.4 0.1 1.6 1.9 1.9 3.1 Netherlands -0.1 0.8 3.9 6.2 4.9 2.1 -3.7 0.4 -4.5 1.7 -0.5 2.0 1.8 Austria 2.4 3.6 0.7 0.3 1.9 -2.5 -0.7 1.3 2.8 1.6 2.5 1.9 2.4 Portugal : 3.5 6.5 3.7 4.0 2.7 -3.4 -10.0 -12.2 0.7 -3.0 3.5 2.2 Finland 2.2 -9.9 8.7 5.0 6.2 -0.7 -2.4 -0.5 -0.6 1.3 2.0 2.4 2.6 Euro area 1.2 0.7 1.4 3.7 2.7 0.1 -1.3 -0.4 -0.4 1.5 1.5 1.6 1.5 Denmark -1.2 -0.7 3.9 -5.7 6.9 3.4 1.7 0.7 -7.6 3.2 2.8 3.1 3.2 Sweden 0.2 -7.6 -0.3 0.0 4.2 5.9 1.7 0.2 -1.7 2.0 1.0 5.1 5.2 United Kingdom 1.9 -1.8 2.9 2.7 4.3 -6.7 6.9 6.3 8.2 5.0 7.3 3.5 5.3 EU-15 1.2 0.1 1.5 3.3 3.0 -0.7 -0.1 0.7 0.8 2.1 2.4 2.0 2.3 Cyprus : : -1.4 -0.2 -3.5 1.5 5.7 : -2.9 : 7.0 : 7.5 Czech Republic : -0.7 -2.0 -11.5 -5.3 21.1 0.2 : 3.7 : 3.8 : 4.5 Estonia : : : : : : : : : : : : : Hungary : : : : : : : 0.0 : 0.0 : 0.0 : Latvia : : : : : : : 6.0 : 6.6 : 6.7 : Lithuania : : 2.8 -7.9 -17.0 8.9 10.9 : : : : : : Malta : : : : : : : : 27.5 : 5.9 : 2.3 Poland : : 10.0 7.3 1.0 -8.5 -2.2 : : : : : : Slovakia : : : : : : : : : : : : : Slovenia : -4.2 10.7 17.8 1.0 -6.5 -1.3 : 4.3 : 9.1 : 8.7 AC-10 : : : : : : : : : : : : : EU-25 : : : : : : : : : : : : : USA 1.7 1.0 4.7 4.0 3.2 -0.3 -2.9 0.8 2.2 2.9 2.6 3.8 -0.7 Japan 3.8 -1.6 -1.1 -1.3 -1.2 -3.5 : : : : : : :
117
AN
NE
X

TABLE 11 : Investment in equipment, volume (percentage change on preceding year, 1971-2005) 29.03.2004
long-term 2003 2004 2005average 5-year average estimate of forecast of forecast of1971-90 1991-95 1996-00 1999 2000 2001 2002 X-2003 III-2004 X-2003 III-2004 X-2003 III-2004
Belgium : : 5.8 8.4 5.0 0.6 -2.7 -0.5 -0.5 2.0 2.0 4.0 4.0 Germany 2.2 -2.6 6.3 7.2 10.1 -4.9 -9.1 0.8 -3.0 4.8 4.9 4.7 7.5 Greece 3.5 4.6 15.9 21.4 14.1 4.9 6.9 7.7 17.0 6.6 5.5 3.0 5.0 Spain 4.3 -2.5 9.1 7.8 4.7 -1.2 -5.4 1.6 1.9 4.7 3.5 7.1 7.7 France 5.3 -0.1 7.9 11.9 10.4 2.5 -3.2 -1.0 -0.5 1.7 4.0 4.0 4.2 Ireland 4.5 2.1 15.7 17.3 7.5 -6.4 -2.4 -5.0 -20.0 5.0 7.0 5.0 7.0 Italy 3.9 -0.1 6.5 7.1 8.3 0.8 -1.1 -6.4 -6.0 2.8 1.5 3.9 6.5 Luxembourg 4.2 2.1 9.4 30.0 -12.9 8.8 -1.2 -4.4 -4.4 0.3 5.0 5.2 6.5 Netherlands 3.0 1.3 5.4 10.1 -3.5 -3.2 -4.2 -8.7 -6.4 -1.5 -0.8 2.6 2.7 Austria 3.5 0.3 6.2 4.6 11.6 -3.2 -6.7 2.7 6.2 3.9 6.3 6.3 5.4 Portugal : 0.0 11.2 9.2 4.7 -3.8 -9.4 -8.3 -6.8 1.4 1.3 7.1 7.6 Finland 3.7 -9.8 4.4 -3.2 -1.0 12.0 -9.1 -7.5 -6.4 -1.5 0.6 2.0 2.0 Euro area ¹ 3.8 -0.9 7.1 8.5 8.0 -1.1 -4.9 -1.9 -2.3 3.1 3.4 4.5 6.0 Denmark 2.6 2.6 7.9 5.5 8.4 7.0 6.5 -5.6 -1.2 2.0 1.6 5.5 3.6 Sweden 4.8 0.5 8.0 11.8 5.0 -4.1 -5.7 -2.1 -3.5 2.5 2.0 4.7 6.1 United Kingdom 2.9 1.1 9.3 7.9 1.8 0.8 -6.7 -0.8 -3.3 4.8 5.5 6.4 6.1 EU-15 ¹ 3.7 -0.4 7.5 8.5 6.8 -0.7 -5.0 -1.8 -2.5 3.3 3.6 4.8 6.0 Cyprus : : 10.6 -3.4 16.2 3.9 16.4 : -2.9 : 7.0 : 7.5 Czech Republic : 3.6 4.1 -1.8 11.8 -5.6 1.7 : 3.6 : 3.8 : 4.5 Estonia : : : : : : : : : : : : : Hungary : : : : : : : 0.0 : 0.0 : 0.0 : Latvia : : : : : : : 2.1 : 3.0 : 3.1 : Lithuania : : 18.7 -3.1 -1.0 22.2 7.1 : : : : : : Malta : : : : : : : : 2.6 : 2.6 : 2.8 Poland : : 14.9 5.1 4.0 -10.4 -9.6 : : : : : : Slovakia : : : : : : : : : : : : : Slovenia : 8.0 12.3 25.7 3.0 5.3 3.9 : 6.3 : 7.6 : 5.9 AC-10 : : : : : : : : : : : : : EU-25 : : : : : : : : : : : : : USA 5.3 7.7 11.7 12.6 9.0 -4.6 -2.3 4.1 5.5 7.7 11.6 7.7 8.4 Japan 6.1 -0.7 3.4 -0.6 7.4 1.0 : : : : : : :¹ Excluding Belgium, excluding Portugal up to 1985.
TABLE 12 : Public investment (as a percentage of GDP, 1971-2005)long-term 2003 2004 2005
average 5-year average estimate of forecast of forecast of1971-90 1991-95 1996-00 1999 2000 2001 2002 X-2003 III-2004 X-2003 III-2004 X-2003 III-2004
Belgium 3.6 1.5 1.7 1.8 1.8 1.6 1.6 1.5 1.6 1.5 1.6 1.6 1.7 Germany 3.1 2.6 1.9 1.9 1.8 1.7 1.6 1.6 1.5 1.5 1.4 1.4 1.3 Greece 2.8 3.2 3.5 3.5 4.1 4.0 3.8 3.9 4.2 3.8 4.2 3.7 4.2 Spain 2.9 4.1 3.2 3.4 3.1 3.3 3.4 3.5 3.5 3.6 3.5 3.8 3.6 France 3.4 3.3 3.1 3.0 3.2 3.1 3.0 3.1 3.2 3.1 3.2 3.1 3.2 Ireland 3.9 2.2 2.9 3.2 3.7 4.5 4.3 4.0 3.9 4.0 3.9 4.0 3.9 Italy 3.2 2.7 2.3 2.4 2.4 2.5 1.9 2.6 2.6 2.4 2.5 2.7 2.8 Luxembourg : 4.7 4.4 4.4 3.8 4.2 4.8 5.2 4.9 4.8 4.8 4.9 4.8 Netherlands 2.9 2.2 3.0 3.0 3.1 3.2 3.3 3.4 3.5 3.4 3.4 3.4 3.3 Austria 4.3 3.2 2.0 1.7 1.5 1.2 1.3 1.2 1.2 1.2 1.2 1.1 1.1 Portugal 3.1 3.6 4.1 4.1 3.8 4.0 3.4 3.4 3.9 2.6 3.1 3.2 3.7 Finland 3.8 3.1 2.9 2.8 2.6 2.8 2.9 2.7 3.0 2.6 2.8 2.5 2.7 Euro area 3.3 2.9 2.5 2.5 2.5 2.5 2.4 2.5 2.6 2.5 2.5 2.5 2.6 Denmark 3.0 1.8 1.8 1.7 1.7 1.9 1.8 1.6 1.6 1.6 1.7 1.6 1.7 Sweden 3.9 2.5 3.2 3.2 2.9 3.1 3.3 3.3 3.1 3.2 3.0 3.1 2.9 United Kingdom 3.0 1.9 1.2 1.1 1.1 1.2 1.3 1.5 1.5 1.9 1.8 2.2 2.0 EU-15 3.2 2.7 2.3 2.3 2.3 2.3 2.2 2.4 2.4 2.4 2.4 2.5 2.5 Cyprus : : : : : : : 0.0 0.0 0.0 0.0 0.0 0.0 Czech Republic : : 4.6 4.1 2.8 3.4 4.4 4.9 4.4 3.2 4.4 2.4 4.4 Estonia : : 4.6 4.5 3.8 4.1 4.9 4.5 4.7 4.4 4.5 4.4 4.3 Hungary : : : : : 3.8 4.9 5.1 3.2 4.7 4.5 4.5 4.6 Latvia : 2.4 2.5 3.3 3.0 2.8 3.3 3.1 2.4 2.9 2.3 2.7 2.2 Lithuania : : 2.5 2.6 2.4 2.2 2.9 0.6 2.9 0.6 3.2 0.7 3.2 Malta : : : : : : : 5.8 5.1 5.8 5.1 5.7 4.9 Poland : 3.2 3.7 3.5 3.5 3.5 3.5 3.5 3.5 3.5 3.5 3.4 3.7 Slovakia : : 3.8 2.9 2.8 3.1 3.3 4.1 3.0 4.3 2.7 4.4 2.5 Slovenia : : : : : : : 3.9 0.0 3.6 0.0 3.4 0.0 AC-10 : : : : : : : 3.6 3.0 3.3 3.1 3.0 3.1 EU-25 : : : : : : : 2.4 2.4 2.4 2.4 2.5 2.4 USA 2.7 2.5 2.5 2.6 2.6 2.7 2.7 3.3 3.2 3.3 3.2 3.3 3.1 Japan 5.3 5.9 5.6 5.8 5.1 4.9 4.7 4.4 4.1 4.1 3.5 3.9 3.0
118
AN
NE
X

TABLE 13 : Output gap relative to potential GDP (deviation of actual output from potential output as % of potential GDP, 1986-2005) ¹ 29.03.2004
long-term 2003 2004 2005average 5-year average estimate of forecast of forecast of1965-90 1991-95 1996-00 1999 2000 2001 2002 X-2003 III-2004 X-2003 III-2004 X-2003 III-2004
Belgium 0.0 -0.2 0.4 1.1 2.4 1.1 -0.1 -0.8 -0.8 -0.8 -0.7 -0.4 -0.4 Germany -0.2 1.6 -0.3 -0.1 1.3 0.8 0.0 -1.6 -1.4 -1.4 -1.5 -1.2 -1.4 Greece 0.5 -1.8 -1.6 -1.1 -0.3 0.4 0.4 1.2 0.8 2.0 1.2 2.1 1.1 Spain 0.2 -1.0 -0.6 0.5 1.1 0.4 -0.8 -1.3 -1.6 -1.7 -2.2 -1.7 -2.3 France 0.0 -0.2 0.1 1.1 2.3 2.0 1.2 -0.7 -0.6 -1.1 -0.8 -1.0 -0.7 Ireland 0.8 -3.8 2.4 4.6 6.8 5.5 5.3 0.3 0.3 -1.8 -1.6 -2.6 -2.5 Italy 0.1 -0.5 0.5 0.4 1.4 1.2 -0.1 -1.2 -1.3 -1.2 -1.5 -0.8 -0.9 Luxembourg : 1.4 1.3 3.1 7.1 3.2 0.0 -3.7 -2.4 -5.7 -4.2 -6.9 -5.5 Netherlands -0.1 -0.2 1.8 3.2 4.0 2.7 0.8 -2.0 -2.2 -3.0 -3.2 -2.7 -3.5 Austria -0.1 0.6 0.2 0.8 1.9 0.6 0.1 -0.9 -1.0 -0.8 -1.0 0.0 -0.2 Portugal 0.1 -0.6 0.6 1.8 2.6 1.6 -0.1 -2.5 -3.1 -3.4 -4.1 -3.5 -3.9 Finland 0.6 -5.0 1.7 2.4 4.2 1.7 0.9 -0.5 -0.1 -0.5 -0.2 -0.2 -0.1 Euro area 0.0 0.2 0.1 0.7 1.9 1.3 0.3 -1.2 -1.2 -1.4 -1.5 -1.2 -1.3 Denmark 0.1 -1.8 1.3 1.7 2.4 1.9 0.9 -0.1 -0.7 -0.1 -0.3 0.0 0.1 Sweden 0.4 -2.3 0.3 1.5 3.1 1.3 0.8 -0.3 0.0 -0.6 0.0 -0.7 0.0 United Kingdom 0.3 -1.8 0.6 0.5 1.4 0.7 -0.4 -0.9 -0.8 -0.7 -0.5 -0.6 -0.5 EU-15 0.1 -0.2 0.2 0.7 1.9 1.2 0.2 -1.1 -1.1 -1.2 -1.3 -1.1 -1.1 Cyprus : : : : : : : : : : : : : Czech Republic : : : : : : : : : : : : : Estonia : : : : : : : : : : : : : Hungary : : : : : : : : : : : : : Latvia : : : : : : : : : : : : : Lithuania : : : : : : : : : : : : : Malta : : : : : : : : : : : : : Poland : : : : : : : : : : : : : Slovakia : : : : : : : : : : : : : Slovenia : : : : : : : : : : : : : AC-10 : : : : : : : : : : : : : EU-25 : : : : : : : : : : : : :¹ Output gaps are non observable concepts and can be measured in different ways. Analysis based on them should be treated with prudence. Potential GDP is calculated on the basis of the Production Function (see note 5 on concepts and sources); the leap year 2004 has not been included.
TABLE 14 : Output gap relative to trend GDP (deviation of actual output from trend output as % of trend GDP, 1961-2005) ¹long-term 2003 2004 2005
average 5-year average estimate of forecast of forecast of1961-90 1991-95 1996-00 1999 2000 2001 2002 X-2003 III-2004 X-2003 III-2004 X-2003 III-2004
Belgium 0.0 0.0 0.3 0.8 2.5 1.2 -0.1 -0.9 -0.9 -0.8 -0.8 -0.3 -0.2 Germany -0.2 1.9 -0.1 0.0 1.5 1.0 -0.1 -1.6 -1.4 -1.3 -1.2 -0.9 -0.7 Greece 0.1 -0.3 -0.9 -0.7 0.2 0.6 0.8 1.0 1.2 1.3 1.4 1.0 1.0 Spain 0.2 0.0 -0.3 0.8 1.8 1.5 0.5 -0.2 -0.1 -0.4 -0.4 -0.2 -0.2 France 0.1 0.0 -0.5 0.3 2.0 2.0 1.2 -0.6 -0.6 -0.8 -0.8 -0.4 -0.3 Ireland 0.1 -3.6 1.6 4.2 6.8 6.1 6.5 1.7 1.8 -0.2 0.0 -0.8 -0.7 Italy 0.1 -0.4 0.0 -0.1 1.3 1.6 0.4 -0.7 -0.7 -0.7 -0.9 -0.2 -0.3 Luxembourg -0.2 1.2 0.2 2.4 7.0 4.0 1.5 -0.2 -0.3 -1.4 -1.2 -1.5 -1.2 Netherlands -0.1 -0.5 1.2 2.7 3.9 3.0 1.4 -1.1 -1.0 -1.9 -1.5 -1.4 -1.3 Austria -0.1 0.9 0.1 0.7 2.0 0.8 0.3 -0.8 -0.8 -0.8 -0.9 -0.3 -0.3 Portugal -0.1 0.0 0.9 2.5 3.6 3.2 1.6 -1.2 -1.4 -2.0 -2.3 -1.7 -1.9 Finland 0.7 -5.1 0.9 2.1 4.1 2.1 1.4 0.3 0.4 0.0 0.1 0.0 0.1 Euro area 0.0 0.5 -0.1 0.5 1.9 1.6 0.6 -0.9 -0.8 -0.9 -0.9 -0.6 -0.5 Denmark 0.2 -1.6 1.0 1.3 2.1 1.6 0.7 -0.4 -1.0 -0.4 -0.7 -0.2 -0.3 Sweden 0.3 -2.0 0.0 1.3 3.0 1.4 1.0 0.0 0.1 -0.2 0.0 0.0 0.2 United Kingdom 0.2 -1.7 0.4 0.5 1.5 0.9 -0.1 -0.6 -0.6 -0.4 -0.3 -0.2 -0.2 EU-15 0.0 0.1 0.0 0.5 1.9 1.5 0.5 -0.8 -0.8 -0.8 -0.8 -0.5 -0.4 Cyprus : : : : : : : : : : : : : Czech Republic : : : : : : : : : : : : : Estonia : : : : : : : : : : : : : Hungary : : : : : : : : : : : : : Latvia : : : : : : : : : : : : : Lithuania : : : : : : : : : : : : : Malta : : : : : : : : : : : : : Poland : : : : : : : : : : : : : Slovakia : : : : : : : : : : : : : Slovenia : : : : : : : : : : : : : AC-10 : : : : : : : : : : : : : EU-25 : : : : : : : : : : : : :¹ Output gaps are non observable concepts and can be measured in different ways. Analysis based on them should be treated with prudence. Trend GDP is calculated using the Hodrick-Prescott filter (see note 5 on concepts and sources).
119
AN
NE
X

TABLE 15 : Deflator of gross domestic product (percentage change on preceding year, 1961-2005) 29.03.2004
long-term 2003 2004 2005average 5-year average estimate of forecast of forecast of1961-90 1991-95 1996-00 1999 2000 2001 2002 X-2003 III-2004 X-2003 III-2004 X-2003 III-2004
Belgium 4.9 2.7 1.4 1.4 1.2 1.8 1.7 1.4 2.0 1.1 1.7 1.4 1.6 Germany 3.9 3.3 0.6 0.5 -0.3 1.3 1.6 1.2 1.0 1.3 1.1 0.9 0.9 Greece 12.2 13.9 5.1 3.0 3.4 3.5 3.9 4.1 3.6 4.3 3.9 3.5 3.1 Spain 10.3 5.4 2.9 2.8 3.5 4.2 4.4 4.1 4.2 3.6 3.7 3.1 3.2 France 6.7 2.1 1.0 0.5 1.0 1.8 1.8 1.7 1.7 1.7 1.7 1.5 1.6 Ireland 8.7 2.9 4.1 3.8 4.3 5.1 5.4 1.5 1.9 3.2 1.9 2.7 2.5 Italy 9.9 4.9 2.8 1.6 2.2 2.6 3.1 3.0 2.9 2.5 2.4 2.1 2.0 Luxembourg 4.9 3.5 2.7 2.2 3.9 2.2 0.6 1.9 2.2 2.7 2.1 2.6 2.1 Netherlands 4.9 2.3 2.1 1.6 3.9 5.4 3.4 2.8 2.9 1.5 1.2 0.9 0.3 Austria 4.6 3.1 1.0 0.7 1.4 2.1 1.4 1.3 2.0 1.2 1.5 1.1 1.2 Portugal 11.9 7.9 3.4 3.1 3.5 4.5 5.1 3.4 2.3 2.5 2.4 2.4 2.1 Finland 8.0 2.5 1.6 -0.2 3.2 3.0 0.9 1.0 0.7 0.8 0.4 1.6 1.3 Euro area 6.6 3.7 1.6 1.1 1.4 2.4 2.4 2.1 2.1 2.0 1.8 1.6 1.6 Denmark 7.5 2.1 2.1 1.8 3.0 2.1 1.6 2.2 2.1 1.8 2.1 2.0 2.0 Sweden 7.2 3.7 1.1 0.7 1.3 2.3 1.4 2.1 2.3 2.0 1.9 2.0 2.1 United Kingdom 8.1 3.5 2.5 2.3 1.4 2.3 3.3 2.4 3.1 1.9 2.8 2.0 2.6 EU-15 6.9 3.6 1.7 1.3 1.4 2.4 2.6 2.2 2.3 2.0 2.0 1.7 1.8 Cyprus : 4.6 2.7 2.2 4.5 2.3 2.8 4.8 4.3 3.9 2.5 3.9 2.3 Czech Republic : 18.3 7.9 3.0 9.3 5.0 1.7 2.1 2.9 2.7 3.1 2.6 3.0 Estonia : : 10.9 4.5 6.7 5.2 4.1 2.7 2.7 4.4 3.7 4.9 3.7 Hungary : 24.6 14.0 8.4 9.9 8.6 9.0 6.0 5.3 7.4 6.4 6.5 5.3 Latvia : 137.7 7.6 5.3 4.6 2.5 1.8 1.9 2.4 2.6 2.0 3.0 1.8 Lithuania : 215.0 8.0 -0.4 0.9 -0.2 0.1 -0.8 -1.2 2.4 1.4 2.7 2.4 Malta : : 1.8 2.7 0.9 5.8 1.1 5.6 4.6 -0.1 1.1 0.3 1.5 Poland : 37.6 11.3 6.4 6.7 4.0 1.2 0.7 0.7 1.6 2.1 2.4 2.6 Slovakia : : 6.2 6.5 8.5 4.2 4.0 6.8 4.7 5.1 5.5 3.2 2.5 Slovenia : 65.1 7.8 5.9 5.6 9.1 8.1 6.4 5.1 5.6 3.5 5.0 3.4 AC-10 : : 10.1 5.7 7.3 4.9 2.9 2.8 2.4 3.4 3.3 3.5 3.2 EU-25 : : 2.0 1.5 1.7 2.5 2.6 2.2 2.3 2.0 2.1 1.8 1.9 USA 4.7 2.5 1.7 1.4 2.2 2.4 1.5 1.4 1.6 1.0 1.1 1.1 0.9 Japan 5.2 0.9 -0.8 -1.5 -2.0 -1.5 -1.2 -2.2 -2.5 -1.3 -1.0 -1.1 -0.4
TABLE 16 : Price deflator of private consumption (percentage change on preceding year, 1961-2005)long-term 2003 2004 2005
average 5-year average estimate of forecast of forecast of1961-90 1991-95 1996-00 1999 2000 2001 2002 X-2003 III-2004 X-2003 III-2004 X-2003 III-2004
Belgium 4.8 2.2 1.7 1.2 2.3 2.5 1.7 1.6 1.8 1.4 1.5 1.8 1.7 Germany 3.4 3.3 1.3 0.3 1.5 1.6 1.3 1.1 1.0 1.7 1.3 1.2 1.1 Greece 11.5 13.8 4.8 2.3 3.3 3.3 3.4 3.6 3.5 3.5 3.4 3.4 3.3 Spain 10.0 5.6 2.8 2.4 3.2 3.3 3.5 3.2 3.1 2.9 2.5 2.6 2.4 France 6.7 2.5 1.2 0.4 1.5 1.6 2.0 1.9 1.5 1.7 1.7 1.5 1.5 Ireland 8.7 2.7 3.3 3.1 4.1 4.3 6.0 3.5 3.8 3.0 1.8 2.7 2.3 Italy 9.4 5.8 2.8 2.1 2.9 2.8 3.1 2.9 2.5 2.4 2.3 2.1 2.1 Luxembourg 4.6 3.2 1.6 1.5 2.6 3.3 2.3 2.1 2.1 1.8 1.7 1.6 1.6 Netherlands 4.5 2.6 2.1 1.8 3.3 4.7 3.1 2.1 2.0 1.3 1.0 0.9 0.9 Austria 4.4 3.1 1.2 0.8 1.4 2.2 1.1 1.4 1.8 1.7 1.4 1.4 1.3 Portugal 12.2 7.5 3.0 2.1 3.3 3.8 4.2 3.4 3.4 2.6 2.0 2.5 2.2 Finland 7.4 3.1 2.1 1.2 3.6 3.5 3.1 1.7 1.7 1.1 0.6 1.7 1.7 Euro area 6.4 4.0 1.9 1.1 2.2 2.3 2.3 2.0 1.9 2.0 1.8 1.7 1.6 Denmark 7.4 2.3 2.1 2.4 2.6 2.5 2.1 2.1 1.8 1.8 1.8 2.0 1.7 Sweden 7.2 4.8 1.3 1.1 1.2 2.4 1.8 2.0 2.5 1.5 1.0 1.6 1.6 United Kingdom 7.7 4.3 2.3 1.7 1.1 2.2 1.3 1.2 1.5 1.2 1.8 1.2 1.9 EU-15 6.6 4.1 1.9 1.3 2.0 2.3 2.1 1.8 1.8 1.8 1.8 1.6 1.7 Cyprus : : 2.6 4.0 2.9 1.3 3.0 4.8 4.0 2.0 2.2 2.4 2.1 Czech Republic : 18.3 7.0 3.7 7.0 2.5 1.8 0.0 0.1 3.5 2.6 2.6 2.2 Estonia : : 10.0 5.3 3.9 5.7 3.4 1.8 1.3 4.0 2.8 3.7 2.9 Hungary : 26.5 14.7 10.2 9.1 8.2 3.8 6.7 4.7 5.9 6.9 4.1 4.7 Latvia : : 7.1 1.8 2.5 4.8 0.1 2.3 3.5 2.8 3.0 2.8 2.0 Lithuania : : 6.4 0.8 -2.1 2.3 -0.9 -0.9 -1.1 2.3 1.0 2.6 2.2 Malta : : 2.3 1.9 1.5 3.1 1.0 1.3 1.3 1.8 2.7 1.9 2.1 Poland : 41.1 12.0 6.5 9.0 6.6 1.6 0.8 0.7 1.9 2.6 2.7 3.3 Slovakia : : 7.3 9.7 10.0 7.7 0.6 6.8 7.7 7.5 7.3 4.0 3.8 Slovenia : 64.4 8.3 6.0 8.4 8.1 7.6 5.9 5.4 5.2 3.9 4.3 3.1 AC-10 : : 10.4 6.3 7.9 5.9 2.1 2.4 1.9 3.5 3.5 3.1 3.2 EU-25 : : 2.2 1.5 2.2 2.5 2.1 1.9 1.8 1.9 1.8 1.7 1.8 USA 4.6 2.6 1.8 1.7 2.5 2.0 1.4 1.7 1.8 1.2 1.2 1.1 0.9 Japan 5.5 1.1 -0.2 -0.7 -1.3 -1.6 -1.3 -1.2 -1.4 -1.0 -0.4 -0.8 -0.2
120
AN
NE
X

TABLE 17 : Harmonised index of consumer prices (national index if not available), (percentage change on preceding year, 1961-2005) 29.03.2004
long-term 2003 2004 2005average 5-year average estimate of forecast of forecast of1961-90 1991-95 1996-00 1999 2000 2001 2002 X-2003 III-2004 X-2003 III-2004 X-2003 III-2004
Belgium 5.1 2.4 1.6 1.1 2.7 2.4 1.6 1.5 1.5 1.6 1.5 1.9 1.6 Germany 3.5 3.1 1.1 0.6 1.4 1.9 1.3 1.1 1.0 1.6 1.3 1.3 1.1 Greece 11.6 13.9 4.6 2.1 2.9 3.7 3.9 3.6 3.4 3.7 3.4 3.4 3.5 Spain 10.1 5.2 2.6 2.2 3.5 2.8 3.6 3.1 3.1 2.8 2.4 2.6 2.3 France 6.7 2.2 1.3 0.6 1.8 1.8 1.9 2.1 2.2 1.8 1.9 1.5 1.5 Ireland 8.6 2.5 2.6 2.5 5.3 4.0 4.7 4.1 4.0 3.0 2.1 2.7 2.3 Italy 9.1 5.0 2.4 1.7 2.6 2.3 2.6 2.8 2.8 2.3 2.2 1.9 1.9 Luxembourg 4.6 2.8 1.7 1.0 3.8 2.4 2.1 2.2 2.5 2.0 2.0 1.7 1.7 Netherlands 4.7 2.9 1.9 2.0 2.3 5.1 3.9 2.4 2.2 1.3 1.4 0.9 0.7 Austria 4.5 3.2 1.2 0.5 2.0 2.3 1.7 1.3 1.3 1.6 1.4 1.5 1.3 Portugal 13.2 7.1 2.4 2.2 2.8 4.4 3.7 3.4 3.3 2.6 2.0 2.5 2.2 Finland 7.6 2.3 1.6 1.3 3.0 2.7 2.0 1.4 1.3 1.0 0.4 1.7 1.5 Euro area 6.8 : 1.7 1.1 2.1 2.4 2.3 2.1 2.1 2.0 1.8 1.7 1.6 Denmark 7.2 2.0 2.0 2.1 2.7 2.3 2.4 2.3 2.0 1.8 1.5 1.9 1.8 Sweden 6.9 4.2 1.1 0.6 1.3 2.7 2.0 2.3 2.3 1.4 1.2 1.7 1.6 United Kingdom 8.0 3.4 1.6 1.3 0.8 1.2 1.3 1.4 1.4 1.5 1.6 1.6 1.9 EU-15 7.1 : 1.7 1.2 1.9 2.2 2.1 2.0 2.0 1.9 1.8 1.7 1.7 Cyprus : : : 1.1 4.9 2.0 2.8 4.3 4.0 2.1 2.2 2.0 2.1 Czech Republic : : 6.5 1.8 3.9 4.5 1.4 0.0 -0.1 3.3 2.8 2.6 2.8 Estonia : : 8.8 3.1 3.9 5.6 3.6 1.6 1.4 3.9 2.8 3.7 2.9 Hungary : : 15.1 10.0 10.0 9.1 5.2 4.6 4.7 6.1 6.9 4.1 4.6 Latvia : : : 2.1 2.6 2.5 2.0 2.5 2.9 3.0 4.0 2.9 3.5 Lithuania : : 7.7 0.7 0.9 1.3 0.4 -0.9 -1.1 2.3 1.0 2.6 2.2 Malta : : : : : : : 1.3 1.3 1.8 1.8 1.9 1.9 Poland : : : 7.2 10.1 5.3 1.9 0.7 0.7 1.9 2.3 2.7 3.0 Slovakia : : 8.2 10.4 12.2 7.2 3.5 8.5 8.5 8.2 8.2 5.0 4.5 Slovenia : : 8.2 6.1 8.9 8.6 7.5 5.9 5.7 5.2 3.6 4.3 3.2 AC-10 : : : 6.3 8.5 5.7 2.7 2.3 2.1 3.7 3.8 3.2 3.3 EU-25 : : : 1.4 2.2 2.4 2.1 2.0 2.0 2.0 1.8 1.8 1.8 USA 5.1 3.1 2.5 2.2 3.4 2.8 1.6 2.3 2.3 1.4 1.4 1.0 1.2 Japan 5.6 1.4 0.3 -0.3 -0.7 -0.6 -0.9 -0.3 -0.3 -0.4 0.0 -0.3 0.2
TABLE 18 : Profiles of quarterly harmonised index of consumer prices (percentage change on corresponding quarter in previous year, 2003-2005)
2003/1 2003/2 2003/3 2003/4 2004/1 2004/2 2004/3 2004/4 2005/1 2005/2 2005/3 2005/4 Belgium 1.5 1.3 1.6 1.7 1.5 1.4 1.6 1.5 1.6 1.5 1.6 1.7 Germany 1.1 0.9 1.0 1.2 1.1 1.2 1.5 1.4 1.2 1.2 1.0 1.0 Greece 3.8 3.5 3.4 3.2 3.1 3.1 3.7 3.8 3.8 3.7 3.4 3.4 Spain 3.8 2.9 3.0 2.8 2.2 2.4 2.4 2.5 2.5 2.4 2.3 2.2 France 2.3 1.9 2.1 2.4 1.9 2.0 2.1 1.7 1.5 1.4 1.4 1.5 Ireland 4.9 4.1 3.9 3.2 2.2 2.1 2.0 2.2 2.2 2.3 2.4 2.5 Italy 2.8 2.9 2.9 2.7 2.3 2.2 2.1 2.0 2.1 1.8 1.8 2.0 Luxembourg 3.4 2.4 2.3 2.1 2.4 2.2 1.8 1.8 1.7 1.8 1.6 1.6 Netherlands 2.8 2.2 2.1 1.9 1.5 1.6 1.2 1.3 1.0 0.8 0.7 0.6 Austria 1.8 1.1 1.1 1.2 1.2 1.5 1.5 1.4 1.8 1.5 1.1 0.7 Portugal 4.0 3.6 3.0 2.5 2.2 2.1 2.0 2.0 2.0 2.0 2.1 2.3 Finland 1.8 1.2 1.1 1.1 0.2 0.2 0.6 0.6 1.2 1.3 1.6 1.9 Euro area 2.3 2.0 2.0 2.1 1.7 1.8 1.9 1.8 1.7 1.6 1.5 1.6 Denmark 2.8 2.2 1.6 1.3 1.1 1.2 1.7 1.8 1.5 1.4 1.7 2.0 Sweden 2.9 2.1 2.3 1.9 0.7 1.3 1.2 1.4 1.3 1.5 1.7 1.9 United Kingdom 1.5 1.3 1.4 1.3 1.5 1.6 1.7 1.7 1.8 1.8 1.9 2.0 EU-15 2.2 1.8 2.0 1.9 1.6 1.7 1.8 1.8 1.7 1.6 1.6 1.7 Cyprus : : : : : : : : : : : : Czech Republic -0.6 -0.3 -0.2 0.8 0.9 2.3 4.1 3.8 2.7 2.8 2.9 2.8 Estonia 2.4 0.7 1.2 1.0 0.9 2.3 3.5 4.5 3.8 2.8 2.7 2.4 Hungary 4.7 3.9 4.7 5.3 6.6 7.1 7.0 6.7 5.3 4.6 4.3 4.3 Latvia 1.9 2.9 3.5 3.5 3.8 3.8 4.0 4.3 3.7 3.5 3.4 3.2 Lithuania -1.6 -0.6 -0.8 -1.2 -0.1 0.0 1.9 2.1 2.3 2.4 2.1 2.0 Malta : : : : : : : : : : : : Poland 0.4 0.3 0.7 1.2 1.6 2.3 2.6 2.8 2.8 2.9 3.1 3.2 Slovakia : : : : : : : : : : : : Slovenia 6.5 5.7 5.6 5.0 3.6 3.6 3.5 3.5 3.5 3.3 3.2 2.9 AC-10 1.2 1.1 1.4 1.9 2.4 3.1 3.7 3.7 3.3 3.2 3.2 3.2 EU-25 2.2 1.7 1.9 1.9 1.7 1.8 1.9 1.8 1.8 1.7 1.7 1.7 USA 2.9 2.2 2.2 1.9 1.3 1.5 1.3 1.4 1.4 1.4 1.4 1.4 Japan -0.2 -0.2 -0.2 -0.3 -0.1 0.0 0.0 0.2 0.2 0.2 0.2 0.2
121
AN
NE
X

TABLE 19 : Price deflator of exports of goods in national currency (percentage change on preceding year, 1961-2005) 29.03.2004
long-term 2003 2004 2005average 5-year average estimate of forecast of forecast of1961-90 1991-95 1996-00 1999 2000 2001 2002 X-2003 III-2004 X-2003 III-2004 X-2003 III-2004
Belgium 4.1 0.5 3.1 -0.3 10.0 1.8 -1.4 -1.0 -1.0 1.0 0.8 1.2 0.7 Germany 2.7 0.8 0.7 -1.0 3.1 1.4 -0.6 -0.6 -0.9 0.3 -0.5 1.1 0.6 Greece 10.0 8.7 5.0 1.0 13.4 0.5 2.0 0.8 1.2 0.9 -1.0 0.8 0.9 Spain : 3.1 2.3 -1.0 8.4 2.1 -0.1 0.6 0.0 1.1 0.4 1.3 0.9 France 5.0 -1.5 0.5 -1.6 2.2 -0.3 -2.4 -0.6 -0.7 0.3 0.0 0.5 0.3 Ireland 7.4 1.1 2.3 2.5 5.8 3.9 -0.1 -7.2 -7.3 0.7 -1.5 1.4 1.7 Italy 7.5 5.5 1.6 -0.4 7.6 3.2 1.4 0.7 0.7 1.2 -1.2 1.3 1.5 Luxembourg : -0.4 -0.1 -3.4 4.6 -0.4 0.2 -1.4 -1.2 -0.6 0.0 0.4 1.0 Netherlands 2.8 -0.8 1.8 -1.0 9.2 1.1 -1.4 -2.5 -0.6 0.0 -1.1 0.8 0.1 Austria : -0.1 0.6 -0.6 2.2 -0.9 -0.9 -1.1 -0.6 0.4 -1.3 0.6 0.6 Portugal : 1.4 : : : : : -2.0 -2.2 0.1 -0.5 0.5 0.2 Finland : 3.7 -1.4 -5.6 2.7 -3.1 -5.2 -3.0 -3.9 -0.5 -1.1 0.5 -0.8 Euro area 4.4 1.0 1.2 -0.9 5.3 1.2 -0.9 -0.9 -0.9 0.5 -0.5 1.0 0.7 Denmark : 1.2 1.1 -0.6 6.1 0.1 -1.2 0.2 0.4 0.7 0.0 0.8 0.2 Sweden : 3.2 -1.6 -2.2 2.0 2.3 -2.5 -1.9 -2.7 -0.3 -0.6 1.0 1.0 United Kingdom 6.7 2.9 -2.2 -1.8 0.8 -1.5 -0.2 2.0 1.5 1.0 0.5 1.3 0.7 EU-15 4.7 1.3 0.8 -1.1 4.7 1.0 -0.9 -0.6 -0.7 0.5 -0.4 1.0 0.7 Cyprus : : 2.2 4.8 6.3 3.1 3.9 0.0 0.5 1.5 2.0 1.5 2.0 Czech Republic : : 2.9 0.5 2.8 -0.8 -7.0 1.0 0.4 1.0 1.5 1.0 1.4 Estonia : : 5.8 0.6 8.1 10.2 -4.3 0.5 3.6 3.5 6.5 4.0 10.2 Hungary : : 12.1 3.8 9.8 2.2 -5.0 5.0 -0.6 5.5 2.4 4.0 2.4 Latvia : : 0.5 -3.7 -1.2 2.6 2.8 2.1 8.0 3.0 5.0 3.0 3.0 Lithuania : : 3.0 0.6 12.0 -3.1 -6.3 -3.9 -1.3 1.9 0.9 2.5 1.9 Malta : : 4.8 1.1 20.0 -13.1 0.5 1.1 1.1 1.3 1.3 1.3 1.3 Poland : : 7.1 5.7 -2.4 1.3 4.8 7.7 6.6 1.0 3.5 0.7 0.5 Slovakia : : 4.6 5.6 12.0 5.3 1.0 -2.1 -3.7 0.4 -2.9 1.8 -1.8 Slovenia : 57.1 6.3 1.5 10.9 8.0 3.7 2.4 1.9 1.9 4.2 1.9 3.7 AC-10 : : 6.4 3.2 4.8 1.7 -1.3 3.3 1.9 2.1 2.1 1.9 1.4 EU-25 : : 1.2 -0.8 4.7 1.0 -0.9 -0.4 -0.5 0.6 -0.2 1.1 0.7 USA 3.9 0.2 -1.8 -1.4 1.1 -0.7 -0.7 2.1 2.1 1.4 2.4 1.6 3.8 Japan : : : : : : : -1.8 -4.5 -1.7 -2.5 -1.5 -0.4
TABLE 20 : Price deflator of imports of goods in national currency (percentage change on preceding year, 1961-2005)long-term 2003 2004 2005
average 5-year average estimate of forecast of forecast of1961-90 1991-95 1996-00 1999 2000 2001 2002 X-2003 III-2004 X-2003 III-2004 X-2003 III-2004
Belgium 4.3 -0.7 3.9 0.8 12.6 1.8 -2.4 -1.5 -1.5 1.2 0.5 1.4 1.0 Germany 2.2 -0.1 1.4 -1.5 8.9 0.8 -2.3 -2.4 -2.5 -1.1 -1.8 1.8 0.5 Greece 10.6 8.5 4.7 1.8 10.5 1.7 0.6 0.5 1.0 0.3 -1.8 0.9 0.7 Spain : 2.3 2.7 0.4 10.4 -0.2 -1.5 -0.3 -0.4 0.6 -0.2 1.2 0.8 France 5.6 -1.7 1.4 -1.7 7.9 -1.4 -3.5 -0.2 -1.1 -0.1 -1.0 0.5 0.3 Ireland 7.2 2.4 1.5 3.0 8.4 3.0 -4.0 -7.3 -6.2 0.3 -1.9 1.1 1.2 Italy 7.8 4.9 2.1 -0.9 16.4 2.4 -0.2 0.2 0.0 -0.3 -1.6 0.8 0.7 Luxembourg : 0.4 1.0 -1.3 6.0 0.8 1.3 -1.6 -1.1 -0.6 0.1 0.7 0.6 Netherlands 2.8 -1.2 2.2 0.5 9.5 -0.2 -1.2 -3.2 -1.6 -0.1 -1.8 0.9 0.5 Austria : 0.1 1.2 -0.1 3.5 -0.7 -2.8 -1.0 -1.2 0.7 -1.9 1.1 0.8 Portugal : 0.3 : : : : : -1.5 -1.0 0.2 -1.1 0.5 0.5 Finland : 3.7 -0.1 -1.7 6.4 -3.7 -2.7 -0.4 -0.1 0.6 -0.4 1.0 0.1 Euro area 4.7 0.6 1.9 -0.6 9.9 0.4 -2.1 -1.5 -1.4 -0.2 -1.2 1.1 0.6 Denmark : 0.5 -0.8 -3.8 3.9 -1.3 -1.1 -0.3 -1.9 0.4 -1.0 1.0 0.9 Sweden : 3.5 0.0 0.8 4.9 3.5 -0.3 -2.1 -2.5 -0.1 -1.0 0.9 0.8 United Kingdom 6.8 3.4 -2.6 -1.5 3.5 -1.0 -2.9 0.9 -0.6 1.0 -0.7 0.8 1.0 EU-15 5.1 1.0 1.2 -0.8 8.7 0.3 -2.1 -1.1 -1.4 0.0 -1.1 1.1 0.7 Cyprus : : 2.9 1.4 11.3 -0.5 2.1 1.0 0.0 -1.0 2.1 -1.0 2.0 Czech Republic : : 2.3 1.0 6.0 -3.2 -8.3 2.0 -0.4 1.0 1.4 1.0 1.0 Estonia : : 5.9 -0.4 6.8 4.0 0.1 0.5 -0.8 1.5 0.1 2.0 -0.2 Hungary : : 13.3 5.5 12.9 2.5 -5.4 8.0 0.4 4.8 2.5 3.0 2.5 Latvia : : 4.3 -5.2 6.8 1.5 6.0 3.0 6.5 3.0 4.2 3.0 3.0 Lithuania : : -0.2 -3.7 3.8 -2.6 -4.7 -3.0 -2.9 2.4 1.1 2.7 2.3 Malta : : 5.2 1.0 16.7 -8.2 1.8 1.2 1.2 1.2 1.2 1.2 1.2 Poland : : 8.6 7.2 0.0 1.3 5.2 7.0 7.7 3.1 4.3 1.6 1.5 Slovakia : : 5.3 8.1 11.6 8.2 0.0 -3.6 -3.9 2.0 -1.1 2.2 -0.7 Slovenia : 55.0 6.2 0.9 14.7 5.8 1.7 3.3 2.1 1.9 3.9 1.9 3.1 AC-10 : : 6.8 4.2 6.8 1.1 -1.3 3.9 2.0 2.6 2.4 1.9 1.5 EU-25 : : 1.6 -0.4 8.6 0.3 -2.1 -0.7 -1.1 0.2 -0.9 1.1 0.7 USA 5.3 0.1 -1.6 0.1 4.8 -3.0 -1.7 3.2 2.9 2.0 3.5 1.6 2.9 Japan : : : : : : : -0.7 -1.5 -4.8 -3.1 -2.6 -1.5
122
AN
NE
X

TABLE 21 : Terms of trade of goods (percentage change on preceding year, 1961-2005) 29.03.2004
long-term 2003 2004 2005average 5-year average estimate of forecast of forecast of1961-90 1991-95 1996-00 1999 2000 2001 2002 X-2003 III-2004 X-2003 III-2004 X-2003 III-2004
Belgium -0.2 1.2 -0.8 -1.1 -2.3 0.0 1.0 0.5 0.5 -0.2 0.3 -0.2 -0.3 Germany 0.5 1.0 -0.7 0.5 -5.3 0.6 1.7 1.8 1.6 1.4 1.3 -0.6 0.2 Greece -0.5 0.2 0.2 -0.8 2.6 -1.2 1.4 0.3 0.2 0.5 0.8 0.0 0.2 Spain : 0.8 -0.4 -1.4 -1.7 2.2 1.5 1.0 0.5 0.5 0.6 0.1 0.1 France -0.5 0.2 -0.9 0.2 -5.3 1.1 1.1 -0.4 0.3 0.4 1.1 0.1 0.1 Ireland 0.1 -1.2 0.7 -0.5 -2.4 0.9 4.0 0.1 -1.2 0.4 0.4 0.4 0.5 Italy -0.3 0.5 -0.5 0.4 -7.5 0.8 1.5 0.5 0.7 1.5 0.4 0.5 0.8 Luxembourg : -0.8 -1.1 -2.1 -1.3 -1.2 -1.2 0.1 -0.2 0.0 0.0 -0.3 0.5 Netherlands -0.1 0.5 -0.4 -1.5 -0.3 1.3 -0.1 0.8 1.1 0.2 0.7 -0.1 -0.4 Austria : -0.1 -0.6 -0.4 -1.2 -0.2 2.0 -0.1 0.6 -0.4 0.6 -0.5 -0.2 Portugal : 1.2 : : : : : -0.5 -1.3 -0.1 0.6 0.0 -0.3 Finland : -0.1 -1.3 -3.9 -3.5 0.5 -2.5 -2.6 -3.8 -1.0 -0.7 -0.5 -0.9 Euro area -0.2 0.5 -0.7 -0.3 -4.2 0.8 1.2 0.5 0.5 0.7 0.8 -0.1 0.1 Denmark : 0.7 1.9 3.3 2.2 1.4 -0.1 0.5 2.3 0.3 1.0 -0.2 -0.7 Sweden : -0.2 -1.6 -2.9 -2.7 -1.2 -2.2 0.2 -0.1 -0.2 0.3 0.2 0.1 United Kingdom -0.1 -0.4 0.5 -0.3 -2.6 -0.5 2.8 1.1 2.0 0.0 1.2 0.5 -0.3 EU-15 -0.3 0.3 -0.4 -0.3 -3.7 0.7 1.3 0.5 0.7 0.5 0.8 0.0 0.0 Cyprus : : -0.6 3.3 -4.4 3.6 1.7 -1.0 0.5 2.5 -0.1 2.5 0.0 Czech Republic : : 0.6 -0.5 -3.0 2.5 1.4 -1.0 0.9 0.0 0.1 0.0 0.3 Estonia : : 0.0 0.9 1.3 6.0 -4.4 0.0 4.4 2.0 6.4 2.0 10.4 Hungary : : -1.1 -1.6 -2.7 -0.3 0.4 -2.8 -1.0 0.7 -0.1 1.0 -0.1 Latvia : : -3.7 1.6 -7.5 1.1 -3.0 -0.9 1.4 0.0 0.7 0.0 0.0 Lithuania : : 3.2 4.5 7.9 -0.5 -1.6 -0.9 1.6 -0.5 -0.2 -0.1 -0.4 Malta : : -0.4 0.1 2.8 -5.3 -1.3 -0.1 -0.1 0.1 0.1 0.1 0.1 Poland : : -1.3 -1.4 -2.5 0.0 -0.4 0.7 -1.0 -2.0 -0.8 -0.9 -1.0 Slovakia : : -0.6 -2.3 0.4 -2.7 1.0 1.6 0.2 -1.6 -1.8 -0.4 -1.1 Slovenia : 1.4 0.1 0.5 -3.3 2.1 2.0 -0.9 -0.2 0.0 0.3 0.0 0.6 AC-10 : : -0.4 -0.9 -1.8 0.5 0.0 -0.6 -0.2 -0.5 -0.3 0.1 -0.1 EU-25 : : -0.5 -0.4 -3.6 0.7 1.2 0.3 0.6 0.4 0.7 0.0 0.0 USA -1.3 0.2 -0.1 -1.5 -3.4 2.4 1.1 -1.1 -0.8 -0.6 -1.1 0.0 0.9 Japan : : : : : : : -1.1 -3.0 3.3 0.7 1.1 1.1
TABLE 22 : Compensation of employees per head (percentage change on preceding year, 1961-2005)long-term 2003 2004 2005
average 5-year average estimate of forecast of forecast of1961-90 1991-95 1996-00 1999 2000 2001 2002 X-2003 III-2004 X-2003 III-2004 X-2003 III-2004
Belgium 8.5 4.1 2.2 3.4 2.1 3.6 4.3 2.2 2.3 3.0 2.8 3.0 3.0 Germany 6.7 5.4 1.3 1.2 2.1 1.7 1.5 1.9 1.6 1.9 1.6 2.2 1.9 Greece 15.7 12.1 7.7 6.5 5.8 5.3 8.7 6.5 7.6 7.0 7.0 5.5 6.2 Spain 14.9 7.2 3.2 2.7 3.7 3.8 3.9 4.2 4.2 3.8 3.5 3.4 3.2 France 10.2 3.1 2.3 2.5 2.3 2.6 2.8 2.7 2.6 2.6 2.3 2.7 2.4 Ireland 12.4 4.5 5.2 5.2 8.1 9.0 5.2 5.1 5.1 5.0 5.0 4.8 4.2 Italy 13.6 5.3 2.8 2.6 3.1 3.2 2.5 3.0 3.8 3.0 3.2 2.7 2.9 Luxembourg 7.7 4.6 2.9 3.6 4.7 3.7 3.1 2.7 2.7 2.0 2.0 2.3 2.8 Netherlands 7.9 3.5 3.0 3.7 4.7 5.5 4.9 4.1 5.1 1.4 2.7 1.1 0.0 Austria 7.9 5.2 1.9 2.1 2.2 1.4 2.2 2.5 2.7 2.9 2.6 2.9 2.7 Portugal 17.0 12.3 5.9 5.4 6.7 5.7 4.0 2.7 3.3 2.3 2.3 2.5 2.7 Finland 11.5 3.2 2.9 2.2 3.7 4.7 1.9 3.1 3.3 3.0 3.3 3.1 3.4 Euro area 9.8 5.0 2.2 2.2 2.8 2.9 2.7 2.7 2.8 2.5 2.4 2.6 2.3 Denmark 9.8 3.0 3.6 3.7 3.7 5.0 3.6 3.7 3.6 3.5 3.5 3.6 3.5 Sweden 9.5 4.7 4.7 1.3 7.5 4.5 2.7 3.7 2.5 3.7 3.4 3.8 3.5 United Kingdom 10.4 5.1 4.6 4.4 5.6 5.1 3.5 4.3 4.3 4.4 5.0 4.4 5.0 EU-15 9.8 5.0 2.7 2.6 3.5 3.4 2.9 3.1 3.1 2.9 2.9 3.0 2.9 Cyprus : : 5.7 5.8 7.2 4.7 5.3 : 4.9 : 4.3 : 4.2 Czech Republic : : 8.3 6.8 3.0 9.2 6.4 6.5 4.0 6.3 4.0 6.3 4.0 Estonia : : 16.7 14.8 9.7 7.5 6.7 10.1 9.7 8.6 9.5 8.0 8.0 Hungary : : 15.1 5.3 15.6 15.6 11.3 12.9 12.9 8.0 8.0 6.7 6.7 Latvia : : 11.9 7.5 6.9 3.4 4.4 5.7 7.0 7.5 7.0 7.5 7.0 Lithuania : : 15.3 5.2 0.0 3.4 3.4 3.7 5.9 3.9 5.8 4.2 6.0 Malta : 8.3 4.6 6.7 2.1 6.5 2.3 1.4 1.4 2.1 1.3 2.0 1.4 Poland : : 17.4 23.2 1.8 13.3 4.2 3.2 1.5 3.4 3.0 4.9 4.5 Slovakia : : 11.0 7.5 12.8 6.3 10.1 7.5 6.3 8.1 6.5 6.1 6.0 Slovenia : : 11.3 9.3 15.1 11.6 10.5 7.6 7.5 7.0 6.5 6.5 6.3 AC-10 : : 14.1 14.0 6.3 11.5 6.0 5.9 4.7 5.4 4.8 5.7 5.2 EU-25 : : 3.2 3.9 3.4 4.0 3.1 3.1 3.2 3.0 3.0 3.1 3.0 USA 6.2 3.4 4.2 4.4 5.6 3.0 1.5 2.1 2.1 4.0 3.3 3.8 4.2 Japan 10.1 2.0 0.2 -1.1 0.2 -0.5 -2.1 0.6 -0.7 0.5 1.1 0.5 0.8
123
AN
NE
X

TABLE 23 : Real compensation of employees per head ¹ (percentage change on preceding year, 1961-2005) 29.03.2004
long-term 2003 2004 2005average 5-year average estimate of forecast of forecast of1961-90 1991-95 1996-00 1999 2000 2001 2002 X-2003 III-2004 X-2003 III-2004 X-2003 III-2004
Belgium 3.5 1.8 0.5 2.1 -0.2 1.1 2.5 0.6 0.5 1.6 1.3 1.3 1.3 Germany 3.2 2.0 0.0 0.9 0.6 0.2 0.2 0.8 0.6 0.2 0.3 1.0 0.8 Greece 3.7 -1.5 2.8 4.1 2.4 1.9 5.0 2.8 4.0 3.4 3.5 2.0 2.8 Spain 4.5 1.5 0.4 0.3 0.5 0.5 0.4 0.9 1.1 0.9 1.0 0.8 0.7 France 3.2 0.5 1.1 2.0 0.8 1.0 0.9 0.8 1.1 0.9 0.5 1.1 0.8 Ireland 3.5 1.8 1.9 2.0 3.9 4.5 -0.8 1.5 1.3 1.9 3.1 2.0 1.9 Italy 3.8 -0.5 0.1 0.4 0.2 0.4 -0.5 0.2 1.3 0.6 0.9 0.6 0.8 Luxembourg 3.0 1.3 1.3 2.1 2.1 0.4 0.8 0.6 0.6 0.2 0.3 0.7 1.1 Netherlands 3.3 0.9 0.9 1.9 1.4 0.7 1.7 2.0 3.0 0.0 1.7 0.1 -0.9 Austria 3.4 2.0 0.7 1.3 0.8 -0.7 1.1 1.1 0.9 1.2 1.2 1.5 1.4 Portugal 4.2 4.5 2.9 3.2 3.4 1.8 -0.2 -0.7 -0.1 -0.2 0.2 0.0 0.5 Finland 3.8 0.1 0.8 0.9 0.1 1.1 -1.2 1.4 1.6 1.8 2.7 1.4 1.7 Euro area 3.2 0.9 0.3 1.1 0.6 0.5 0.4 0.6 0.9 0.5 0.6 0.8 0.7 Denmark 2.3 0.6 1.4 1.3 1.1 2.4 1.5 1.5 1.7 1.7 1.7 1.6 1.7 Sweden 2.1 -0.1 3.4 0.2 6.1 2.1 0.9 1.7 0.0 2.2 2.3 2.2 1.9 United Kingdom 2.5 0.8 2.3 2.6 4.4 2.8 2.2 3.1 2.8 3.1 3.1 3.1 3.0 EU-15 3.0 0.8 0.7 1.3 1.5 1.1 0.8 1.2 1.3 1.1 1.2 1.3 1.2 Cyprus : : : : : : : : 0.9 : 2.1 : 2.1 Czech Republic : : : : : : : 6.5 3.9 2.7 1.4 3.6 1.8 Estonia : : : : : : : 8.2 8.3 4.4 6.5 4.1 5.0 Hungary : : : : : : : 5.8 7.9 2.0 1.1 2.5 1.9 Latvia : : : : : : : 3.4 3.4 4.6 3.9 4.6 4.9 Lithuania : : : : : : : 4.6 7.0 1.6 4.8 1.6 3.7 Malta : : : : : : : 0.1 0.1 0.3 -1.4 0.1 -0.7 Poland : : 4.8 15.7 -6.6 6.4 2.6 2.4 0.7 1.5 0.4 2.1 1.2 Slovakia : : : : : : : 0.6 -1.3 0.5 -0.7 2.0 2.1 Slovenia : : : : : : : 1.6 2.0 1.7 2.6 2.1 3.1 AC-10 : : : : : : : 3.4 2.8 1.8 1.2 2.5 1.8 EU-25 : : : : : : : 1.2 1.4 1.1 1.1 1.4 1.2 USA 1.5 0.8 2.4 2.7 3.0 0.9 0.2 0.4 0.3 2.8 2.1 2.6 3.2 Japan 4.4 0.9 0.4 -0.4 1.5 1.1 -0.8 1.8 0.7 1.5 1.5 1.3 1.0¹ Deflated by the price deflator of private consumption.
TABLE 24 : Labour productivity (real GDP per occupied person) (percentage change on preceding year, 1961-2005)long-term 2003 2004 2005
average 5-year average estimate of forecast of forecast of1961-90 1991-95 1996-00 1999 2000 2001 2002 X-2003 III-2004 X-2003 III-2004 X-2003 III-2004
Belgium 3.2 1.1 1.4 1.8 1.9 -0.8 1.0 1.0 1.5 1.3 1.6 1.3 1.5 Germany 2.7 2.1 1.1 0.8 1.1 0.4 0.8 1.6 1.0 1.9 1.6 1.1 1.1 Greece 4.2 0.7 2.5 3.3 4.2 4.4 3.8 3.0 1.9 3.3 2.3 2.9 2.2 Spain 4.2 1.9 0.7 0.5 0.6 0.4 0.5 0.6 0.6 0.9 0.6 1.1 0.9 France 3.3 1.5 1.5 1.3 1.1 0.3 0.5 0.3 0.1 1.8 1.7 1.7 1.8 Ireland 3.9 2.9 3.9 5.0 5.2 3.1 5.5 0.7 -0.5 2.7 2.9 3.5 3.2 Italy 3.5 2.1 1.1 1.1 1.3 0.1 -0.9 -0.5 -0.2 1.0 0.9 1.2 1.4 Luxembourg 2.5 1.3 2.8 2.7 3.3 -4.2 -1.8 -0.5 -0.2 1.0 1.4 1.7 2.0 Netherlands 2.7 1.3 1.2 1.6 1.6 -0.1 0.0 0.2 0.2 1.5 2.3 1.7 1.1 Austria 3.5 2.1 1.9 1.5 2.4 0.1 1.4 0.8 0.5 1.6 1.4 1.9 1.8 Portugal 4.7 2.3 1.8 1.9 1.2 0.4 0.1 0.2 -0.5 1.1 0.6 1.5 1.4 Finland 3.5 2.9 2.4 0.8 2.8 -0.4 1.3 1.7 2.2 2.3 2.5 2.3 2.3 Euro area 3.2 1.7 1.1 1.0 1.3 0.3 0.3 0.6 0.4 1.5 1.4 1.4 1.4 Denmark 2.1 2.0 1.6 1.4 2.3 1.2 1.6 1.5 1.3 1.6 2.0 1.8 1.6 Sweden 2.2 2.9 2.5 2.4 1.9 -1.0 1.9 1.6 1.9 2.2 2.8 2.4 2.2 United Kingdom 2.1 2.7 1.6 1.3 2.4 1.4 0.9 1.4 1.3 2.3 2.6 2.4 2.4 EU-15 2.9 1.9 1.3 1.1 1.5 0.4 0.5 0.8 0.6 1.7 1.6 1.6 1.6 Cyprus : : 6.6 3.4 2.1 2.1 0.6 1.5 1.5 2.8 2.7 3.2 3.2 Czech Republic : : 0.5 2.6 -4.4 1.6 1.2 2.7 3.7 2.6 3.3 3.2 3.6 Estonia : : 7.1 4.0 8.9 5.6 4.6 3.9 3.7 5.4 4.7 4.9 5.5 Hungary : : 2.9 1.0 4.2 3.4 2.8 2.4 2.4 2.4 2.6 2.4 2.7 Latvia : -6.5 5.9 4.7 10.1 5.6 4.4 5.4 6.7 4.7 5.7 5.1 5.6 Lithuania : -7.6 4.9 -1.3 8.0 11.0 2.7 5.0 7.3 4.3 5.5 4.4 5.3 Malta : : 3.8 4.5 4.0 -2.9 2.1 0.4 1.9 2.3 1.7 2.1 0.8 Poland : : 4.7 7.0 6.4 1.7 3.7 3.6 4.9 3.7 4.2 3.2 3.6 Slovakia : : 4.5 4.3 3.9 3.2 5.5 2.2 2.4 2.7 3.4 2.9 3.3 Slovenia : : 3.8 4.8 0.3 2.4 3.5 2.6 3.8 2.6 3.1 3.0 3.1 AC-10 : : 3.8 4.9 4.2 2.5 3.1 3.1 4.0 3.2 3.7 3.1 3.5 EU-25 : : 1.5 1.7 1.9 0.7 0.8 0.9 0.9 1.7 1.7 1.6 1.7 USA 1.5 1.3 2.1 2.6 1.8 0.8 2.5 2.0 2.2 3.4 3.3 2.7 2.5 Japan 5.1 0.8 1.4 0.9 3.0 1.0 1.1 2.1 2.9 1.5 3.0 1.4 2.0
124
AN
NE
X

TABLE 25 : Unit labour costs, whole economy ¹ (percentage change on preceding year, 1961-2005) 29.03.2004
long-term 2003 2004 2005average 5-year average estimate of forecast of forecast of1961-90 1991-95 1996-00 1999 2000 2001 2002 X-2003 III-2004 X-2003 III-2004 X-2003 III-2004
Belgium 5.1 3.0 0.7 1.6 0.2 4.5 3.2 1.1 0.7 1.7 1.1 1.7 1.5 Germany 3.9 3.3 0.2 0.3 1.0 1.3 0.7 0.3 0.6 0.0 0.0 1.0 0.8 Greece 11.0 11.3 5.1 3.1 1.6 0.9 4.7 3.4 5.6 3.5 4.6 2.5 3.9 Spain 10.2 5.2 2.5 2.1 3.1 3.4 3.3 3.5 3.6 2.9 2.9 2.2 2.2 France 6.6 1.5 0.8 1.1 1.2 2.3 2.3 2.4 2.5 0.8 0.6 1.0 0.6 Ireland 8.2 1.6 1.3 0.2 2.8 5.7 -0.3 4.3 5.7 2.2 2.1 1.2 0.9 Italy 9.8 3.1 1.7 1.5 1.8 3.1 3.5 3.5 4.0 2.0 2.3 1.5 1.5 Luxembourg 5.1 3.2 0.1 0.9 1.4 8.2 5.1 3.2 2.9 1.0 0.6 0.6 0.8 Netherlands 5.1 2.2 1.9 2.1 3.1 5.5 4.9 3.9 4.9 -0.1 0.4 -0.6 -1.1 Austria 4.3 3.0 0.0 0.6 -0.2 1.3 0.8 1.7 2.3 1.3 1.2 0.9 0.9 Portugal 11.8 9.8 4.0 3.4 5.5 5.3 3.8 2.5 3.8 1.3 1.6 1.0 1.2 Finland 7.8 0.3 0.5 1.3 0.9 5.1 0.6 1.4 1.1 0.7 0.8 0.7 1.1 Euro area 6.4 3.2 1.0 1.2 1.4 2.6 2.4 2.1 2.4 1.0 1.0 1.1 1.0 Denmark 7.6 1.0 2.0 2.3 1.4 3.7 2.0 2.2 2.2 1.9 1.5 1.7 1.9 Sweden 7.1 1.8 2.2 -1.1 5.5 5.5 0.8 2.1 0.6 1.5 0.6 1.4 1.3 United Kingdom 8.2 2.3 3.0 3.1 3.2 3.6 2.6 2.9 3.0 2.0 2.3 1.9 2.5 EU-15 6.7 3.0 1.4 1.5 1.9 3.0 2.4 2.3 2.4 1.2 1.3 1.3 1.3 Cyprus : : -0.8 2.3 4.9 2.5 4.7 : 3.4 : 1.6 : 1.0 Czech Republic : : 7.8 4.0 7.8 7.5 5.2 3.7 0.3 3.6 0.6 3.1 0.4 Estonia : : 8.9 10.4 0.8 1.9 2.0 6.0 5.8 3.0 4.6 3.0 2.4 Hungary : : 11.8 4.3 10.9 11.7 8.3 10.3 10.3 5.5 5.3 4.1 3.8 Latvia : : 5.7 2.7 -2.9 -2.1 0.0 0.3 0.3 2.7 1.2 2.2 1.3 Lithuania : : 9.9 6.6 -7.4 -6.8 0.7 -1.3 -1.3 -0.4 0.3 -0.2 0.7 Malta : : 0.9 2.1 -1.8 9.6 0.2 0.9 -0.5 -0.2 -0.4 -0.1 0.6 Poland : : 12.1 15.1 -4.4 11.5 0.5 -0.4 -3.2 -0.3 -1.1 1.6 0.9 Slovakia : : 6.2 3.1 8.5 3.0 4.4 5.2 3.8 5.2 3.0 3.1 2.6 Slovenia : : 7.2 4.3 14.7 9.0 6.8 4.8 3.6 4.3 3.3 3.4 3.1 AC-10 : : 10.0 8.7 2.1 8.7 2.8 2.7 0.7 2.1 1.1 2.5 1.6 EU-25 : : 1.7 2.2 1.5 3.3 2.4 2.2 2.3 1.3 1.3 1.4 1.3 USA 4.6 2.0 2.0 1.8 3.7 2.2 -1.0 0.1 -0.1 0.6 0.0 1.1 1.6 Japan 4.8 1.2 -1.2 -2.0 -2.7 -1.5 -3.1 -1.4 -3.4 -1.0 -1.8 -0.9 -1.1¹ Compensation of employees per head divided by labour productivity per head, defined as GDP in volume divided by total employment.
TABLE 26 : Real unit labour costs ¹ (percentage change on preceding year, 1961-2005)long-term 2003 2004 2005
average 5-year average estimate of forecast of forecast of1961-90 1991-95 1996-00 1999 2000 2001 2002 X-2003 III-2004 X-2003 III-2004 X-2003 III-2004
Belgium 0.2 0.2 -0.6 0.2 -1.0 2.6 1.5 -0.3 -1.3 0.6 -0.5 0.3 -0.1 Germany 0.0 -0.1 -0.4 -0.2 1.2 0.0 -0.8 -0.9 -0.4 -1.3 -1.1 0.1 -0.1 Greece -1.1 -2.3 0.0 0.1 -1.7 -2.5 0.8 -0.7 1.9 -0.7 0.7 -0.9 0.7 Spain -0.1 -0.2 -0.4 -0.6 -0.4 -0.7 -1.0 -0.6 -0.5 -0.6 -0.8 -0.8 -1.0 France -0.1 -0.6 -0.3 0.6 0.2 0.6 0.5 0.7 0.8 -0.9 -1.0 -0.5 -1.0 Ireland -0.4 -1.3 -2.7 -3.5 -1.4 0.6 -5.5 2.8 3.7 -1.0 0.1 -1.5 -1.5 Italy -0.1 -1.7 -1.1 -0.1 -0.4 0.4 0.4 0.5 1.0 -0.5 -0.1 -0.6 -0.5 Luxembourg 0.2 -0.2 -2.6 -1.3 -2.5 5.9 4.5 1.3 0.7 -1.6 -1.5 -1.9 -1.3 Netherlands 0.2 0.0 -0.2 0.5 -0.8 0.1 1.4 1.1 1.9 -1.6 -0.8 -1.5 -1.4 Austria -0.3 -0.1 -1.0 -0.1 -1.6 -0.7 -0.5 0.4 0.3 0.1 -0.3 -0.1 -0.3 Portugal -0.1 1.8 0.5 0.3 1.9 0.8 -1.2 -0.9 1.4 -1.2 -0.7 -1.4 -0.9 Finland -0.2 -2.1 -1.1 1.5 -2.2 2.1 -0.3 0.3 0.4 -0.1 0.4 -0.8 -0.2 Euro area -0.2 -0.4 -0.6 0.1 0.0 0.2 -0.1 -0.1 0.3 -1.0 -0.8 -0.5 -0.6 Denmark 0.1 -1.1 -0.1 0.4 -1.6 1.6 0.4 0.0 0.1 0.1 -0.6 -0.2 -0.1 Sweden 0.0 -1.9 1.0 -1.7 4.1 3.2 -0.7 0.1 -1.6 -0.5 -1.2 -0.6 -0.8 United Kingdom 0.1 -1.2 0.4 0.8 1.7 1.3 -0.7 0.5 -0.1 0.1 -0.5 -0.1 -0.1 EU-15 -0.2 -0.6 -0.3 0.2 0.4 0.6 -0.2 0.1 0.2 -0.7 -0.7 -0.4 -0.5 Cyprus : : -3.4 0.1 0.4 0.3 1.9 : -0.9 : -0.9 : -1.3 Czech Republic : : -0.1 1.1 -1.4 2.4 3.5 1.6 -2.5 0.9 -2.4 0.4 -2.5 Estonia : : -1.8 5.7 -5.6 -3.2 -2.1 3.2 3.0 -1.4 0.9 -1.8 -1.2 Hungary : : -1.9 -3.8 0.9 2.9 -0.6 4.1 4.7 -1.8 -1.1 -2.2 -1.4 Latvia : : -1.7 -2.5 -7.2 -4.6 -1.7 -1.6 -2.1 0.1 -0.8 -0.7 -0.5 Lithuania : : 1.8 6.9 -8.2 -6.6 0.7 -0.5 -0.2 -2.7 -1.1 -2.8 -1.7 Malta : : -0.9 -0.6 -2.7 3.6 -0.8 -4.4 -4.8 -0.1 -1.5 -0.3 -0.9 Poland : : 0.7 8.3 -10.4 7.2 -0.7 -1.1 -3.9 -1.8 -3.1 -0.7 -1.7 Slovakia : : 0.0 -3.1 0.1 -1.1 0.4 -1.5 -0.9 0.1 -2.3 -0.2 0.1 Slovenia : : -0.6 -1.5 8.6 -0.1 -1.2 -1.4 -1.4 -1.2 -0.2 -1.5 -0.4 AC-10 : : -0.1 2.8 -4.8 3.6 -0.1 0.0 -1.7 -1.2 -2.1 -0.9 -1.5 EU-25 : : -0.3 0.7 -0.1 0.8 -0.2 0.0 0.0 -0.7 -0.8 -0.4 -0.5 USA 0.0 -0.4 0.4 0.3 1.5 -0.2 -2.5 -1.3 -1.7 -0.4 -1.0 0.0 0.7 Japan -0.4 0.3 -0.4 -0.6 -0.7 0.0 -2.0 0.8 -1.0 0.3 -0.8 0.1 -0.7¹ Nominal unit labour costs divided by GDP price deflator.
125
AN
NE
X
TABLE 27 : Total population (percentage change on preceding year, 1961-2005) 29.03.2004
long-term 2003 2004 2005average 5-year average estimate of forecast of forecast of1961-90 1991-95 1996-00 1999 2000 2001 2002 X-2003 III-2004 X-2003 III-2004 X-2003 III-2004
Belgium 0.3 0.3 0.2 0.2 0.2 0.3 0.5 0.3 0.3 0.2 0.2 0.2 0.2 Germany 0.4 0.7 0.1 0.1 0.1 0.2 0.2 0.1 0.0 0.1 0.1 0.1 0.1 Greece 0.7 0.9 0.5 0.4 0.3 0.2 0.1 0.2 0.6 0.2 0.2 0.2 0.2 Spain 0.8 0.2 0.4 0.4 0.8 0.8 0.7 0.6 0.6 0.6 0.6 0.5 0.5 France 0.7 0.4 0.4 0.4 0.5 0.5 0.5 0.4 0.4 0.3 0.3 0.3 0.3 Ireland 0.7 0.5 1.1 1.1 1.2 1.4 1.5 1.2 1.6 1.1 1.1 1.0 0.9 Italy 0.4 0.2 0.2 0.1 0.2 0.3 0.2 0.2 0.2 0.2 0.2 0.2 0.2 Luxembourg 0.7 1.4 1.4 1.4 1.4 0.7 1.1 1.0 1.0 0.9 1.0 0.9 0.9 Netherlands 0.9 0.7 0.6 0.7 0.7 0.8 0.7 0.6 0.6 0.5 0.5 0.4 0.3 Austria 0.3 0.7 0.2 0.2 0.2 0.2 0.3 0.2 0.3 0.3 0.3 0.3 0.3 Portugal 0.4 0.2 0.4 0.4 0.5 0.7 0.7 0.7 0.7 0.6 0.6 0.7 0.6 Finland 0.4 0.5 0.3 0.2 0.2 0.2 0.3 0.1 0.2 0.1 0.2 0.1 0.2 Euro area 0.6 0.4 0.3 0.3 0.4 0.4 0.4 0.3 0.3 0.3 0.3 0.3 0.3 Denmark 0.4 0.3 0.4 0.3 0.3 0.4 0.4 0.3 0.3 0.3 0.0 0.3 0.1 Sweden 0.5 0.6 0.1 0.1 0.2 0.3 0.3 0.4 0.4 0.4 0.4 0.5 0.5 United Kingdom 0.3 0.2 0.2 0.3 0.3 0.7 0.3 0.3 0.3 0.3 0.3 0.3 0.3 EU-15 0.5 0.4 0.3 0.3 0.3 0.5 0.4 0.3 0.3 0.3 0.3 0.3 0.3 Cyprus : 2.3 1.3 1.1 1.1 1.1 1.3 0.6 0.6 0.6 0.6 0.6 0.6 Czech Republic 0.2 -0.1 -0.1 -0.1 -0.1 -0.5 -0.2 0.1 -0.1 0.0 0.0 0.0 -0.1 Estonia 0.8 -1.8 -1.0 -1.2 -0.4 -0.4 -0.4 -0.4 -0.2 -0.3 -0.2 -0.3 -0.2 Hungary 0.1 -0.1 -0.2 -0.3 -0.3 -0.2 -0.3 -0.4 -0.4 -0.4 -0.4 -0.2 -0.3 Latvia 0.8 -1.4 -0.9 -0.8 -0.7 -0.8 -0.7 -0.3 -0.3 -0.2 -0.2 -0.2 -0.2 Lithuania 1.0 -0.4 -0.7 -0.7 -0.7 -0.5 -0.4 -0.2 -0.2 -0.3 -0.3 -0.3 -0.3 Malta 0.3 1.0 0.6 0.6 0.6 0.8 0.7 0.5 0.5 0.5 0.5 0.5 0.5 Poland 0.9 0.2 0.0 0.0 0.0 -1.0 0.0 0.0 0.0 0.0 0.0 0.0 0.0 Slovakia 0.9 0.3 0.1 0.1 0.1 0.0 -0.5 0.0 0.0 0.0 0.0 0.0 0.0 Slovenia 0.8 -0.1 0.0 0.1 0.3 0.1 0.2 0.0 0.1 0.0 0.0 0.0 0.0 AC-10 : 0.0 -0.1 -0.1 -0.1 -0.7 -0.2 -0.1 -0.1 -0.1 -0.1 0.0 -0.1 EU-25 : : 0.2 0.2 0.3 0.3 0.3 0.3 0.3 0.2 0.2 0.2 0.2 USA 1.1 1.3 1.2 1.2 1.2 1.2 1.0 0.9 1.0 0.9 1.0 0.9 1.0 Japan 0.9 0.3 0.2 0.2 0.2 0.2 0.1 0.1 0.1 0.1 0.1 0.1 0.1
TABLE 28 : Total employment (percentage change on preceding year, 1961-2005)long-term 2003 2004 2005
average 5-year average estimate of forecast of forecast of1961-90 1991-95 1996-00 1999 2000 2001 2002 X-2003 III-2004 X-2003 III-2004 X-2003 III-2004
Belgium 0.3 0.5 1.3 1.4 1.9 1.5 -0.3 -0.2 -0.5 0.5 0.3 1.0 1.0 Germany 0.5 0.0 0.7 1.2 1.8 0.4 -0.6 -1.5 -1.1 -0.3 -0.1 0.7 0.7 Greece 0.3 0.6 1.0 0.1 0.3 -0.3 0.1 1.0 2.2 0.8 1.7 0.5 1.0 Spain 0.3 -0.4 3.1 3.7 3.6 2.4 1.5 1.7 1.8 2.0 2.1 2.1 2.3 France 0.4 -0.4 1.2 1.8 2.7 1.8 0.7 -0.2 0.0 -0.1 0.1 0.6 0.7 Ireland 0.2 1.7 5.7 6.0 4.7 3.0 1.3 0.8 1.8 1.0 0.8 1.3 1.3 Italy 0.4 -0.8 0.8 0.6 1.7 1.6 1.3 0.8 0.4 0.5 0.3 0.7 0.7 Luxembourg 1.2 2.6 4.2 5.0 5.6 5.6 3.2 1.7 2.0 0.9 0.9 1.2 1.2 Netherlands 0.7 0.8 2.6 2.3 1.8 1.3 0.2 -1.1 -1.0 -0.8 -1.3 0.3 0.5 Austria 0.1 0.0 0.8 1.1 1.0 0.6 0.0 0.1 0.3 0.3 0.4 0.5 0.7 Portugal 0.1 -0.6 2.0 1.9 2.1 1.3 0.3 -1.0 -0.8 -0.1 0.2 0.5 0.7 Finland 0.4 -3.7 2.3 2.5 2.3 1.5 0.9 -0.2 -0.3 0.2 0.1 0.4 0.5 Euro area 0.4 -0.1 1.4 1.8 2.2 1.4 0.6 -0.2 0.0 0.3 0.3 0.8 0.9 Denmark 0.6 0.0 1.1 1.2 0.5 0.4 -0.6 -0.6 -1.3 0.4 0.1 0.4 0.6 Sweden 0.7 -2.1 0.8 2.1 2.4 1.9 0.2 -0.2 -0.2 0.0 -0.4 0.2 0.4 United Kingdom 0.4 -1.0 1.5 1.5 1.4 0.7 0.7 0.7 0.9 0.5 0.4 0.5 0.3 EU-15 0.4 -0.4 1.4 1.7 2.0 1.3 0.6 0.0 0.1 0.3 0.3 0.8 0.8 Cyprus : : -2.7 1.3 2.8 1.9 1.4 0.5 0.5 0.6 0.7 1.0 0.9 Czech Republic : : 0.7 -2.1 8.1 1.4 0.8 -0.5 -0.7 0.0 -0.4 0.1 -0.2 Estonia : -5.3 -2.0 -4.4 -1.5 0.9 1.3 0.5 1.0 0.2 0.6 0.2 0.4 Hungary : : 1.1 3.2 1.0 0.4 0.7 0.5 0.5 0.8 0.6 1.0 0.7 Latvia : -7.2 -0.5 -1.8 -2.9 2.2 1.6 0.5 0.7 0.5 0.5 0.5 0.5 Lithuania : -2.4 -0.7 -0.5 -3.7 -4.0 4.0 1.5 1.5 1.3 1.3 1.6 1.2 Malta : 1.5 0.8 -0.4 2.3 1.8 -0.3 0.4 -1.4 0.4 -0.2 0.8 1.1 Poland : : 0.4 -2.7 -2.3 -0.6 -2.2 -0.3 -1.1 0.5 0.4 1.5 1.1 Slovakia : : -0.8 -2.7 -1.8 0.6 -1.1 1.6 1.8 1.3 0.6 1.3 0.7 Slovenia : : 0.5 1.1 3.8 0.5 -0.5 -0.5 -1.4 0.5 0.1 0.7 0.4 AC-10 : : 0.3 -1.6 -0.1 -0.1 -0.7 0.0 -0.4 0.6 0.3 1.1 0.8 EU-25 : : 1.2 1.2 1.7 1.1 0.4 0.0 0.0 0.3 0.3 0.8 0.8 USA 2.0 1.1 2.0 1.9 1.9 -0.3 -0.3 0.8 0.9 0.4 0.9 0.6 0.6 Japan 1.0 0.8 0.0 -0.8 -0.1 -0.6 -1.4 0.5 -0.2 0.2 0.4 0.1 0.3
126
AN
NE
X

TABLE 29 : Number of unemployed (as a percentage of civilian labour force, 1964-2005) ¹ 29.03.2004
long-term 2003 2004 2005average 5-year average estimate of forecast of forecast of1964-90 1991-95 1996-00 1999 2000 2001 2002 X-2003 III-2004 X-2003 III-2004 X-2003 III-2004
Belgium 5.7 8.3 8.7 8.6 6.9 6.7 7.3 8.2 8.1 8.3 8.3 7.8 7.9 Germany 3.2 7.1 8.7 8.4 7.8 7.8 8.6 9.4 9.3 9.6 9.1 9.5 8.8 Greece 4.5 8.3 10.6 11.8 11.0 10.4 10.0 9.5 9.3 9.2 8.4 9.0 8.0 Spain 6.8 17.1 14.9 12.8 11.3 10.6 11.3 11.3 11.3 10.9 10.9 10.4 10.5 France 5.4 10.7 11.0 10.7 9.3 8.5 8.8 9.4 9.4 9.7 9.6 9.4 9.4 Ireland 9.7 14.5 7.8 5.6 4.3 3.9 4.3 4.8 4.6 5.1 5.0 5.0 4.9 Italy 6.7 10.0 11.3 11.3 10.4 9.4 9.0 8.8 8.7 8.8 8.6 8.7 8.5 Luxembourg 1.1 2.5 2.6 2.4 2.3 2.1 2.8 3.7 3.7 4.2 4.7 4.5 5.0 Netherlands 4.9 6.1 4.2 3.2 2.9 2.5 2.7 4.4 3.8 5.8 5.3 6.1 6.0 Austria 2.1 3.7 4.2 3.9 3.7 3.6 4.3 4.5 4.4 4.6 4.5 4.1 4.3 Portugal 5.2 5.7 5.6 4.5 4.1 4.1 5.1 6.6 6.4 7.2 6.8 7.3 6.7 Finland 3.9 13.3 11.7 10.2 9.8 9.1 9.1 9.3 9.0 9.2 8.9 9.1 8.6 Euro area 5.1 9.6 9.9 9.4 8.5 8.0 8.4 8.9 8.8 9.1 8.8 8.9 8.6 Denmark 4.1 8.1 5.1 4.8 4.4 4.3 4.6 5.5 5.6 5.2 5.8 4.9 5.3 Sweden 2.2 7.2 8.0 6.7 5.6 4.9 4.9 5.7 5.6 5.8 6.1 5.7 5.8 United Kingdom 5.4 9.2 6.5 5.9 5.4 5.0 5.1 4.9 5.0 4.9 5.0 4.9 5.0 EU-15 5.1 9.5 9.2 8.7 7.8 7.4 7.7 8.1 8.0 8.2 8.1 8.1 7.9 Cyprus : : 5.0 5.3 5.2 4.4 3.9 3.9 4.4 3.7 4.1 3.7 4.0 Czech Republic : : 6.5 8.6 8.7 8.0 7.3 7.8 7.8 8.1 8.2 8.0 8.2 Estonia : 5.8 10.5 11.3 12.5 11.8 10.5 8.6 10.0 8.4 9.7 7.9 9.6 Hungary : : 8.0 6.9 6.3 5.6 5.6 5.6 5.8 5.6 5.7 5.5 5.6 Latvia : 9.8 15.6 14.0 13.7 12.9 12.6 12.4 10.5 12.0 10.3 11.5 10.1 Lithuania : 8.1 12.4 11.2 15.7 16.1 13.6 12.3 12.7 11.1 11.5 10.0 10.7 Malta : 5.7 7.0 7.7 7.0 6.7 7.5 7.0 8.2 6.8 8.6 6.7 8.1 Poland : : 12.6 13.4 16.4 18.5 19.8 20.6 19.8 20.9 19.6 20.3 19.3 Slovakia : : 14.5 16.7 18.7 19.4 18.7 17.7 17.1 17.1 16.5 16.5 15.9 Slovenia : : 7.0 7.2 6.6 5.8 6.1 6.4 6.5 6.1 6.4 6.0 6.2 AC-10 : : 11.0 11.8 13.6 14.5 14.8 15.1 14.3 15.2 14.1 14.8 13.8 EU-25 : : 9.2 8.7 7.9 7.5 7.9 : 9.0 : 9.0 : 8.8 USA 6.1 6.5 4.6 4.2 4.0 4.8 5.8 6.1 6.0 6.2 5.6 6.3 5.6 Japan 1.9 2.6 4.1 4.7 4.7 5.0 5.4 5.2 5.1 5.1 4.8 5.1 4.7¹ Series following Eurostat definition, based on the labour force survey.
TABLE 30 : Nominal bilateral exchange rates against Ecu/euro (1970-2005)long-term 2003 2004 2005
average 5-year average estimate of forecast of forecast of1970-90 1991-95 1996-00 1999 2000 2001 2002 X-2003 III-2004 X-2003 III-2004 X-2003 III-2004
Belgium 44.45 40.50 40.23 40.34 40.34 40.34 : : : : : : : Germany 2.64 1.96 1.95 1.96 1.96 1.96 : : : : : : : Greece 80.44 266.37 321.61 325.76 336.63 340.75 : : : : : : : Spain 102.29 146.41 165.32 166.39 166.39 166.39 : : : : : : : France 6.17 6.71 6.57 6.56 6.56 6.56 : : : : : : : Ireland 0.64 0.79 0.78 0.79 0.79 0.79 : : : : : : : Italy 1137.90 1803.04 1940.89 1936.27 1936.27 1936.27 : : : : : : : Luxembourg 44.45 40.50 40.23 40.34 40.34 40.34 : : : : : : : Netherlands 2.83 2.20 2.20 2.20 2.20 2.20 : : : : : : : Austria 18.83 13.80 13.73 13.76 13.76 13.76 : : : : : : : Portugal 84.58 186.94 199.40 200.48 200.48 200.48 : : : : : : : Finland 4.77 5.88 5.92 5.95 5.95 5.95 : : : : : : : Euro area : : : : : : : : : : : : : Denmark 7.65 7.64 7.45 7.44 7.45 7.45 7.43 7.44 7.43 7.46 7.46 7.46 7.46 Sweden 6.05 8.53 8.67 8.81 8.45 9.26 9.16 9.12 9.12 8.99 9.18 9.01 9.21 United Kingdom 0.59 0.76 0.69 0.66 0.61 0.62 0.63 0.69 0.69 0.70 0.68 0.71 0.69 EU-15 : : : : : : : : : : : : : Cyprus 0.48 0.58 0.58 0.58 0.57 0.58 0.58 0.58 0.58 0.58 0.59 0.58 0.59 Czech Republic : 34.89 35.78 36.88 35.60 34.07 30.80 31.81 31.84 32.03 32.91 32.29 33.32 Estonia : : 15.61 15.65 15.65 15.65 15.65 15.65 15.65 15.65 15.65 15.65 15.65 Hungary : 142.43 231.76 252.77 260.05 256.59 242.96 252.18 253.42 254.74 261.49 254.74 261.49 Latvia : : 0.64 0.62 0.56 0.56 0.58 0.64 0.64 0.65 0.67 0.65 0.67 Lithuania : : 4.41 4.26 3.70 3.58 3.46 3.45 3.45 3.45 3.45 3.45 3.45 Malta 0.43 0.43 0.43 0.43 0.40 0.40 0.41 0.43 0.43 0.43 0.43 0.43 0.43 Poland : 2.60 3.86 4.23 4.01 3.67 3.86 4.38 4.40 4.55 4.81 4.57 4.82 Slovakia : : 40.66 44.12 42.60 43.30 42.69 41.50 41.49 42.26 41.08 43.38 41.50 Slovenia : 115.11 187.96 194.47 206.61 217.98 225.98 233.71 233.82 241.00 240.32 247.82 248.44 AC-10 : : : : : : : : : : : : : EU-25 : : : : : : : : : : : : : USA 1.11 1.24 1.10 1.07 0.92 0.90 0.95 1.13 1.13 1.16 1.25 1.15 1.24 Japan 262.44 141.04 128.47 121.32 99.47 108.68 118.06 130.73 130.95 125.76 133.42 122.00 130.31
127
AN
NE
X

TABLE 31 : Nominal effective exchange rates to rest of a group ¹ of industrialised countries (percentage change on preceding year, 1970-2005) 29.03.2004
long-term 2003 2004 2005average 5-year average estimate of forecast of forecast of1970-90 1991-95 1996-00 1999 2000 2001 2002 X-2003 III-2004 X-2003 III-2004 X-2003 III-2004
Belgium 1.0 1.9 -2.2 -1.4 -3.6 0.6 1.0 3.8 3.9 0.4 1.2 -0.2 0.0 Germany 6.2 2.4 -2.9 -2.1 -4.9 0.6 1.5 5.5 5.5 0.6 2.1 -0.3 -0.1 Greece -4.6 -7.2 -3.5 -0.5 -6.4 -0.7 1.0 3.8 3.8 0.4 1.3 -0.2 0.0 Spain 0.8 -3.9 -1.8 -1.6 -3.5 0.4 1.1 4.1 4.1 0.5 1.4 -0.2 0.0 France -1.2 1.8 -1.9 -2.0 -4.5 0.5 1.4 5.1 5.2 0.5 1.8 -0.3 -0.1 Ireland -1.4 -0.6 -1.9 -3.1 -5.7 0.6 1.9 7.2 7.2 0.8 2.3 -0.3 0.0 Italy -3.3 -6.9 0.4 -2.3 -4.4 0.4 1.4 5.0 5.1 0.5 2.0 -0.3 -0.1 Luxembourg 1.0 1.9 -2.2 -1.4 -3.6 0.6 1.0 3.8 3.9 0.4 1.2 -0.2 0.0 Netherlands 0.9 2.0 -2.2 -1.3 -3.2 0.6 0.8 3.6 3.6 0.4 1.1 -0.2 0.0 Austria 1.9 1.7 -1.8 -1.2 -2.9 0.3 0.8 3.2 3.2 0.3 1.2 -0.2 -0.1 Portugal 0.5 -1.1 -1.5 -1.2 -2.9 0.4 0.8 3.4 3.4 0.4 1.1 -0.1 0.0 Finland -1.8 -2.7 -2.7 -2.1 -4.6 1.2 1.3 5.2 5.2 0.4 2.0 -0.3 -0.1 Euro area 3.5 -0.2 -4.6 -4.7 -10.2 1.2 3.1 11.7 11.8 1.2 4.2 -0.6 -0.2 Denmark 1.4 1.8 -1.9 -1.7 -4.5 1.5 1.2 4.3 4.4 -0.1 1.4 -0.3 -0.1 Sweden -0.1 -4.1 0.2 -1.8 -0.5 -8.3 2.1 6.1 6.1 2.0 1.8 -0.7 -0.5 United Kingdom -3.6 -3.0 4.6 -0.5 2.8 -1.7 0.7 -4.3 -4.0 -0.9 4.1 -0.7 -1.9 EU-15 1.6 -2.2 -3.7 -6.2 -11.3 -0.3 4.3 12.6 12.8 1.1 6.9 -1.1 -1.1 Cyprus : : 6.8 -0.9 -2.7 2.2 1.9 4.1 4.1 0.7 1.2 0.1 0.4 Czech Republic : : 0.4 -1.5 1.7 5.2 11.6 -0.1 -0.2 0.0 -1.9 -0.7 -1.0 Estonia : : -0.8 -0.2 -3.4 1.7 0.6 3.1 3.1 0.3 1.5 -0.1 0.1 Hungary : : -7.8 -4.8 -4.7 2.4 6.9 -0.4 -0.9 -0.4 -1.7 0.2 0.3 Latvia : : 4.2 4.5 7.5 1.0 -3.0 -5.8 -5.9 -1.2 -3.5 0.7 0.4 Lithuania : : 8.7 5.0 12.3 4.6 5.1 5.2 5.3 0.9 1.9 0.1 0.4 Malta : : -0.1 -1.4 -1.8 0.7 1.1 2.9 3.0 0.1 2.7 -0.3 -0.4 Poland : : -4.2 -8.5 3.3 10.3 -4.2 -9.7 -10.1 -3.4 -7.6 -0.4 0.0 Slovakia : : -0.7 -10.1 2.0 -1.6 1.6 5.7 5.8 -1.2 2.5 -2.4 -0.8 Slovenia : : -4.9 -4.3 -7.2 -4.3 -2.7 -0.6 -0.6 -2.5 -1.5 -2.6 -3.1 AC-10 : : -3.2 -5.3 0.0 4.6 3.2 -2.7 -2.9 -1.5 -3.2 -0.6 -0.5 EU-25 : : 1.7 -1.8 -8.0 4.2 6.0 12.2 12.5 1.5 6.6 -0.2 -0.2 USA -4.2 0.4 4.7 -0.6 4.6 5.1 -1.1 -8.9 -9.2 -2.9 -7.0 0.4 0.6 Japan 4.8 9.4 0.3 17.1 11.8 -9.3 -5.2 -0.2 -0.2 5.7 3.2 2.8 2.2¹ For Member States, EU-15, euro area, USA and Japan : 22 countries : EUR14 (excl. LU), CH, NR, US, CA, JP, AU, MX and NZ. For Acceding Countries, AC-10 and EU-25 : 35 countries (22 plus 13 candidates).
TABLE 32 : Relative unit labour costs, to rest of a group ¹ of industrialised countries (nat. curr.) (percentage change on preceding year, 1963-2005)long-term 2003 2004 2005
average 5-year average estimate of forecast of forecast of1963-90 1991-95 1996-00 1999 2000 2001 2002 X-2003 III-2004 X-2003 III-2004 X-2003 III-2004
Belgium -0.6 0.4 -0.6 0.3 -1.7 1.8 1.6 -0.4 -0.9 0.8 0.3 : 0.4 Germany -2.8 0.7 -1.3 -1.2 -1.1 -1.6 -0.8 -0.9 -0.7 -1.3 -1.1 : -0.7 Greece 5.5 8.4 3.9 1.9 -0.2 -1.7 3.1 1.9 4.1 2.5 3.6 : 2.5 Spain 3.9 2.1 0.9 0.6 0.9 0.6 1.5 1.9 1.8 1.9 1.9 : 1.0 France 0.3 -1.4 -0.7 -0.3 -0.9 -0.4 0.9 1.2 1.3 -0.4 -0.4 : -0.9 Ireland 1.5 -1.0 -0.3 -1.3 0.7 3.1 -1.5 3.2 4.6 1.2 1.2 : -0.5 Italy 4.2 0.3 0.4 0.2 -0.1 0.6 2.2 2.6 3.0 1.1 1.4 : 0.1 Luxembourg -0.6 0.4 -0.6 0.3 -1.7 1.8 1.6 -0.4 -0.9 0.8 0.3 : 0.4 Netherlands -0.9 -0.5 0.7 0.8 1.4 3.0 3.4 2.6 3.5 -1.1 -0.5 : -2.4 Austria -1.7 0.2 -1.1 -0.5 -1.8 -1.1 -0.6 1.0 1.4 0.4 0.3 : -0.5 Portugal 5.8 6.9 2.5 2.0 3.4 2.5 2.0 0.7 1.9 0.0 0.5 : -0.2 Finland 1.6 -2.1 -1.0 0.1 -1.2 2.4 -0.7 0.1 -0.1 -0.3 -0.1 : -0.2 Euro area -0.2 0.7 -0.9 -0.5 -1.1 0.2 1.8 2.1 2.7 -0.3 0.0 : -1.2 Denmark 1.2 -1.5 0.7 1.2 -0.7 0.9 0.7 0.9 1.0 0.9 0.7 : 0.6 Sweden 0.8 -0.6 0.7 -2.6 3.5 2.8 -0.6 0.8 -0.9 0.5 -0.2 : 0.0 United Kingdom 2.2 -0.2 1.7 1.9 1.1 1.1 1.5 1.9 1.9 1.2 1.7 : 1.3 EU-15 1.1 0.6 -0.1 0.0 -0.3 1.1 2.8 3.4 4.0 0.3 0.8 : -0.7 Cyprus : : : : : : : : : : : : : Czech Republic : : : : : : : : : : : : : Estonia : : : : : : : : : : : : : Hungary : : : : : : : : : : : : : Latvia : : : : : : : : : : : : : Lithuania : : : : : : : : : : : : : Malta : : : : : : : : : : : : : Poland : : : : : : : : : : : : : Slovakia : : : : : : : : : : : : : Slovenia : : : : : : : : : : : : : AC-10 : : : : : : : : : : : : : EU-25 : : : : : : : : : : : : : USA -2.3 -1.2 -0.2 -0.2 1.6 -0.7 -2.3 -1.6 -1.3 -0.5 -1.2 : 0.4 Japan -1.1 -1.2 -3.1 -3.7 -5.6 -4.0 -3.7 -2.3 -4.4 -2.0 -2.5 : -2.7¹ For Member States, EU-15, euro area, USA and Japan : 22 countries : EUR14 (excl. LU), CH, NR, US, CA, JP, AU, MX and NZ. For Acceding Countries, AC-10 and EU-25 : 35 countries (22 plus 13 candidates).
128
AN
NE
X

TABLE 33 : Real effective exchange rate : ulc relative to rest of a group ¹ of industrialised countries (usd) (% change on preceding year, 1963-2005) 29.03.2004
long-term 2003 2004 2005average 5-year average estimate of forecast of forecast of1963-90 1991-95 1996-00 1999 2000 2001 2002 X-2003 III-2004 X-2003 III-2004 X-2003 III-2004
Belgium 0.0 2.2 -2.8 -1.1 -5.2 2.4 2.6 3.4 2.9 1.2 1.5 : 0.4 Germany 0.3 3.1 -4.2 -3.3 -5.9 -1.0 0.6 4.5 4.7 -0.7 1.0 : -0.8 Greece -1.4 0.7 0.2 1.4 -6.7 -2.4 4.1 5.8 8.0 2.9 5.0 : 2.5 Spain 1.9 -1.9 -0.9 -1.0 -2.6 1.0 2.6 6.0 6.0 2.4 3.3 : 1.0 France -0.7 0.4 -2.6 -2.3 -5.4 0.1 2.3 6.4 6.5 0.2 1.4 : -1.0 Ireland 0.2 -1.6 -2.2 -4.3 -5.1 3.7 0.4 10.6 12.1 2.0 3.5 : -0.5 Italy 1.0 -6.6 0.8 -2.2 -4.5 1.0 3.7 7.7 8.2 1.6 3.4 : 0.0 Luxembourg 0.0 2.2 -2.8 -1.1 -5.2 2.4 2.6 3.4 2.9 1.2 1.5 : 0.4 Netherlands 0.7 1.5 -1.5 -0.5 -1.9 3.6 4.2 6.3 7.2 -0.7 0.6 : -2.4 Austria 0.3 1.9 -2.8 -1.6 -4.6 -0.8 0.2 4.2 4.6 0.7 1.6 : -0.6 Portugal -0.3 5.7 1.0 0.7 0.4 2.9 2.7 4.2 5.4 0.5 1.6 : -0.1 Finland 0.6 -4.8 -3.6 -2.0 -5.8 3.6 0.6 5.3 5.0 0.1 1.9 : -0.3 Euro area 0.6 0.5 -5.5 -5.2 -11.2 1.4 5.0 14.0 14.8 0.9 4.2 : -1.3 Denmark 1.3 0.2 -1.2 -0.5 -5.2 2.4 1.9 5.3 5.5 0.9 2.1 : 0.5 Sweden 0.0 -4.6 0.9 -4.3 3.0 -5.8 1.6 6.9 5.1 2.5 1.6 : -0.6 United Kingdom 0.0 -3.2 6.3 1.4 4.0 -0.6 2.2 -2.5 -2.2 0.3 5.9 : -0.6 EU-15 0.6 -1.7 -3.8 -6.2 -11.6 0.8 7.3 16.5 17.4 1.4 7.8 : -1.8 Cyprus : : : : : : : : : : : : : Czech Republic : : : : : : : : : : : : : Estonia : : : : : : : : : : : : : Hungary : : : : : : : : : : : : : Latvia : : : : : : : : : : : : : Lithuania : : : : : : : : : : : : : Malta : : : : : : : : : : : : : Poland : : : : : : : : : : : : : Slovakia : : : : : : : : : : : : : Slovenia : : : : : : : : : : : : : AC-10 : : : : : : : : : : : : : EU-25 : : : : : : : : : : : : : USA -1.7 -0.8 4.5 -0.8 6.2 4.4 -3.3 -10.4 -10.4 -3.4 -8.1 : 0.9 Japan 2.4 8.1 -2.8 12.7 5.6 -12.9 -8.7 -2.5 -4.6 3.6 0.5 : -0.6¹ For Member States, EU-15, euro area, USA and Japan : 22 countries : EUR14 (excl. LU), CH, NR, US, CA, JP, AU, MX and NZ. For Acceding Countries, AC-10 and EU-25 : 35 countries (22 plus 13 candidates).
TABLE 34 : Short term interest rates (1961-2003)long-term
average 5-year average1961-90 1991-95 1996-00 1994 1995 1996 1997 1998 1999 2000 2001 2002 2003
Belgium 7.9 7.4 3.5 5.6 4.7 3.2 3.4 3.5 3.0 4.4 4.3 3.3 2.3 Germany 6.2 7.1 3.5 5.3 4.5 3.3 3.3 3.5 3.0 4.4 4.3 3.3 2.3 Greece : 22.1 11.7 24.6 16.4 13.8 12.8 14.0 10.1 7.7 4.3 3.3 2.3 Spain : 11.1 4.9 8.0 9.4 7.5 5.4 4.3 3.0 4.4 4.3 3.3 2.3 France 8.3 8.2 3.7 5.9 6.6 3.9 3.5 3.6 3.0 4.4 4.3 3.3 2.3 Ireland : 8.8 4.9 5.9 6.3 5.4 6.1 5.5 3.0 4.4 4.3 3.3 2.3 Italy 10.0 11.0 5.5 8.5 10.3 8.7 6.8 4.9 3.0 4.4 4.3 3.3 2.3 Luxembourg 7.9 7.4 3.5 5.6 4.7 3.2 3.4 3.5 3.0 4.4 4.3 3.3 2.3 Netherlands 5.9 7.0 3.4 5.2 4.4 3.0 3.3 3.4 3.0 4.4 4.3 3.3 2.3 Austria : 7.0 3.6 5.0 4.5 3.3 3.5 3.6 3.0 4.4 4.3 3.3 2.3 Portugal : 13.6 5.0 11.1 9.8 7.4 5.7 4.3 3.0 4.4 4.3 3.3 2.3 Finland : 9.0 3.6 5.3 5.8 3.6 3.2 3.6 3.0 4.4 4.3 3.3 2.3 Euro area 8.0 9.1 4.3 6.9 7.0 5.2 4.5 4.2 3.1 4.5 4.3 3.3 2.3 Denmark 9.7 8.7 4.0 6.1 6.1 3.9 3.7 4.1 3.4 5.0 4.7 3.5 2.4 Sweden : 10.1 4.4 7.6 8.9 5.9 4.5 4.3 3.3 4.1 4.1 4.2 3.3 United Kingdom 9.7 7.9 6.4 5.5 6.7 6.0 6.8 7.3 5.5 6.2 5.0 4.1 3.8 EU-15 8.4 8.9 4.6 6.7 7.0 5.4 4.9 4.7 3.5 4.7 4.4 3.5 2.6 Cyprus : : : : : : : : 6.3 6.4 5.9 4.4 3.9 Czech Republic : : 10.9 9.1 11.0 12.0 16.0 14.3 6.9 5.4 5.2 3.5 2.3 Estonia : : 7.7 : : 7.1 7.6 12.5 6.6 4.7 4.5 3.4 2.9 Hungary : : 17.8 27.8 31.3 24.3 20.4 17.9 15.1 11.4 10.9 9.2 8.1 Latvia : : : : : : 6.0 6.9 7.5 4.0 6.1 3.3 3.0 Lithuania : : : : : : : : 13.9 8.6 5.9 3.7 2.9 Malta : : 5.1 : 4.8 5.0 5.1 5.4 5.2 4.9 4.9 4.0 3.3 Poland : : 19.8 : 27.6 21.4 23.7 20.4 14.7 18.8 16.1 9.0 5.7 Slovakia : : 15.8 : 8.4 11.9 21.8 21.1 15.7 8.6 7.8 7.8 6.2 Slovenia : : : : : : : 10.3 8.6 10.9 10.9 8.0 6.8 AC-10 : : : : : : : : 12.6 13.0 11.9 7.4 5.3 EU-25 : : : : : : : : 4.3 5.4 4.7 3.7 2.7 USA 6.6 4.6 5.7 4.7 6.0 5.5 5.7 5.5 5.4 6.5 3.8 1.8 1.2 Japan : 3.6 0.5 2.3 1.2 0.6 0.6 0.8 0.2 0.3 0.2 0.1 0.1
129
AN
NE
X

TABLE 35 : Long term interest rates (1961-2003) 29.03.2004
long-termaverage 5-year average1961-90 1991-95 1996-00 1994 1995 1996 1997 1998 1999 2000 2001 2002 2003
Belgium 8.5 8.1 5.5 7.8 7.5 6.5 5.8 4.8 4.8 5.6 5.1 5.0 4.1 Germany 7.4 7.3 5.2 6.9 6.9 6.2 5.6 4.6 4.5 5.3 4.8 4.8 4.1 Greece : : 9.1 20.7 17.0 14.5 9.9 8.5 6.3 6.1 5.3 5.1 4.2 Spain : 11.1 6.0 10.0 11.3 8.7 6.4 4.8 4.7 5.5 5.1 5.0 4.1 France 9.4 7.8 5.3 7.2 7.5 6.3 5.6 4.6 4.6 5.4 4.9 4.9 4.1 Ireland : 8.5 5.7 7.9 8.3 7.3 6.3 4.8 4.7 5.5 5.0 5.0 4.1 Italy 11.1 12.1 6.3 10.5 12.2 9.4 6.9 4.9 4.7 5.6 5.2 5.0 4.2 Luxembourg : 7.4 5.4 7.2 7.2 6.3 5.6 4.7 4.7 5.5 5.0 4.9 4.1 Netherlands 7.5 7.4 5.3 6.9 6.9 6.2 5.6 4.6 4.6 5.4 5.0 4.9 4.1 Austria : 7.6 5.4 7.0 7.1 6.3 5.7 4.7 4.7 5.6 5.1 5.0 4.1 Portugal : 11.8 6.0 10.5 11.5 8.6 6.4 4.9 4.8 5.6 5.2 5.0 4.2 Finland 9.9 10.1 5.6 9.0 8.8 7.1 6.0 4.8 4.7 5.5 5.0 5.0 4.1 Euro area 9.1 9.1 5.7 8.4 8.9 7.4 6.1 4.8 4.7 5.4 5.0 4.9 4.1 Denmark 12.0 8.3 5.8 7.8 8.3 7.2 6.3 4.9 4.9 5.6 5.1 5.1 4.3 Sweden 9.1 9.8 6.0 9.7 10.2 8.0 6.6 5.0 5.0 5.4 5.1 5.3 4.6 United Kingdom 10.2 8.6 6.2 8.2 8.3 7.9 7.1 5.6 5.0 5.3 5.0 4.9 4.5 EU-15 9.4 9.1 5.8 8.4 8.8 7.5 6.3 4.9 4.7 5.4 5.0 4.9 4.2 Cyprus : : : : : : 6.9 6.7 7.4 7.6 7.7 5.4 4.7 Czech Republic : : : : : : : : : 6.9 6.3 4.9 3.9 Estonia : : : : : : : : : : : : 4.3 Hungary : : : : : : : : 9.9 8.6 7.9 7.1 6.6 Latvia : : : : : : : : : : : : 4.9 Lithuania : : : : : : : : : : : 6.0 5.3 Malta : : : : : : : : : 5.8 6.1 5.7 5.0 Poland : : : : : : : : 9.5 11.8 10.7 7.3 5.6 Slovakia : : : : : : : : : 8.3 8.1 6.9 5.0 Slovenia : : : : : : : : : : : : 5.5 AC-10 : : : : : : : : : : : : 5.3 EU-25 : : : : : : : : : : : : 4.3 USA 7.4 7.0 6.0 7.2 6.7 6.5 6.5 5.3 5.6 6.0 5.0 4.6 4.0 Japan : 4.7 2.0 4.2 3.3 3.0 2.2 1.3 1.8 1.8 1.3 1.3 1.0
TABLE 36 : Total expenditure, general government (as a percentage of GDP, 1970-2005) ¹long-term 2003 2004 2005
average 5-year average estimate of forecast of forecast of1970-90 1991-95 1996-00 1999 2000 2001 2002 X-2003 III-2004 X-2003 III-2004 X-2003 III-2004
Belgium 53.0 54.1 50.9 50.1 49.3 49.5 50.5 51.1 51.5 50.8 49.9 50.1 49.4 Germany 44.8 48.2 48.6 48.7 45.7 48.3 48.5 49.1 48.9 48.4 48.0 47.6 47.1 Greece ² 33.2 47.6 48.4 47.6 49.8 47.8 46.7 46.3 47.1 45.7 47.2 45.1 46.9 Spain 31.6 45.4 41.4 40.2 40.0 39.6 39.9 39.8 39.5 39.7 39.6 39.7 39.5 France 45.3 53.0 54.1 53.5 52.7 52.6 53.5 54.7 54.7 54.3 54.4 54.1 54.1 Ireland 42.6 39.6 35.7 34.5 32.1 33.9 33.3 34.8 34.3 34.9 35.1 34.5 34.7 Italy 44.1 54.6 50.0 48.8 46.9 48.7 47.9 48.5 48.9 47.7 48.7 47.6 48.7 Luxembourg : : 42.1 41.3 38.5 39.1 44.3 48.0 47.3 48.6 48.8 48.8 49.1 Netherlands 51.4 53.0 47.5 46.9 45.3 46.6 47.8 48.5 48.8 48.2 48.6 47.5 48.1 Austria 46.2 53.3 54.2 54.1 52.3 51.7 51.2 51.2 51.0 50.9 50.7 50.0 49.7 Portugal 32.8 42.4 45.0 45.2 45.1 46.2 46.1 46.9 47.5 46.0 46.6 46.3 46.9 Finland 39.2 58.7 54.0 52.1 49.1 49.2 50.1 50.9 50.5 51.0 50.7 50.1 50.1 Euro area 44.2 50.8 49.4 48.9 47.1 48.2 48.4 49.0 49.0 48.4 48.6 48.0 48.1 Denmark 50.3 59.4 57.1 56.2 53.9 54.3 54.9 55.4 55.4 54.7 55.8 53.6 54.7 Sweden 54.9 64.9 61.3 60.2 57.3 57.2 58.1 59.0 58.8 58.7 58.9 57.8 58.3 United Kingdom 41.5 42.3 40.0 39.2 37.0 40.4 41.1 42.8 42.8 43.1 41.8 43.2 41.8 EU-15 44.3 50.2 48.4 47.7 45.7 47.2 47.5 48.4 48.4 48.0 47.8 47.6 47.4 Cyprus : : : : : : : 40.6 : 39.1 42.1 38.3 41.7 Czech Republic : : 50.6 50.1 47.3 50.6 52.0 50.8 57.9 50.6 50.9 49.3 49.2 Estonia : : : : 50.6 45.8 37.9 41.1 38.6 39.7 42.8 38.9 42.2 Hungary : : : : : : : 48.6 : 48.8 : 47.8 : Latvia : 38.0 46.5 50.2 45.2 42.4 44.6 46.0 43.3 43.8 41.8 38.2 40.4 Lithuania : : 40.3 43.7 39.0 35.7 35.2 37.8 35.6 38.7 37.4 38.6 37.3 Malta : : : : : : : 46.6 : 44.9 45.3 43.3 44.0 Poland : 49.6 43.6 42.6 42.0 44.8 44.9 45.6 45.1 48.1 46.8 46.7 45.7 Slovakia : : 60.8 56.9 59.9 51.5 50.9 38.5 52.7 37.3 46.1 37.1 47.0 Slovenia : : : : : : : 43.8 : 44.0 44.0 44.1 44.0 AC-10 : : : : : : : 46.0 : 46.8 : 45.6 : EU-25 : : : : : : : 48.3 : 47.9 : 47.5 : USA 34.1 36.2 33.4 32.7 32.5 33.5 34.1 35.1 34.4 34.8 34.0 34.8 34.1 Japan 28.6 33.3 38.9 39.0 39.6 39.2 39.8 40.2 39.2 40.1 38.4 40.2 38.0¹ ESA 79 up to 1994, ESA 95 from 1995 onwards. Total expenditure includes one-off proceeds relative to UMTS licences (see note 10 on concepts and sources).² Current expenditure, gross fixed capital formation and net capital transfers.
130
AN
NE
X

TABLE 37 : Total revenue, general government (as a percentage of GDP, 1970-2005) ¹ 29.03.2004
long-term 2003 2004 2005average 5-year average estimate of forecast of forecast of1970-90 1991-95 1996-00 1999 2000 2001 2002 X-2003 III-2004 X-2003 III-2004 X-2003 III-2004
Belgium ² 46.2 48.3 49.5 49.7 49.5 50.0 50.5 51.4 51.7 50.4 49.4 49.7 48.6 Germany 43.0 45.1 46.9 47.3 47.1 45.5 45.0 44.9 45.0 44.4 44.5 44.2 44.3 Greece ³ 27.5 36.1 44.9 45.8 47.8 46.4 45.3 44.6 44.2 43.4 44.0 42.8 44.1 Spain 29.4 39.8 38.8 39.0 39.1 39.2 39.9 39.8 39.9 39.9 40.0 39.9 40.1 France 44.1 48.5 51.5 51.8 51.3 51.0 50.2 50.5 50.6 50.5 50.7 50.5 50.5 Ireland 34.9 37.5 37.7 36.8 36.5 34.9 33.1 34.0 34.6 33.7 34.3 33.5 33.7 Italy 34.8 45.5 46.9 47.1 46.2 46.0 45.6 45.9 46.5 44.9 45.4 44.1 44.7 Luxembourg : : 45.8 45.0 44.8 45.4 47.0 47.5 47.1 46.5 46.8 46.3 46.8 Netherlands 48.5 49.5 47.3 47.6 47.5 46.6 45.9 45.9 45.6 45.5 45.1 45.1 44.8 Austria 44.4 49.5 51.8 51.8 50.8 51.9 51.0 50.2 49.9 50.4 49.5 49.8 47.7 Portugal 28.2 37.2 41.6 42.4 42.3 41.8 43.4 44.1 44.6 42.7 43.2 42.4 43.0 Finland 43.1 53.7 55.4 54.3 56.1 54.4 54.4 53.4 52.7 52.7 52.6 52.0 52.2 Euro area 40.8 45.8 47.4 47.6 47.3 46.6 46.1 46.2 46.3 45.7 45.8 45.4 45.5 Denmark 50.5 57.0 58.6 59.5 57.4 58.2 57.3 56.4 57.5 56.0 56.9 55.6 56.2 Sweden 55.4 57.6 62.4 62.7 62.4 60.0 58.1 59.2 59.5 59.2 59.1 58.8 58.9 United Kingdom 39.3 36.6 39.7 40.3 40.8 41.1 39.5 40.0 39.6 40.4 39.1 40.8 39.2 EU-15 41.4 45.1 46.8 47.0 46.7 46.2 45.5 45.7 45.8 45.4 45.2 45.2 45.0 Cyprus : : : : : : : 35.4 : 35.4 37.5 35.4 37.6 Czech Republic : : 47.2 46.5 42.8 44.1 45.6 42.8 45.0 44.3 45.0 44.1 44.1 Estonia : : : : 50.3 46.1 39.6 41.1 41.2 39.3 43.4 39.3 42.2 Hungary : : : : : 45.5 45.0 43.2 44.8 44.4 47.1 44.2 46.8 Latvia : 38.9 44.9 44.9 42.5 40.8 41.9 43.4 41.5 41.1 39.6 36.2 38.4 Lithuania : : 37.1 38.0 36.4 33.6 33.8 35.2 33.9 35.5 34.7 35.9 34.7 Malta : : : : : : : 39.0 : 39.1 40.2 39.2 40.4 Poland : 46.3 41.4 40.8 40.2 41.3 41.3 41.3 41.0 42.2 40.8 41.8 41.2 Slovakia : : 53.5 49.8 47.6 45.5 45.2 33.4 49.1 33.3 42.0 33.7 43.1 Slovenia : : : : : : : 41.6 : 42.2 42.3 42.4 42.3 AC-10 : : : : : : : 41.0 : 41.8 42.5 41.5 42.5 EU-25 : : : : : : : 45.5 : 45.3 45.1 45.0 44.9 USA 30.7 31.3 32.9 33.1 33.8 33.0 30.4 30.1 29.7 29.3 29.6 29.4 30.0 Japan 27.7 32.5 32.0 31.8 32.2 33.1 31.9 32.9 31.5 32.9 31.0 33.1 30.8¹ ESA 79 up to 1994, ESA 95 from 1995 onwards.² The figures include one-off measures at the amount of 1.2% of GDP in 2003, 0.5% in 2004 and -0.1% in 2005. ³ Total current receipts.
TABLE 38 : Net lending (+) or net borrowing (-), general government (as a percentage of GDP, 1970-2005) ¹long-term 2003 2004 2005
average 5-year average estimate of forecast of forecast of1970-90 1991-95 1996-00 1999 2000 2001 2002 X-2003 III-2004 X-2003 III-2004 X-2003 III-2004
Belgium ² -6.8 -5.9 -1.3 -0.4 0.2 0.5 0.1 0.2 0.2 -0.4 -0.5 -0.4 -0.7 Germany -1.9 -3.1 -1.7 -1.5 1.3 -2.8 -3.5 -4.2 -3.9 -3.9 -3.6 -3.4 -2.8 Greece -5.7 -11.5 -3.5 -1.8 -2.0 -1.4 -1.4 -1.7 -3.0 -2.4 -3.2 -2.3 -2.8 Spain -2.4 -5.6 -2.6 -1.2 -0.9 -0.4 0.0 0.0 0.3 0.1 0.4 0.2 0.6 France -1.2 -4.5 -2.6 -1.8 -1.4 -1.5 -3.2 -4.2 -4.1 -3.8 -3.7 -3.6 -3.6 Ireland -7.7 -2.1 2.0 2.4 4.4 1.1 -0.2 -0.9 0.2 -1.2 -0.8 -1.1 -1.0 Italy -9.1 -9.1 -3.1 -1.7 -0.6 -2.6 -2.3 -2.6 -2.4 -2.8 -3.2 -3.5 -4.0 Luxembourg : 1.7 3.7 3.7 6.3 6.3 2.7 -0.6 -0.1 -2.1 -2.0 -2.5 -2.3 Netherlands -3.2 -3.5 -0.2 0.7 2.2 0.0 -1.9 -2.6 -3.2 -2.7 -3.5 -2.4 -3.3 Austria -1.8 -3.8 -2.4 -2.3 -1.5 0.2 -0.2 -1.0 -1.1 -0.6 -1.1 -0.2 -1.9 Portugal -4.6 -5.2 -3.4 -2.8 -2.8 -4.4 -2.7 -2.9 -2.8 -3.3 -3.4 -3.9 -3.8 Finland 3.9 -5.0 1.3 2.2 7.1 5.2 4.3 2.4 2.3 1.7 2.0 1.9 2.1 Euro area -3.3 -5.0 -2.1 -1.3 0.1 -1.6 -2.3 -2.8 -2.7 -2.7 -2.7 -2.7 -2.6 Denmark ³ -0.5 -2.4 1.3 3.3 2.6 3.1 1.7 0.9 1.5 1.3 1.1 1.9 1.5 Sweden 0.6 -7.3 1.1 2.5 5.1 2.8 0.0 0.2 0.7 0.5 0.2 1.0 0.7 United Kingdom -2.2 -5.7 -0.3 1.1 3.9 0.7 -1.6 -2.8 -3.2 -2.7 -2.8 -2.4 -2.6 EU-15 -2.9 -5.1 -1.6 -0.7 1.0 -1.0 -2.0 -2.7 -2.6 -2.6 -2.6 -2.4 -2.4 Cyprus : : : : -2.4 -2.4 -4.6 -5.2 -6.3 -3.7 -4.6 -2.9 -4.1 Czech Republic : : -3.4 -3.7 -4.5 -6.4 -6.4 -8.0 -12.9 -6.3 -5.9 -5.2 -5.1 Estonia : : -1.0 -2.8 -0.3 0.3 1.8 0.0 2.6 -0.4 0.7 0.4 0.0 Hungary : : : : -3.0 -4.4 -9.3 -5.4 -5.9 -4.4 -4.9 -3.6 -4.3 Latvia : 0.9 -1.5 -5.3 -2.7 -1.6 -2.7 -2.7 -1.8 -2.7 -2.2 -2.0 -2.0 Lithuania : : -3.2 -5.7 -2.6 -2.1 -1.4 -2.6 -1.7 -3.1 -2.8 -2.7 -2.6 Malta : : : : -6.5 -6.4 -5.7 -7.6 -9.7 -5.8 -5.9 -4.1 -4.5 Poland : -3.3 -2.2 -1.9 -1.8 -3.5 -3.6 -4.3 -4.1 -5.9 -6.0 -4.9 -4.5 Slovakia : : -7.4 -7.1 -12.3 -6.0 -5.7 -5.1 -3.6 -4.0 -4.1 -3.4 -3.9 Slovenia : : : : -3.0 -2.7 -1.9 -2.2 -1.8 -1.8 -1.7 -1.7 -1.8 AC-10 : : : : -3.2 -4.1 -4.9 -5.0 -5.7 -5.0 -5.0 -4.1 -4.2 EU-25 : : : : 0.9 -1.1 -2.1 -2.8 -2.7 -2.7 -2.7 -2.5 -2.5 USA -3.4 -4.9 -0.4 0.4 1.3 -0.5 -3.7 -5.0 -4.8 -5.5 -4.5 -5.4 -4.2 Japan -1.4 -0.9 -6.9 -7.2 -7.5 -6.1 -7.9 -7.3 -7.7 -7.2 -7.4 -7.1 -7.2¹ ESA 79 up to 1994, ESA 95 from 1995 onwards. The net lending (borrowing) includes one-off proceeds relative to UMTS licences (see note 10 on concepts and sources).² The figures include one-off measures at the amount of 1.2% of GDP in 2003, 0.5% in 2004 and -0.1% in 2005. ³ For 2001 the retroactive change to the "special pension contribution" is not included. Note : the figures for Greece are based on a second EDP notification (30.3.2004) not yet validated by Eurostat; hence, they are to be considered subject to revision.
131
AN
NE
X

TABLE 39 : Interest expenditure, general government (as a percentage of GDP, 1970-2005) ¹ 29.03.2004
long-term 2003 2004 2005average 5-year average estimate of forecast of forecast of1970-90 1991-95 1996-00 1999 2000 2001 2002 X-2003 III-2004 X-2003 III-2004 X-2003 III-2004
Belgium 6.6 10.1 7.6 7.0 6.8 6.6 6.1 5.6 5.6 5.0 5.1 4.6 4.8 Germany 2.0 3.2 3.6 3.5 3.4 3.3 3.1 3.1 3.1 3.2 3.1 3.2 3.1 Greece 3.2 12.0 9.3 8.3 7.8 7.1 6.2 6.0 5.7 5.6 5.6 5.4 5.5 Spain 1.3 4.6 4.2 3.5 3.3 3.1 2.8 2.5 2.5 2.3 2.4 2.2 2.3 France 1.8 3.3 3.5 3.3 3.1 3.1 3.0 3.2 3.0 3.2 3.0 3.2 3.0 Ireland 6.2 6.2 3.3 2.4 2.0 1.6 1.4 1.5 1.4 1.5 1.4 1.4 1.4 Italy 5.6 11.2 8.5 6.7 6.5 6.5 5.8 5.3 5.3 5.0 5.0 5.1 5.2 Luxembourg : 0.3 0.3 0.3 0.3 0.3 0.2 0.1 0.2 0.1 0.2 0.1 0.1 Netherlands 4.3 5.9 4.8 4.5 3.8 3.4 3.1 3.0 2.9 2.7 2.9 2.6 3.0 Austria 2.4 4.2 3.8 3.6 3.6 3.5 3.4 3.3 3.1 3.3 3.1 3.2 3.1 Portugal 3.7 6.6 3.9 3.2 3.2 3.2 3.0 2.9 2.9 2.7 2.9 2.8 3.1 Finland 1.2 3.6 3.6 3.1 2.9 2.7 2.2 2.1 1.9 2.0 1.9 1.8 1.7 Euro area 3.0 5.4 4.8 4.3 4.1 4.0 3.6 3.6 3.5 3.4 3.4 3.4 3.4 Denmark 4.5 6.9 5.1 4.7 3.4 3.2 2.8 3.3 2.6 3.0 2.5 2.8 2.3 Sweden 4.2 5.7 5.4 4.6 4.0 3.2 2.9 2.7 2.1 2.6 2.3 2.7 2.4 United Kingdom 4.2 3.0 3.3 2.9 2.7 2.4 2.0 2.1 2.0 2.1 2.0 2.0 2.1 EU-15 3.2 5.1 4.6 4.1 3.8 3.6 3.3 3.2 3.2 3.1 3.1 3.1 3.1 Cyprus : : : : 3.5 3.6 3.2 4.8 3.3 4.6 : 4.5 : Czech Republic : : 1.2 1.0 0.9 1.1 1.5 1.3 1.3 1.0 1.3 1.2 1.3 Estonia : : 0.4 0.4 0.3 0.3 0.3 0.3 0.3 0.3 0.3 0.3 0.3 Hungary : : : : 5.7 4.8 4.1 3.6 4.1 3.2 4.0 2.8 3.9 Latvia : 0.5 1.1 0.9 1.1 1.0 0.9 0.9 0.9 0.8 0.8 0.8 0.7 Lithuania : : 1.2 1.5 1.8 1.8 1.6 1.5 1.3 1.4 1.4 1.3 1.3 Malta : : : : 3.7 3.8 3.7 3.9 3.6 4.2 2.6 4.2 2.5 Poland : 6.0 3.6 3.0 2.1 3.0 2.9 3.2 3.1 3.0 3.2 3.1 3.3 Slovakia : : 2.9 3.4 4.1 4.0 3.6 2.9 2.4 2.6 2.7 2.5 2.9 Slovenia : : : : 2.3 2.2 2.1 1.7 1.9 1.8 1.7 1.8 1.6 AC-10 : : : : 2.5 2.9 2.7 2.7 2.7 2.5 : 2.5 : EU-25 : : : : 3.8 3.6 3.3 3.3 3.2 3.1 : 3.1 : USA 3.6 4.9 4.2 3.9 3.7 3.4 3.1 2.8 2.8 2.9 2.8 3.0 2.9 Japan 2.7 3.6 3.4 3.4 3.3 3.2 3.0 3.6 3.0 3.7 3.0 3.8 3.0¹ ESA 79 up to 1994, ESA 95 from 1995 onwards.
TABLE 40 : Primary balance, general government (as a percentage of GDP, 1970-2005) ¹ ²long-term 2003 2004 2005
average 5-year average estimate of forecast of forecast of1970-90 1991-95 1996-00 1999 2000 2001 2002 X-2003 III-2004 X-2003 III-2004 X-2003 III-2004
Belgium -0.2 4.2 6.3 6.6 6.9 7.1 6.1 5.8 5.8 4.6 4.7 4.2 4.1 Germany 0.2 0.1 1.8 2.0 4.7 0.4 -0.4 -1.1 -0.7 -0.7 -0.4 -0.2 0.3 Greece -2.4 0.5 5.8 6.5 5.9 5.7 4.7 4.3 2.7 3.3 2.4 3.1 2.7 Spain -1.1 -1.0 1.6 2.4 2.4 2.8 2.8 2.6 2.9 2.5 2.8 2.5 2.9 France 0.5 -1.2 0.9 1.6 1.7 1.6 -0.2 -0.9 -1.0 -0.6 -0.6 -0.4 -0.5 Ireland -1.5 4.1 5.3 4.7 6.4 2.6 1.2 0.7 1.6 0.3 0.6 0.4 0.3 Italy -3.5 2.1 5.4 5.0 5.8 3.9 3.5 2.7 2.9 2.2 1.8 1.6 1.2 Luxembourg : 2.1 4.0 4.0 6.5 6.5 3.0 -0.4 0.1 -2.0 -1.9 -2.4 -2.2 Netherlands 1.1 2.4 4.6 5.1 6.0 3.4 1.2 0.4 -0.3 0.0 -0.7 0.2 -0.3 Austria 0.6 0.4 1.5 1.3 2.1 3.7 3.1 2.4 2.0 2.7 2.0 3.1 1.2 Portugal -0.9 1.4 0.5 0.4 0.4 -1.2 0.3 0.0 0.1 -0.6 -0.5 -1.0 -0.8 Finland 5.0 -1.4 5.0 5.3 10.0 7.9 6.5 4.6 4.1 3.7 3.8 3.7 3.8 Euro area -0.4 0.4 2.7 3.0 4.2 2.3 1.4 0.7 0.8 0.7 0.7 0.8 0.8 Denmark 4.0 4.4 6.3 8.0 6.0 6.3 4.5 4.2 4.0 4.3 3.6 4.7 3.8 Sweden 4.8 -1.5 6.6 7.1 9.2 6.0 2.9 2.8 2.9 3.1 2.5 3.6 3.1 United Kingdom 2.0 -2.7 3.0 4.0 6.6 3.1 0.4 -0.7 -1.2 -0.7 -0.7 -0.4 -0.5 EU-15 0.3 0.0 3.0 3.4 4.8 2.6 1.3 0.6 0.6 0.5 0.5 0.7 0.7 Cyprus : : : : 1.1 1.2 -1.3 -0.5 -3.0 0.9 : 1.6 : Czech Republic : : -2.3 -2.6 -3.6 -5.4 -5.0 -6.7 -11.7 -5.2 -4.6 -4.0 -3.8 Estonia : : -0.5 -2.4 0.0 0.6 2.1 0.3 2.9 -0.1 0.9 0.6 0.3 Hungary : : : : 2.7 0.4 -5.1 -1.9 -1.8 -1.3 -0.9 -0.8 -0.5 Latvia : 1.4 -0.4 -4.5 -1.7 -0.5 -1.8 -1.8 -1.0 -1.9 -1.4 -1.2 -1.2 Lithuania : : -2.0 -4.1 -0.8 -0.4 0.1 -1.0 -0.4 -1.7 -1.4 -1.4 -1.3 Malta : : : : -2.8 -2.5 -2.0 -3.7 -6.1 -1.6 -3.3 0.1 -2.0 Poland : 2.7 1.3 1.2 0.3 -0.5 -0.7 -1.1 -1.0 -2.8 -2.8 -1.9 -1.2 Slovakia : : -4.5 -3.8 -8.2 -2.0 -2.1 -2.2 -1.2 -1.4 -1.4 -0.9 -1.0 Slovenia : : : : -0.8 -0.5 0.2 -0.5 0.1 -0.1 -0.1 0.1 -0.1 AC-10 : : : : -0.6 -1.2 -2.2 -2.2 -3.1 -2.5 : -1.6 : EU-25 : : : : 4.6 2.5 1.1 0.5 0.4 0.5 : 0.6 : USA 0.1 -0.1 3.8 4.3 5.0 2.9 -0.6 -2.2 -1.9 -2.6 -1.6 -2.4 -1.3 Japan 1.3 2.7 -3.5 -3.8 -4.2 -3.0 -4.8 -3.7 -4.7 -3.5 -4.4 -3.3 -4.2¹ ESA 79 up to 1994, ESA 95 from 1995 onwards. The primary balance includes one-off proceeds relative to UMTS licences (see note 10 on concepts and sources).² Net lending/borrowing excluding interest expenditure.
132
AN
NE
X

TABLE 41 : Cyclically adjusted net lending (+) or net borrowing (-), general government (as a percentage of GDP, 1970-2005) ¹ 29.03.2004
long-term 2003 2004 2005average 5-year average estimate of forecast of forecast of1970-90 1991-95 1996-00 1999 2000 2001 2002 X-2003 III-2004 X-2003 III-2004 X-2003 III-2004
Belgium -10.0 -8.4 -1.6 -1.1 -1.3 -0.3 0.1 0.8 0.7 0.1 0.0 -0.2 -0.5 Germany -1.8 -3.8 -2.2 -1.5 -1.9 -3.3 -3.5 -3.5 -3.2 -3.3 -3.0 -3.0 -2.5 Greece -5.8 -10.8 -2.9 -1.3 -1.8 -2.1 -1.6 -2.2 -3.3 -3.1 -3.7 -3.2 -3.3 Spain -2.4 -5.2 -2.5 -1.5 -1.7 -1.0 -0.2 0.1 0.4 0.3 0.6 0.3 0.7 France -1.2 -4.4 -2.6 -2.2 -2.3 -2.4 -3.8 -3.9 -3.8 -3.3 -3.3 -3.2 -3.3 Ireland -7.7 -0.7 1.3 0.9 2.2 -0.6 -1.9 -1.0 0.1 -0.6 -0.3 -0.2 -0.2 Italy -9.1 -8.9 -3.5 -1.9 -2.5 -3.2 -2.2 -2.1 -1.9 -2.3 -2.6 -3.2 -3.6 Luxembourg : : 3.6 2.3 2.4 4.0 1.8 1.8 0.0 1.4 -1.3 1.7 -1.6 Netherlands -3.2 -3.3 -1.5 -1.4 -1.0 -1.8 -2.4 -1.3 -1.7 -0.7 -1.4 -0.6 -0.9 Austria -1.8 -4.0 -2.5 -2.5 -2.5 0.0 -0.3 -0.7 -0.9 -0.3 -0.9 -0.1 -1.8 Portugal -4.6 -4.9 -3.7 -3.5 -4.0 -4.9 -2.6 -2.0 -1.7 -2.1 -2.0 -2.6 -2.4 Finland 3.3 -1.4 0.2 0.6 4.3 4.1 3.7 2.8 2.3 2.1 2.1 2.0 2.2 Euro area -3.5 -5.2 -2.4 -1.7 -1.8 -2.3 -2.5 -2.3 -2.2 -2.2 -2.2 -2.2 -2.2 Denmark -0.5 -1.0 0.2 1.9 0.8 1.4 0.9 1.0 2.0 1.4 1.3 1.9 1.4 Sweden 0.1 -5.7 1.0 1.4 3.0 1.9 -0.6 0.4 0.7 0.9 0.2 1.5 0.7 United Kingdom -6.6 -8.3 -1.0 0.8 0.8 0.4 -1.4 -2.4 -2.8 -2.3 -2.5 -2.1 -2.3 EU-15 -3.8 -5.6 -2.0 -1.1 -1.2 -1.7 -2.2 -2.2 -2.1 -2.0 -2.1 -2.0 -2.1 Cyprus : : : : : : : : : : : : : Czech Republic : : : : : : : : : : : : : Estonia : : : : : : : : : : : : : Hungary : : : : : : : : : : : : : Latvia : : : : : : : : : : : : : Lithuania : : : : : : : : : : : : : Malta : : : : : : : : : : : : : Poland : : : : : : : : : : : : : Slovakia : : : : : : : : : : : : : Slovenia : : : : : : : : : : : : : AC-10 : : : : : : : : : : : : : EU-25 : : : : : : : : : : : : :¹ ESA 79 up to 1994, ESA 95 from 1995 onwards. The proceeds from UMTS licences are not included in the calculation of the cyclically adjusted balances. The cyclical adjustment is based on the Production Function approach for calculating output gaps, except for DE, ES and AT for which the Hodrick-Prescott filter is used.
TABLE 42 : Cyclically adjusted primary balance, general government (as a percentage of GDP, 1970-2005) ¹long-term 2003 2004 2005
average 5-year average estimate of forecast of forecast of1970-90 1991-95 1996-00 1999 2000 2001 2002 X-2003 III-2004 X-2003 III-2004 X-2003 III-2004
Belgium -3.4 1.7 6.1 5.9 5.5 6.3 6.2 6.4 6.3 5.1 5.1 4.5 4.3 Germany 0.2 -0.7 1.4 2.0 1.5 0.0 -0.4 -0.3 0.0 -0.1 0.1 0.2 0.7 Greece -2.6 1.2 6.5 6.9 6.0 5.1 4.6 3.8 2.4 2.5 1.9 2.2 2.2 Spain -0.9 -0.6 1.7 2.1 1.6 2.2 2.6 2.6 2.9 2.7 2.9 2.6 3.0 France 0.5 -1.1 0.9 1.1 0.8 0.7 -0.7 -0.7 -0.8 -0.2 -0.3 0.0 -0.2 Ireland -1.6 5.5 4.6 3.2 4.3 0.9 -0.5 0.6 1.5 0.9 1.1 1.2 1.2 Italy -3.5 2.3 5.0 4.8 4.0 3.3 3.5 3.2 3.4 2.7 2.4 2.0 1.6 Luxembourg : : 4.0 2.6 2.7 4.3 2.1 1.9 0.2 1.5 -1.1 1.8 -1.5 Netherlands 1.1 2.6 3.3 3.1 2.8 1.7 0.7 1.7 1.2 2.0 1.5 2.0 2.0 Austria 0.6 0.2 1.3 1.1 1.2 3.5 3.1 2.6 2.2 3.0 2.3 3.1 1.2 Portugal -0.9 1.6 0.2 -0.3 -0.9 -1.8 0.4 0.8 1.2 0.6 0.9 0.2 0.6 Finland 4.4 2.2 3.8 3.7 7.2 6.8 5.9 4.9 4.2 4.0 3.9 3.8 3.9 Euro area -0.6 0.2 2.4 2.6 2.2 1.6 1.2 1.2 1.3 1.3 1.2 1.2 1.2 Denmark 4.1 5.9 5.3 6.6 4.2 4.6 3.7 4.3 4.6 4.4 3.8 4.7 3.7 Sweden 4.3 0.0 6.4 6.1 7.0 5.2 2.4 3.0 2.8 3.5 2.6 4.1 3.1 United Kingdom -2.3 -5.4 2.2 3.7 3.6 2.8 0.6 -0.3 -0.8 -0.3 -0.5 -0.1 -0.2 EU-15 -0.6 -0.4 2.6 3.0 2.6 2.0 1.2 1.1 1.0 1.1 1.0 1.2 1.1 Cyprus : : : : : : : : : : : : : Czech Republic : : : : : : : : : : : : : Estonia : : : : : : : : : : : : : Hungary : : : : : : : : : : : : : Latvia : : : : : : : : : : : : : Lithuania : : : : : : : : : : : : : Malta : : : : : : : : : : : : : Poland : : : : : : : : : : : : : Slovakia : : : : : : : : : : : : : Slovenia : : : : : : : : : : : : : AC-10 : : : : : : : : : : : : : EU-25 : : : : : : : : : : : : :¹ ESA 79 up to 1994, ESA 95 from 1995 onwards. The proceeds from UMTS licences are not included in the calculation of the cyclically adjusted balances. The cyclical adjustment is based on the Production Function approach for calculating output gaps, except for DE, ES and AT for which the Hodrick-Prescott filter is used.
133
AN
NE
X

TABLE 43 : Gross debt, general government (as a percentage of GDP, 1980-2005) ¹ 29.03.2004
2003 2004 2005estimate of forecast of forecast of
1980 1985 1990 1999 2000 2001 2002 X-2003 III-2004 X-2003 III-2004 X-2003 III-2004 Belgium 78.6 122.3 129.2 114.8 109.1 108.1 105.8 103.5 100.5 101.0 97.4 97.8 94.3 Germany 31.2 40.7 42.3 61.2 60.2 59.4 60.8 63.8 64.2 65.0 65.6 65.8 66.1 Greece 25.0 53.6 79.6 105.2 106.2 106.9 104.7 100.6 103.0 97.1 102.8 95.0 101.7 Spain 16.8 42.3 43.6 63.1 61.2 57.5 54.6 51.3 50.8 48.8 48.0 46.3 45.1 France 19.8 30.8 35.1 58.5 57.2 56.8 58.6 62.6 63.0 64.3 64.6 65.6 65.6 Ireland 69.8 101.7 94.2 48.6 38.4 36.1 32.3 33.5 32.0 33.8 32.4 33.8 32.6 Italy 58.2 82.3 97.2 115.5 111.2 110.6 108.0 106.4 106.2 106.1 106.0 106.1 106.0 Luxembourg 11.3 11.7 5.4 6.0 5.5 5.5 5.7 4.9 4.9 4.7 4.5 4.1 3.8 Netherlands 45.9 70.3 76.9 63.1 55.9 52.9 52.6 54.6 54.8 55.5 56.3 55.5 58.6 Austria 36.2 49.2 57.2 67.5 67.0 67.1 66.6 66.4 65.0 65.2 65.5 63.2 65.3 Portugal 32.3 61.5 58.3 54.3 53.3 55.6 58.1 57.5 59.4 58.6 60.7 60.0 62.0 Finland 11.5 16.2 14.2 47.0 44.6 43.9 42.6 44.6 45.3 44.5 44.5 44.3 44.3 Euro area 34.0 51.6 57.8 72.8 70.4 69.4 69.2 70.4 70.4 70.7 70.9 70.7 70.9 Denmark ² 36.5 70.0 57.8 53.0 50.1 47.8 47.2 42.9 45.0 41.0 42.3 37.9 40.0 Sweden 40.0 61.9 42.0 62.8 52.8 54.4 52.6 51.7 51.9 51.4 51.8 50.0 50.5 United Kingdom 53.2 52.7 34.0 45.0 42.1 38.9 38.5 39.6 39.9 40.5 40.1 41.0 40.6 EU-15 38.1 52.2 53.7 67.8 64.0 63.2 62.5 64.1 64.0 64.4 64.2 64.4 64.2 Cyprus : : : 62.0 61.7 64.4 67.1 60.3 72.2 58.9 74.6 56.8 76.9 Czech Republic : : : 14.3 18.2 25.2 28.9 30.7 37.6 34.5 40.6 38.3 42.4 Estonia : : : 6.5 5.0 4.7 5.7 5.4 5.8 5.3 5.4 4.5 5.3 Hungary : : : 61.2 55.4 53.5 57.1 57.9 59.0 56.9 58.7 55.5 58.0 Latvia : : : 13.7 13.9 16.2 15.5 16.7 15.6 18.2 16.0 18.7 16.1 Lithuania : : : 23.4 24.3 23.4 22.8 23.3 21.9 23.6 22.8 23.7 23.2 Malta : : : 60.8 57.1 61.8 61.7 66.4 72.0 69.4 73.9 70.6 75.9 Poland : : : 40.3 36.6 36.7 41.2 45.1 45.4 49.2 49.1 51.5 50.3 Slovakia : : : 43.8 49.9 48.7 43.3 45.1 42.8 45.2 45.1 45.4 46.1 Slovenia : : : 25.1 26.7 26.9 27.8 27.4 27.1 27.0 28.3 26.4 28.2 AC-10 : : : 38.1 36.4 38.5 39.4 42.4 42.2 44.6 44.4 45.9 45.2 EU-25 : : : 66.7 62.9 62.1 61.5 63.1 63.1 63.5 63.4 63.5 63.4¹ Government gross debt as defined in Council Regulation (EC) Nº 3605/93. ESA 95 from 1996 onwards.² Government deposits with the central bank, government holdings of non-government bonds and public enterprise related debt amounted to 9.1 % of GDP in 2001.
TABLE 44 : Gross national saving (as a percentage of GDP, 1970-2005)long-term 2003 2004 2005
average 5-year average estimate of forecast of forecast of1970-90 1991-95 1996-00 1999 2000 2001 2002 X-2003 III-2004 X-2003 III-2004 X-2003 III-2004
Belgium 21.3 24.6 25.6 26.0 25.9 24.8 24.8 23.8 23.6 23.5 23.9 23.5 24.4 Germany 23.5 22.4 21.2 20.8 20.8 19.8 20.5 20.7 20.4 21.4 20.8 21.7 20.7 Greece 26.7 20.1 18.0 18.1 18.6 18.6 18.5 19.3 18.7 20.2 18.7 20.6 18.5 Spain 23.5 20.9 22.4 22.4 22.4 22.7 23.4 22.5 22.8 22.7 23.3 22.8 23.7 France 22.6 19.8 21.1 22.3 22.1 21.4 20.3 19.6 19.6 19.8 19.8 20.0 19.9 Ireland 18.6 18.0 24.3 24.6 25.0 23.4 21.9 20.6 20.6 20.5 20.7 20.5 20.7 Italy 24.2 19.7 21.1 20.7 20.0 20.0 19.7 18.8 18.4 18.8 18.1 18.8 18.3 Luxembourg : : : : : : : 48.6 27.8 44.7 28.6 44.4 30.0 Netherlands 22.8 25.6 26.8 26.6 27.6 25.2 23.0 22.4 21.7 23.8 23.7 25.4 24.3 Austria 25.9 23.0 21.6 21.3 22.0 21.3 21.6 22.9 22.4 22.7 22.6 22.9 22.8 Portugal 23.3 21.4 19.9 19.6 18.8 18.4 17.9 18.5 17.8 18.8 18.4 19.8 19.4 Finland 26.3 17.3 25.1 25.8 27.7 27.9 27.2 24.9 24.2 24.5 23.5 24.6 23.5 Euro area 23.4 21.3 21.8 21.9 21.9 21.2 21.0 20.6 20.4 20.9 20.7 21.2 20.8 Denmark 19.6 19.8 21.3 21.5 22.7 23.4 22.4 21.8 22.4 21.6 22.3 22.0 22.8 Sweden 20.9 17.1 21.2 21.7 22.5 22.3 21.4 20.8 21.6 20.8 21.8 21.2 22.2 United Kingdom 18.6 14.9 16.2 15.5 15.3 15.4 14.9 14.2 14.7 14.7 15.0 15.6 15.8 EU-15 22.5 20.1 20.9 20.8 20.9 20.3 20.1 19.5 19.5 19.9 19.7 20.3 20.0 Cyprus : : : 15.4 : : : 16.9 14.4 19.2 15.7 19.9 16.8 Czech Republic : : 26.2 25.4 24.4 23.8 21.9 20.7 21.7 19.6 21.4 19.4 21.5 Estonia : : 18.7 18.6 21.1 21.0 : 21.9 25.1 23.6 25.8 25.7 25.3 Hungary : : : : : : : 15.3 16.8 16.3 17.5 17.7 18.1 Latvia : 34.1 16.8 17.1 20.1 21.6 24.1 21.1 21.3 21.2 20.8 22.0 20.7 Lithuania : : 14.0 11.5 14.6 17.0 : 17.0 15.7 17.8 15.8 18.3 16.7 Malta : : : : : : : 14.8 19.0 15.3 18.8 16.2 19.7 Poland : 21.1 20.7 20.9 19.0 : : 18.3 16.9 18.9 17.0 19.8 17.5 Slovakia : : : : : : : 25.6 23.8 26.0 23.9 26.1 23.5 Slovenia : 23.9 24.2 24.5 24.1 24.2 : 26.1 24.4 25.9 21.3 26.2 21.7 AC-10 : : : : : : : 18.8 18.4 19.1 18.4 19.8 18.8 EU-25 : : : : : : : 19.5 19.3 19.8 19.6 20.2 19.9 USA 18.9 16.3 17.4 17.5 16.7 14.9 13.4 13.2 13.7 13.6 14.1 14.1 14.6 Japan 33.6 32.2 29.6 28.4 28.7 27.7 26.4 26.8 27.1 26.7 27.4 26.4 27.4
134
AN
NE
X

TABLE 45 : Gross saving, private sector (as a percentage of GDP, 1970-2005) ¹ 29.03.2004
long-term 2003 2004 2005average 5-year average estimate of forecast of forecast of1970-90 1991-95 1996-00 1999 2000 2001 2002 X-2003 III-2004 X-2003 III-2004 X-2003 III-2004
Belgium 24.0 28.5 24.5 23.9 23.2 22.6 22.7 22.8 22.5 22.3 22.5 21.8 22.9 Germany 20.7 21.6 20.7 19.5 19.4 19.6 21.3 22.1 21.6 22.6 21.7 22.5 21.1 Greece 28.7 27.2 18.4 16.4 16.0 15.8 15.7 17.4 17.0 19.0 17.8 19.5 17.5 Spain 21.8 21.5 21.1 19.6 19.2 18.9 19.2 18.2 18.4 18.1 18.7 18.1 18.8 France 20.2 20.7 20.1 20.1 19.8 19.1 19.9 20.2 20.1 20.0 19.9 20.1 19.9 Ireland 21.6 18.5 19.6 18.1 17.1 18.0 18.0 17.6 16.9 17.7 17.8 17.6 18.0 Italy 29.4 25.1 21.2 18.9 18.6 19.0 19.0 18.9 18.7 18.5 18.3 18.6 18.5 Luxembourg : : : : : : : 41.7 21.4 41.1 24.1 41.6 25.8 Netherlands 21.4 26.2 24.5 23.2 23.0 21.5 20.5 21.6 21.5 23.3 23.9 24.5 24.4 Austria 21.7 22.0 20.0 19.7 20.1 17.1 18.4 21.0 20.8 20.5 21.0 20.4 22.0 Portugal 24.1 23.2 19.3 18.2 18.0 18.5 18.0 20.7 18.7 20.4 20.1 21.1 20.9 Finland 18.4 18.9 20.9 21.0 18.3 20.0 19.9 19.9 19.2 20.3 19.0 20.4 18.9 Euro area 22.5 22.6 20.9 19.9 19.6 19.4 20.1 20.4 20.1 20.6 20.3 20.6 20.3 Denmark 16.5 20.5 18.3 16.5 18.4 18.8 19.0 19.5 19.6 18.9 19.6 18.7 19.7 Sweden 16.1 20.7 17.6 17.0 16.3 14.9 16.9 17.4 18.1 17.2 18.7 17.2 18.8 United Kingdom 17.5 17.8 15.3 13.0 12.4 13.1 14.5 14.8 15.9 14.9 15.6 15.2 16.2 EU-15 21.3 21.7 19.9 18.6 18.3 18.2 19.1 19.4 19.3 19.5 19.4 19.6 19.5 Cyprus : : : : : : : : 20.6 : 20.4 : 21.0 Czech Republic : : 21.5 21.2 22.1 21.5 20.3 18.9 26.1 17.5 26.7 : 26.4 Estonia : : 12.8 13.1 15.9 19.4 : 20.6 16.6 22.3 21.0 : 22.0 Hungary : : : : : : : : 17.9 : 16.6 : 16.6 Latvia : 30.5 13.3 15.4 18.5 19.1 22.4 18.8 20.2 : 20.7 : 20.9 Lithuania : : 12.9 10.9 13.7 17.5 : 17.1 14.4 18.0 16.0 : 17.0 Malta : : : : : : : : 23.2 : 19.3 : 18.9 Poland : 21.6 18.6 18.3 17.7 : : 14.7 17.7 15.4 19.5 : 19.0 Slovakia : : : : : : : 27.0 20.2 : 21.3 : 21.1 Slovenia : : : : : : : : 26.1 : 23.0 : 23.5 AC-10 : : : : : : : : 19.5 : 20.0 : 19.9 EU-25 : : : : : : : : 19.2 : 19.4 : 19.4 USA 19.9 18.8 15.2 14.3 12.7 12.8 14.2 15.1 15.5 16.0 15.6 16.3 15.8 Japan 28.6 25.9 28.3 28.6 28.8 27.7 27.3 28.4 29.7 28.7 30.4 28.6 30.8¹ ESA 79 up to 1994, ESA 95 from 1995 onwards.
TABLE 46 : Gross saving, general government (as a percentage of GDP, 1970-2005) ¹long-term 2003 2004 2005
average 5-year average estimate of forecast of forecast of1970-90 1991-95 1996-00 1999 2000 2001 2002 X-2003 III-2004 X-2003 III-2004 X-2003 III-2004
Belgium -2.7 -3.9 1.1 2.1 2.8 2.4 2.2 1.0 1.1 1.2 1.4 1.7 1.6 Germany 2.8 0.8 0.5 1.2 1.6 0.2 -0.7 -1.4 -1.1 -1.3 -1.0 -0.8 -0.4 Greece -2.1 -7.1 -0.6 1.7 2.1 2.5 2.3 1.9 1.7 1.1 0.9 1.1 1.0 Spain 1.7 -0.6 1.3 2.9 3.2 3.8 4.2 4.3 4.3 4.5 4.5 4.7 4.8 France 2.5 -0.9 1.0 2.1 2.3 2.2 0.4 -0.6 -0.4 -0.2 -0.1 -0.1 0.0 Ireland -3.0 -0.6 4.7 6.6 7.8 5.4 3.7 3.1 3.7 2.8 2.9 2.9 2.7 Italy -5.1 -5.5 -0.1 1.7 1.5 1.0 0.7 -0.1 -0.2 0.3 -0.2 0.2 -0.2 Luxembourg : : 8.9 8.9 11.0 9.7 8.7 6.9 6.6 3.6 4.6 2.9 4.2 Netherlands 1.4 -0.6 2.3 3.4 4.6 3.6 1.7 0.8 0.3 0.5 -0.2 0.8 0.0 Austria 4.2 1.0 1.6 1.7 1.8 3.8 3.0 1.9 1.9 2.2 1.7 2.5 0.9 Portugal -0.8 -1.7 0.6 1.3 0.7 -0.7 0.0 -2.2 -0.9 -1.7 -1.6 -1.2 -1.4 Finland 7.9 -1.6 4.3 5.0 9.7 8.0 7.0 5.0 5.1 4.1 4.7 4.2 4.7 Euro area 0.9 -1.3 0.9 2.0 2.4 1.8 1.0 0.2 0.3 0.4 0.4 0.6 0.6 Denmark 3.1 -0.7 3.2 4.9 5.1 5.4 3.8 2.3 3.7 2.7 2.6 3.2 3.2 Sweden 4.8 -3.6 4.1 5.7 7.9 5.7 3.1 3.4 3.7 3.6 3.1 4.1 3.5 United Kingdom 1.2 -2.9 0.8 2.5 2.7 2.3 0.0 -0.6 -1.1 -0.2 -0.7 0.4 -0.4 EU-15 1.2 -1.6 1.0 2.3 2.7 2.1 0.9 0.2 0.2 0.4 0.3 0.7 0.5 Cyprus : : : : : : : : : : : : : Czech Republic : : 4.7 4.1 2.2 2.5 2.3 1.8 -4.3 2.1 -5.1 : -4.7 Estonia : : 5.9 5.5 5.2 5.2 7.7 1.3 8.5 1.3 4.8 : 3.3 Hungary : : : : : 1.8 -0.7 : -1.1 : 0.8 : 1.5 Latvia : 3.6 2.6 -1.5 0.6 1.6 0.9 2.3 1.0 : 0.1 : -0.1 Lithuania : : 1.2 0.6 1.0 0.6 1.5 -0.1 1.2 -0.2 -0.2 : -0.3 Malta : : : : : : : : : : : : : Poland : -0.6 2.1 2.4 1.5 0.9 0.0 3.6 -0.9 3.5 -2.5 : -1.5 Slovakia : : : 2.4 0.6 -0.1 -0.7 -1.4 3.6 : 2.6 : 2.4 Slovenia : : : : : : : : : : : : : AC-10 : : : : : : : : : : : : : EU-25 : : : : : : : : : : : : : USA -1.1 -2.5 2.2 3.2 3.9 2.1 -0.8 -1.9 -1.8 -2.3 -1.5 -2.2 -1.2 Japan 5.0 6.3 1.3 -0.2 -0.1 0.1 -0.9 -1.6 -2.6 -1.9 -3.0 -2.2 -3.4¹ ESA 79 up to 1994, ESA 95 from 1995 onwards.
135
AN
NE
X

TABLE 47 : Exports of goods, volume (percentage change on preceding year, 1961-2005) 29.03.2004
long-term 2003 2004 2005average 5-year average estimate of forecast of forecast of1961-90 1991-95 1996-00 1999 2000 2001 2002 X-2003 III-2004 X-2003 III-2004 X-2003 III-2004
Belgium 6.2 4.8 4.9 4.1 7.4 0.4 1.5 -1.0 2.5 3.0 4.0 4.0 5.0 Germany 6.2 3.7 8.5 5.6 13.6 5.3 2.7 2.1 2.5 6.3 6.9 7.4 5.2 Greece 8.0 4.1 4.0 6.3 8.7 -1.6 -7.1 4.7 6.7 4.8 3.6 6.1 6.3 Spain : 11.9 10.1 6.5 10.0 2.4 1.2 4.4 5.7 5.4 6.1 7.6 7.7 France 7.0 5.9 8.1 4.9 12.2 2.1 1.9 -1.9 -1.6 4.5 4.7 7.0 5.5 Ireland 8.5 13.2 15.2 13.6 18.6 4.4 5.4 -5.6 -5.4 5.3 5.1 7.1 7.5 Italy 8.1 7.3 4.1 1.1 9.4 1.5 -2.9 -2.9 -4.3 5.2 2.8 5.8 6.5 Luxembourg 3.8 4.0 8.5 6.8 12.8 9.7 -0.9 0.5 0.4 3.4 4.8 5.8 6.5 Netherlands 6.6 6.0 7.3 4.4 11.9 1.5 -0.5 -0.6 0.2 4.8 4.8 5.9 6.4 Austria : 4.6 10.0 7.9 13.5 7.4 5.4 2.8 2.0 6.3 4.9 7.8 7.1 Portugal : 6.1 : : : : : 3.4 4.9 5.1 5.6 7.7 7.4 Finland : 7.7 12.4 7.2 22.6 -0.2 4.2 2.3 1.9 4.2 4.3 6.0 5.5 Euro area ¹ 6.9 6.0 7.9 5.2 12.3 3.1 1.5 0.1 0.6 5.2 5.2 6.7 5.9 Denmark 5.8 3.4 6.2 8.6 9.9 3.5 5.1 2.7 -1.6 4.0 3.1 4.8 4.3 Sweden : 7.5 8.6 5.9 12.1 -2.4 2.0 4.1 5.1 6.5 6.0 7.2 6.7 United Kingdom 4.6 5.4 6.4 3.2 12.2 2.7 -1.7 0.5 -0.8 5.7 5.4 6.9 6.8 EU-15 ² 6.6 5.9 7.8 5.1 12.2 2.9 1.3 0.3 0.5 5.3 5.2 6.7 6.0 Cyprus : : -1.7 -7.4 -2.4 5.9 -8.8 0.4 0.4 4.9 5.5 5.9 5.9 Czech Republic : : 11.9 8.4 20.0 14.1 5.9 6.2 8.9 5.0 8.4 5.8 8.4 Estonia : : 16.9 -2.6 40.9 -5.5 3.5 5.0 5.3 10.0 4.0 12.0 1.0 Hungary : : 20.0 15.3 21.8 6.9 5.7 5.2 8.6 6.8 8.6 9.2 9.1 Latvia : : 11.1 -3.0 14.0 8.6 11.0 10.0 13.5 10.0 9.8 11.0 7.7 Lithuania : : 5.2 -21.1 15.0 24.6 20.1 10.0 6.3 8.0 9.2 8.0 9.4 Malta : : 4.0 11.2 10.9 -5.8 7.0 2.2 -3.5 3.5 0.2 4.0 2.2 Poland : : 10.6 1.0 25.9 7.8 6.6 8.6 15.1 11.2 12.8 12.2 10.5 Slovakia : : 11.3 6.1 15.4 5.7 5.7 19.4 27.1 11.0 10.1 8.5 9.0 Slovenia : -7.8 8.0 2.7 12.9 6.9 6.5 3.4 4.5 5.3 5.5 5.7 5.9 AC-10 : : 12.3 5.4 21.0 8.7 6.5 7.7 11.7 7.9 9.6 8.8 8.8 EU-25 : : 8.1 5.1 12.7 3.2 1.6 0.8 1.2 5.5 5.5 6.8 6.2 USA 6.2 7.8 8.0 3.8 11.2 -6.1 -4.0 0.4 1.9 5.0 8.9 6.1 9.5 Japan : 1.9 3.8 -5.5 12.4 -6.2 8.1 7.2 9.8 7.5 12.1 9.1 7.8¹ Excluding Spain, Austria and Finland up to 1973 and Portugal up to 2000.² Excluding Spain, Austria, Finland and Sweden up to 1973 and Portugal up to 2000.
TABLE 48 : Imports of goods, volume (percentage change on preceding year, 1961-2005)long-term 2003 2004 2005
average 5-year average estimate of forecast of forecast of1961-90 1991-95 1996-00 1999 2000 2001 2002 X-2003 III-2004 X-2003 III-2004 X-2003 III-2004
Belgium 5.8 3.8 5.1 3.0 8.3 -0.1 1.5 -0.5 4.0 2.5 4.0 4.1 5.0 Germany 6.7 3.8 8.1 7.8 10.7 -0.3 -1.5 4.9 5.0 5.9 7.6 7.4 7.1 Greece 8.0 3.9 7.9 8.5 7.6 -4.2 1.1 2.7 13.2 5.4 6.1 3.1 5.2 Spain : 7.5 11.5 12.3 10.5 3.3 1.5 6.4 7.8 7.2 8.1 8.8 9.0 France 7.2 3.8 8.3 7.6 15.0 1.0 1.4 0.6 0.3 4.6 5.1 6.7 6.2 Ireland 6.7 9.0 13.7 8.4 16.9 3.5 0.5 -7.8 -7.8 5.2 4.8 6.5 7.1 Italy 7.2 3.6 6.7 7.6 8.0 0.0 -1.1 0.5 -1.3 5.5 4.1 6.3 6.3 Luxembourg 4.6 3.4 8.3 9.1 6.7 8.5 -3.1 1.1 0.3 4.0 5.0 5.8 6.3 Netherlands 6.0 5.8 7.8 5.5 10.6 1.7 -1.1 -0.9 0.9 4.3 4.1 5.5 5.6 Austria : 3.7 7.9 7.2 10.8 4.8 0.4 2.8 4.7 6.0 6.1 7.7 7.6 Portugal : 6.7 : : : : : -2.5 -0.7 3.9 2.9 5.6 5.2 Finland : 0.6 11.3 3.6 16.8 1.0 3.0 1.7 2.0 3.9 3.8 5.8 4.7 Euro area ¹ 6.9 4.4 8.1 7.3 11.1 0.9 0.0 1.9 2.6 5.2 5.7 6.6 6.6 Denmark 4.8 3.6 8.1 5.4 12.3 3.3 6.2 1.6 -0.5 5.2 4.3 5.6 4.4 Sweden : 3.7 7.8 3.2 11.7 -4.9 -0.7 4.5 5.5 6.3 5.1 7.4 7.3 United Kingdom 4.7 3.0 8.8 6.7 9.3 5.4 4.1 0.5 0.9 4.9 6.0 6.2 5.9 EU-15 ² 6.5 4.2 8.2 7.1 10.9 1.4 0.7 1.7 2.4 5.2 5.7 6.6 6.4 Cyprus : : 4.5 -4.0 9.4 6.6 -1.6 0.3 -1.3 2.4 2.4 4.7 4.7 Czech Republic : : 10.8 5.1 20.2 15.3 4.3 5.6 9.2 4.8 8.2 6.0 8.6 Estonia : : 14.1 -7.9 32.6 0.3 5.2 9.0 12.5 9.0 9.8 10.0 9.6 Hungary : : 18.9 14.0 20.4 3.8 4.9 7.0 10.1 6.2 7.5 7.1 7.0 Latvia : : 8.3 -2.7 3.8 16.6 4.3 12.0 14.7 10.0 11.8 9.0 9.7 Lithuania : : 8.9 -13.8 9.2 19.4 17.6 8.0 7.3 8.7 9.0 7.0 8.7 Malta : : 3.1 8.7 17.6 -11.6 -1.8 5.0 3.2 3.4 2.5 3.4 1.7 Poland : : 17.6 -3.2 22.0 -5.0 3.6 4.7 8.6 9.5 10.6 11.5 11.4 Slovakia : : 11.7 -5.8 12.7 11.7 4.6 13.6 13.9 9.8 9.5 7.8 10.0 Slovenia : -1.1 8.4 8.6 7.7 3.2 4.4 4.5 6.8 5.6 6.7 6.0 6.3 AC-10 : : 13.7 1.8 18.6 4.5 4.5 6.5 9.3 7.2 8.8 8.1 9.0 EU-25 : : 8.6 6.7 11.5 1.6 0.9 2.1 2.9 5.3 5.9 6.7 6.6 USA 6.8 8.2 12.3 12.4 13.5 -3.2 3.7 4.0 4.8 6.0 9.3 6.3 5.4 Japan : 5.1 3.5 -1.0 11.9 0.1 1.1 4.2 6.7 6.1 9.0 6.7 8.0¹ Excluding Spain, Austria and Finland up to 1973 and Portugal up to 2000.² Excluding Spain, Austria, Finland and Sweden up to 1973 and Portugal up to 2000.
136
AN
NE
X

TABLE 49 : Trade balance (fob-fob, as a percentage of GDP, 1974-2005) 29.03.2004
long-term 2003 2004 2005average 5-year average estimate of forecast of forecast of1974-90 1991-95 1996-00 1999 2000 2001 2002 X-2003 III-2004 X-2003 III-2004 X-2003 III-2004
Belgium -2.9 2.9 3.5 3.8 2.1 2.5 3.0 1.5 2.4 1.7 2.6 1.5 2.4 Germany 4.1 1.9 3.3 3.4 3.1 4.9 6.3 6.1 6.2 6.8 6.6 7.0 6.4 Greece -9.9 -12.6 -14.8 -15.6 -16.8 -15.1 -14.8 -14.0 -16.2 -13.6 -15.8 -13.0 -15.6 Spain -5.2 -3.8 -4.0 -5.1 -6.2 -5.7 -5.1 -5.3 -5.4 -5.6 -5.7 -6.0 -6.1 France -1.8 -0.1 0.8 0.9 -0.8 -0.2 0.1 -0.4 -0.1 -0.3 0.0 -0.3 -0.1 Ireland -4.8 14.7 22.7 24.7 26.5 26.6 28.6 25.2 24.8 25.2 24.5 25.7 25.3 Italy -1.1 2.2 3.1 2.4 1.3 1.8 1.6 1.2 1.1 1.5 0.9 1.5 1.1 Luxembourg -8.5 -11.2 -12.0 -13.6 -11.8 -12.5 -11.6 -11.4 -11.1 -11.5 -11.2 -11.8 -11.1 Netherlands 1.2 5.2 5.0 3.9 4.9 5.2 5.2 5.4 5.2 5.8 5.9 6.1 6.3 Austria -5.0 -3.7 -1.9 -1.6 -1.3 -0.5 1.8 1.8 1.1 1.8 0.9 1.8 0.7 Portugal : -9.5 -9.4 -10.9 -11.7 -10.7 -9.4 -7.9 -8.5 -7.8 -7.7 -7.5 -7.3 Finland 0.2 6.1 9.9 9.5 11.4 10.4 9.7 9.1 8.3 9.0 8.2 9.0 8.3 Euro area -0.4 0.7 1.8 1.6 0.9 1.7 2.4 2.0 2.0 2.2 2.1 2.3 2.0 Euro area, adjusted ¹ : 0.9 0.1 1.1 1.8 1.5 1.5 1.7 1.6 1.8 1.6 Denmark -2.5 3.9 3.5 3.8 4.1 4.6 4.3 4.2 3.6 4.0 3.5 3.7 3.3 Sweden : 3.9 7.0 6.7 6.5 6.7 6.5 6.3 6.3 6.4 6.7 6.6 6.8 United Kingdom -2.1 -1.8 -2.5 -3.2 -3.5 -4.1 -4.5 -4.1 -4.2 -4.0 -4.1 -3.9 -4.0 EU-15 -0.6 0.6 1.3 0.9 0.3 0.9 1.3 1.0 1.0 1.2 1.1 1.3 1.0 EU-15, adjusted ¹ : 0.1 -0.7 0.0 0.5 0.2 0.4 0.5 0.5 0.5 0.4 Cyprus : : -26.5 -25.0 -29.4 -29.0 -28.3 -30.8 -26.0 -28.6 -25.4 -27.1 -25.4 Czech Republic : -2.6 -6.5 -3.5 -5.6 -5.0 -3.1 -3.6 -2.9 -3.5 -2.8 -3.7 -2.8 Estonia : : -20.0 -15.8 -15.0 -14.1 -16.9 -18.8 -18.7 -17.4 -18.4 -15.6 -17.4 Hungary : -5.6 -4.3 -4.5 -6.3 -4.3 -3.2 -5.8 -4.5 -5.2 -4.1 -3.6 -3.1 Latvia : : -15.9 -15.4 -14.8 -17.6 -17.1 -19.2 -18.9 -20.1 -20.7 -20.1 -22.3 Lithuania : : -12.1 -13.2 -9.9 -9.3 -9.6 -9.1 -9.0 -9.9 -9.1 -9.6 -9.2 Malta : -23.0 -20.7 -16.9 -23.8 -17.9 -13.6 -12.1 -17.1 -12.2 -18.3 -12.0 -17.9 Poland : 0.0 -6.5 -6.8 -7.4 -4.1 -3.8 -4.9 -2.9 -5.3 -2.8 -5.7 -3.5 Slovakia : : -8.5 -5.6 -4.8 -10.6 -9.0 -4.9 -2.0 -5.3 -2.8 -5.3 -4.2 Slovenia : 1.7 -4.8 -5.9 -5.9 -3.2 -1.1 -2.0 -2.2 -2.1 -2.7 -2.2 -2.7 AC-10 : : -7.4 -6.9 -7.8 -5.9 -5.1 -6.1 -4.6 -6.2 -4.6 -6.0 -4.8 EU-25 : : 1.0 0.6 0.0 0.6 1.0 0.7 0.7 0.9 0.8 0.9 0.7 USA -1.6 -1.9 -3.2 -3.8 -4.7 -4.3 -4.7 -5.1 -5.1 -5.4 -5.6 -5.6 -5.4 Japan 2.2 2.9 2.5 2.8 2.5 1.7 2.4 2.7 2.5 3.2 2.9 3.6 3.2¹ See note 8 on concepts and sources.
TABLE 50 : Balance on current transactions with the rest of the world (as a percentage of GDP, 1961-2005)long-term 2003 2004 2005
average 5-year average estimate of forecast of forecast of1961-90 1991-95 1996-00 1999 2000 2001 2002 X-2003 III-2004 X-2003 III-2004 X-2003 III-2004
Belgium 0.4 4.1 5.0 5.4 4.0 4.0 5.1 5.2 3.7 4.5 4.1 4.2 4.2 Germany 1.3 -0.9 -0.5 -0.8 -1.1 0.6 3.1 3.0 2.6 3.6 2.9 3.7 2.4 Greece -0.9 -0.5 -4.0 -5.7 -6.3 -6.1 -5.2 -5.2 -7.0 -4.6 -6.4 -3.9 -6.6 Spain -1.1 -2.0 -1.1 -2.1 -3.3 -3.1 -2.7 -3.1 -3.2 -3.2 -3.2 -3.4 -3.4 France -0.7 -0.1 1.9 2.6 1.3 1.5 1.6 0.7 0.9 0.8 0.9 0.8 0.7 Ireland -4.4 1.9 1.4 0.3 -0.4 -0.7 -0.7 -0.7 -0.9 -0.5 -1.0 -0.2 -0.7 Italy 0.2 -0.1 1.7 1.0 -0.2 0.3 -0.3 -0.5 -1.2 -0.4 -1.4 -0.4 -1.3 Luxembourg : : : : : : : 27.3 6.7 24.0 7.7 23.8 8.8 Netherlands 1.8 4.4 4.7 4.0 4.8 3.5 2.1 2.4 1.5 3.8 3.8 5.2 4.3 Austria -0.5 -1.1 -2.6 -3.0 -2.6 -1.9 0.5 0.5 -0.4 0.5 -0.4 0.5 -0.4 Portugal -2.5 -2.6 -7.3 -8.7 -10.8 -9.7 -7.4 -4.5 -5.0 -4.2 -3.9 -3.8 -3.6 Finland -2.1 -1.3 5.7 6.2 7.2 6.9 7.4 6.7 5.5 6.5 5.5 6.7 5.6 Euro area 0.1 -0.2 0.8 0.6 -0.2 0.5 1.3 1.0 0.5 1.2 0.7 1.3 0.6 Euro area, adjusted ¹ : -0.5 -1.2 -0.2 0.9 0.6 0.4 0.8 0.6 1.0 0.5 Denmark -2.6 1.6 0.8 1.8 1.5 3.1 2.0 2.8 2.9 2.7 2.9 2.7 3.2 Sweden -0.4 -0.1 4.1 4.2 4.2 4.4 5.1 4.0 5.5 4.1 6.0 4.4 6.1 United Kingdom -0.5 -1.6 -1.3 -2.7 -2.5 -2.4 -1.7 -2.3 -1.7 -2.2 -2.1 -1.7 -1.8 EU-15 0.0 -0.3 0.6 0.2 -0.4 0.2 1.0 0.5 0.2 0.7 0.4 0.8 0.3 EU-15, adjusted ¹ : -0.1 -0.8 -0.3 0.6 0.2 0.5 0.4 0.6 0.6 0.5 Cyprus : : -4.4 -1.7 -3.5 -4.0 : -4.4 -4.4 -3.1 -3.7 -2.8 -3.5 Czech Republic : : -4.6 -2.7 -4.9 -5.4 -5.8 -6.6 -6.5 -6.9 -6.8 -6.6 -6.6 Estonia : : -8.2 -4.7 -5.8 -6.0 -12.2 -15.2 -13.7 -12.2 -11.5 -8.5 -9.1 Hungary : : : : : : : -6.2 -5.7 -6.1 -5.4 -5.8 -5.1 Latvia : 10.1 -7.8 -9.8 -6.9 -9.6 -7.6 -8.6 -9.1 -9.5 -10.1 -9.6 -10.9 Lithuania : : -9.7 -11.2 -6.0 -4.8 -5.4 -5.7 -6.1 -5.8 -6.2 -5.9 -5.9 Malta : : : : : : : -6.6 -3.4 -6.3 -4.3 -5.7 -3.9 Poland : 0.1 -3.9 -5.2 -6.0 -2.9 -2.6 -2.9 -2.0 -3.4 -2.3 -3.6 -2.8 Slovakia : : -6.5 -3.5 -2.5 -7.4 -8.2 -3.8 -0.9 -4.4 -2.5 -4.4 -4.0 Slovenia : 4.3 -1.2 -3.3 -2.8 0.1 1.7 0.5 0.2 0.3 -0.5 0.1 -0.6 AC-10 : : : : : : : -4.6 -3.7 -4.9 -3.9 -4.8 -4.1 EU-25 : : : : : : : 0.3 0.1 0.4 0.2 0.6 0.1 USA -0.3 -0.8 -2.4 -3.0 -4.1 -3.8 -4.5 -5.3 -4.7 -5.6 -5.2 -5.8 -5.0 Japan 1.0 2.6 2.4 2.6 2.5 2.1 2.8 3.0 3.1 3.4 3.6 3.7 3.8¹ See note 8 on concepts and sources.
137
AN
NE
X

TABLE 51 : Trade balance (fob-fob, in billions of Ecu/euro, 1997-2005) 29.03.2004
2003 2004 2005estimate of forecast of forecast of
1997 1998 1999 2000 2001 2002 X-2003 III-2004 X-2003 III-2004 X-2003 III-2004 Belgium 8.3 8.5 8.9 5.3 6.2 7.9 3.9 6.4 4.5 7.2 4.2 7.1 Germany 63.1 69.4 66.6 62.8 100.7 133.8 130.9 131.7 149.2 144.1 158.4 143.1 Greece -14.4 -16.1 -18.4 -20.7 -19.7 -21.0 -21.4 -24.8 -22.6 -26.0 -23.1 -27.3 Spain -12.0 -18.7 -28.6 -37.7 -37.1 -35.6 -39.1 -40.2 -44.0 -45.4 -50.1 -51.7 France 21.2 18.3 12.5 -11.1 -2.6 2.9 -6.4 -2.1 -5.2 0.4 -4.2 -1.9 Ireland 14.6 17.5 22.2 27.3 30.5 37.0 33.6 33.2 35.9 34.6 39.5 38.3 Italy 38.6 36.8 26.1 15.1 21.7 20.5 15.9 14.1 19.8 12.0 21.3 15.6 Luxembourg -1.8 -2.0 -2.6 -2.5 -2.7 -2.6 -2.6 -2.6 -2.8 -2.7 -3.0 -2.9 Netherlands 18.6 18.2 14.7 19.7 22.5 23.0 24.5 23.8 26.8 27.5 29.0 29.9 Austria -3.4 -3.0 -3.1 -2.7 -1.1 4.0 4.0 2.5 4.2 2.2 4.2 1.8 Portugal -7.5 -9.4 -11.7 -13.6 -14.8 -12.5 -10.6 -11.1 -10.7 -10.3 -10.7 -10.3 Finland 10.4 11.4 11.5 14.9 14.1 13.5 13.1 11.9 13.3 12.2 14.0 12.7 Euro area 135.6 131.0 98.0 56.8 117.5 171.1 145.8 142.6 168.4 155.8 179.4 154.4 Euro area, adjusted ¹ 100.5 92.3 56.3 7.7 73.6 130.6 106.4 109.8 129.0 123.0 140.0 121.6 Denmark 5.0 3.2 6.1 7.1 6.5 6.2 7.9 6.8 7.8 6.9 7.6 6.8 Sweden 16.8 15.3 15.7 16.9 16.4 16.8 16.6 16.9 17.9 18.6 19.3 19.6 United Kingdom -17.8 -32.3 -44.1 -54.1 -65.3 -74.2 -65.1 -66.8 -65.5 -69.5 -66.1 -71.3 EU-15 139.6 117.3 75.8 26.7 75.1 118.8 97.5 91.6 119.4 104.8 130.2 100.8 EU-15, adjusted ¹ 62.9 42.4 11.0 -58.8 0.5 50.1 23.5 34.5 45.3 47.7 56.2 43.7 Cyprus -1.9 -2.2 -2.2 -2.8 -3.0 -3.0 -3.7 -2.9 -3.7 -3.0 -3.8 -3.2 Czech Republic -4.3 -2.3 -1.8 -3.4 -3.4 -2.3 -2.7 -2.2 -2.7 -2.2 -3.0 -2.3 Estonia -1.0 -1.0 -0.8 -0.8 -0.9 -1.2 -1.4 -1.4 -1.5 -1.5 -1.4 -1.5 Hungary -1.1 -1.7 -2.0 -3.2 -2.5 -2.2 -4.3 -3.2 -4.2 -3.1 -3.2 -2.6 Latvia -0.7 -1.0 -1.0 -1.2 -1.5 -1.5 -1.7 -1.7 -1.9 -1.9 -2.1 -2.2 Lithuania -1.0 -1.4 -1.3 -1.2 -1.2 -1.4 -1.4 -1.4 -1.7 -1.6 -1.8 -1.7 Malta -0.6 -0.6 -0.6 -0.9 -0.7 -0.6 -0.5 -0.7 -0.5 -0.8 -0.5 -0.8 Poland -8.8 -11.9 -10.6 -13.3 -8.5 -7.7 -8.9 -5.4 -9.9 -5.0 -11.3 -6.8 Slovakia -1.9 -2.2 -1.1 -1.0 -2.5 -2.3 -1.4 -0.6 -1.6 -0.9 -1.7 -1.4 Slovenia -0.7 -0.7 -1.2 -1.2 -0.7 -0.3 -0.5 -0.5 -0.5 -0.7 -0.6 -0.7 AC-10 -22.1 -24.9 -22.4 -29.1 -24.9 -22.5 -28.4 -21.4 -30.8 -22.8 -32.3 -25.8 EU-25 117.5 92.3 53.3 -2.4 50.2 96.3 69.2 70.3 88.7 82.1 98.0 75.1 USA -174.3 -221.6 -326.7 -497.7 -487.7 -522.2 -496.7 -493.5 -530.2 -514.2 -577.9 -527.5 Japan 89.8 109.0 115.8 126.4 78.4 99.4 101.8 93.4 126.3 111.5 151.2 125.7¹ See note 8 on concepts and sources.
TABLE 52 : Balance on current transactions with the rest of the world (in billions of Ecu/euro, 1997-2005)2003 2004 2005
estimate of forecast of forecast of1997 1998 1999 2000 2001 2002 X-2003 III-2004 X-2003 III-2004 X-2003 III-2004
Belgium 11.7 12.0 12.6 10.0 10.2 13.2 13.8 9.8 12.4 11.4 11.8 12.1 Germany -1.8 -5.2 -16.6 -23.2 12.2 65.6 64.7 54.6 79.7 63.0 84.1 54.5 Greece -2.3 -3.8 -6.8 -7.8 -8.0 -7.4 -7.9 -10.6 -7.7 -10.6 -6.9 -11.6 Spain 1.9 -4.6 -11.7 -19.9 -20.3 -18.7 -22.7 -23.7 -25.3 -25.5 -28.7 -28.3 France 31.6 30.8 35.5 18.0 22.7 24.0 11.0 13.7 12.1 14.6 12.8 11.5 Ireland 2.2 0.6 0.2 -0.4 -0.8 -1.0 -0.9 -1.2 -0.8 -1.4 -0.3 -1.0 Italy 28.6 20.5 11.1 -2.0 3.4 -4.0 -7.0 -15.6 -5.6 -18.4 -5.9 -18.1 Luxembourg : : : : : 1.0 : 1.6 : 1.9 : 2.3 Netherlands 20.5 10.5 14.8 19.5 14.9 9.3 11.0 7.0 17.6 17.7 24.9 20.3 Austria -5.5 -4.4 -5.9 -5.3 -4.0 1.0 1.2 -0.8 1.2 -0.9 1.2 -1.1 Portugal -5.7 -7.1 -9.4 -12.5 -11.6 -8.5 -6.0 -6.5 -5.8 -5.3 -5.5 -5.1 Finland 5.9 6.6 7.4 9.4 9.4 10.3 9.6 7.9 9.6 8.1 10.3 8.6 Euro area 87.1 55.8 31.3 -14.2 30.5 84.9 73.1 36.1 93.3 54.4 103.9 44.2 Euro area, adjusted ¹ 49.9 19.4 -31.8 -77.7 -14.5 67.0 43.8 27.7 64.0 46.0 74.6 35.8 Denmark 0.6 -1.4 2.8 2.5 5.4 3.7 5.3 5.5 5.2 5.7 5.6 6.5 Sweden 9.5 8.9 10.0 10.8 10.7 13.0 10.6 14.7 11.5 16.5 12.8 17.6 United Kingdom -1.4 -5.9 -37.1 -39.5 -37.8 -28.3 -36.0 -27.1 -35.5 -35.5 -28.6 -32.2 EU-15 95.8 57.5 7.1 -40.5 8.9 72.5 46.9 23.6 67.5 36.4 86.0 30.2 EU-15, adjusted ¹ 64.4 34.4 -7.9 -67.4 -26.4 57.2 20.7 49.7 41.3 62.5 59.8 56.3 Cyprus -0.3 -0.6 -0.1 -0.3 -0.4 -0.6 -0.5 -0.5 -0.4 -0.4 -0.4 -0.4 Czech Republic -3.0 -1.1 -1.4 -2.9 -3.7 -4.8 -5.0 -5.0 -5.4 -5.2 -5.4 -5.4 Estonia -0.5 -0.4 -0.2 -0.3 -0.4 -0.8 -1.1 -1.0 -1.0 -0.9 -0.8 -0.8 Hungary : : : : : -2.8 -4.5 -4.1 -4.9 -4.1 -5.2 -4.3 Latvia -0.3 -0.6 -0.6 -0.5 -0.8 -0.7 -0.8 -0.8 -0.9 -0.9 -1.0 -1.1 Lithuania -0.9 -1.2 -1.1 -0.7 -0.6 -0.8 -0.9 -1.0 -1.0 -1.1 -1.1 -1.1 Malta : : : : : -0.1 -0.3 -0.1 -0.3 -0.2 -0.3 -0.2 Poland -4.7 -5.9 -8.0 -10.8 -5.9 -5.3 -5.2 -3.7 -6.3 -4.1 -7.2 -5.4 Slovakia -1.6 -1.8 -0.7 -0.6 -2.0 -2.1 -1.1 -0.3 -1.4 -0.8 -1.4 -1.3 Slovenia 0.0 -0.1 -0.7 -0.6 0.0 0.4 0.1 0.0 0.1 -0.1 0.0 -0.2 AC-10 : : : : -16.2 -17.6 -21.3 -17.4 -24.1 -19.7 -25.8 -22.2 EU-25 : : : : -7.4 54.9 25.7 6.2 43.5 16.8 60.4 8.1 USA -97.2 -167.4 -256.9 -429.9 -422.8 -491.9 -508.0 -458.3 -547.0 -484.7 -595.2 -488.3 Japan 85.6 105.9 107.8 129.5 98.0 119.8 116.3 118.9 136.2 137.4 153.4 151.1¹ See note 8 on concepts and sources.
138
AN
NE
X

TABLE 53 : Export markets (a) (percentage change on preceding year, 1997-2005) 29.03.2004
2003 2004 2005estimate of forecast of forecast of
1997 1998 1999 2000 2001 2002 X-2003 III-2004 X-2003 III-2004 X-2003 III-2004 Belgium 9.3 8.2 6.9 11.9 1.1 2.4 3.5 4.0 6.7 7.2 7.8 7.4 Germany 9.8 7.3 5.9 12.3 0.6 3.8 3.2 4.0 6.5 7.2 7.3 7.4 Greece 8.8 6.0 5.6 9.7 1.6 3.2 4.3 4.5 6.8 7.4 7.6 7.6 Spain 9.4 8.5 6.0 10.8 0.6 1.9 2.4 3.1 6.0 6.7 7.2 7.1 France 9.6 7.3 7.2 10.7 0.6 2.9 3.7 4.6 6.6 7.3 7.4 7.4 Ireland 9.3 7.8 6.9 11.5 0.1 3.2 2.8 3.6 5.8 7.1 6.8 6.7 Italy 9.8 7.1 6.4 12.3 0.5 3.6 4.1 5.1 6.9 7.9 7.7 7.7 Luxembourg (b) : : : : : : : : : : : : Netherlands 7.9 7.2 4.8 9.6 0.3 2.3 3.5 4.2 5.5 6.3 6.6 6.6 Austria 10.3 8.6 6.6 12.5 1.2 2.0 4.0 4.6 6.5 7.4 7.3 7.4 Portugal 9.8 9.3 8.2 12.5 0.7 1.4 3.4 3.9 6.2 7.0 7.4 7.2 Finland 10.0 6.0 3.8 11.6 0.6 4.0 4.4 5.3 6.9 8.1 7.5 7.9 Euro area (c) 9.5 7.5 6.2 11.5 0.6 3.1 3.5 4.3 6.4 7.2 7.3 7.3 Denmark 6.9 5.0 9.5 0.1 2.6 4.0 4.5 6.0 6.7 6.9 6.9 Sweden 9.9 7.3 6.0 11.3 -0.4 3.5 3.4 3.9 6.2 7.1 7.1 6.9 United Kingdom 9.8 7.5 6.5 11.4 0.0 3.0 3.3 4.1 6.5 7.1 7.3 7.1 EU-15 (c) 9.5 7.4 6.2 11.5 0.5 3.1 3.5 4.2 6.4 7.2 7.3 7.3 Cyprus : : : : : : : : : : : : Czech Republic : : : : : : : : : : : : Estonia : : : : : : : : : : : : Hungary : : : : : : : : : : : : Latvia : : : : : : : : : : : : Lithuania : : : : : : : : : : : : Malta : : : : : : : : : : : : Poland : : : : : : : : : : : : Slovakia : : : : : : : : : : : : Slovenia : : : : : : : : : : : : AC-10 : : : : : : : : : : : : EU-25 : : : : : : : : : : : : USA 10.0 1.6 6.7 10.8 -2.2 6.5 4.8 5.2 7.5 8.1 8.4 8.5 Japan 11.6 3.2 9.1 12.5 -2.3 7.9 6.0 6.6 8.4 9.8 9.0 8.4(a) Imports to the various markets (incl. EU-markets) weighted according to their share in country's exports.(b) Included in the figures for Belgium.(c) Intra- and extra-EU trade.
TABLE 54 : Export performance (a) (percentage change on preceding year, 1997-2005)2003 2004 2005
estimate of forecast of forecast of1997 1998 1999 2000 2001 2002 X-2003 III-2004 X-2003 III-2004 X-2003 III-2004
Belgium -2.7 -3.8 -1.6 -2.5 -0.8 -0.9 -4.3 -1.4 -3.5 -3.0 -3.5 -2.2 Germany 1.6 0.2 -0.6 1.1 4.5 -1.1 -1.1 -1.4 -0.2 -0.3 0.1 -2.0 Greece -4.6 -4.1 -3.1 1.9 -6.8 -10.0 0.4 2.1 -1.9 -3.5 -1.4 -1.2 Spain 3.6 -3.1 -0.9 -1.4 1.7 -0.7 2.0 2.5 -0.6 -0.6 0.4 0.6 France 2.0 -0.5 -3.3 2.2 0.7 -1.0 -5.4 -5.9 -2.0 -2.4 -0.4 -1.8 Ireland 5.4 12.6 4.5 5.5 4.9 2.1 -8.2 -8.7 -0.5 -1.9 0.3 0.7 Italy -5.2 -3.4 -5.0 -0.5 0.4 -6.3 -6.7 -8.9 -1.6 -4.7 -1.8 -1.1 Luxembourg (b) : : : : : : : : : : : : Netherlands -1.9 -0.7 0.8 0.4 1.6 -2.7 -4.0 -3.8 -0.7 -1.4 -0.7 -0.2 Austria 2.1 -0.4 1.2 0.9 6.1 3.3 -1.2 -2.5 -0.2 -2.3 0.5 -0.3 Portugal -0.3 -1.5 : : : : 0.0 1.0 -1.0 -1.3 0.3 0.2 Finland 4.7 3.8 3.7 8.1 -2.4 0.2 -2.0 -3.2 -2.5 -3.5 -1.4 -2.2 Euro area (c) 0.2 -0.6 -1.5 0.9 2.2 -1.6 -3.3 -3.5 -1.1 -1.9 -0.6 -1.3 Denmark -5.2 2.3 0.6 -0.1 2.4 -1.3 -5.8 -1.9 -3.4 -2.0 -2.4 Sweden 2.4 -0.5 -1.0 -0.1 -3.1 -1.4 0.7 1.2 0.3 -1.0 0.1 -0.2 United Kingdom -1.8 -5.8 -2.8 0.2 1.3 -4.6 -2.7 -4.7 -0.8 -1.6 -0.4 -0.3 EU-15 (c) -0.2 -1.4 -1.6 0.7 1.8 -1.7 -3.1 -3.6 -1.0 -1.9 -0.6 -1.2 Cyprus : : : : : : : : : : : : Czech Republic : : : : : : : : : : : : Estonia : : : : : : : : : : : : Hungary : : : : : : : : : : : : Latvia : : : : : : : : : : : : Lithuania : : : : : : : : : : : : Malta : : : : : : : : : : : : Poland : : : : : : : : : : : : Slovakia : : : : : : : : : : : : Slovenia : : : : : : : : : : : : AC-10 : : : : : : : : : : : : EU-25 : : : : : : : : : : : : USA 5.0 0.5 -2.5 0.5 -3.8 -9.9 -4.2 -3.1 -2.3 0.7 -2.1 0.9 Japan -1.9 -4.5 -13.4 -0.1 -4.0 0.2 1.1 3.0 -0.8 2.1 0.1 -0.6(a) Index for exports divided by an index for growth of markets.(b) Included in the figures for Belgium.(c) Intra- and extra-EU trade.
139
AN
NE
X

TABLE 55 : World GDP, volume (percentage change on preceding year, 1998-2005) 29.03.2004
2003 2004 2005estimate of forecast of forecast of
( a ) 1998 1999 2000 2001 2002 X-2003 III-2004 X-2003 III-2004 X-2003 III-2004EU-15 18.2 2.9 2.9 3.6 1.7 1.1 0.8 0.8 2.0 2.0 2.4 2.4Euro area 14.5 2.9 2.8 3.5 1.6 0.9 0.4 0.4 1.8 1.7 2.3 2.3Belgium 0.6 2.0 3.2 3.8 0.6 0.7 0.8 1.1 1.8 2.0 2.3 2.5Denmark 0.4 2.5 2.6 2.8 1.6 1.0 0.8 0.0 2.0 2.1 2.3 2.2Germany 4.6 2.0 2.0 2.9 0.8 0.2 0.0 -0.1 1.6 1.5 1.8 1.8Greece 0.2 3.4 3.4 4.4 4.0 3.9 4.1 4.2 4.2 4.0 3.4 3.3Spain 1.3 4.3 4.2 4.2 2.8 2.0 2.3 2.4 2.9 2.8 3.3 3.3France 3.2 3.4 3.2 3.8 2.1 1.2 0.1 0.2 1.7 1.7 2.3 2.4Ireland 0.2 8.6 11.3 10.1 6.2 6.9 1.6 1.2 3.7 3.7 4.9 4.6Italy 2.4 1.8 1.7 3.0 1.8 0.4 0.3 0.3 1.5 1.2 1.9 2.1Luxembourg 0.0 6.9 7.8 9.1 1.2 1.3 1.2 1.8 1.9 2.4 2.8 3.1Netherlands 0.9 4.3 4.0 3.5 1.2 0.2 -0.9 -0.8 0.6 1.0 2.0 1.6Austria 0.5 3.9 2.7 3.4 0.8 1.4 0.9 0.7 1.9 1.8 2.5 2.5Portugal 0.2 4.6 3.8 3.4 1.7 0.4 -0.8 -1.3 1.0 0.8 2.0 2.2Finland 0.3 5.0 3.4 5.1 1.1 2.3 1.5 1.9 2.5 2.6 2.7 2.7Sweden 0.6 3.6 4.6 4.3 0.9 2.1 1.4 1.6 2.2 2.3 2.6 2.6United Kingdom 2.8 3.1 2.8 3.8 2.1 1.6 2.0 2.2 2.8 3.0 2.9 2.8Acceding Countries 0.9 3.8 3.2 4.1 2.5 2.4 3.1 3.6 3.8 4.0 4.2 4.2 - Cyprus 0.0 4.8 4.7 5.0 4.0 2.0 2.0 2.0 3.4 3.4 4.2 4.1 - Czech Republic 0.1 -1.0 0.5 3.3 3.1 2.0 2.2 2.9 2.6 2.9 3.3 3.4 - Estonia 0.0 4.6 -0.6 7.3 6.5 6.0 4.4 4.8 5.6 5.4 5.1 5.9 - Hungary 0.1 4.9 4.2 5.2 3.8 3.5 2.9 2.9 3.2 3.2 3.4 3.4 - Latvia 0.0 4.8 2.8 6.8 7.9 6.1 6.0 7.5 5.2 6.2 5.7 6.2 - Lithuania 0.0 7.3 -1.8 4.0 6.5 6.8 6.6 8.9 5.7 6.9 6.0 6.6 - Malta 0.0 3.4 4.1 6.4 -1.2 1.7 0.8 0.4 2.7 1.4 2.9 2.0 - Poland 0.4 4.8 4.1 4.0 1.0 1.4 3.3 3.7 4.2 4.6 4.8 4.8 - Slovakia 0.1 4.2 1.5 2.0 3.8 4.4 3.8 4.2 4.1 4.0 4.3 4.1 - Slovenia 0.1 3.7 5.9 4.1 2.9 2.9 2.1 2.3 3.1 3.2 3.7 3.6Candidate Countries 0.5 1.9 -3.8 6.5 -4.9 7.0 5.0 5.5 4.6 4.7 5.0 5.1 - Bulgaria 0.0 3.9 2.3 5.4 4.1 4.8 4.5 4.3 5.0 5.0 5.5 5.5 - Romania 0.1 -4.8 -1.2 2.1 5.7 4.9 4.6 4.9 4.9 5.1 5.1 5.3 - Turkey 0.4 3.1 -4.7 7.4 -7.5 7.8 5.1 5.8 4.5 4.6 5.0 5.0USA 21.8 4.2 4.5 3.7 0.5 2.2 2.8 3.1 3.8 4.2 3.3 3.2Japan 7.4 -1.1 0.1 2.8 0.4 -0.4 2.6 2.7 1.7 3.4 1.5 2.3Canada 2.1 4.1 5.7 5.3 1.9 3.3 1.9 1.7 2.8 2.2 3.3 3.0Norway 0.3 2.6 2.1 2.8 2.7 1.4 1.0 0.4 2.1 3.0 2.7 2.7Switzerland 0.5 2.8 1.3 3.7 1.0 0.2 0.1 -0.4 1.9 2.4 2.2 1.8Iceland 0.0 5.6 4.1 5.7 2.8 -0.6 2.3 3.0 3.8 4.5 4.8 4.8Australia 1.2 5.3 4.0 1.8 3.9 2.7 3.4 3.0 3.5 3.6 3.3 3.6New Zealand 0.2 0.4 5.0 2.7 3.5 4.3 2.0 2.9 3.0 3.1 3.4 3.9Industrialised countries 53.0 3.0 3.2 3.6 1.0 1.5 2.1 2.2 2.8 3.2 2.8 2.8Others 47.0 2.5 4.5 6.1 3.8 4.1 4.8 5.4 5.4 6.0 5.7 5.9CIS 4.1 -3.4 5.1 9.0 6.3 5.3 6.0 7.5 5.2 6.4 4.7 5.1 Russia 2.8 -5.3 6.4 10.0 5.1 4.7 6.0 7.3 5.0 6.5 5.0 5.4 Ukraine 0.5 -1.9 -0.2 5.9 9.2 4.1 5.5 8.5 5.5 6.0 5.5 6.0 Other 0.8 3.0 3.9 7.3 8.8 8.0 6.1 7.7 5.5 6.4 3.2 3.6OPEC 4.9 -3.0 0.4 4.4 2.7 2.1 2.5 3.1 4.0 5.0 4.5 4.9 Indonesia 1.6 -13.1 0.8 4.9 3.3 3.7 4.3 4.1 4.2 4.8 4.4 5.3Other emerging markets 38.1 3.8 5.0 6.0 3.6 4.2 5.0 5.5 5.6 6.1 6.0 6.1 Asia 25.5 4.0 6.7 6.8 5.2 6.0 6.3 7.2 6.7 7.3 6.7 7.0 - China 13.1 7.8 7.1 8.0 7.3 8.0 8.0 9.1 8.0 8.7 7.9 8.1 - India 4.9 6.0 7.1 4.0 5.5 4.9 6.3 7.7 6.1 6.8 5.9 6.7 - Hong Kong 0.4 -5.0 3.4 10.2 0.5 2.3 1.9 3.3 3.8 6.2 3.6 5.5 - Korea 1.8 -6.7 10.9 9.3 3.1 6.3 3.1 3.0 6.4 5.9 5.9 5.6 Latin America 9.6 2.9 1.1 4.5 0.4 0.3 2.0 1.7 3.4 3.5 4.4 4.3 - Argentina 0.7 3.8 -3.4 -0.8 -4.4 -10.9 4.5 7.3 5.0 6.1 5.5 5.1 - Brazil 2.7 0.1 0.8 4.4 1.4 1.5 1.1 0.3 3.1 3.4 4.5 4.7 - Mexico 2.0 5.0 3.6 6.6 -0.2 0.9 1.9 1.3 3.1 3.0 4.2 3.9 Africa 3.0 4.6 3.0 3.8 1.0 0.9 3.1 2.8 4.2 3.6 4.5 4.1 - South Africa 0.8 0.8 2.0 3.5 2.8 3.0 2.2 2.5 3.0 3.0 3.2 3.4World 100.0 2.7 3.8 4.8 2.3 2.7 3.3 3.7 4.1 4.5 4.1 4.3World excluding EU-15 81.8 2.7 4.0 5.0 2.5 3.1 3.9 4.4 4.5 5.1 4.5 4.7World excluding euro area 85.5 2.7 4.0 5.0 2.4 3.0 3.8 4.3 4.4 5.0 4.5 4.6(a) Relative weights, based on GDP (at constant prices and pps) in 2002.
140
AN
NE
X

TABLE 56 : World exports of goods, volume (percentage change on preceding year, 1998-2005) 29.03.2004
2003 2004 2005estimate of forecast of forecast of
( a ) 1998 1999 2000 2001 2002 X-2003 III-2004 X-2003 III-2004 X-2003 III-2004EU-15 (b) 36.4 6.8 5.1 12.2 2.9 1.3 0.3 0.5 5.3 5.2 6.7 6.0Euro area (b) 29.9 7.5 5.2 12.3 3.1 1.5 0.1 0.6 5.2 5.2 6.7 5.9Acceding Countries 2.4 13.2 5.4 21.0 8.7 6.5 7.7 11.7 7.9 9.6 8.8 8.8 - Cyprus 0.0 -13.0 -7.4 -2.4 5.9 -8.8 0.4 0.4 4.9 5.5 5.9 5.9 - Czech Republic 0.6 11.6 8.4 20.0 14.1 5.9 6.2 8.9 5.0 8.4 5.8 8.4 - Estonia 0.1 16.3 -2.6 40.9 -5.5 3.5 5.0 5.3 10.0 4.0 12.0 1.0 - Hungary 0.5 22.5 15.3 21.8 6.9 5.7 5.2 8.6 6.8 8.6 9.2 9.1 - Latvia 0.0 11.1 -3.0 14.0 8.6 11.0 10.0 13.5 10.0 9.8 11.0 7.7 - Lithuania 0.1 2.8 -21.1 15.0 24.6 20.1 10.0 6.3 8.0 9.2 8.0 9.4 - Malta 0.0 9.3 11.2 10.9 -5.8 7.0 2.2 -3.5 3.5 0.2 4.0 2.2 - Poland 0.7 11.9 1.0 25.9 7.8 6.6 8.6 15.1 11.2 12.8 12.2 10.5 - Slovakia 0.2 13.9 6.1 15.4 5.7 5.7 19.4 27.1 11.0 10.1 8.5 9.0 - Slovenia 0.2 9.4 2.7 12.9 6.9 6.5 3.4 4.5 5.3 5.5 5.7 5.9Candidate Countries 1.1 : : : : : 11.4 17.4 11.1 14.1 12.1 13.7 - Bulgaria 0.1 : : : : : 11.0 10.2 13.0 12.0 16.0 13.5 - Romania 0.3 3.2 10.2 24.7 10.9 19.8 10.1 11.3 9.2 12.5 9.0 12.1 - Turkey 0.8 10.3 3.1 12.4 21.6 15.5 12.0 20.5 11.5 15.0 12.5 14.3USA 10.7 2.2 3.8 11.2 -6.1 -4.0 0.4 1.9 5.0 8.9 6.1 9.5Japan 6.1 -1.5 -5.5 12.4 -6.2 8.1 7.2 9.8 7.5 12.1 9.1 7.8Canada 4.1 8.5 11.7 9.3 -3.5 0.2 -0.7 -2.0 4.8 3.9 5.4 4.6Norway 0.9 -1.1 3.2 2.1 7.7 1.2 0.6 -1.0 3.2 3.5 3.6 3.6Switzerland 1.6 3.8 6.5 11.6 1.4 1.1 -0.1 -0.1 4.7 4.1 4.1 2.9Iceland 0.0 6.1 -2.0 -7.9 -17.8 9.7 1.1 0.2 3.5 2.5 4.9 3.3Australia 1.0 0.1 5.2 9.5 1.1 4.5 5.0 5.0 6.5 7.0 7.5 7.5New Zealand 0.2 0.1 2.9 5.8 2.6 6.0 4.7 6.2 5.2 5.2 6.2 6.2Industrialised countries 64.6 : : : : : 1.5 2.3 5.6 6.8 6.9 6.9Others 35.4 6.8 8.6 15.4 -0.2 8.4 8.4 8.7 10.3 9.5 10.4 9.7CIS 2.4 -3.3 4.9 14.9 3.1 9.7 6.8 12.2 5.3 7.1 5.0 5.6 Russia 1.7 1.9 11.2 9.5 4.2 9.9 5.0 11.7 5.9 8.0 6.3 6.3 Ukraine 0.3 -12.4 -10.2 21.1 10.1 10.1 10.6 12.0 5.5 6.5 4.5 5.5 Other 0.4 -13.1 -7.6 33.7 -4.5 8.6 11.3 14.2 2.6 3.8 0.3 3.1OPEC 4.6 5.3 9.6 -3.5 0.1 -9.4 -0.5 -1.1 5.6 5.5 6.9 7.0 Indonesia 0.9 17.2 24.1 -17.2 1.1 -3.1 6.0 6.0 7.0 7.0 8.0 8.0Other emerging markets 28.4 7.9 8.8 18.6 -0.6 11.2 10.0 10.0 11.5 10.3 11.5 10.5 Asia 19.5 6.9 8.9 20.8 -1.0 15.3 12.8 12.4 13.8 11.9 13.6 11.9 - China 5.0 13.6 8.3 25.3 14.8 25.2 33.0 28.5 27.0 18.5 24.0 19.1 - India 0.8 4.4 12.8 20.1 9.9 16.4 6.0 9.0 5.5 5.5 6.0 6.0 - Hong Kong 3.1 -3.8 2.9 16.8 -3.7 8.3 7.5 8.5 7.8 10.0 8.0 10.0 - Korea 2.5 21.8 11.2 19.4 -13.0 30.5 7.0 8.0 7.7 8.5 8.7 8.0 Latin America 7.5 12.0 8.4 13.4 -1.1 0.4 3.8 4.0 6.9 7.1 7.3 7.5 - Argentina 0.4 11.9 -0.6 2.6 4.3 1.5 4.0 7.0 7.5 9.0 7.5 6.0 - Brazil 0.9 10.2 -0.7 7.0 11.4 8.4 6.0 8.0 6.0 7.0 6.0 6.0 - Mexico 2.5 12.3 14.0 16.5 -4.5 0.0 3.5 3.0 7.0 7.0 7.5 8.0 Africa 1.4 -1.5 8.6 14.4 7.7 11.7 4.3 7.4 4.6 6.5 4.7 8.1 - South Africa 0.5 -7.8 7.3 18.4 4.1 7.7 1.4 1.4 3.4 3.4 3.7 3.7World 100.0 : : : : : 4.0 4.6 7.3 7.7 8.1 7.9World excluding EU-15 63.6 : : : : : 6.0 6.9 8.4 9.2 8.9 9.0World excluding euro area 70.1 : : : : : 5.6 6.3 8.2 8.8 8.7 8.8(a) Relative weights, based on exports (at current prices and current exchange rates) in 2002.(b) Intra- and extra-EU trade.
TABLE 57 : Export shares in EU trade (goods only - 2002)Other
Acceding Candidate Emerging Latin EU-15 USA Japan Canada Countries Countries CIS OPEC Markets Asia America Africa World
EU-15 61.8 9.3 1.6 0.9 4.8 1.5 1.6 2.4 9.1 5.6 1.5 2.0 100Belgium 73.3 7.8 1.0 0.7 2.4 1.0 0.8 1.5 7.4 5.3 0.8 1.4 100Denmark 65.9 6.4 3.0 0.8 3.6 0.7 1.5 1.4 6.4 4.4 1.2 0.8 100Germany 54.5 10.5 1.9 0.9 8.2 1.8 2.5 2.0 9.8 6.9 1.4 1.5 100Greece 44.0 5.3 0.5 0.7 8.8 11.5 4.3 3.8 8.6 5.1 1.3 2.3 100Spain 71.6 4.4 0.8 0.5 3.1 1.4 0.8 2.5 8.9 2.9 3.2 2.8 100France 61.4 7.8 1.6 0.8 3.2 1.4 1.0 3.9 11.7 5.2 2.4 4.1 100Ireland 65.0 17.5 2.6 0.5 0.9 0.4 0.3 0.9 5.7 4.6 0.4 0.7 100Italy 53.9 9.6 1.7 0.9 5.4 3.2 2.0 3.8 11.3 6.5 2.3 2.5 100Luxembourg 85.7 2.7 0.4 0.4 2.4 0.4 0.7 0.7 2.7 1.5 0.5 0.7 100Netherlands 77.3 4.5 0.9 0.4 2.8 1.0 1.3 1.5 5.8 3.7 0.9 1.2 100Austria 61.4 5.0 1.2 0.7 12.1 2.1 1.8 1.3 5.4 4.0 0.6 0.8 100Portugal 80.7 5.6 0.3 0.5 1.3 0.6 0.2 0.7 6.8 1.6 1.0 4.1 100Finland 53.9 8.9 2.2 0.8 7.1 0.9 7.3 2.7 10.4 7.2 1.8 1.3 100Sweden 54.0 11.5 2.4 1.2 4.3 0.8 1.7 2.1 8.9 6.3 1.3 1.2 100United Kingdom 58.8 15.0 1.9 1.7 2.3 1.0 0.7 2.8 10.0 6.9 1.1 2.0 100
141
AN
NE
X

TABLE 58 : World imports of goods, volume (percentage change on preceding year, 1998-2005) 29.03.2004
2003 2004 2005estimate of forecast of forecast of
( a ) 1998 1999 2000 2001 2002 X-2003 III-2004 X-2003 III-2004 X-2003 III-2004EU-15 (b) 34.7 10.2 7.1 10.9 1.4 0.7 1.7 2.4 5.2 5.7 6.6 6.4Euro area (b) 27.5 10.5 7.3 11.1 0.9 0.0 1.9 2.6 5.2 5.7 6.6 6.6Acceding Countries 2.7 15.0 1.8 18.6 4.5 4.5 6.5 9.3 7.2 8.8 8.1 9.0 - Cyprus 0.1 8.2 -4.0 9.4 6.6 -1.6 0.3 -1.3 2.4 2.4 4.7 4.7 - Czech Republic 0.6 6.2 5.1 20.2 15.3 4.3 5.6 9.2 4.8 8.2 6.0 8.6 - Estonia 0.1 10.6 -7.9 32.6 0.3 5.2 9.0 12.5 9.0 9.8 10.0 9.6 - Hungary 0.6 25.9 14.0 20.4 3.8 4.9 7.0 10.1 6.2 7.5 7.1 7.0 - Latvia 0.1 21.1 -2.7 3.8 16.6 4.3 12.0 14.7 10.0 11.8 9.0 9.7 - Lithuania 0.1 7.0 -13.8 9.2 19.4 17.6 8.0 7.3 8.7 9.0 7.0 8.7 - Malta 0.0 1.6 8.7 17.6 -11.6 -1.8 5.0 3.2 3.4 2.5 3.4 1.7 - Poland 0.8 18.2 -3.2 22.0 -5.0 3.6 4.7 8.6 9.5 10.6 11.5 11.4 - Slovakia 0.3 16.8 -5.8 12.7 11.7 4.6 13.6 13.9 9.8 9.5 7.8 10.0 - Slovenia 0.2 10.8 8.6 7.7 3.2 4.4 4.5 6.8 5.6 6.7 6.0 6.3Candidate Countries 1.4 : : : : : 13.2 20.5 11.6 14.5 12.4 13.3 - Bulgaria 0.1 : : : : : 14.0 17.0 12.0 14.0 15.0 12.5 - Romania 0.3 14.9 -1.5 29.5 22.1 13.5 13.5 17.5 10.2 11.7 9.1 10.7 - Turkey 0.9 -1.1 -2.6 32.3 -23.9 17.3 13.0 22.0 12.0 15.5 13.0 14.2USA 18.4 11.7 12.4 13.5 -3.2 3.7 4.0 4.8 6.0 9.3 6.3 5.4Japan 4.7 -4.9 -1.0 11.9 0.1 1.1 4.2 6.7 6.1 9.0 6.7 8.0Canada 3.5 6.1 8.5 8.6 -5.6 1.4 4.2 3.3 5.6 5.4 6.2 5.9Norway 0.6 9.5 -3.4 3.0 -0.3 2.8 3.5 1.9 3.0 3.2 3.3 3.3Switzerland 1.5 7.1 4.0 10.2 1.8 -3.6 2.3 -1.2 6.2 1.4 2.2 2.2Iceland 0.0 25.7 1.1 -2.4 -22.4 -4.4 4.9 10.0 6.4 8.9 12.7 11.4Australia 1.1 6.9 6.6 5.5 -5.3 20.6 5.5 5.5 5.0 5.0 6.0 6.0New Zealand 0.2 2.4 13.3 -2.7 -4.0 15.9 5.0 5.0 4.8 4.8 5.8 5.8Industrialised countries 68.7 : : : : : 3.3 4.2 5.8 7.2 6.6 6.4Others 31.3 -0.5 5.7 16.4 0.8 8.4 7.8 8.5 10.3 10.8 10.7 10.7CIS 1.6 -13.8 -18.9 20.7 12.5 10.7 10.2 13.9 10.1 16.3 7.8 12.6 Russia 0.9 -17.4 -17.0 32.4 19.8 14.5 12.6 16.6 13.4 22.9 10.2 17.9 Ukraine 0.3 -14.3 -14.3 6.6 12.7 12.7 7.0 5.5 8.0 8.0 9.0 9.0 Other 0.4 -8.2 -23.9 11.7 -0.5 1.4 6.6 13.5 3.0 5.3 -0.2 0.0OPEC 2.9 -3.9 -1.0 11.2 5.9 -1.9 -0.2 0.7 6.9 9.5 5.1 6.6 Indonesia 0.5 -26.2 -11.1 32.4 -3.8 -15.5 4.8 4.8 6.0 6.0 6.0 6.0Other emerging markets 26.8 0.7 7.9 16.8 -0.5 9.4 8.5 9.0 10.7 10.6 11.4 11.0 Asia 17.9 -5.8 10.8 18.5 -4.4 15.6 11.7 12.1 12.8 11.9 12.9 12.0 - China 4.3 10.8 19.7 28.8 12.5 25.1 35.0 35.0 30.0 22.3 27.0 21.7 - India 1.0 16.7 3.4 5.8 1.7 15.7 5.0 5.0 6.5 6.5 7.4 7.4 - Hong Kong 3.2 -7.0 -0.5 18.1 -2.4 7.5 3.0 3.0 6.5 8.0 7.0 8.0 - Korea 2.3 -22.7 28.5 17.0 -23.3 41.2 7.3 7.3 6.7 10.0 7.7 10.5 Latin America 7.5 13.8 2.2 14.4 8.1 -4.8 2.2 2.4 7.3 8.3 9.7 9.8 - Argentina 0.1 8.9 -13.9 -0.9 -17.2 -54.5 35.0 28.0 25.0 28.0 15.0 17.0 - Brazil 0.7 10.6 -6.4 8.8 -3.9 -62.0 -5.0 2.0 9.0 10.0 12.5 12.5 - Mexico 2.6 17.3 14.9 21.4 17.3 18.1 2.5 1.5 6.0 7.0 9.0 9.0 Africa 1.4 11.5 1.7 6.8 2.8 6.6 0.4 5.5 2.6 5.7 3.1 5.8 - South Africa 0.4 -3.7 -3.1 15.8 1.1 9.3 4.6 4.6 3.9 3.9 3.4 3.4World 100.0 : : : : : 4.7 5.6 7.2 8.3 7.9 7.8World excluding EU-15 65.3 : : : : : 6.3 7.3 8.3 9.7 8.6 8.5World excluding euro area 72.5 : : : : : 5.8 6.7 7.9 9.3 8.4 8.2(a) Relative weights, based on imports (at current prices and current exchange rates) in 2002.(b) Intra- and extra-EU trade.
TABLE 59 : Import shares in EU trade (goods only - 2002)Other
Acceding Candidate Emerging Latin EU-15 USA Japan Canada Countries Countries CIS OPEC Markets Asia America Africa World
EU-15 60.4 7.0 2.7 0.6 4.3 1.4 2.4 2.3 12.5 8.6 1.8 2.1 100Belgium 70.7 6.6 3.2 0.5 1.9 0.8 1.1 1.1 10.2 6.3 1.5 2.4 100Denmark 70.5 3.7 1.3 0.7 4.2 0.9 0.8 0.3 7.8 6.3 1.1 0.5 100Germany 55.2 6.3 3.1 0.5 9.9 1.9 3.0 0.9 11.4 9.1 1.2 1.2 100Greece 52.2 4.7 3.0 0.3 2.0 3.9 9.3 5.8 14.8 11.8 1.6 1.4 100Spain 67.3 3.4 1.9 0.3 1.6 1.1 2.1 5.7 12.4 6.5 2.9 3.0 100France 66.1 6.8 1.9 0.6 2.1 1.2 1.8 2.9 10.8 5.9 1.9 3.0 100Ireland 66.1 15.8 2.7 0.8 0.9 0.3 0.1 0.1 9.6 8.6 0.5 0.5 100Italy 57.6 4.8 2.0 0.5 3.4 3.0 4.3 5.5 12.0 7.1 2.1 2.8 100Luxembourg 78.4 3.9 1.0 0.2 1.7 0.1 0.1 0.1 8.8 8.6 0.0 0.2 100Netherlands 52.9 9.0 4.0 0.6 2.1 0.8 2.1 2.8 19.9 15.1 3.2 1.7 100Austria 67.3 3.5 1.1 0.3 12.5 1.7 2.0 1.1 4.3 3.6 0.3 0.4 100Portugal 77.9 2.1 1.7 0.2 1.8 0.8 1.1 3.6 7.7 3.1 2.7 1.9 100Finland 64.6 3.7 3.0 0.4 5.2 0.4 10.4 0.0 6.7 4.9 1.3 0.5 100Sweden 66.0 5.3 2.6 0.4 5.0 0.6 2.0 1.0 7.4 6.0 1.2 0.3 100United Kingdom 52.6 12.0 3.6 1.5 2.1 1.4 1.3 1.1 17.4 12.3 1.9 3.2 100
142
AN
NE
X

TABLE 60 : World trade balances (fob-fob, bn. US dollars, 1997-2005) 29.03.2004
2003 2004 2005estimate of forecast of forecast of
1997 1998 1999 2000 2001 2002 X-2003 III-2004 X-2003 III-2004 X-2003 III-2004EU-15 158.3 131.3 80.8 24.7 67.2 112.1 109.8 103.5 138.8 131.1 150.3 125.2EU-15, adjusted ¹ 71.3 47.5 11.7 -54.3 0.4 47.4 26.4 39.0 52.7 59.7 64.8 54.3Euro area 153.8 146.6 104.4 52.4 105.2 161.4 164.2 161.2 195.8 194.9 207.0 191.8Euro area, adjusted ¹ 114.0 103.5 60.0 7.1 65.9 123.5 119.8 124.1 150.0 153.8 161.6 151.0Acceding Countries -25.0 -27.9 -23.9 -26.9 -22.3 -21.2 -31.9 -24.1 -35.9 -28.5 -37.3 -32.1Candidate Countries -24.9 -22.6 -16.8 -30.0 -9.0 -15.5 -29.1 -30.1 -38.6 -41.1 -48.1 -48.4USA -197.6 -248.1 -348.3 -459.2 -436.6 -492.6 -559.2 -557.7 -616.6 -643.2 -666.8 -655.1Japan 101.7 122.1 123.4 116.6 70.2 93.8 114.6 105.6 146.9 139.4 174.4 156.1Canada 18.5 16.0 28.3 45.7 44.5 36.8 44.4 43.0 46.6 48.7 46.4 49.1Norway 11.3 1.7 10.7 26.0 26.0 25.3 27.5 24.3 25.2 23.3 23.1 21.8Switzerland -0.3 -1.6 -0.2 -2.5 -2.8 3.3 1.0 -1.0 0.0 -1.4 2.4 4.3Iceland 0.0 -0.4 -0.3 -0.5 -0.3 -0.1 -0.3 -0.4 -0.3 -0.7 -0.6 -0.9Australia 1.8 -5.3 -9.7 -4.2 2.6 -4.1 -1.8 -3.2 -1.9 1.4 -1.8 0.6New Zealand 0.9 0.9 -0.4 0.7 1.5 0.5 0.3 0.5 0.6 0.6 1.1 1.2Industrialised countries 44.8 -33.8 -156.5 -309.6 -259.0 -261.8 -324.8 -339.6 -335.3 -370.4 -356.8 -378.3Others 69.5 96.4 204.7 288.1 222.4 264.7 362.6 322.9 362.7 345.2 372.1 310.8CIS 6.2 8.4 33.9 63.3 49.3 49.8 58.1 65.6 49.3 64.8 39.9 49.3OPEC 83.7 33.6 91.4 165.6 115.5 114.1 142.7 134.8 125.4 150.5 120.6 139.1Other emerging markets -20.4 54.4 79.4 59.2 57.6 100.7 161.8 122.5 188.0 129.9 211.5 122.3 Asia 15.9 119.2 114.9 92.5 88.1 105.3 138.2 102.8 180.8 96.1 229.4 118.9 Latin America -24.6 -47.6 -21.6 -23.4 -22.7 0.2 22.4 21.8 7.6 34.2 -16.9 4.7 Africa -11.7 -17.2 -13.9 -9.9 -7.8 -4.8 1.2 -2.0 -0.4 -0.5 -1.0 -1.2World 114.3 62.6 48.2 -21.5 -36.6 2.9 37.7 -16.7 27.4 -25.2 15.3 -67.5¹ See note 8 on concepts and sources.
TABLE 61 : World current account balances (bn. US dollars, 1997-2005)2003 2004 2005
estimate of forecast of forecast of1997 1998 1999 2000 2001 2002 X-2003 III-2004 X-2003 III-2004 X-2003 III-2004
EU-15 108.6 64.4 7.5 -37.3 7.9 68.4 52.9 26.7 78.5 45.5 99.3 37.5EU-15, adjusted ¹ 73.0 38.6 -8.4 -62.3 -23.6 54.1 23.3 56.2 48.0 78.2 69.0 69.9Euro area 98.8 62.5 33.4 -13.1 27.3 80.1 82.3 40.8 108.5 68.1 119.9 54.9Euro area, adjusted ¹ 56.6 21.7 -33.9 -71.8 -13.0 63.4 49.3 31.3 74.4 57.6 86.0 44.4Acceding Countries : : : : -14.5 -16.6 -24.0 -19.7 -28.1 -24.7 -29.7 -27.6Candidate Countries -9.2 -5.3 -5.9 -15.6 0.2 -4.5 -19.0 -17.1 -26.0 -24.9 -33.1 -30.1USA -110.2 -187.4 -273.9 -396.6 -378.5 -464.0 -572.0 -517.9 -636.2 -606.3 -686.8 -606.4Japan 97.0 118.6 114.9 119.5 87.7 113.0 131.0 134.4 158.4 171.9 177.0 187.7Canada -7.0 -7.6 2.4 24.1 17.9 15.4 17.9 19.0 18.5 23.1 17.8 22.0Norway 10.0 0.1 8.5 26.0 26.5 25.2 26.3 23.1 24.2 22.3 22.3 21.0Switzerland 24.0 24.0 28.4 28.9 27.1 36.1 25.9 27.3 42.5 26.9 51.5 31.5Iceland -0.1 -0.6 -0.6 -0.8 -0.3 -0.1 -0.1 -0.2 -0.1 -0.5 -0.4 -0.7Australia -12.4 -18.0 -23.0 -15.1 -8.7 -17.9 -13.8 -15.2 -13.9 -10.6 -13.8 -11.4New Zealand -4.3 -2.1 -3.5 -2.7 -1.4 -1.9 -2.1 -1.9 -1.8 -1.8 -1.3 -1.3Industrialised countries : : : : -236.1 -246.9 -377.0 -341.4 -384.1 -379.2 -397.2 -377.8Others -49.0 -31.8 82.3 153.8 102.3 160.0 269.6 239.1 274.8 246.8 291.3 226.4CIS -3.8 -6.0 23.0 48.6 33.4 34.4 43.1 49.3 34.1 50.0 27.6 37.1OPEC 18.4 -19.6 35.1 100.9 56.5 55.9 115.2 105.8 102.8 126.3 99.6 117.9Other emerging markets -63.6 -6.2 24.3 4.3 12.4 69.6 111.4 84.0 137.9 70.5 164.1 71.5 Asia 23.5 109.5 107.1 88.3 89.3 106.8 139.6 110.1 174.2 99.4 218.0 120.8 Latin America -77.5 -102.5 -72.7 -76.7 -72.9 -36.9 -37.9 -33.6 -44.4 -38.1 -62.0 -58.1 Africa -9.7 -13.2 -10.2 -7.4 -4.0 -0.3 9.6 7.5 8.1 9.2 8.2 8.9World : : : : -133.8 -86.9 -107.4 -102.3 -109.2 -132.4 -105.9 -151.3¹ See note 8 on concepts and sources.
143
AN
NE
X

TABLE 62 : Primary commodity prices (in US dollars, percentage change on preceding year, 1997-2005) 29.03.2004
2003 2004 2005SITC estimate of forecast of forecast ofClassification 1997 1998 1999 2000 2001 2002 X-2003 III-2004 X-2003 III-2004 X-2003 III-2004Food (0 + 1) -5.7 -14.6 -15.2 -2.4 1.2 8.5 3.8 3.8 -1.5 14.3 -0.3 -2.2Basic materials (2 + 4) -1.7 -14.7 -2.1 4.6 -8.1 2.3 9.0 8.0 3.5 16.2 1.1 -2.8- of which : Agricultures non-food -5.3 -14.3 -3.1 0.4 -6.9 7.4 10.4 7.0 1.5 10.0 0.7 -2.1 - of which : Wood and pulp -6.4 -13.1 8.8 2.7 -9.9 -3.1 12.2 7.0 4.6 3.8 1.8 -1.4 Minerals and metals 3.7 -15.4 -0.8 10.5 -9.7 -4.4 7.1 9.6 6.5 25.0 1.8 -3.6Fuel products (3) -6.7 -28.4 25.1 49.5 -9.4 -0.3 11.9 12.2 -8.2 8.1 -5.3 -6.4- of which : Crude petroleum -7.5 -33.4 41.1 59.1 -12.4 0.2 13.2 13.8 -9.6 9.0 -5.9 -7.1Primary commodities- Total excluding fuels -3.1 -14.7 -6.7 2.4 -5.3 4.3 7.3 6.6 1.9 15.6 0.7 -2.6- Total including fuels -4.2 -20.7 7.1 26.6 -7.7 0.0 9.9 9.8 -3.9 11.3 -2.6 -4.7
Crude petroleum - price per barrel (us dollar)Brent 19.1 12.7 17.9 28.5 25.0 25.0 28.3 28.5 25.6 31.1 24.1 28.9
Note on concepts and sources
1. Directorate General "ECFIN" produces, under its own formalities, and thereby the scope and precision of intra-EU responsibility, short- term economic forecasts twice a year: trade coverage. Typically, intra-EU imports are underestimated in the spring and in the autumn. These forecasts cover the compared to intra-EU exports, leading to an overestimation principal macroeconomic aggregates for the Member States, of the surplus. The "adjusted" balances are eurostat the Acceding Countries, the European Union as a whole, (for EU-15) and ECB (for euro area) estimates for the past. the euro area and the international environment. For the future, they are ECFIN's forecasts based on the
extrapolation of the discrepancies observed in 2002.
2. Data for 2003, 2004 and 2005 are estimates and projections. 9. Tables 38, 40 and 43 are based on Excessive Deficit Procedure data The sources for all tables are the Commission services, from 1999 onwards, as reported in the first notification in 2004 except where it is stated otherwise. In general, the historical and subsequent revisions. Data before 1999 according to ESA 95. data for the Member States are based on the ESA 95 system. (See Eurostat news release N° 38, 16 March 2004). For DE, IE, LU and PT data start in the late 1980s or early 1990s. Tables 36, 38, 39 and 41 include swap related settlements. For all other Member States most data have been reported for longer periods in the past. For the USA and Japan 10. The allocation of mobile phone licences (UMTS) impacts strongly the definitions are as in the SNA. on the general government accounts for some countries in 2000,
2001 and 2002. Tables 36, 38 and 40 include the amounts from3. Tables 5 and 6 on domestic demand and final demand the sale of the licences, while the cyclically adjusted balances in respectively present data including inventories. tables 41 and 42 exclude these amounts. The amounts in bn of
national currency are for 2000 : DE 50.5, ES 0.5, IT 13.8, NL 2.7,4. In Table 17 national index for USA and Japan, and for AT 0.8, PT 0.4, UK 22.5, EU-15 105.9 and euro area 69.0. EU Member States and aggregates before 1996. For 2001 : BE 0.4, DK 3.2, EL 0.6, FR 1.2, EU-15 2.8 and euro area 2.3.
For 2002 : FR 0.6, IE 0.2, EU-15 0.8 and euro area 0.8.5. The potential output gap is calculated with reference to potential output estimated in a production function where the increase in 11. German, EU-15 and euro area figures concern unified Germany the capital stock and the difference between actual from 1991 onwards; for percentage changes from 1992 onwards. unemployment and the NAIRU play a key role. The cyclical adjustment of budgetary balances is based on this concept, 12. With respect to the acceding countries, which are presently in a except for DE, ES and AT. In Table 14 output gaps are calculated transition phase, data may not always be directly comparable to according to the alternative method using the Hodrick-Prescott filter, the existing member states. which is used for the cyclical adjustment in the case of DE, ES and AT.
13. Geographical zones are defined as follows :6. Employment data are based on numbers of persons employed. Euro area : The concept of full-time equivalent is used for Spain, France, EUR-12 (EU-15 excluding DK, SE and the UK) Italy, the Netherlands and Austria. Tables 22-28 and 32-33 Acceding Countries (AC-10) : use data on the basis of FTE for these countries. Cyprus, Czech Republic, Estonia, Hungary, Latvia,
Lithuania, Malta, Poland, Slovakia and Slovenia.7. The nominal short term interest rates are defined as the 3-month Candidate countries : interbank rates. The nominal long term interest rates are defined Bulgaria, Romania and Turkey. as the central government benchmark bond of 10 years from 1995. Industrialised Countries :
EU-15, AC-10, Candidate Countries, USA, Japan, Canada,8. EU-15 and euro area data are aggregated using exchange rates. Norway, Switzerland, Iceland, Australia and New Zealand. World GDP is aggregated at Purchasing Power Standards (PPS). OPEC : In the tables on world trade and international payments, the Algeria, Indonesia, Iran, Iraq, Kuwait, Libya, Nigeria, Qatar, aggregation is done on the basis of current exchange rates. Saudi Arabia, United Arab Emirates and Venezuela. Tables 49 - 52, 60 and 61 show also EU-15 and euro area Asia : "adjusted" balances. Theoretically, balances of EU-15 and All countries except Indonesia, Iran, Iraq, Japan, Kuwait, euro area vis-à-vis third countries should be identical to the sum Qatar, Saudi Arabia and UAE. of the balances of the individual countries in the EU-15 or Latin America : euro area aggregate. However, intra-EU-15 or intra euro area All countries except Venezuela. balances are, due to reporting errors, non-zero. The creation Africa : of the internal market in 1993 reduced border controls and All countries except Algeria, Libya and Nigeria.
144
AN
NE
X

List of contents of European Economy
Basic editions
1, November 1978• Annual Economic Report 1978–79• Annual Economic Review 1978–79
2, March 1979• European monetary system
— Texts of the European Council of 4 and 5 December 1978
3, July 1979• Short-term economic trends and prospects• The European monetary system
— Commentary— Documents
4, November 1979• Annual Economic Report 1979–80• Annual Economic Review 1979–80
5, March 1980• Short-term economic trends and prospects• Adaptation of working time
6, July 1980• Short-term economic trends and prospects —
Borrowing and lending instruments looked atin the context of the Community’s financial instruments
7, November 1980• Annual Economic Report 1980–81• Annual Economic Review 1980–81
8, March 1981• Economic trends and prospects —
The Community’s borrowing and lending operations recent developments
9, July 1981• Fifth medium-term economic policy programme
— The main medium-term issues: an analysis
10, November 1981• Annual Economic Report 1981–82• Annual Economic Review 1981–82
11, March 1982
• Economic trends and prospects — Unit labour costs in manufacturing industry and in the whole economy
12, July 1982
• Documents relating to the European monetary system
13, September 1982
• The borrowing and lending activities of the Community in 1981
14, November 1982
• Annual Economic Report 1982–83• Annual Economic Review 1982–83
15, March 1983
• Economic trends and prospects — Budgetary systems and procedures — Industrial labour costs — Greek capital markets
16, July 1983
• Business investment and the tax and financial environment — Energy and the economy: a study of the main relationships in the countries of the European Community — The foreign trade of the Community, the United States and Japan
17, September 1983
• The borrowing and lending activities of the Community in 1982
18, November 1983
• Annual Economic Report 1983–84• Annual Economic Review 1983–84
19, March 1984
• Economic trends and prospects —Industrial labour costs — Medium-term budget balance and the public debt — The issue of protectionism

20, July 1984• Some aspects of industrial productive
performance in the European Community: an appraisal — Profitability, relative factor prices and capital/labour substitution in the Community, the United States and Japan, 1960–83 — Convergence and coordination of macroeconomic policies: some basic issues
21, September 1984• Commission report to the Council and to
Parliament on the borrowing and lending activities of the Community in 1983
22, November 1984• Annual Economic Report 1984–85• Annual Economic Review 1984–85
23, March 1985• Economic trends and prospects 1984–85
24, July 1985• The borrowing and lending activities of
the Community in 1984
25, September 1985• Competitiveness of European industry:
situation to date — The determination of supply in industry in the Community — The development of market services in the European Community, the United States and Japan — Technical progress, structural change and employment
26, November 1985• Annual Economic Report 1985–86• Annual Economic Review 1985–86
27, March 1986• Employment problems: views of businessmen
and the workforce — Compact — A prototype macroeconomic model of the European Community in the world economy
28, May 1986• Commission report to the Council and to
Parliament on the borrowing and lending activities of the Community in 1985
29, July 1986• Annual Economic Review 1986–87
30, November 1986
• Annual Economic Report 1986–87
31, March 1987
• The determinants of investment — Estimation and simulation of international trade linkages in the Quest model
32, May 1987
• Commission report to the Council and to Parliament on the borrowing and lending activities of the Community in 1986
33, July 1987
• The economy outlook for 1988 and budgetary policy in the Member States — Economic trends in the Community and Member States
34, November 1987
• Annual Economic Report 1987–88
35, March 1988
• The economics of 1992
36, May 1988
• Creation of a European financial area
37, July 1988
• Commission report to the Council and to Parliament on the borrowing and lending activities in the Community in 1987
38, November 1988
• Annual Economic Report 1988–89
39, March 1989
• International trade of the European Community
40, May 1989
• Horizontal mergers and competition policy in the European Community
41, July 1989
• The borrowing and lending activities of the Community in 1988 — Economic convergence in the Community: a greater effort is needed

42, November 1989
• Annual Economic Report 1989–90
43, March 1990
• Economic transformation in Hungary and Poland
44, October 1990
• One market, one money
45, December 1990
• Stabilisation, liberalisation and devolution
46, December 1990
• Annual Economic Report 1990–91
47, March 1991
• Developments on the labour-market in the Community — Quest — A macroeconomic model for the countries of the European Community as part of the world economy
48, September 1991
• Fair competition in the international market: Community State aid policy — The ecu and its role in the process towards monetary union
49, 1993
• Reform issues in the former Soviet Union
50, December 1991
• Annual Economic Report 1991–92
51, May 1992
• The climate challenge: Economic aspects of the Community’s strategy for limiting CO2 emissions
52, 1993
• The European Community as a world trade partner
53, 1993
• Stable money — sound finances: Community public finance in the perspective of EMU
54, 1993
• Annual Economic Report for 1993
55, 1993
• Broad economic policy guidelines and convergence report
56, 1994
• Annual Economic Report for 1994
57, 1994
• Competition and integration — Community merger control policy
58, 1994
• 1994 broad economic policy guidelines — Report on the implementation of macrofinancial assistance to third countries
59, 1995
• Annual Economic Report for 1995
60, 1995
• 1995 broad economic policy guidelines
61, 1996
• Annual Economic Report for 1996
62, 1996
• 1996 broad economic policy guidelines
63, 1997
• Annual Economic Report for 1997
64, 1997
• 1997 broad economic policy guidelines
65, 1998
• Commission’s recommendation concerning the third stage of economic and monetary union — Convergence report 1998 — Growth and employment in the stability-oriented framework of EMU
66, 1998
• 1998 broad economic policy guidelines
67, 1999
• 1999 Annual Economic Report

68, 1999• 1999 broad economic policy guidelines
69, 1999• The EU economy: 1999 review
70, 2000• 2000 broad economic policy guidelines —
Convergence report 2000 — Proposal for a Council decision for the adoption by Greece of the single currency on 1 January 2001
71, 2000• The EU economy: 2000 review
72, 2001• 2001 broad economic policy guidelines
73, 2001• The EU economy: 2001 review
Investing in the future
Reports and studies
1-1993
• The economic and financial situation in Italy
2-1993
• Shaping a market economy legal system
3-1993
• Market services and European integration: the challenges for the 1990s
4-1993
• The economic and financial situation in Belgium
5-1993
• The economics of Community public finance
6-1993
• The economic and financial situation in Denmark
1-1994
• Applying market principles to government borrowing — Growth and employment: the scope for a European initiative
2-1994
• The economic and financial situation in Germany
3-1994
• Towards greater fiscal discipline
4-1994
• EC agricultural policy for the 21st century
5-1994
• The economics of the common agricultural policy (CAP)
6-1994
• The economic interpretation between the EU and eastern Europe
7-1994
• The economic and financial situation in Spain

1-1995
• The economic and financial situation in the Netherlands
2-1995
• Report on the implementation of macrofinancial assistance to the third countries in 1994
3-1995
• Performance of the European Union labour market
4-1995
• The impact of exchange-rate movements on trade within the single market
1-1996
• The economic and financial situation in Ireland. Ireland in the transition to EMU
2-1996
• The CAP and enlargement — Economic effects of the compensatory payments
3-1996
• Ageing and pension expenditure prospects in the western world
4-1996
• Economic evaluation of the internal market
1-1997
• The economic and financial situation in Portugal in the transition to EMU
2-1997
• The CAP and enlargement — Agrifood price developments in five associated countries
3-1997
• The European Union as a world trade partner
4-1997
• The welfare state in Europe — Challenges and reforms
5-1997
• Towards a common agricultural and rural policy for Europe
6-1997
• The joint harmonised EU programme of business and consumer surveys
1-1998
• Getting environmental policy right — The rational design of European environmental policy
2-1998
• The economic and financial situation in Austria
3-1998
• Income benefits for early exit from the labour market in eight European countries — A comparative study
1-1999
• The economic and financial situation in Finland
2-1999
• Income insurance in European agriculture
3-1999
• State aid and the single market
4-1999
• Liberalisation of network industries
5-1999
• Italy’s slow growth in the 1990s
6-1999
• Generational accounting in Europe
1-2000
• The report on the implementation of the 1999 broad economic policy guidelines
2-2000
• Public debt and fiscal policy in EMU
3-2000
• Public finances in EMU — 2000
4-2000
• Performance of the European Union labour market — Joint harmonised EU programme of business and consumer surveys

1-2001
• Current issues in economic growth
2-2001
• Report on the implementation of the 2000 broad economic policy guidelines
3-2001
• Public finances in EMU — 2001
4-2001
• The budgetary challenges posed by ageing populations
5-2001
• The efficiency defense and the European system of merger control
Special editions
Special issue 1979• Changes in industrial structure in the European
economies since the oil crisis 1973–78 — Europe — its capacity to change in question
Special edition 1990• The impact of the internal market by industrial
sector: the challenge for the Member States
Special edition No 1/91• The economics of EMU
Special edition No 2/91• The path of reform in central
and eastern Europe
Special edition No 1/92• The economics of limiting CO2 emissions
New numbering
2002
1-2002• Report on the implementation of the 2001
broad economic policy guidelines
2-2002• Economic forecasts — Spring 2002
3-2002• Public finances in EMU — 2002
4-2002• 2002 broad economic policy guidelines
5-2002• Economic forecasts — Autumm 2002
6-2002• The EU economy: 2002 review
Special Report No 1/2002• Responses to the challenges
of globalisation
Special Report No 2/2002• European integration and the functioning
of product markets

New numbering
2003
1-2003• Report on the implementation of the 2002
broad economic policy guidelines
2-2003• Economic forecasts — Spring 2003
3-2003• Public finances in EMU — 2003
4-2003• Broad economic policy guidelines
(for the 2003–05 period)
5-2003• Economic forecasts — Autumn 2003
6-2003• The EU economy: 2003 review
2004
1-2004• Report on the implementation of the 2003–05
broad economic policy guidelines
2-2004• Economic forecasts — Spring 2004


ORDER FORM
for European Economy
ORDER FORM — Annual subscriptionEuropean Economy Main issues ISSN 0379-0991
Special reports ISSN 1684-033XPrice of annual subscription (six issues minimum per year):EUR 150
Date: Signature: ......................................................
Numberof copies:
Name and address:
ORDER FORM — Single issue
European Economy Main issue ISSN 0379-0991
ISBN . . . . . . . . .
Special report ISSN 1684-033XISBN . . . . . . . . .
Title requested . . . . . . . . . . . . . . . . . . . . . . Price of single issue: EUR 50
Date: Signature:
Numberof copies:
Name and address:
Office despublications officiellesdes Communautés européennes
L-2985 Luxembourg

Office des publications officiellesdes Communautés européennes
L-2985 Luxembourg
Office des publications officiellesdes Communautés européennes
L-2985 Luxembourg

Bulletin of the European Union European Commission > Bulletin of the European Union
Want to keep track of the European Union’s activities?
On the Internet, consult the Bulletin of the European Union,the source of information on the Union’s activities
http://europa.eu.int/abc/doc/off/bull/en/welcome.htm
Published monthly in the official EU languages and, from the January/February 2004 issue onwards, in the languages of the new MemberStates, the Bulletin offers summaries of the decisions, communica-tions, events, etc. occurring each month, under the appropriate subjectheadings, together with specific references to the legal base and earliertexts.
Starting from the January/February 2003 issue, the new electronicversion of the Bulletin (described overleaf) will be enhanced with asearch engine and links to official documents (OJ and COM).
Paper version
This version, available on subscription, produced by the Office forOfficial Publications of the European Communities, can be obtainedfrom sales agents throughout the world. The list of sales agents can beconsulted at the following Internet address:
http://publications.eu.int/general/en/salesagents_en.htm
Office for Official Publications of the European Communities2, rue Mercier, L-2985 Luxembourg — Fax (352) 29 29-44619
Starting from the January/February 2003 issue of theBulletin of the European Union —
Electronic version
Search
• By means of words in the heading and/or text
In the languages of the European Union
• By language, covering all the Bulletins published: since 1994 inFrench; since 1996 in Spanish, Danish, German, Greek, English,Italian, Dutch, Portuguese, Finnish and Swedish; from 2004 on-wards, in the languages of the new Member States
Links
• To the texts published in the Official Journal of the European Unionand referred to in the Bulletin
• To the texts of the European Commission’s legislative proposalsand communications (COM documents) referred to in the Bulletin
http://europa.eu.int/abc/doc/off/bull/en/welcome.htm


European Economy appears six times a year. It contains important reportsand communications from the Commission to the Council and theParliament on the economic situation and developments ranging from theBroad economic policy guidelines and its implementation report to theEconomic forecasts, the EU Economic review and the Public financereport. As a complement, Special reports focus on problems concerningeconomic policy.
Subscription terms are shown on the back cover and the address of thesales offices are shown on the inside back cover.
Unless otherwise indicated the texts are published under the responsibilityof the Directorate-General for Economic and Financial Affairs of theEuropean Commission, BU1, B-1049 Brussels, to which enquiries otherthan those related to sales and subscriptions should be addressed.
BELGIQUE/BELGIË
Jean De LannoyAvenue du Roi 202/Koningslaan 202B-1190 Bruxelles/BrusselTél. (32-2) 538 43 08Fax (32-2) 538 08 41E-mail: [email protected]: http://www.jean-de-lannoy.be
La librairie européenne/De Europese BoekhandelRue de la Loi 244/Wetstraat 244B-1040 Bruxelles/BrusselTél. (32-2) 295 26 39Fax (32-2) 735 08 60E-mail: [email protected]: http://www.libeurop.be
Moniteur belge/Belgisch StaatsbladRue de Louvain 40-42/Leuvenseweg 40-42B-1000 Bruxelles/BrusselTél. (32-2) 552 22 11Fax (32-2) 511 01 84E-mail: [email protected]
DANMARK
J. H. Schultz Information A/SHerstedvang 4DK-2620 AlbertslundTlf. (45) 43 63 23 00Fax (45) 43 63 19 69E-mail: [email protected]: http://www.schultz.dk
DEUTSCHLAND
Bundesanzeiger Verlag GmbHVertriebsabteilungAmsterdamer Straße 192D-50735 KölnTel. (49-221) 97 66 80Fax (49-221) 97 66 82 78E-Mail: [email protected]: http://www.bundesanzeiger.de
ELLADA/GREECE
G. C. Eleftheroudakis SAInternational BookstorePanepistimiou 17GR-10564 AthinaTel. (30) 21 03 25 84 40Fax (30) 21 03 25 84 99E-mail: [email protected]: www.books.gr
ESPAÑA
Boletín Oficial del EstadoTrafalgar, 27E-28071 MadridTel. (34) 915 38 21 11 (libros), 913 84 17 15(suscripción)Fax (34) 915 38 21 21 (libros), 913 84 17 14(suscripción)E-mail: [email protected]: http://www.boe.es
Mundi Prensa Libros, SACastelló, 37E-28001 MadridTel. (34) 914 36 37 00Fax (34) 915 75 39 98E-mail: [email protected]: http://www.mundiprensa.com
FRANCE
Journal officielService des publications des CE26, rue DesaixF-75727 Paris Cedex 15Tél. (33) 140 58 77 31Fax (33) 140 58 77 00E-mail: [email protected]: http://www.journal-officiel.gouv.fr
IRELAND
Alan Hanna’s Bookshop270 Lower Rathmines RoadDublin 6Tel. (353-1) 496 73 98Fax (353-1) 496 02 28E-mail: [email protected]
ITALIA
Licosa SpAVia Duca di Calabria, 1/1Casella postale 552I-50125 FirenzeTel. (39) 05 56 48 31Fax (39) 055 64 12 57E-mail: [email protected]: http://www.licosa.com
LUXEMBOURG
Messageries du livre SARL5, rue RaiffeisenL-2411 LuxembourgTél. (352) 40 10 20Fax (352) 49 06 61E-mail: [email protected]: http://www.mdl.lu
NEDERLAND
SDU Servicecentrum UitgeversChristoffel Plantijnstraat 2Postbus 200142500 EA Den HaagTel. (31-70) 378 98 80Fax (31-70) 378 97 83E-mail: [email protected]: http://www.sdu.nl
PORTUGAL
Distribuidora de Livros Bertrand Ld.a
Grupo Bertrand, SARua das Terras dos Vales, 4-AApartado 60037P-2700 AmadoraTel. (351) 214 95 87 87Fax (351) 214 96 02 55E-mail: [email protected]
Imprensa Nacional-Casa da Moeda, SASector de Publicações OficiaisRua da Escola Politécnica, 135P-1250 -100 Lisboa CodexTel. (351) 213 94 57 00Fax (351) 213 94 57 50E-mail: [email protected]: http://www.incm.pt
SUOMI/FINLAND
Akateeminen Kirjakauppa/Akademiska BokhandelnKeskuskatu 1/Centralgatan 1PL/PB 128FIN-00101 Helsinki/HelsingforsP./tfn (358-9) 121 44 18F./fax (358-9) 121 44 35Sähköposti: [email protected]: http://www.akateeminen.com
SVERIGE
BTJ ABTraktorvägen 11-13S-221 82 LundTfn (46-46) 18 00 00Fax (46-46) 30 79 47E-post: [email protected]: http://www.btj.se
UNITED KINGDOM
The Stationery Office LtdCustomer ServicesPO Box 29Norwich NR3 1GNTel. (44-870) 60 05-522Fax (44-870) 60 05-533E-mail: [email protected]: http://www.tso.co.uk
ÍSLAND
Bokabud Larusar BlöndalEngjateigi 17-19IS-105 ReykjavikTel. (354) 552 55 40Fax (354) 552 55 60E-mail: [email protected]
NORGE
Swets Blackwell ASHans Nielsen Hauges gt. 39Boks 4901 NydalenN-0423 OsloTel. (47) 23 40 00 00Fax (47) 23 40 00 01E-mail: [email protected]
SCHWEIZ/SUISSE/SVIZZERA
Euro Info Center Schweizc/o OSEC Business Network SwitzerlandStampfenbachstraße 85PF 492CH-8035 ZürichTel. (41-1) 365 53 15Fax (41-1) 365 54 11E-mail: [email protected]: http://www.osec.ch/eics
B@LGARIJA
Europress Euromedia Ltd59, blvd VitoshaBG-1000 SofiaTel. (359-2) 980 37 66Fax (359-2) 980 42 30E-mail: [email protected]: http://www.europress.bg
CYPRUS
Cyprus Chamber of Commerceand IndustryPO Box 21455CY-1509 NicosiaTel. (357-22) 88 97 52Fax (357-22) 66 10 44E-mail: [email protected]
EESTI
Eesti Kaubandus-Tööstuskoda(Estonian Chamber of Commerce and Industry)Toom-Kooli 17EE-10130 TallinnTel. (372) 646 02 44Fax (372) 646 02 45E-mail: [email protected]: http://www.koda.ee
HRVATSKA
Mediatrade LtdStrohalov Prilaz 27HR-10000 ZagrebTel. (385-1) 660 08 40Fax (385-1) 660 21 65E-mail: [email protected]
MAGYARORSZÁG
Euro Info ServiceSzt. István krt.12IIl emelet 1/APO Box 1039H-1137 BudapestTel. (36-1) 329 21 70Fax (36-1) 349 20 53E-mail: [email protected]: http://www.euroinfo.hu
MALTA
Miller Distributors LtdMalta International AirportPO Box 25Luqa LQA 05Tel. (356) 21 66 44 88Fax (356) 21 67 67 99E-mail: [email protected]
POLSKA
Ars PolonaKrakowskie Przedmiescie 7Skr. pocztowa 1001PL-00-950 WarszawaTel. (48-22) 826 12 01Fax (48-22) 826 62 40E-mail: [email protected]
ROMÂNIA
EuromediaStr.Dionisie Lupu nr. 65, sector 1RO-70184 BucurestiTel. (40-21) 260 28 82Fax (40-21) 260 27 88E-mail: [email protected]
SLOVAKIA
Centrum VTI SRNámestie Slobody 19SK-81223 Bratislava 1Tel. (421-2) 54 41 83 64Fax (421-2) 54 41 83 64E-mail: [email protected]: http://www.cvtisr.sk
SLOVENIJA
GV Zalozba d.o.o.Dunajska cesta 5SI-1000 LjubljanaTel. (386) 13 09 1800Fax (386) 13 09 1805E-mail: [email protected]: http://www.gvzalozba.si
TÜRKIYE
Dünya Aktüel A.SGlobus Dünya Basinevi100, Yil Mahallessi 34440TR-80050 Bagcilar-IstanbulTel. (90-212) 440 22 27Fax (90-212) 440 23 67E-mail: [email protected]
ARGENTINA
World Publications SAAv. Córdoba 1877C1120 AAA Buenos AiresTel. (54-11) 48 15 81 56Fax (54-11) 48 15 81 56E-mail: [email protected]: http://www.wpbooks.com.ar
AUSTRALIA
Hunter PublicationsPO Box 404Abbotsford, Victoria 3067Tel. (61-3) 94 17 53 61Fax (61-3) 94 19 71 54E-mail: [email protected]
BRASIL
Livraria CamõesRua Bittencourt da Silva, 12 CCEP20043-900 Rio de JaneiroTel. (55-21) 262 47 76Fax (55-21) 262 47 76E-mail: [email protected]: http://www.incm.com.br
CANADA
Les éditions La Liberté Inc.
3020, chemin Sainte-FoySainte-Foy, Québec G1X 3V6Tél. (1-418) 658 37 63Fax (1-800) 567 54 49E-mail: [email protected]
Renouf Publishing Co. Ltd
5369 Chemin Canotek Road Unit 1Ottawa, Ontario K1J 9J3Tel. (1-613) 745 26 65Fax (1-613) 745 76 60E-mail: [email protected]: http://www.renoufbooks.com
EGYPT
The Middle East Observer
41 Sherif Street11111 CairoTel. (20-2) 392 69 19Fax (20-2) 393 97 32E-mail: [email protected]: http://www.meobserver.com.eg
MALAYSIA
EBIC Malaysia
Suite 47.01, Level 47Bangunan AmFinance (letter box 47)8 Jalan Yap Kwan Seng50450 Kuala LumpurTel. (60-3) 21 62 62 98Fax (60-3) 21 62 61 98E-mail: [email protected]
MÉXICO
Mundi Prensa México, SA de CV
Río Pánuco, 141Colonia CuauhtémocMX-06500 México, DFTel. (52-5) 533 56 58Fax (52-5) 514 67 99E-mail: [email protected]
SOUTH KOREA
The European Union Chamber ofCommerce in Korea
Suite 2004, Kyobo Bldg.1 Chongro 1-Ga, Chongro-GuSeoul 110-714Tel. (82-2) 725-9880/5Fax (82-2) 725-9886E-mail: [email protected]: http://www.eucck.org
SRI LANKA
EBIC Sri Lanka
Trans Asia Hotel115 Sir ChittampalamA. Gardiner MawathaColombo 2Tel. (94-1) 074 71 50 78Fax (94-1) 44 87 79E-mail: [email protected]
T’AI-WAN
Tycoon Information Inc
PO Box 81-466105 TaipeiTel. (886-2) 87 12 88 86Fax (886-2) 87 12 47 47E-mail: [email protected]
UNITED STATES OF AMERICA
Bernan Associates
4611-F Assembly DriveLanham MD 20706-4391Tel. (1-800) 274 44 47 (toll free telephone)Fax (1-800) 865 34 50 (toll free fax)E-mail: [email protected]: http://www.bernan.com
ANDERE LÄNDER/OTHER COUNTRIES/AUTRES PAYS
Bitte wenden Sie sich an ein Büro IhrerWahl/Please contact the sales office ofyour choice/Veuillez vous adresser aubureau de vente de votre choix
Office for Official Publicationsof the European Communities2, rue MercierL-2985 LuxembourgTel. (352) 29 29-42001Fax (352) 29 29-42700E-mail: [email protected]: http://publications.eu.int
7/2003
Venta • Salg • Verkauf • Pvlèseiw • Sales • Vente • Vendita • Verkoop • Venda • Myynti • Försäljninghttp://eur-op.eu.int/general/en/s-ad.htm
CL_CoverEN_404049 26/04/04 14:14 Page 2

No 2 / 2004
ISSN 0379-0991
EUROPEANECONOMY
EUROPEAN COMMISSIONDIRECTORATE-GENERAL FOR ECONOMIC
AND FINANCIAL AFFAIRS
Economic forecastsSpring 2004
EURO
PEAN
ECON
OM
YN
o 2
/ 2004
Price (excluding VAT) in Luxembourg: EUR 50
European Economy (6 issues minimum per year): EUR 150
The annual subscription runs from 1 January to 31 December of each year.
Payments to be made only to the agents in the countries listed on page 3 of the cover of European Economy.
These are surface mail rates; for air subscription rates please apply to the sales offices.
http://europa.eu.int/comm/economy_finance
10K
C-A
R-04-002-E
N-C
,!7IJ2I9-eejfhb! ISBN 92-894-4957-8
CL_CoverEN_404049 26/04/04 14:14 Page 1