Embed Size (px)
Citation preview

Economic and Financial Affairs
Summer 2018 (Interim)
ISSN 2443-8014 (online)
European Economic Forecast
INSTITUTIONAL PAPER 084 | JULY 2018
EUROPEAN ECONOMY

European Economy Institutional Papers are important reports analysing the economic situation and economic developments prepared by the European Commission's Directorate-General for Economic and Financial Affairs, which serve to underpin economic policy-making by the European Commission, the Council of the European Union and the European Parliament. Views expressed in unofficial documents do not necessarily represent the views of the European Commission.
LEGAL NOTICE Neither the European Commission nor any person acting on behalf of the European Commission is responsible for the use that might be made of the information contained in this publication. This paper exists in English only and can be downloaded from https://ec.europa.eu/info/publications/economic-and-financial-affairs-publications_en. Luxembourg: Publications Office of the European Union, 2018 PDF ISBN 978-92-79-77465-2 ISSN 2443-8014 doi:10.2765/81909 KC-BC-18-016-EN-N
© European Union, 2018 Reuse is authorised provided the source is acknowledged. The reuse policy of European Commission documents is regulated by Decision 2011/833/EU (OJ L 330, 14.12.2011, p. 39). For any use or reproduction of material that is not under the EU copyright, permission must be sought directly from the copyright holders.

European Commission Directorate-General for Economic and Financial Affairs
European Economic Forecast Summer 2018 (Interim)
EUROPEAN ECONOMY Institutional Paper 084


CONTENTS
iii
Resilient growth amid increased uncertainty 1
1. Euro area and EU outlook 2 1.1. Global growth becoming less synchronised 2
1.2. European financial markets show resilience to risks 3
1.3. Expansion continues in lower gear 5
1.4. Labour market conditions set to continue improving 8
1.5. Energy prices drive inflation higher in the near term 9
1.6. Risks tilted to the downside 10
2. Prospects by Member States 12 2.1. Belgium 12
2.2. Bulgaria 12
2.3. Czech Republic 13
2.4. Denmark 13
2.5. Germany 14
2.6. Estonia 15
2.7. Ireland 15
2.8. Greece 16
2.9. Spain 16
2.10. France 17
2.11. Croatia 18
2.12. Italy 18
2.13. Cyprus 19
2.14. Latvia 20
2.15. Lithuania 20
2.16. Luxembourg 21
2.17. Hungary 22
2.18. Malta 22
2.19. The Netherlands 23
2.20. Austria 23
2.21. Poland 24
2.22. Portugal 24
2.23. Romania 25
2.24. Slovenia 26
2.25. Slovakia 26
2.26. Finland 27
2.27. Sweden 27
2.28. The United Kingdom 28
Statistical Annex 30
LIST OF TABLES
1. Overview - the summer 2018 (interim) forecast 1
1.1. International environment 2
LIST OF GRAPHS
1.1. Global GDP growth and JPMorgan Global Composite PMI 2
1.2. Oil price, developments and assumptions 3

iv
1.3. Benchmark 10-year government bond spreads, selected Member States 4
1.4. Real GDP growth, EU28 (contribution by Member States) 5
1.5. Economic Sentiment Indicator and PMI Composite Output, euro area 6
1.6. Retail trade volumes and retail confidence, euro area 6
1.7. Real GDP and its components, euro area 7
1.8. Real GDP growth, euro area and Member States, 2016-2017 versus 2018-
2019 8
1.9. Employment expectations, DG ECFIN surveys, euro area 9
1.10. HICP, euro area 9
1.11. Inflation expectations derived from implied forward inflation-linked swap
rates 10

RESILIENT GROWTH AMID INCREASED UNCERTAINTY
Summer 2018 (Interim) forecast
1
Following five consecutive quarters of vigorous GDP growth, economic momentum in the euro area
moderated in the first half of the year. GDP growth eased to 0.4% (q-o-q) in the first quarter and the
evidence available so far suggests that this softness extended into the second quarter. Outside the EU,
activity remains solid overall but growth rates are becoming more differentiated across countries and
regions and downside risks are rising.
Although the slowdown of European economic activity in early 2018 is widely believed to have reflected
a number of temporary factors, confidence and activity failed to rebound in spring, as trade tensions
escalated, political uncertainty rose in some Member States, and oil prices continued their rising trend.
While the nature of the current ‘soft patch’ is not yet fully clear and developments in global trade policy
have emerged as a major downside risk to the near and medium term outlook, the fundamentals for
sustained growth in Europe remain in place. The euro area economy continues to benefit from
supportive monetary conditions, with low financing costs for companies and governments despite the
expected gradual withdrawal of monetary stimulus. Furthermore, brightening labour market conditions,
as well as improving household balance sheets and still elevated levels of consumer confidence, should
ensure continued private consumption growth going forward despite some dampening effect from higher
energy prices. Finally, while the support from the external environment is subject to great uncertainty in
view of current trade policy tensions, the direct impact of protectionist measures so far remains limited
and the baseline forecast continues to see an expansion in global trade this year and next, which should
ensure continued demand for European goods and services.
Overall, euro area and EU economies are set to continue expanding this year and in 2019, but at a
more moderate pace than in 2017 when growth was the fastest in a decade. Mirroring the weaker-than-
expected activity in the first half of the year, the outlook for GDP growth in the euro area and the EU in
2018 has been revised to 2.1%, down by 0.2 pps. compared to the spring forecast, and remains
unchanged at 2.0% in 2019. Wages and core inflation pressures are still expected to rise only gradually
over this year and next. Headline inflation in the euro area has, however, been revised up to 1.7% in
both 2018 and 2019 as a result of higher energy prices.
This relatively benign outlook is, however, predicated on the non-escalation of trade tensions and
conflicts at global level. Hence significant downside risks exist. First and foremost, if trade tensions
with the US were to escalate further, this could dampen confidence more permanently, weighing on
global investment and trade flows, and likely disrupting the current global cyclical upswing. This adds
to concerns about the potential for negative consequences from renewed bouts of financial market
volatility and a faster-than-expected tightening of global financing conditions, as well as increased
imbalances stemming from the highly pro-cyclical fiscal policy in the US. Additional risks relate to
political and policy uncertainty in a number of EU countries (including the outcome of Brexit
negotiations), as well as political and geopolitical tensions outside Europe.
2017 2018 2019 2018 2019 2017 2018 2019 2018 2019
Euro area 2.4 2.1 2.0 2.3 2.0 1.5 1.7 1.7 1.5 1.6
EU27 2.6 2.3 2.1 2.5 2.2 1.6 1.8 1.8 1.6 1.7
EU28 2.4 2.1 2.0 2.3 2.0 1.7 1.9 1.8 1.7 1.8
Table 1:
Overview - the summer 2018 (interim) forecast
Real GDP Inflation
forecast forecast forecast forecast
Summer 2018 Spring 2018 Summer 2018 Spring 2018

1. EURO AREA AND EU OUTLOOK
Summer 2018 (Interim) forecast
2
1.1. GLOBAL GROWTH BECOMING LESS
SYNCHRONISED
Global economic activity remains solid overall but
growth rates are becoming more differentiated
across countries and regions and downside risks
are rising. GDP data for the first quarter of 2018
indicate that growth momentum remains strong,
with global growth advancing by 0.9% (q-o-q),
unchanged from the previous quarter (see
Graph 1.1). Growth slowed somewhat in advanced
economies but picked up in emerging markets,
with robust growth in emerging Asia, led by China
and India. At the same time, several other
emerging markets surprised on the downside (e.g.
South Africa, Brazil). High-frequency indicators
point to a weakening momentum in global
manufacturing output, which has so far been
compensated by a rebound in the service sector.
The outlook for global growth outside the EU
remains unchanged at 4.2% for 2018, despite
sizeable downward revisions for Latin America.
Global growth outside the EU is projected to
moderate somewhat to 4.1% in 2019, slightly
weaker than projected in the spring, as economic
activity is expected to slow in both the US and
China (see Table 1.1).
The US economy continues to benefit from several
tailwinds, including a strong labour market, strong
sentiment and fiscal stimulus. However, this highly
pro-cyclical loosening of fiscal policy entails
significant risks and is expected to further widen
the US current account deficit in the near term,
which could reinforce protectionist tendencies. The
protectionist measures now beginning to
materialise are likely to weigh on business
confidence and investment in the US. In emerging
markets, economic performance is forecast to
diverge somewhat. The financial market turmoil
experienced by some of the more vulnerable
countries in recent weeks (e.g. in Argentina and
Turkey) implies lower growth over the forecast
horizon, while other emerging markets are
expected to post solid growth (emerging Asia) and
some are set to benefit from higher oil prices
(Russia and OPEC countries).
Global import volumes (outside the EU) are
expected to increase by 4.9% in 2018, moderately
less than in 2017 and less than expected in the
spring forecast. The first quarter of 2018 retained
the strong momentum from the previous year,
boosted by strong imports in emerging Asia
(including China) and Latin America and solid
imports in most advanced economies. Trade
growth will, however, likely level off and
decelerate later this year and in 2019, when global
import growth (outside the EU) is expected to
settle down to a still-solid 4.4%. This deceleration
reflects increased trade tensions following the
measures implemented so far and rising
uncertainty over global growth in the medium
term. The trend has already been signalled by a
gradual worsening of high-frequency trade
indicators, although these mostly remain above
their historical averages.
35
40
45
50
55
60
65
-1.5
-1.0
-0.5
0.0
0.5
1.0
1.5
08 09 10 11 12 13 14 15 16 17 18
q-o-q%
Graph 1.1: Global GDP growth and JPMorgan
Global Composite PMI
Growth contribution from emerging markets, pps. (lhs)
Growth contribution from advanced economies, pps. (lhs)
Composite PMI - emerging markets (rhs)
Composite PMI - advanced economies (rhs)
Sources: Data Insight, IMF and national statistical institutes for
GDP, JPMorgan/Markit for PMI.
index > 50 = expansion
Table 1.1:
(Annual percentage change)
2014 2015 2016 2017 2018 2019 2017 2018 2019
World (excl.EU) 3.8 3.5 3.4 3.9 4.2 4.1 3.9 4.2 4.2
World (excl.EU) exports of goods and services 3.2 1.3 1.7 4.7 4.2 4.1 4.7 4.4 4.1
World (excl.EU) imports of goods and services 3.4 0.6 1.1 5.3 4.9 4.4 5.3 5.1 4.5
Real GDP growth
Merchandise trade volumes
International environment
Summer interim 2018 Spring 2018
forecast forecast

Summer 2018 (Interim) forecast
3
Futures markets suggest higher oil prices
The oil price surges in May, driven by strong
demand and tightening supplies, levelled off
temporarily in June after OPEC (and Russia)
signalled their willingness to increase oil supplies
with immediate effect. These additional supplies
are expected to partly compensate for the
continuing supply disruptions in Venezuela and the
risk of lower supply from Iran in the wake of US
sanctions. Price volatility around current levels is
expected to persist for the remainder of 2018, as
geopolitical tensions and potential supply
disruptions remain unpredictable and existing
stocks have declined. As higher oil prices weigh
on oil demand growth and additional supplies from
the US should become available in 2019, oil prices
are projected to edge down, mainly in the second
half of 2019. Overall, based on futures markets, an
average price of 72.8 USD/bbl is assumed in 2018
– equivalent to a 33% increase from 2017 and
5.6% higher than assumed in the spring forecast –
and 71.8 USD/bbl for 2019. In euro terms, given
the euro’s recent depreciation vis-à-vis the US
dollar, upward revisions compared to the spring
are higher, amounting to 9.9% in 2018 and 16.6%
in 2019 (see Graph 1.2).
Downside risks to the global growth outlook have
intensified since the spring forecast, most notably
those related to the rise in trade protectionism.
Some trade-related risks have already materialised:
the US imposed tariffs on steel and aluminium
from China, the EU, Canada and Mexico; and
selected imports from China; and launched an
investigation into automobile imports on national
security grounds. Several US trading partners,
including the EU, have responded with counter-
measures (see technical box for an overview of the
implemented measures). While the direct
macroeconomic effect of the measures
implemented so far are likely to be rather
limited, (1)
the broader impact on confidence and
investment decisions could be much more
significant and immediate. The central scenario for
global growth and trade does not incorporate a
further escalation in trade protectionism but this
remains a serious downside risk that could derail
global growth over the forecast horizon and
beyond.
Financial vulnerabilities in several emerging
markets linked to high debt and leverage present
another downside risk to the global outlook.
Emerging market currencies have been
increasingly coming under pressure in recent
weeks as the monetary policy normalisation in the
US and a stronger US dollar have shifted investor
interest away from riskier assets in more
vulnerable emerging market economies. Although
the ongoing tightening of global financial
conditions has not had a material impact on growth
and financial stability so far (with the exception of
isolated cases such as Argentina), the pressure on
emerging markets is clearly increasing and could
result in unforeseen disruptions going forward.
Among them, China is vulnerable due to its high
financial leverage and exposure to protectionist
measures.
1.2. EUROPEAN FINANCIAL MARKETS SHOW
RESILIENCE TO RISKS
Increasing monetary policy divergence…
Monetary policy divergence between the euro area
and the US has increased further. While the ECB
signalled in June that it will maintain an
accommodative monetary policy stance, the US
Federal Reserve has increased its target range for
the federal funds rate by 25 bps to 1.75%-2.00%.
Moreover, the Fed has indicated that another two
interest rate hikes may be required in 2018,
compared to just one previously, and that three
interest rates hikes may be necessary next year.
The resulting divergence in expected future policy
rates between the US and the euro area has been
further magnified by the introduction of an
enhanced ECB forward guidance on policy rates,
according to which key ECB interest rates are
expected ‘to remain at their present level at least
(1) ECB (2018). ‘Implications of rising trade tensions for the
global economy’. ECB Economic Bulletin 3, pp. 21-25.
(see Box 1)
10
30
50
70
90
110
130
12 13 14 15 16 17 18 19
pri
ce p
er b
bl
Graph 1.2: Oil price, developments and assumptions
USD/bbl
EUR/bbl
annual
assumption

Summer 2018 (Interim) forecast
4
through the summer of 2019’. Although net asset
purchases are anticipated to end in December
2018 (2)
, this is subject to incoming data
confirming the medium-term inflation outlook.
…reflected in a weakening euro.
The euro has weakened by more than 5% against
the US dollar since mid-April this year in a context
of fiscal stimulus and an improved economic
outlook in the US; and weakening economic
momentum and rising political uncertainty in some
euro area Member States. In nominal effective
terms, the euro has depreciated by 1.5%.
Financial markets have taken a more cautious
tone recently…
Prices on global financial markets are increasingly
reflecting investor concerns about the adverse
effects of trade tensions. The upside pressure on
oil prices and the further expected rise in US
interest rates have also led global investors to take
a more cautious stance, particularly in emerging
markets. In the EU, political developments in some
Member States have weighed on investor
sentiment.
Benchmark yields for some euro area Member
States have fallen back in the past few months
amid weaker-than-expected economic data in the
euro area, renewed risk aversion, and
accommodative monetary policy. Italian bond
yields spiked briefly over political stability and
fiscal sustainability concerns but quickly stabilised
below 3% (for 10-year bonds), and the initial
contagion to other sovereign bonds proved brief
(see Graph 1.3). In the US, Treasury yields
oscillated around 3% before declining somewhat,
as fragilities in some emerging market economies
triggered higher risk aversion and pushed investors
back to safe-haven sovereign bonds.
EU stock markets continued to oscillate without
clear direction. While the depreciation of the euro
vis-à-vis the US dollar has been supportive to euro
area stocks, weaker economic indicators
compounded with an escalation of trade tensions
and the increase in oil prices weighed on EU
equity markets. European bank shares
(2) To be precise, the ECB announced that: “the Governing
Council anticipates that, after September 2018, subject to
incoming data confirming [its] medium-term inflation
outlook, the monthly pace of the net asset purchases will be reduced to EUR 15 billion until the end of December 2018
and that net purchases will then end.”
underperformed as yield curves flattened.
Corporate bond yields have risen over the past few
months, but, taken in historical perspective, risk
premia are still compressed in many segments.
Corporate bond issuance volumes have been
strong, particularly in the high-yield segment.
Meanwhile, macro-financial vulnerabilities are
building up in several parts of the global financial
system. Globally, valuations of certain financial
(and real) assets continue to seem stretched.
Markets appear to be pricing in expectations that
the unwinding of unconventional monetary policy
measures in major regions of the world will lift
risk-free interest rates in an orderly and moderate
way.
…but funding flows remain strong.
Bank lending continued to expand over the last
few months in the euro area. Net lending growth
stood at 3.6% for non-financial corporations
(NFCs) and 2.9% for the household sector in May.
The April 2018 ECB Bank Lending Survey points
to further easing of credit standards in 2018-Q2.
Demand for bank loans has been supported by the
low level of interest rates and interest rate
differentials between euro area Member States
have narrowed further over the last couple of
months for both households and NFCs, except in
some Member States. Market funding for NFCs
continued to expand in the euro area.
Overall, households and NFCs are expected to
remain unconstrained financially, with benign
financial conditions assumed over the forecast
horizon. In addition, the euro area corporate sector
continues to run funding surpluses generating
substantial internal funds, which could potentially
be used to boost investment.
0
100
200
300
400
500
600
700
800
17 18
ES EL PT IT
Graph 1.3: Benchmark 10-year government bond
spreads, selected Member Statesbps.
Source: Macrobond

Summer 2018 (Interim) forecast
5
1.3. EXPANSION CONTINUES IN LOWER GEAR
Growth momentum diminished at the start of
the year…
In mid-2018, the European economic outlook
remains solid but has moved into a lower gear
compared to last year. In the first quarter of the
year, GDP grew by 0.4% (q-o-q) in both the euro
area and the EU, following 0.7% (q-o-q) growth in
the five preceding quarters in both areas. All in all,
this represents the 20th
consecutive quarter of
expansion. The weaker outturn may reflect some
adjustment given that growth has been running
above its long-run rate for some time. Temporary
factors (3)
such as unusual weather conditions,
strikes in some Member States, the timing of
Easter and a wave of influenza-related sick leaves
are also likely to have played a role, but are hard to
quantify. Despite the soft patch, GDP expanded in
the first quarter in all reporting Member States
except Romania and Estonia.
…amid a marked shift in growth composition…
The GDP breakdown for 2018-Q1 shows that the
expansion in the euro area was mainly supported
by private consumption and investment, whereas
the contribution of public consumption was
neutral. At the same time, net exports became a
drag (-0.2 pps.), following two consecutive
quarters of positive contributions to GDP growth.
Private consumption gained some momentum in
the first quarter (from 0.2% q-o-q to 0.5%), as
labour markets continued to improve and
consumer confidence remained higher than
average. The pick-up was broad-based across most
of the large euro area economies.
Investment growth receded somewhat to 0.5% in
the first quarter (after 1.2%), with investment
expanding across the largest euro area economies,
apart from Italy. The contribution of changes in
inventories to GDP growth turned positive,
preventing an even sharper slowdown. The assets
breakdown indicates that the slowdown was due to
non-construction spending.
After 20 consecutive quarters of expansion,
including growth of 2.2% in the last quarter of
(3) On whether the moderation has any bearing on
medium-term growth see Draghi, M. (2018). ‘Monetary
policy in the euro area’. Speech at the ECB Forum on
Central Banking, Sintra, 19 June.
2017, exports of goods and services contracted by
0.4% (q-o-q) in the first quarter of this year. The
decline in exports was broad-based across the
largest euro area economies, apart from Spain, and
particularly marked in Italy and Germany.
According to Eurostat’s international trade data,
extra-EU exports of goods fell by 0.3% (q-o-q)
(+2.1% q-o-q in 2017-Q4) whereas intra-EU
exports fell by 0.6% (following +0.9% in the
preceding quarter). Imports contracted as well, but
the fall was more muted than that of exports.
…and available data signal continued
moderation in the second quarter…
Incoming data on activity and sentiment provide
more evidence that the soft patch in euro area
activity extended into the second quarter. While
the impact of temporary factors has largely waned,
activity and sentiment have so far failed to recover.
In June, the Commission’s Economic Sentiment
Indicator (ESI) remained broadly unchanged in the
euro area for the third consecutive month, while
the Eurozone Flash Composite Output Purchasing
Managers’ Index (PMI) rose from an 18-month
low in May, driven by the service sector (see
Graph 1.5). Meanwhile, sentiment in
manufacturing continued to deteriorate, falling to a
18-month low. Weaker output and order books
have been linked to intensifying trade and political
concerns.
2.3
1.9
2.4
2.12.0
0.0
0.5
1.0
1.5
2.0
2.5
3.0
15 16 17 18 19
DE ES FR IT NL RoEU
Graph 1.4: Real GDP growth, EU28
(contribution by Member States)
forecast
pps.

Summer 2018 (Interim) forecast
6
The momentum in euro area industrial production
deteriorated further in April to -1.2% (3m-o-3m)
(from -0.6% in March), with momentum of new
industrial orders falling from -1.0% in March
to -2.2% in April.
Available high-frequency indicators are consistent
with a moderation of private consumption
expenditure in 2018-Q2. After moving up in
2018-Q1, consumer confidence edged downwards
again in 2018-Q2. At the same time, the
Commission’s Retail Trade Confidence Indicator
also decreased in the euro area and the EU in the
second quarter, although it remains at historically
high levels.
By contrast, the momentum in retail trade volumes
geared up in May (+0.6% 3m-o-3m), following an
unchanged level in the first quarter (see
Graph 1.6), whereas car registrations fell markedly
over the same period (-1.0% 3m-o-3m, following
+1.4% in 2018-Q1). Loans to euro area households
for consumption purposes recorded an annual
increase of 7.2% in May, close to its highest
growth rate since late 2006. (4)
At the same time, high-frequency indicators of
business investment have been more benign. The
industrial production of capital goods rose in April
(+1.9% m-o-m), following a contraction in
2018-Q1 (-2.0%). The capacity utilisation rate in
manufacturing is close to its highest since 2008,
which suggests a growing obsolescence of the
capital stock, with equipment increasingly
mentioned as a factor limiting production.
Furthermore, May 2018 saw the strongest annual
growth of loans to non-financial corporations in
(4) For an up-to-date statistical picture of economic conditions
for the household sector see ECB (2018). ‘Household
sector report’. May 2018.
nine years, (5)
which bodes well for business
investment spending.
This positive momentum is also visible in the
Commission’s Construction Confidence Indicator,
which reached its highest level since early-1990 in
2018-Q2. Construction output in April increased
by 1.8% (m-o-m) in the euro area (+1.2% in the
EU) after remaining unchanged in 2018-Q1 (-0.4%
in the EU). At the same time, loans for house
purchases grew at an annual rate of 3.1% in May,
close to the 3.3% reached in December 2017,
which was the highest rate since September 2011.
Exports are expected to have remained subdued in
the second quarter. The assessment of export order
books in the Commission’s manufacturing survey
has fallen from the post-crisis high reached in
2018-Q1. The IHS Markit’s Manufacturing PMI
new export orders index points to a continued
underperformance in both April and May. And
data from the Centraal Planbureau (CPB) on the
volume of trade in goods in the euro area shows
that the growth momentum (3m-o-3m) moved
further down to -1.4% in April (-0.7% in March).
…as the outlook is clouded by lower sentiment
and uncertainty…
The recent spell of weak data, coupled with fading
tailwinds and an increasing number of headwinds
suggest that the European economy is unlikely to
regain the strong momentum it enjoyed in 2017.
Rising headwinds include first and foremost the
fall-out from ongoing trade tensions (6)
. The central
(5) Loans adjusted for sales and securitisation. (6) See ECB (2018). ‘Implications of rising trade tensions for
the global economy’. ECB Monthly Bulletin May 2018,
pp. 21-5 (Box 1) and A. Barattieri, M. Cacciatore and
30
40
50
60
60
70
80
90
100
110
120
08 09 10 11 12 13 14 15 16 17 18
Economic Sentiment Indicator (lhs)
PMI Composite Output Index (rhs)
3-month moving average (ma) 3-month ma
Graph 1.5: Economic Sentiment Indicator
and PMI Composite Output, euro area
Source: EC, Markit Group Limited-25
-20
-15
-10
-5
0
5
10
-4
-3
-2
-1
0
1
2
3
4
08 09 10 11 12 13 14 15 16 17 18
Retail trade volume, 3 mma (lhs)
Retail confidence (rhs)
y-o-y% balance
Graph 1.6: Retail trade volumes and retail confidence,
euro area

Summer 2018 (Interim) forecast
7
scenario takes into account only the actions that
took place before the cut-off date (3 July), and
does not incorporate any further escalation of trade
tensions. The direct economic impact of the policy
measures implemented so far has been limited, but
their indirect effects on confidence are set to weigh
on investment decisions, particularly in export-
oriented sectors and countries (see technical box).
These concerns come on top of the recent de-
synchronisation of global momentum and in a
context where the liquidity provided by major
central banks is about to peak, and global yields
have started to rise. Furthermore, the recent bout of
political uncertainty in a number of Member States
and the increase in oil prices are set to weigh on
economic activity. Moreover, capacity constraints
are expected to become progressively more
binding in a number of Member States, dampening
the growth outlook.
…but fundamentals remain sound…
However, the fundamentals for above-potential
growth remain in place. The European economy
continues to benefit from supportive monetary
conditions, with low financing costs for companies
and governments despite the gradual withdrawal of
monetary stimulus; brightening labour market
conditions; as well as improving corporate and
household balance sheets. Unless business
sentiment changes significantly, rising labour
utilisation should lead firms to focus on additional
capital spending in order to increase supply. Even
though tighter labour markets in a number of
Member States may limit the pace of employment
growth, they are likely to spur investment in
F. Ghironi (2018). ‘Protectionism and the business cycle’.
NBER Working Paper 24353. February.
technology and training and thereby support
productivity growth.
…with domestic demand remaining robust…
Domestic demand is set to remain the main growth
engine. Looking ahead, private consumption is
forecast to continue expanding at a solid pace. The
improvement in labour market conditions, as
reflected in continued employment gains and
higher wages, are set to continue bolstering
household disposable income. Furthermore, the
aggregate household balance sheet remains in solid
shape with net worth levels rising on the back of
rising house prices and past stock market gains. (7)
However, household spending growth is expected
to slow, as labour market improvements moderate
this year and next and oil prices rise.
Investment growth is expected to remain robust
but to moderate gradually. Favourable financing
conditions, increasing capacity constraints and
corporate profitability will continue to support
business investment. The continued dynamism in
housing markets should further support residential
investment, driven by increasing real house prices,
favourable income prospects and low nominal
interest rates, despite the challenges posed by
demographic factors. (8)
Also, the Investment Plan
for Europe should continue to boost business
investment by improving access to finance. (9)
The
impact of these supportive factors, however, is
likely to be partially offset by uncertainty
regarding the external environment, through both
its direct impact on current demand, as well as on
future demand prospects. (10)
(7) C. Guerrieri and C. Mendicino (2018). ‘Wealth effects in
the euro area’. ECB Working Paper Series 2157. June. (8) Its leading properties to the economic cycle give increased
backing to the narrative on the economic outlook. See E. Kholscheen, A. Mehrotra and D. Mihaljek (2018).
‘Residential investment and economic activity: evidence
from the past five decades’. BIS Working Papers 726. June. and E. Monnet and C. Wolf (2017). ‘Is demographics the
housing cycle?’. Banque de France, Rue de la Banque 41.
April. (9) As of June 2018, operations approved under the Investment
Plan for Europe were expected to trigger €294 billion in
investments. Around 644,000 small and medium-sized businesses are expected to benefit from improved access to
finance. (10) Uncertainty arises when economic agents cannot
reasonably assess the likelihood of all possible future states
of nature or characterise the probability distribution of their
possible impacts. The real options channel suggests that the
option value increases with uncertainty in the case of
irreversible investment or consumption decisions. See ECB
(2016). ‘The impact of uncertainty on activity in the euro area’. Economic Bulletin 8. December.
-3
-2
-1
0
1
2
3
10 11 12 13 14 15 16 17 18 19
Graph 1.7: Real GDP and its components, euro area
Private consumption Government consumption
Investment Inventories
Net exports GDP (y-o-y%)
forecast
pps.

Summer 2018 (Interim) forecast
8
…despite rising risks.
Assuming no further escalation of trade tensions,
euro area export growth is expected to slow down
gently. Overall, global GDP is still expected to
expand at a robust pace, and world import growth
is still likely to ease only modestly. The lagged
impact of the past appreciation of the euro since
early-2017, however, is likely to constrain further
market share gains.
Overall, euro area GDP is forecast to continue
growing in 2018 but at a slightly slower pace
compared to 2017 (2.1% and 2.4% respectively)
and to the pace expected in spring. It is set to
moderate further to 2.0% in 2019 as supply-side
constraints gradually dent the growth momentum,
foreign demand slows, and the uncertainty
surrounding the outcome of the Brexit transition
agreement weighs on confidence.
While all Member States are forecast to continue
experiencing an economic upswing, those that
have grown at above-average rates over the last
two years are set to continue outperforming,
whereas the remaining countries are forecast to
continue expanding at below-average rates, with
the notable exception of Greece, which is forecast
to grow much above its previous average (11)
(see
Graph 1.8).
(11) Greece will conclude its ESM programme on 20 August.
See Eurogroup (2018). ‘Eurogroup statement on Greece’.
Press release 390/18. June.
1.4. LABOUR MARKET CONDITIONS SET TO
CONTINUE IMPROVING
The labour market situation in the euro area
continued to improve in the first half of 2018.
Employment rose by 0.4% quarter-on-quarter in
2018-Q1 and was 1.4% higher than one year ago.
The number of employed persons reached a new
historical high. The long period of employment
growth was accompanied by a rebound in the
number of total hours worked in the economy. In
2018-Q1 they increased by 0.2% quarter-on-
quarter to the highest level since 2008-Q4. The
slower growth of hours worked as compared to
persons employed reflects the rise in part-time
workers over recent years, but also changes in the
composition of employment due to structural shifts
across sectors. Many part-time workers have
identified themselves as involuntarily working less
than full time, which is reflected in developments
of broader underemployment indicators that
continue to suggest that some slack remains in the
labour market. Labour market slack has been
receding as the market has improved and labour
shortages have arisen in several sectors in some
Member States. Labour shortages have also
become visible in the job vacancy rate, which
moved up in the first quarter to 2.1%, its highest
level in the history of the series (since 2006).
Reflecting the gradual tightening of the labour
market, the unemployment rate in the euro area
declined to 8.4% in April 2018 and stabilised at
that level in May, its lowest level since December
2008.
Employment creation continued to be strong
considering the pace of economic expansion. Both
in terms of employment and unemployment,
labour market conditions have improved across all
Member States. Nevertheless, significant
differences remain.
Survey indicators of companies’ employment
expectations retreated somewhat in early 2018 but
remain well above their long-term averages (see
Graph 1.9). In June, the readings in the
Commission's Business and Consumer Surveys
were consistent with continued job creation in the
coming months, with the unemployment rate set to
continue falling. The marginally slower pace of
economic growth now expected should have little
impact on the labour market outlook.
BEDE
EE
EL
ES
FR
IT
CYLV
LT
LU
NLAT
PT
SISK
FI
EA
0.0
0.5
1.0
1.5
2.0
2.5
3.0
3.5
4.0
4.5
0.0 0.5 1.0 1.5 2.0 2.5 3.0 3.5 4.0 4.5
20
18
-201
9
2016-2017
Graph 1.8: Real GDP growth, euro area and Member States,
2016-2017 versus 2018-2019
Note: MT and IE are excluded from the calculation of the euro area
average and are not displayed.

Summer 2018 (Interim) forecast
9
1.5. ENERGY PRICES DRIVE INFLATION HIGHER IN THE NEAR TERM
Headline inflation in the euro area edged up, particularly in the second quarter 2018, on the back of higher energy prices. Inflation jumped to 1.9% in May and is estimated at 2% in June. This was a substantial pick-up from the average of 1.3% in the first quarter of 2018 (see Graph 1.10). Although this was to an extent expected, given base effects from last year’s energy price developments, the continued rise in oil prices and the drop in the euro exchange rate against the dollar have added further upward pressure on energy prices and led to higher-than-expected inflation. Indeed, energy inflation is estimated at 8% in June, compared to 6.1% in May. The second quarter figures were also driven higher by unprocessed food prices, in particular major cereals and dairy.
On the other hand, core inflation – which excludes energy and unprocessed food prices – has
remained muted with no discernible trend so far in 2018. It averaged 1.2% in the first quarter and was estimated at the same rate in June. Services inflation exhibited some volatility due to the timing of Easter (in late March vs. April last year), which affected the prices of package holidays, accommodation and transport. On the whole, non-energy industrial goods inflation has remained stable so far this year. The muted underlying inflation rate reflects the lagged negative impact of a prolonged period of low inflation and weak wage dynamics.
Recent wage developments show a pick-up…
Recent wage indicators in the euro area, however, show signs of a gradual pick-up. The annual growth of both nominal compensation per employee and negotiated wages registered notable increases in the first quarter of 1.9% and 1.8% respectively. Compensation per hour worked also increased strongly, from 1.5% in 2017-Q4 to 1.9% in 2018-Q1. Meanwhile, prices along industrial supply chains are also contributing to rising pressure in underlying inflation, with the growth of industrial producer prices having edged up to the 3% mark in May.
…supportive of a gradual increase in core inflation.
Headline inflation in the euro area is forecast to remain around current levels in 2018, provided that oil prices remain close to the current assumptions based on futures markets. Overall, headline inflation is forecast to average 1.7% over 2018, 0.2 pps. higher than in the spring forecast. Then, in 2019, the impact of energy inflation should slowly taper out, leading to some moderation in the headline rate in the first half of the year. Underlying inflation is then expected to gradually gather pace, as labour markets progressively tighten and wages rise. In fact, recent developments in wage growth underpin and drive a good part of the inflation outlook, as wage growth is a key determinant of domestic price pressures, especially services inflation, which has been subdued until recently. In 2019, headline inflation is expected to average 1.7%, also slightly higher than previously expected.
Market-based measures of inflation expectations have continued to recover since spring and the beginning of the year, but mainly in the short-term spectrum. At the cut-off date of this forecast,
-10
0
10
20
30
40
50
60
70-50
-40
-30
-20
-10
0
10
20
30
09 10 11 12 13 14 15 16 17 18
Employment exp. in industry, next 3 months (lhs)
Employment exp. in services, next 3 months (lhs)
Consumers' unempl. exp., next 12 months (inverted, rhs)
Graph 1.9: Employment expectations, DG ECFIN surveys, euro area
level level
92
96
100
104
-1
0
1
2
3
10 11 12 13 14 15 16 17 18 19
HICP inflation (annual rate) (lhs)
HICP index (monthly) (rhs)
HICP index (annual) (rhs)
2.7
1.3 0.4
2.5
0.0 0.2
1.5
1.7
1.7
forecast
Graph 1.10: HICP, euro area
% index, 2015=100
Figures next to horizontal bars are annual inflation rates.
1.6

Summer 2018 (Interim) forecast
10
inflation-linked swap rates at the one-year forward
one-year-ahead horizon stood at around 1.4%.
Swap rates at the three-year forward three-year-
ahead horizon imply an average inflation of close
to 1.6%. On a longer horizon, the widely watched
five-year forward five-year-ahead indicator
suggests inflation of 1.7% (see Graph 1.11).
Moreover, the ECB’s April 2018 Survey of
Professional Forecasters includes inflation forecast
means of 1.5% in 2018 (unchanged, compared to
the 2018-Q1 exercise), 1.6% in 2019 (down by
0.1 pps.) and 1.7% in 2020 (down by 0.1 pps.).
Longer-term inflation expectations stood
unchanged at 1.9%.
1.6. RISKS TILTED TO THE DOWNSIDE
Overall, even though some of the risks identified
in April have materialised, the balance of risks
remains clearly tilted to the downside. This is
particularly the case beyond the very short term, as
some downside risks have increased, notably those
related to escalating trade protectionism.
On the upside, rising supply constraints could
trigger additional investment and efforts to
increase productivity; and additional labour supply
could emerge from among the underemployed and
the inactive. Given the prominent role played by
supply-shocks in driving oil prices over the
previous year (12)
, oil prices could turn out lower
than assumed on the back of a recent OPEC
agreement and the price-responsiveness of US
shale oil production.
Downside risks to the growth outlook, however,
clearly dominate. They are mainly on the external
side and concern the dangerous nexus between a
(12) ECB (2018). ‘Are the recent oil price increases set to last?’.
ECB Economic Bulletin 2, pp. 36-40, March. (Box 1)
possible further escalation of trade disputes driven
by the US, the potentially disruptive effect of
tighter financing conditions, and increased
imbalances stemming from the highly pro-cyclical
fiscal policy in the US.
Since the spring, trade tensions have further
escalated. This forecast takes into account what is
already implemented, but several additional
protectionist measures are being considered and
would probably trigger retaliation if implemented.
Further escalating trade conflicts would negatively
affect welfare in all countries involved.
Restrictions to foreign trade and foreign direct
investment would lower productivity. A disruption
of global supply chains could have a highly non-
linear effect on world trade volumes. In the near
term, trade disputes could have a sizeable indirect
impact on domestic investment through confidence
effects – already seen to some extent in the
tradable goods sector in the first half of 2018 - and
increased uncertainty. In the longer term, the
European and global economy would also likely
suffer from a further undermining of open rules-
based multilateralism.
The expected further divergence of monetary
policies in 2019 may not be fully priced in by
financial markets yet, and could lead to a sharper
tightening of global financial conditions. Volatility
in global financial markets could increase further
in a context of relatively high equity valuations
and rising treasury yields, impacting financing
conditions also in the euro area. (13)
If this were to
lead to diminished risk appetite globally, there
could be significant spillovers in terms of capital
flows and financial market stability. As shown
over the second quarter of the year, emerging
market economies (14)
, including China, where
public and private leverage (15)
have increased
markedly in recent years, would be particularly
vulnerable to changing market conditions.
Also, political and policy uncertainty in a number
of EU countries remains an important downside
risk to the forecast. This includes the risks related
to the outcome of the negotiations on the terms of
the UK’s withdrawal from the EU in March
(13) BIS (2018). ‘The risks ahead’. Annual Economic Report,
pp. 12-20. June. (14) L. Menna and M. Tobal (2018). ‘Financial and price
stability in emerging markets: the role of the interest rate’. BIS Working Papers 717. May.
(15) See World Bank (2018). ‘Corporate debt: financial stability
and investment implications’. Global Economic Prospects. June.
0.0
0.5
1.0
1.5
2.0
2.5
3.0
10 11 12 13 14 15 16 17 18
%
Maturity date
Graph 1.11: Inflation expectations derived from implied
forward inflation-linked swap rates
5 years forward 5 years ahead
3 years forward 3 years ahead
1 year forward 1 year ahead
SSource: Bloomberg

Summer 2018 (Interim) forecast
11
2019 (16)
, in particular if the outcome differs
meaningfully from the technical assumption of
status quo in terms of trading relations between the
EU27 and the UK for 2019.
(16) See Box 1 on .the technical assumption regarding trading
relations between EU27 and the UK for the current
forecast.
The relevance of downside risks related to
geopolitical tensions in the Korean peninsula
appears to have faded, although they remain high
in the Middle East. Were these risks to increase,
supply-side pressures on oil prices could intensify.

2. PROSPECTS BY MEMBER STATES
Summer 2018 (Interim) forecast
12
2.1. BELGIUM
GDP growth abated slightly in 2018-Q1 to 0.3%
(q-o-q) due to slower private sector investment
growth and a fall in inventories. Soft indicators
have deteriorated in recent months, suggesting that
this soft patch may have continued in 2018-Q2.
However, confidence indicators remain high,
suggesting that growth should pick up again in the
second half of the year.
For 2018 as whole, Belgium’s GDP growth is
forecast to remain stable at 1.7% driven by
sustained private demand amid improving labour
market and investment conditions. In 2019, growth
is forecast to ease to 1.6%, as investment growth is
expected to weaken gradually.
The contribution of private investment to growth is
expected to increase in 2018 but weaken from
2019. Household investment is projected to rise
moderately as interest rates are expected to remain
low. Business investment is also expected to
increase, amid favourable financing conditions,
improved profitability and elevated capacity
utilisation rates. Public investment is expected to
continue growing in 2018, driven by infrastructure
and defence projects and by the local election
investment cycle. However, its contribution to
growth is set to reduce slightly from 2019, in line
with contained public expenditure. Net exports
contributed positively to growth in 2017, but
should be neutral over the forecast horizon.
After having picked up to 2.2% in 2017, inflation
(HICP) is expected to decline to 1.9% in 2018 and
1.6% in 2019. The upwards revision to the
inflation forecast since the spring is mostly due to
the recent increase in oil prices, which should have
its main impact in the second half of 2018. Core
inflation is expected to remain close to its 2017
level of 1.6% over the forecast horizon. Nominal
wage growth is projected to rise moderately
through indexation, although labour cost growth
should be contained thanks to cuts in labour
taxation. The inflation gap with the euro area is
expected to close in 2019.
2.2. BULGARIA
Real GDP growth reached 0.9% (q-o-q) in the first
quarter of 2018, maintaining last year’s
momentum when the economy grew by 3.6%. The
ongoing expansion is being driven by strong
private consumption and higher investment. Wage
increases continued to boost private consumption,
while a recovery in the use of EU investment
funding programmes is fuelling the growth of
public investment. Economic sentiment continues
to improve and survey data show expectations of
increasing orders, higher output and greater
demand, which suggests that the economy should
continue expanding in the coming quarters.
Real GDP growth is forecast to remain robust at
3.8% in 2018 and 3.7% in 2019, driven mainly by
domestic demand. Positive labour market
developments and planned wage increases in the
public sector should provide the fuel for continued
private consumption growth. Investment growth is
also expected to be strong over the forecast period,
mainly due to the recovery in EU funds absorption,
but also due to stronger private sector investment.
At the same time, the contribution from net exports
to GDP is expected to be negative. Although solid
external demand should support export growth,
strong domestic consumption and investment mean
that imports will continue to outweigh exports.
Price pressures increased in the spring months as a
result of a steep rise in oil prices and second round
effects on food prices. Administered prices were
also raised significantly over the same period.
HICP inflation is thus expected to rise to 2.0% in
2018 before slowing down to 1.8% in 2019. This
pattern is mainly due to a strong base effect in
energy products, while the rise in real disposable
-1.0
-0.5
0.0
0.5
1.0
1.5
2.0
2.5
3.0
3.5
10 11 12 13 14 15 16 17 18 19
Graph 2.1: Belgium - Real GDP growth and
contributions
Real GDP (y-o-y%) Private consumption
Public consumption Investment
Changes in inventories Net exports
pps.forecast

Summer 2018 (Interim) forecast
13
incomes should provide continued support to
consumption and prices generally.
2.3. CZECH REPUBLIC
The economy of the Czech Republic expanded by
4.3% in 2017, its second fastest rate in a decade.
All demand components contributed positively to
GDP growth. Despite an easing of the pace in
2018-Q1 due to weak external demand in key
trading partners, GDP growth is forecast at a solid
rate of 3.0% for 2018 and 2.9% in 2019, thanks
mainly to robust domestic demand. The very high
confidence indicators readings seen in the first half
of 2018 are fully consistent with these prospects.
Wage increases and high levels of consumer
confidence should continue to support private
consumption. Investment is also expected to
remain vigorous, underpinned by a revival of
construction activity, greater use of EU investment
funding, and a general trend towards industrial
automatisation. Meanwhile, public consumption is
set to continue growing at a steady pace, supported
by robust wage growth in the public sector.
On the downside, net exports are likely to detract
from GDP growth, particularly in 2018. The
intensity and duration of this effect will hinge on
world trade developments and economic growth in
the euro area, particularly in Germany. Labour
shortages, which are increasingly cited as a
production constraint, also pose a growing risk to
the economy. The number of job vacancies was
almost twice as large as the number of unemployed
persons in 2018-Q1. Continued rapid house price
inflation, coupled with rising household debt, also
constitutes a vulnerability.
After a temporary slowdown in the first months of
2018, headline inflation is expected to return above
2% in the coming quarters, influenced by the
positive output gap, wage dynamics, and oil prices.
The gradual increase of interest rates by the Czech
National Bank, whose latest hike at the end of June
raised the policy rate by 25 bps. to 1.0%, should
help temper inflationary pressures and maintain
consumer price inflation close to the target of 2%.
HICP inflation is forecast to average 2.1% in 2018
and 2.0% in 2019.
2.4. DENMARK
Real GDP growth of 0.4% (q-o-q) in the first
quarter of 2018 was somewhat weaker than
expected in spring. Service exports dragged down
economic growth despite rising world trade and
strong demand in Denmark’s main export markets.
On the other hand, private consumption turned out
to be stronger than expected due to the release of
pent-up demand for cars following changes in car
taxation at the end of last year.
Economic growth in Denmark is forecast to reach
1.6% in 2018 and 1.8% in 2019 after growth of
2.3% in 2017. While the growth momentum is
expected to remain solid, headline growth in 2018
is negatively affected by the carry-over of a large
one-off transaction linked to the sale of a Danish
patent (about 0.4% of GDP recorded as a service
export) in 2017. Robust private consumption is
expected to help sustain the upswing over the
forecast horizon. Supported by rising housing
prices, residential construction is set to remain an
important driver of investment growth in 2018 and
2019.
-6.0
-4.0
-2.0
0.0
2.0
4.0
6.0
8.0
10 11 12 13 14 15 16 17 18 19
Graph 2.2: Bulgaria - Real GDP growth and
contributions
Real GDP (y-o-y%) Private consumption
Public consumption Investment
Changes in inventories Net exports
pps.forecast
-3.0
-2.0
-1.0
0.0
1.0
2.0
3.0
4.0
5.0
6.0
10 11 12 13 14 15 16 17 18 19
Graph 2.3: Czech Republic - Real GDP growth and
contributions
Real GDP (y-o-y%) Private consumption
Public consumption Investment
Changes in inventories Net exports
pps.forecast

Summer 2018 (Interim) forecast
14
Risks to the forecast are gathering. As a small open
economy with a large shipping sector, frictions in
world trade would have large negative
repercussions on Danish exports and investment.
Deteriorating sentiment indicators and weakening
prospects in Denmark’s export markets could
rapidly impact Danish exports and business
investment.
Despite the solid economic performance and a
tightening labour market, consumer prices (HICP)
are expected to rise by only 0.9% in 2018 after
increasing by 1.1% in 2017. Inflation is revised
slightly upwards both in 2018 and 2019 due to
higher energy prices. Despite rising energy prices,
inflation will decelerate in 2018 mainly because of
the impact of lower indirect taxes and the
appreciation of the krone. Rising service prices and
the waning impact of the tax changes are expected
to lift HICP inflation to 1.5% in 2019.
2.5. GERMANY
Germany’s GDP growth slowed from 0.6% in late
2017 to 0.3% in the first quarter of 2018.
Investment and private consumption held up well,
but public consumption and exports declined
significantly. Net exports contributed negatively to
GDP growth with both exports and imports falling.
The weak foreign trade results of the first quarter
follow an exceptionally strong performance in the
preceding quarter. Nevertheless, overall economic
sentiment has cooled since the start of the year,
suggesting deteriorating foreign demand and
possible investment and consumption restraint in
the coming quarters. Survey data point to a
moderation of order inflows and industrial activity.
Escalating protectionism would likely weigh on
business confidence across the globe and thus
dampen global investment demand which is likely
contributing to the growing concerns of German
exporters.
Business investment grew strongly in the first
quarter, in response to the steady rise in capacity
utilisation rates. Some businesses, however, are
likely to hold back on investment due to growing
uncertainty over trade policies and their possible
impact on global value chains. By contrast,
housing investment has proven resilient and
positive data on residential construction permits
and still robust business sentiment in the sector
indicate that construction activity is likely to keep
rising.
Willingness to hire remains high and vacancy rates
are still on the rise. The strong labour market
conditions and solid wage growth should benefit
private consumption and continue to sustain
growth. Public consumption growth is expected to
resume later in the year, as the 2018 budget, which
was only just approved, is implemented. Overall,
real GDP is now expected to increase by 1.9% in
2018 and 2019, a downward revision compared to
the spring. Risks are tilted to the downside. Global
trade policy uncertainty could affect the highly
open German economy more strongly.
After having picked up to 1.7% in 2017, inflation
(HICP) is expected to remain broadly at this level
in 2018 and edge up in 2019, reflecting factors
such as energy prices and a higher minimum wage,
which could affect services inflation. Core
inflation is expected to move in parallel to reach
1.6% in 2019.
-1.5
-1.0
-0.5
0.0
0.5
1.0
1.5
2.0
2.5
3.0
3.5
10 11 12 13 14 15 16 17 18 19
Graph 2.4: Denmark - Real GDP growth and
contributions
Real GDP (y-o-y%) Private consumption
Public consumption Investment
Changes in inventories Net exports
pps.forecast
-3.0
-2.0
-1.0
0.0
1.0
2.0
3.0
4.0
5.0
10 11 12 13 14 15 16 17 18 19
Graph 2.5: Germany - Real GDP growth and
contributions
Real GDP (y-o-y%) Private consumption
Public consumption Investment
Changes in inventories Net exports
pps.forecast
Summer 2018 (Interim) forecast
15
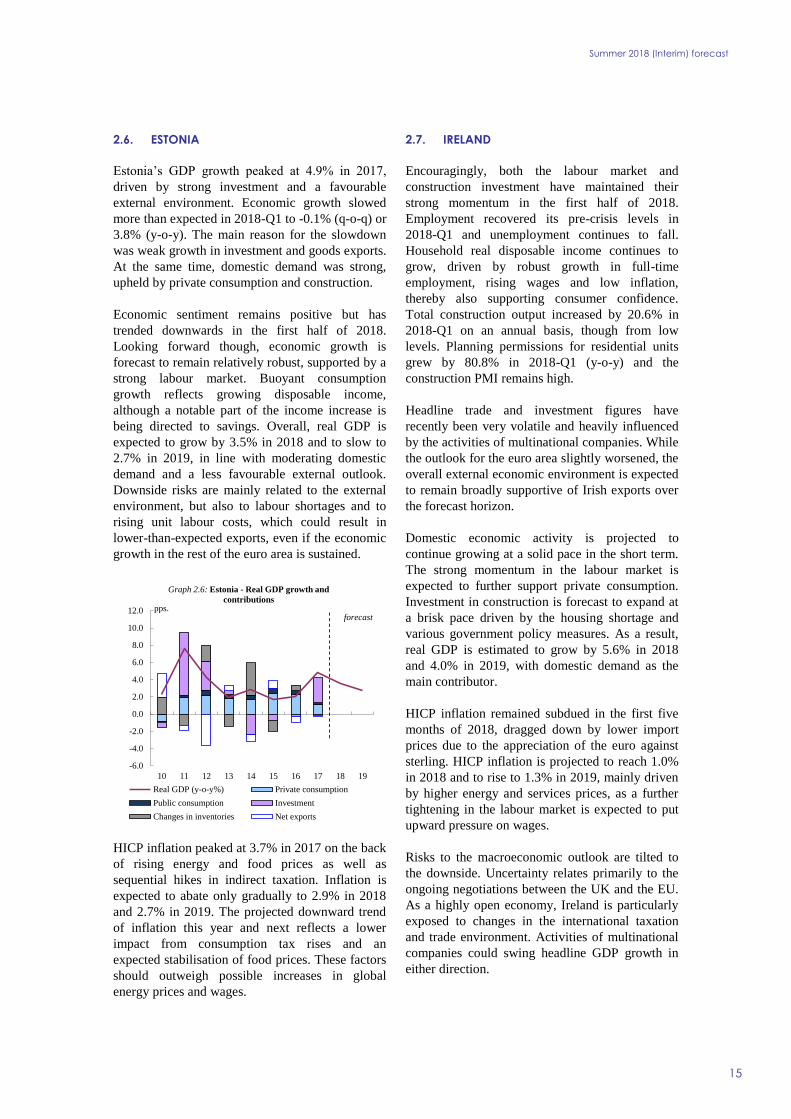
2.6. ESTONIA
Estonia’s GDP growth peaked at 4.9% in 2017,
driven by strong investment and a favourable
external environment. Economic growth slowed
more than expected in 2018-Q1 to -0.1% (q-o-q) or
3.8% (y-o-y). The main reason for the slowdown
was weak growth in investment and goods exports.
At the same time, domestic demand was strong,
upheld by private consumption and construction.
Economic sentiment remains positive but has
trended downwards in the first half of 2018.
Looking forward though, economic growth is
forecast to remain relatively robust, supported by a
strong labour market. Buoyant consumption
growth reflects growing disposable income,
although a notable part of the income increase is
being directed to savings. Overall, real GDP is
expected to grow by 3.5% in 2018 and to slow to
2.7% in 2019, in line with moderating domestic
demand and a less favourable external outlook.
Downside risks are mainly related to the external
environment, but also to labour shortages and to
rising unit labour costs, which could result in
lower-than-expected exports, even if the economic
growth in the rest of the euro area is sustained.
HICP inflation peaked at 3.7% in 2017 on the back
of rising energy and food prices as well as
sequential hikes in indirect taxation. Inflation is
expected to abate only gradually to 2.9% in 2018
and 2.7% in 2019. The projected downward trend
of inflation this year and next reflects a lower
impact from consumption tax rises and an
expected stabilisation of food prices. These factors
should outweigh possible increases in global
energy prices and wages.
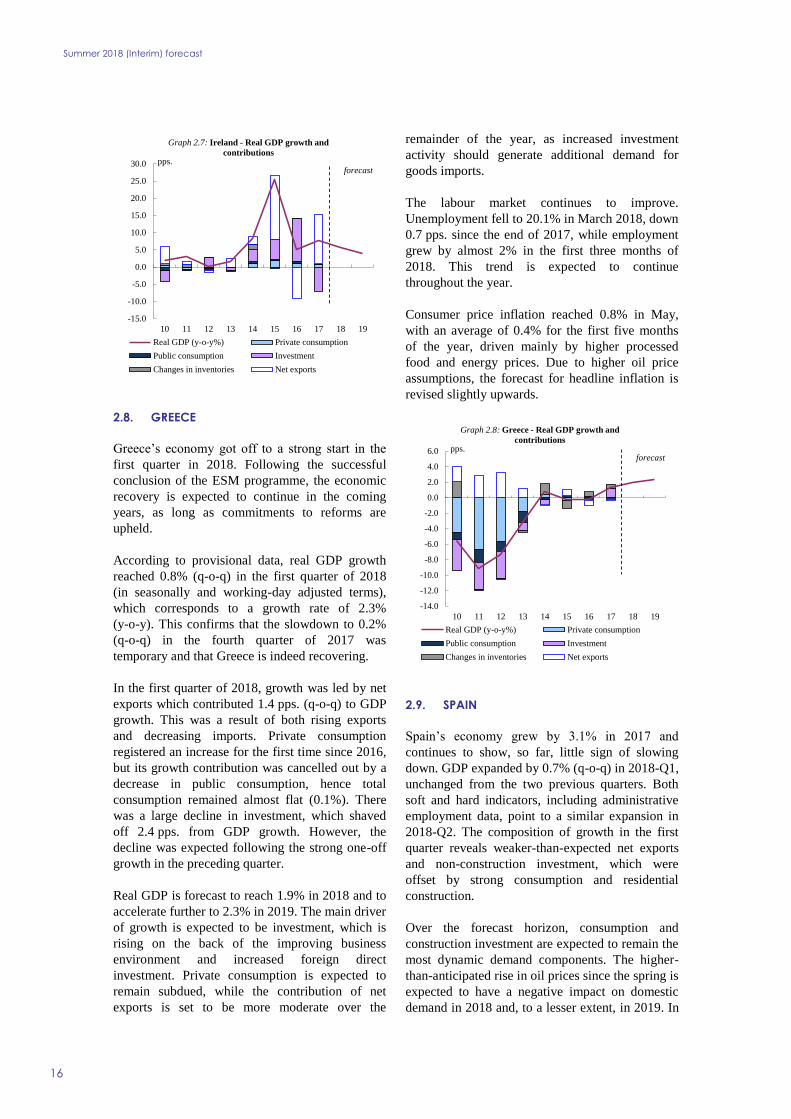
2.7. IRELAND
Encouragingly, both the labour market and
construction investment have maintained their
strong momentum in the first half of 2018.
Employment recovered its pre-crisis levels in
2018-Q1 and unemployment continues to fall.
Household real disposable income continues to
grow, driven by robust growth in full-time
employment, rising wages and low inflation,
thereby also supporting consumer confidence.
Total construction output increased by 20.6% in
2018-Q1 on an annual basis, though from low
levels. Planning permissions for residential units
grew by 80.8% in 2018-Q1 (y-o-y) and the
construction PMI remains high.
Headline trade and investment figures have
recently been very volatile and heavily influenced
by the activities of multinational companies. While
the outlook for the euro area slightly worsened, the
overall external economic environment is expected
to remain broadly supportive of Irish exports over
the forecast horizon.
Domestic economic activity is projected to
continue growing at a solid pace in the short term.
The strong momentum in the labour market is
expected to further support private consumption.
Investment in construction is forecast to expand at
a brisk pace driven by the housing shortage and
various government policy measures. As a result,
real GDP is estimated to grow by 5.6% in 2018
and 4.0% in 2019, with domestic demand as the
main contributor.
HICP inflation remained subdued in the first five
months of 2018, dragged down by lower import
prices due to the appreciation of the euro against
sterling. HICP inflation is projected to reach 1.0%
in 2018 and to rise to 1.3% in 2019, mainly driven
by higher energy and services prices, as a further
tightening in the labour market is expected to put
upward pressure on wages.
Risks to the macroeconomic outlook are tilted to
the downside. Uncertainty relates primarily to the
ongoing negotiations between the UK and the EU.
As a highly open economy, Ireland is particularly
exposed to changes in the international taxation
and trade environment. Activities of multinational
companies could swing headline GDP growth in
either direction.
-6.0
-4.0
-2.0
0.0
2.0
4.0
6.0
8.0
10.0
12.0
10 11 12 13 14 15 16 17 18 19
Graph 2.6: Estonia - Real GDP growth and
contributions
Real GDP (y-o-y%) Private consumption
Public consumption Investment
Changes in inventories Net exports
pps.forecast
Summer 2018 (Interim) forecast
16
2.8. GREECE
Greece’s economy got off to a strong start in the
first quarter in 2018. Following the successful
conclusion of the ESM programme, the economic
recovery is expected to continue in the coming
years, as long as commitments to reforms are
upheld.
According to provisional data, real GDP growth
reached 0.8% (q-o-q) in the first quarter of 2018
(in seasonally and working-day adjusted terms),
which corresponds to a growth rate of 2.3%
(y-o-y). This confirms that the slowdown to 0.2%
(q-o-q) in the fourth quarter of 2017 was
temporary and that Greece is indeed recovering.
In the first quarter of 2018, growth was led by net
exports which contributed 1.4 pps. (q-o-q) to GDP
growth. This was a result of both rising exports
and decreasing imports. Private consumption
registered an increase for the first time since 2016,
but its growth contribution was cancelled out by a
decrease in public consumption, hence total
consumption remained almost flat (0.1%). There
was a large decline in investment, which shaved
off 2.4 pps. from GDP growth. However, the
decline was expected following the strong one-off
growth in the preceding quarter.
Real GDP is forecast to reach 1.9% in 2018 and to
accelerate further to 2.3% in 2019. The main driver
of growth is expected to be investment, which is
rising on the back of the improving business
environment and increased foreign direct
investment. Private consumption is expected to
remain subdued, while the contribution of net
exports is set to be more moderate over the
remainder of the year, as increased investment
activity should generate additional demand for
goods imports.
The labour market continues to improve.
Unemployment fell to 20.1% in March 2018, down
0.7 pps. since the end of 2017, while employment
grew by almost 2% in the first three months of
2018. This trend is expected to continue
throughout the year.
Consumer price inflation reached 0.8% in May,
with an average of 0.4% for the first five months
of the year, driven mainly by higher processed
food and energy prices. Due to higher oil price
assumptions, the forecast for headline inflation is
revised slightly upwards.
2.9. SPAIN
Spain’s economy grew by 3.1% in 2017 and
continues to show, so far, little sign of slowing
down. GDP expanded by 0.7% (q-o-q) in 2018-Q1,
unchanged from the two previous quarters. Both
soft and hard indicators, including administrative
employment data, point to a similar expansion in
2018-Q2. The composition of growth in the first
quarter reveals weaker-than-expected net exports
and non-construction investment, which were
offset by strong consumption and residential
construction.
Over the forecast horizon, consumption and
construction investment are expected to remain the
most dynamic demand components. The higher-
than-anticipated rise in oil prices since the spring is
expected to have a negative impact on domestic
demand in 2018 and, to a lesser extent, in 2019. In
-15.0
-10.0
-5.0
0.0
5.0
10.0
15.0
20.0
25.0
30.0
10 11 12 13 14 15 16 17 18 19
Graph 2.7: Ireland - Real GDP growth and
contributions
Real GDP (y-o-y%) Private consumption
Public consumption Investment
Changes in inventories Net exports
pps.forecast
-14.0
-12.0
-10.0
-8.0
-6.0
-4.0
-2.0
0.0
2.0
4.0
6.0
10 11 12 13 14 15 16 17 18 19
Graph 2.8: Greece - Real GDP growth and
contributions
Real GDP (y-o-y%) Private consumption
Public consumption Investment
Changes in inventories Net exports
pps.forecast

Summer 2018 (Interim) forecast
17
addition, a less favourable external environment
should result in a slightly smaller contribution of
net exports to growth. At the same time, the
additional expansionary measures that were
included in the budget law for 2018 (approved on
28 June, after the cut-off date of the spring
forecast) are expected to provide an additional
boost to growth in 2018, mainly via private
consumption. Consumer spending should also
benefit from higher-than-expected real wage
growth and dynamic job creation over the forecast
horizon. The net effect of these offsetting factors
on real GDP growth is slightly negative for 2018,
leading to a downward revision by 0.1 pps.
compared to spring, to 2.8%. For 2019, the net
effect is broadly neutral, with the forecast
remaining at 2.4%.
HICP inflation has been rising throughout the first
half of the year, reaching 2.1% in May, driven by
oil price developments. It is expected to peak in
2018-Q3 and then moderate to an annual average
of 1.8% in 2018 and 1.6% in 2019. Core inflation
is expected to gradually increase over the forecast
horizon, as the output gap turns firmly positive and
wage growth in the private sector accelerates
following the latest framework agreement between
the social partners.
2.10. FRANCE
Following upward revisions by INSEE in national
accounts outturns, GDP expanded by a strong
2.2% in 2017 as a whole (17)
and by 0.7% in
2017-Q4, in line with the previous two quarters
and mainly driven by strong investment and
exports. However, GDP growth in the first quarter
of 2018 slowed markedly to 0.2% after five
quarters of strong expansion and both soft and hard
indicators deteriorated. The slowdown was led by
a decline in exports and the deceleration in
corporate investment. Temporary factors such as
particularly cold weather conditions also explain
some of the slowdown.
Economic activity, which has also been slightly
affected by strikes in the transport sector, is set to
remain moderate in 2018-Q2, with quarter-on-
quarter GDP growth of 0.3%. While order books,
service sector PMIs and the Economic Sentiment
Indicator started to improve at the end of the
second quarter, consumer confidence has
deteriorated. Employment, however, is set to
remain relatively resilient.
Growth is set to gain momentum as of the second
half of this year, with GDP growth expected to
expand by 1.7% in both 2018 and 2019. The
reduction in social contributions and housing
taxes, projected wage increases and resilient
employment growth are expected to have a
positive impact on household purchasing power in
the coming months, which should fuel private
consumption growth in the second half of 2018. In
(17) The GDP annual growth figures are non-calendar adjusted.
In 2017, calendar adjusted GDP growth reached 2.3%.
-6.0
-5.0
-4.0
-3.0
-2.0
-1.0
0.0
1.0
2.0
3.0
4.0
5.0
10 11 12 13 14 15 16 17 18 19
Graph 2.9: Spain - Real GDP growth and contributions
Real GDP (y-o-y%) Private consumption
Public consumption Investment
Changes in inventories Net exports
pps.forecast
-1.5
-1.0
-0.5
0.0
0.5
1.0
1.5
2.0
2.5
10 11 12 13 14 15 16 17 18 19
Graph 2.10: France - Real GDP growth and
contributions
Real GDP (y-o-y%) Private consumption
Public consumption Investment
Changes in inventories Net exports
pps.forecast

Summer 2018 (Interim) forecast
18
turn, the expected growth uptick in the rest of the
euro area should back a moderate rebound in
exports as of the second half of the year.
Inflation is expected to pick-up further in 2018.
Core inflation is projected to gain momentum in
line with the projected uptick in wage growth but
should remain contained. HICP inflation is
forecast to reach 1.9% this year but to fall back to
1.5% in 2019, as the rise in oil prices abates.
2.11. CROATIA
Following the unexpected slowdown in the last
quarter of 2017, real GDP growth edged up only
slightly in the first quarter in 2018, mainly thanks
to robust private consumption and recovering
investment. Nevertheless, and despite mixed
signals from high frequency indicators, positive
labour market developments and survey data
suggest that domestic demand will fuel a growth
pick up over the rest of 2018.
Private consumption is expected to remain the
main driver of growth throughout the forecast
period, supported by rising household disposable
incomes and low inflation. An improved uptake of
EU funds, decreasing interest rates and increasing
credit flows to the corporate sector should
underpin investment growth. Available early data
on tourist arrivals and overnight stays support
expectations of a strong growth of services exports
in 2018. At the same time, the sudden slowdown
of goods exports in early 2018 is in line with the
weakening observed in the manufacturing sector.
However, the impact of expected lower goods
export growth on GDP should be partially offset
by a slowdown in import growth, as domestic
production is import intensive.
Overall, real GDP growth is expected to moderate
slightly over the forecast horizon to 2.6% in 2018
and 2.5% in 2019. The settlement plan adopted by
creditors on the debt restructuring of the country’s
largest employer, Agrokor, has reduced the
downward risks to the forecast scenario, but the
successful implementation of the agreement
remains crucial for the operational and financial
stability of the company.
Labour market conditions continue to improve.
Wages are projected to continue rising, as labour
shortages become more apparent in the tourism
and construction sectors. The unemployment rate
should continue declining mainly thanks to rising
employment, as outbound migration flows slow
down. In the first five months of 2018 inflationary
pressures remained contained, despite rising
energy prices. Strong consumer spending and
rising wages are expected to eventually drive
consumer price inflation up to 1.6% in 2018 and
1.8% in 2019.
2.12. ITALY
Although Italy’s economy grew by 0.3% (q-o-q) in
2018-Q1, only slightly less than in the previous
quarter, it did not fully escape the general loss of
growth momentum in advanced countries. While
private consumption and inventories continued to
support the output expansion, weak investment and
exports were a drag on growth.
The near-term outlook for the manufacturing
sector suggests some weakening ahead. A
comprehensive view of leading indicators suggests
that the current recovery should weaken but
continue at above potential rates. Real GDP is
expected to grow by 1.3% in 2018 before easing
down to 1.1% in 2019. The forecast scenario is
based on a no-policy-change assumption and does
not incorporate the effects of legislated VAT and
excise tax hikes envisaged for 2019 as a
“safeguard clause” in the 2018 budget.
Domestic demand is expected to remain the main
growth driver amid a more challenging external
environment. Investment is expected to pick-up,
supported by favourable financing conditions and
tax incentives, although financial market volatility
reflecting global and domestic uncertainty is
expected to delay some investment decisions in the
-6.0
-5.0
-4.0
-3.0
-2.0
-1.0
0.0
1.0
2.0
3.0
4.0
5.0
10 11 12 13 14 15 16 17 18 19
Graph 2.11: Croatia - Real GDP growth and
contributions
Real GDP (y-o-y%) Private consumption
Public consumption Investment
Changes in inventories Net exports
pps.forecast

Summer 2018 (Interim) forecast
19
short term. In 2019, the phase-out of tax incentives
and gradually rising interest rates is forecast to
dampen investment growth. The rise in household
spending is set to continue in light of rising wages
and employment. But higher oil prices are
expected to weigh on disposable incomes and
slightly dampen private consumption. Net exports
are unlikely to make a positive contribution to
growth due to the lagged impact of the euro’s
appreciation and moderating growth in some of
Italy’s main trading partners.
Downside risks to the growth outlook have
become more prominent amid heightened global
and domestic policy uncertainty. At the domestic
level, any re-emerging concerns or uncertainty
about economic policies and the possible spillover
of higher sovereign yields into corporate financing
costs could worsen funding conditions and mute
domestic demand.
After averaging 1.3% in 2017, consumer price
inflation is set to rise, mainly as a result of higher
energy prices. The headline HICP index is
expected to increase by 1.4% this year and by
1.6% in 2019, largely due to the effect of higher oil
prices, which will be further amplified by a weaker
euro. A stronger price increase in 2018 is unlikely
given substantial base effects related to services.
For 2019, consumer prices are expected to grow in
line with rising commodity prices and wages,
especially in the services sector. Core inflation is
set to pick up gradually over the forecast period, in
line with accelerating wage growth.
2.13. CYPRUS
After expanding by 3.9% in 2017, a nine-year
high, Cyprus’ economy continued its cyclical
upswing in early 2018, posting 3.8% (y-o-y)
growth in the first quarter of 2018. Growth was
driven by solid domestic demand and, lately,
exports. Consumer sentiment continued to
improve, while business confidence across major
sectors either increased or levelled off, suggesting
continued momentum in the coming quarters.
The composition of growth shifted somewhat in
early 2018. Investment, after breaking an historic
high in the last quarter of 2017, fell in the first
quarter of this year. Goods exports, by contrast,
more than doubled compared to the previous
quarter. Shipping sector activity was at the heart of
these pronounced changes, with ship acquisitions
moderating, while ship sale/deregistration reached
record high levels. Excluding shipping activity, the
underlying trends remained broadly stable and this
compositional shift is expected to be temporary.
Exports of services were subdued in the first
quarter of the year. This soft patch is likely to be
overcome in the quarters ahead thanks to the
marked increase in tourist arrivals already recorded
in the spring months as well as the completion of
new hotels for tourists.
Private consumption continues to expand,
supported by rapidly rising employment and
gradually increasing wages. Survey data reveal
that hiring is set to continue strongly in the near
future, giving a further boost to disposable income.
Cyprus’ struggling financial sector, which has
been a drag on the economy since the crisis years,
is consolidating. Once finalised, the sale of the
second largest bank, Cyprus Cooperative Bank, is
expected to reduce uncertainties surrounding the
macroeconomic outlook. Overall, real GDP growth
is expected to reach 3.6% in 2018 and 3.3% in
2019, unchanged since the spring.
Inflationary pressures remain weak. HICP inflation
dropped during the first four months of the year
and turned positive only in May. The decrease in
prices was rather broad-based, reflecting strong
competition among retailers in several sectors and
subdued wage dynamics. HICP inflation is
expected to be positive for the year as a whole due
to increasing services and energy prices. It is
-7.0
-6.0
-5.0
-4.0
-3.0
-2.0
-1.0
0.0
1.0
2.0
3.0
4.0
10 11 12 13 14 15 16 17 18 19
Graph 2.12: Italy - Real GDP growth and contributions
Real GDP (y-o-y%) Private consumption
Public consumption Investment
Changes in inventories Net exports
pps.forecast

Summer 2018 (Interim) forecast
20
expected to pick up further in 2019, mainly as a
result of higher oil prices and the gradual build-up
of domestic price pressures amid rapid economic
recovery.
2.14. LATVIA
In 2017, GDP growth in Latvia reached 4.5%,
driven by solid growth in all components including
double-digit investment growth as a result of EU
investment funding programmes. GDP growth
accelerated during the first quarter of 2018, mostly
due to continued strong growth in investment. As
this trend is unlikely to be sustained at such levels,
GDP growth is forecast to slow down in the
coming quarters.
Overall, GDP growth is set to average 3.3% in
2018, led by private consumption and investment,
which is expected to continue receiving strong
impetus from the use of EU investment funds but
should slow down towards the end of the year, as
the fund flows near their peak. On the other hand,
the downsizing of the non-resident banking sector
and continued contraction in transit services are
expected to weigh on export growth.
In 2019, economic growth is expected to remain
above 3% supported in a balanced way by private
consumption, investment and exports. As the use
of EU investment funding peaks, the boost to
investment should wane, bringing its growth more
in line with that of the economy generally. Export
growth, however, is expected to recover as the
effects of the decline in financial services exports
fades.
Wages are expected to rise rapidly over the
forecast horizon, with the falling supply of labour
and the moderate increase in employment also
causing unemployment to decrease further. Wage
pressures, however, should temper somewhat as
the rate of investment growth normalises.
Inflation is expected to slow down in 2018 and
remain flat in 2019. Although energy prices are
expected to pick up in 2018, their effects should be
outweighed by lower food price increases. In 2019,
reversed dynamics are expected as energy prices
are set to increase more slowly while service prices
are expected to pick up as a result of the high wage
increases in recent years.
Risks to the forecast are tilted to the downside as
the structural decline in Latvian financial and
transport services exports is expected to continue
and any worsening in the external environment
could weigh on national income and domestic
demand.
2.15. LITHUANIA
In 2017, real GDP grew by 3.8%, driven by
booming exports and a strong pick up in private
investment, although the usage of EU funds
remained sluggish. Growth was also supported by
strong private consumption. Its dynamics were
influenced by notable wage growth, which offset
the negative effects of high inflation and
population decline.
Good economic momentum continued in 2018
with a growth rate of 0.9% (q-o-q) in the first
quarter based on the strong performance of
industry and the construction sector. Private
-12.0
-10.0
-8.0
-6.0
-4.0
-2.0
0.0
2.0
4.0
6.0
8.0
10.0
10 11 12 13 14 15 16 17 18 19
Graph 2.13: Cyprus - Real GDP growth and
contributions
Real GDP (y-o-y%) Private consumption
Public consumption Investment
Changes in inventories Net exports
pps.forecast
-8.0
-6.0
-4.0
-2.0
0.0
2.0
4.0
6.0
8.0
10.0
12.0
14.0
10 11 12 13 14 15 16 17 18 19
Graph 2.14: Latvia - Real GDP growth and
contributions
Real GDP (y-o-y%) Private consumption
Public consumption Investment
Changes in inventories Net exports
pps.forecast

Summer 2018 (Interim) forecast
21
consumption continued to be one of the main
growth drivers, while the contribution of net
exports, though negative, was somewhat better
than expected.
The most recent economic sentiment indicators
have been strong. Positive expectations in the
service sector, high levels of consumer confidence
and rapidly rising wages point to a stable
expansion of private consumption in the coming
quarters. Investment is also set to remain an
important growth driver.
Over the forecast horizon, economic growth is
expected to moderate somewhat due to slower
growth in major trading partners. Overall, real
GDP is forecast to grow solidly at 3.1% in 2018
and 2.6% in 2019.
As the effects of excise duties hikes in 2017 fade,
inflation is expected to slow, increasing disposable
income and supporting private consumption. HICP
inflation is forecast to fall from 3.7% in 2017 to
2.7% in 2018 and to 2.2% in 2019. Meanwhile,
rising oil prices (especially in 2018) and strong
wage growth, which has a particular effect on
service prices, are set to drive inflation over the
forecast horizon.
2.16. LUXEMBOURG
Luxembourg’s economic growth slowed to 2.3%
in 2017 from 3.1% in 2016. This slowdown, which
was unusual among euro area countries, was
driven by weaker external demand and an
exceptionally subdued performance in financial
services, Luxembourg’s main economic driver.
Activity contracted in the banking sector following
a strong expansion the year before, which was
flattered by a large-scale sale of assets. This was
only partially offset by the strong performance of
the investment funds sector. These figures need to
be analysed with caution, given the frequent and
substantial revisions to Luxembourg’s national
accounts data.
Looking forward, the reduced activity in the
banking sector and the increased financial market
volatility early this year have somewhat weakened
growth prospects for financial services and for the
economy as a whole. However, the country’s
economic prospects remain sound, underpinned by
the accommodative monetary policy environment
and the ongoing expansion in the euro area. Firmer
trends in business services and private
consumption are also supporting real GDP growth,
which is expected to reach 3.5% in 2018, before
slowing slightly to 3.3% in 2019.
Private consumption growth is expected to
strengthen in 2018, as stronger employment
creation pushes up disposable income growth.
High job vacancy rates remain a source of concern
about constraints in the supply of skilled labour.
Lingering income gains from recent tax reforms
and the wage indexation projected for the third
quarter should offset the negative impact of higher
oil prices.
In 2019, private consumption growth is projected
to lose some momentum as employment growth is
expected to slow down while the impact of past
income gains fades. Meanwhile private investment
should be boosted by the reduction in the corporate
income tax. The main downside risk to the forecast
concerns a worsening of the external environment,
which might lead to a correction in financial
-6.0
-4.0
-2.0
0.0
2.0
4.0
6.0
8.0
10 11 12 13 14 15 16 17 18 19
Graph 2.15: Lithuania - Real GDP growth and
contributions
Real GDP (y-o-y%) Private consumption
Public consumption Investment
Changes in inventories Net exports
pps.forecast
-4.0
-3.0
-2.0
-1.0
0.0
1.0
2.0
3.0
4.0
5.0
6.0
7.0
10 11 12 13 14 15 16 17 18 19
Graph 2.16: Luxembourg - Real GDP growth and
contributions
Real GDP (y-o-y%) Private consumption
Public consumption Investment
Changes in inventories Net exports
pps.forecast

Summer 2018 (Interim) forecast
22
market valuations, to which the economy is
especially sensitive.
HICP inflation bounced up to 2.1% in 2017 from
zero in 2016, mainly as a result of higher oil
prices, which are expected to continue feeding into
headline inflation in 2018. However, downside
factors for inflation, such as subsidies in child and
healthcare services introduced in November 2017,
are expected to moderate overall inflation to 1.6%
in 2018. As these effects dissipate, domestic price
pressures, including from past wage increases,
should drive the headline inflation rate to 1.9% in
2019.
2.17. HUNGARY
GDP growth remained steady at 1.2% (q-o-q) in
the first quarter of 2018, supported mainly by
domestic demand. However, exports failed to keep
pace with rising import demand. Sentiment
indicators have remained buoyant up to June, but
recent production data indicate some deceleration
in the second quarter. The level of industrial
production has been flat since the beginning of the
year, and construction output has decreased.
Private consumption is set to grow robustly in
2018 thanks to rising employment and dynamic
real wage growth. Investment growth remains
broad-based, supported by high capacity
utilisation, rising public capital expenditure and
the recovery of the real estate sector. The cyclical
upswing of domestic demand is set to moderate in
2019, leading to slower GDP growth.
While domestic demand remains dynamic, the
external environment has become less supportive.
The soft patch of growth in main export markets is
proving persistent. Consequently, Hungarian
export growth may slow down in 2018, despite
major new manufacturing capacities starting
production. In addition, the prominent role of the
automotive industry (which accounts for over 5%
of gross value added) makes the economy sensitive
to global trade disputes, creating a new risk for the
outlook.
HICP inflation rose to 2.9% in May 2018, driven
by the surge in oil prices and the depreciation of
the forint. The weaker exchange rate may also
raise non-energy prices in the coming quarters.
The tight labour market and administrative wage
hikes are maintaining upward pressure on wages,
which will gradually feed into core inflation. Thus,
HICP inflation is expected to remain near 3%
throughout 2019. The aggregate effect of newly
planned indirect tax measures on inflation is
broadly neutral in 2019.
2.18. MALTA
Real GDP rose by 6.4% in 2017, one of the highest
growth rates within the EU. Growth was driven by
net exports, which reflected sustained export
growth combined with a contraction in imports.
Domestic demand was affected by a sharp decline
in investment, which is attributable to strong base
effects from exceptional investment growth in
previous years. The solid performance of the
internationally-oriented services sector contributed
to maintain Malta’s sizeable current account
surplus.
Growth is set to remain robust but to moderate
over the forecast horizon. Domestic demand is set
to become the main driver of growth in the second
half of 2018, underpinned by an expansion in
public and private consumption. Investment is
expected to recover strongly in 2019, supported by
projects in the health, technology and telecoms
sectors. The robust growth rate of residential
investment is set to moderate in line with the
expected slowdown in population growth.
The economic momentum is expected to further
support employment creation, on the back of
record-low unemployment and increasing labour
supply (resulting from the inflows of foreign
workers and the rising participation of women in
the labour market). Overall, real GDP is forecast to
increase by 5.4% in 2018 and 5.0% in 2019.
-6.0
-4.0
-2.0
0.0
2.0
4.0
6.0
8.0
10 11 12 13 14 15 16 17 18 19
Graph 2.17: Hungary - Real GDP growth and
contributions
Real GDP (y-o-y%) Private consumption
Public consumption Investment
Changes in inventories Net exports
pps.forecast

Summer 2018 (Interim) forecast
23
Downside risks are mainly related to geopolitical
uncertainties, which could be particularly relevant
for Malta’s small and open economy, and the
possibility of a slower-than-expected recovery in
investment.
Regulated prices in the electricity market and
moderate wage dynamics have helped keep
inflation slightly below the euro area average.
Headline annual HICP inflation is forecast to
gradually pick up over the forecast horizon to
reach 1.8% in 2019, driven by price pressures in
the services component.
2.19. THE NETHERLANDS
After solid annual real GDP growth of 2.9% in
2017, growth moderated slightly in the first quarter
of 2018. Quarterly growth was mainly driven by
private consumption, partly attributable to higher
energy consumption, and investment. Net exports
contributed negatively to growth, reflecting both
the transition to domestic demand based growth as
the cycle matures and a less dynamic external
environment.
Domestic demand is projected to remain the main
driver of sustained growth rates. Although they
peaked in the first quarter of 2018, confidence
indicators continue to point to expansion.
Employment growth has been solid so far this year
but is expected to moderate gradually as labour
market conditions tighten. Labour supply
constraints have increasingly been reflected in
recent wage agreements. These developments are
set to increase disposable incomes and thereby
support private consumption growth. High
capacity utilisation rates and business expectations
on new orders should provide a boost to robust
investment growth. Furthermore, the fiscal
stimulus ensuing from the 2018-2021 government
agreement is expected to raise government
consumption growth in 2018 and to a lesser extent
in 2019. Net exports are expected to contribute
negatively to growth in 2018, although monthly
data on goods exports show some recovery after
the weak first quarter. Overall GDP growth is
expected to reach 2.8% in 2018 and 2.5% in 2019.
HICP inflation averaged 1.3% in 2017 and is
expected to rise slightly to 1.5% in 2018, as higher
oil prices pass through into energy prices.
Accelerating wage growth is set to boost services
inflation. In 2019, HICP inflation is forecast to
increase to 2.3%, as the increase in the reduced
VAT tariff from 6% to 9% takes effect.
2.20. AUSTRIA
After a strong second half of 2017, Austria
experienced solid GDP growth in the first quarter
of 2018, pointing to a continuation of the
economic expansion. Growth has been driven by
private consumption and investment, as well as a
positive contribution from net exports. Economic
sentiment indicators have remained well above
long-term averages so far this year, although they
have declined slightly in recent months. Overall,
GDP growth is expected to remain high at 2.8% in
2018 and to decrease somewhat to 2.1% in 2019.
Investment growth is set to stay robust over the
forecast horizon, but to moderate from high levels.
It is expected to be supported by expansion needs
in light of high capacity utilisation as well as by
full construction order books resulting from
-10.0
-5.0
0.0
5.0
10.0
15.0
10 11 12 13 14 15 16 17 18 19
Graph 2.18: Malta - Real GDP growth and
contributions
Real GDP (y-o-y%) Private consumption
Public consumption Investment
Changes in inventories Net exports
pps.forecast
-6.0
-4.0
-2.0
0.0
2.0
4.0
6.0
8.0
10 11 12 13 14 15 16 17 18 19
Graph 2.19: The Netherlands - Real GDP growth and
contributions
Real GDP (y-o-y%) Private consumption
Public consumption Investment
Changes in inventories Net exports
pps.forecast

Summer 2018 (Interim) forecast
24
economic and population growth. Given the
positive developments on the labour market and
rising wages, private consumption is set to
continue to contribute positively to growth. It is
expected to grow more strongly in 2018 and to
moderate in 2019.
In 2017, GDP growth was supported by a notable
uptake in external demand. In 2018 and 2019,
Austria’s foreign trade is set to be less dynamic,
but should continue to contribute positively to
economic growth.
Prices increased considerably in 2017, raising
headline and core inflation both to 2.2%, which
was mainly due to the pick-up of prices in services,
as well as rents. In 2018, the assumed increase in
oil prices should keep headline inflation at 2.2%,
before it slightly decreases to 1.9% in 2019, while
core inflation is set to stabilise at 2.1%.
2.21. POLAND
Growth strengthened in the first quarter of 2018 to
1.6% (q-o-q), supported mainly by strong private
consumption and a sizeable build-up in
inventories. Despite increasing public investment
expenditure, investment growth remained modest.
Economic sentiment remained at elevated levels up
to June both among households and in the business
sector, which suggests that solid growth should
continue. Overall, real GDP growth is expected to
reach 4.6% in 2018 before slowing to 3.7% in
2019. Fast wage increases and high consumer
confidence levels are expected to support private
consumption, though its growth is projected to
gradually moderate as inflation picks up. Public
investment is expected to rise sharply in the
coming quarters as projects financed with EU
funding make progress. High capacity utilisation is
projected to support a more gradual increase in
private investment, especially equipment
investment.
Downside risks are related to the outlook for
German exports, given the strong role of Polish
producers in associated supply chains.
Core inflation and especially services prices
surprised on the downside in the first few months
of 2018 due to sector-specific factors. This partly
offset the effects of a faster rise in energy prices.
Headline inflation is expected to average 1.3% in
2018 before rising to 2.6% in 2019, driven by fast
wage growth, eventually leading to higher services
prices.
2.22. PORTUGAL
Portugal’s GDP growth slowed to 2.1% (y-o-y) in
2018-Q1, mainly due to weaker net exports. Part of
the moderation is explained by temporary factors,
such as bad weather conditions affecting
construction activities and port services. Following
a soft patch at the beginning of the year, economic
sentiment improved in May and June pointing to a
more favourable performance in the second
quarter. This is also confirmed by the latest
available hard data.
Private consumption continues to benefit from
improving labour market conditions but is
nevertheless projected to decelerate somewhat
over the second half of 2018 as the pace of job
creation slows and, to a lesser extent, as a result of
-1.0
-0.5
0.0
0.5
1.0
1.5
2.0
2.5
3.0
3.5
10 11 12 13 14 15 16 17 18 19
Graph 2.20: Austria - Real GDP growth and
contributions
Real GDP (y-o-y%) Private consumption
Public consumption Investment
Changes in inventories Net exports
pps.forecast
-2.0
-1.0
0.0
1.0
2.0
3.0
4.0
5.0
6.0
10 11 12 13 14 15 16 17 18 19
Graph 2.21: Poland - Real GDP growth and
contributions
Real GDP (y-o-y%) Private consumption
Public consumption Investment
Changes in inventories Net exports
pps.forecast

Summer 2018 (Interim) forecast
25
the impact of higher oil prices on real disposable
incomes. Equipment investment remains strong
and the outlook is also favourable, reflecting the
improved financial health of the corporate sector,
favourable lending conditions and a steady rise in
capacity utilisation. In addition, construction
investment is expected to rebound after the heavy
rainfalls in March, as suggested by improved data
on cement sales in 2018-Q2.
Both exports and imports are projected to continue
expanding at high rates, with a slightly negative
overall contribution to growth due to a less
favourable external environment. Overall, real
GDP growth is expected to rise by 2.2% in 2018
and 2.0% in 2019.
Following a significant slowdown early in the
year, inflation began to pick up in May, driven
mainly by the surge in oil prices. Inflation (HICP)
is therefore expected to average 1.4% in 2018 and
1.6% in 2019. Wage growth has been subdued but
is projected to gradually pick up over the forecast
horizon, pushing service prices above the headline
inflation rate. House prices, meanwhile, rose by
12.2% (y-o-y) in 2018-Q1, driven by tourism-
related activities and foreign capital inflows. The
ongoing recovery in residential construction is
expected to gradually rein in house prices but the
gap relative to the headline inflation rate is set to
remain substantial over the forecast horizon.
2.23. ROMANIA
The Romanian economic boom has started to wind
down. After reaching a post-crisis peak of 6.9% in
2017, real GDP growth decelerated to 4.0%
(y-o-y) in the first quarter of 2018. The main driver
of the slowdown was a contraction in private
consumption as inflation weighed more heavily on
real disposable income. Export growth, in contrast,
remained very robust in the first quarter of 2018
and outpaced the growth of imports.
Looking ahead, real GDP growth is forecast to
decelerate to 4.1% in 2018 and 3.8% in 2019. The
composition of growth is expected to become more
balanced as private consumption growth tempers
and investment strengthens on the back of a pick-
up in the implementation of projects financed by
EU funds.
Tight labour market conditions are expected to
continue over the forecast horizon, with
unemployment remaining close to its current very
low level. Nominal wage growth is expected to
continue in 2018, albeit at a slower pace, on the
back of further increases in public wages and an
additional 9% hike in the net minimum wage as of
January 2018. Real wage growth, however, is
expected to moderate significantly in 2018, due to
the higher inflation.
After two consecutive years of falling consumer
prices, inflation turned positive in 2017, despite
VAT rate cuts and lower excise duties on fuel.
Headline inflation started to accelerate in the
second half of the year mainly on account of rising
food and energy prices and further picked up in
early 2018 as the effect of the January 2017 tax
cuts faded away. Annual headline inflation stood at
4.6% in May this year. The reversal of the January
excise duties cut in October 2017 will exert an
additional pressure on inflation in the first three
quarters of 2018. Thus, inflation is forecast to rise
to 4.4% in 2018 and 3.4% in 2019. In response to
the rising inflation, the National Bank of Romania
-10.0
-8.0
-6.0
-4.0
-2.0
0.0
2.0
4.0
6.0
10 11 12 13 14 15 16 17 18 19
Graph 2.22: Portugal - Real GDP growth and
contributions
Real GDP (y-o-y%) Private consumption
Public consumption Investment
Changes in inventories Net exports
pps.forecast
-4.0
-2.0
0.0
2.0
4.0
6.0
8.0
10.0
10 11 12 13 14 15 16 17 18 19
Graph 2.23: Romania - Real GDP growth and
contributions
Real GDP (y-o-y%) Private consumption
Public consumption Investment
Changes in inventories Net exports
pps.forecast

Summer 2018 (Interim) forecast
26
has started to tighten its highly accommodative
monetary policy. In 2018 so far the key monetary
policy rate was raised by 0.75 pps. to 2.5%. These
are the first rate hikes since 2008.
2.24. SLOVENIA
In 2017, real GDP grew by 5.0% in Slovenia,
reaching a 10-year high, driven mainly by
domestic demand, particularly investment. In
2018-Q1, the economy grew by 0.7%, compared to
the previous quarter and 5.0% compared with the
same quarter in 2017. Export growth diminished
due to lower foreign demand, while imports,
consumption and investment continued to expand.
Economic sentiment fell somewhat in the first half
of 2018 compared to the end of 2017 but remained
at a very high level.
Real GDP growth is forecast to reach 4.4% in 2018
and 3.5% in 2019, slightly lower than 4.7% and
3.6% expected in the spring forecast. While
external demand has grown less than previously
expected, Slovenia’s exports are likely to benefit
from a good competitive position. Nevertheless net
exports’ growth contribution is likely to turn
negative as domestic demand strengthens,
supported by growing employment, wages and
favourable financing conditions. Business
investment growth is forecast to continue at a
rather high rate on the back of high capacity
utilisation and a tightening labour market amid
stronger balance sheets and improved profitability.
In the public sector, a more intensive use of EU
funds for investment projects is forecast for 2018
and 2019.
Downside risks to the growth outlook are linked to
developments in Slovenia’s key export markets
and the possibility that labour supply shortages
could start to limit growth. On the upside, the
positive impact of improving access to credit could
be larger than expected.
Overall, price pressures are expected to increase.
HICP inflation was 1.5% in the first quarter of
2018 and rose in April and May. Overall,
consumer prices are projected to rise by 2.1% in
2018 and 2.2% in 2019, slightly higher than the
1.9% and 2.0% expected in the spring forecast,
driven by energy prices and wages growth.
2.25. SLOVAKIA
After expanding by 3.4% in 2017, the Slovak
economy is expected to grow by around 4% in
2018 and 2019, with private consumption and
investment likely to be the main drivers of growth.
Investment growth is anticipated to peak in 2018,
driven by booming investment in the automotive
industry and some large-scale public infrastructure
projects. Investment surged by 6.2% (q-o-q) in
2018-Q1, pointing to a robust annual increase for
the year as a whole. Investment activity will
probably remain solid throughout 2019, supported
by a more buoyant drawdown of EU investment
funds. Net trade is expected to contribute
positively to growth as exports benefit from the car
industry’s expanded production capacity but there
is heightened uncertainty surrounding global trade
developments.
Households are expected to see their real
disposable incomes rise as improving labour
market conditions, including broad-based and swift
wage growth, should outweigh the impact of rising
inflation. This is expected to support continued
growth in private consumption given that
consumer confidence remains upbeat. Further
labour market tightening in the context of already
record-high labour shortages is set to keep nominal
wage growth high throughout 2018 and 2019. At
the same time, a shrinking supply of skilled
workers, coupled with rising demand for labour,
represents a potential bottleneck for Slovakia’s
booming economy.
Headline inflation is projected to increase to 2.6%
in 2018, reflecting solid wage growth and robust
household spending. Prices of services and food
are expected to be the main contributors to overall
-8.0
-6.0
-4.0
-2.0
0.0
2.0
4.0
6.0
10 11 12 13 14 15 16 17 18 19
Graph 2.24: Slovenia - Real GDP growth and
contributions
Real GDP (y-o-y%) Private consumption
Public consumption Investment
Changes in inventories Net exports
pps.forecast

Summer 2018 (Interim) forecast
27
growth in consumer prices over the forecast
horizon. Core inflation is expected to pick up
significantly this year. Both headline and core
inflation are expected to ease somewhat in 2019,
while remaining above 2%.
2.26. FINLAND
After reaching a six-year high of 2.6% in 2017,
preliminary data show that real GDP growth in
Finland hit 3.1% (y-o-y) in the first quarter of
2018, led by private consumption and machinery
investment. Investment growth surprised positively
with a 7.9% increase (y-o-y). Most indicators
suggest that the economy’s growth momentum
should continue into the second quarter of 2018.
The economic outlook remains favourable. Higher
employment, higher disposable income and solid
consumer confidence are expected to drive
household consumption. High capacity utilisation
and favourable financing conditions should
support investment. Investment growth is projected
to remain strong, despite some deceleration in
construction activity. Recent productivity gains
have improved competitiveness, which is
underpinning export growth, while import growth
is expected to strengthen further on the back of
rising private consumption. Supported by moderate
wage growth, the employment rate is expected to
increase further but significant slack is likely to
remain in the labour market.
Overall, real GDP growth this year is expected to
reach 2.8%. In 2019, however, growth is expected
to slow to 2.2%, as Finland’s shrinking working-
age population and persistently high structural
unemployment weigh on growth.
Risks to the outlook are broadly balanced. A
higher-than-forecast decrease in demand from
Finland’s main EU trading partners could harm
exports growth and investment. On the flip side,
further productivity gains could trigger higher
investment spending. Higher oil prices could also
boost Russian demand for Finnish goods.
Price pressures are expected to remain subdued.
Inflation (HICP) in the first half of 2018 was
among the lowest in the EU. Some acceleration is
forecast on the back of the rapid increase in oil
prices, although core inflation is likely to remain
low at 0.8%, with only a gradual acceleration in
2019.
2.27. SWEDEN
Economic growth in Sweden eased somewhat in
2017, with real GDP growth of 2.3%, mainly
driven by solid domestic demand. The estimate for
the first quarter of 2018 suggests that economic
activity remained solid (0.7% q-o-q), based on
buoyant construction investment and strong private
consumption. However, the contribution from net
exports turned negative, reflecting weaker demand
from Sweden’s main trading partners.
Real GDP growth is expected to remain firm at
2.4% in 2018, before moderating to 1.9% in 2019
when lower housing investment is expected to
flatten domestic demand. Following two decades
of strong growth, house prices declined in
2017-Q4 and have broadly stabilised since. This
development in the construction sector is reflected
in overall economic sentiment, which has been on
a downward trend since November. Nevertheless,
a strong labour market has continued to support a
-6.0
-4.0
-2.0
0.0
2.0
4.0
6.0
8.0
10 11 12 13 14 15 16 17 18 19
Graph 2.25: Slovakia - Real GDP growth and
contributions
Real GDP (y-o-y%) Private consumption
Public consumption Investment
Changes in inventories Net exports
pps.forecast
-2.0
-1.0
0.0
1.0
2.0
3.0
4.0
5.0
10 11 12 13 14 15 16 17 18 19
Graph 2.26: Finland - Real GDP growth and
contributions
Real GDP (y-o-y%) Private consumption
Public consumption Investment
Changes in inventories Net exports
pps.forecast

Summer 2018 (Interim) forecast
28
further increase in household incomes, which is
likely to feed private consumption growth in 2018
and 2019.
Turning to the external sector, in spite of the
Swedish krona’s depreciation, exports of goods
and services surprised on the downside in the first
quarter of 2018, contracting by 0.2% (q-o-q).
Trade-related uncertainty is expected to weigh on
external demand and investment decisions going
forward.
Risks are tilted to the downside. As a small open
economy, Sweden remains vulnerable to external
shocks. While the recent decline in house prices
seems to have come to a halt, a renewed decline
could reduce residential construction activity with
repercussions on consumer confidence, household
consumption, and ultimately growth.
Headline inflation stood at 2.0% in May, the
Riksbank’s target rate for price increases, fuelled
by high energy and food prices. However, core
inflation was only at 1.1%, suggesting still
subdued price pressures. HICP is projected to be
1.9% in 2018 as in 2017 and to edge down to 1.7%
in 2019. The weak Swedish krona is set to exert
upward pressures on import prices but despite a
tight domestic labour market wage growth remains
weak.
2.28. THE UNITED KINGDOM
Economic growth in the UK slowed significantly
at the start of 2018: GDP growth was 0.2% (q-o-q)
in 2018-Q1 down from 0.4% in 2017-Q4. This
slowdown was in part due to severe weather
disruption in March. High frequency indicators
suggest that the output lost in 2018-Q1 will not be
recovered in 2018-Q2, which is consistent with
surveys indicating that firms in the construction
and manufacturing sectors are facing capacity
constraints and are therefore unable to make up for
lost output.
For 2018 as a whole, private consumption growth
is expected to remain subdued despite support
from generally easing inflation, reflecting low
consumer confidence and an anticipated
stabilisation in the household saving rate. Business
investment growth is projected to remain weak
while uncertainty over the UK’s future trading
relationship with the EU remains. Net trade is
expected to moderate in 2018, in line with the
unwinding of the boost from sterling’s 2016
depreciation and moderating export market
growth. Reflecting this outlook, modest GDP
growth of 1.3% in 2018 is forecast. Risks to the
2018 forecast are tilted to the downside.
Domestically, downside risks relate to the
possibility that the household saving rate rises
faster than anticipated leading to lower
consumption growth. While on the external side,
as an open economy, the UK is particularly
exposed to an escalation in trade protectionist
measures that could further inhibit export growth.
Given the ongoing negotiation over the terms of
the UK’s withdrawal from the EU, projections for
2019 continue to be based on a purely technical
assumption of status quo in terms of trading
relations between the EU27 and the UK. This is for
forecasting purposes only and has no bearing on
the talks underway in the context of the Article 50
process. Under this assumption, GDP growth is
-2.0
-1.0
0.0
1.0
2.0
3.0
4.0
5.0
6.0
7.0
10 11 12 13 14 15 16 17 18 19
Graph 2.27: Sweden - Real GDP growth and
contributions
Real GDP (y-o-y%) Private consumption
Public consumption Investment
Changes in inventories Net exports
pps.forecast
-1.5
-1.0
-0.5
0.0
0.5
1.0
1.5
2.0
2.5
3.0
3.5
10 11 12 13 14 15 16 17 18 19
Graph 2.28: The United Kingdom - Real GDP growth
and contributions
Real GDP (y-o-y%) Private consumption
Public consumption Investment
Changes in inventories Net exports
pps.forecast

Summer 2018 (Interim) forecast
29
projected to remain weak at 1.2% in 2019. The
boost from lower consumer price inflation on
private consumption is expected to be offset by a
rise in the household saving rate. Business
investment is projected to remain subdued
following a period of prolonged uncertainty.
Export growth is expected to remain modest,
broadly in line with growth in export markets.
However, as the purely technical assumption
implies a relatively benign scenario, the risks to
the 2019 baseline forecast are large and
predominantly to the downside.
Consumer price inflation is expected to remain
elevated in 2018 at 2.6% but to slow over the
course of the year. The impact of the recent rise in
oil prices should partly offset the unwinding of the
pass through sterling’s earlier depreciation on
consumer prices. Inflation is projected to ease to
2.0% in 2019.

STATISTICAL ANNEX
Summer 2018 (Interim) forecast
30
Table 1: 3.7.2018
5-year
1999-03 2004-08 2009-13 2014 2015 2016 2017 2018 2019 2018 2019
2.1 2.5 0.5 1.3 1.4 1.4 1.7 1.7 1.6 1.8 1.7
1.2 2.0 0.6 1.9 1.7 1.9 2.2 1.9 1.9 2.3 2.1
5.8 5.5 0.0 2.9 1.7 2.1 4.9 3.5 2.7 3.7 2.8
7.0 3.8 0.3 8.3 25.6 5.1 7.8 5.6 4.0 5.7 4.1
4.2 2.8 -5.9 0.7 -0.3 -0.2 1.4 1.9 2.3 1.9 2.3
4.0 3.2 -1.8 1.4 3.4 3.3 3.1 2.8 2.4 2.9 2.4
2.3 1.9 0.4 1.0 1.1 1.2 2.2 1.7 1.7 2.0 1.8
1.5 1.0 -1.6 0.1 1.0 0.9 1.5 1.3 1.1 1.5 1.2
4.0 4.3 -1.9 -1.4 2.0 3.4 3.9 3.6 3.3 3.6 3.3
6.0 7.3 -1.4 1.9 3.0 2.2 4.5 3.3 3.2 3.3 3.3
Lithuania 5.2 7.0 -0.3 3.5 2.0 2.3 3.8 3.1 2.6 3.1 2.7
4.9 3.8 1.2 5.8 2.9 3.1 2.3 3.5 3.3 3.7 3.5
3.3 2.7 1.9 8.1 9.6 5.2 6.4 5.4 5.0 5.8 5.1
2.4 2.7 -0.4 1.4 2.0 2.2 2.9 2.8 2.5 3.0 2.6
2.2 2.7 0.3 0.8 1.1 1.5 3.0 2.8 2.1 2.8 2.2
1.9 1.4 -1.6 0.9 1.8 1.6 2.7 2.2 2.0 2.3 2.0
3.8 4.8 -2.0 3.0 2.3 3.1 5.0 4.4 3.5 4.7 3.6
2.8 7.4 1.1 2.8 3.9 3.3 3.4 3.9 4.2 4.0 4.2
3.3 3.3 -1.1 -0.6 0.1 2.1 2.6 2.8 2.2 2.5 2.3
2.1 2.1 -0.4 1.3 2.1 1.8 2.4 2.1 2.0 2.3 2.0
2.5 6.8 0.1 1.3 3.6 3.9 3.6 3.8 3.7 3.8 3.7
2.8 5.3 -0.4 2.7 5.3 2.5 4.3 3.0 2.9 3.4 3.1
1.7 1.9 -0.1 1.6 1.6 2.0 2.3 1.6 1.8 1.8 1.9
3.4 4.0 -2.4 -0.1 2.4 3.5 2.9 2.6 2.5 2.8 2.7
3.9 2.9 -0.8 4.2 3.4 2.2 4.0 4.0 3.2 4.0 3.2
3.2 5.2 2.9 3.3 3.8 3.0 4.6 4.6 3.7 4.3 3.7
3.6 7.1 -0.4 3.1 4.0 4.8 6.9 4.1 3.8 4.5 3.9
3.0 2.9 0.8 2.6 4.5 3.2 2.3 2.4 1.9 2.6 2.0
EU27 2.2 2.4 -0.3 1.5 2.3 2.0 2.6 2.3 2.1 2.5 2.2
3.1 2.0 0.5 2.9 2.3 1.8 1.7 1.3 1.2 1.5 1.2
2.3 2.3 -0.1 1.7 2.3 1.9 2.4 2.1 2.0 2.3 2.0EU28
Czech Republic
Slovakia
Cyprus
forecast
United Kingdom
Bulgaria
Italy
Poland
Slovenia
Romania
Greece
Euro area
Denmark
Netherlands
Spring 2018
Malta
Ireland
Summer 2018
Sweden
Finland
Latvia
Gross domestic product, volume (percentage change on preceding year, 1999-2019)
France
Hungary
Portugal
Luxembourg
Estonia
Belgium
forecastaverages
Croatia
Austria
Spain
Germany
Table .2:Table 2: 3.7.2018
2017/1 2017/2 2017/3 2017/4 2018/1 2018/2 2018/3 2018/4 2019/1 2019/2 2019/3 2019/4
0.7 0.5 0.2 0.5 0.3 0.4 0.5 0.5 0.4 0.3 0.3 0.3
0.9 0.6 0.7 0.6 0.3 0.3 0.5 0.5 0.5 0.5 0.5 0.4
1.1 1.6 0.1 2.1 -0.1 1.0 1.1 0.8 0.6 0.5 0.5 0.5
: : : : : : : : : : : :
: : : : : : : : : : : :
0.8 0.9 0.7 0.7 0.7 0.7 0.7 0.6 0.6 0.5 0.5 0.5
0.8 0.7 0.7 0.7 0.2 0.3 0.4 0.4 0.4 0.5 0.5 0.5
0.5 0.4 0.3 0.4 0.3 0.2 0.3 0.3 0.2 0.3 0.2 0.2
: : : : : : : : : : : :
1.4 1.4 1.5 0.4 1.5 0.2 0.3 0.4 0.9 1.0 1.0 1.0
Lithuania 1.1 0.7 0.5 1.4 0.9 0.4 0.6 0.7 0.7 0.7 0.7 0.7
: : : : : : : : : : : :
: : : : : : : : : : : :
0.5 1.0 0.6 0.9 0.6 0.6 0.7 0.7 0.6 0.6 0.5 0.5
1.1 0.8 0.9 0.9 0.8 0.4 0.5 0.5 0.5 0.5 0.5 0.5
0.7 0.3 0.6 0.7 0.4 0.6 0.5 0.6 0.5 0.5 0.4 0.5
1.6 1.3 1.1 1.9 0.7 0.9 0.9 0.9 0.8 0.8 0.8 0.8
0.8 1.0 0.8 0.9 0.9 1.2 1.2 1.2 1.2 1.0 0.9 1.0
0.9 0.6 0.3 0.9 1.2 0.5 0.3 0.3 0.7 0.7 0.7 0.7
0.7 0.7 0.7 0.7 0.4 0.4 0.5 0.5 0.4 0.5 0.5 0.5
0.9 1.0 0.9 0.7 0.9 1.0 1.0 1.1 0.8 0.8 0.8 0.8
1.3 2.3 0.5 0.7 0.5 0.7 0.7 0.7 0.7 0.8 0.7 0.7
2.4 -1.1 -0.8 0.9 0.4 0.7 0.7 0.7 0.3 0.3 0.3 0.3
0.9 0.7 0.6 0.0 0.2 1.0 1.1 0.8 0.6 0.5 0.5 0.5
1.4 1.1 1.1 1.3 1.2 0.6 0.7 0.8 0.8 0.8 0.8 0.8
1.1 0.9 1.4 1.0 1.6 0.9 0.8 0.9 0.9 0.9 0.9 0.9
2.4 1.6 2.2 0.3 0.0 1.7 1.4 1.2 0.8 0.7 0.6 0.5
0.4 1.1 0.6 0.7 0.7 0.5 0.4 0.4 0.4 0.4 0.3 0.3
EU27 0.7 0.8 0.7 0.7 0.4 0.5 0.5 0.5 0.5 0.5 0.5 0.5
0.4 0.2 0.4 0.4 0.2 0.3 0.4 0.4 0.3 0.3 0.3 0.2
0.7 0.7 0.7 0.7 0.4 0.4 0.5 0.5 0.4 0.5 0.5 0.4
Belgium
Greece
Denmark
Finland
Latvia
Sweden
Croatia
Austria
Spain
Netherlands
Profiles (qoq) of quarterly GDP, volume (percentage change from previous quarter, 2017-19)
Euro area
Germany
Hungary
Portugal
France
Estonia
Bulgaria
Luxembourg
Italy
Slovenia
Malta
Ireland
Czech Republic
Cyprus
Slovakia
United Kingdom
Poland
EU28
Romania

Summer 2018 (Interim) forecast
31
Table .3:Table 3:
5-year
1999-03 2004-08 2009-13 2014 2015 2016 2017 2018 2019 2018 2019
1.9 2.6 1.9 0.5 0.6 1.8 2.2 1.9 1.6 1.6 1.6
1.3 2.1 1.5 0.8 0.1 0.4 1.7 1.7 1.8 1.6 1.8
3.5 5.8 3.1 0.5 0.1 0.8 3.7 2.9 2.7 2.9 2.5
4.1 2.6 0.1 0.3 0.0 -0.2 0.3 1.0 1.3 0.8 1.1
3.2 3.4 1.9 -1.4 -1.1 0.0 1.1 0.7 1.3 0.5 1.2
3.0 3.4 1.8 -0.2 -0.6 -0.3 2.0 1.8 1.6 1.4 1.4
1.7 2.2 1.5 0.6 0.1 0.3 1.2 1.9 1.5 1.7 1.4
2.4 2.4 2.0 0.2 0.1 -0.1 1.3 1.4 1.6 1.2 1.4
2.9 2.5 1.9 -0.3 -1.5 -1.2 0.7 0.8 1.4 0.7 1.2
2.4 9.0 1.7 0.7 0.2 0.1 2.9 2.6 2.6 2.7 2.6
Lithuania 0.7 4.9 2.8 0.2 -0.7 0.7 3.7 2.7 2.2 2.7 2.3
2.4 3.3 2.2 0.7 0.1 0.0 2.1 1.6 1.9 1.5 1.7
2.5 2.6 2.1 0.8 1.2 0.9 1.3 1.5 1.8 1.6 1.8
3.1 1.7 2.0 0.3 0.2 0.1 1.3 1.5 2.3 1.6 2.2
1.6 2.2 2.1 1.5 0.8 1.0 2.2 2.2 1.9 2.1 1.9
3.3 2.6 1.5 -0.2 0.5 0.6 1.6 1.4 1.6 1.2 1.6
7.4 3.6 1.9 0.4 -0.8 -0.2 1.6 2.1 2.2 1.9 2.0
8.3 4.1 2.2 -0.1 -0.3 -0.5 1.4 2.6 2.2 2.4 2.1
2.0 1.5 2.4 1.2 -0.2 0.4 0.8 1.3 1.7 1.4 1.7
2.0 2.4 1.7 0.4 0.0 0.2 1.5 1.7 1.7 1.5 1.6
5.7 7.8 2.3 -1.6 -1.1 -1.3 1.2 2.0 1.8 1.8 1.8
2.3 3.1 1.8 0.4 0.3 0.6 2.4 2.1 2.0 2.1 1.8
2.3 2.0 1.8 0.4 0.2 0.0 1.1 0.9 1.5 0.8 1.4
3.5 3.4 2.2 0.2 -0.3 -0.6 1.3 1.6 1.8 1.4 1.5
7.8 5.7 4.0 0.0 0.1 0.4 2.4 2.7 3.2 2.3 3.0
5.0 2.8 3.0 0.1 -0.7 -0.2 1.6 1.3 2.6 1.3 2.5
32.7 8.1 4.8 1.4 -0.4 -1.1 1.1 4.4 3.4 4.2 3.4
1.8 1.7 1.3 0.2 0.7 1.1 1.9 1.9 1.7 1.9 1.7
3.1 2.7 1.9 0.4 0.0 0.2 1.6 1.8 1.8 1.6 1.7
1.2 2.3 3.1 1.5 0.0 0.7 2.7 2.6 2.0 2.5 1.9
2.7 2.6 2.1 0.5 0.0 0.3 1.7 1.9 1.8 1.7 1.8EU28
Czech Republic
Slovakia
Cyprus
forecast
Hungary
Portugal
Belgium
forecastaverages
Croatia
Austria
Spain
Germany
Romania
Denmark
3.7.2018
Luxembourg
Estonia
United Kingdom
Bulgaria
Italy
Poland
Slovenia
Spring 2018
Harmonised index of consumer prices (percentage change on preceding year, 1999-2019)
Malta
Ireland
Summer 2018
EU27
Euro area
France
Netherlands
Greece
Sweden
Finland
Latvia
Table .4:Table 4: 3.7.2018
2017/1 2017/2 2017/3 2017/4 2018/1 2018/2 2018/3 2018/4 2019/1 2019/2 2019/3 2019/4
3.0 2.0 1.9 2.0 1.6 2.1 2.3 1.8 2.0 1.6 1.5 1.4
1.9 1.6 1.7 1.6 1.3 1.8 2.0 1.8 2.1 1.7 1.7 1.7
3.1 3.4 4.0 4.1 3.2 3.1 2.7 2.7 2.8 2.6 2.6 2.6
0.4 0.0 0.1 0.5 0.5 0.8 1.4 1.2 1.4 1.3 1.3 1.4
1.5 1.3 0.8 0.8 0.3 0.8 1.0 0.6 0.9 1.2 1.4 1.6
2.7 2.1 1.8 1.6 1.1 1.8 2.3 1.9 1.8 1.6 1.6 1.5
1.5 1.0 0.9 1.2 1.5 2.2 2.0 1.8 1.4 1.4 1.5 1.6
1.3 1.6 1.3 1.1 0.9 1.0 1.6 1.9 1.8 1.6 1.5 1.5
1.2 1.3 0.2 0.1 -0.8 0.8 1.6 1.5 1.5 1.3 1.4 1.5
3.1 3.0 2.9 2.5 2.0 2.4 3.0 2.8 2.7 2.6 2.5 2.4
Lithuania 3.0 3.4 4.5 4.1 3.1 2.5 2.6 2.6 2.6 2.3 2.0 1.9
2.6 2.0 2.0 1.8 1.2 1.9 1.9 1.8 1.9 1.9 1.9 2.0
1.3 1.1 1.2 1.4 1.3 1.7 1.7 1.7 1.6 1.8 1.8 1.8
1.3 1.0 1.5 1.4 1.3 1.5 1.6 1.8 2.3 2.3 2.4 2.3
2.2 2.2 2.2 2.4 2.0 2.2 2.3 2.2 2.0 1.8 1.9 2.0
1.4 1.7 1.3 1.8 0.9 1.3 1.9 1.8 1.7 1.6 1.6 1.6
2.0 1.4 1.3 1.5 1.5 2.1 2.4 2.3 2.3 2.2 2.2 2.2
1.0 1.0 1.6 2.0 2.4 2.9 2.7 2.5 2.1 2.1 2.2 2.2
1.1 0.9 0.7 0.6 0.8 1.0 1.6 1.7 2.1 1.8 1.6 1.4
1.8 1.5 1.4 1.4 1.3 1.7 1.9 1.8 1.8 1.6 1.6 1.6
0.8 1.4 0.9 1.7 1.6 2.1 2.4 2.0 2.0 1.7 1.7 1.8
2.5 2.3 2.4 2.5 1.7 2.1 2.4 2.4 2.3 2.0 1.9 1.8
0.8 0.7 1.5 1.2 0.5 0.8 1.4 1.0 1.5 1.4 1.5 1.6
1.1 1.1 1.4 1.5 1.1 2.4 2.3 1.9 1.7 1.6 1.8 1.9
2.6 2.1 2.5 2.3 2.0 2.7 3.2 3.0 3.3 3.3 3.1 3.2
1.7 1.5 1.5 1.8 1.0 1.2 1.6 1.4 2.1 2.6 2.7 2.8
0.4 0.6 1.0 2.4 3.7 4.7 4.9 4.2 3.6 3.6 3.3 3.3
1.6 1.8 2.2 1.8 1.7 1.9 2.1 2.0 1.9 1.8 1.7 1.5
EU27 1.7 1.5 1.5 1.5 1.3 1.7 2.0 1.8 1.9 1.7 1.7 1.7
2.2 2.8 2.8 3.0 2.7 2.5 2.8 2.5 2.2 2.0 1.9 1.8
1.8 1.7 1.7 1.7 1.5 1.9 2.1 2.0 1.9 1.8 1.7 1.7
Belgium
Greece
Denmark
Finland
Latvia
Sweden
Croatia
Austria
Spain
Netherlands
Harmonised index of consumer prices (percentage change on preceding year, 2017-19)
Euro area
Germany
Hungary
Portugal
France
Estonia
Bulgaria
Luxembourg
Italy
Slovenia
Malta
Ireland
Czech Republic
Cyprus
Slovakia
United Kingdom
Poland
EU28
Romania

Summer 2018 (Interim) forecast
32
(Continued on the next page)
Box .1: Some technical elements behind the forecast
The European Commission presents its first
summer issue of what will be twice-yearly interim
forecasts, resuming its annual schedule of two-fully
fledged forecasts and two much shorter interim
forecasts as done until the height of the sovereign
debt crisis. The interim forecasts provide an update
of GDP and inflation developments for all EU
Member States. This interim forecast updates the
outlook of the spring 2018 economic forecast of
3 May 2018.
Given the ongoing negotiations on the terms of the
UK withdrawal from the EU, projections for 2019
are based on a purely technical assumption of status
quo in terms of trading relations between the EU27
and the UK. This is for forecasting purposes only
and has no bearing on the outcome of the talks
underway in the context of the Article 50 process.
The cut-off date for taking new information into
account in this European Economic Forecast was
3 July 2018.
ESA 2010
The source for all tables is the European
Commission, unless otherwise stated. Historical
data for the Member States are based on the
European System of Accounting (ESA 2010). 2018
and 2019 are forecast years.
External assumptions
This forecast is based on a set of external
assumptions, reflecting market expectations at the
time of the forecast. To shield the assumptions
from possible volatility during any given trading
day, averages from a 10-day reference period
(between 15 and 28 June) were used for exchange
and interest rates, and for oil prices.
The technical assumption regarding exchange rates
was standardised using fixed nominal exchange
rates for all currencies. This technical assumption
leads to an implied average USD/EUR rate of 1.19
in 2018 and 1.16 in 2019. The average JPY/EUR is
129.71 in 2018 and 127.85 in 2019.
Interest-rate assumptions are market-based.
Short-term interest rates for the euro area are
derived from futures contracts. Long-term interest
rates for the euro area, as well as short- and
long-term interest rates for other Member States are
calculated using implicit forward swap rates,
corrected for the current spread between the
interest rate and swap rate. In cases where no
market instrument is available, the fixed spread
vis-à-vis the euro area interest rate is taken for both
short- and long-term rates. As a result, short-term
interest rates are assumed to be -0.3% in 2018 and
-0.2% in 2019 in the euro area. Long-term euro
area interest rates are assumed to be 0.5% in 2018
and 0.6% in 2019.
Commodity price assumptions are also based on
market conditions. According to futures markets,
prices for Brent oil are projected to be on average
72.8 USD/bbl in 2018, and 71.8 USD/bbl in 2019.
This would correspond to an oil price of
61.4 EUR/bbl in 2018, and 61.8 EUR/bbl in 2019.
Trade policies
This Interim Summer Forecast is published against
a background of rising trade tensions. The forecast
pencils in only the measures that have been
implemented until the cut-off date:
In January 2018, the US implemented
safeguard tariffs on solar panels and washing
machines from all countries (20 to 30 percent
tariffs on imports worth $10.3 billion,
combined).
On 23 March, US duties of 25% and 10%
respectively on imports of steel and aluminium
went into effect. One of the nations affected
was China, which responded by imposing
tariffs (mainly on aluminium waste and scrap
as well as food), on imports worth about
$2.5 billion, while several countries gained
temporary or permanent or exemptions
(Argentina, Australia, Brazil and South Korea,
which all promised to adhere to voluntary
export limits on these metals).
On 1 June, the exemptions granted to the
EU (1), Canada and Mexico ended. The US
measures are set to affect EU exports worth
€6.4 billion in 2017, phased in 2 steps.
On 20 June, the European Commission
exercised (2) its rights under WTO rules and
(1) European Commission (2018). ‘European
Commission reacts to the US restrictions on steel and
aluminium affecting the EU’. European Commission
Press Release 4006. June. (2) European Commission (2018). ‘EU adopts
rebalancing measures in reaction to US steel and
aluminium tariffs’. European Commission Press Release 4220. June.

Summer 2018 (Interim) forecast
33
Acknowledgements
This report was prepared in the Directorate-General for Economic and Financial Affairs under the
direction of Marco Buti, Director General, and José Eduardo Leandro, Director of the “Policy, strategy
and communication”. Executive responsibilities were attached to Björn Döhring, Head of Unit
“Economic situation, forecasts, business and consumer surveys”, Evelyne Hespel, Head of Sector
“Macro-economic forecasts and short-term economic developments”, and the forecast coordinators,
Reuben Borg and Suzanne Casaux.
The report benefitted from contributions by Aurelija Anciūtė, Wojciech Balcerowicz, Nicolae Biea,
Reuben Borg, Chris Bosma, Lucian Briciu, Kathleen Burkhardt, Suzanne Casaux, Francisco de Castro
Fernández, András Chabin, Oliver Dieckmann, Violaine Faubert, Norbert Gaál, Mateja Gabrijelcic,
Oscar Gomez Lacalle, Benedetta Guerzoni, John Harnett, Julien Hartley, David Havrlant, Andras
Hudecz, Jip Italianer, Isabelle Justo, Violeta Klyviene, Radoslav Krastev, Anna Küffel, Ivan Kusen,
João Miguel Leal, Julia Lendvai, David Lopes, Natalie Lubenets, Mart Maiväli, Wojciech Paczyński,
Mona Papadakou, Gábor Márk Pellényi, Leonardo Pérez-Aranda, Samuli Pietiläinen, Mario Pletikosa,
Simona Pojar, Félix Rodríguez Millán, Dan A. Rieser, Maja Semanovic, Sara Simoes, Michael Sket,
Peeter Soidla, Ulrike Stierle-von Schütz, Nuria Subirats Rebull, Tsvetan Tsalinski, Ismael Valdés
Fernández, Milda Valentinaitė, Przemysław Woźniak, Alexandru Zeana, and Ingars Zustrups.
Statistical and layout assistance was provided by Salvador Adrian Ferrandis Vallterra and Tomasz
Zdrodowski.
Support in editing was provided by Peter Koh.
Box (continued)
adopted a regulation enacting the EU’s
rebalancing measures in response to the US
tariffs on steel and aluminium, which in a first
stage target a list of products worth
€2.8 billion. These measures took effect on
22 June. Both Mexico and Canada also
retaliated, imposing tariffs on the US exports of
equal value to the affected value of their
respective imports.
Calendar effects on GDP growth
The number of working days may differ from one
year to another. The Commission’s annual GDP
forecasts are not adjusted for the number of
working days, but quarterly forecasts are. However,
the working-day effect in the EU and the euro area
is estimated to be limited over the forecast horizon,
implying that adjusted and unadjusted annual
growth rates differ only marginally (by up to
±0.1 pps.).
Geographical zones
Euro area: EA19 (BE, DE, EE, IE, EL, ES, FR, IT,
CY, LV, LT, LU, MT, NL, AT, PT, SI, SK and FI).
European Union: EU28 (EA19, BG, CZ, DK, HR,
HU, PL, RO, SE and UK).
EU27: EU28 without UK


EUROPEAN ECONOMY INSTITUTIONAL SERIES European Economy Institutional series can be accessed and downloaded free of charge from the following address: https://ec.europa.eu/info/publications/economic-and-financial-affairs-publications_en?field_eurovoc_taxonomy_target_id_selective=All&field_core_nal_countries_tid_selective=All&field_core_date_published_value[value][year]=All&field_core_tags_tid_i18n=22621. Titles published before July 2015 can be accessed and downloaded free of charge from: • http://ec.europa.eu/economy_finance/publications/european_economy/index_en.htm
(the main reports, e.g. Economic Forecasts) • http://ec.europa.eu/economy_finance/publications/occasional_paper/index_en.htm
(the Occasional Papers) • http://ec.europa.eu/economy_finance/publications/qr_euro_area/index_en.htm
(the Quarterly Reports on the Euro Area)


GETTING IN TOUCH WITH THE EU In person All over the European Union there are hundreds of Europe Direct Information Centres. You can find the address of the centre nearest you at: http://europa.eu/contact. On the phone or by e-mail Europe Direct is a service that answers your questions about the European Union. You can contact this service:
• by freephone: 00 800 6 7 8 9 10 11 (certain operators may charge for these calls),
• at the following standard number: +32 22999696 or • by electronic mail via: http://europa.eu/contact.
FINDING INFORMATION ABOUT THE EU Online Information about the European Union in all the official languages of the EU is available on the Europa website at: http://europa.eu. EU Publications You can download or order free and priced EU publications from EU Bookshop at: http://publications.europa.eu/bookshop. Multiple copies of free publications may be obtained by contacting Europe Direct or your local information centre (see http://europa.eu/contact). EU law and related documents For access to legal information from the EU, including all EU law since 1951 in all the official language versions, go to EUR-Lex at: http://eur-lex.europa.eu. Open data from the EU The EU Open Data Portal (http://data.europa.eu/euodp/en/data) provides access to datasets from the EU. Data can be downloaded and reused for free, both for commercial and non-commercial purposes.