Embed Size (px)
Citation preview

European Cooperation on Health Technology Assessment Economic and governance analysis of the establishment of a permanent secretariat
Final report
Client: Executive Agency for Health and Consumers
Rotterdam, 30 January 2013

European Cooperation on Health Technology Assessment Economic and governance analysis of the establishment of a permanent secretariat Final report
Client: Executive Agency for Health and Consumers
Arthur ten Have Wija Oortwijn Pieter Broos Emmy Nelissen Rotterdam, 30 January 2013

2
FGE91603
About Ecorys
At Ecorys we aim to deliver real benefit to society through the work we do. We offer research, consultancy and project management, specialising in economic, social and spatial development. Focusing on complex market, policy and management issues we provide our clients in the public, private and not-for-profit sectors worldwide with a unique perspective and high-value solutions. Ecorys’ remarkable history spans more than 80 years. Our expertise covers economy and competitiveness; regions, cities and real estate; energy and water; transport and mobility; social policy, education, health and governance. We value our independence, integrity and partnerships. Our staff are dedicated experts from academia and consultancy, who share best practices both within our company and with our partners internationally. Ecorys Netherlands has an active CSR policy and is ISO14001 certified (the international standard for environmental management systems). Our sustainability goals translate into our company policy and practical measures for people, planet and profit, such as using a 100% green electricity tariff, purchasing carbon offsets for all our flights, incentivising staff to use public transport and printing on FSC or PEFC certified paper. Our actions have reduced our carbon footprint by an estimated 80% since 2007. ECORYS Nederland BV Watermanweg 44 3067 GG Rotterdam P.O. Box 4175 3006 AD Rotterdam The Netherlands T +31 (0)10 453 88 00 F +31 (0)10 453 07 68 E [email protected] Registration no. 24316726 W www.ecorys.nl

Table of contents
3
European Cooperation on Health Technology Assessment
Preface 5
1 Introduction 7 1.1 European cooperation on Health Technology Assessment 7 1.2 Focus of the study 7 1.3 Outline of the report 9
2 Methodology 11 2.1 Literature review 11 2.2 Interviews 11 2.3 Cost benefit analysis 12 2.4 Limitations of the study 12
2.4.1 Scope of the study 12 2.4.2 Assumptions 12 2.4.3 Quantification of costs and benefits 12
3 Governance analysis 13 3.1 HTA cooperation in Europe 13
3.1.1 Main benefits of HTA cooperation in Europe 13 3.1.2 Main bottlenecks of HTA cooperation in Europe 14 3.1.3 Future opportunities and necessary changes to improve cooperation in HTA in Europe 15
3.2 Scenario’s 17 3.2.1 Scenario 1: Developing and maintaining an ICT platform 17 3.2.2 Scenario 2: Development of common generic guidelines 18 3.2.3 Scenario 3: Coordinated/joint assessment 18 3.2.4 General remarks 18
3.3 Hosting alternatives 19 3.3.1 Hosting within the EU Commission 20 3.3.2 Hosting within a subordinate Agency under the EU Commission 20 3.3.3 Hosting through outsourcing to an external body 21
3.4 Conclusion 22
4 Economic analysis 23 4.1 Description of the scenarios and components 23 4.2 Assumptions on coordination of HTA activities 25
4.2.1 Coordination of the network 25 4.3 Estimating HTA production 28
4.3.1 Estimating the costs of the HTA production 29 4.4 Results of the economic analysis 31
4.4.1 EUnetHTA coordination cost 31 4.4.2 Benefits: production of HTA reports 32
4.5 Overview of benefits, components and scenarios 34 4.5.1 Conclusions 39

4
European Cooperation on Health Technology Assessment
5 Conclusions and further observations 41 5.1 Main conclusions 41 5.2 Further observations 43
Annex 1: Tables of Calculations 47
Annex 2: List of interviewees 57

5
European Cooperation on Health Technology Assessment
Preface
Referring to the framework Contract EAHC/2010/Health/01 “Support for the Health Information Strategy” (Lot 2 signed between our consortium, led by Ecorys Nederland BV, and Executive Agency for Health and Consumers - EAHC), Ecorys is pleased to submit this draft final report for an economic and governance analysis of the establishment of a permanent secretariat for European cooperation on Health Technology Assessment (HTA) (Reference number 2011 63 72). This report builds upon desk research and information provided by many people of the European and international HTA community, as well as stakeholders from industry, health professionals, patient representatives, national governments and European organizations. We thank all contributors for their willingness to cooperate and their time. In particular, we would like to thank the Secretariat of EUnetHTA for their support in providing information and data on existing cooperation in the field of HTA in Europe. This study has been undertaken by a team of experts of Ecorys consisting of Arthur ten Have (economist, team leader), Wija Oortwijn (principal HTA expert), Emmy Nelissen (researcher) and Pieter Broos (researcher).

7
European Cooperation on Health Technology Assessment
1 Introduction
1.1 European cooperation on Health Technology Assessment
Health Technology Assessment (HTA) is defined as “the systematic evaluation of properties, effects, and/or impacts of health technology. It may address the direct, intended consequences of technologies as well as their indirect, unintended consequences.” Its main purpose is to provide input to decision making in policy and practice. The most well-known applications have been in the field of pharmaceuticals focusing on cost-effectiveness, but it has a wider application both in terms of type of technology or (policy) intervention and in terms of effects and/or impacts, e.g. organisational aspects and ethical issues. Since the 1990s, many governments established formal HTA units or agencies associated with the Ministry of Health (MoH) or its equivalent. Since 1993, the European Commission (EC) supported important projects on HTA that resulted in an HTA network (EUnetHTA Collaboration) that conducts project-based activities in the field of HTA. EUnetHTA coordinated the efforts of 29 European countries, including 25 Member States of the European Union (EU), in evaluating health technology in Europe. EUnetHTA’s Secretariat is the executive body acting under the supervision of the Executive Committee and assisting the Executive Committee in implementing the policy decisions. In 2009, the EUnetHTA Collaboration joined forces with other partners in the EU Member States and the European Commission to implement the results of the EUnetHTA project and the Pharmaceutical Forum through a Joint Action 1 on HTA 2010-2012 (EUnetHTA JA). Joint Action 1 is expanding on the tools developed within EUnetHTA 2006-2008; it includes a few pilot projects and capacity building. Joint Action 2, started at the end of 2012, is extending this to implementation and more pilot projects. The aims of European cooperation on HTA are to reduce duplication of research effort, effective use of resources, increase the impact of HTA in decision-making in Member States and the EU, strengthen the relation between HTA and healthcare policy making, and support countries with minimal HTA experience. The focus lies on those aspects of HTA where data seem more easily transferable across Member States; e.g. technology description, safety issues and relative effectiveness.
1.2 Focus of the study
To support the effectiveness and efficiency of the HTA network a more permanent solution for the coordination of its activities should be found. In Article 15 of Directive 2011/24/EU of the European Parliament and of the Council of 9 March 2011 on the application of patients’ rights in cross-border health care, a permanent network on HTA in the EU is foreseen by the end of 2013. In preparation of the action stated in Article 15 of Directive 2011/24/EU of the European Parliament and of the Council of 9 March 2011 on the application of patients’ rights in cross-border health care, the Executive Agency for Health and Consumers (EAHC) commissioned this study, The aim is to conduct an economic and governance analysis on alternative solutions for the set-up of a permanent secretariat for future cooperation in the field of HTA, taking into account possible synergies and costs for the Commission. In this cost-benefit analysis (CBA) emphasis is put on scientific (HTA production, coordination), financially and regulatory (horizontal) synergies and how anticipated synergies are best organised by the type of organisation for hosting such a network.
8
European Cooperation on Health Technology Assessment
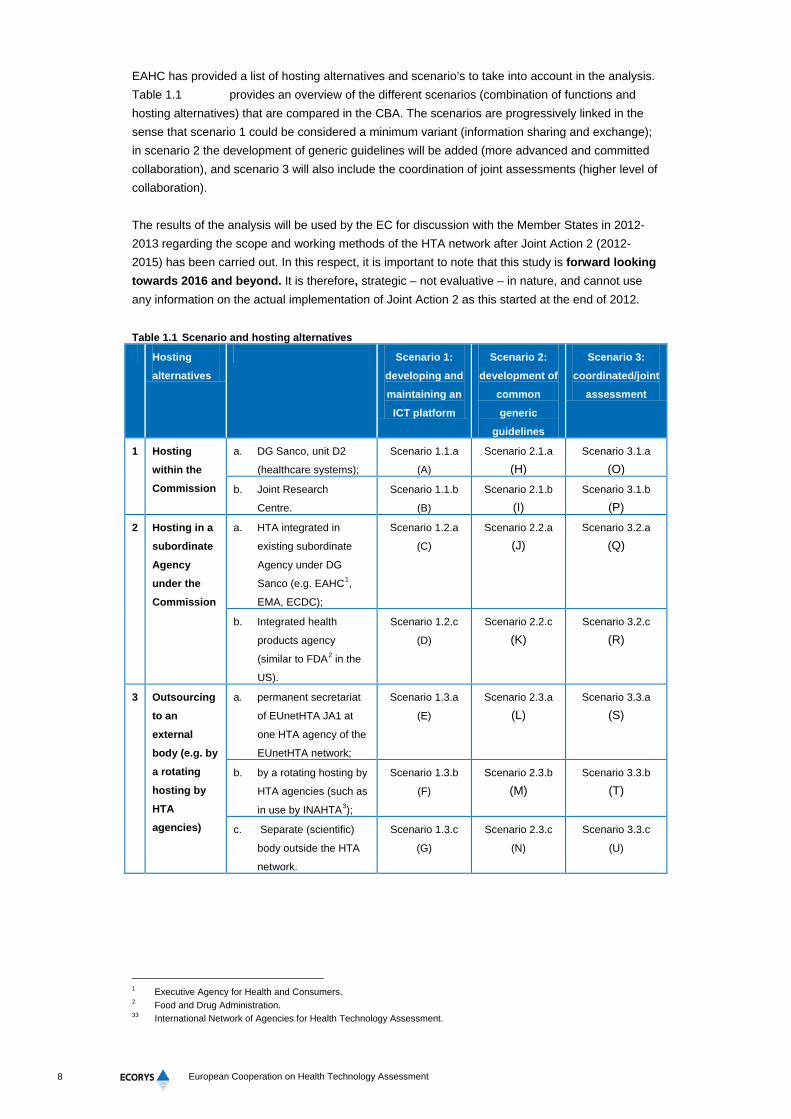
EAHC has provided a list of hosting alternatives and scenario’s to take into account in the analysis. Table 1.1 provides an overview of the different scenarios (combination of functions and hosting alternatives) that are compared in the CBA. The scenarios are progressively linked in the sense that scenario 1 could be considered a minimum variant (information sharing and exchange); in scenario 2 the development of generic guidelines will be added (more advanced and committed collaboration), and scenario 3 will also include the coordination of joint assessments (higher level of collaboration). The results of the analysis will be used by the EC for discussion with the Member States in 2012-2013 regarding the scope and working methods of the HTA network after Joint Action 2 (2012-2015) has been carried out. In this respect, it is important to note that this study is forward looking towards 2016 and beyond. It is therefore, strategic – not evaluative – in nature, and cannot use any information on the actual implementation of Joint Action 2 as this started at the end of 2012. Table 1.1 Scenario and hosting alternatives
Hosting
alternatives
Scenario 1:
developing and
maintaining an
ICT platform
Scenario 2:
development of
common
generic
guidelines
Scenario 3:
coordinated/joint
assessment
1 Hosting
within the
Commission
a. DG Sanco, unit D2
(healthcare systems);
Scenario 1.1.a
(A)
Scenario 2.1.a
(H) Scenario 3.1.a
(O) b. Joint Research
Centre.
Scenario 1.1.b
(B)
Scenario 2.1.b
(I) Scenario 3.1.b
(P) 2 Hosting in a
subordinate
Agency
under the
Commission
a. HTA integrated in
existing subordinate
Agency under DG
Sanco (e.g. EAHC1,
EMA, ECDC);
Scenario 1.2.a
(C)
Scenario 2.2.a
(J) Scenario 3.2.a
(Q)
b. Integrated health
products agency
(similar to FDA2 in the
US).
Scenario 1.2.c
(D)
Scenario 2.2.c
(K) Scenario 3.2.c
(R)
3 Outsourcing
to an
external
body (e.g. by
a rotating
hosting by
HTA
agencies)
a. permanent secretariat
of EUnetHTA JA1 at
one HTA agency of the
EUnetHTA network;
Scenario 1.3.a
(E)
Scenario 2.3.a
(L) Scenario 3.3.a
(S)
b. by a rotating hosting by
HTA agencies (such as
in use by INAHTA3);
Scenario 1.3.b
(F)
Scenario 2.3.b
(M) Scenario 3.3.b
(T)
c. Separate (scientific)
body outside the HTA
network.
Scenario 1.3.c
(G)
Scenario 2.3.c
(N)
Scenario 3.3.c
(U)
1 Executive Agency for Health and Consumers. 2 Food and Drug Administration. 33 International Network of Agencies for Health Technology Assessment.

9
European Cooperation on Health Technology Assessment
1.3 Outline of the report
In the following chapters we: • describe the methodology used (Chapter 2); • provide the governance analysis assessing the pros and cons of the different hosting options
(Chapter 3); • provide the cost benefit analysis of the proposed alternatives for the set-up of a permanent
secretariat for future cooperation in the field of HTA (Chapter 4); and • present our conclusions and further observations based on the governance- and cost benefit
analysis. Several annexes support the report.


11
European Cooperation on Health Technology Assessment
2 Methodology
In this chapter we present our methodology used for the economic and governance analysis on alternative solutions for the set-up of a permanent secretariat for future cooperation in the field of HTA. The input data used for the cost-benefit analysis (CBA) includes an analysis of documents (i.e. literature review), available (budgetary) data and interviews with key stakeholders.
2.1 Literature review
After delivery of the inception report in February 2012, we have collected and analysed relevant documentation (i.e. literature, (conference) presentations, and policy documents) to gain insight in the structure and working processes of the HTA network, specifically of Joint Action 1 and to understand the future working of Joint Action 2. In addition, we collected budgetary information with regard to both Joint Action 1 and 2. The documents were collected through an internet search (key words included EUnetHTA, European and collaboration/cooperation and HTA, joint assessments) and key (financial) documents were provided by the National Board of Health (NBoH) in Denmark, currently hosting the EUnetHTA secretariat. In addition, further information was received from the EC.
2.2 Interviews
We have conducted a series of interviews with key stakeholders from the (international) HTA networks, HTA agencies in Europe, European Commission, and other stakeholders (including representatives of European patient organisation, industry, and health professionals) to collect further data and information as well as opinions on the alternative solutions for the set up of a permanent secretariat for future cooperation in the field of HTA. First, we undertook an orientating interview with the EUnetHTA secretariat to gain insight in the structure and working processes of EUnetHTA and to receive feedback on the potential interviewee list. Second, we asked the EC to provide us suggestions for interviewees from the EC and EU-agencies. We subsequently drew up a complete list of interviewees who we approached by email for an in-depth interview either face-to-face or by telephone. In the period February-May 2012, we conducted 24 interviews of which 8 face-to-face and 16 by telephone, based on the availability and location of the interviewees. This includes two interviews with the EUnetHTA secretariat – one orientating interview and one in-depth interview. In advance of the in-depth interviews we send a topic guide to each interviewee. See Annex 2 for an overview of interviews conducted, and the topic guide used. The interview with the Joint Research Centre has not been completed as the interviewee felt not knowledgeable enough to answer the questions. This means that we base our analysis on responses from 22 in-depth interviews. After the interviews notes we gave interviewees an opportunity to provide feedback on our reflection of the answers and to add any missing or to provide additional information. Most interviewees provided feedback. Several interviewees have been contacted again at a later stage – either by phone or by email to ask for additional information or to verify certain details, especially with regard to data to be used for the CBA.
12
European Cooperation on Health Technology Assessment
2.3 Cost benefit analysis
We started the CBA with gaining an in-depth understanding of the baseline situation, i.e. the current situation of the EUnetHTA secretariat and the HTA network and how each scenario and hosting alternative differs from the baseline. For example, what activities are included/excluded in each scenario, what changes are foreseen in the organisation and what effects (in terms of for example synergy) are to be expected? For this part, we took into account the effects on costs and benefits for the Commission, and costs for producers and end users of HTA information. This initial analysis led to an elaborate list of assumptions with regard to each scenario and each hosting alternative. We subsequently focused on the quantification of the identified effects (costs and benefits). This is based as much as possible on quantitative information (i.e. data). Expert judgements on the benefits and costs have been used when the data were not available. For the quantification of future coordination costs of the EUnetHTA secretariat we specifically focused on the budget information available for Joint Action 2 as opposed to the coordination costs under Joint Action 1. For the benefits we focused on calculating the difference in costs between the present situation (for example individual assessments) as opposed to the future situation (for example joint assessments). The CBA is explained in more detail in chapter 4.
2.4 Limitations of the study
The study is based upon literature review and interviews. Whereas the approach is sound and comprehensive for conducting a CBA, certain limitations have been identified.
2.4.1 Scope of the study The scope of the study is very strategic in nature. Several interview respondents had difficulty to imagine what should or could happen after 2016 without Joint Action 2, which addresses a more elaborated cooperation, but which is not yet started. This definitely has influenced the answers of some respondents who tend to stay close to the current situation. In addition, the respondents are almost all closely involved in the production or regulation of HTA and cooperate already within the framework of EUnetHTA. Therefore the views and perceptions collected and presented are largely reflecting the positions of existing stakeholders in Europe.
2.4.2 Assumptions The framing of the alternative solutions, both with regard to the scenarios and hosting options, has been complex and sometimes arbitrary because many different assumptions needed to be made with regard to what activities are to be included/excluded, what changes are to be foreseen in the organisation and what effects (in terms of for example synergy) are to be expected, in comparison to the current (baseline) situation. It is thus important to bear in mind that this analysis is based on a long list of assumptions when interpreting the results of the CBA.
2.4.3 Quantification of costs and benefits We have used as much as possible available data inputs to quantify the costs and benefits, but this has not always been possible. In these cases, we relied on expert judgements. This invariably leads to uncertainty whether some of the costs and benefits have been quantified correctly. It is important to bear this in mind when interpreting the results of the CBA.

13
European Cooperation on Health Technology Assessment
3 Governance analysis
In this chapter we present the results of the strategic and forward-looking governance analysis with regard to how the EUnetHTA network and secretariat can optimally be organised. Our analysis is based on the literature review and interviews. Due to the fact that this analysis is looking towards the future (beyond 2016), the analysis excludes a detailed review of Joint Action 1. Only where appropriate, important lessons of Joint Action 1 are taken into account. The chapter starts with an identification of the benefits, bottlenecks and future opportunities associated with HTA cooperation in Europe, irrespective of the future organisation of the EUnetHTA network. The subsequent two sections offer an analysis of the organisational alternatives; the identified scenarios and hosting options.
3.1 HTA cooperation in Europe
3.1.1 Main benefits of HTA cooperation in Europe HTA provides decision-makers across the EU important information to make decisions with regard to the introduction, coverage, and use or disinvestment of health technologies. Often, decision-makers are faced with similar information needs that are fulfilled by multiple HTA agencies. This leads to considerable duplication of efforts. As a result, collaboration among the HTA agencies has been set up through EUnetHTA with the aims to reduce the duplication of research effort, to stimulate effective use of resources, to increase the impact of HTA in decision-making in Member States and the EU, to strengthen the relation between HTA and healthcare policy making, and to support countries with minimal HTA experience. From our interviews it becomes clear that interviewees essentially agree with the identified aims above although many use slightly different phrasings regarding what the main benefits of HTA cooperation in Europe are, irrespective of the shape of the secretariat and the exact arrangement of cooperation (see table below). The results show that 32% (n=14) of the interviewees believed that HTA cooperation in Europe leads to increased knowledge and information sharing (e.g. by using one EU HTA portal, increased access to common resources such as HTA reports, increased transparency, and the possibility to gain (more informal) cross-border information on HTA (e.g. reimbursement decisions of other countries)). Also, reduction of duplication of research efforts (14%, n=6) is observed as a benefit. Only one interviewee mentioned that joint assessments can lead to huge cost savings. Another benefit of HTA collaboration is the overall improvement in HTA (14%, n=6) as reflected in improvements in methodology and the quality of data, more acceptance of data that comes from multiple sources and is obtained through different analytical techniques; and the acknowledgement that industry wishes to cooperate in generating scientific information, independent from stakeholder´s interest. Increase of the impact of HTA in decision-making in Member States and the EU is equally observed (14%, n=6). Collaboration creates opportunities to put HTA on national agenda’s and to gain more formal recognition of the importance of HTA in countries where HTA currently receives less attention. It is also mentioned that an increased and enforced role of HTA in healthcare decision-making will ensure better-informed decision-making. Effective use of resources (9%, n=4) is observed but considered less significant. The support of countries with minimal HTA experience (11%, n=5) is especially mentioned as a benefit, but interviewees rather call it capacity building, having access to a pool of experts from across the EU, and exchange of staff for training and learning purposes. Stakeholders from outside the EU community mention the stimulation of innovation (7%, n=3) as a benefit. HTA cooperation enables technology push (especially in

14
European Cooperation on Health Technology Assessment
pharmaceuticals) and collaboration in the field of technologies that are targeted to small populations (low prevalence) by pooling together limited data. Table 3.1 Overview of mentioned benefits of HTA cooperation in Europe
Mentioned benefits of HTA cooperation in Europe* N % of mentioned
benefits
% of interviews
(n=22)
Knowledge and information sharing 14 32% 64%
Reduction duplication of research effort 6 14% 27%
Improvement in HTA 6 14% 27%
Increase in impact of HTA in decision-making in Member
States and the EU
6 14% 27%
Support countries with minimal HTA experience 5 11% 23%
Effective use of resources 4 9% 18%
Stimulation of innovation 3 7% 14%
Total 44 100% Source: Analysis of interview notes. *Interviewees could provide more than one answer.
3.1.2 Main bottlenecks of HTA cooperation in Europe Although increased collaboration can be observed as a result of Joint Action 1, more can be done to take full advantage of the added value of collaboration. Main bottlenecks that have been identified are the lack of formal coordination, the complexity surrounding the major differences in decision-making structures and technical requirements, and the level of implementation of HTA in individual EU Member States. Therefore, the structure of EUnetHTA Joint Action 1 is currently being refined to overcome bottlenecks for cooperation during Joint Action 2. Organisational bottlenecks The internal evaluation of the EUnetHTA Collaboration (2006-2008) already indicated that the large number of participating organisations complicates collaboration within the network. This puts considerable pressure on the EUnetHTA secretariat to spur efficient cooperation between partners collaborating within a specific work package but also across work packages. The secretariat invests a lot of time in overcoming issues related to communication and operational collaboration, implying that they have less time available for other, more strategic issues. Another organisational issue that has been mentioned in the internal evaluation is the limited amount of project resources available to conduct all the necessary work. For example, the development of HTA tools took much more staff time and needed more financial support than originally planned. This meant that several lead partners used own funds to meet the demands and objectives of the project. Interviewees of national HTA agencies identified the bottlenecks mentioned above. However, they are even more concerned about the lack of structure and the absence of a vision with regard to where the network is exactly moving. They also mentioned that the secretariat is sometimes too focused on its own priorities and does not always seem to be working on behalf of the whole network. Interviewees from the HTA network, particularly from the New Member States, agree with the second point and are concerned about the limited amount of funding and resources (staff) available. Interviewees from other stakeholder groups have the opinion that stakeholder involvement should be improved through better functioning of the stakeholder forum. Another issue is that the stakeholders perceive that the scientific origin and focus of the network restricts the use for

15
European Cooperation on Health Technology Assessment
stakeholder input limiting the use of results for policymaking. In addition, they perceive a lack of internal and external (towards the stakeholders) communication. Other issues that are mentioned as bottlenecks include the burden of travelling, language differences, the inability to transfer or share the results of economic analyses and the problem of transparency: that intellectual property rights established between national HTA agencies and producers are not open to everyone, limiting the access to important HTA information. Differences in HTA conduct, context and working methods A large number of interviewees confirm that differences in HTA conduct and methodologies obstruct the further development of HTA cooperation in Europe. These differences stand in the way of aligning views and perspectives with regard to future HTA cooperation and also lead to differences in expectations with regard to the shape and content of such collaboration. For example, common generic guidelines are not easily developed because of differences in HTA working procedures across Europe. These are not simple matters to deal with and seem to cause frustration, as it is perceived to lead to a lack of transparency and coherence. Especially interviewees from other (i.e. non-HTA agency) stakeholder groups find this an important issue. Examples that are provided include the differences of the use (or non-use) of HTA in decision-making and the fact that in some countries HTA “producers” are also responsible for policy making while in other countries these functions are separated. Inequalities in market access between the pharmaceutical and medical devices industry and the lack of knowledge and expertise to assess medical devices have also been raised as bottlenecks. In addition, certain ‘smaller’ HTA agencies (in terms of budget and staff) observe that other HTA agencies, especially the larger ones (e.g. in the UK), prefer their own working procedures and are less willing to change their existing practices to move towards common work processes. One of the larger agencies acknowledged that due to their size and visibility they have a big influence on tool development, sometimes at the expense of work done by smaller HTA agencies.
3.1.3 Future opportunities and necessary changes to improve cooperation in HTA in Europe From the interviews, we identified the following opportunities and necessary changes. Focus on continuation of HTA cooperation in Europe and suggested tools Many interviewees, particularly those from HTA agencies of New Member States, expressed clearly that HTA cooperation should be continued and strengthened. They emphasised the need for more and stable funding4. These views clearly show that there is a desire among the HTA agencies from New Member States to use the EUnetHTA network to professionalize and embed HTA more firmly both nationally and at EU level. This view is also expressed by a representative from a stakeholder group and by a large HTA agency. More specifically it was stated that more focus should be put on information exchange so that Member States can learn from each other and that all partners are treated equally keeping in mind the different development stages of HTA agencies. Tools for cooperation Several interviewees mentioned different tools for increased cooperation in the future. One interviewee of an HTA agency located in a New Member State mentioned the organisation of regular training courses for HTA specialists across Europe and the set up of a high-level group of
4 Covering among other HTA report translation costs.

16
European Cooperation on Health Technology Assessment
supervision with regards to HTA policy development. This comment is clearly focusing on increasing capacity building in the New Member States. Other interviewees both from HTA agencies and from stakeholder groups across Europe suggest a move towards more standardisation of HTA methodologies, harmonization of scientific data5 requirements, the development of common quality assurance procedures, the sharing of HTA reports (clearing house function), improved ability to leverage data available in the different Member States, more focus on joint modelling, and more generally, best practice sharing and more peer review. Another issue mentioned by a stakeholder concerns the acknowledgement that medical devices and pharmaceuticals require a different assessment approach using different considerations and methodologies. Complications surrounding the scaling up of HTA cooperation in Europe Almost all interviewed HTA agency representatives except those from the New Member States, and one stakeholder interviewee asked for prudency with regard to scaling up HTA cooperation in Europe. The general message that can be distilled from the various answers is that collaboration is complicated by differences that exist in the national health care systems, contextual settings, and level of HTA development across the EU Member States. As a result, several interviewees think that full collaboration and harmonisation should not be expected in the near future because the outputs are currently not fit for purpose for use in each national system. Instead they mentioned that cooperation should primarily facilitate existing national HTA processes by promotion of using each other´s work as ´building blocks´ that can be adjusted or fitted into the national settings. In this respect, one interviewee also mentioned that centres of excellence are interesting to pursue, but he questioned whether this is feasible in the current context due to the different political HTA settings across Europe. Another view, stated by an established HTA agency, was that the activities of EUnetHTA are not included in the work processes of the agency and are sometimes seen as a threat to national activities. Organisational issues All interviewees expressed their wish that the network is governed well with a structured and stable secretariat. According to some of the established agencies more speed could be brought into the development of the network and in the tools produced. Two interviewees raised the option of splitting the functions of the secretariat throughout the network (as appropriate) or organising a rotating schedule (of approximately 7 years) for R&D. In addition, one interviewee noted that the network demands a new business model, one with alternative income streams, for example through the use of fees to pay for certain products coming out of the network (for example a joint assessment). Stakeholder involvement Only one of the interviewed HTA agency representatives commented on stakeholder involvement and proposed to include universities in the network. Interviewees from other stakeholder groups have a much more pronounced view on stakeholder involvement. They mentioned that stakeholders can and should be more involved, in particular patients, citizens and health professionals. Also, better cooperation with the industry is mentioned to increase access to data that will improve cost effectiveness analysis and budget impact analysis. These interviewees asked for a change in approach; i.e. they have the perception that the stakeholder involvement is an ‘obligatory' exercise whereas they would prefer to be consulted as a pool of experts when appropriate with regard to both strategic and organisational issues.
5 The example of the use of information from 7 HTAs on PSA testing by the Norwegian HTA agency is provided (as they
encountered the same questions). This led to less duplication of work and increased efficiency.

17
European Cooperation on Health Technology Assessment
3.2 Scenario’s
The scenario's introduced in Chapter 1 (and described in the Inception Report of February 2012) are tested in the interviews. The scenarios have a different and increasing degree of collaboration. The first scenario can be considered a 'minimum' scenario close to what is envisaged to be achieved upon completion of Joint Action 2. The third scenario is the most advanced in terms of collaboration. In terms of efforts the third scenario is expected to lead to the highest coordination costs but also to the highest potential benefits, if correctly carried out. For example a benefit accrued to joint assessments (both rapid and full assessments) is that work sharing leads to a reduction in duplication of individual efforts. It may also lead to increased capacity to undertake assessments. This would provides HTA with a potentially bigger scope and impact in decision-making in Member States and across the EU, which in turn could lead to more adequate, timely available and more cost-effective use of health technology. Better quality of health technology products will help save lives and reduce morbidity. The fact that health technology will become available to all Europeans at the same time may raise equity. This clearly shows the potential benefits for collaboration in such a scenario. However, increased collaboration is not something to achieve overnight and requires significant coordination costs and collaboration efforts. It becomes clear from the results of our interviews, that interviewees are aware of this and have doubts on whether more intense collaboration is currently a realistic scenario to pursue. The table below provides an overview of the preferences of the interviewed parties regarding each scenario and how they perceive the efficiency and feasibility of each scenario. In the sections below we explain the reasoning behind each preference in more detail. Table 3.2 Overview of opinions with regard to the scenarios
Preferred scenario Most cost efficient /
feasible scenario
Scenario 1 Developing and maintaining an ICT platform 3 8
Scenario 2 Development of common generic guidelines 7 6
Scenario 3 Coordinated/joint assessment 8 2
No preference stated 4 6
Total 22 22 Source: Interpretation of interview notes.
3.2.1 Scenario 1: Developing and maintaining an ICT platform Scenario 1 is not a preferred option by the majority of interviewees. It is instead seen as the minimum level to be achieved in HTA cooperation in Europe and the “better than nothing” option. Of the interviewed HTA network representatives, only one representative from a New Member State (i.e. Hungary) prefers this scenario to the other scenarios. This interviewee reasons that guidelines are in most cases already available and that national HTA agencies will keep their own structure and strategy for assessment, basically ruling out scenario options 2 and 3. Two out of the four interviewed stakeholder representatives are in favour of this scenario as they view this the most realistic scenario to implement. They noted that in this scenario the secretariat can serve as one single information point by which duplication of work can be avoided. A large number of interviewees (n=8) noted that scenario 1 is the most efficient and also the most likely scenario in terms of feasibility. An important remark here is that interviewees generally seemed to have answered this question assessing their own costs when a scenario is pursued
18
European Cooperation on Health Technology Assessment
instead of taking into account overall cost efficiency, thus ignoring the overall benefits that can be achieved, but may not accrue to them.
3.2.2 Scenario 2: Development of common generic guidelines Scenario 2 is a preferred option by a large number of the interviewees (n=7). They view scenario 1 as the minimum on which scenario 2 can be built to form a real added value. A large benefit attributed to scenario 2 is that due to its set up it can speed up the development of less advanced HTA agencies. But as two interviewees observed: it can only add value when the guidelines are not obligatory. Instead the guidelines should be used as best practice and set-up as a 'supermarket ' from which HTA bodies can pick and choose, since the guidelines are not likely to fit every national system. A large number of interviewees (n=6) noted that the combination of scenario 1 and 2 is the most cost efficient option. However, as one interviewed stakeholder representative phrased it: “If scenario 3 would be fully implemented, leading to less duplication of work, it would be a real cost saver.” More interviewees seem to share this opinion but doubt whether scenario 3 can be correctly and fully implemented and therefore whether this scenario is cost efficient.
3.2.3 Scenario 3: Coordinated/joint assessment The majority of the interviewees (n=8) prefer scenario 3 but doubt whether it is a realistic scenario to pursue. They have the opinion that scenario 2 currently will reap the most benefits. However, in the long term the ambition of a large number of interviewees is clearly focused on reaching scenario 3. To quote two interviewees: “It is the best way to cooperate at EU level.” Interviewees expected several difficulties to arise before this ambition can be fulfilled. Problems that have been identified concern transparency and confidentiality as well as a lack of experience of staff to deal with the specific demands needed to implement this scenario. It is further expected that not all HTA agencies in Europe will support nor should be pushed to support this scenario due to its complexity and political nature. Some HTA agencies will choose to focus on drug assessment, others on medical devices, and yet others might only be involved in the development of guidelines (part of scenario 2). It is seen as up to each EU Member State how they wish or wish not to be involved. Generally, interviewees are of the opinion that joint assessments should support national decision making, not replace it. Emphasis in the collaboration should be put on reaping the benefits of interactive cooperation through the use of common procedures and standards, using each other’s work as building blocks for undertaking national assessments that fit the unique country specific context. Scenario 3 is clearly not considered cost efficient by the interviewed representatives. Only two interviewees are of the opinion that scenario 3 will eventually form the most cost efficient option once the hurdles of time and resource investments have been taken. It is further noted that not all HTA agencies, in particular the smaller ones, will be able to finance the activities linked to this scenario.
3.2.4 General remarks Interviewees further offered several useful remarks that should be kept in mind when choosing to work towards any of the three scenarios: • More emphasis is needed on improving the quality of the HTA reports;

19
European Cooperation on Health Technology Assessment
• The host of the secretariat needs to have a good balance between HTA expertise and professional organisational expertise to manage the daily administrative issues;
• Attention should be put more firmly on appropriate governance of the network. Therefore, the host of the secretariat needs to work more closely and with increased professionalism with the executive committee;
• The HTA network should not merely be seen as an infrastructure to be managed by the host. Instead, more emphasis should be put on directing the HTA network (motivating and activating) and carrying out public relations to advertise the network appropriately;
• Efficiency would increase if all stakeholders would have access to a common database of assessments that have been carried out (e.g. 500 studies with evidence tables).
3.3 Hosting alternatives
Also, each hosting alternative bears pro’s and con’s, particularly in relation to what synergy effects can be realised (or lost). The first option, hosting within the Commission, can lead to a synergy effect between the secretariat and EU policy activities, but this option runs the danger of a loss of current synergies with HTA agency activities and the link to HTA knowledge. The second option, hosting through a subordinate Agency under the Commission, entails the same loss of a synergy effect with HTA agency activities, but can lead to a synergy effect when the hosting is carried out through an Integrated Health Products Agency. The problem in this particular case is that combining the regulatory task of such an Agency with HTA activities can lead to a situation of conflict of interest. The third hosting option leads to different implications. Current synergies with national HTA agency activities will be maintained if the hosting is carried out through the HTA network, but it will also continue as a status quo without creating additional synergies or solving identified bottlenecks linked to this hosting option (see also section 3.1.2). Organising the hosting externally outside the Commission and the HTA network cuts the secretariat loose from both the HTA network and the EC which would not lead to any related synergy effect, but it can lead to a positive effect at organisational level on the precondition that the external body has expertise in managing networks at EU level. From our interviews it becomes clear that interviewees had difficulties stating their views with regard to the hosting options, particularly with regard to cost efficiency. The table below shows that more than 60% of the interviewees could not provide an opinion on the cost efficiency question (n=13). The interviewees that provided an answer, indicated roughly the same list of pro’s and con’s for the different hosting options skewing their preference clearly to option 3, outsourcing to an external body, but within the HTA network (n=11, 52%) – see table below.

20
European Cooperation on Health Technology Assessment
Table 3.3 Overview of opinions with regard to the scenarios
Preferred
hosting option
Most cost
efficient
hosting option
Hosting within the
Commission
DG Sanco, in combination with Joint Research
Centre
1 1
Sub-total 1 1
Hosting in a
subordinate agency
under the
Commission
HTA integrated in existing subordinate agency
under DG Sanco
1 0
Integrated health products agency (similar to
FDA in the USA)
2 2
Sub-total 3 2
Outsourcing to an
external body
Permanent secretariat at one HTA agency 4 4
Rotating hosting by HTA agencies 4 0
Permanent or rotating 1 2
Separate independent body outside the HTA
network
2 0
Sub-total 11 6
No opinion Sub-total 7 13
Total 22 22 Source: Interpretation of interview notes.
3.3.1 Hosting within the EU Commission The interviewed stakeholder representatives do not see hosting within the Commission as a desirable option. Only one interviewee prefers this option with the argumentation that it will provide a necessary legal framework to organise appropriate stakeholder involvement. He also mentioned that if such a hosting option is carried out, especially with regard to scenario 3, this should be done in close cooperation with the Joint Research Centre (JRC). A large part of the interviewees are concerned that hosting within the Commission will lead to more bureaucracy, making the network more ‘official’ and thus ‘expensive’. Because of this only one interviewee viewed this hosting option as most cost efficient. Another concern is that this hosting option will lead to a loss of ownership over the HTA process of national (regional) HTA agencies and that this will skew the balance between EU and national (regional) priorities. Additionally, it is observed that this hosting option may lead to a loss of synergy with current activities and expertise of HTA agencies.
3.3.2 Hosting within a subordinate Agency under the EU Commission Hosting within an Agency of the European Union under the Commission is also not seen as a desirable or cost efficient hosting option. Only three interviewees preferred this option and two identified it as most cost efficient. Only one interviewee from a HTA Agency of a New Member State believed that hosting in a subordinate agency under DG Sanco is a desirable option. He noted that hosting in an existing agency may not be the best option, but that instead a newly subordinate agency should possibly be set up to ensure that sufficient attention is given to HTA.
21
European Cooperation on Health Technology Assessment
Two other interviewees from two HTA agencies across Europe preferred the hosting option by an integrated health products agency (similar to FDA in the US), especially when scenario 3 would be carried out. This hosting option is seen as a ‘clean way’ to pull the knowledge together of the separate EU HTA agencies, but the question was raised whether it is feasible in the short run. Another interviewee mentioned that if this hosting option is chosen, it should not be limited to devices and drugs, but also include procedures (targets of assessment). A large part of the interviewees are concerned that this hosting option will affect the objectivity of information provided as HTA becomes interlinked with the regulatory tasks of such an Agency. This may lead to a conflict of interest and considerable (public) confusion. For this reason, particularly the hosting option within EMA is considered detrimental. Another argument made is the perceived surge in bureaucracy, together with the possible loss of synergy with existing activities and expertise of HTA agencies. An additional pitfall that has been observed is the danger for a lack of transparency with regard to the governance of the secretariat. This is a general remark that is often mentioned with regard to all the options involving the organisation of subordinate Agencies under the Commission.
3.3.3 Hosting through outsourcing to an external body The majority of the interviewees (n=11, 52%) preferred the option of hosting through outsourcing to an external body of which the majority (n=9, 41%) preferred outsourcing within the HTA network. Outsourcing within the HTA network is also considered the most cost efficient (n=6, 29%) as it concerns a collaborative network that should and can only be most efficiently run by the network itself. It is seen as a benefit that hosting within the HTA network will maintain the synergy effect with current HTA activities and expertise. However, it is observed that the hosting should be organised independent from the HTA agency activities and especially from the national (regional) agenda, seemingly an argument counteracting the synergy effect. In addition, this option is considered most trustworthy for the users, the HTA community, as the secretariat remains within their realm. No clear preference can be observed for hosting through a permanent secretariat or a rotating secretariat within the HTA network. The rotating secretariat is seen as the most equitable, but the least (cost) efficient. Despite the fact that a periodic rotation between 5 to 7 years is seen as ideal, it will still involve considerable efficiency losses during shifts in rotation. In addition, more efficiency losses can occur in case the rotating schedule involves HTA agencies lacking the capacity to run an effective and credible secretariat. For this reason, clear criteria should be identified distinguishing what makes a HTA agency capable for hosting. Only two interviewees preferred the option of hosting by a scientific body outside the HTA network. This option ascertains that the secretariat is managed independent from any national (regional) agenda that may influence the activities of a hosting HTA agency. In addition, it assures that the hosting agency has the needed coordination expertise in-house to run an EU network (obtainable through, for example, an open tender procedure).

22
European Cooperation on Health Technology Assessment
3.4 Conclusion
HTA provides decision-makers across the EU important information to make decisions with regard to the introduction, coverage, and use or disinvestment of health technologies. Often, decision-makers are faced with similar information needs that are fulfilled by multiple HTA agencies. This leads to considerable duplication of efforts. As a result, collaboration among HTA agencies has been set up. This collaboration is seen to be beneficial as it stimulates knowledge and information sharing, reduces duplication of efforts (especially research-related), and leads to an improvement in HTA with respect to methodology and data input. Another benefit is that an increased and enforced role of HTA in healthcare decision-making will further support better-informed decision-making. However, it is clear from our analysis that more can be done to reap the full benefits of collaboration. Main bottlenecks are the organisational complexity of working with many partners in one network. Also, major differences in decision-making structures, data requirements and the level of conduct and implementation of HTA in individual EU Member States seem to obstruct intensifying the current collaboration. Although the will for increased collaboration clearly exists, efficiency gains can be made. Out of the three scenario’s, the third scenario including joint assessments evidently goes the furthest in terms of collaboration. This leads to high potential benefits, as it has the highest possibility to reach an effective impact in decision-making in Member States and the EU with the greatest potential to support the adequate, timely available and more cost-effective use of health technology within the EU. It is, however, highly questionable whether this scenario can be rolled out successfully under the present conditions. It is therefore considered more realistic and cost efficient to pursue scenario 2 with scenario 1 as a building stone, keeping in mind the ambition to potentially aim for more collaboration in the shape of scenario 3 at a later stage. Despite the fact that each hosting alternative bears pro’s and con’s, it becomes clear that the third hosting option, through outsourcing to an external body and within the HTA network, is considered both the most realistic and preferred option to pursue. It offers trust to those who make use of the network, it keeps the HTA community well connected with the secretariat, it makes use of available HTA expertise within the HTA community, and it is considered the most efficient as a collaborative network is considered to be best managed internally, by the network itself. The two options within the HTA network, a permanent secretariat or a rotating secretariat, have specific advantages and disadvantages. The rotating secretariat seems, however, to be the preferred option but bears significant issues with regard to efficiency. The other two hosting options, within the Commission and through a subordinate Agency under the Commission do bear benefits, but do not convincingly counter-effect the fear for bureaucracy and detachment from the HTA community and HTA expertise. Outsourcing through an external body outside the HTA network can lead to organisational efficiency gains, but would cut the secretariat not only loose from the HTA community but also from the Commission.

23
European Cooperation on Health Technology Assessment
4 Economic analysis
This chapter provides the results of the economic analysis. This analysis is structured as an economic Cost-Benefit Analysis (CBA) and gives an overview of the costs and benefits of different degrees of coordination of HTA activities between countries within the European Union in the foreseeable future. The different degrees of coordination are translated into different scenario's with varying assumptions on the main cost drivers and possible benefits. As described in Chapter 1, the aims of European cooperation on HTA are manifold and include to 1) reduce duplication of research efforts; 2) make effective use of resources; 3) increase the impact of HTA on decision-making in Member States and the EU; 4) strengthen the relation between HTA and healthcare policy making; and 5) support countries with limited HTA experience and capacity. Not all these goals of increased cooperation are easily made operational and quantified. In addition, costs and benefits are spread over different stakeholders to varying degrees. For example, the benefits of cooperation could be quite different for a new, small HTA agency with limited capacity compared to a large established agency conducting many studies per year and that is at the forefront in methodological development. The costs of increased coordination may also have to be shared between the EC and the Member States. At the very least these costs should be outweighed by the benefits of this cooperation. At the same time the industry may benefit as well from a more standardised approach as it would lead to less costs to comply with regulations for market access for medicines or medical devices and to faster availability of medicines. For this analysis certain assumptions are made concerning the type of costs and benefits that are taken into account. The focus in the economic analysis is on the impact on the production of HTA information in Member States of the EU and the costs associated with these activities. In addition the costs for industry have been taken into account. Any reduction in these costs in the three different coordination scenarios against a baseline scenario are considered efficiency gains and taken up as benefits of cooperation. These benefits are monetized by calculating the cost of producing an HTA report from the perspective of both the HTA agencies and the industry. The costs of increased cooperation through the HTA network as an organisation and in terms of increased activities to coordinate the actual production of HTA information are defined as the main cost components in the CBA. Thus the CBA can be understood as a trade off between possible additional costs of coordination of HTA in the EU and the opportunity of increased efficiencies in the EU-wide production of HTA reports.
4.1 Description of the scenarios and components
The CBA distinguishes four different scenarios, which are cumulative as the intensity of the cooperation increases from one scenario to the other in terms of workload, efforts to coordinate and corresponding responsibilities of a secretariat and the network. To calculate the benefits of the three different scenarios on cooperation an additional, zero or baseline scenario was added to the model, which represents the continuation of the current tasks of the HTA network after completion

24
European Cooperation on Health Technology Assessment
of Joint Action 1 in 2012. The highest degree of coordination between Member States is expected when scenario 3 is implemented.6 The scenarios are described in more detail below: • Scenario 1 is the minimum variant and includes
information sharing and exchange through the organisation and maintenance of an ICT platform for interaction, as well as preparations and follow-up for meetings and workshops;
• Additionally, in scenario 2 development and application of generic guidelines for assessing different health technologies will be added (more advanced and committed collaboration that asks for more coordination compared to scenario 1); and
• Scenario 3 will also include the coordination of joint assessments including both rapid assessments and full assessments for producing core HTA information (higher level of collaboration and coordination).
In order to calculate costs and benefits of implementing, the different scenarios are divided using the information on the work packages of Joint Action 2 (see Table 4.1 Relation between components and working packages) as proxies for cost estimations. We distinguish five different components to group different workpackages (WP) that are of similar nature, such as in Component 1 where WP 1,2,3 of Joint Action 2 are consolidated under the heading ' European Coordination Services '. Thus the first scenario foresees in the basic tasks of coordinating the European Services as within EUnetHTA (referring to WP1, 2, 3), and includes the Information Management Infrastructure and Services (IMIS) (referring to WP6). Regarding the development of common generic guidelines working packages 7 and 8 are used in component 3 ‘The HTA core model’. Scenario 3 uses the information on activities included in component 4 (WP4) and component 5 (WP5).
6 Under this Joint Action 8 working packages (WP) were carried out on the following topics:
• WP1: Coordination; • WP2: Dissemination; • WP3: Evaluation, • WP4: Core HTA; • WP5: Relative Effectiveness Assessment of Pharmaceuticals; • WP6: Information technology system; • WP7: New technologies, including planned and on-going project database (POP) and EVIDENT; • WP8: Strategy and business model development.
For a more in-depth description of the work packages we refer to the Inception Report (February 2012).

25
European Cooperation on Health Technology Assessment
Table 4.1 Relation between components and working packages
Scenario Components and working packages
Baseline scenario:
Completion of JA1 Continuing EUnetHTA after completing Joint Action 1
Scenario 1:
Developing and maintaining an ICT
platform
Component 1: European Coordination Services
• WP1: Coordination and sustainable network implementation;
• WP2: Dissemination and capacity building;
• WP3: Evaluation and data collection on costs and efficiency. Component 2: Information Management Infrastructure and Services
• WP6: Information Management Infrastructure and Services (IMIS).
Scenario 2:
Development of common generic
guidelines
Component 3: HTA Core Model
• WP7: Methodology development and evidence generation:
Guidelines and pilots component;
• WP8: Maintenance of HTA Core Model infrastructure to support
shared component and sharing of HTA information. Scenario 3:
Coordinated joint assessments Component 4: Full HTAs
• WP4: Testing collaborative components of HTA information for
national adaptation and reporting. Component 5: Rapid HTAs
• WP5: Applying the HTA Core Model for Rapid Assessment for
national adaptation and reporting.
4.2 Assumptions on coordination of HTA activities
To calculate the costs and benefits of a permanent secretariat for future cooperation in the field of HTA, budget information on Joint Action 1 and 2, information from interviews, and publically available information from websites of the HTA agencies as well as other literature was used. The timeline of the model was set at 10 years, from January 2013 to December 2022, just after the start of Joint Action 2. The calculation on the costs for coordination of the network was divided into two main periods: 1) 2013 – 2015 when Joint Action 2 is being implemented, and 2) 2016 – 2022 after completion of Joint Action 2. A period of analysis spanning more than 10 years would have been possible, but taking into account the rather strategic and abstract nature of the analysis, this extra time period would not add to a deeper understanding and would become rather tentative. For similar reasons the use of discounting has been disregarded in the CBA. Most costs and benefits are recurrent in nature and only very limited capital costs are foreseen. Hence, discounting would change the results of the analysis only marginally and would not add analytically.
4.2.1 Coordination of the network The costs for the coordination of the network in the baseline scenario are based on the 2010 budget of Joint Action1. The costs for the coordination of the network in the three alternative scenarios are based on the budget for coordination activities of JA2 (see Table 4.2). Because this

26
European Cooperation on Health Technology Assessment
budget was set for three years the total budget for these activities was divided by three to calculate the annual cost. The two main cost components of the European Coordination Services were some minor capital cost consisting some pieces of electronic equipment, and for the very largest part recurrent cost. Table 4.2 Annual costs for coordination of the network per component (EUR 1,000, JA2 budget)
Cost based on JA2
budget
Component
1
Component
2
Component
3
Component
4
Component
5
WP 1, 2, 3 WP 6 WP 7 and 8 WP 4 WP 5
Expenditure
Staff Costs * € 799 € 98 € 665 € 310 € 508
National Officials € 202 € 10 € 31 € 42 € 72
Non-National Officials € 597 € 88 € 634 € 267 € 436
Travel-costs € 84 € 3 € 50 € 13 € 30
Subsistence € 63 € 2 € 30 € 5 € 13
Equipment € 1 € 3 € 2 € - € 3
Consumables € 1 € - € 1 € 1 € -
Subcontracting costs € 26 € 31 € 26 € 16 € 10
Other costs € 103 € 16 € 17 € 4 € 4
Total direct costs € 1.077 € 152 € 791 € 349 € 568
7 % overhead € 75 € 11 € 55 € 24 € 40
Total expenditure € 1.152 € 163 € 847 € 373 € 608
The recurrent costs consist of annual staff and travel cost of the HTA agencies, annual staff cost of the secretariat, Commission, industry and stakeholders. The category industry was defined as the three industry members of the stakeholder forum, whereas the category stakeholder was defined as the other 12 members of the stakeholder forum. Assumptions on the workload of the secretariat, industry and stakeholders were based on input from the interviews and presented in Table 4.3. As the responsibilities of the EUnetHTA secretariat and the Commission differ in the scenarios, differentiation in workload between the scenarios was included in the model. Estimates of travel costs of the HTA agencies were based on the information provided in the Joint Action 2 budget. Further details on the coordination costs included for each scenario are included in Tables 2 and 3 of the annexes.
27
European Cooperation on Health Technology Assessment
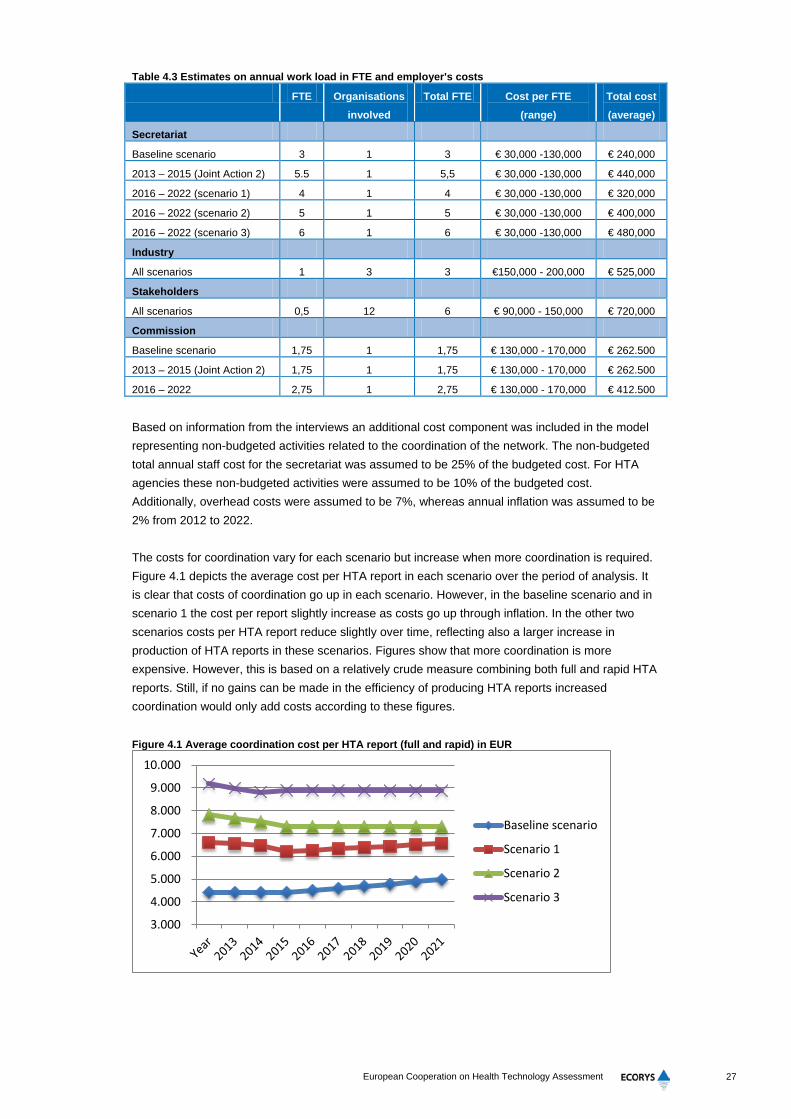
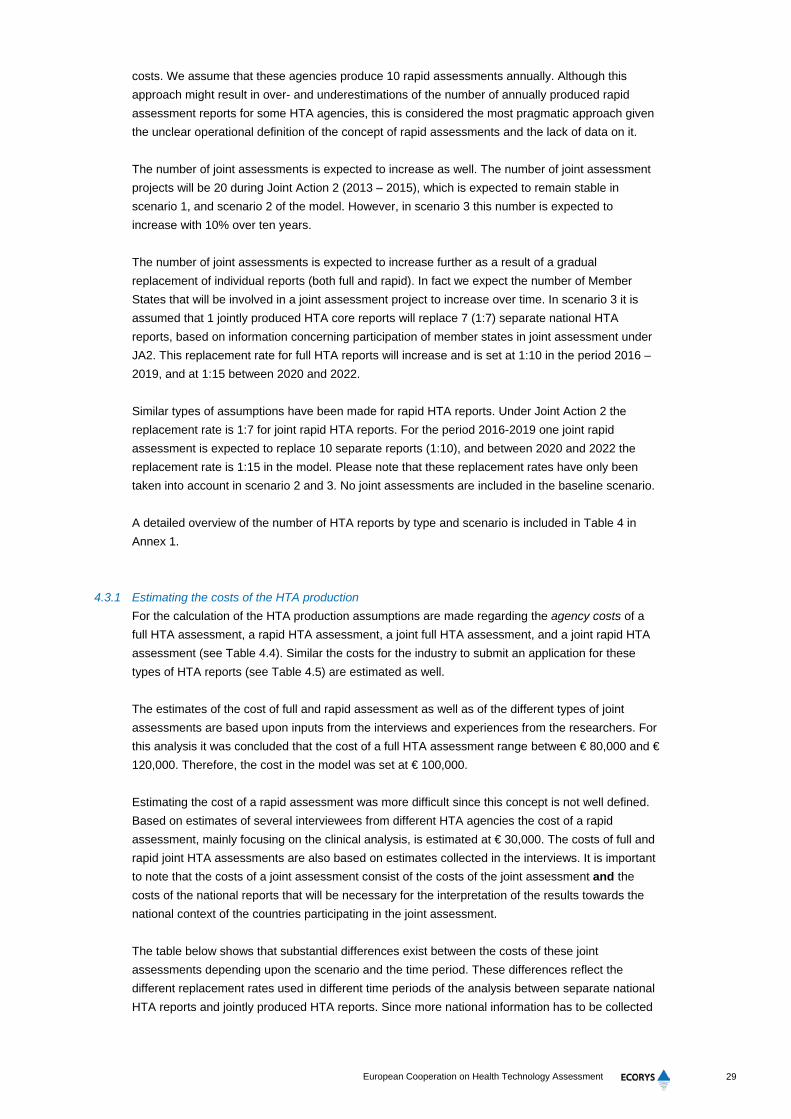
Table 4.3 Estimates on annual work load in FTE and employer's costs
FTE Organisations
involved
Total FTE Cost per FTE
(range)
Total cost
(average)
Secretariat
Baseline scenario 3 1 3 € 30,000 -130,000 € 240,000
2013 – 2015 (Joint Action 2) 5.5 1 5,5 € 30,000 -130,000 € 440,000
2016 – 2022 (scenario 1) 4 1 4 € 30,000 -130,000 € 320,000
2016 – 2022 (scenario 2) 5 1 5 € 30,000 -130,000 € 400,000
2016 – 2022 (scenario 3) 6 1 6 € 30,000 -130,000 € 480,000
Industry
All scenarios 1 3 3 €150,000 - 200,000 € 525,000
Stakeholders
All scenarios 0,5 12 6 € 90,000 - 150,000 € 720,000
Commission
Baseline scenario 1,75 1 1,75 € 130,000 - 170,000 € 262.500
2013 – 2015 (Joint Action 2) 1,75 1 1,75 € 130,000 - 170,000 € 262.500
2016 – 2022 2,75 1 2,75 € 130,000 - 170,000 € 412.500
Based on information from the interviews an additional cost component was included in the model representing non-budgeted activities related to the coordination of the network. The non-budgeted total annual staff cost for the secretariat was assumed to be 25% of the budgeted cost. For HTA agencies these non-budgeted activities were assumed to be 10% of the budgeted cost. Additionally, overhead costs were assumed to be 7%, whereas annual inflation was assumed to be 2% from 2012 to 2022. The costs for coordination vary for each scenario but increase when more coordination is required. Figure 4.1 depicts the average cost per HTA report in each scenario over the period of analysis. It is clear that costs of coordination go up in each scenario. However, in the baseline scenario and in scenario 1 the cost per report slightly increase as costs go up through inflation. In the other two scenarios costs per HTA report reduce slightly over time, reflecting also a larger increase in production of HTA reports in these scenarios. Figures show that more coordination is more expensive. However, this is based on a relatively crude measure combining both full and rapid HTA reports. Still, if no gains can be made in the efficiency of producing HTA reports increased coordination would only add costs according to these figures. Figure 4.1 Average coordination cost per HTA report (full and rapid) in EUR
3.000
4.000
5.000
6.000
7.000
8.000
9.000
10.000
Baseline scenario
Scenario 1
Scenario 2
Scenario 3

28
European Cooperation on Health Technology Assessment
4.3 Estimating HTA production
In order to monetize the benefits through possible efficiency gains a calculation of the volume of production of HTA information as well as an estimation of the associated cost are required. Unfortunately there is no structured information available to monitor the production of HTA reports; although INAHTA collects some of these data but not comprehensively. In our analysis we distinguish different types of HTA reports: • Full HTA assessments carried out by one HTA agency; • Rapid HTA assessments carried out by one HTA agency; • Joint full HTA assessments carried out by several HTA agencies; • Joint rapid HTA assessments carried out by several HTA agencies. Therefore, assumptions and estimates on the capacity of HTA agencies to produce HTA information, as well as the number of annually produced HTA reports had to be made. Based on information from annual reports of the HTA agencies in the Member States and input from the interviews an estimate was made of the number of full HTA reports currently being produced in the EU. It is assumed that 11 of the EUnetHTA members (HTA organisations) are able to annually produce between 5 (KCE) and 36 (NICE) full HTA reports per year. Based on this information the annual total number of full HTA assessments was calculated to be 180 in the baseline scenario. For rapid HTA assessments the total annual number of reports was estimated at 560 in the baseline scenario. Although the calculation on the annual number of full HTA reports is based on relative reliable information sources on actual numbers of produced reports this was not equally possible for rapid assessments. Because the concept of rapid assessments (or rapid reviews) is not well defined it is very difficult to assess from annual reports of HTA-agencies which reports are valid to be classified as rapid assessment reports. As Watt et al. state in their article on the rapid reviews: “while the concept of rapid review has been prominent in the discourse surrounding HTA for some time, the HTA community is yet to reach a consensus regarding their validity and the most appropriate methodology to use in their preparation”.7 Therefore a different approach for the calculation of the number of rapid assessment reports is chosen. First of all the annual number of evaluations of drug applications for marketing authorisation that were carried by the European Medicine Agency (EMA) have been analysed. This would provide an estimate of the 'market demand'. On average a total of about 80 evaluations per annum was calculated. However, these numbers include several types of assessments (e.g. assessment of any modifications or extensions (‘variations’) to an existing marketing authorisation)8 and therefore do not provide a solid basis for further projections. This figure could be considered an upper bound figure at best. A more realistic estimate would probably be more close to a total of about 40 new approvals, of which 30 for medicines and 10 for medical equipment per annum. However, it remains difficult to link this potential demand with the actual capacity to conduct rapid assessments of HTA agencies, which ultimately will determine how many rapid assessments can be carried out. Based on the interviews with the HTA agencies we estimate that middle-sized HTA agencies that are capable of producing full HTA reports on average will produce 20 rapid assessment reports per year. HTA agencies with no experience in producing full HTA reports produce to a large extent reports that would qualify as rapid assessments in terms of scope and
7 Watt et al. – Rapid reviews versus full systematic reviews: An inventory of current methods and practice in health
technology assessment: International Journal of Technology Assessment in Health Care, 24:2 (2008), 133–139. 8 http://www.ema.europa.eu/ema/index.jsp?curl=pages/about_us/general/general_content_000095.jsp&mid=
WC0b01ac0580028c7a.
29
European Cooperation on Health Technology Assessment
costs. We assume that these agencies produce 10 rapid assessments annually. Although this approach might result in over- and underestimations of the number of annually produced rapid assessment reports for some HTA agencies, this is considered the most pragmatic approach given the unclear operational definition of the concept of rapid assessments and the lack of data on it. The number of joint assessments is expected to increase as well. The number of joint assessment projects will be 20 during Joint Action 2 (2013 – 2015), which is expected to remain stable in scenario 1, and scenario 2 of the model. However, in scenario 3 this number is expected to increase with 10% over ten years. The number of joint assessments is expected to increase further as a result of a gradual replacement of individual reports (both full and rapid). In fact we expect the number of Member States that will be involved in a joint assessment project to increase over time. In scenario 3 it is assumed that 1 jointly produced HTA core reports will replace 7 (1:7) separate national HTA reports, based on information concerning participation of member states in joint assessment under JA2. This replacement rate for full HTA reports will increase and is set at 1:10 in the period 2016 – 2019, and at 1:15 between 2020 and 2022. Similar types of assumptions have been made for rapid HTA reports. Under Joint Action 2 the replacement rate is 1:7 for joint rapid HTA reports. For the period 2016-2019 one joint rapid assessment is expected to replace 10 separate reports (1:10), and between 2020 and 2022 the replacement rate is 1:15 in the model. Please note that these replacement rates have only been taken into account in scenario 2 and 3. No joint assessments are included in the baseline scenario. A detailed overview of the number of HTA reports by type and scenario is included in Table 4 in Annex 1.
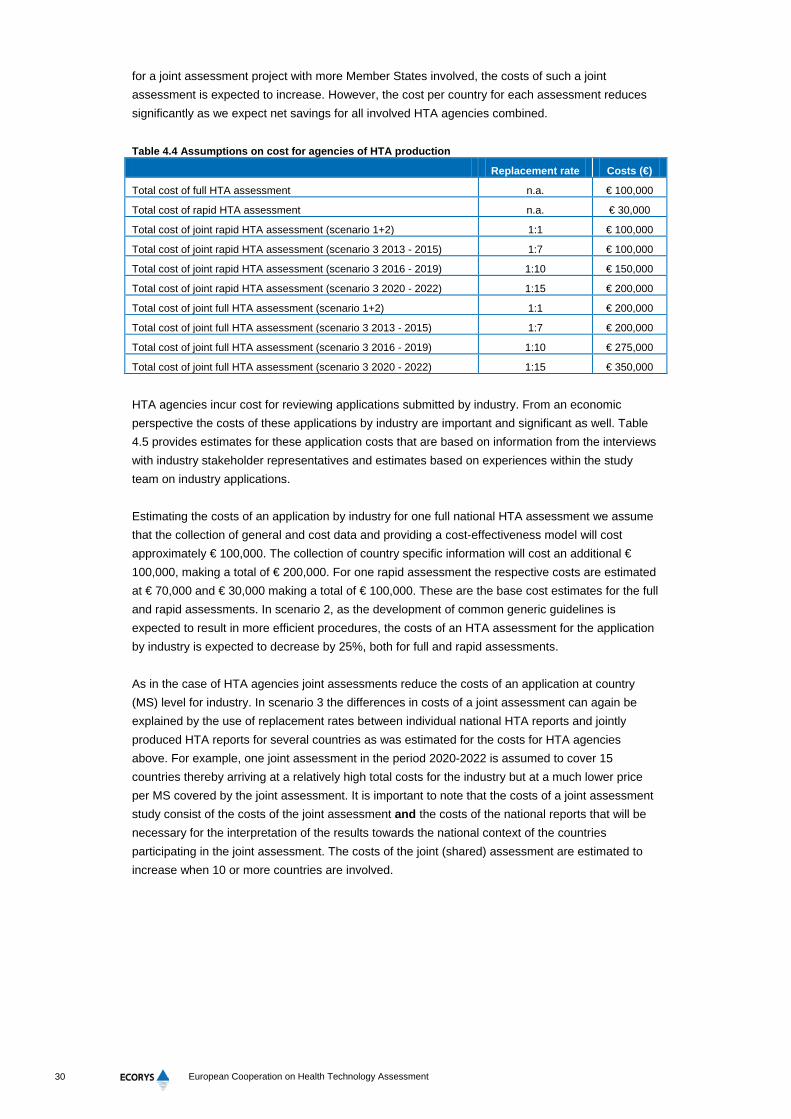
4.3.1 Estimating the costs of the HTA production For the calculation of the HTA production assumptions are made regarding the agency costs of a full HTA assessment, a rapid HTA assessment, a joint full HTA assessment, and a joint rapid HTA assessment (see Table 4.4). Similar the costs for the industry to submit an application for these types of HTA reports (see Table 4.5) are estimated as well. The estimates of the cost of full and rapid assessment as well as of the different types of joint assessments are based upon inputs from the interviews and experiences from the researchers. For this analysis it was concluded that the cost of a full HTA assessment range between € 80,000 and € 120,000. Therefore, the cost in the model was set at € 100,000. Estimating the cost of a rapid assessment was more difficult since this concept is not well defined. Based on estimates of several interviewees from different HTA agencies the cost of a rapid assessment, mainly focusing on the clinical analysis, is estimated at € 30,000. The costs of full and rapid joint HTA assessments are also based on estimates collected in the interviews. It is important to note that the costs of a joint assessment consist of the costs of the joint assessment and the costs of the national reports that will be necessary for the interpretation of the results towards the national context of the countries participating in the joint assessment. The table below shows that substantial differences exist between the costs of these joint assessments depending upon the scenario and the time period. These differences reflect the different replacement rates used in different time periods of the analysis between separate national HTA reports and jointly produced HTA reports. Since more national information has to be collected
30
European Cooperation on Health Technology Assessment
for a joint assessment project with more Member States involved, the costs of such a joint assessment is expected to increase. However, the cost per country for each assessment reduces significantly as we expect net savings for all involved HTA agencies combined. Table 4.4 Assumptions on cost for agencies of HTA production
Replacement rate Costs (€)
Total cost of full HTA assessment n.a. € 100,000
Total cost of rapid HTA assessment n.a. € 30,000
Total cost of joint rapid HTA assessment (scenario 1+2) 1:1 € 100,000
Total cost of joint rapid HTA assessment (scenario 3 2013 - 2015) 1:7 € 100,000
Total cost of joint rapid HTA assessment (scenario 3 2016 - 2019) 1:10 € 150,000
Total cost of joint rapid HTA assessment (scenario 3 2020 - 2022) 1:15 € 200,000
Total cost of joint full HTA assessment (scenario 1+2) 1:1 € 200,000
Total cost of joint full HTA assessment (scenario 3 2013 - 2015) 1:7 € 200,000
Total cost of joint full HTA assessment (scenario 3 2016 - 2019) 1:10 € 275,000
Total cost of joint full HTA assessment (scenario 3 2020 - 2022) 1:15 € 350,000
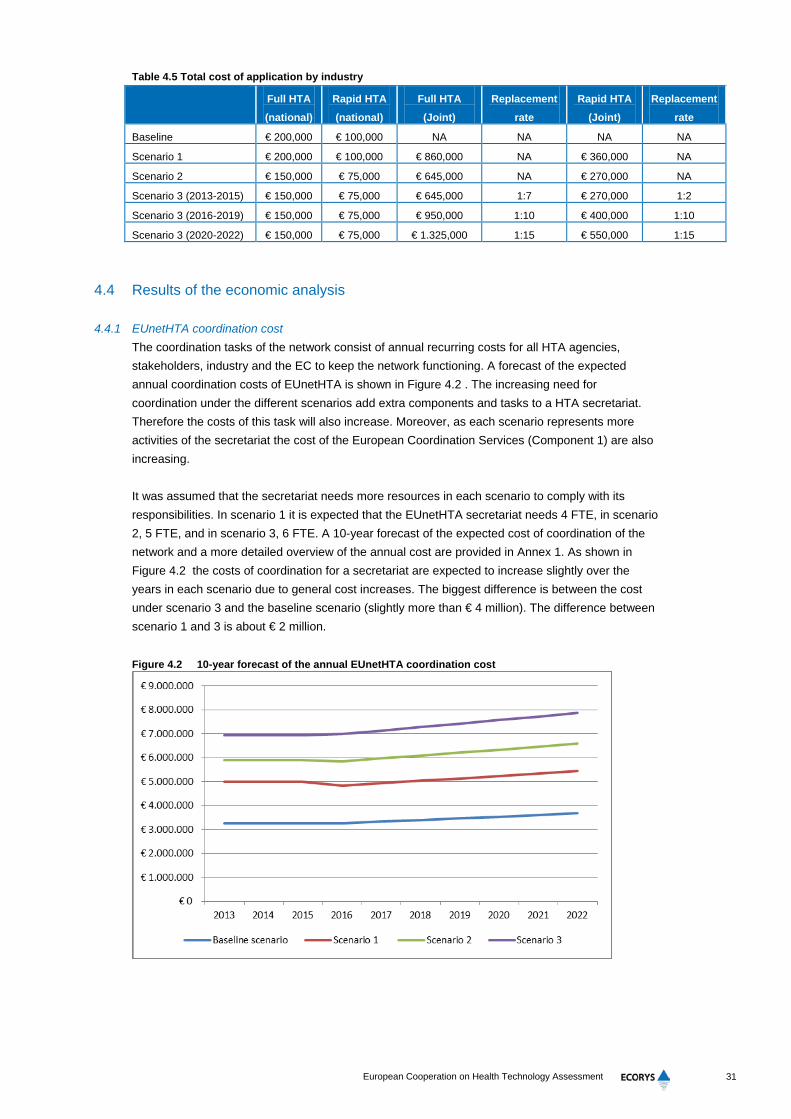
HTA agencies incur cost for reviewing applications submitted by industry. From an economic perspective the costs of these applications by industry are important and significant as well. Table 4.5 provides estimates for these application costs that are based on information from the interviews with industry stakeholder representatives and estimates based on experiences within the study team on industry applications. Estimating the costs of an application by industry for one full national HTA assessment we assume that the collection of general and cost data and providing a cost-effectiveness model will cost approximately € 100,000. The collection of country specific information will cost an additional € 100,000, making a total of € 200,000. For one rapid assessment the respective costs are estimated at € 70,000 and € 30,000 making a total of € 100,000. These are the base cost estimates for the full and rapid assessments. In scenario 2, as the development of common generic guidelines is expected to result in more efficient procedures, the costs of an HTA assessment for the application by industry is expected to decrease by 25%, both for full and rapid assessments. As in the case of HTA agencies joint assessments reduce the costs of an application at country (MS) level for industry. In scenario 3 the differences in costs of a joint assessment can again be explained by the use of replacement rates between individual national HTA reports and jointly produced HTA reports for several countries as was estimated for the costs for HTA agencies above. For example, one joint assessment in the period 2020-2022 is assumed to cover 15 countries thereby arriving at a relatively high total costs for the industry but at a much lower price per MS covered by the joint assessment. It is important to note that the costs of a joint assessment study consist of the costs of the joint assessment and the costs of the national reports that will be necessary for the interpretation of the results towards the national context of the countries participating in the joint assessment. The costs of the joint (shared) assessment are estimated to increase when 10 or more countries are involved.
31
European Cooperation on Health Technology Assessment
Table 4.5 Total cost of application by industry
4.4 Results of the economic analysis
4.4.1 EUnetHTA coordination cost The coordination tasks of the network consist of annual recurring costs for all HTA agencies, stakeholders, industry and the EC to keep the network functioning. A forecast of the expected annual coordination costs of EUnetHTA is shown in Figure 4.2 . The increasing need for coordination under the different scenarios add extra components and tasks to a HTA secretariat. Therefore the costs of this task will also increase. Moreover, as each scenario represents more activities of the secretariat the cost of the European Coordination Services (Component 1) are also increasing. It was assumed that the secretariat needs more resources in each scenario to comply with its responsibilities. In scenario 1 it is expected that the EUnetHTA secretariat needs 4 FTE, in scenario 2, 5 FTE, and in scenario 3, 6 FTE. A 10-year forecast of the expected cost of coordination of the network and a more detailed overview of the annual cost are provided in Annex 1. As shown in Figure 4.2 the costs of coordination for a secretariat are expected to increase slightly over the years in each scenario due to general cost increases. The biggest difference is between the cost under scenario 3 and the baseline scenario (slightly more than € 4 million). The difference between scenario 1 and 3 is about € 2 million. Figure 4.2 10-year forecast of the annual EUnetHTA coordination cost
Full HTA
(national)
Rapid HTA
(national)
Full HTA
(Joint)
Replacement
rate
Rapid HTA
(Joint)
Replacement
rate
Baseline € 200,000 € 100,000 NA NA NA NA
Scenario 1 € 200,000 € 100,000 € 860,000 NA € 360,000 NA
Scenario 2 € 150,000 € 75,000 € 645,000 NA € 270,000 NA
Scenario 3 (2013-2015) € 150,000 € 75,000 € 645,000 1:7 € 270,000 1:2
Scenario 3 (2016-2019) € 150,000 € 75,000 € 950,000 1:10 € 400,000 1:10
Scenario 3 (2020-2022) € 150,000 € 75,000 € 1.325,000 1:15 € 550,000 1:15
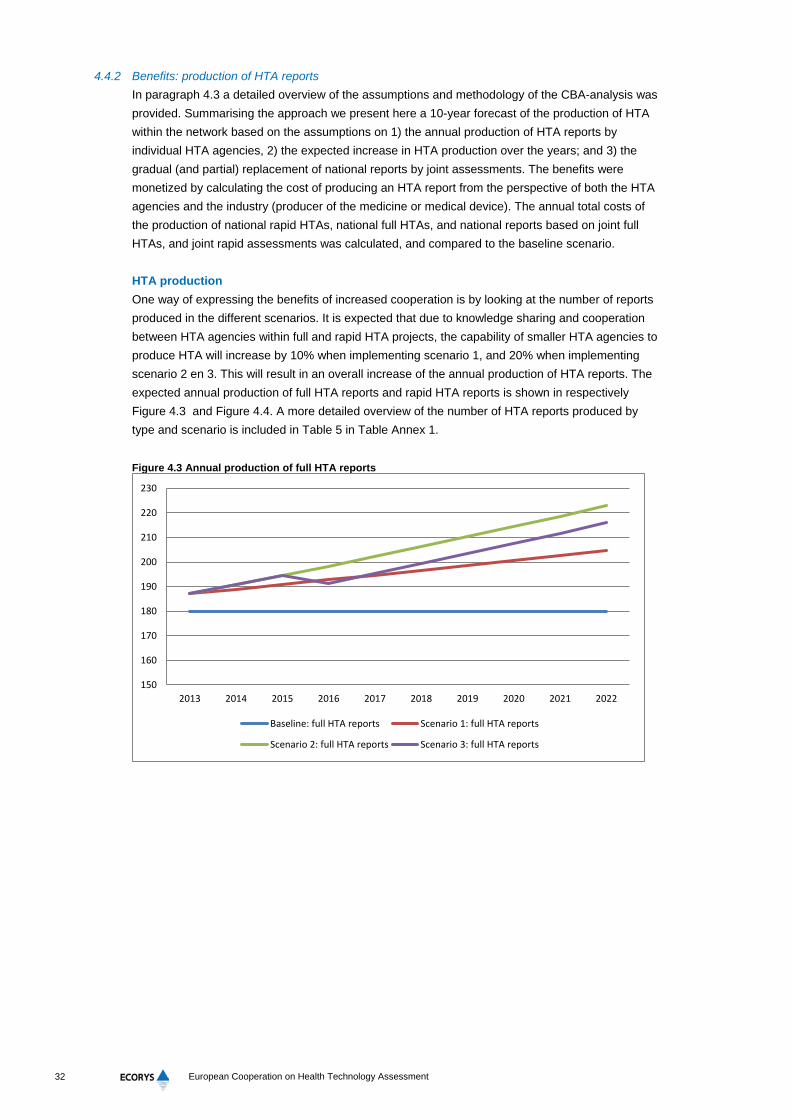
32
European Cooperation on Health Technology Assessment
4.4.2 Benefits: production of HTA reports In paragraph 4.3 a detailed overview of the assumptions and methodology of the CBA-analysis was provided. Summarising the approach we present here a 10-year forecast of the production of HTA within the network based on the assumptions on 1) the annual production of HTA reports by individual HTA agencies, 2) the expected increase in HTA production over the years; and 3) the gradual (and partial) replacement of national reports by joint assessments. The benefits were monetized by calculating the cost of producing an HTA report from the perspective of both the HTA agencies and the industry (producer of the medicine or medical device). The annual total costs of the production of national rapid HTAs, national full HTAs, and national reports based on joint full HTAs, and joint rapid assessments was calculated, and compared to the baseline scenario. HTA production One way of expressing the benefits of increased cooperation is by looking at the number of reports produced in the different scenarios. It is expected that due to knowledge sharing and cooperation between HTA agencies within full and rapid HTA projects, the capability of smaller HTA agencies to produce HTA will increase by 10% when implementing scenario 1, and 20% when implementing scenario 2 en 3. This will result in an overall increase of the annual production of HTA reports. The expected annual production of full HTA reports and rapid HTA reports is shown in respectively Figure 4.3 and Figure 4.4. A more detailed overview of the number of HTA reports produced by type and scenario is included in Table 5 in Table Annex 1. Figure 4.3 Annual production of full HTA reports
150
160
170
180
190
200
210
220
230
2013 2014 2015 2016 2017 2018 2019 2020 2021 2022
Baseline: full HTA reports Scenario 1: full HTA reports
Scenario 2: full HTA reports Scenario 3: full HTA reports

33
European Cooperation on Health Technology Assessment
Figure 4.4 Annual production of rapid HTA reports
The graphs in both figures show that the increase in HTA production is higher in scenario 2 than in scenario 3. This can be explained by the higher assumed replacement rates between separate individual national HTA reports and jointly produced HTA reports under scenario 3. Although scenario 2 will result in the highest production of HTA reports, it is expected that scenario 3 will bring additional benefits in terms of a more efficient process of HTA production within the network. The assumed replacement of jointly produced HTA reports resulting in national reports will generate cost savings since there is less duplication of work. Figure 4.5 shows the costs per HTA report. The individual prices and their projected development over time for the different types of reports have been presented in paragraph 4.3. Here the average costs of an 'average' HTA assessment is presented. Figure 4.5 Average cost per HTA report
The average cost per HTA report (full HTA and rapid HTA) will decrease from € 140,000 to €131,000 assuming a replacement rate of 1:10, and decreasing further to €112,000 in 2022 assuming a replacement rate of 1:15. The average unit price of an HTA report therefore decreases in the scenarios 2 and 3.
500
520
540
560
580
600
620
640
660
680
700
2013 2014 2015 2016 2017 2018 2019 2020 2021 2022
Baseline: rapid HTA reports Scenario 1: rapid reports reports
Scenario 2: rapid HTA reports Sceanrio 3: rapid HTA reports
€ 100.000
€ 110.000
€ 120.000
€ 130.000
€ 140.000
€ 150.000
€ 160.000
€ 170.000
€ 180.000
2013 2014 2015 2016 2017 2018 2019 2020 2021 2022
Baseline Scenario 1 Scenario 2 Scenario 3
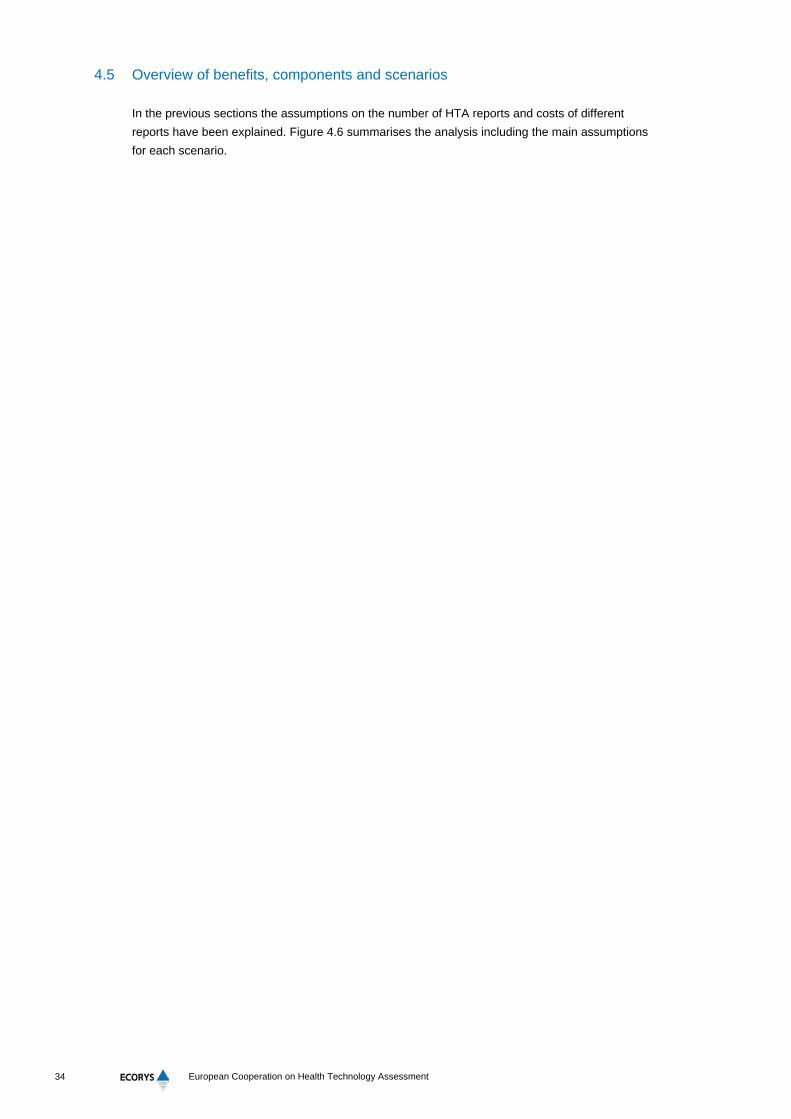
34
European Cooperation on Health Technology Assessment
4.5 Overview of benefits, components and scenarios
In the previous sections the assumptions on the number of HTA reports and costs of different reports have been explained. Figure 4.6 summarises the analysis including the main assumptions for each scenario.
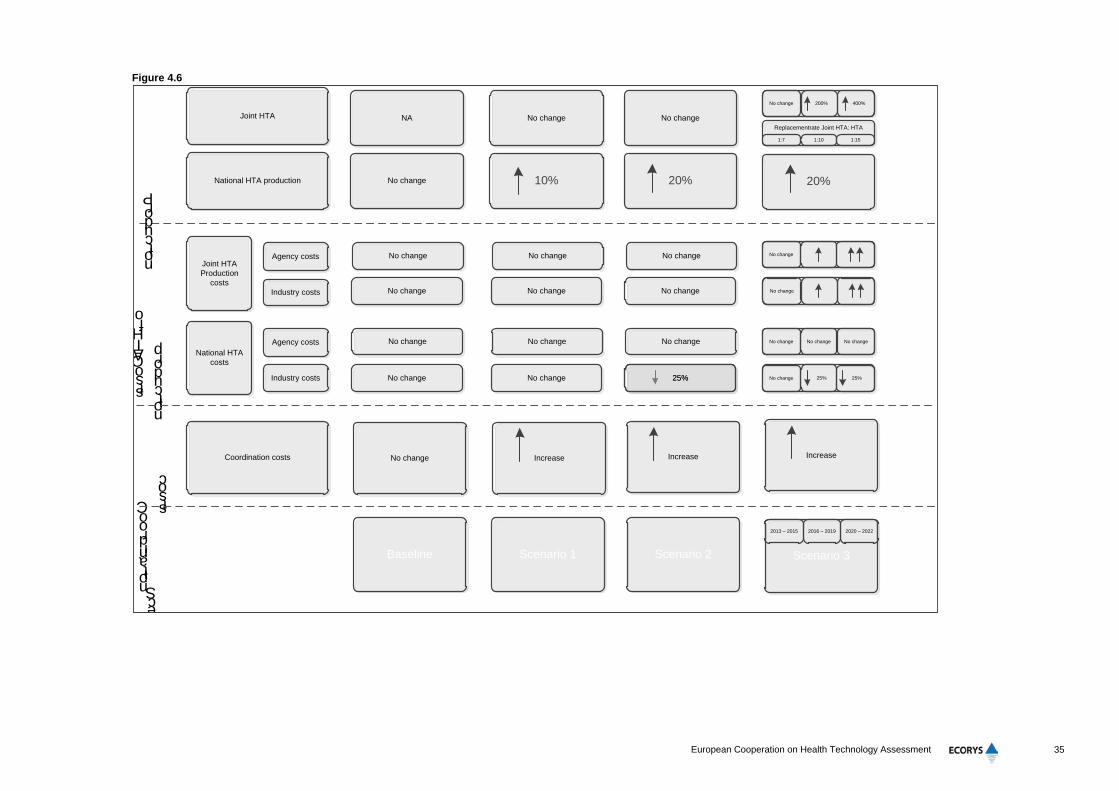
35
European Cooperation on Health Technology Assessment
Figure 4.6
National HTA costs
Agency costs
Industry costs
Joint HTA
National HTA production
No change
No change
Joint HTA Production
costs
Agency costs
Industry costs
Coordination costs
Production
Costs
of HTA
production
Baseline Scenario 1 Scenario 2 Scenario 3
2013 – 2015 2016 – 2019 2020 – 2022
NA
No change
No change
No change
No change
No change
Increase
No change
10%
No change
No change
No change
No change
No change
20%
No change
No change
25%
Replacementrate Joint HTA: HTA
No change
No change 200% 400%
20%
Increase Increase
1:7 1:10 1:15
No change
No change 25% 25%
No change No change No change
Coordination
costs
Scenarios
25%

36
European Cooperation on Health Technology Assessment
Assessment of the net benefits In the previous paragraphs the costs and (gross) benefits have been presented for the different scenarios. Ultimately we are interested in the net benefits of increased cooperation in HTA, which means subtracting the additional costs from the gross benefits. For this analysis this involves combining the two gross benefits of both increased HTA production and more efficient production of HTA reports with the additional costs for increased efforts for coordination by a secretariat. A general overview of these net annual benefits (Figure 4.7) shows that the highest benefits (efficiency gains through cost savings minus outlays for coordination) are to be expected in scenario 3. The figure also shows that scenario 1 is more expensive due to a 10% increase in HTA production compared to the baseline scenario, without an additional increase in efficiency. The foreseen development of common generic guidelines in scenario 2 will result in an increase in production of HTA reports of 20%. Since HTA agencies are using the same methodology and/or template for their reports HTA information is more easily exchangeable. This will provide opportunities to smaller HTA agencies with less expertise and resources to increase their individual HTA production. Moreover, the use of common generic guidelines will provide efficiency gains for the industry, since application procedures and requirements in the different Member States will become more harmonized. Therefore, it was assumed that the average cost of an HTA application for a full and rapid HTA assessment will decrease in this scenario.
Figure 4.7 General overview of expected benefits
The above described increase in HTA production and the efficiency gains for the industry are also applicable to scenario 3. Additionally, in this scenario it is assumed that the use of joint HTA assessments will double in the period 2016 – 2019, and double again in the period 2020 – 2022. Additionally, these national reports produced from joint HTA projects are expected to replace the individually produced national HTA reports. As described above, the assumed replacement of jointly produced HTA core information resulting in national reports will generate cost savings since there is less duplication of work. Therefore implementing scenario 3 will result in an annual benefit of approximately € 20 million in terms of HTA production as compared to implementation of scenario 1 and 2 cumulatively. If only scenario 2 would be implemented the benefits in terms of more efficient HTA production would only temporarily outweigh the costs of increased coordination. Distribution of gross benefits The cost benefit analysis is based on the benefits of two main stakeholders, the HTA agencies and the industry. The distribution of the benefits over these two stakeholders is therefore of particular interest. Who would possibly benefit most from the investments in increased coordination? Figures
€ -30.000.000
€ -20.000.000
€ -10.000.000
€ -
€ 10.000.000
€ 20.000.000
€ 30.000.000
2013 2014 2015 2016 2017 2018 2019 2020 2021 2022
Scenario 1 Scenario 2 Scenario 3

37
European Cooperation on Health Technology Assessment
4.8 and 4.9 provide an overview of the gross benefits per scenario for HTA agencies and industry respectively. Figure 4.8 Gross benefits per scenario for HTA agencies
Figure 4.9 Gross benefits per scenario for Industry
Several comments are made on the basis of these graphs: • The gross benefits per scenario show that under scenario 1 the gross benefits are negative
both for Industry and HTA agencies; • Under scenario 2 the industry reaps immediate and substantial benefits from the increased
standardisation in the common approach, which leads to costs decreases. However, for HTA agencies this scenario does not show any financial gains compared to the baseline;
• In scenario 3 both stakeholders benefit. The respective shares in the combined gross benefit are approximately 65 percent for the industry and 35 percent for the HTA agencies;
• Comparing the impact of the gross benefit in terms of the production costs of each stakeholder shows that the impact in all scenarios is smaller for the HTA agencies (between 5-10% of HTA production value) than for industry (approximately 15-20%).
These observations again seem to point to scenario 3 as the most attractive in financial terms with the biggest gain for both stakeholders.
-6
-4
-2
0
2
4
6
8
10
12
1 2 3 4 5 6 7 8 9 10
Mill
ions
Scenario 1
Scenario 2
Scenario 3
-15
-10
-5
0
5
10
15
20
25
30
Mill
ions
Scenario 1
Scenario 2
Scenario 3

38
European Cooperation on Health Technology Assessment
Sensitivity analyses The CBA is highly stylised and based on many assumptions. Therefore a sensitivity analysis is necessary to see how robust the results are if the main parameters would change. Two important parameters are the replacement rates from separate country reports to joint assessment reports and the 'autonomous' growth in HTA production in the different scenarios. Therefore the results are shown eliminating either the assumptions on the replacement rates or the 'autonomous' growth factors. The efficiency gain due to the use of joint assessments to (partially) replace individually produced HTA reports is shown in Figure 4.10. This figure shows the expected benefits without the assumed growth in HTA production. When only the replacement factor is taken into account the benefits are expected to be even higher in scenario 3. Please note that the breaks in the line for scenario 3 correspond with the consecutive increases in the replacement rates. The expected benefits of the implementation of the different scenarios without assumptions on the (partial) replacement of individually produced HTA reports is shown in Figure 4.11. This figure shows that when implementing at least scenario 2 the HTA production can potentially increase by 20% at the same cost as in the baseline scenario. The sensitivity analysis for the replacement rate and the autonomous growth factor shows that the results are slightly changing but the ranking of the three scenarios in terms of attractiveness remains the same. Figure 4.10 Expected benefits without assumed general increase in HTA production (only replacement)
€ -10.000.000
€ -5.000.000
€ -
€ 5.000.000
€ 10.000.000
€ 15.000.000
€ 20.000.000
€ 25.000.000
2013 2014 2015 2016 2017 2018 2019 2020 2021 2022
Scenario 1 - ICT Platform Scenario 2 - Common Generic Guidelines
Scenario 3 - Joint Assessments

39
European Cooperation on Health Technology Assessment
Figure 4.11 Expected benefits without replacement of separate HTA reports by joint reports (only
growth)
Two additional parameters have been analysed in this sensitivity analysis: the replacement rate in scenario 3 and the costs of the HTA reports. The impact of the changes is presented here as an assessment against the value of the net benefits in the year 2022.
Table 4.6 Results of sensitivity analysis
Net benefit in 2022 (Euro mln)
Change in parameter Scenario 1 Scenario 2 Scenario 3
Base case -21,3 -7,1 19,1
Costs of HTA reports 25 percent lower than in base case -28,6 -13,7 13,5
Costs of HTA reports 25 percent higher than in base case -14,0 -0,5 24,7
Replacement rate in scenario 3 not higher than 10 countries -21,3 -7,1 3,6
The results presented in table 4.6 show considerable variations in the net benefit in 2022. It is clear that a reduction in the price of HTA reports reduces the attractiveness of all scenarios. The costs are lower and hence the efficiency gains to be reaped are also lower. Correspondingly, a rise in the price of the HTA assessments increases the attractiveness of all scenarios. Scenario 2 would almost turn positive. In addition the impact of a lower replacement rate - less countries will be covered in one joint assessment study- has been tested for scenario 3 by limiting the number of countries to 10 instead of 15 in the last three years of analysis. The analysis is quite sensitive to this change and the net benefit drops substantially to € 3.6 million. We conclude that the analysis presented is quite robust to changes in the main parameters except for the specific replacement rate in scenario 3.
4.5.1 Conclusions
The results of the economic analysis for a permanent HTA secretariat in the EU show that an increasing degree of cooperation among Member States brings cumulative and increasing benefits, which outweigh relatively modest increases in coordinating costs. The approach of this economic
€ -25.000.000
€ -20.000.000
€ -15.000.000
€ -10.000.000
€ -5.000.000
€ -
€ 5.000.000
€ 10.000.000
€ 15.000.000
€ 20.000.000
2013 2014 2015 2016 2017 2018 2019 2020 2021 2022
Scenario 1 - ICT Platform Scenario 2 - Common Generic Guidelines
Scenario 3 - Joint Assessments

40
European Cooperation on Health Technology Assessment
analysis builds upon monetising the main benefits of increased cooperation by capturing them into additional production of HTA-reports, lower average production costs and a conversion towards joint assessments instead of separate assessments. An additional expenditure on coordination of HTA activities in the EU increasing to about 4.2 million per year in 2022 is associated with an economic return for HTA agencies and industry of about € 19 million per annum. This result is crucially dependent upon the increased use of joint assessments instead of separate assessments per country as reflected in scenario 3 of the analysis. In case of scenario 2 the benefits of the development of common generic guidelines are at first positive but will ultimately not outweigh the additional cost for coordination and production of HTA reports. Only developing and maintaining an ICT platform as in scenario one is not attractive. A similar conclusion could be drawn from cumulative figures for the full period of analysis as shown in the table below. It is shown that in the case of scenario 1 the total costs of coordination are € 51 million over 10 years. This expenditure would correspond to additional costs for industry and HTA agencies of € 95 million. In scenario three total costs of enhanced coordination of HTA activities of € 73 million would lead to economic benefits for HTA agencies and industry of € 225 million. Table 4.7 Cumulative Benefits (€, million)
Cumulative net benefit Cumulative gross benefit Cumulative cost coordination
Scenario 1 € -146 € 95- € 51
Scenario 2 € 41 € 102 € 61
Scenario 3 € 152 € 225 € 73
The distribution of the benefits of enhanced cooperation is skewed in favour of industry. Only in scenario 3 industry and stakeholders would both be able to reap substantial benefits. In this scenario the benefit for industry would be about two-thirds of the total benefit and the HTA agencies would reap bout one-third of the total. The results of the alternative hosting options have not explicitly been taken into account. The response of the interviewees on the managerial and organisational benefits of the different options has been tentative, rather abstract and not operational. In the light of these uncertainties and the relative modest variations in coordinating costs based on the differences between the scenarios, further detailing the cost per hosting alternative would, in our view, be too dependent upon rather arbitrary types of assumptions. The strategic nature of the assessment looking beyond 2016, the limited availability of relevant data on organisational costs and current and future costs of HTA assessments, prescribe that the economic analysis is based on a string of assumptions regarding future developments. By nature these are uncertain and considerable variations may apply. However, by taking these uncertainties into account in explicit assumptions the current analysis does present an up to date and verifiable projection of likely costs and benefits of the different scenarios for more cooperation in the field of HTA within the EU.

41
European Cooperation on Health Technology Assessment
5 Conclusions and further observations
HTA provides decision-makers across the EU important information to make decisions with regard to the introduction, coverage, and use or disinvestment of health technologies. Often, decision-makers are faced with similar information needs that are fulfilled by multiple HTA agencies. This leads to considerable duplication of efforts. As a result, collaboration among HTA agencies has been set up. This collaboration is seen to be beneficial as it stimulates knowledge and information sharing, reduces duplication of efforts (especially research-related), and leads to an improvement in HTA with respect to methodology and data input. Another benefit is that an increased and enforced role of HTA in healthcare decision-making will further support better-informed decision-making. To support the effectiveness and efficiency of the European network on Health Technology Assessment a more permanent solution for the coordination of its activities should be found with the overarching objective to put into practice an effective and sustainable HTA collaboration in Europe that brings added value at the European, national and regional level. In Article 15 of Directive 2011/24/EU of the European Parliament and of the Council of 9 March 2011 on the application of patients’ rights in cross-border health care, a permanent network on HTA in the EU is foreseen by the end of 2013. In response to the provisions of Article 15 the Executive Agency for Health and Consumers (EAHC) commissioned an economic and governance analysis on alternative solutions for the set-up of such a permanent secretariat for future cooperation in the field of HTA. In this report we present the results of this governance and economic analysis. Particular emphasis lies on the scientific (HTA production, coordination), financially and regulatory (horizontal) synergies and how anticipated synergies are best organised by the type of organisation for hosting such a network.
5.1 Main conclusions
Governance analysis Based on our research and the interviews held with many stakeholders in the HTA community in Europe and beyond, it is clear that more can be done to reap the full benefits of collaboration in the field of HTA. Main bottlenecks are the organisational complexity of working with many partners in one network. Also, major differences in decision-making structures, data requirements and the level of conduct and implementation of HTA in individual EU Member States seem to obstruct intensifying the current collaboration. Although the will for increased collaboration clearly exists, efficiency gains can be made. Out of the three identified scenario’s, the third scenario including joint assessments evidently goes the furthest in terms of collaboration. This leads to high potential benefits, as it has the highest possibility to reach an effective impact in decision-making in Member States and the EU with the greatest potential to support the adequate, timely available and more cost-effective use of health technology within the EU. It is, however, highly questionable whether this scenario can be rolled out successfully under the present conditions. It is therefore considered more realistic to pursue scenario 2 with scenario 1 as a building stone, keeping in mind the ambition to potentially aim for more collaboration in the shape of scenario 3 at a later stage.
42
European Cooperation on Health Technology Assessment
Different options for hosting a permanent HTA secretariat have investigated. Despite the fact that each hosting alternative bears pro’s and con’s, it becomes clear that the third hosting option, through outsourcing to an external body and within the HTA network, is considered both the most realistic and preferred option to pursue. It offers trust to those who make use of the network, it keeps the HTA community well connected with the secretariat, it makes use of available HTA expertise within the HTA community, and it is considered the most efficient as a collaborative network is considered to be best managed internally, by the network itself. The two options within the HTA network, a permanent secretariat or a rotating secretariat, have specific advantages and disadvantages. The rotating secretariat seems, however, to be the preferred option but bears significant issues with regard to efficiency. The other two hosting options, within the Commission and through a subordinate Agency under the Commission do bear benefits, but do not convincingly counter-effect the fear for bureaucracy and detachment from the HTA community and HTA expertise. Outsourcing through an external body outside the HTA network can lead to organisational efficiency gains, but would cut the secretariat not only loose from the HTA community but also from the Commission. Economic Analysis The approach of this economic analysis builds upon monetising the main benefits of increased cooperation by capturing them into efficiency gains in the production of HTA reports by HTA agencies and industry. These efficiency gains materialise through additional production of HTA-reports, lower average production costs of HTA assessments and a conversion towards joint assessments (full and rapid) instead of separate national assessments. The results of the economic analysis for a permanent HTA secretariat in the EU show that an increasing degree of cooperation among Member States brings cumulative and increasing benefits, which in case of a high degree of collaboration outweigh relatively modest increases in coordinating costs. It is estimated that an additional expenditure on coordination of HTA activities in the EU increasing to about 4.2 million per year in 2022 is associated with an economic return for HTA agencies and industry of about € 19 million per annum9. This result is crucially dependent upon the increased use of joint assessments instead of separate assessments per country. Changes in the costs of HTA assessments and number of HTA reports produced would also impact on the economic returns. When collaboration would indeed also be based on the use of joint assessments the economic return of € 19 million could vary in a range between € 3.6 million and 27 million. In case collaboration would only involve the development of common generic guidelines the results are at first positive but they will ultimately not outweigh the additional cost for coordination and production of HTA reports. Only developing and maintaining an ICT platform as in scenario one is not attractive. A similar conclusion could be drawn from cumulative figures for the full period of analysis as shown in the table below. It is shown that in the case of scenario 1 the total costs of coordination are € 51 million over 10 years. This expenditure would lead to additional costs for industry and HTA agencies of € 95 million. In scenario three total cumulative costs of (enhanced) coordination of HTA activities of € 73 million would lead to economic benefits for HTA agencies and industry of € 225 million over a ten year time span. 9 These figures do not represent discounted figures.

43
European Cooperation on Health Technology Assessment
Table 5.1 Cumulative Benefits (€, million)
Cumulative net benefit Cumulative gross benefit Cumulative cost coordination
Scenario 1 € -146 € 95- € 51
Scenario 2 € 41 € 102 € 61
Scenario 3 € 152 € 225 € 73
The distribution of the benefits of enhanced cooperation is skewed in favour of industry. Only in scenario 3 industry and stakeholders would both be able to reap substantial benefits. In this scenario the benefit for industry would be about two-thirds of the total benefit and the HTA agencies would reap bout one-third of the total. The results of the alternative hosting options have not explicitly been taken into account. The response of the interviewees on the managerial and organisational benefits of the different options has been tentative, rather abstract and not operational. In the light of these uncertainties and the relative modest variations in coordinating costs based on the differences between the scenarios, further detailing the cost per hosting alternative would, in our view, be too dependent upon rather arbitrary types of assumptions. This surplus or net benefit for the EU as a whole increases when collaboration between member states would become more intense. For these benefits to materialise, the degree of cooperation would have to move beyond a shared ICT platform and include the use of common generic guidelines and an increasing reliance upon joint assessments. However, the stakeholders that were interviewed for this study consider the feasibility of an increased reliance upon joint assessments unlikely to happen in the coming 5-10 years, taking into account the institutional bottlenecks of widely varying HTA practices among member states. The benefits taken into account focus on the efficiency in producing HTA information for producers and users of HTA both from the public and private sector. Possible broader impacts on the quality of HTA, the timeliness and accuracy in decision-making and the speed of adopting more cost-effective health care interventions and ultimately the health of EU citizens have not been included in the calculations. Apart from these broader benefits the combined results of the governance and economic analysis result in a deadlock. To improve efficiency in the production of HTA, collaboration would have to be extended to an increased use of joint assessments. However, at the same time the existing stakeholders in the HTA community consider such a degree of collaboration not realistic in the medium term. Hence the practical and strategic realities on the ground for the existing stakeholders seem to stand in the way of improving further efficiency in the production of HTA through enhanced coordination of HTA-activities in the EU.
5.2 Further observations
The strategic nature of this analysis (i.e. looking beyond 2016), the limited availability of relevant data on organisational costs and current and future costs of HTA assessments, prescribe that the economic analysis is based on a string of assumptions regarding uncertain future developments. However, by taking these uncertainties into account in explicit assumptions, the current analysis does present an up to date and verifiable projection of likely costs and benefits of the different scenarios for more cooperation in the field of HTA within the EU.
44
European Cooperation on Health Technology Assessment
Considerable differences of opinion exist between representatives of smaller and larger member states (i.e. HTA agencies) on the perceived benefits of further cooperation. Smaller agencies typically have less capacity in terms of scope of analysis and resources and view the larger HTA-agencies as dominant. A related, but even more important difference is between countries (large and small) that have established HTA capacity and those that have not or are only starting to become engaged professionally in this field. The benefits of increased harmonisation of approaches and enhanced cooperation among agencies are particularly large for smaller agencies with no or limited established capacity in the field of HTA. On the other hand the costs in terms of capacity building, developing new approaches and fields of application (e.g. care pathways), the intellectual property lies primarily with the larger, established HTA agencies, which do no have an immediate interest in transferring resources and know-how to other countries. This skewed distribution of benefits and costs among member states in the short to medium term will decrease the willingness to pursue a common agenda and the speed with which such an agenda can be implemented. For the EC and the permanent secretariat this emphasises the important independent role it can have in facilitating and financing the capacity development of HTA, thereby diminishing possible bottlenecks due to capacity constraints. Several respondents have linked the legal framework governing the cooperation between different agencies and member states to the issue of the distribution of costs and benefits among agencies and countries. Intellectual property rights of approaches and methods developed by individual agencies outside the framework of EU-cooperation are unclear and are reported to affect the willingness to cooperate. A common legal basis for cooperation is deemed necessary for structural future cooperation. A bottleneck that has often been mentioned by respondents across countries and stakeholders concerns language barriers and the dominance of English. These are considered a real bottleneck in cooperation, but they receive relatively little attention in discussions on cooperation. Most respondents expect the importance of this barrier to increase when cooperation would intensify and more countries get involved in HTA. It is not immediately clear what additional role the EC or the secretariat can have to help reduce this barrier. The European capacity in terms of numbers of HTA professionals is considered too limited. There appear to be too few universities and research institutes that offer substantial HTA related curricula for people to specialise in this area. A drive to increase that capacity within academia is considered a necessary step to facilitate the collaboration within Europe. This may also provide opportunities to harmonise education in the field of HTA (confer the programme for pharma-regulatory sciences EMI). The preference for hosting the secretariat within the existing network of HTA agencies is understandable and supported by powerful arguments about the benefits and considerable achievements of the cooperation over the past two decades. The broader discussion on the future of the HTA cooperation invoked also a few more philosophical debates during the interviews. An important observation concerned the inclusiveness of the current networks in terms of stakeholders and if stakeholders such as ministries of finance of member states, organisations of professionals and health insurers, often with a more direct financial interest in the application of the results of HTA, may become more active players in the future. Increasingly limited budgetary resources and a further increase to direct financial contributions to health care by patients and consumers may trigger such a more active position. The progress in HTA and the collaboration between agencies is perceived as largely driven by the scientific community in the past decades. At the same time the practical impact of HTA on actual policy decisions and reimbursements practices is currently widely discussed also within the HTA community, as actual impact is less visible than envisaged. With

45
European Cooperation on Health Technology Assessment
these development in mind the question has been posed to what extent possible new or more active stakeholders dealing with financial and budgetary policies could change the (discussion on) collaboration. They could create further impetus for collaboration between countries and agencies but may possibly also put different emphasis on the information required and the timeliness of results of HTA to support policy decisions.


47
European Cooperation on Health Technology Assessment
Annex 1: Tables of Calculations

48
European Cooperation on Health Technology Assessment
Table 1: 10-year forecast EUnetHTA coordination cost of EUnetHTA
2013 2014 2015 2016 2017 2018 2019 2020 2021 2022Baseline scenario - Completion JA1Component 1: European Coordination Services € 3.268.504 3.268.504€ 3.268.504€ 3.268.504€ 3.333.875€ 3.400.552€ 3.468.563€ 3.537.934€ 3.608.693€ 3.680.867€ Component 2: Information Management Infrastructure and ServicesComponent 3: HTA core modelComponent 4: Full HTAsComponent 5: Rapid HTAsTOTAL COSTS 3.268.504€ 3.268.504€ 3.268.504€ 3.268.504€ 3.333.875€ 3.400.552€ 3.468.563€ 3.537.934€ 3.608.693€ 3.680.867€ CUMULATIVE COSTS 3.268.504€ 6.537.009€ 9.805.513€ 13.074.018€ 16.407.892€ 19.808.444€ 23.277.007€ 26.814.942€ 30.423.635€ 34.104.502€
2013 2014 2015 2016 2017 2018 2019 2020 2021 2022Scenario 1 - ICT PlatformComponent 1: European Coordination Services € 4.833.028 € 4.833.028 € 4.833.028 4.672.528€ 4.765.978€ 4.861.298€ 4.958.524€ 5.057.694€ 5.158.848€ 5.262.025€ Component 2: Information Management Infrastructure and Services € 171.533 € 171.533 € 171.533 171.533€ 174.964€ 178.463€ 182.032€ 185.673€ 189.386€ 193.174€ Component 3: HTA core modelComponent 4: Full HTAsComponent 5: Rapid HTAsTOTAL 5.004.561€ 5.004.561€ 5.004.561€ 4.844.061€ 4.940.942€ 5.039.761€ 5.140.556€ 5.243.367€ 5.348.234€ 5.455.199€ CUMULATIVE COSTS 5.004.561€ 10.009.121€ 15.013.682€ 19.857.742€ 24.798.684€ 29.838.445€ 34.979.000€ 40.222.367€ 45.570.602€ 51.025.801€
2013 2014 2015 2016 2017 2018 2019 2020 2021 2022Scenario 2 - Common generic guidelinesComponent 1: European Coordination Services € 4.833.028 4.833.028€ 4.833.028€ 4.779.528€ 4.875.118€ 4.972.620€ 5.072.073€ 5.173.514€ 5.276.985€ 5.382.524€ Component 2: Information Management Infrastructure and Services € 171.533 € 171.533 € 171.533 171.533€ 174.964€ 178.463€ 182.032€ 185.673€ 189.386€ 193.174€ Component 3: HTA core model € 908.906 908.906€ 908.906€ 908.906€ 927.084€ 945.626€ 964.538€ 983.829€ 1.003.505€ 1.023.576€ Component 4: Full HTAsComponent 5: Rapid HTAsTOTAL 5.913.466€ 5.913.466€ 5.913.466€ 5.859.966€ 5.977.166€ 6.096.709€ 6.218.643€ 6.343.016€ 6.469.876€ 6.599.274€ CUMULATIVE COSTS 5.913.466€ 11.826.933€ 17.740.399€ 23.600.365€ 29.577.531€ 35.674.240€ 41.892.883€ 48.235.899€ 54.705.776€ 61.305.049€
2013 2014 2015 2016 2017 2018 2019 2020 2021 2022Scenario 3 - Joint AssessmentsComponent 1: European Coordination Services € 4.833.028 4.833.028€ 4.833.028€ 4.886.528€ 4.984.258€ 5.083.943€ 5.185.622€ 5.289.335€ 5.395.121€ 5.503.024€ Component 2: Information Management Infrastructure and Services € 171.533 171.533€ 171.533€ 171.533€ 174.964€ 178.463€ 182.032€ 185.673€ 189.386€ 193.174€ Component 3: HTA core model € 908.906 908.906€ 908.906€ 908.906€ 927.084€ 945.626€ 964.538€ 983.829€ 1.003.505€ 1.023.576€ Component 4: Full HTAs € 376.128 376.128€ 376.128€ 376.128€ 383.651€ 391.324€ 399.150€ 407.133€ 415.276€ 423.581€ Component 5: Rapid HTAs € 655.247 655.247€ 655.247€ 655.247€ 668.352€ 681.719€ 695.354€ 709.261€ 723.446€ 737.915€ TOTAL 6.944.842€ 6.944.842€ 6.944.842€ 6.998.342€ 7.138.308€ 7.281.075€ 7.426.696€ 7.575.230€ 7.726.735€ 7.881.269€ CUMULATIVE COSTS 6.944.842€ 13.889.683€ 20.834.525€ 27.832.867€ 34.971.175€ 42.252.250€ 49.678.946€ 57.254.176€ 64.980.911€ 72.862.180€

49
European Cooperation on Health Technology Assessment
Table 2: Annual EUnetHTA coordination cost by input category (2013 – 2015)
Baseline scenario Scenario 1 Scenario 2 Scenario 3
COMPLETION JA1 ICT PLATFORM COMMON GENERIC GUIDELINES JOINT ASSESSMENTS
Component 1: European Coordination Services
Capital cost 125.282€ 316.884€ 316.884€ 316.884€
Recurrent costTotal annual staff cost agencies 1.080.217€ 1.871.644€ 1.871.644€ 1.871.644€ Total annual staff cost agencies not budgeted 108.022€ 187.164€ 187.164€ 187.164€ Total annual travel cost agencies 218.656€ 218.656€ 218.656€ 218.656€
Total annual staff cost secretariat 240.000€ 440.000€ 440.000€ 440.000€ Total annual staff cost secretariat not budgeted 60.000€ 110.000€ 110.000€ 110.000€
Total annual staff cost commission 262.500€ 412.500€ 412.500€ 412.500€ Total annual staff cost industry 240.000€ 240.000€ 240.000€ 240.000€ Total annual staff cost stakeholders 720.000€ 720.000€ 720.000€ 720.000€
Total capital and recurrent cost 3.054.677,05€ 4.516.848,18€ 4.516.848,18€ 4.516.848,18€ Overhead cost (7%) 213.827€ 316.179€ 316.179€ 316.179€ TOTAL COMPONTENT 1 3.268.504,44€ 4.833.027,55€ 4.833.027,55€ 4.833.027,55€
Component 2: Information Management Infrastructure and Services
Capital cost 50.455€ 50.455€ 50.455€
Recurrent costTotal annual staff cost agencies 96.989€ 96.989€ 96.989€ Total annual staff cost agencies not budgetted 9.699€ 9.699€ 9.699€ Total annual travel cost agencies 3.168€ 3.168€ 3.168€
Total capital and recurrent cost 160.311,23€ 160.311,23€ 160.311,23€ Overhead cost (7%) 11.222€ 11.222€ 11.222€ TOTAL COMPONTENT 2 171.533,01€ 171.533,01€ 171.533,01€

50
European Cooperation on Health Technology Assessment
Component 3: HTA core model
Capital cost 75.438€ 75.438€
Recurrent costTotal annual staff cost agencies 658.643€ 658.643€ Total annual staff cost agencies not budgetted 65.864€ 65.864€ Total annual travel cost agencies 49.500€ 49.500€
Total capital and recurrent cost 849.444,65€ 849.444,65€ Overhead cost (7%) 59.461€ 59.461€ TOTAL COMPONTENT 3 908.905,78€ 908.905,78€
Component 4: Full HTAs
Capital cost 25.997€
Recurrent costTotal annual staff cost agencies 306.781€ Total annual staff cost agencies not budgetted 30.678€ Total annual travel cost agencies 12.672€
Total capital and recurrent cost 376.127,99€ Overhead cost (7%) 26.329€ TOTAL COMPONTENT 4 376.127,99€
Component 5: Rapid HTAs
Capital cost 29.924€
Recurrent costTotal annual staff cost agencies 502.686€ Total annual staff cost agencies not budgetted 50.269€ Total annual travel cost agencies 29.502€
Total capital and recurrent cost 612.380,67€ Overhead cost (7%) 42.867€ TOTAL COMPONTENT 5 655.247,32€
TOTAL COSTS ALL COMPONENTS 3.268.504,44€ 5.004.560,57€ 5.913.466,34€ 6.944.841,65€

51
European Cooperation on Health Technology Assessment
Table 3: Annual EUnetHTA coordination cost (2016 – 2022)
Baseline scenario Scenario 1 Scenario 2 Scenario 3
COMPLETION JA1 ICT PLATFORM COMMON GENERIC GUIDELINES JOINT ASSESSMENTS
Component 1: European Coordination Services
Capital cost 125.282€ 316.884€ 316.884€ 316.884€
Recurrent costTotal annual staff cost agencies 1.080.217€ 1.871.644€ 1.871.644€ 1.871.644€ Total annual staff cost agencies not budgetted 108.022€ 187.164€ 187.164€ 187.164€ Total annual travel cost agencies 218.656€ 218.656€ 218.656€ 218.656€
Total annual staff cost secretariat 240.000€ 320.000€ 400.000€ 480.000€ Total annual staff cost secretariat not budgetted 60.000€ 80.000€ 100.000€ 120.000€
Total annual staff cost commission 262.500€ 412.500€ 412.500€ 412.500€ Total annual staff cost industry 240.000€ 240.000€ 240.000€ 240.000€ Total annual staff cost stakeholders 720.000€ 720.000€ 720.000€ 720.000€
Total capital and recurrent cost 3.054.677,05€ 4.366.848,18€ 4.466.848,18€ 4.566.848,18€ Overhead cost (7%) 213.827€ 305.679€ 312.679€ 319.679€ TOTAL COMPONTENT 1 3.268.504,44€ 4.672.527,55€ 4.779.527,55€ 4.886.527,55€
Component 2: Information Management Infrastructure and Services
Capital cost 50.455€ 50.455€ 50.455€
Recurrent costTotal annual staff cost agencies 96.989€ 96.989€ 96.989€ Total annual staff cost agencies not budgetted 9.699€ 9.699€ 9.699€ Total annual travel cost agencies 3.168€ 3.168€ 3.168€
Total capital and recurrent cost 160.311,23€ 160.311,23€ 160.311,23€ Overhead cost (7%) 11.222€ 11.222€ 11.222€ TOTAL COMPONTENT 2 171.533,01€ 171.533,01€ 171.533,01€

52
European Cooperation on Health Technology Assessment
Component 3: HTA core model
Capital cost 75.438€ 75.438€
Recurrent costTotal annual staff cost agencies 658.643€ 658.643€ Total annual staff cost agencies not budgetted 65.864€ 65.864€ Total annual travel cost agencies 49.500€ 49.500€
Total capital and recurrent cost 849.444,65€ 849.444,65€ Overhead cost (7%) 59.461€ 59.461€ TOTAL COMPONTENT 3 908.905,78€ 908.905,78€
Component 4: Full HTAs
Capital cost 25.997€
Recurrent costTotal annual staff cost agencies 306.781€ Total annual staff cost agencies not budgetted 30.678€ Total annual travel cost agencies 12.672€
Total capital and recurrent cost 376.127,99€ Overhead cost (7%) 26.329€ TOTAL COMPONTENT 4 376.127,99€
Component 5: Rapid HTAs
Capital cost 29.924€
Recurrent costTotal annual staff cost agencies 502.686€ Total annual staff cost agencies not budgetted 50.269€ Total annual travel cost agencies 29.502€
Total capital and recurrent cost 612.380,67€ Overhead cost (7%) 42.867€ TOTAL COMPONTENT 5 655.247,32€
TOTAL COSTS ALL COMPONENTS 3.268.504,44€ 4.844.060,57€ 5.859.966,34€ 6.998.341,65€
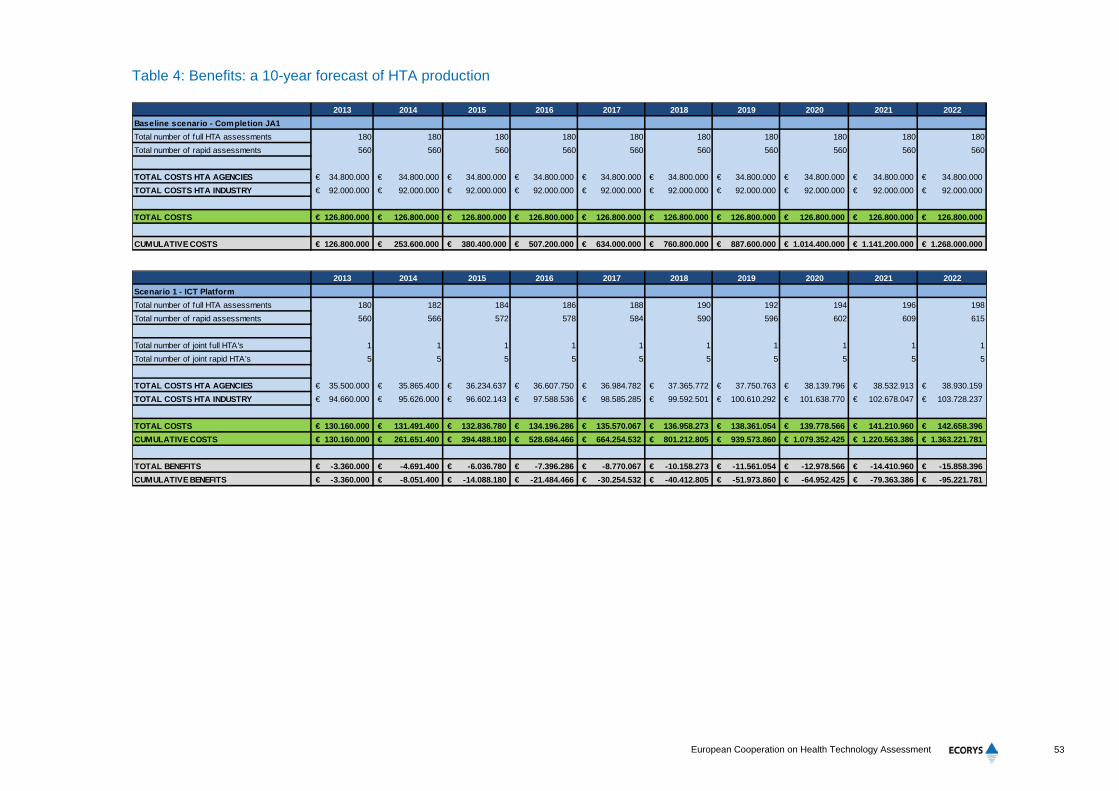
53
European Cooperation on Health Technology Assessment
Table 4: Benefits: a 10-year forecast of HTA production
2013 2014 2015 2016 2017 2018 2019 2020 2021 2022Baseline scenario - Completion JA1Total number of full HTA assessments 180 180 180 180 180 180 180 180 180 180Total number of rapid assessments 560 560 560 560 560 560 560 560 560 560
TOTAL COSTS HTA AGENCIES 34.800.000€ 34.800.000€ 34.800.000€ 34.800.000€ 34.800.000€ 34.800.000€ 34.800.000€ 34.800.000€ 34.800.000€ 34.800.000€ TOTAL COSTS HTA INDUSTRY 92.000.000€ 92.000.000€ 92.000.000€ 92.000.000€ 92.000.000€ 92.000.000€ 92.000.000€ 92.000.000€ 92.000.000€ 92.000.000€
TOTAL COSTS 126.800.000€ 126.800.000€ 126.800.000€ 126.800.000€ 126.800.000€ 126.800.000€ 126.800.000€ 126.800.000€ 126.800.000€ 126.800.000€
CUMULATIVE COSTS 126.800.000€ 253.600.000€ 380.400.000€ 507.200.000€ 634.000.000€ 760.800.000€ 887.600.000€ 1.014.400.000€ 1.141.200.000€ 1.268.000.000€
2013 2014 2015 2016 2017 2018 2019 2020 2021 2022Scenario 1 - ICT PlatformTotal number of full HTA assessments 180 182 184 186 188 190 192 194 196 198Total number of rapid assessments 560 566 572 578 584 590 596 602 609 615
Total number of joint full HTA's 1 1 1 1 1 1 1 1 1 1Total number of joint rapid HTA's 5 5 5 5 5 5 5 5 5 5
TOTAL COSTS HTA AGENCIES 35.500.000€ 35.865.400€ 36.234.637€ 36.607.750€ 36.984.782€ 37.365.772€ 37.750.763€ 38.139.796€ 38.532.913€ 38.930.159€ TOTAL COSTS HTA INDUSTRY 94.660.000€ 95.626.000€ 96.602.143€ 97.588.536€ 98.585.285€ 99.592.501€ 100.610.292€ 101.638.770€ 102.678.047€ 103.728.237€
TOTAL COSTS 130.160.000€ 131.491.400€ 132.836.780€ 134.196.286€ 135.570.067€ 136.958.273€ 138.361.054€ 139.778.566€ 141.210.960€ 142.658.396€ CUMULATIVE COSTS 130.160.000€ 261.651.400€ 394.488.180€ 528.684.466€ 664.254.532€ 801.212.805€ 939.573.860€ 1.079.352.425€ 1.220.563.386€ 1.363.221.781€
TOTAL BENEFITS -3.360.000€ -4.691.400€ -6.036.780€ -7.396.286€ -8.770.067€ -10.158.273€ -11.561.054€ -12.978.566€ -14.410.960€ -15.858.396€ CUMULATIVE BENEFITS -3.360.000€ -8.051.400€ -14.088.180€ -21.484.466€ -30.254.532€ -40.412.805€ -51.973.860€ -64.952.425€ -79.363.386€ -95.221.781€
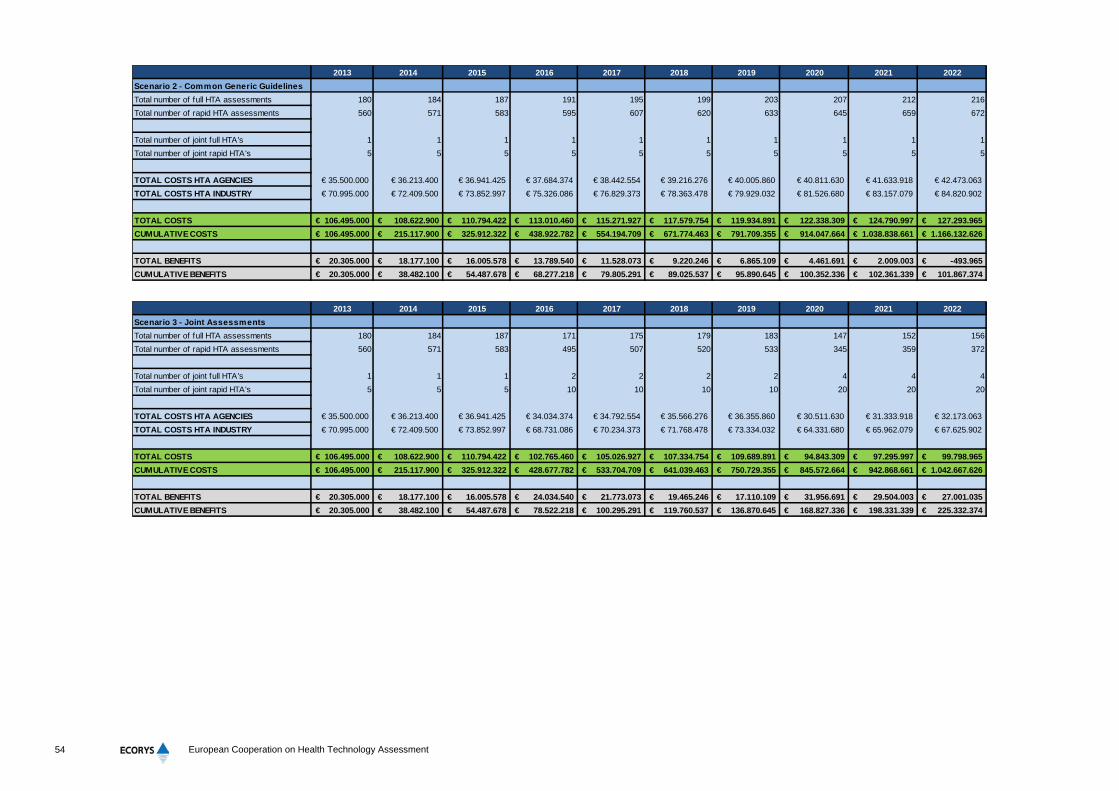
54
European Cooperation on Health Technology Assessment
2013 2014 2015 2016 2017 2018 2019 2020 2021 2022Scenario 2 - Common Generic GuidelinesTotal number of full HTA assessments 180 184 187 191 195 199 203 207 212 216Total number of rapid HTA assessments 560 571 583 595 607 620 633 645 659 672
Total number of joint full HTA's 1 1 1 1 1 1 1 1 1 1Total number of joint rapid HTA's 5 5 5 5 5 5 5 5 5 5
TOTAL COSTS HTA AGENCIES € 35.500.000 € 36.213.400 € 36.941.425 € 37.684.374 € 38.442.554 € 39.216.276 € 40.005.860 € 40.811.630 € 41.633.918 € 42.473.063TOTAL COSTS HTA INDUSTRY € 70.995.000 € 72.409.500 € 73.852.997 € 75.326.086 € 76.829.373 € 78.363.478 € 79.929.032 € 81.526.680 € 83.157.079 € 84.820.902
TOTAL COSTS 106.495.000€ 108.622.900€ 110.794.422€ 113.010.460€ 115.271.927€ 117.579.754€ 119.934.891€ 122.338.309€ 124.790.997€ 127.293.965€ CUMULATIVE COSTS 106.495.000€ 215.117.900€ 325.912.322€ 438.922.782€ 554.194.709€ 671.774.463€ 791.709.355€ 914.047.664€ 1.038.838.661€ 1.166.132.626€
TOTAL BENEFITS 20.305.000€ 18.177.100€ 16.005.578€ 13.789.540€ 11.528.073€ 9.220.246€ 6.865.109€ 4.461.691€ 2.009.003€ -493.965€ CUMULATIVE BENEFITS 20.305.000€ 38.482.100€ 54.487.678€ 68.277.218€ 79.805.291€ 89.025.537€ 95.890.645€ 100.352.336€ 102.361.339€ 101.867.374€
2013 2014 2015 2016 2017 2018 2019 2020 2021 2022Scenario 3 - Joint AssessmentsTotal number of full HTA assessments 180 184 187 171 175 179 183 147 152 156Total number of rapid HTA assessments 560 571 583 495 507 520 533 345 359 372
Total number of joint full HTA's 1 1 1 2 2 2 2 4 4 4Total number of joint rapid HTA's 5 5 5 10 10 10 10 20 20 20
TOTAL COSTS HTA AGENCIES € 35.500.000 € 36.213.400 € 36.941.425 € 34.034.374 € 34.792.554 € 35.566.276 € 36.355.860 € 30.511.630 € 31.333.918 € 32.173.063TOTAL COSTS HTA INDUSTRY € 70.995.000 € 72.409.500 € 73.852.997 € 68.731.086 € 70.234.373 € 71.768.478 € 73.334.032 € 64.331.680 € 65.962.079 € 67.625.902
TOTAL COSTS 106.495.000€ 108.622.900€ 110.794.422€ 102.765.460€ 105.026.927€ 107.334.754€ 109.689.891€ 94.843.309€ 97.295.997€ 99.798.965€ CUMULATIVE COSTS 106.495.000€ 215.117.900€ 325.912.322€ 428.677.782€ 533.704.709€ 641.039.463€ 750.729.355€ 845.572.664€ 942.868.661€ 1.042.667.626€
TOTAL BENEFITS 20.305.000€ 18.177.100€ 16.005.578€ 24.034.540€ 21.773.073€ 19.465.246€ 17.110.109€ 31.956.691€ 29.504.003€ 27.001.035€ CUMULATIVE BENEFITS 20.305.000€ 38.482.100€ 54.487.678€ 78.522.218€ 100.295.291€ 119.760.537€ 136.870.645€ 168.827.336€ 198.331.339€ 225.332.374€

55
European Cooperation on Health Technology Assessment
Table 5: HTA production and average cost per HTA product
2013 2014 2015 2016 2017 2018 2019 2020 2021 2022Baseline scenario - Completion JA1Baseline: full HTA reports 180 180 180 180 180 180 180 180 180 180Baseline: rapid HTA reports 560 560 560 560 560 560 560 560 560 560Baseline 171.351€ 171.351€ 171.351€ 171.351€ 171.351€ 171.351€ 171.351€ 171.351€ 171.351€ 171.351€
Scenario 1 - ICT PlatformTotal number of full HTA assessments 180 182 184 186 188 190 192 194 196 198Total number of rapid assessments 560 566 572 578 584 590 596 602 609 615Total number of full HTA joint national reports 7 7 7 7 7 7 7 7 7 7Total number of rapid joint national reports 10 10 10 10 10 10 10 10 10 10Scenario 1: full HTA reports 187 189 191 193 195 197 199 201 203 205Scenario 1: rapid HTA reports 570 576 582 588 594 600 606 612 619 625Scenario 1 171.942€ 171.936€ 171.930€ 171.924€ 171.918€ 171.912€ 171.907€ 171.901€ 171.896€ 171.890€
Scenario 2 - Common Generic GuidelinesTotal number of full HTA assessments 180 184 187 191 195 199 203 207 212 216Total number of rapid assessments 560 571 583 595 607 620 633 645 659 672Total number of full HTA joint national reports 7 7 7 7 7 7 7 7 7 7Total number of rapid joint national reports 10 10 10 10 10 10 10 10 10 10Scenario 2: full HTA reports 187 191 194 198 202 206 210 214 219 223Scenario 2: rapid HTA reports 570 581 593 605 617 630 643 655 669 682Scenario 2 140.680€ 140.672€ 140.664€ 140.657€ 140.649€ 140.642€ 140.634€ 140.627€ 140.620€ 140.613€
Scenario 3 - Joint AssessmentsTotal number of full HTA assessments 180 184 187 171 175 179 183 147 152 156Total number of rapid HTA assessments 560 571 583 495 507 520 533 345 359 372Total number of full HTA joint national reports 7 7 7 20 20 20 20 60 60 60Total number of rapid joint national reports 10 10 10 100 100 100 100 300 300 300Scenario 3: full HTA reports 187 191 194 191 195 199 203 207 212 216Sceanrio 3: rapid HTA reports 570 581 593 595 607 620 633 645 659 672Scenario 3 140.680€ 140.672€ 140.664€ 130.670€ 130.863€ 131.052€ 131.237€ 111.195€ 111.779€ 112.351€

56
European Cooperation on Health Technology Assessment
Table 6: General overview of the net benefits

57
European Cooperation on Health Technology Assessment
Annex 2: List of interviewees
Table A.2.1 Overview of interviewed key stakeholders
Nr. Stakeholder Type of
interview
Method of
interview
1 NBoH, National Board of Health, EUnetHTA secretariat, Denmark Orientating Telephone
2 HTAi Secretariat, Canada In-depth Telephone
3 KCE, Belgium In-depth Face-to-face
4 HAS, Haute Autorité de santé, France In-depth Telephone
5 CVZ, College voor zorgverzekeringen, the Netherlands In-depth Face-to-face
6 NBoH, National Board of Health, EUnetHTA secretariat, Denmark In-depth Face-to-face
7 NICE, National Institute for Health and Clinical Excellence, UK In-depth Telephone
8 THL/FinOHTA, Finnish Office for HTA, Finland In-depth Telephone
9 AHTAPOL, Poland In-depth Face-to-face
10 AGE.NA.S, Italy In-depth Face-to-face
11 EPF, European Patient Forum, Belgium In-depth Telephone
12 HOPE, European hospital and healthcare federation, Belgium In-depth Telephone
13 EUCOMED, medical technology association in Europe, Belgium In-depth Face-to-face
14 EFPIA - EU pharmaceutical association, Belgium In-depth Face-to-face
15 SBU, INAHTA Secretariat, Sweden In-depth Telephone
16 DIMDI, Germany In-depth Telephone
17 EMA, Belgium In-depth Telephone
18 Czech Ministry of Health, Czech Republic In-depth Telephone
19 GYEMSZI, Hungary In-depth Telephone
20 VASPVT/ State Health Care Accreditation Agency, Lithuania In-depth Telephone
21 SLOVAHTA/ Slovak Agency for Health Technology Assessment,
Slovak Republic
In-depth Telephone
22 ISC III/ Instituto De Salud Carlos III, Spain In-depth Telephone
23 DG Sanco, Sanco D, DDG1.D Health systems and products In-depth Face-to-face
24 Joint Research Centre Broken off due to
too limited
knowledge on the
subject
Telephone

58
European Cooperation on Health Technology Assessment
Topic guide
Interview guide Economic and governance analysis for the set-up of a permanent secretariat for future cooperation in the field of Health technology assessment (HTA).
The Executive Agency for Health and Consumers (EAHC) asks for an economic and governance analysis
on alternative solutions for the set-up of a permanent secretariat for future cooperation in the field of HTA,
taking into account possible synergies and costs for the Commission, Member States and other
stakeholders.
This study is in preparation of the action stated in Article 15 of Directive 2011/24/EU of the European
Parliament and of the Council of 9 March 2011 on the application of patients’ rights in cross-border health
care a permanent network on HTA in the EU is foreseen by the end of 2013.
Background In 2006, the European Union and Member States established the EUnetHTA project as an answer to the need for a sustainable European HTA network. The aims of European cooperation on HTA are to reduce duplication of research effort, effective use of resources, increase the impact of HTA in decision-making in Member States and the EU, strengthen the relation between HTA and healthcare policy making, and support countries with minimal HTA experience. EUnetHTA, coordinated the efforts of 29 European countries, including 25 Member States of the European Union, in evaluating health technology in Europe. EUnetHTA’s Secretariat is the executive body acting under the supervision of the Executive Committee and assisting the Executive Committee in implementing the policy decisions. The EUnetHTA Collaboration joined forces in 2009 with other partners in the EU Member States and the European Commission to implement the results of the EUnetHTA project and the Pharmaceutical Forum through a Joint Action on HTA 2010-2012 (EUnetHTA JA). The work of EUnetHTA JA is focused on the development of methods and tools aiming to harmonise practices of conducting and reporting on HTA. Some Member States have dedicated HTA agencies that perform HTAs on a regular basis, while other Member States are at the beginning of building capacity; therefore relying on centralised tools and support. The difference between the level of HTA activity in Member States have an impact on the level of cooperation within the HTA network. To support the effectiveness and efficiency of the HTA network a more permanent solution for the coordination of its activities should be found, with the overarching objective to put into practice an effective and sustainable HTA collaboration in Europe that brings added value at the European, national and regional level. This study The aim of the study is to provide a cost-benefit analysis (CBA) of alternative solutions for the set-up of a permanent secretariat for future cooperation in the field of HTA. More specifically, we will identify which solutions(s) will provide an optimal balance between synergies and costs. The focus lies on scientific (HTA production, coordination), financially and regulatory (horizontal) synergies and how to facilitate and secure the synergies by a certain type of hosting (see below). We will focus on European cooperation on HTA of pharmaceuticals and medical devices through a permanent secretariat. This means that assumptions have to be made with regard to the volume of work (i.e. scale and scope) of the secretariat. It is also important to take into account the relation to existing EU agencies (e.g. EAHC, EMA, ECDC).
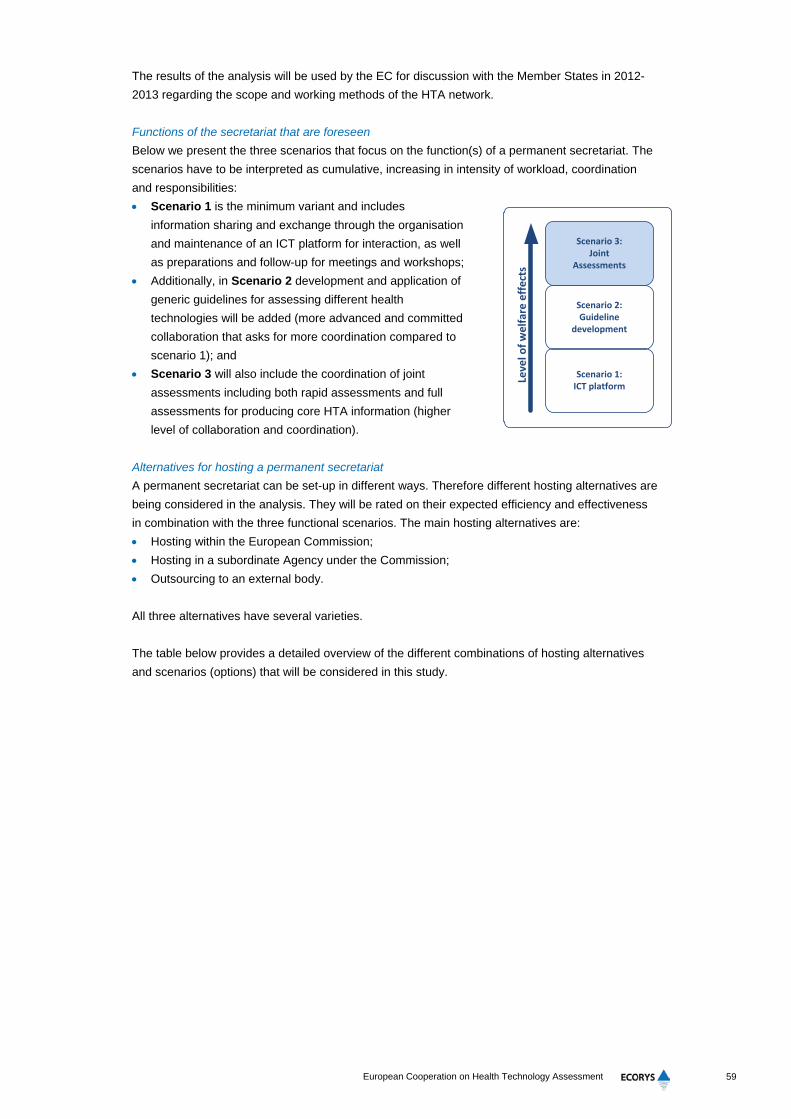
59
European Cooperation on Health Technology Assessment
The results of the analysis will be used by the EC for discussion with the Member States in 2012-2013 regarding the scope and working methods of the HTA network. Functions of the secretariat that are foreseen Below we present the three scenarios that focus on the function(s) of a permanent secretariat. The scenarios have to be interpreted as cumulative, increasing in intensity of workload, coordination and responsibilities: • Scenario 1 is the minimum variant and includes
information sharing and exchange through the organisation and maintenance of an ICT platform for interaction, as well as preparations and follow-up for meetings and workshops;
• Additionally, in Scenario 2 development and application of generic guidelines for assessing different health technologies will be added (more advanced and committed collaboration that asks for more coordination compared to scenario 1); and
• Scenario 3 will also include the coordination of joint assessments including both rapid assessments and full assessments for producing core HTA information (higher level of collaboration and coordination).
Alternatives for hosting a permanent secretariat A permanent secretariat can be set-up in different ways. Therefore different hosting alternatives are being considered in the analysis. They will be rated on their expected efficiency and effectiveness in combination with the three functional scenarios. The main hosting alternatives are: • Hosting within the European Commission; • Hosting in a subordinate Agency under the Commission; • Outsourcing to an external body. All three alternatives have several varieties. The table below provides a detailed overview of the different combinations of hosting alternatives and scenarios (options) that will be considered in this study.
Scenario 1: ICT platform
Leve
l of w
elfa
re e
ffect
s
Scenario 2: Guideline
development
Scenario 3: Joint
Assessments

60
European Cooperation on Health Technology Assessment
Table A.2.2 Overview of possible scenarios and hosting alternatives
Hosting
alternatives
Scenario 1:
developing and
maintaining an
ICT platform
Scenario 2:
development of
common
generic
guidelines
Scenario 3:
coordinated/joint
assessment
1 Hosting
within the
Commission
c. DG Sanco, unit D2
(healthcare systems);
Option 1.1.a
(A)
Option 2.1.a
(H) Option 3.1.a
(O) d. Joint Research Centre. Option 1.1.b
(B)
Option 2.1.b
(I) Option 3.1.b
(P) 2 Hosting in a
subordinate
Agency
under the
Commission
c. HTA integrated in
existing subordinate
Agency under DG
Sanco (e.g. EAHC10,
EMA, ECDC);
Option 1.2.a
(C)
Option 2.2.a
(J) Option 3.2.a
(Q)
d. integrated health
products agency
(similar to FDA11 in the
US).
Option 1.2.c
(D)
Option 2.2.c
(K) Option 3.2.c
(R)
3 Outsourcing
to an
external
body (e.g. by
a rotating
hosting by
HTA
agencies)
d. permanent secretariat
of EUnetHTA JA1 at
one HTA agency of the
EUnetHTA network;
Option 1.3.a
(E)
Option 2.3.a
(L) Option 3.3.a
(S)
e. by a rotating hosting by
HTA agencies (such as
in use by INAHTA12);
Option 1.3.b
(F)
Option 2.3.b
(M) Option 3.3.b
(T)
f. separate (scientific)
body outside the HTA
network.
Option 1.3.c
(G)
Option 2.3.c
(N)
Option 3.3.c
(U)
10 Executive Agency for Health and Consumers. 11 Food and Drug Administration. 12 International Network of Agencies for Health Technology Assessment.

61
European Cooperation on Health Technology Assessment
Questions
Introduction: 1. Can you give a brief introduction on your organisation, and your specific role within the
organisation? Current involvement in HTA: 2. Can you elaborate on how your organisation is involved in HTA on regional/national, EU and/or
international level? 3. How does HTA in general, support your organisation in its work? 4. Is your organisation involved in EUnetHTA?
a. If yes, has your organisation been involved in the implementation of Joint Action 1 and/or Joint Action 2? If yes, can you elaborate on how your organisation is involved?
5. Is your organisation ‘producing’ or using HTA information? 6. If your organisation has certain activities concerning the production or use of HTA activities,
what are the costs of these HTA activities? a. If your organisation is involved in EUnetHTA, what are the costs related to the involvement
of your organisation. 7. (If financed by EUnetHTA/EC): Is the budgeting for these activities sufficient? Cooperation on HTA in Europe: 8. What are the main benefits of cooperation on HTA in Europe, both for your organisation as well
as for other stakeholders? 9. What are the main bottlenecks regarding cooperation in HTA in Europe, both for your
organisation as well as for other stakeholders? 10. What are the opportunities to be explored regarding cooperation in HTA in Europe, both for your
organisation as well as for other stakeholders? 11. What should be changed in order to improve cooperation in HTA in Europe, both for your
organisation as well as for other stakeholders? General questions on scenario’s: 12. Do you have a preference concerning the described scenarios? Why? 13. Which scenarios do you expect to be most efficient in terms of costs? 14. Which scenarios do you expect to be best in terms of benefits? 15. What are the main bottlenecks to realise each scenario? General questions on hosting alternatives: 16. Do you have a preference concerning the hosting alternatives? Why? 17. What hosting alternative do you expect to be most efficient in terms of costs? For whom? 18. What hosting alternative do you expect to be best in terms of benefits, such as……? And for
Whom? 19. What are the bottlenecks to realise each hosting alternative?

Sound analysis, inspiring ideas
BELGIUM – BULGARIA – HUNGARY – INDIA – THE NETHERLANDS – POLAND – RUSSIAN FEDERATION – SOUTH AFRICA – SPAIN – TURKEY – UNITED KINGDOM
P.O. Box 4175
3006 AD Rotterdam
The Netherlands
Watermanweg 44
3067 GG Rotterdam
The Netherlands
T +31 (0)10 453 88 00
F +31 (0)10 453 07 68
W www.ecorys.nl