Embed Size (px)
Citation preview

european automobile
manufacturers association

p u b l i s h e d b y
ACEA Communications department Please order your personal copy via [email protected]
s t a t i s t i c s c o m p i l e d b y
Quynh-Nhu HuyNH, Director Economics & Statistics Please direct enquiries to [email protected]
This paper is made in an environmentally-friendly way and according to FSC certification© A C E A _ s E p t E m b E r 2 0 1 3
1
the automobile industry pocket guide
With the latest data on vehicle production, registration, use and taxation, as well as employment and trade, ACEA’s Automobile Industry Pocket Guide provides a map of the European automobile industry today.
As the key figures of this sixth edition clearly show, the automobile industry is the engine of Europe - in terms of its skilled workforce, levels of investment in research and development, the size of its manufacturing base, as well as its trade and tax contributions.
Today, however, the industry stands at a critical juncture, with the economic crisis having taken a harsh toll. Since the 2007 peak, vehicle registrations have shrunk by a quarter - down 4.4 million vehicles.Despite this difficult context, the automotive industry is ready to meet the challenges ahead. It is also ready to support Europe in its ‘mission growth’ of boosting industry’s share of EU GDP to 20% by 2020.In order to be able to adapt to changing demands, our sector requires a robust industrial policy. It needs
a supportive regulatory framework that will foster competitiveness, ultimately stimulating growth, jobs and investment - thereby benefiting the European economy as a whole.
Erik Jonnaert ACEA Secretary General
Foreword

ACEA
ABOUT ACEA

ACEA
the automobile industry pocket guide
5
Members and partnersThe European Automobile Manufacturers’ Association (ACEA) represents the fifteen Europe-based car, van, truck and bus makers: BMW Group, Daimler, DAF, Fiat, Ford of Europe, General Motors Europe, Hyundai Motor Europe, Iveco, Jaguar Land Rover, PSA Peugeot Citroën, Renault, Toyota Motor Europe, Volkswagen Group, Volvo Cars, Volvo Group.
ACEA has permanent cooperation with the European Council for Automotive R&D (EUCAR), which is the industry body for collaborative research and development. ACEA has close relations with 29 national automobile manufacturers’ associations in Europe and maintains a dialogue on international issues with automobile associations around the world. It also works with a variety of institutional, non-governmental, research and civil society partners as well as with a number of industry associations with related interests.
ACEA represents Europe’s car, van, truck and bus makers

6
acea
ACEA’s mission is to: define and voice the common interests, policies and positions of the European automobile industry;
engage in dialogue with the European institutions and other stakeholders in order to advance understanding of industry-related issues, and to contribute to effective legislation;
act as a portal for specialist knowledge on vehicle-related regulation;
communicate the role and importance of the industry, using reliable data and information;
monitor activities that influence the automobile industry, cooperating with the actors involved;
undertake strategic reflection on the increasingly global challenges of sustainability and competitiveness.
The automotive industry is one of the most regulated sectors in Europe. This legislative framework consists of around 80 EU Directives and over 70 international UNECE regulatory agreements, mostly covering technical issues and standardisation. Through its member companies, ACEA taps into a wealth of technical, regulatory and practical expertise in the following priority fields:– Environment and sustainability– Competitiveness, market and economy– International trade– Research and innovation– Safety– Transport policy
ACEA’s mission and priorities

ACEA
the automobile industry pocket guide
7
The ACEA Board of Directors is composed of the CEOs of its member companies. Additionally, a Commercial Vehicle Board of Directors addresses the specific issues facing the commercial vehicle manufacturers that ACEA represents: DAF Trucks, Daimler Trucks, Iveco, MAN Truck & Bus, Scania, Volkswagen Commercial Vehicles and Volvo Group.
The day-to-day work of the ACEA secretariat is overseen by the Secretary General, who ensures that the Board of Directors’ priorities are addressed. Technical expertise and advisory input come from working groups on topics as diverse as emissions, road and vehicle safety, general transport policy and regulatory compliance. These specialist working groups are made up of experts from the member companies and are chaired by ACEA staff.
How ACEA works

8
acea
Secretary GeneralIvan Hodac Erik Jonnaert (as from 1 October 2013)
Emissions & Fuels DirectorPaul Greening
Environmental Policy DirectorPeter Kunze
Legal & Taxation DirectorMarc Greven
Mobility & Sustainable Transport DirectorPetr Dolejsi
Parliamentary Affairs Director
Céline Domecq
Regulatory Affairs DirectorEskil Sturesson
Safety DirectorGianfranco Burzio
Statistics & Economics DirectorQuynh-Nhu Huynh
Technical Affairs DirectorErwin Kirschner
Trade & Economics DirectorErik Bergelin
Trade AdviserMáté Kander
Transport Policy DirectorFuensanta Martinez-Sans
Communications DirectorCara McLaughlin
Communications Manager Charles de Lusignan
Information Technology Director Marc Vanderstraeten
Finance & Administration DirectorTanguy De Decker
ACEA Tokyo OfficeAnthony Millington +81 3 350 563 [email protected]
ACEA Beijing Office Dominik Declercq +86 10 6463 [email protected]
ACEA Avenue des Nerviens 85B-1040 Brussels+32 2 732 55 [email protected]
ACEA secretariat

ACEA
the automobile industry pocket guide
9
BMW AGPetuelring 130D – 80788 MunichT. +49 89 3820www.bmwgroup.com
DAF TRUCKS NVHugo van der Goeslaan 1 NL – 5643 PT EindhovenT. + 31 40 214 9111www.daftrucks.com
DAIMLER AGD – 70546 StuttgartT. +49 711 170www.daimler.com
FIAT SpAVia Nizza 250I – 10126 TurinT. +39 011 003 11 11www.fiatspa.com
FORD OF EUROPE GmbHHenry Fordstrasse 1D – 50725 CologneT. +49 221 900www.ford.com
GENERAL MOTORS EUROPE AGADAM OPEL AGBahnhofsplatz D – 65423 RüsselsheimT. +49 6142 770www.gm.com
ACEA members

10
acea
HYUNDAI MOTOR EUROPE GmbH Kaiserleipromenade 5D – 63067 Offenbach am MainT. +49 69 271 4720www.hyundai-europe.com
IVECO SpAVia Puglia 35I – 10156 TurinT. +39 011 006 11 11www.iveco.com
JAGUAR LAND ROVERBanbury RoadGaydonUK – Warwick CV35 ORRT. +44 19 2664 1111www.jaguarlandrover.com
PSA PEUGEOT CITROËNAvenue de la Grande Armée 75F – 75116 Paris CedexT. +33 1 40 66 55 11www.psa-peugeot-citroen.com
RENAULT SAQuai Alphonse Le Gallo 13-15F – 92109 Boulogne-Billancourt T. +33 1 41 04 50 50www.renault.com
TOYOTA MOTOR EUROPE SAAvenue du Bourget 60B – 1140 BrusselsT. +32 2 745 21 11www.toyota.eu
VOLKSWAGEN AGBerliner Ring 2D – 38436 WolfsburgT. +49 536 190www.volkswagenag.com
VOLVO CAR CORPORATIONS – 405 31 GothenburgT. +46 31 59 00 00www.volvocars.com
AB VOLVOS – 405 08 GothenburgT. +46 31 66 51 70www.volvogroup.com
MAN Truck & Bus AG(Commercial Vehicle Board member)Postfach 50 06 20D – 80995 MunichT. +49 891 580 01www.mantruckandbus.com
SCANIA AB(Commercial Vehicle Board member)S – 151 87 SodertaljeT. +46 8 55 38 10 00www.scania.com

ACEA
the automobile industry pocket guide
11
BMW Group Representative OfficeBoulevard de Waterloo 25B –1000 BrusselsT. +32 2 737 50 30
Daimler EU Corporate Representation Rue Froissart 133B –1040 BrusselsT. +32 2 233 11 45
Fiat Delegation to EuropeRue Jules Cockx 12AB –1160 BrusselsT. +32 2 513 63 92
Ford Motor Company EU AffairsRue Montoyer 40 B7B –1000 BrusselsT. +32 2 761 06 11
GM Europe Public Policy & Government RelationsRue d’Idalie 11-13B –1050 BrusselsT. +32 2 773 69 81
Brussels ACEA member representations
Hyundai Motor Group Brussels OfficeRue de la Loi 227B –1040 BrusselsT. +32 2 205 03 60
Iveco Delegation to EuropeA. Gossetlaan 28A B3B-1702 Groot-BijgaardenT. +32 2 467 12 11
Jaguar Land Rover Brussels OfficeRue Abbé Cuypers 3B –1040 BrusselsT. +32 2 741 24 60

12
acea
PSA Peugeot Citroën EU DelegationAvenue des Arts 53B –1000 BrusselsT. +32 2 545 11 79
Renault European AffairsAvenue des Arts 40B –1040 BrusselsT. +32 2 274 10 00
Toyota Motor EuropeAvenue du Bourget 60B –1140 BrusselsT. +32 2 745 33 13
Volkswagen Group EU Representation Rue Archimède 25B –1000 BrusselsT. +32 2 645 49 53
Volvo Car CorporationBrussels Office EU AffairsRue du Luxembourg 3B –1000 BrusselsT. +32 2 503 69 67
Volvo Group EU RepresentationRue du Luxembourg 3B –1000 BrusselsT. +32 2 482 58 70
MAN Truck & Bus Brussels Office(Commercial Vehicle Board member)Rue Jacques de Lalaing 4B –1040 BrusselsT. +32 2 230 41 95
Scania EU Representation(Commercial Vehicle Board member)c/o Kreab Gavin AndersonAvenue de Tervueren 2B –1040 BrusselsT. +32 2 737 69 02

ACEA
the automobile industry pocket guide
13
_a u s t r i a
FFOEAutomobile Industry Association of AustriaWiedner Hauptstrasse 63A–1045 ViennaT. +43 5 90 900 48 00F. +43 5 90 900 289www.wk.or.at/fahrzeuge
_b e l g i u m
FEBIACBelgian Federation of Automobile & Motorcycle Industries Boulevard de la Woluwe 46 B6B–1200 BrusselsT. +32 2 778 64 00F. +32 2 762 81 71www.febiac.be
_b u l g a r i a
ACMAssociation of Car Manufacturers and their Authorised Representatives for BulgariaVeliko Tarnovo Street 37BG–1504 SofiaT. +359 2 946 12 50F. +359 2 94 33 944www.svab.bg
_c y p r u s
OEBEmployers & Industrialists FederationAcropoleos Avenue 2 & Glafkou StreetPoBox 21657 CY–1511 NicosiaT. +357 22 66 51 02F. +357 22 66 94 59http://en.oeb.org.cy
_c z e c h r e p u b l i c
AIA CR (SAP)Automotive Industry Association of the CROpletalova 55CZ–110 00 Prague 1T. +420 221 602 982F. +420 224 239 690www.autosap.cz
_d e n m a r k
DBIDanish Car Importers AssociationRådhuspladsen 16DK–1550 Copenhagen VT. +45 39 16 23 23F. +45 39 16 24 24www.bilimp.dk
ACEA associated organisations

14
acea
_e s t o n i a
AMTELUnion of Estonian Car Sales and Service EnterprisesPärnu Road 232EST–11314 TallinnT. +372 672 23 08F. +372 650 21 97www.amtel.ee
_ f i n l a n d
AUTOTUOJAT RYAssociation of Automobile Importers in FinlandAteneuminkuja 2 C FIN– 00100 HelsinkiT. +358 207 928 850F. +358 207 928 859www.autotuojat.fi
_ f r a n c e
CCFAFrench Automobile Manufacturers’ AssociationRue de Presbourg 2F–75008 ParisT. +33 1 49 52 51 00F. +33 1 49 52 51 88www.ccfa.fr
_g e r m a n y
VDAGerman Association of the Automotive IndustryBehrenstrasse 35D –10117 BerlinT. +49 30 897 8420F. +49 30 897 842 600www.vda.de
_g r e e c e
AMVIR (SEAA)Association of Motor Vehicle Importers’ RepresentativesKifisias Avenue 296GR–152 32 Chalandri – AthensT. +30 210 689 1400 F. +30 210 685 9 022www.seaa.gr
_h u n g a ry
AHAI (MGSZ)Association of the Hungarian Automotive IndustryThán Károly u. 3– 5H–1119 BudapestT. +36 1 382 9805F. +36 1 382 9810www.gepjarmuipar.hu

ACEA
the automobile industry pocket guide
15
_ i r e l a n d
SIMISociety of the Irish Motor IndustryUpper Pembroke Street 5IRL– Dublin 2T. +353 1 676 16 90F. +353 1 661 92 13www.simi.ie
_ i ta ly
ANFIAItalian Association of the Automobile IndustryCorso Galileo Ferraris 61I – 10128 TurinT. +39 011 554 65 11F. +39 011 545 986www.anfia.it
_l at v i a
AUTO ASOCIĀCIJASAutomotive AssociationVangažu Street 5LV–1024 RigaT. +371 6 752 99 79F. +371 6 754 03 15www.lpaa.lv
_l i t h u a n i a
LAALithuanian Autoenterpreneurs’ AssociationP. Žadeikos g. 1bLT– 06319 VilniusT. +370 5 230 12 24F. +370 5 230 12 25www.laa.lt
_m a lta
ACIMAssociation of Car Importers MaltaPoBox 50 Valletta Building MT– Sint GwannT. +356 21 38 57 74 F. +356 21 22 33 06
_t h e n e t h e r l a n d s
RAIMotorcycle & Automobile Industry AssociationKoningin Wilhelminaplein 30 PoBox 74800NL–1062 KR AmsterdamT. + 31 20 504 49 49F. +31 20 646 38 57www.raivereniging.nl

16
acea
_n o r way
BILAutomobile Importers’ AssociationØkernveien 99PoBox 71 ØkernN– 0508 OsloT. +47 22 64 64 55F. +47 22 64 85 95www.bilimportorene.no
_p o l a n d
PZPMPolish Automotive Industry AssociationAl. Niepodległości 69 PL– 02– 626 WarsawT. +48 22 322 71 98F. +48 22 322 76 65www.pzpm.org.pl
_p o rt u g a l
ACAPAutomobile Association of PortugalAvenida Torre de Belém 29P –1400– 342 LisbonT. +351 21 303 53 00F. +351 21 302 14 74www.acap.pt
_r o m a n i a
ACAROMAutomobile Manufacturers’ Association of RomaniaStr. Banu Mãrãcine – Bl. D5RO –110194 PitestiT. +40 248 211 245F. +40 248 217 990www.acarom.ro
_s l o v e n i a
ADSAssociation of Automobile Manufacturers and Authorised Importersc/o Chamber of Commerce & Industry of SloveniaDimiceva 13SI – 1000 LjubljanaT. +386 1 58 98 217F. +386 1 58 98 219www.ads– slo.org
_s l o va k r e p u b l i c
ZAP SRAutomotive Industry Association SRTomášikova 26SK – 821 01 Bratislava T. +421 2 4364 2235F. +421 2 4364 2237www.zapsr.sk
ACEA
the automobile industry pocket guide
17
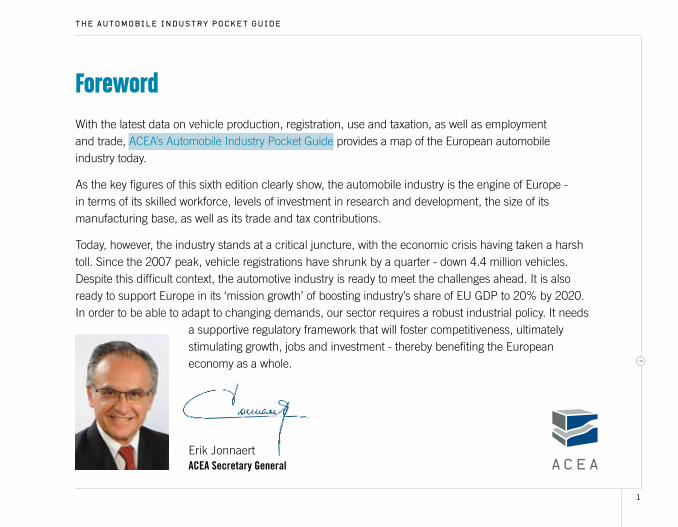
_s w i t z e r l a n d
AUTO-SUISSE Automobile Association of Swiss ImportersMittelstrasse 32Postfach 5232 CH – 3001 BernT. +41 31 306 65 65F. +41 31 306 65 50www.auto-suisse.chwww.auto-schweiz.ch
_t u r k e y
OSDAutomotive Manufacturers’ AssociationAtilla Sokak 10 AltunizadeTR– 34676 IstanbulT. +90 216 318 29 94F. +90 216 321 94 97www.osd.org.tr
_s pa i n
ANFACSpanish Association of Car & Truck ManufacturersIberia Mart II BuildingCalle Orense 34E – 28020 MadridT. +34 91 343 13 45F. +34 91 343 13 77www.anfac.com
_s w e d e n
BIL SwedenSwedish Association of Automobile Manufacturers & Importers Box 26173 – Storgatan 19S – 100 41 StockholmT. +46 8 700 41 00 F. +46 8 791 23 11www.bilsweden.se
_u n i t e d k i n g d o m
SMMTSociety of Motor Manufacturers and Traders Great Peter Street 71UK – London SW1P 2BNT. +44 207 235 70 00F. +44 207 235 71 12 www.smmt.co.uk

18
acea
The European Council for Automotive R&D (EUCAR) is the collaborative research organisation of the major automobile manufacturers in Europe, with the mission to strengthen the competitiveness of the manufacturers through strategic collaborative research and innovation.
Together with its members, EUCAR drives the strategy and assessment of collaborative automotive research and innovation, and establishes common work with the European Commission, member states and other key stakeholders. These activities facilitate the participation of EUCAR’s members in high-quality projects with industrially-relevant results. Projects are mainly financed through the EU Framework Programmes for research and innovation, matched with industry funding.
EUCAR’s activities also cover commercial vehicle research and development.
EUCAR collaborative research is focused on the following domains: Sustainable propulsion Safe and integrated mobility Affordability and competitiveness
EUCAR is governed by its Council, composed of the heads of the research and advanced development divisions of the member companies. EUCAR’s Chairman is nominated annually from the Council on a rotating basis.
The EUCAR Office is composed of:Simon Godwin
Alessandro [email protected]
Research Coordinator
Assistant to Chairman and [email protected]
EUCAR members are:
BMW, DAF, Daimler, Fiat, Ford Europe, GM/Opel,
Jaguar Land Rover, Porsche, PSA Peugeot Citroën, Renault,
Scania, Volkswagen, Volvo Cars and Volvo Group.

KEy
Figu
rEs
KEY FIGURES

21
Key
figur
es
the automobile industry pocket guide
The automobileindustry:the engineof Europe
Many of our essential public services - such as postal, waste and emergency services - are delivered by cars, trucks and vans.
The automotive sector is the EU’s largest investor in R&D, accounting for 25% of total R&D spending.
The EU auto industry invests over €32 billion into R&D and applies for 9,500 patents per year.
Cars and buses offer freedom and mobility for all, providing us with direct access to education, health and employment.
12.9 million people work in the sector – representing 5.3% of the EU employed population.
The 3 million high-skilled jobs in automotive manufacturing represent 10% of the EU’s manufacturing employment.
Trucks and vans deliver the goods and services we take for granted in our daily lives, carrying 75% of freight transported over land and delivering 18 billion tonnes of goods per year.
22
key figures
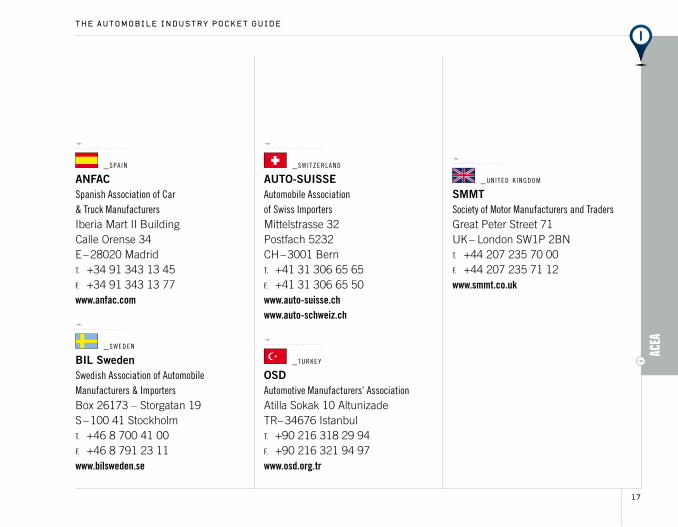
Motor vehicles account for over €385 billion in tax contribution in just 14 EU countries - a vital source of government revenue.
Vehicle manufacturing is a strategic industry in the EU, where 16.2 million cars, vans, trucks and buses are manufactured.
ACEA’s members operate 208 vehicle assembly and production plants in 22 countries across Europe.
The €839 billion turnover generated by the automotive sector represents 6.9% of EU GDP. The automobile industry has ripple effects throughout the economy, supporting a vast supply chain and generating an array of business services.
The European auto industry is a global player, delivering 6.6 million ‘Made in Europe’ vehicles around the world, and bringing in a €92 billion trade surplus.
Europe’s cars, vans, trucks and buses are the cleanest, safest and quietest in the world.
Europe leads the way in clean production, with decreasing quantities of water and energy used to manufacture a vehicle, and much less CO2 and waste produced in the process.

23
Key
figur
es
the automobile industry pocket guide
Driving sustainable mobility...
Europe’s cars, vans, trucks and buses are the cleanest, safest and quietest in the world.
Europe leads the way in clean production, with decreasing quantities of water and energy used to manufacture a vehicle, and much less CO2 and waste being produced in the process.
Over the past 30 years, safety technologies have helped halve the number of road deaths, despite a three-fold increase in traffic.
One car in the 1970s produced as many pollutant emissions as 100 cars today.
The average car engine emits 28 times less carbon monoxide than 20 years ago.
In 2012, 71% of new cars emitted less than 140g of CO2 per kilometre, and more than half of those less than 120g.
An average new car today consumes 15% less fuel per 100km than 10 years ago.
Noise from passenger cars has been reduced by 90% since 1970.
Pollutant emissions from trucks have been slashed to near-zero levels, down 98% since 1990.
Trucks’ fuel consumption - and therefore CO2 emissions - has decreased by over a third since 1970.
A modern truck needs just 1 litre of fuel to transport 1 tonne of goods over a distance of 100km.
25 of today’s trucks and buses are quieter than one built in 1980.

24
key figures
The automobile sector is the EU’s biggest investor in R&D
R&D shares of sectors of the main world regions | 2011
Source: The 2012 eU indUsTrial r&d invesTmenT scoreboard eUropean commission, jrc/dg rTd
eU
Us
japan
0% 10% 20% 30% 40% 50% 60% 70% 80% 90% 100%
pharmaceuticals & biotechnology Technology hardware & equipment automobiles & parts software & computer services
electronical equipment chemicals industrial engineering aerospace & defence
leisure goods general industrials other
15%
11%
23%
12%
11%
23%
25%
25% 4%
7%
3%
11%
16% 2%
5%
7%
3%
5%
3%
3%
5%
11%
4%
1
1
16%
5%
4%
23%
13%
13%

25
Key
figur
es
the automobile industry pocket guide
Patent applications filed by the automotive sector | 2012
Source: based on eUropean paTenT office daTa - 2013
21.6% japan
55.6% eU
14.8% Us
1.2% south Korea
1.9% switzerland
0.9% canada
0.8% china
0.8% Taiwan
2.4% others
Spurring innovation
In 2012,
a total of 9,541 patents
were filed by the automotive sector
at the European Patent Office

Empl
oym
Ent
EMPLOYMENT
26
key figures
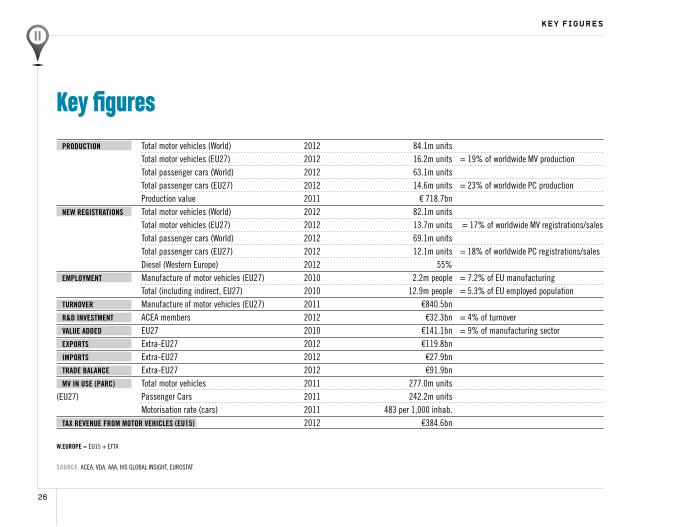
PRODUCTION Total motor vehicles (World) 2012 84.1m units Total motor vehicles (EU27) 2012 16.2m units = 19% of worldwide MV production Total passenger cars (World) 2012 63.1m units Total passenger cars (EU27) 2012 14.6m units = 23% of worldwide PC production Production value 2011 € 718.7bn NEW REGISTRATIONS Total motor vehicles (World) 2012 82.1m units Total motor vehicles (EU27) 2012 13.7m units = 17% of worldwide MV registrations/sales Total passenger cars (World) 2012 69.1m units Total passenger cars (EU27) 2012 12.1m units = 18% of worldwide PC registrations/sales Diesel (Western Europe) 2012 55% EMPLOYMENT Manufacture of motor vehicles (EU27) 2010 2.2m people = 7.2% of EU manufacturing Total (including indirect, EU27) 2010 12.9m people = 5.3% of EU employed population TURNOVER Manufacture of motor vehicles (EU27) 2011 €840.5bn R&D INVESTMENT ACEA members 2012 €32.3bn = 4% of turnover VALUE ADDED EU27 2010 €141.1bn = 9% of manufacturing sector ExPORTS Extra-EU27 2012 €119.8bn IMPORTS Extra-EU27 2012 €27.9bn TRADE BALANCE Extra-EU27 2012 €91.9bn MV IN USE (PARC) Total motor vehicles 2011 277.0m units (EU27) Passenger Cars 2011 242.2m units Motorisation rate (cars) 2011 483 per 1,000 inhab. TAx REVENUE FROM MOTOR VEHICLES (EU15) 2012 €384.6bn
SOURCE: ACEA, VDA, AAA, IHS GLoBAL InSIGHT, EURoSTAT
W.EUROPE = EU15 + EFTA
Key figures

Trad
eTa
xatio
n
EmploymEnt
29
Empl
oym
Ent
Total12.9m jobs
3.0m jobsmanufacturing
10.7m jobsindirect
Automobile sector: direct and indirect* employment
The automotive industry generates 12.9 million jobs in the EUSo
urce
: Bas
ed o
n eu
rost
at m
ost
rece
nt d
ata
avai
laBl
e - 2
010
2.2m jobsdirect
0.8m jobsindirect
4.3m jobs
4.8m jobs
0.7m jobs
9.9m jobsnon-manufacturing
AuToMoTIVe INDuSTrY (ProDucTIoN oPerATIoNS)
› automobile manufacturing (nace c291)› coachwork, trailers, caravans (nace c292)› equipment and accessories (nace c293)
oTHer MANuFAcTurING AcTIVITIeS
› manufacture, retreading and rebuilding of rubber tyres and tubes (nace c2211)› manufacture of bearings, gears, gearing and driving elements (nace c2815)› manufacture of cooling and ventilation equipment (nace c2825)› manufacture of computers and other information processing equipment (nace c262)› manufacture of electric motors, generators and transformers (nace c2711)
AuToMoBILe uSe
› sale of motor vehicles (nace g451)› maintenance and repair of motor vehicles (nace g452)› sale of motor vehicle parts and accessories (nace g453)› retail sale of automotive fuel (nace g473)› renting and leasing of motor vehicles (nace n771)
TrANSPorT
› Passenger land transport (urban and suburban, taxi) (nace h493)› Freight transport by road (nace h4941)
coNSTrucTIoN
› construction of roads and motorways (nace f4211) › construction of bridges and tunnels (nace f4213)
* indirect employment data does not report employment in raw material sector (eg steel, aluminium, glass, etc), textile, driving schools, licensing activities, vehicle testing, vehicle insurance and financing, etc.

30
employment
Trends in automotive employment in the EU
12,000,000
14,000,000
16,000,000
0
2,000,000
4,000,000
6,000,000
8,000,000
10,000,000
units
2008 2009 2010
EU automobile employment – by year | 2008 – 2010
eMPLoYMeNT reLATeD To THe AuToMoTIVe SecTor 2008 2009 2010 % cHG 10/08
manufacturing direct 2,233,422 2,218,600 2,176,498 -2.5%
manufacturing indirect * 813,947 877,120 816,994 0.4%
automobile use 4,443,645 4,549,700 4,348,100 -2.2%
transport 5,111,300 4,816,500 4,818,900 -5.7%
construction 759,100 748,400 713,200 -6.0%
Total 13,361,414 13,210,320 12,873,692 -3.7%
manufacturing direct
manufacturing indirect*
automobile use
transport
construction
* indirect employment data does not report employment in raw material sector (eg steel, aluminium, glass, etc), textile, driving schools, licensing activities, vehicle testing, vehicle insurance and financing, etc.
Sour
ce: B
ased
on
euro
stat
mos
t re
cent
com
Preh
ensi
ve d
ata
avai
laBl
e - 2
010

Trad
eTa
xatio
n
EmploymEnt
31
Empl
oym
Ent
Total manufacturing employment in the EU (% share)
Source: Based on eurostat most recent data availaBle - 2010
Direct automotive employment (manufacturing) 2.2m people = 7.3% of total EU employment in manufacturing
Manufacturing employment related to the automotive sector 3.0m people = 10.0% of total EU employment in manufacturing
Total automotive employment (manufacturing, services* and construction) 12.9m people = 5.3% of EU employed population
EU27 total population in 2010 493.8m people
EU27 total employment in 2010 216.4m people
EU27 employed population in the manufacturing sector 30.0m people = 13.9% of total employed population
eu manufacturing employment non-automotive 30m 90.0%
Sour
ce: B
ased
on
euro
stat
dat
a - 2
010
10% of EU’s manufacturing employment is in the automotive sector
*in activities specified
direct automotive7.3% manufacturing employment 2.2m
indirect automotive2.7% manufacturing employment 0.8m

32
7
100
200
300
400
500
600
700
800
900
0
de Fr it uKesPl cZ se hu Be atPt si Fi dK
ieBG cYee lt lv
Direct automotive employment - by country | 2010
20293035516566
117136140141149171
225
749
0113341013
units - in thousands
Sour
ce: B
ased
on
euro
stat
dat
a 20
10 -
revi
sed
in 2
013
ro sK nl
A closer look at automotive employment
employment

Trad
eTa
xatio
n
EmploymEnt
33
Empl
oym
Ent
Employment* – by mode of transport in the EU (% share) | 2010
Postal and courier activities 17.0%
Warehousing and support activities 23.9%
railways 6.5%
air transport 3.8%
sea transport 1.7%
inland water transport 0.4%
Pipelines 0.2%
Passenger transport 18.5%
Feight transport28.0%
* employment in companies the main activity of which lies in the transport mode concerned
Sour
ce: B
ased
on
euro
stat
dat
a - 2
010
Road transport accounts for almost half of all transport-related jobs
road transport 46.5%

prod
uCti
on
PROdUCTION

Production
37
Prod
ucti
on
10,000,000
15,000,000
20,000,000
25,000,000
5,000,000
0
Sour
ce: o
ica
- 201
3
Passenger car production - international comparison (% share) | 2000 – 2012
Passenger car production - world | 2012
2000 2005 2010 2012
VoLuMe % SHAre
eu* 14,611,284 23.2%
naFta 6,956,158 11.0%
Japan 8,554,219 13.6%
south Korea 4,167,089 6.6%
Bric 23,401,647 37.1%
others 5,379,144 8.5%
Total World 63,069,541 100%
eu* naFta Japan south Korea Bric
Sour
ce: o
ica
– 20
13
units
39.3%
20.3% 20.3%
6.3%8.4%
34.1%
14.2%
19.2%
7.2%
15.8%
26.2%23.2%
8.7%
11.0%
14.3% 13.6%
6.6% 6.6%
35.2%
37.1%
* constant eu27 perimeter throughout the period
23.2% of the world’s cars are produced in the EU

38
Passenger car production - world (% share) | 2012
Commercial vehicle production - world (% share) | 2012
Sour
ce: a
cea
- oic
a –
2013
Sour
ce: a
cea
- oic
a –
2013
11.0% naFta
13.6% Japan
23.2% eu
24.6% china
south Korea 6.6%
Brazil 4.2%
others 3.2%
russia 3.1%
europe - others 1.0%
india 4.1%
europe - others 3.6%
others 3.5%
Brazil 3.4%
turkey 2.7%
asia-others 2.2%
south Korea 1.9%
6.6% Japan
7.7% eu
17.8% china
41.9% naFta
india 5.2%
asia-others 4.3%
thailand 7.2%
Asia - others : australia, indonesia, malaysia, taiwan, thailandeurope - others : serbia, turkey, ukraineothers : argentina, egypt, iran, south africa, uzbekistan
Asia - others : australia, indonesia, malaysia, taiwaneurope - others : russia, serbia, ukraineothers : argentina, egypt, iran, south africa, uzbekistan
production

Production
39
Prod
ucti
on
World passenger car production – international comparison | 2001-2012
World car production is on the riseSo
urce
: Bas
ed o
n oi
ca –
201
3
20,000,000
30,000,000
40,000,000
50,000,000
60,000,000
World passenger car production – trend | 1997-2012
1997 1998 1999 2000 2001 2002 2003 2004 2005 2006 2007 2008 2009 2010 2011
-0.7%+4.2% +3.7% -3.4% +3.8% +1.5%
+6.2%
+6.6% -0.9%
-9.4%
+22.0%+2.9%
+6.5%
Sour
ce: B
ased
on
oica
- 20
13
units
+5.2%
0
2,000,000
4,000,000
6,000,000
8,000,000
10,000,000
12,000,000
14,000,000
16,000,000
18,000,000
units
2001 2002 2003 2004 2005 2006 2007 2008 2009 2010 2011 2012
eu
china
Japan
south Korea
india
usa Brazil
russia
2012
+5.2%

40
World commercial vehicle production - international comparison | 2001-2012
production
World commercial vehicle production is climbing
Sour
ce: B
ased
on
oica
– 2
013
0
5,000,000
10,000,000
15,000,000
25,000,000
20,000,000
World commercial vehicle production - trend | 1999-2012
+4.0% -4.0%+7.0%
+6.0%+6.7% -1.6% -1.6%
-21.2%
+38.1% +4.1% +4.5%
-11.3%
Sour
ce: B
ased
on
oica
– 2
013
units
+3.9%
0
1,000,000
2,000,000
3,000,000
4,000,000
5,000,000
6,000,000
7,000,000
8,000,000
9,000,000
units
2001 2002 2003 2004 2005 2006 2007 2008 2009 2010 2011 2012
1999 2000 2001 2002 2003 2004 2005 2006 2007 2008 2009 2010 2011 2012
usa
china
eu
thailand
canada
Japan
mexico india

Production
41
Prod
ucti
on
Motor vehicle production in the EU – by country | 2012
+ ToTAL
AuSTrIA 123,602 19,060 142,662
BeLGIuM 507,204 33,890 541,094
cZecH rePuBLIc 1,171,774 568 1,172,342
FINLAND 2,900 2,900
FrANce ² 1,682,814 284,951 n.a. 1,967,765
GerMANY ² 5,388,456 260,813 n.a. 5,649,269
HuNGArY 215,440 2,400 217,840
ITALY 396,817 241,186 33,411 671,414
NeTHerLANDS 28,000 21,800 49,800
PoLAND 540,000 103,923 764 644,687
PorTuGAL 115,735 43,831 3,990 163,556
roMANIA 326,556 11,187 22 337,765
SLoVAKIA 900,000 900,000
SLoVeNIA 126,836 4,113 130,949
SPAIN 1,539,680 392,624 46,875 1,979,179
SWeDeN ² 162,814 n.a. 162,814
uNITeD KINGDoM 1,464,906 94,045 16,289 1,575,240
EU ¹ 14,611,284 1,435,990 186,204 16,233,478
1. double countings are deducted from the totals2. Figures for cvs + B&c were not communicated in 2012
Sour
ce: a
cea
- 201
2 (n
atio
nal
auto
moB
ile
asso
ciat
ions
)16.2 million vehicles are produced in the EU

42
0
2,000,000
4,000,000
6,000,000
8,000,000
10,000,000
12,000,000
14,000,000
16,000,000
18,000,000
1990 1991 1992 1993 1994 1995 1996 1997 1998 1999 2000 2001 2002 2003 2004 2005 2006 2007 2008 2009 2010 2011
-3.2%+2%
-15.1%
+12.4% +3.8% +2.9%+4.3%
+8.8% +1.1%+3.1% +0.2% -1.2% -1.2% +1.9% -0.9% +1.3%
-12.8%
+9.9% +2.7%
+5.6%-6.7%
czech republic, hungary, Poland, romania, slovakia, slovenia
austria, Belgium, Finland, France, Germany, italy, netherlands, Portugal, spain, sweden, united Kingdom
Passenger car production in the EU | 1990-2012
Trends in EU car production
Sour
ce: a
cea
– 20
13
units
2012
-6.9%
production

Production
43
Prod
ucti
on
Commercial vehicle production in the EU | 1990-2012
Trends in EU commercial vehicle productionSo
urce
: ace
a - 2
013
0
1,000,000
2,000,000
3,000,000
1990 1991 1992 1993 1994 1995 1996 1997 1998 1999 2000 2001 2002 2003 2004 2005 2006 2007 2008 2009 2010 2011 2012
-7.7% -1.0%
-23.5%
+20.6%+10.2% +2.2%
+17.3%+7.5%
-3.3%
+13.2%-3.3%
-6.0% +2.3% +3.8%+3.3% +3.8%
-47.3%
+39.3%+9.8%
-18.7%
+5.4%-5.2%
units

44
20
40
60
80
100
120
140
160
180
0
sK cZ side Be Fres uK Plhu se* roat Pt it nl Fi*
Motor vehicle production per 1,000 inhabitants | 2012
production
The EU produces 35 vehicles per 1,000 inhabitants
Sour
ce: e
uros
tat;
acea
- 20
13
* only production of cars available in 2012
eu
Prod
uctio
n / 1
,000
inha
bita
nts
167
112
6964
4943
3530
25 2217 17 17 16 16
113 1
Production
45
Prod
ucti
on
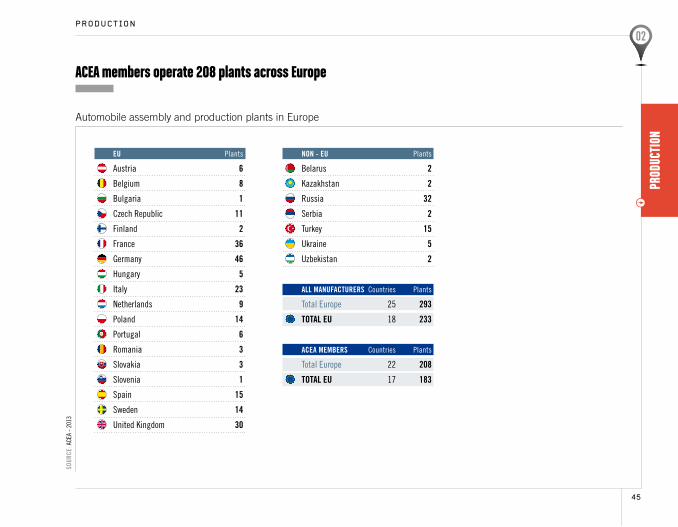
eu Plants
austria 6
Belgium 8
Bulgaria 1
czech republic 11
Finland 2
France 36
Germany 46
hungary 5
italy 23
netherlands 9
Poland 14
Portugal 6
romania 3
slovakia 3
slovenia 1
spain 15
sweden 14
united Kingdom 30
NoN - eu Plants
Belarus 2
Kazakhstan 2
russia 32
serbia 2
turkey 15
ukraine 5
uzbekistan 2
ALL MANuFAcTurerS countries Plants
total europe 25 293
ToTAL eu 18 233
AceA MeMBerS countries Plants
total europe 22 208
ToTAL eu 17 183
Automobile assembly and production plants in Europe
ACEA members operate 208 plants across EuropeSo
urce
: ace
a - 2
013

46
Water used
Sour
ce:
acea
- 2
013
Europe leads the way in resource-efficient production
6.50
6.00
5.50
5.00
4.50
4.0050
55
60
65
70
75
80
85
90
95
100
million m3 m3/car
-35.3%
European automobile manufacturers have significantly reduced the environmental impact of vehicle production in recent years.
long-term strategies to reduce water consumption have made it possible to reduce the water use per car produced by 28.5% from 2005 to 2012. this includes the increased application of re-circulation technologies for the reuse of water.
Water total (million m3/year) Water per unit produced (m3/car) total industry volume production
production
2005 2006 2007 2008 2009 2010 2011 2012

Production
47
Prod
ucti
on
Energy consumption
Sour
ce: a
cea
- 20
13
as cars are equipped with more and more features to make them safer, more comfortable and more environmentally-friendly, the complexity of production increases as well, which affects energy demand. however, manufacturers constantly work on improving energy-efficiency. as a result, total energy consumption over the last years, from 2005 to 2012, decreased by 10.7%. Fluctuation in energy per car produced can be explained by lower volumes in production in certain years and weather conditions such as the harsh winter of 2012.
the co2 emissions per vehicle produced in the same period dropped by 10.4%, while the overall figure went down by 19.0%, reflecting the industry’s efforts to reduce co2 emissions.
3.3
3.1
2.9
2.7
2.520
25
30
35
40
45
2005 2006 2007 2008 2009 2010 2011 2012
million mWh mWh/car
CO2 emissions
Sour
ce: a
cea
- 20
13
0.90
0.85
0.80
0.75
0.70
0.65
0.60
0.55
0.50
million tons tons/car
7
8
9
10
11
12
13
14
energy total (million mWh/year) energy per unit produced (mWh/car) total industry volume production
co2 emissions total (million t/year) co2 emissions per unit produced (t/car) total industry volume production
2005 2006 2007 2008 2009 2010 2011 2012
-10.7%
-19.0%

48
Volatile Organic Compounds (VOC) emissions
Sour
ce:
acea
- 20
13
4.10
3.90
3.70
3.50
3.30
3.10
2.90
2.70
2.50
2.3030,000
35,000
40,000
45,000
50,000
55,000
60,000
65,000
tons kg/car
Volatile organic compounds (Voc) are organic solvents mainly emitted from paintshops. the graph shows the voc emissions per car produced and the absolute emissions of all passenger car manufacturers altogether. With new technologies such as water-based paints that replace solvent-based paints, manufacturers have been able to reduce emissions by 34.8% per vehicle over the last eight years.
voc emissions total (t) voc emissions per unit produced (kg/car) total industry volume production
- 42.6%
- 34.8%
production
2005 2006 2007 2008 2009 2010 2011 2012
Production
49
Prod
ucti
on
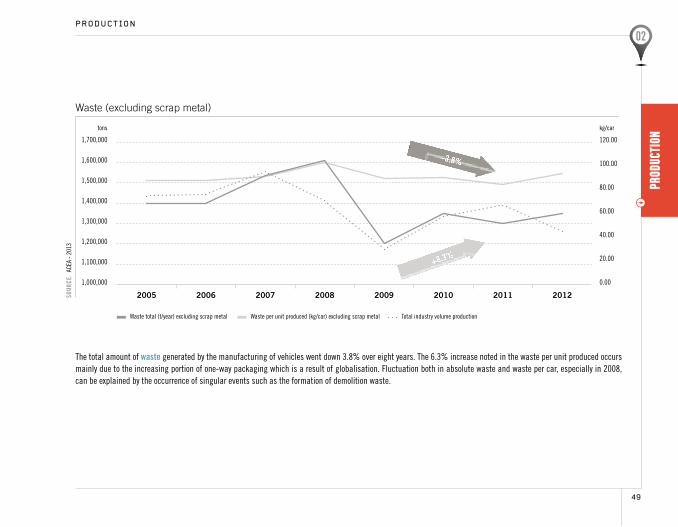
Waste (excluding scrap metal)
Sour
ce:
acea
- 20
13
120.00
100.00
80.00
60.00
40.00
20.00
0.001,000,000
1,100,000
1,200,000
1,300,000
1,400,000
1,500,000
1,600,000
1,700,000
tons kg/car
the total amount of waste generated by the manufacturing of vehicles went down 3.8% over eight years. the 6.3% increase noted in the waste per unit produced occurs mainly due to the increasing portion of one-way packaging which is a result of globalisation. Fluctuation both in absolute waste and waste per car, especially in 2008, can be explained by the occurrence of singular events such as the formation of demolition waste.
Waste total (t/year) excluding scrap metal Waste per unit produced (kg/car) excluding scrap metal total industry volume production
+6.3%
-3.8%
2005 2006 2007 2008 2009 2010 2011 2012

rEgi
strA
tion
s
REGISTRATIONS

RegistRations
53
Regi
stRa
tion
s
europe 22.6%
eu 16.8%eFta 0.7%russia 3.9%turkey 1.0%ukraine 0.3%
Asia 41.0%
china 23.5% Japan 6.5% india 4.4% south Korea 1.9% asia-others 1 4.7%
1. indonesia, malaysia, Pakistan, Philippines, singapore, taiwan, thailand, vietnam
others 9.4%
New motor vehicle registrations – world (market shares) | 2012
Europe accounts for 23% of all motor vehicle registrationsSo
urce
: a
cea,
vda
- 20
13
America 27.0%
NAFTA 21.4%
usa 18.0%
MercoSur 5.6%
Brazil 4.6%
MoTor VeHIcLeS in 1,000 units 2012 % share 2011 % change 12/11
euroPe 18,573 22.6% 19,648 -5.5%
eu 13,749 16.8% 15,065 -8.7%
eFta 549 0.7% 539 1.9%
russia 3,194 3.9% 2,902 10.0%
turkey 818 1.0% 911 -10.2%
ukraine 264 0.3% 231 14.2%
AMerIcA 22,151 27.0% 20,105 10.2%
naFta 17,525 21.4% 15,596 12.4%
of which usa 14,786 18.0% 13,041 13.4%
mercosur 4,626 5.6% 4,509 2.6%
of which Brazil 3,796 4.6% 3,625 4.7%
ASIA 33,644 41.0% 30,594 10.0%
china 19,304 23.5% 18,505 4.3%
india 3,580 4.4% 3,292 8.8%
Japan 5,370 6.5% 4,210 27.5%
south Korea 1,542 1.9% 1,580 -2.4%
asia-others 1 3,849 4.7% 3,008 28.0%
oTHerS 7,704 9.4% 8,110 -5.0%
ToTAL WorLD 82,072 100.0% 78,457 4.6%

54
Asia 35%
china 19.2% Japan 6.6% india 4.0% south Korea 1.9% asia-others 2 3.3%
europe 23.5%
eu 17.5%eFta 0.7%russia 4.3%turkey 0.8%ukraine 0.3%
PASSeNGer cArS in 1,000 units 2012 % share 2011 % change 12/11
euroPe 16,257 23.5% 17,048 -4.6%
eu 12,054 17.5% 13,130 -8.2%
eFta 474 0.7% 462 2.5%
russia 2,935 4.3% 2,654 10.6%
turkey 556 0.8% 594 -6.3%
ukraine 238 0.3% 207 14.5%
AMerIcA 1 21,529 31.2% 19,492 10.4%
naFta 17,098 24.8% 15,221 12.3%
of which usa 14,440 20.9% 12,734 13.4%
mercosur 4,431 6.4% 4,271 3.7%
of which Brazil 3,634 5.3% 3,426 6.1%
ASIA 24,200 35.0% 21,428 12.9%
china 13,239 19.2% 12,214 8.4%
india 2,777 4.0% 2,514 10.4%
Japan 4,572 6.6% 3,525 29.7%
south Korea 1,307 1.9% 1,316 -0.7%
asia-others 2 2,306 3.3% 1,859 24.1%
oTHerS 7,074 10.2% 7,448 -5.0%
ToTAL WorLD 69,060 100.0% 65,416 5.6%1. including light commercial vehicles2. indonesia, malaysia, Pakistan, Philippines, singapore, taiwan, thailand, vietnam
America 31.2%
NAFTA 24.8%
usa 20.9%
MercoSur 6.4%
Brazil 5.3%
others 10.2%
New passenger car registrations - world (market shares) | 2012
Over 16 million cars were registered in Europe in 2012
Sour
ce:
ace
a, v
da -
2013
registrations
RegistRations
55
Regi
stRa
tion
s
Asia 72.6%
china 46.6% india 6.2% Japan 6.1% south Korea 1.8% asia-others 2 11.9%
europe 17.8%
eu 13.0%eFta 0.6%turkey 2.0%russia 2.0%ukraine 0.2%
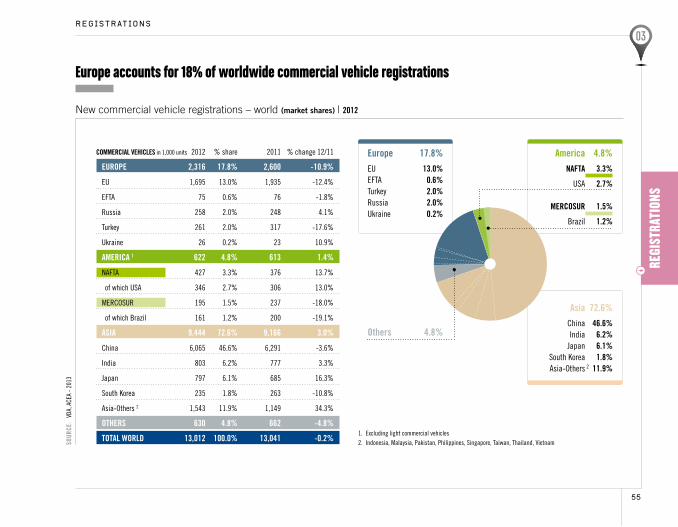
coMMercIAL VeHIcLeS in 1,000 units 2012 % share 2011 % change 12/11
euroPe 2,316 17.8% 2,600 -10.9%
eu 1,695 13.0% 1,935 -12.4%
eFta 75 0.6% 76 -1.8%
russia 258 2.0% 248 4.1%
turkey 261 2.0% 317 -17.6%
ukraine 26 0.2% 23 10.9%
AMerIcA 1 622 4.8% 613 1.4%
naFta 427 3.3% 376 13.7%
of which usa 346 2.7% 306 13.0%
mercosur 195 1.5% 237 -18.0%
of which Brazil 161 1.2% 200 -19.1%
ASIA 9,444 72.6% 9,166 3.0%
china 6,065 46.6% 6,291 -3.6%
india 803 6.2% 777 3.3%
Japan 797 6.1% 685 16.3%
south Korea 235 1.8% 263 -10.8%
asia-others 2 1,543 11.9% 1,149 34.3%
oTHerS 630 4.8% 662 -4.8%
ToTAL WorLD 13,012 100.0% 13,041 -0.2%1. excluding light commercial vehicles2. indonesia, malaysia, Pakistan, Philippines, singapore, taiwan, thailand, vietnam
America 4.8%
NAFTA 3.3%
usa 2.7%
MercoSur 1.5%
Brazil 1.2%
others 4.8%
New commercial vehicle registrations – world (market shares) | 2012
Europe accounts for 18% of worldwide commercial vehicle registrationsSo
urce
: v
da, a
cea
- 201
3
56
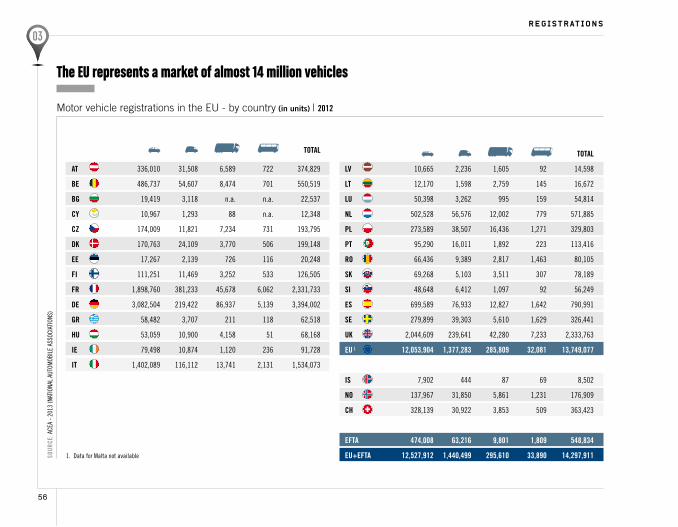
ToTAL
AT 336,010 31,508 6,589 722 374,829
Be 486,737 54,607 8,474 701 550,519
BG 19,419 3,118 n.a. n.a. 22,537
cY 10,967 1,293 88 n.a. 12,348
cZ 174,009 11,821 7,234 731 193,795
DK 170,763 24,109 3,770 506 199,148
ee 17,267 2,139 726 116 20,248
FI 111,251 11,469 3,252 533 126,505
Fr 1,898,760 381,233 45,678 6,062 2,331,733
De 3,082,504 219,422 86,937 5,139 3,394,002
Gr 58,482 3,707 211 118 62,518
Hu 53,059 10,900 4,158 51 68,168
Ie 79,498 10,874 1,120 236 91,728
IT 1,402,089 116,112 13,741 2,131 1,534,073
ToTAL
LV 10,665 2,236 1,605 92 14,598
LT 12,170 1,598 2,759 145 16,672
Lu 50,398 3,262 995 159 54,814
NL 502,528 56,576 12,002 779 571,885
PL 273,589 38,507 16,436 1,271 329,803
PT 95,290 16,011 1,892 223 113,416
ro 66,436 9,389 2,817 1,463 80,105
SK 69,268 5,103 3,511 307 78,189
SI 48,648 6,412 1,097 92 56,249
eS 699,589 76,933 12,827 1,642 790,991
Se 279,899 39,303 5,610 1,629 326,441
uK 2,044,609 239,641 42,280 7,233 2,333,763
eu ¹ 12,053,904 1,377,283 285,809 32,081 13,749,077
IS 7,902 444 87 69 8,502
No 137,967 31,850 5,861 1,231 176,909
cH 328,139 30,922 3,853 509 363,423
eFTA 474,008 63,216 9,801 1,809 548,834
eu+eFTA 12,527,912 1,440,499 295,610 33,890 14,297,9111. data for malta not available
registrations
Motor vehicle registrations in the EU - by country (in units) | 2012
Sour
ce: a
cea
- 201
3 (n
atio
nal
auto
moB
ile
asso
ciat
ions
)
The EU represents a market of almost 14 million vehicles

RegistRations
57
Regi
stRa
tion
s
10,000,000
1,500,000
11,000,000
1,700,000
12,000,000
1,900,000
13,000,000
2,100,000
14,000,000
2,300,000
15,000,000
2,500,000
16,000,000
2,700,000
-5
-5
-4
-4
-3
-3
-2
-2
-1
-1
+0
+0
+1
+1
+2
+2
+3
+3
+4
+4
New commercial vehicle registrations in the EU and GDP | 1997-2012
1997 1998 1999 2000 2001 2002 2003 2004 2005 2006 2007 2008 2009 2010 2011 2012 2013 2014
Sour
ce: a
aa, a
cea,
dG
ecFi
nSo
urce
: aaa
, ace
a, d
G ec
Fin
new Pc registrations – eu eu GdP
new cv registrations – eu eu GdP
New
Pc re
gist
ratio
ns (u
nits
)Ne
w cV
regi
stra
tions
(uni
ts)
New passenger car registrations in the EU and GDP | 1990-2012
Vehicle sales mirror economic growth
GDP
grow
th (%
)
GDP
grow
th (%
)
eurostat forecast
eurostat forecast
1990 1991 1992 1993 1994 1995 1996 1997 1998 1999 2000 2001 2002 2003 2004 2005 2006 2007 2008 2009 2010 2011 2012 2013 2014

58
10,000,000
11,000,000
12,000,000
13,000,000
14,000,000
15,000,000
16,000,000
1990 1991 1992 1993 1994 1995 1996 1997 1998 1999 2000 2001 2002 2003 2004 2005 2006 2007 2008 2009 2010 2011 2012
-0.6% +0.8%
-16.9%
+6.0% +0.7%
+6.3%
+4.9%
+7.2%
+5.0%-2.1% +0.6%
-2.7%
+5.0%+1.6% -0.6%
+3.8% +1.0%
-8.0% -1.2%
-5.5%-1.7%
-8.3%
New passenger car registrations in the EU (in units – % change) | 1990-2012
Trend in new EU car registrations
Sour
ce: a
cea
- 201
3
units
registrations

RegistRations
59
Regi
stRa
tion
s
0
0
500,000
100,000
1,000,000
200,000
1,500,000
300,000
2,000,000,
400,000
2,500,000
500,000
New medium & heavy commercial vehicle registrations in the EU (in units – % change) | 1997-2012
1998
1998
1997
1997
1999
1999
2000
2000
2001
2001
2002
2002
2003
2003
2004
2004
2005
2005
2006
2006
2007
2007
2008
2008
2009
2009
2010
2010
2011 2012
2011 2012
+13.1%+9.0%
+5.6% -2.8% -2.5% -2.7%+9.5%
+3.0% +0.4%
-29.5%+8.7%
+7.5%-7.4%
+5.7%-9.7%
+16.5%+12.7% +2.5% -3.7%
-10.0% -1.2%+9.5%
+6.1%+6.4%
+6.5% -2.6%
-44.4% +7.1%
+19.7%-6.0%
New light commercial vehicle registrations in the EU (in units – % change) | 1997-2012
Trend in new EU commercial vehicle registrationsSo
urce
: ace
a, B
ased
on
aaa
data
- 20
13So
urce
: ace
a, B
ased
on
aaa
data
- 20
13
units
units

60
New cars sold in Europe* – by segment (% share) | 2012
upper medium (d) 12.0%
luxury (e+F) 4.0%
mPv 12.0%
suv 12.0%
others 2.0%
small (a+B) 35.0%
lower medium (c) 23.0%
* europe = eu27 (without luxembourg) + norway, switzerland
A closer look at consumer demand
more information on trends in new car characteristics at www.acea.be
Sour
ce: i
hs G
loBa
l in
siGh
t
0
1,000,000
2,000,000
3,000,000
4,000,000
5,000,000
6,000,000
New passenger cars sold in Europe* – by segment (in units) | 1994-2012
19951994 1996 1997 1998 1999 2000 2001 2002 2003 2004 2005 2006 2007 2008 2009 2010 2011 2012Sour
ce: i
hs G
loBa
l in
siGh
t
small (a+B) lower medium (c) upper medium (d) luxury (e+F) mPv suv othersunits
registrations
RegistRations
61
Regi
stRa
tion
s
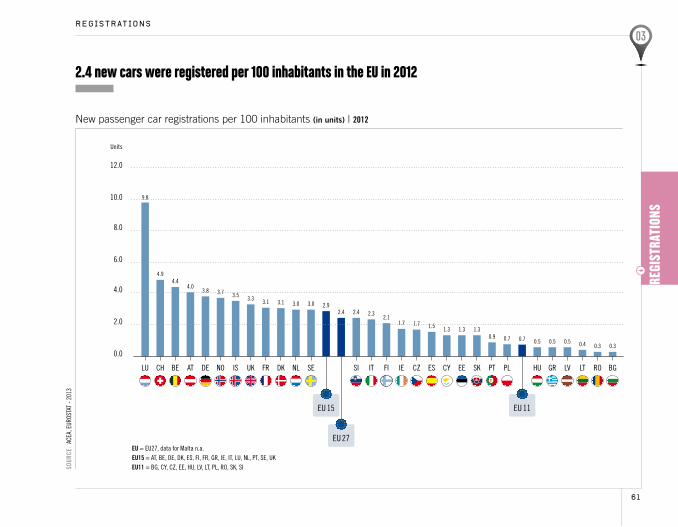
eu = eu27, data for malta n.a. eu15 = at, Be, de, dK, es, Fi, Fr, Gr, ie, it, lu, nl, Pt, se, uK eu11 = BG, cY, cZ, ee, hu, lv, lt, Pl, ro, sK, si
2.0
4.0
6.0
8.0
10.0
12.0
0.0
New passenger car registrations per 100 inhabitants (in units) | 2012
Sour
ce:
acea
, eur
osta
t - 2
013
units
2.4 new cars were registered per 100 inhabitants in the EU in 2012
9.8
4.94.4
4.03.8 3.7 3.5 3.3 3.1 3.1 3.0 3.0 2.9
2.4 2.4 2.32.1
1.7 1.7 1.5 1.3 1.3 1.30.9 0.7 0.7 0.5 0.5 0.5 0.4 0.3 0.3
lu deBe at uKnoch is eesenl itFr cYie PlFi husK Gr ltesdK
cZ Pt lv ro BG
eu 15
eu 27
si
eu 11

62
0
500,000
1,000,000
1,500,000
2,000,000
3,000,000
4,500,000
4,000,000
3,500,000
2,500,000
New passenger cars in the EU – by CO2 emissions | 1995-2012
19991998199719961995 2000 2001 2002 2003 2004 2005 2006 2007 2008 2009 2010 2011 2012
02
3,247,803
3,865,560
4,283,478
4,594,922
2,057,924
1,494,098
1,008,992904,845958,591839,488583,614
306,514159,384813 20,339 88,174
co2 emissions (g/km)
161+
160-141
140-121
120 and less
Demand for passenger cars ≤ 120g CO2 /km | 1995-2012
The drive towards fuel efficiency
units
+6.8%
1995
17%
3% 0%
20071998
37%29%
28% 23%
7%11%
0%
20082001
31%42%
27%35%
26%
20% 16%
3%
20092004 2010 2011 2012
23%
36%25%
34%27%
21%25%
8%
19%15% 12%
21%19% 18%
30% 33% 32%29% 33%39%
80%
65%
registrations
Sour
ce:
Base
d on
aaa
dat
a - 1
995-
2009
: eu
15, 2
010-
2012
: 23
eu c
ount
ries
(dat
a Fo
r BG
, ro,
cY,
mt
n.a.
)So
urce
: Ba
sed
on a
aa d
ata
- 199
5-20
09:
eu15
, 201
0-20
12: 2
3 eu
cou
ntri
es (d
ata
For
BG, r
o, c
Y, m
t n.
a.)

63
Regi
stRa
tion
s
RegistRations
Be: 128 ; -16.4%
nl: 123 ; -25.1%
dK: 117 ; -25.7%
se: 139 ; -23.3%
Fi: 139 ; -21.7%
uK: 133 ; -18.8%
ie: 125 ; -24.2%
de: 141 ; -17.0%Pl: 141 ; -8.4%
cZ: 141
ee: 150
lv: 153
lt: 145
si: 134 hu: 140
sK: 141
lu: 138 ; -16.3%
at: 138 ; -15.0%
it: 128 ; -13.1%
Gr: 127 ; -22.9%
es: 132 ; -16.%
Pt: 119 ; -16.6%
Fr: 124 ; -16.8%
CO2 emissions of new cars: continuing the downward trend
Source: acea - 2013
average co2 of new cars % change in 2012 2012/2007
DK 117 -25.7%
PT 119 -16.6%
NL 123 -25.1%
Fr 124 -16.8%
Ie 125 -24.2%
Gr 127 -22.9%
Be 128 -16.4%
IT 128 -13.1%
eS 132 -16.0%
uK 133 -18.8%
SI 134
Lu 138 -16.3%
AT 138 -15.0%
FI 139 -21.7%
Se 139 -23.3%
Hu 140
SK 141
PL 141 -8.6%
cZ 141
De 141 -17.0%
LT 145
ee 150
LV 153
Average CO2 emissions of new cars in the EU in 2012 (in gCO2 /km)

64
0
10
20
30
40
60
50
Diesel penetration in the EU15 + EFTA – by country (% of new cars registered) | 2012
1999199819971996199519941993199219911990 2000 2001 2002 2003 2004 2005 2006 2007 2008 2009 2010 2011 2012
Fr eslu noBe uKitse chdK
Fide nlPt Gr
0
10
20
30
40
50
60
70
80
Diesel penetration in the EU15 + EFTA (% of new cars registered) | 1990-2012
Most new cars have a diesel engine
% share
% share
Sour
ce: B
ased
on
aaa
(dat
a Fo
r th
e eu
15 +
eFt
a)So
urce
: Ba
sed
on a
aa (d
ata
For
eu15
+ e
Fta)
more information on trends in new car characteristics at www.acea.be
ie
registrations
eu15 +
eFta
at is
VEhi
ClEs
in u
sEVEhICLESIN USE

Vehicles in use
67
Vehi
cles
in U
se
2
4
6
8
10
12
14
Years
0
Passenger car fleet* – by age (% share) | 2010
slovaKiaFinlandestonia Greece sWedenPortuGal GermanY BelGium austria uK ireland
* for available countries: austria, Belgium, estonia, Finland, France, Germany, Greece, ireland, Portugal, slovakia, sweden, united Kingdom.
Average passenger car age – by country | 2010
Cars in the EU are on average 8.3 years oldSo
urce
: an
Fac,
ace
a - 2
012
Sour
ce: a
nFac
, ace
a - 2
012
35.6% cars > 10 years old
32.2% cars ≤ 5 years old
12.0 11.9 11.510.7
10.1 9.8
8.3 8.3 8.2 8.0 7.5 7.36.3
eu*
France
32.1% cars 5-10 years old

68
vehicles in use
The share of diesel in the EU car fleet is gradually increasing
EU car fleet – by fuel type (% share) | 2012
EU car fleet – by fuel type (% share) | 2010
Sour
ce:
anFa
c, a
cea
- 201
3So
urce
: an
Fac,
ace
a - 2
012
Gasoline 60.6%
Gasoline 61.5%
diesel 35.9%
diesel 35.3%
other 3.4%
other 3.2%
* for available countries: austria, Belgium, czech republic, denmark, Finland, France, Germany, italy, latvia, netherlands, Poland, romania, sweden, united Kingdom.
* for available countries: austria, Belgium, czech republic, denmark, Finland, France, Germany, Greece, italy, latvia, lithuania, netherlands, Poland, romania, spain, sweden, united Kingdom
Vehicles in use
69
Vehi
cles
in U
se
300
0
50
100
150
200
250
0
5
10
15
20
25
30
35
40
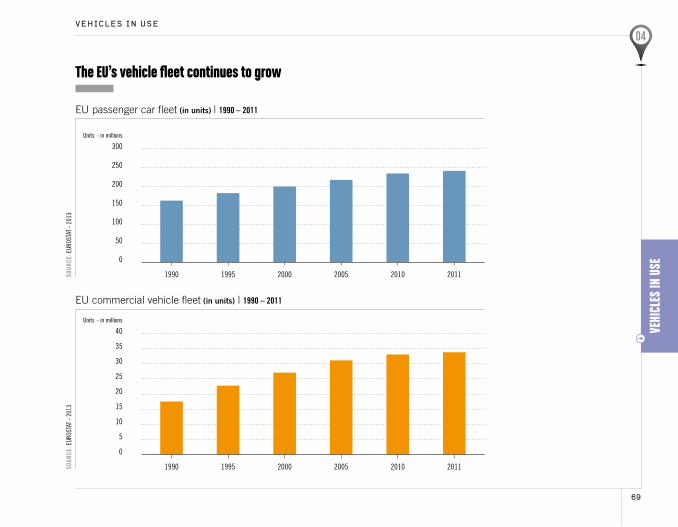
EU commercial vehicle fleet (in units) | 1990 – 2011
units - in millions
units - in millions
1990
1990
1995
1995
2000
2000
2005
2005
2010 2011
2010 2011
EU passenger car fleet (in units) | 1990 – 2011
The EU’s vehicle fleet continues to growSo
urce
: eur
osta
t - 2
013
Sour
ce: e
uros
tat
- 201
3

70
5
10
15
20
25
30
35
40
45
0
de it Fr uK es Pl nl Be Gr cZPt at se ro huFi BG dK
ie ltsK si lv ee cY lu mt
17.7%
15.3%
13.2%12.1%
9.2%
7.5%
3.2%
2.2% 2.1% 1.9% 1.9% 1.9% 1.8% 1.8%1.2% 1.2% 1.1% 0.9% 0.8% 0.7% 0.7% 0.4% 0.3% 0.2% 0.2% 0.1% 0.1%
vehicles in use
Passenger car fleet – by country (% share - in units) | 2011
Vehicle spread in the EU
Sour
ce: e
uros
tat
- 201
3
units - in millions

Vehicles in use
71
Vehi
cles
in U
se
Passenger car fleet growth (in units) | 1995-2011
0
50
100
150
200
250
300
0
50
100
150
200
250
300
JaPan
JaPan
usa
usa
russia
russiachina
BraZil
BraZil
s. Korea
s. Korea
india
india
* 27 countries included over the whole period
Passenger car fleet (in units) | 2011
The EU has the largest car fleet in the world
eu*
eu*
Sour
ce: e
uros
tat,
ihs
GloB
al in
siGh
tSo
urce
: eur
osta
t, ih
s Gl
oBal
insi
Ght
units – in millions
units – in millions
242.2
130.72
57.7 55.935.0 27.5 14.2 13.5
1995 2011
china

72
100
200
300
400
500
600
700
0
100
200
300
400
500
0
usaJaPaneu s. Korea russia BraZil china india
vehicles in use
Passenger car density per 1,000 inhabitants – EU | 2011
Passenger car density per 1,000 inhabitants – world | 1995-2011
The EU has 483 cars per 1,000 inhabitants
Sour
ce: e
uros
tat,
ihs
GloB
al in
siGh
tSo
urce
: eur
osta
t - 2
012
380 373
461
143108 106
2 3
448447
454
236179
100
11 6
483 452
417
293251
137
4111
itlu cYmt Fi delt Fr Be es uKeu nl Gr iePl Pt ee dK
BG husK ro
658
610 589570 551 545 535 525 519 502 490 482483 470 470 466 464 461 447 436 428 417
394368
324300 298
203
at si se cZ lv
units
units
1995
2005
2011

trAd
E
TRAdE

trade
75
Trad
e
eFta & eastern europe 25.1%
middle east 4.8%
africa 6.8%
asia & oceania 34.0%
north america (naFta) 26.8%
south america & caribbean 2.4%
EU exports of passenger cars - by value (% share)
The EU automotive industry is a formidable exporterSo
urce
: Bas
ed o
n eu
rost
at d
ata
- 201
2
76
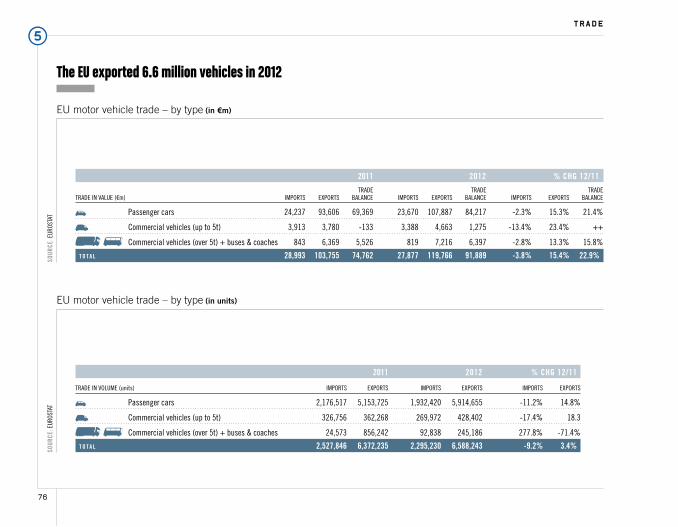
2011 2012 % cHG 12/11
trade trade tradetrade in value (¤m) imPorts exPorts Balance imPorts exPorts Balance imPorts exPorts Balance
Passenger cars 24,237 93,606 69,369 23,670 107,887 84,217 -2.3% 15.3% 21.4%
commercial vehicles (up to 5t) 3,913 3,780 -133 3,388 4,663 1,275 -13.4% 23.4% ++
commercial vehicles (over 5t) + buses & coaches 843 6,369 5,526 819 7,216 6,397 -2.8% 13.3% 15.8%
t o t a l 28,993 103,755 74,762 27,877 119,766 91,889 -3.8% 15.4% 22.9%
2011 2012 % cHG 12/11
trade in volume (units) imPorts exPorts imPorts exPorts imPorts exPorts
Passenger cars 2,176,517 5,153,725 1,932,420 5,914,655 -11.2% 14.8%
commercial vehicles (up to 5t) 326,756 362,268 269,972 428,402 -17.4% 18.3
commercial vehicles (over 5t) + buses & coaches 24,573 856,242 92,838 245,186 277.8% -71.4%
t o t a l 2,527,846 6,372,235 2,295,230 6,588,243 -9.2% 3.4%
trade
EU motor vehicle trade – by type (in €m)
EU motor vehicle trade – by type (in units)
Sour
ce: e
uros
tat
Sour
ce: e
uros
tat
The EU exported 6.6 million vehicles in 2012

trade
77
Trad
e
chinas. KoreaturKeY indiamexico sWitZerlands. aFrica thailand
Origin of EU motor vehicle imports (in units) | 2012
Origin of EU motor vehicle imports (in units)
A closer look at imports of all vehicle categoriesSo
urce
: eur
osta
t
2006 2007 2008 2009 2010 2011 2012 % chG 12/11 % share in 2012
World 3,402,211 3,620,596 3,246,820 2,522,080 2,488,966 2,527,846 2,295,230 -9.2% 100.0%
turkey 561,914 620,836 666,586 497,799 568,896 571,142 518,427 -9.2% 22.6%
south Korea 724,689 655,218 452,348 353,423 295,970 384,462 403,690 5.0% 17.6%
Japan 970,386 971,861 879,620 691,638 618,914 440,320 347,759 -21.0% 15.2%
united states 322,664 450,533 365,682 155,695 186,425 243,049 241,129 -0.8% 10.5%
china 329,426 348,407 267,254 208,718 164,712 161,101 184,927 14.8% 8.1%
mexico 101,378 152,045 183,686 116,308 139,186 184,196 163,550 -11.2% 7.1%
india 51,391 63,035 101,705 267,065 233,441 260,922 163,503 -37.3% 7.1%
south africa 29,499 25,056 35,316 38,783 74,278 86,263 67,714 -21.5% 3.0%
switzerland 34,166 47,060 43,751 29,795 26,740 26,691 25,966 -2.7% 1.1%
thailand 75,011 82,865 62,645 35,822 44,383 39,950 25,198 -36.9% 1.1%
0
200,000
400,000
600,000
JaPan usa
units
Sour
ce: B
ased
on
euro
stat
dat
a
78
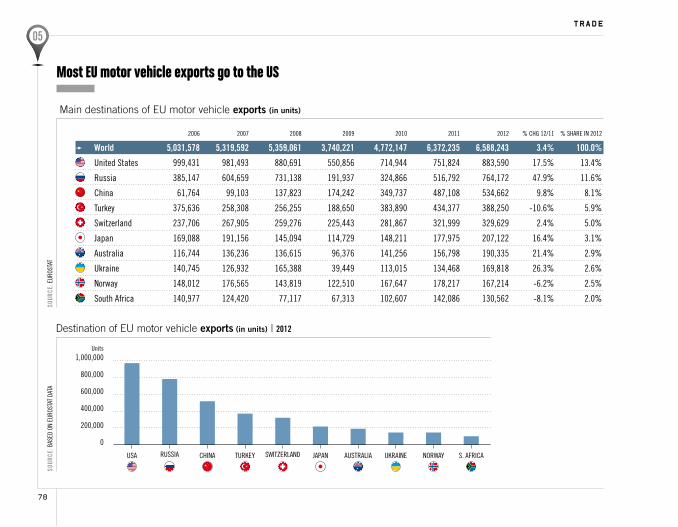
Destination of EU motor vehicle exports (in units) | 2012
china sWitZerlandrussiausa JaPan norWaYaustralia s. aFrica
Main destinations of EU motor vehicle exports (in units)
Most EU motor vehicle exports go to the US
Sour
ce: e
uros
tat
Sour
ce: B
ased
on
euro
stat
dat
a
trade
2006 2007 2008 2009 2010 2011 2012 % chG 12/11 % share in 2012
World 5,031,578 5,319,592 5,359,061 3,740,221 4,772,147 6,372,235 6,588,243 3.4% 100.0%
united states 999,431 981,493 880,691 550,856 714,944 751,824 883,590 17.5% 13.4%
russia 385,147 604,659 731,138 191,937 324,866 516,792 764,172 47.9% 11.6%
china 61,764 99,103 137,823 174,242 349,737 487,108 534,662 9.8% 8.1%
turkey 375,636 258,308 256,255 188,650 383,890 434,377 388,250 -10.6% 5.9%
switzerland 237,706 267,905 259,276 225,443 281,867 321,999 329,629 2.4% 5.0%
Japan 169,088 191,156 145,094 114,729 148,211 177,975 207,122 16.4% 3.1%
australia 116,744 136,236 136,615 96,376 141,256 156,798 190,335 21.4% 2.9%
ukraine 140,745 126,932 165,388 39,449 113,015 134,468 169,818 26.3% 2.6%
norway 148,012 176,565 143,819 122,510 167,647 178,217 167,214 -6.2% 2.5%
south africa 140,977 124,420 77,117 67,313 102,607 142,086 130,562 -8.1% 2.0%
0
200,000
400,000
600,000
800,000
1,000,000
turKeY uKraine
units

trade
79
Trad
e
Passenger cars - origin of EU imports - by value (% share) | 2012
2006 2007 2008 2009 2010 2011 2012 % chG 12/11 % share in 2012
World 31,601 33,397 29,721 22,046 22,483 24,237 23,670 -2.3% 100.0%
united states 5,470 6,344 5,977 2,952 3,483 4,665 5,492 17.7% 23.2%
Japan 12,012 11,796 10,634 8,240 7,672 6,504 5,464 -16.0% 23.1%
south Korea 7,272 6,690 3,945 2,610 2,449 3,395 3,900 14.9% 16.5%
turkey 3,393 4,206 3,674 3,194 3,397 3,328 3,119 -6.3% 13.2%
mexico 1,334 1,992 2,405 1,499 1,771 2,465 2,341 -5.0% 9.9%
india 270 332 584 1,536 1,341 1,770 1,069 -39.6% 4.5%
south africa 366 70 300 469 847 904 549 -39.3% 2.3%
china 298 482 541 398 455 394 331 -16.0% 1.4%
canada 89 86 70 38 70 136 179 32.1% 0.8%
switzerland 142 193 152 120 114 106 123 16.0% 0.5%
Origin of most EU passenger car imports - by value (in €m)
The US, Japan and South Korea account for the highest import value for carsSo
urce
: eur
osta
tSo
urce
: Bas
ed o
n eu
rost
at d
ata
13.2% turkey
16.5% south Korea
33.8 % naFta
23.1% Japan
0.1% middle east
0.0% australia
africa 4.9%
india 4.5%
china 1.4%
eFta 0.6%
asean 0.2%
russia 0.1%
mercosur 0.0%
others 1.6%

80
Origin of EU passenger car imports (in units) | 2012
2006 2007 2008 2009 2010 2011 2012 % chG 11/12 % share in 2012
World 3,014,086 3,214,833 2,783,532 2,212,025 2,139,820 2,176,517 1,932,420 -11.2% 100.0%
south Korea 717,090 651,130 446,544 351,142 294,013 382,871 402,062 5.0% 20.8%
Japan 940,670 949,317 852,805 676,461 604,151 429,803 345,895 -19.5% 17.9%
turkey 344,923 385,188 361,161 314,514 330,548 334,349 318,265 -4.8% 16.5%
united states 314,856 440,892 351,235 150,142 179,892 236,381 233,835 -1.1% 12.1%
mexico 101,331 152,006 183,647 116,298 139,171 184,180 163,526 -11.2% 8.5%
india 49,433 61,389 99,121 265,659 231,987 259,776 162,928 -37.3% 8.4%
china 308,720 336,075 252,801 154,266 155,262 149,025 111,881 -24.9% 5.8%
south africa 17,938 3,877 20,515 31,315 65,396 72,074 43,973 -39.0% 2.3%
switzerland 29,346 41,248 36,281 26,232 23,892 23,420 22,254 -5.0% 1.2%
taiwan 54,904 57,492 59,795 32,076 29,670 29,252 19,327 -33.9% 1.0%
50,000
100,000150,000200,000250,000300,000350,000400,000450,000
0
turKeY indiaJaPan mexico taiWansWitZerlands. aFrica
trade
Origin of most EU passenger car imports (in units)
Sour
ce: e
uros
tat
units
s. Korea usa china
Sour
ce: B
ased
on
euro
stat
dat
a
Most EU car imports come from South Korea

trade
81
Trad
e
2006 2007 2008 2009 2010 2011 2012 % chG 12/11 % share in 2012
World 67,776 70,658 69,416 48,088 76,149 93,606 107,887 15.3% 100.0%
united states 27,064 24,748 20,520 12,768 19,127 19,482 24,934 28.0% 23.1%
china 2,250 3,344 4,608 5,475 12,182 17,335 19,290 11.3% 17.9%
russia 4,290 6,627 8,758 2,563 4,063 7,016 8,727 24.4% 8.1%
switzerland 4,002 4,318 4,360 3,935 5,219 6,646 6,813 2.5% 6.3%
Japan 4,221 4,115 3,249 2,713 3,843 5,089 6,306 23.9% 5.8%
turkey 2,908 2,834 2,806 2,067 4,255 5,229 4,826 -7.7% 4.5%
australia 1,831 2,097 2,186 1,613 2,758 3,177 3,496 10.1% 3.2%
norway 2,266 2,694 2,180 1,854 2,699 3,016 3,166 5.0% 2.9%
canada 2,082 2,074 2,057 1,789 2,414 2,480 2,995 20.7% 2.8%
south Korea 1,018 974 911 805 1,682 1,955 2,496 27.7% 2.3%
Main destinations of EU passenger car exports – by value (in €m)
The US is the EU’s most valuable export market
Passenger cars - destination of EU exports – by value (% share) | 2012
Sour
ce: e
uros
tat
9.4% eFta
8.1% russia
17.9% china
6.8% others
26.8% naFta
1.3% mercosur
0.2% india
africa 6.8%
Japan 5.8%
middle east 4.8%
turkey 4.5%
australia 3.2%
south Korea 2.3%
asean 2.0%
Sour
ce: B
ased
on
euro
stat
dat
a

82
norWaY s. aFrica canada
trade
Destination of EU passenger car exports (in units) | 2012
Main destinations of EU passenger car exports (in units)
Almost 15% of EU car exports set sail to the US
Sour
ce: e
uros
tat
2006 2007 2008 2009 2010 2011 2012 % chG 12/11 % share in 2012
World 4,301,184 4,743,045 4,797,916 3,375,224 4,234,470 5,153,725 5,914,655 14.8% 100.0%
united states 993,405 972,316 874,508 547,326 708,575 731,138 873,628 19.5% 14.8%
russia 342,762 528,674 670,381 176,595 291,164 470,878 706,918 50.1% 12.0%
china 60,383 95,925 136,239 172,218 345,581 478,877 526,769 10.0% 8.9%
turkey 247,886 225,505 223,331 170,456 339,556 388,000 349,979 -9.8% 5.9%
switzerland 212,941 243,348 233,163 203,939 255,874 291,899 300,976 3.1% 5.1%
Japan 168,731 190,864 145,006 114,649 148,082 175,242 206,521 17.8% 3.5%
australia 99,876 107,469 109,738 84,157 123,250 141,394 150,460 6.4% 2.5%
norway 125,799 151,956 122,103 110,027 147,473 153,694 144,232 -6.2% 2.4%
south africa 122,877 102,828 65,611 62,834 93,145 123,355 115,808 -6.1% 2.0%
canada 83,707 85,291 98,188 82,576 99,169 94,849 109,767 15.7% 1.9%
200,000
400,000
600,000
800,000
1.000,000
0
china turKeY sWitZerland JaPanusa australiarussia
Sour
ce: B
ased
on
euro
stat
dat
a
units

tAxA
tion
TAxATION

TaxaTion
85
Taxa
Tion
co2 taxation is now well established across the european union. 19 eu member states currently apply some form of co2 tax to the registration and/or ownership of passenger cars, up from 17 in 2010. Finland and Greece both changed their annual circulation tax to a co2 basis recently.
the 19 eu countries that levy passenger car taxes partially or totally based on the cars’ co2 emissions and/or fuel consumption are: austria, Belgium, cyprus, denmark, Finland, France, Germany, Greece, ireland, latvia, luxembourg, malta, the netherlands, Portugal, romania, slovenia, spain, sweden and the united Kingdom.
the european automobile industry welcomes this trend towards co2-related car taxation. however, it regrets the lack of uniformity in the implementation of these taxes.
european auto makers therefore support taxation for passenger cars that is:– exclusively based on co2 emissions;– technologically neutral;– linear; and– budget neutral.
For more information, visit www.acea.be
CO2 taxation is gaining ground in the EU
Source: acea tax Guide 2013

86
taxation
incentives for electrically-chargeable vehicles are now applied in all western european countries. the incentives mainly consist of tax reductions and exemptions, as in countries such as Belgium and the netherlands, and bonus payments and premiums for the buyers of electric vehicles in spain, luxembourg and Portugal.
the european car industry supports the further introduction of fiscal incentives for fuel efficiency. tax measures are an important tool in shaping consumer demand towards fuel-efficient cars and help create a market for breakthrough technologies, notably during the introduction phase. innovations generally first enter the market in low volumes and at a significant cost premium, and this needs to be offset by a positive policy framework. electric mobility will make an important contribution towards ensuring sustainable mobility. however, advanced conventional technologies, engines and fuels will play a predominant role for years to come. Governments must continue to include these co2-efficient technologies and solutions in their overall sustainable mobility policy approach.
For more information, visit www.acea.be
Tax incentives help shape demand for electric vehicles
Source: acea tax Guide 2013

TaxaTion
87
Taxa
Tion
at Be dK de es Fi Fr Gr ie it nl Pt se uK
€ bn € bn dKK bn € bn € bn € bn € bn € bn € bn € bn € bn € bn seK bn £ bn 2011 2012 2011 2011 2011 2011 2011 2012 2012 2010 2011 2012 2012 2011
Purchase or transfer
1. vat on vehicle sales servicing/repair, parts, tyres 2.484 6.060 n.a. 27.175 4.031 1.310 14.554 0.170 0.387 18.100 1.400 1.076 21.000 12.500
2. Fuels & lubricants 5.517 7.534 16.970 40.036 18.325 3.742 35.332 4.143 2.720 31.315 7.708 2.310 49.500 26.920
3. sales & registration taxes 0.485 0.408 13.800 0.478 1.008 2.076 0.100 0.387 1.142 1.999 0.420
annual ownership taxes 1.635 1.512 9.872 8.422 2.807 0.706 1.098 1.116 1.075 6.610 3.586 0.362 12.200 5.820
driving license fees 0.007 0.010 0.065 – 0.295
insurance taxes 0.310 0.934 1.757 3.656 0.676 0.299 4.276 4.051 0.365 3.000
tolls 1.512 0.370 10.106 1.422 0.800
customs duties 0.550 – 0.025
other taxes 0.274 0.759 0.920 0.349 1.572 0.055 5.186 3.396 0.266 4.200 1.500
ToTAL 12.217 17.214 42.769 80.769 26.731 7.065 69.014 5.584 4.569 67.826 18.749 4.459 90.700 46.740
euro 12.2 17.2 5.7 80.8 26.7 7.1 69.0 5.6 4.6 67.8 18.7 4.5 10.4 54.3
GrAND ToTAL = €384.6bn
Fiscal income from motor vehicles in the EU*
* no data available for other eu member states.Sour
ce: a
cea
- 201
3Motor vehicles are a vital source of government revenue

88
taxation
austria
Bulgaria
estonia
slovakia
slovenia
uK
France
Germany
malta
cyprus
luxembourg
Share of VAT in net price of cars
Excise duties on fuels in (€/1,000 litres)
at Be BG cY cZ de dK ee es Fi Fr Gr hu ie it lt lu lv mt nl Pl Pt ro se si sK uK eu minimum rates
unleaded Petrol 482 628 363 429 512 655 593 423 456 650 607 670 432 587 728 434 462 415 469 747 406 585 360 668 576 551 674 360
Diesel 397 428 330 400 437 470 444 393 331 470 428 330 398 479 617 330 335 336 382 440 355 368 330 621 449 368 674 330
Sour
ce: a
cea
- 201
3So
urce
: eur
oPea
n co
mm
issi
on -
2013
hungary
denmark
sweden
romania
Finland
Greece
ireland
Poland
Portugal
Belgium
czech republic
italy
latvia
lithuania
netherlands
spain 19.6%
19%
18%
17%
15%
25%
24%
21%20%
27%
23%

eu27
AT Austria
Be Belgium
BG Bulgaria
CY Cyprus
CZ Czech Republic
De Germany
DK Denmark
ee Estonia
eS Spain
FI Finland
FR France
GR Greece
Hu Hungary
Ie Ireland
IT Italy
LT Lithuania
Lu Luxembourg
LV Latvia
MT Malta
NL Netherlands
PL Poland
PT Portugal
RO Romania
Se Sweden
SI Slovenia
SK Slovakia
uK United Kingdom
OTHeRS
CH Switzerland
IS Iceland
NO Norway
RS Serbia
Ru Russia
TR Turkey
uA Ukraine
euROPe EU27 + EFTA eFTA Iceland + Norway + Switzerland NAFTA USA + Canada + Mexico BRIC Brazil + Russia + India + China MeRCOSuR Argentina + Brazil + Paraguay + Uruguay ASeAN Brunei + Cambodia + Indonesia + Laos + Malaysia + Myanmar + Philippines + Singapore + Thailand + Vietnam
AAA Auxiliary Automobile Association VDA German Association of the Automotive Industry OICA International Organization of Motor Vehicle Manufacturers
CARS
PC Passenger cars
SUV Sport utility vehicles
MPV Multi-purpose vehicles
VANS
LCV Light commercial vehicles + minibus / coaches 3.5t
TRuCKS
MCV Medium commercial vehicles > 3.5t but 16t HCV Heavy commercial vehicles > 16t CV MCV + HCV
BuSeS + COACHeS
B&C Buses > 3.5t
MOTOR VeHICLeS
MV Cars + vans + trucks + buses & coaches
PM particulate matter NOx nitrogen oxides CO carbon monoxide CO2 carbon dioxide
m million bn billion g gramme t tonne tkm tonne-kilometre pkm passenger-kilometre GCW gross combined weight GDP gross domestic product
Avenue des Nerviens 85
B–1040 Brussels
T +32 2 732 55 50
www.acea.be
european auTomobile manufacTurers associaTion www.acea.be
european auTomobile
manufacTurers associaTion