Embed Size (px)
Citation preview
EUROPEAN AND WORLDWIDE UPDATE: NATURAL GAS VEHICLES
Working Party on GAsUnited Nations
Palais Nations, Geneva20 January 2009Presented by: Jeffrey Seisler
on behalf of:

International Association forNatural Gas Vehicles
Latin America
Asia Pacific
USA Pakistan IndiaCanadaNew
ZealandEurope
Regional Associations National Associations
Individual Members
Austria -Bulgaria – Canada - CzechFinland - France - Germany
Greece - Iceland - Italy – Ivory Coast – Netherlands - Norway --Portugal – Serbia - S. Africa -
Switzerland – Sweden -Ukraine - UK
Bangladesh - India Japan - Korea
Malaysia - Thailand Etc.
Argentina - Brazil Peru – Venezuela
Etc.Australia - Columbia – Egypt
Hong Kong - Iran - Mexico Nigeria - PakistanTrinidad & Tobago
Countries withDelegate Representation
Over 600 Members from 50+ Countries
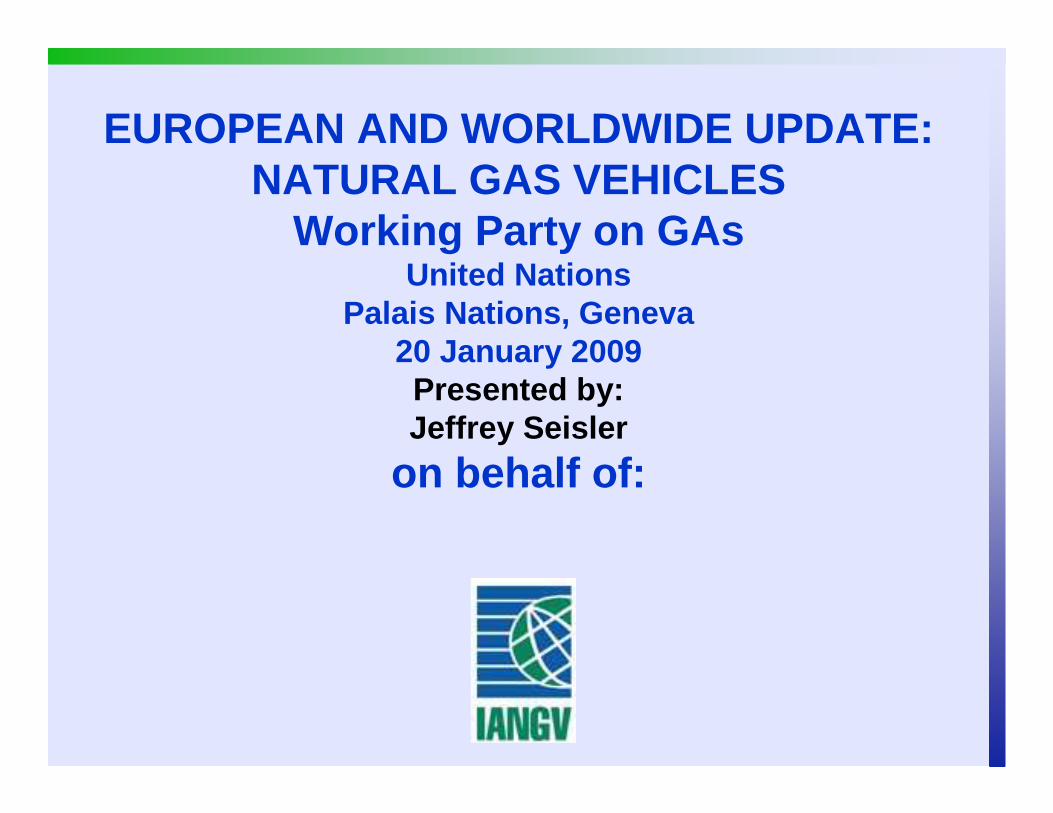
Canada 12.140
USA 100.000
Venezuela 44.146Colombia 269.753
Bolivia 99.657
Argentina 1.740.911
Brazil 1.572.648
Egypt 98.738
China 336.062
Europe (incl. IT & RU)1.090.195
Russia 95.000
Thailand 117.727
World Total~ 9.4 M 14.169 1455
= Existing Fuel Stations = Under construction
NGVs IN THE WORLD2009
Data source: The GVR, January 2009
Italy
580.000
India 821.871
Australia 2.453
Iran 846.169
Pakistan 1.900.000 Japan
35.720

THE TOP TEN COUNTRIES WORLDWIDE
Country NGVs*Fuel
Stations*
% CNG Price less than Petrol
Pakistan 1.90 mil 2.430 46.7%
Argentina 1.74 mil 1.800 69.1%
Brazil 1.57 mil 1.683 52%
Iran 846.169 637 81.7%
India 821.872 325 68.4%
Italy 580.000 700 55.4%
China 336.062 1260 46.5%
Colombia 269.753 401 38.5%
Bangladesh 180.000 296 67.3%
Ukraine 120.000 224 67.5%
•Rounded up figures
Data source: The GVR, January 2009

THE TOP TEN COUNTRIES WORLDWIDE: NGV % of Total Vehicles
Country NGVs*Total Vehicle Population(Millions)
% NGVs
Pakistan 1.90 mil 6.85 24.1%
Argentina 1.74 mil 8.20 21.1%
Brazil 1.57 mil 25.59 6.1%
Iran 846.169 14.90 5.68%
India 821.872 13.92 5.9%
Italy 580.000 40.37 1.44%
China 336.062 40.09 0.84%
Colombia 269.753 36.00 0.7%
Bangladesh 180.000 0.852 21.1%
Ukraine 120.000 8.17 1.47%
•Rounded up figuresData source: The GVR, December 2008 & Wards 2007.

GROWTH RATES 2007-2008January 2009
2007 2008 %
WORLD 7.55 Million 9.44 Million 25%
CHINA 200,873 336.062 67.3%
BRAZIL 1.48 Million 1.57 Million 6.1%
EUROPE 748,749 1.09 Million 45.6%
UKRAINE 100,000 120.000 20%
ITALY 432,900 580.000 34%
Source: GVR Jan. 2009
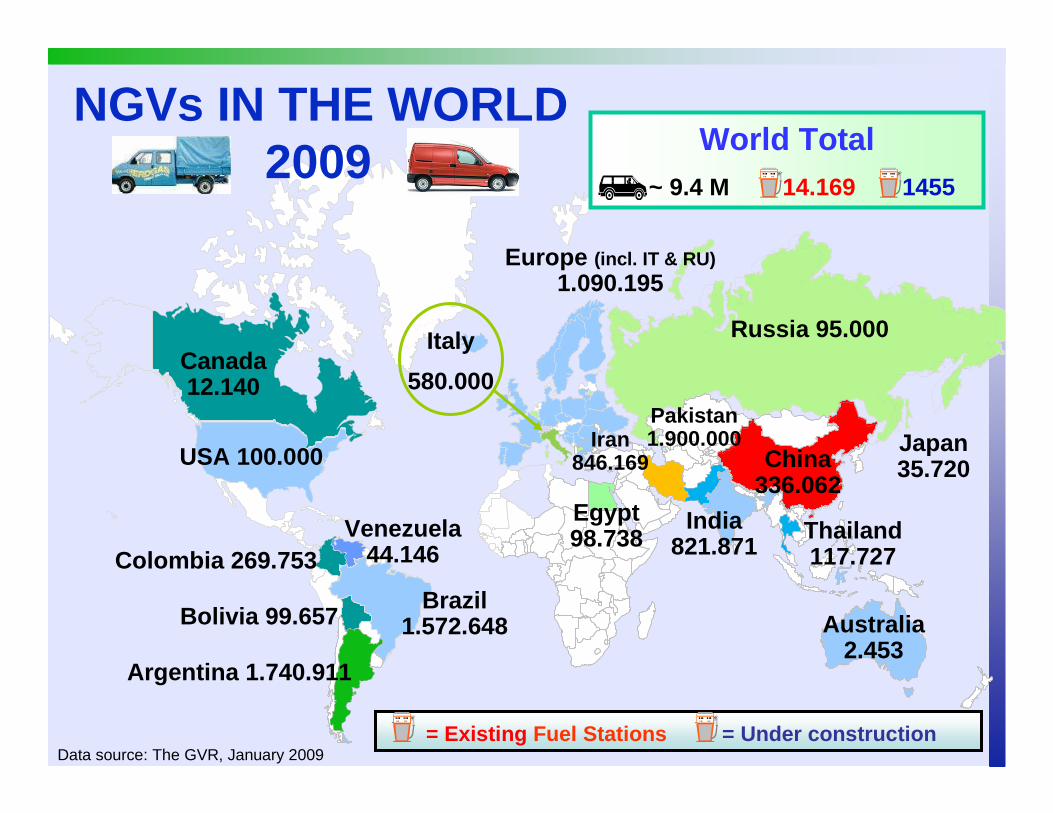
GROWTH RATES 2007-2008January 2009
2007 2008 %
ARGENTINA 1.67 Million 1.74 Million 4.2%
PAKISTAN 1.65 Million 1.90 Million 15.2%
INDIA 334,820 821.872 145.5%
BANGLADESH 80,000 180.000 125%
Source: GVR Jan. 2009

NGV TECHNOLOGY IS AVAILABLE
• Technology is commercial in many parts of the world• More OEM Products available than any other
alternative fuel vehicles– ~65 Manufacturers worldwide producing 295+
vehicle models & engines• Distribution needs integration into OEM country
networks

NGVs IN EUROPE

Data source: The GVR, January 2009
Europe Total~ 1.090.195
NGVsRefuelling Stations ~ 3,028
Sweden 15.474
Belarus 5.500
France 10.150
Germany 64.454
Russia95.000
Ukraine 120.000
Italy580.000
UK368
Czech 1.230
Poland 8.850
Spain 1.863
Bulgaria60.255
Moldova 5.000
CH6.820
Austria 3.574
Turkey 3.056
Netherlands 1.100

* Rounded upfigures
Data source: The GVR, January 2009
Sweden 118
Belarus 25
France 125
Germany 804
Russia224
Ukraine 224
Italy 700
UK25
Czech 33
Poland 31
Spain 42
Bulgaria 70
Moldova 14CH
106
Austria 170
Turkey 9
Total Fuelling Stations (Public and Private)
January 2009
Europe Total~ 1.090.195
NGVsRefuelling Stations ~3.028
StationsUnder
Construction 169
Netherlands21

* Rounded upfigures
Data source: The GVR, January 2009
Sweden 131
Belarus 220
France 81
Germany 80
Russia424
Ukraine 536
Italy 829
UK15
Czech 37
Poland 285
Spain 44
Bulgaria 861
Moldova 357CH
64
Austria 21
Turkey 340
ratio = # vehicles per fuelling station
Vehicles per fuelling station(600-1000 vehicles per station economically is optimal)
January 2009Europe Total~ 1.090.195
NGVsRefuelling Stations ~3.028
StationsUnder
Construction 169
Netherlands 53

EUROPE’S 5.000+ CLUBCountry NGVs* Fuel
Stations**% Nat.Gas
Price of Petrol
Italy 480,000 700 55.4%
Ukraine 120.000 224 67.5%
Russia 95.000 224 63.0%
Germany 64.454 804 55.7%
Bulgaria 60.255 70 48.1%
Sweden 15,474 118 39.2%
France 10.150 125 58.4%
Poland 8.850 31 57.5%
Switzerland 6.820 106 55.1%
Belarus 5.500 25 56.24%
* Rounded up figures** Total StationsData source: The GVR, January 2009

EUROPE’S <1.000 CLUBCountry NGVs* Fuel
Stations**% NG Price of
Petrol
Latvia 500 4 73.4
Greece 416 1 ?
Portugal 379 6 54.2
U.K. 368 25 53.0
Slovakia 337 7 54.5
Belgium 300 9 66.2
Finland 250 9 51.1
Serbia 210 7 67.8
Norway 180 9 71.3
Croatia 130 1 71.3
* Rounded up figures** Total Stations
Data source: The GVR, January 2009

EUROPE’S <1.000 CLUB
Country NGVs* Fuel Stations % NG Price of Petrol
Hungary 122 3 ?
Luxembourg 115 4 55.07%
Iceland 77 1 41.7%
Macedonia 50 1 ?-
Liechtenstein 41 1 22.6%
Lithuania 17 1 ?
Bosnia & Herz.
7 3 65.6%* Rounded up figures
Data source: The GVR, January 2009

Target Markets for NGVsTarget Markets for NGVsDedicated fleet vehicles Publicly fuelled NGVs
Urban buses
Heavy Duty Vehicles
Off-road Vehicles
Light/Medium Duty Vehicles
Individual Vehicles
Flavio Mariani, Flavio Mariani, Metauto - Eni divisione Gas & PowerSeptember, 20 -21 2005 – Cattolica

ITALIAN NGV GROWTH & FUELLING STATION GROWTH
IS BALANCED
280 290 300320
350 382
400.8 381.25
402.3370
280 290
355 360 368421
463 460
521543 609 fuel stations
050
100150200250300350400450500
1995
1996
1997
1998
1999
2000
2001
2002
2003
2004
2005
2006
2007
0
100
200
300
400
500
600
700NGV FS
NGV
(x 1000)
NG
(x 1)
Source: The GVR 01.2007
580 NGVs

Available Light Duty OEM Vehicles (4 manufacturers/10 styles/17 models)
• FiatDoblo Passenger CarDoblo VanDucato Passenger CarDucato VanMultipla ELXMultipla ELX BlupowerMultipla SXMultipla Van
• CitroenBerlingo Multispace PlusBerlingo Kastenwagen 600Jumper Kastenwagen 33MH• OpelZafiraCorsa• PuntoPunto VanPunto PuntoSiena 1.4 TetrafuelPanda Panda or Panda Aria

GERMAN NGV GROWTH
19400
39000
64454
60000
25000
1500011000
34000
400 1000 2000 300042005500
7500
804655 720
35 50 65 80100 120 140
190
230
390
530
640
0
10000
20000
30000
40000
50000
60000
70000
1994
1996
1998
2000
2002
2004
2006
2008
0
100
200
300
400
500
600
700
800
900
NGV FS
NGV
(x 1)
NG
(x 1)
Source: The GVR

NGVs in SwitzerlandWhere they are today
26
35
50
61
78
98 100
350 730 1.245 1.9003.300
6.000
9.000
14.000
19.000
25.000
30.000
0
20
40
60
80
100
120
2002 2003 2004 2005 2006 2007 2008 2009 2010 2011 2012
Erd
gast
anks
telle
n
0
5.000
10.000
15.000
20.000
25.000
30.000
35.000
Erd
gasf
ahrz
euge
Situation in November 2008:> 100 CNG fuelling stations> Just under 7.000 NGVs
Objective 2012 : 30.000 vehicles to get return on investment. of €40 to 50 million for 100 fuelling stations
CN
G F
uelli
ng s
tatio
ns
Vna
tuar
l gas
veh
icle
s
SVGW 2009


China NGV Overview
• 336,000 NGVs NG Cars = 95,545; NG Buses =~9,500; ‘other’= 195,000 (April 2008)
• NGVs represent 0.57% of total vehicle population (106.8 million total vehicles)
• 561 CNG fueling stations (81% are public; 19% private fleet operators)
• 598 NGVs per fueling station, • 74 cities have NGV fuelling stations

Gas Demand Outpacing Supply

China’s LNG Demand• Shanghai using 40,000
taxis on CNG (sourced from LNG)– Source is 100,000 gallon per
day liquefaction facility– 500 trucks transporting LNG
over 4,000 km (coming along the west-east pipeline)
– Originally planned to go by rail but did not get approval;
• Communities use LNG to directly serve residential households– Bypassing traditional pipeline
infrastructureSource: Max Universal, Inc.

WHAT ARE THE MARKET DRIVERS FOR NGVS IN
THEIR WORLD CONTEXT?

Primary Motivators to Develop NGV Program
• Economics• Environment• Energy security*
*Energy security ‘rationale’ includes policies to substitute the domestic use of oil by natural gas with the aim of increasing oil exports (i.e. Venezuela, Iran) or protect against imbalance of trade due to oil imports (India, Bangladesh, etc.)

WORLD WIDE TRENDS
• CNG will continue to grow; maybe not at the same rate as the past few years, but in many countries, very steadily
• LNG popularity will help drive the L-NGV market- China; Australia; Thailand; US; Spain; Russia;
Netherlands
• Biogas-to-biomethane will advance, but will be dependent on public commitment to new waste management infrastructure
- Sweden, Switzerland, Austria, France, Germany

Government Support
• Government incentives remain a key to NGV development
• A wide variety of government incentives have appeared worldwide
- Fiscal: cash rebates; exemption from congestion charges; tax benefits (road, income, property fuel; etc.)
- Free parking; lanes at airports/train stations
• Some countries mandate NGVs- Venezuela: 40,000 NGVs- Iran: As many that can be converted- India: Diesel buses, 8 regions and more to expand

INNOVATIONS WITH NGVs

4 cylinders, 1.6 l5.3 kg/100 km; 144 g CO 2/kmTurbo compressorMonovalent plus-CNG110 kW / 150 ch 210 Nm @ 2.300 rpm
From January 2009
A présent : 69 kW / 94 PS 133 Nm @ 4.200 rpm Source: Adam Opel AG
The new Opel Zafira 1.6 CNG Turbo
The Latest NGV of 2009

VW Passat TSI EcoFuelMotor 1.4l TSI CNGConforms to Euro-5
Engine power 110 kW / 150 chEngine speed 220 Nm (1.500 – 4.000 rpm)
Speed maxi. 210 km/hGears 6 manuelle, 7 DSG
Fuel Consumption* 4,6 kg / 100 kmEmissions CO2* 120 g / km
Driving Range on Total > 820 km On CNG & Petrol CNG > 420 km
3 CNG tanks 135 litres (22 kg)Driving range on gasoline 400 kmPlastic tanks with capacity of 31 litres
First quarter 2009
Source: Volkswagen AG
The Latest NGV of 2009

Innovative NGVs
The ‘modern’Tuk Tuk
Source: Swiss Gas & Water Association

AIRPORT TRACTOR
Source: Swiss Gas & Water Association

Natural Gas Injector with Pilot Diesel InjectorDual Fuel Operation
Diesel
GNC HP
Came
Poussoir
Diesel GNC
Servo
Injecteur
Unified injection
Naturalgas jet
dieselPilotinjection
Source: Swiss Gas & Water Association

Development s with new composite CNG tanks
Dedicated natural gas vehicle with integrated storage system
Supplemental cylinders are integrated into the vehicle bodyTransparent as a petrol vehicle
Source: Swiss Gas & Water Association

3-Wheel natural gas urban vehicle prototype by BMW with removable fuel storage system by WEH

OUTLOOK FOR NGVs is POSITIVE
• Economics (fuel price differential) should remain favorable (<30-50% natural gas to gasoline)
• Vehicle manufacturers should be motivated to provide more factory made NGVs– Environmental benefits, esp. CO2 excellent– Demand increasing (show us a market, we’ll show
you a vehicle!)– Balance between fuel alternatives will occur
• Natural gas is available and supply is strong• Government support should be positive• Fuel suppliers (pipeline/LNG) should be encouraged• Biomethane provides a renewable energy option

International Association for Natural Gas Vehicles – IANGV
Representing and in consultation with
ALGNV (Latin America)
ANGVA (Asia-Pacific)
NGVA Europe
and
national NGV associations worldwide
www.iangv.org
Brett Jarman
Executive Director
Martin Siefert
Vice President – Govt and International Affairs