Embed Size (px)
Citation preview
45th AIAA Aerospace Sciences Meeting & Exhibit, 8-11 Jan, 2007, Reno, NV
Euler Solutions of Flow around a Rectangular Wing
with Square Tip
Shuchi Yang∗, Shijun Luo†, Feng Liu‡
Department of Mechanical and Aerospace EngineeringUniversity of California, Irvine, CA 92697-3975
Her-Mann Tsai§
Temasek LaboratoriesNational University of Singapore
Kent Ridge Crescent, Singapore 119260
Low speed flows about a high-lift rectangular wing with square lateral tip are computedby a three-dimensional compressible Euler flow solver. Flow separation around the squaretip of the wing is studied. The flow is, otherwise, attached to the surface of the wing. Thepressure distributions over the upper and lower surfaces of the wing, especially on the outerportion of the wing and the generation and evolution of the tip vortices in the near field ofthe wing are computed by the Euler method and validated by a comprehensive wind-tunneltest data in the literature. The effects of the wind-tunnel wall are not considered in thecomputations.
I. Introduction
The vortices shed from an aircraft wing can pose a hazard to other aircraft that penetrate them andthose from helicopter rotor blades and propeller blades interact with following blades causing rotor noiseand vibration. To alleviate the potential hazards posed by the tip trailing vortices, the wing pressure andthe accompanying tip-vortex-wake must be measured and predicted accurately and controlled to ensureflight safety. Numerous experimental, theoretical and computational investigations have been conducted toimprove the understanding the generation and evolution of the tip-vortex structure. An excellent review ofthe underlying theories was given by Spalart.1
Wind-tunnel tests produce flow fields of good quality and accurate measurements. However, examiningtrailing vortices from a rotor in wind tunnel is relatively complex than that from a fixed wing. Fortunately,the structure of a trailing vortex from a rotor blade is essentially the same as that from a fixed wing.2 Thewing configurations studied in most tests were a fixed, rectangular wing with a constant and untwisted airfoilalong the entire span. McAlister et al.3 made an extensive measurements of the pressure on the upper andlower surface of a NACA 0015 rectangular fixed semi-span wing and the velocity across the vortex trailingdownstream from the tip of the wing in a large-scale production wind tunnel. The velocity profiles weremeasured by a two-component laser velocimeter. The data feature a detailed comparison between wing tipswith square and round lateral edges. In the same wind tunnel, Chigier et al.4 measured tip-vortex propertiesat several chord-wise stations above the surface of an untwisted, NACA 0015 rectangular wing with squaretip using hot-wire anemometers. Francis et al.5 using a hot-wire anemometry probe in a low-turbulencelaboratory wind tunnel, measured the mean velocity field in the vicinity of the flat tip of a NACA 64009rectangular fixed wing. Birch et al.6 using a miniature seven-hole pressure probe in a low-turbulence wind
∗Post-Doctoral Researcher. AIAA senior member†Researcher.‡Professor. Associate Fellow AIAA.§Principal Research Scientist, AIAA Member
1 of 20
American Institute of Aeronautics and Astronautics Paper 2007–0896
45th AIAA Aerospace Sciences Meeting and Exhibit8 - 11 January 2007, Reno, Nevada
AIAA 2007-896
Copyright © 2007 by the authors. Published by the American Institute of Aeronautics and Astronautics, Inc., with permission.

tunnel and particle image velocimetry in a laboratory tow tank, measured the formation and growth of thevortex along the square tip of a rectangular high-lift wing. Zhang et al.7 using particle image velocimetryin a laboratory wind tunnel, measured the near-field vortex shed from the tip of a NACA 0012 rectangularfixed semi-span wing and modeled it with the exponential vortex solution of Lamb-Oseen vortex.
Computational fluid dynamics has proven to be a useful tool for the simulation and prediction of rotor-blade flow.8 Methods ranging from the linear doublet-lattice method to methods that solve the Navier-Stokes equations have been developed. The linear doublet-lattice method is efficient in computer time butis hampered by the necessity for user supplied initial conditions and assumptions which model vortex sheettransition from the bound to free state.9–11 A Reynolds-averaged Navier-Stokes calculations for a fixed wingwith rounded tip were performed by Dacles-Mariani et al.12 They used experimentally determined inflowand outflow boundary conditions and a modified Baldwin-Barth turbulence model and reported that theycould resolve the outer portion of the vortex but could not resolve the viscous portion of the core owing tolarge numerical diffusion and a deficiency in one-equation turbulence models. In between the preceding twoextremes, the Euler equations were used to calculate the flow about high-lift rectangular wings with squaretip by Strawn.13 Unfortunately, his calculations missed the increase in suction on the upper surface nearthe wing tip which had been recognized to occur due to the low static pressure in the core of the tip vortexand led him to doubt the capability of the Euler equations for modeling the detail of the flow-field near thesquare wing-tip.
The present studies are undertaken in an attempt to clarify that the Euler equations can model theessential effects of the square tip on the pressure distribution over the wing and the downstream near-fieldflow for a high-lift rectangular wing. It is well known that simulations of vortex flow over a sharp leading-edge delta wing at high angles of attack can be achieved by Euler methods. Although the secondary vorticesare absent in the Euler solutions, the gross dominant characteristics of the flow-field, i.e. the primary vortexand the distributions of the static pressure, the velocity components and the total-pressure loss in the vortexcore are reproduced. See, for example, Murman et al.,14 Rizzi,15 Rizzetta et al.,16 Powell et al.17 and Cai,et al.18 For the case of the rectangular wing, air particles from the lower surface near the square tip follow atrajectory that takes them around two sharp corners before forming a vortex on the upper surface. Betweenthe two sharp corners the boundary layer over the lateral surface of the wing tip may experience separations,but they have likely minor effects on the entire flow around the square tip of the wing.
The Reynolds-averaged Navier-Stokes methods encompass the most complete flow model short of large-eddy simulations or direct numerical simulations. However, their usefulness is limited by uncertainties inturbulence modeling, grid resolution, numerical damping effects, and difficulties in grid generation. Advancesin computer speed and maturity of algorithms for the Euler equations have made the solution of the Eulerequations a rather dependable and routine tool. Although the Euler equations cannot account for theviscous effects in the boundary layer, they can capture automatically and simulate correctly the shear layerseparated from the sharp edge and its spirally rolling up into a vortex core over the body leeward side.Because of the requirement of large computing resources by a Navier-Stokes code and also unresolved issuesregarding accuracy of current numerical algorithms for the Navier-Stokes equations, the Euler equationsstrike a good balance between completeness of the flow model and computational efficiency for calculatinghigh-lift rectangular wing with square tip.
The thoroughly measured cases of a rectangular wing with square tip in Refs. 3 are chosen for the codevalidation. The wind-tunnel interference is not simulated in the computations since the inflow and outflowboundary conditions are unknown to the present authors. Free-air flow is computed by an Euler solver. It isassumed that the pressure distribution over the wing surface and the tip-vortex behavior in the downstreamnear-field of the wing determined by the wind-tunnel test are very close to those in the free-air flow. In thefollowing sections, the Euler method is first presented and then applied for the investigations.
II. Euler Method
The present Euler solver is based on a multi-block, multi-grid, finite-volume method and parallel code forthe three-dimensional, compressible steady and unsteady Euler and Navier-Stokes equations. The methoduses central differencing with a blend of second- and fourth-order artificial dissipation and explicit Runge-Kutta-type time marching. The coefficients of the artificial dissipation depend on the local pressure gradient.The order of magnitude of the added artificial dissipation terms is of the order of the truncation error of thebasic scheme, so that the added terms have little effect on the solution in smooth parts of the flow. Near
2 of 20
American Institute of Aeronautics and Astronautics Paper 2007–0896

the steep gradients the artificial dissipation is activated to mimic the physical dissipation effects. The solverhas been validated for a number of steady and unsteady cases.19–22
The present Euler solver was originally designed for compressible flows. It is known that the numericalsolution of a compressible flow solver may not converge to the physical incompressible flow as the free-streamMach number goes to zero. To remove this problem, a pre-conditioning techniques to treat the compressible-flow solver were proposed by Turkel.23 However, in many cases, there exists small nonzero free stream Machnumbers at which the compressible code would yield good approximate low speed flows.24 The free-streamMach numbers M∞ = 0.13 and 0.25 investigated in Ref. 3 are used in the computations.
The NACA 0015 rectangular wing with square tip and aspect ratio of 6.6 at an angle of attack α = 12◦
is computed. On the wing surface the flow normal velocity component is set equal to zero. Semi-wing isconsidered. On the symmetry plane, symmetric boundary condition is applied. The far field boundary islocated at 20c away from the wing, where c is the wing chord. Characteristic-based conditions are used onthe upstream boundary of the grid. On the downstream boundary, all flow variables are extrapolated. Theinitial condition is the free-stream flow.
It is well known that proper grid resolution of vortex is crucial to compute the correct growth rateof a vortex. Accurate finite difference computations of vortical flows require resolution of not only thevicinity of the wing surface but also the region of the tip vortices where high flow gradients prevail. Theinaccuracy caused by poor resolution manifests itself in the form of excessive numerical dissipation. It is alsodetermined that the vortex is more sensitive to the cross-flow-plane grid-refinement than the stream-wisegrid-refinement. For these reasons, sufficient grid density and appropriate distribution are essential to thesuccess of the computations.
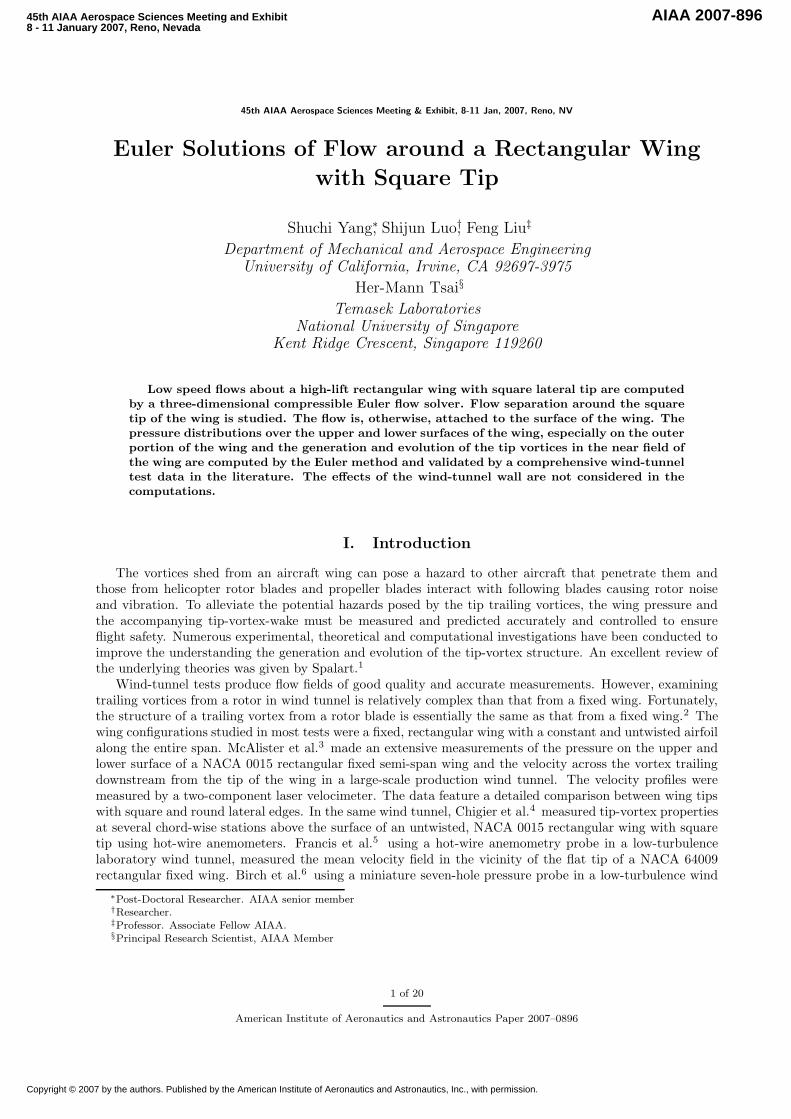
The grid used for the computations of the NACA 0015 rectangular semi-span wing is composed of twoblocks. Block 1 covers the entire flow-field except the space enclosed by the cylindrical surface which is thespan-wise extension of the wing surface and the enclosed space is Block 2. The topology of the grid for Block1 and Block 2 is C-H and H-H, respectively. Fig. 1 presents a three-dimensional view of the C-H grid and across-sectional view normal to the span-wise direction of the H-H grid.
The grid-refinement study is performed on three grids of different sizes from the coarse to the fine asshown in table 1 where the three numbers for the C-H grid are in the circumferential, radial and span-wisedirections, respectively, and the three numbers for the H-H grid are in the chord-wise, chord-normal andspan-wise directions, respectively.
Table 1. Three grid sizes from the coarse to the fine.
Grid C-H H-H
Coarse 193× 65× 97 65× 33× 49
Medium 193× 65× 129 65× 33× 65
Fine 513× 97× 129 129× 33× 65
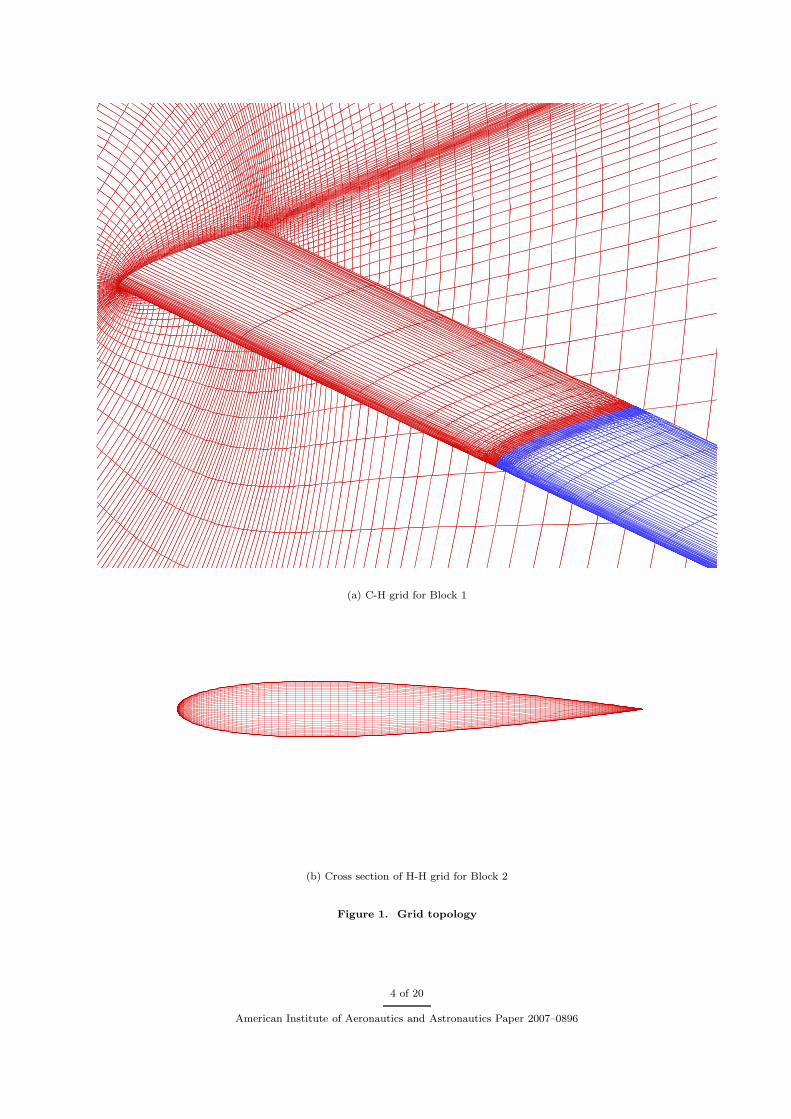
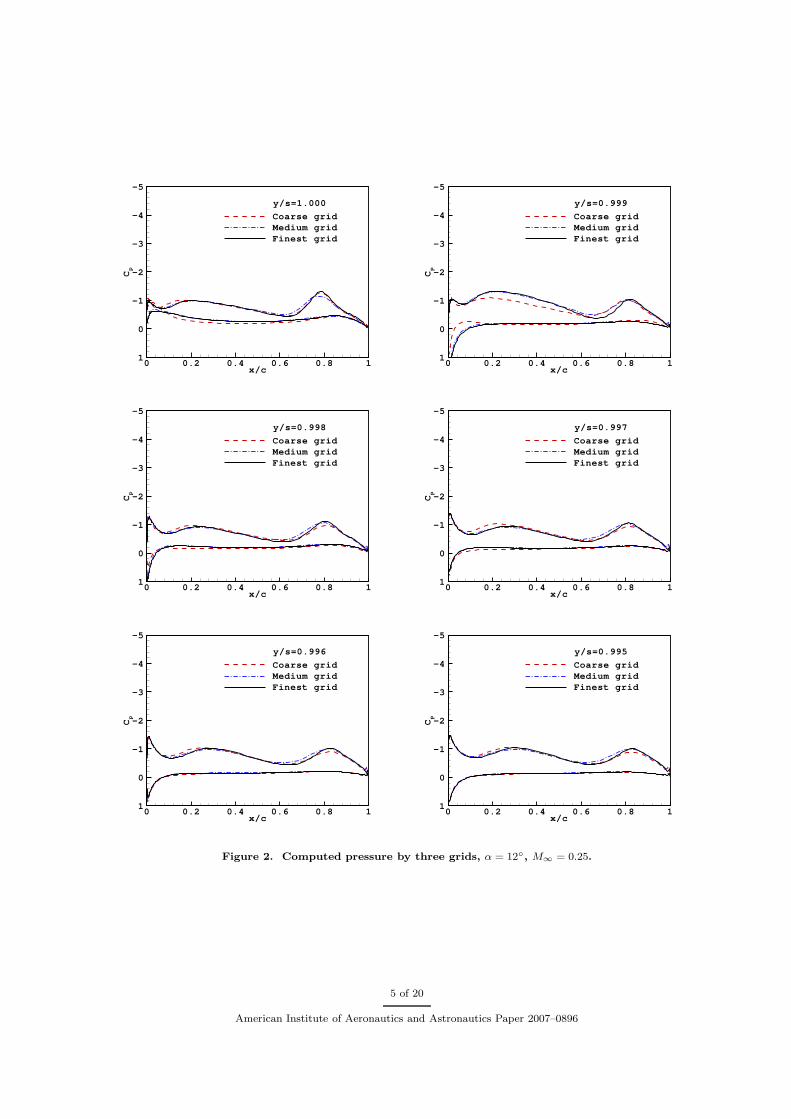
The computed pressure coefficients at angle of attack α = 12◦ using the three grids are compared in Figs.2 and 3 for M∞ = 0.25 and 0.13, respectively. The pressure over the outer sections of the the wing is mostsensitive to the grid refinement. The six outer sections in the range of y/s = 1.000−0.995 are considered. Ascan be seen in these figures, grid independence is achieved for the fine grid at the free stream Mach numbersM∞ = 0.25 and 0.13 and angle of attack α = 12◦. Thus, the fine grid is used in the following computations.
The grid shown in Fig. 1 is the fine grid. Only every other grid is plotted for the C-H grid for clarity. Thetotal grid number of the fine grid is 6, 695, 874. In the C-H grid, of the 513 grid points in the circumferentialdirection, 256 points are used on the wing surface. It is seen that the grid points are clustered in the vicinityof the wing tip and the leading and trailing edges of the wing. Vortex core is defined as the region wherethe rise of vorticity and the drop of static-pressure become significant. It is assumed that the cross sectionof the vortex core has a size approximately equal to the maximum thickness of the airfoil, 0.15c. More than30× 30 grid points are used in the cross flow plane to resolve the vortex core, which is equivalent to a gridspacing of 5× 10⁻³c or smaller. It is noted that to resolve the vortex core about 100× 100 grid points maybe needed in the cross-flow plane as shown by Cai et al.18 The fine grid used in this paper is chosen based ona balance between the grid-independence requirement and the computing resources available to the present
3 of 20
American Institute of Aeronautics and Astronautics Paper 2007–0896
(a) C-H grid for Block 1
(b) Cross section of H-H grid for Block 2
Figure 1. Grid topology
4 of 20
American Institute of Aeronautics and Astronautics Paper 2007–0896
x/c
Cp
0 0.2 0.4 0.6 0.8 1
-5
-4
-3
-2
-1
0
1
Coarse gridMedium gridFinest grid
y/s=1.000
x/c
Cp
0 0.2 0.4 0.6 0.8 1
-5
-4
-3
-2
-1
0
1
Coarse gridMedium gridFinest grid
y/s=0.999
x/c
Cp
0 0.2 0.4 0.6 0.8 1
-5
-4
-3
-2
-1
0
1
Coarse gridMedium gridFinest grid
y/s=0.998
x/c
Cp
0 0.2 0.4 0.6 0.8 1
-5
-4
-3
-2
-1
0
1
Coarse gridMedium gridFinest grid
y/s=0.997
x/c
Cp
0 0.2 0.4 0.6 0.8 1
-5
-4
-3
-2
-1
0
1
Coarse gridMedium gridFinest grid
y/s=0.996
x/c
Cp
0 0.2 0.4 0.6 0.8 1
-5
-4
-3
-2
-1
0
1
Coarse gridMedium gridFinest grid
y/s=0.995
Figure 2. Computed pressure by three grids, α = 12◦, M∞ = 0.25.
5 of 20
American Institute of Aeronautics and Astronautics Paper 2007–0896

x/c
Cp
0 0.2 0.4 0.6 0.8 1
-5
-4
-3
-2
-1
0
1
Coarse gridMedium gridFine grid
y/s=1.000
x/c
Cp
0 0.2 0.4 0.6 0.8 1
-5
-4
-3
-2
-1
0
1
Coarse gridMedium gridFine grid
y/s=0.999
x/c
Cp
0 0.2 0.4 0.6 0.8 1
-5
-4
-3
-2
-1
0
1
Coarse gridMedium gridFine grid
y/s=0.998
x/c
Cp
0 0.2 0.4 0.6 0.8 1
-5
-4
-3
-2
-1
0
1
Coarse gridMedium gridFine grid
y/s=0.997
x/c
Cp
0 0.2 0.4 0.6 0.8 1
-5
-4
-3
-2
-1
0
1
Coarse gridMedium gridFine grid
y/s=0.996
x/c
Cp
0 0.2 0.4 0.6 0.8 1
-5
-4
-3
-2
-1
0
1
Coarse gridMedium gridFine grid
y/s=0.995
Figure 3. Computed pressure by three grids, α = 12◦, M∞ = 0.13.
6 of 20
American Institute of Aeronautics and Astronautics Paper 2007–0896

authors.The computation grid is designed to study the wing tip vortex only in the near field of the wing. The
grid points of the C-H grid are clustered in the vicinity in the wing plane. Since the downstream passage ofthe tip vortex is parallel to the local streamline, it will move away from the wing plane and finally out of thegrid-clustered region for the high-lift case. In this case, the tip-vortex in the downstream far-field can notbe accurately resolved by the present grid. On the other hand, the computation is performed under free-aircondition, while the measurements were conducted in a wind tunnel. The wind-tunnel-wall effects on thetip vortex would certainly grow up in the downstream direction and render the comparison of the far-fieldresults meaningless. For these reasons, the the present paper is confined to study the behavior of the tipvortex in the near field of the wing.
III. Pressure over Wing Surface, α = 12◦, M∞ = 0.25
The Euler method is validated by the experimental data base of Ref. 3. The wing has a rectangularplanform of aspect ratio 2s/c = 6.6 with an untwisted NACA 0015 airfoil and a square tip, where s is thesemi-span of the wing. The pressure measurements were performed at angle of attack α = 12◦, free-streamMach number M∞ = 0.25 and Reynolds number based on the wing chord, Re = 2.9×10⁶. No flow separationoccurs from the wing surface except in the vicinity of the wing tip. The Euler computations are made infree-air flow. No wind-tunnel wall is considered in the computations.
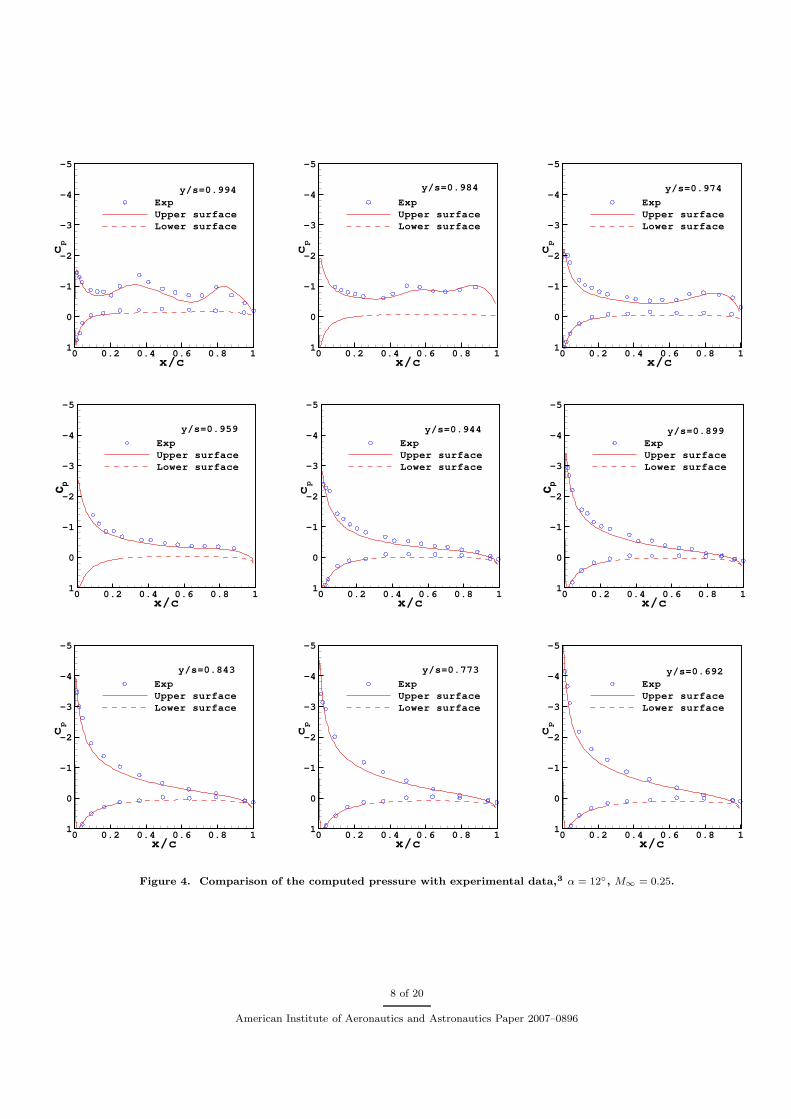
The effect of wing tip on the wing pressure is significant in the outer portion of the wing. The pressuremeasurements emphasizing the outboard region of the wing measured by Ref. 3 are compared with thepresent computations. Figure 4 presents the pressure coefficient cp over the upper and lower surfaces of thewing versus the chord-wise position x/c at the span-wise positions y/s ranging from 0.692 to 0.994. It isseen that unlike the calculations of Strawn,13 the present Euler computations predict very well the measuredpressure- suction peaks over the upper surface of the wing near the square tip.
There is a gradual reduction in aerodynamic load as the tip of the wing is approached, and in the regionnear the tip of the wing, the pressure distributions along the airfoil chord assume shapes that are distinctivefrom the inboard ones. There is a peculiar distortion over the upper surface of the outer portion of the wingin the range of 1.00 ≥ y/s ≥ 0.96. (See Figs. 2 and 4.) Based on the wing chord, the span-wise range ofthe tip-affected region is 3.3 ≥ y/c ≥ 3.17 whose width is about the maximum thickness ratio of the NACA0015 airfoil. After the suction peak that occurs near the leading edge over the upper surface, the pressurecurve exhibits two strong undulations in the square-tip case at α = 12◦. The first undulation appears nearx/c = 0.3 which is the location of the maximum thickness point of the wing airfoil. The second undulationoccurs behind the maximum thickness point around x/c = 0.8 where the local thickness ratio is 6.6%. At thespan-wise station y/s = 0.994, the suction-pressure peak of the undulations is as large as the suction peaknear the leading edge. At the outboard stations y/s = 1.000 and 0.999, the suction peak of the undulationsare even larger than the leading-edge suction-peak. (See Fig. 2.)
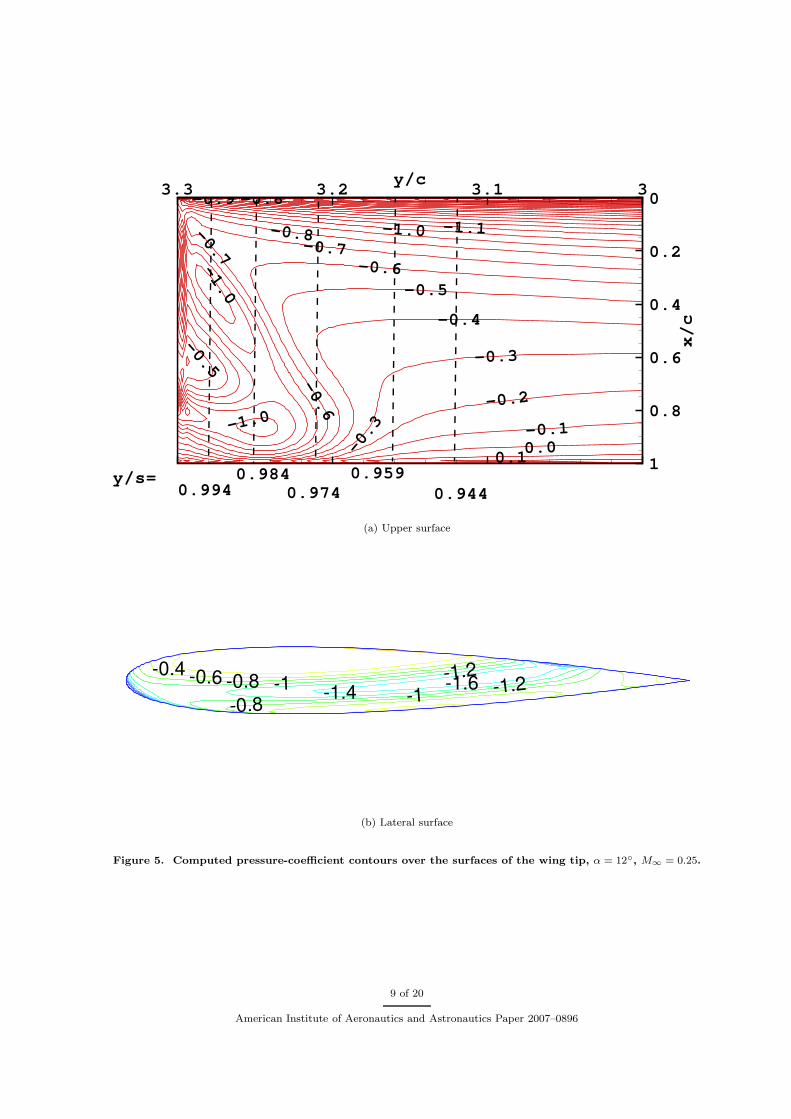
Figure 5 shows the computed pressure-coefficient contours over the upper and lateral surface of the wingtip at α = 12◦ and M∞ = 0.25. It is seen that the pressure distribution is highly three-dimensional for1.0 ≥ y/s ≥ 0.959 and nearly two-dimensional inboard of y/s = 0.959. There are two distinct suction-pressure regions over the upper surface besides the suction peaks in the vicinities of the leading edge andthe tip edge. Chigier et al.4 tested a rectangular wing of NACA 0015 airfoil, aspect ratio 5.33 and squaretip at angle of attack of 12◦. The measured pressure coefficient contours over the upper surface of the wingtip region were given in their Fig. 3 (b). The present computed results agree with them even though theaspect ratio of the wing for the two cases is different. Fig. 5(b) shows a low pressure corridor extendingfrom cp = −1.0 at x/c ≈ 0.07 and near the lower edge of the wing tip to cp ≈ −1.6 at x/c ≈ 0.7 and nearthe upper edge. The variations of the pressure distribution over the upper and lateral surfaces of the wingtip are associated with the passage of the vortices that are separated from the upper and lower edges of thesquare tip. (See next Section.)
The appearance of two undulations in the chord-wise pressure distribution near the wing tip is a charac-teristic of rectangular wing with square tip at high angle of attack and was also observed in other experiments,e.g., Ref. 4. For the rectangular wing with round tip at the same angle of attack, only one undulation inthe pressure distribution was observed.3 The same behavior has been observed in pressure measurementsconducted for a rotor wing having a rectangular planform, untwisted NACA 0012 airfoil with square andround tips25 at a pitch angle of 11.4◦. The round tip had a shape of half body of revolution whose local
7 of 20
American Institute of Aeronautics and Astronautics Paper 2007–0896
x/c
cp
0 0.2 0.4 0.6 0.8 1
-5
-4
-3
-2
-1
0
1
ExpUpper surfaceLower surface
y/s=0.994
x/c
cp
0 0.2 0.4 0.6 0.8 1
-5
-4
-3
-2
-1
0
1
ExpUpper surfaceLower surface
y/s=0.984
x/c
cp
0 0.2 0.4 0.6 0.8 1
-5
-4
-3
-2
-1
0
1
ExpUpper surfaceLower surface
y/s=0.974
x/c
c p
0 0.2 0.4 0.6 0.8 1
-5
-4
-3
-2
-1
0
1
ExpUpper surfaceLower surface
y/s=0.959
x/c
cp
0 0.2 0.4 0.6 0.8 1
-5
-4
-3
-2
-1
0
1
ExpUpper surfaceLower surface
y/s=0.944
x/c
c p
0 0.2 0.4 0.6 0.8 1
-5
-4
-3
-2
-1
0
1
ExpUpper surfaceLower surface
y/s=0.899
x/c
cp
0 0.2 0.4 0.6 0.8 1
-5
-4
-3
-2
-1
0
1
ExpUpper surfaceLower surface
y/s=0.843
x/c
cp
0 0.2 0.4 0.6 0.8 1
-5
-4
-3
-2
-1
0
1
ExpUpper surfaceLower surface
y/s=0.773
x/c
cp
0 0.2 0.4 0.6 0.8 1
-5
-4
-3
-2
-1
0
1
ExpUpper surfaceLower surface
y/s=0.692
Figure 4. Comparison of the computed pressure with experimental data,3 α = 12◦, M∞ = 0.25.
8 of 20
American Institute of Aeronautics and Astronautics Paper 2007–0896
0.0
-0.4
-0.3
-0.5
-0.3
0.1
-0.2
-1.0 -0.1
-0.7
-1.0
-1.0
-1.1
-0.9
-0.5
-0.8
-0.8-0.7
-0.6
-0.6
y/c
x/c
33.13.23.3 0
0.2
0.4
0.6
0.8
1y/s= 0.959
0.9440.9940.984
0.974
(a) Upper surface
-1.4-1.2
-1-0.8
-0.6-0.4-1
-1.6 -1.2-0.8
(b) Lateral surface
Figure 5. Computed pressure-coefficient contours over the surfaces of the wing tip, α = 12◦, M∞ = 0.25.
9 of 20
American Institute of Aeronautics and Astronautics Paper 2007–0896
diameter equals to the local thickness of the airfoil.It was shown that the Reynolds number has little effect on the pressure undulations in the square-tip
case, whereas the pressure undulation is more responsive to changes in the Reynolds number in the round-tipcase3 in the investigated Reynolds-number range of 1× 10⁶ ≤ Re ≤ 3× 10⁶. The apparent insensitivity toReynolds number in the square-tip case may be due to the transition-fixing nature of the sharp edge, as theflow accelerates around the sharp edge of the wing tip to form a vortex sheet and develop into a vortex coreon the upper surface of the wing. This explains why the Euler method can predict the peculiar pressuredistributions over the outer portion of the square-tip wing as shown in Fig. 4. Of course, to predict thepressure over the outer portion of a round-tip wing, a calculation of the boundary-layer separation must beincorporated with the Euler computation.
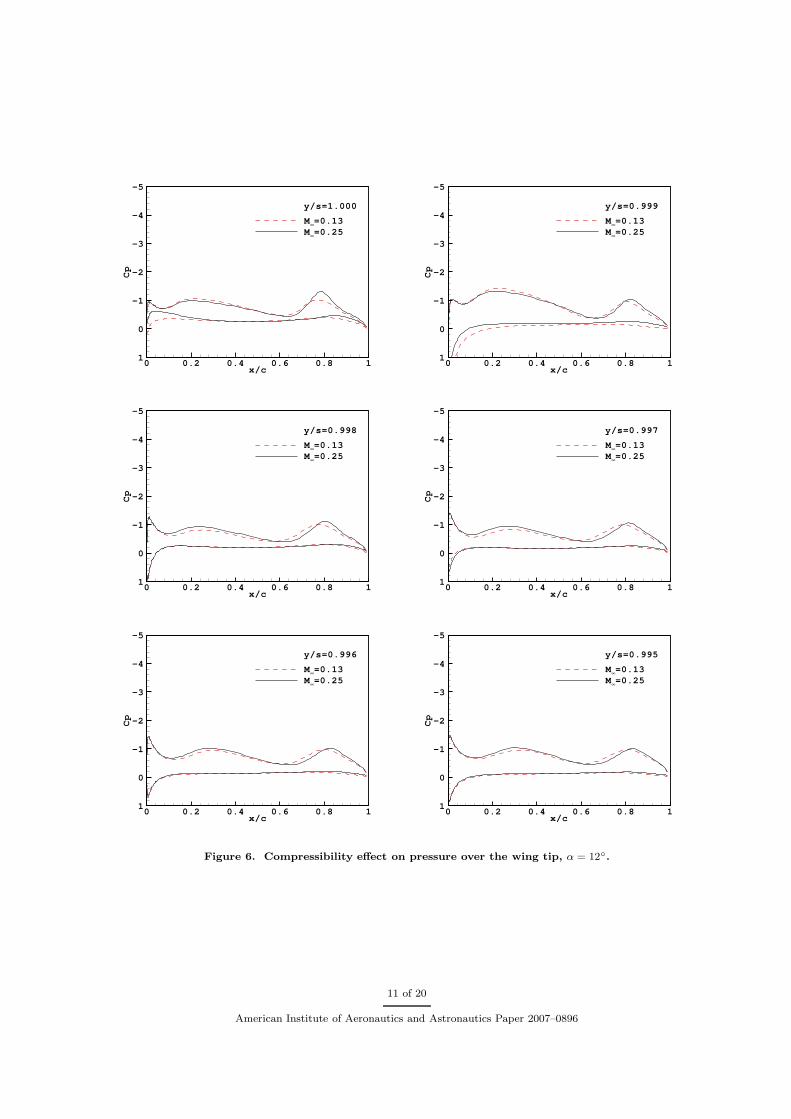
Although the free-stream Mach number is low, the local velocity in the vortex core can be high. Theeffect of the free-stream Mach number on the pressure over the wing tip region is studied. Figure 6 gives thepressure on outer portion of the wing computed at M∞ = 0.25 and 0.13 which were used by McAlister et al.3
The change of the pressure due to the change of M∞ is small, but not negligible. Thus, a compressible-flowsolver is needed for a good prediction of the pressure over the wing tip region even when the free-streamvelocity is low.
IV. Formation, Growth and Passage of Tip Vortices, α = 12◦, M∞ = 0.25
For the rectangular wing with high lift, under the pressure difference between the upper and lowersurfaces, the fluid particles move from the lower surface to the upper surface around the wing tip, and areseparated from the wing surfaces at the two sharp edges of the square tip. The separated flow experienceslarge velocity gradient and sharp loss in the total pressure. A total-pressure-loss coefficient ∆cpT is defined.
∆cpT = (pT − pT∞)/pT∞. (1)
where pT and pT∞ are the local total-pressure and the total-pressure in the free stream, respectively.The contours of the total-pressure-loss coefficient on the cross-flow planes x/c = 0.05 − 1.5 along the
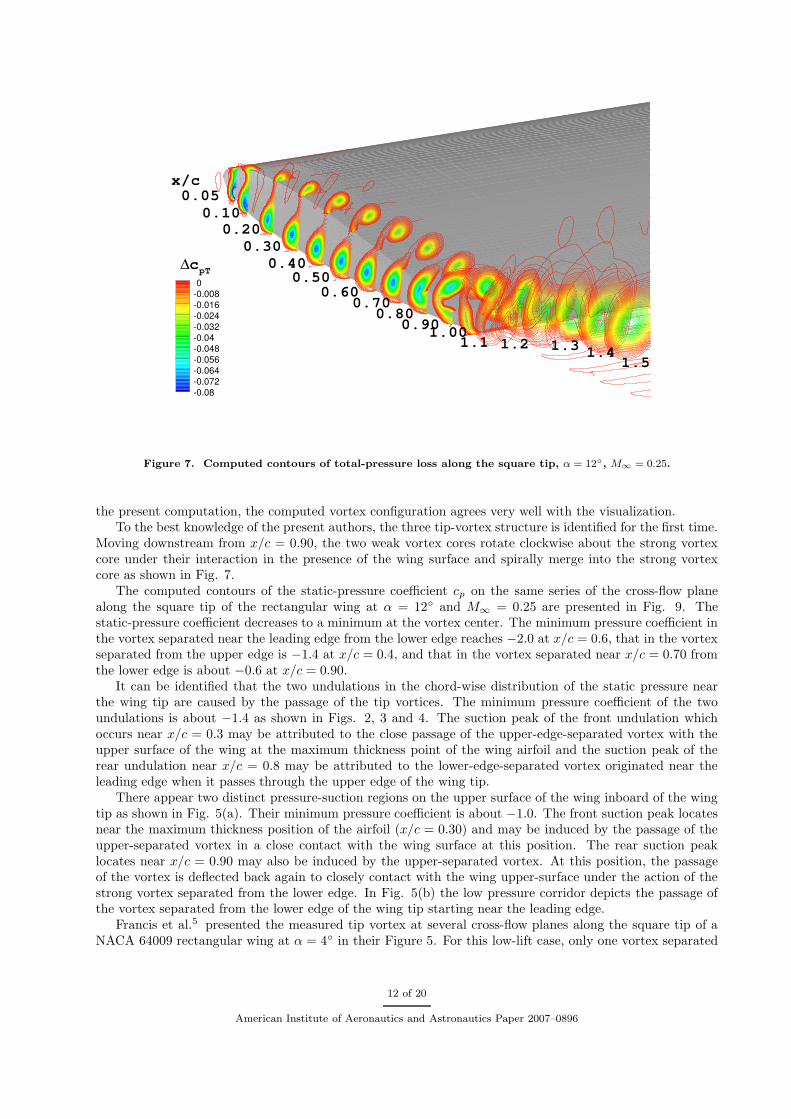
square tip of the wing at α = 12◦ and M∞ = 0.25 computed by the Euler solver are presented in Fig. 7. TheFigure clearly depicts the formation, growth and passage of the tip vortices. Vortex sheet is first producedby the separation at sharp edge and then rolls up into vortex core. Total-pressure loss occurs in the vortexsheet and the vortex core because there is large velocity gradient inside them. The larger the total-pressureloss is, the higher the vortex strength is. The computed total-pressure loss is captured by the action ofnumerical viscosity in the code. Fig 7 confirms the estimation used in the grid generation that the diameterof the vortex core can be as large as the maximum thickness of the wing airfoil.
Flow separations start to occur near the leading edge of the wing tip. The vortex separated from theupper edge of the square tip grows up on the upper surface of the wing and the vortex separated from thelower edge first grows up on the lateral surface of the square tip and then develops onto the upper surface.Both vortices rotate in the clockwise direction.
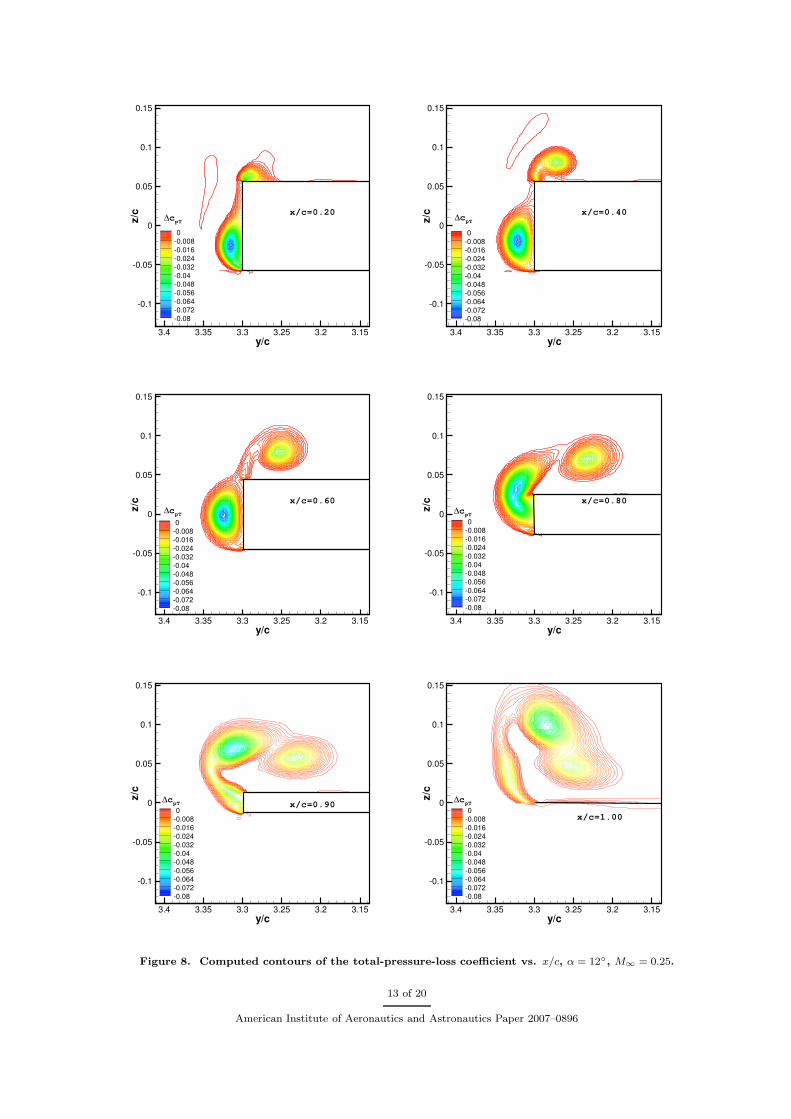
For clarity, the computed contours of the total-pressure-loss coefficient ∆cpT on a series of the cross-flowplane along the square tip of the rectangular wing at x/c = 0.20, 0.40, 0.60, 0.80, 0.90 and 1.00, α = 12◦ andM∞ = 0.25 are presented in Fig. 8. The cross section of the wing in the cross-flow plane is also shownfor reference in the Figure. The total-pressure-loss coefficient increases monotonically to a maximum at thevortex center. The maximum loss of the total pressure can be as large as 8% for the vortex separated fromthe lower edge starting near the leading edge of the wing. The maximum loss for the vortex from the upperedge is about 4%. As the lower-separated vortex develops onto the upper surface of the wing at x/c = 0.70,it detaches from the lateral surface at x/c = 0.90 and a new vortex core is formed on the lateral surface dueto the separation from the lower edge of the wing tip starting from x/c = 0.70. The new vortex core has amaximum total-pressure loss of about 4%. In summary, there are two distinguishable vortex cores upstreamof the cross-flow plane of x/c = 0.80 and three distinguishable vortex cores on x/c = 0.90 and 1.00. Amongthe three vortices, the vortex starting near the leading edge of the wing and separated from the lower edgehas the strongest strength.
The Figure 11 in Ref. 13 gave an experimental surface-oil-flow patterns on the lateral surface of thesquare tip of a rectangular wing observed by W.J. McCroskey. It is clearly seen that the vortex formed nearthe leading edge from the lower edge of the wing tip is developed onto the upper surface of the wing at astation x/c ≈ 0.7. Although the wing geometry and flow conditions are somewhat different from those of
10 of 20
American Institute of Aeronautics and Astronautics Paper 2007–0896
x/c
Cp
0 0.2 0.4 0.6 0.8 1
-5
-4
-3
-2
-1
0
1
M∞=0.13M∞=0.25
y/s=1.000
x/c
Cp
0 0.2 0.4 0.6 0.8 1
-5
-4
-3
-2
-1
0
1
M∞=0.13M∞=0.25
y/s=0.999
x/c
Cp
0 0.2 0.4 0.6 0.8 1
-5
-4
-3
-2
-1
0
1
M∞=0.13M∞=0.25
y/s=0.998
x/c
Cp
0 0.2 0.4 0.6 0.8 1
-5
-4
-3
-2
-1
0
1
M∞=0.13M∞=0.25
y/s=0.997
x/c
Cp
0 0.2 0.4 0.6 0.8 1
-5
-4
-3
-2
-1
0
1
M∞=0.13M∞=0.25
y/s=0.996
x/c
Cp
0 0.2 0.4 0.6 0.8 1
-5
-4
-3
-2
-1
0
1
M∞=0.13M∞=0.25
y/s=0.995
Figure 6. Compressibility effect on pressure over the wing tip, α = 12◦.
11 of 20
American Institute of Aeronautics and Astronautics Paper 2007–0896
0-0.008-0.016-0.024-0.032-0.04-0.048-0.056-0.064-0.072-0.08
x/c0.05
0.100.20
0.300.40
0.500.60
0.700.80
0.901.001.1 1.2 1.3 1.4
1.5
∆cpT
Figure 7. Computed contours of total-pressure loss along the square tip, α = 12◦, M∞ = 0.25.
the present computation, the computed vortex configuration agrees very well with the visualization.To the best knowledge of the present authors, the three tip-vortex structure is identified for the first time.
Moving downstream from x/c = 0.90, the two weak vortex cores rotate clockwise about the strong vortexcore under their interaction in the presence of the wing surface and spirally merge into the strong vortexcore as shown in Fig. 7.
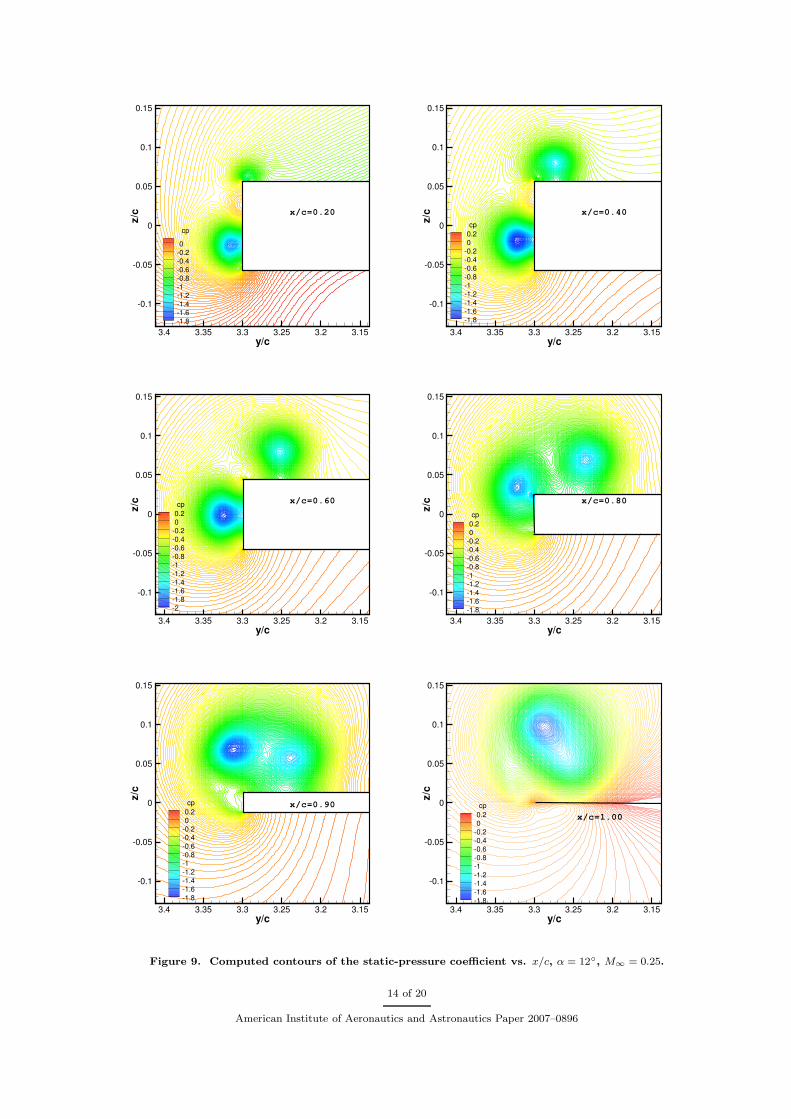
The computed contours of the static-pressure coefficient cp on the same series of the cross-flow planealong the square tip of the rectangular wing at α = 12◦ and M∞ = 0.25 are presented in Fig. 9. Thestatic-pressure coefficient decreases to a minimum at the vortex center. The minimum pressure coefficient inthe vortex separated near the leading edge from the lower edge reaches −2.0 at x/c = 0.6, that in the vortexseparated from the upper edge is −1.4 at x/c = 0.4, and that in the vortex separated near x/c = 0.70 fromthe lower edge is about −0.6 at x/c = 0.90.
It can be identified that the two undulations in the chord-wise distribution of the static pressure nearthe wing tip are caused by the passage of the tip vortices. The minimum pressure coefficient of the twoundulations is about −1.4 as shown in Figs. 2, 3 and 4. The suction peak of the front undulation whichoccurs near x/c = 0.3 may be attributed to the close passage of the upper-edge-separated vortex with theupper surface of the wing at the maximum thickness point of the wing airfoil and the suction peak of therear undulation near x/c = 0.8 may be attributed to the lower-edge-separated vortex originated near theleading edge when it passes through the upper edge of the wing tip.
There appear two distinct pressure-suction regions on the upper surface of the wing inboard of the wingtip as shown in Fig. 5(a). Their minimum pressure coefficient is about −1.0. The front suction peak locatesnear the maximum thickness position of the airfoil (x/c = 0.30) and may be induced by the passage of theupper-separated vortex in a close contact with the wing surface at this position. The rear suction peaklocates near x/c = 0.90 may also be induced by the upper-separated vortex. At this position, the passageof the vortex is deflected back again to closely contact with the wing upper-surface under the action of thestrong vortex separated from the lower edge. In Fig. 5(b) the low pressure corridor depicts the passage ofthe vortex separated from the lower edge of the wing tip starting near the leading edge.
Francis et al.5 presented the measured tip vortex at several cross-flow planes along the square tip of aNACA 64009 rectangular wing at α = 4◦ in their Figure 5. For this low-lift case, only one vortex separated
12 of 20
American Institute of Aeronautics and Astronautics Paper 2007–0896
y/c
z/c
3.153.23.253.33.353.4
-0.1
-0.05
0
0.05
0.1
0.15
0-0.008-0.016-0.024-0.032-0.04-0.048-0.056-0.064-0.072-0.08
x/c=0.20∆cpT
y/c
z/c
3.153.23.253.33.353.4
-0.1
-0.05
0
0.05
0.1
0.15
0-0.008-0.016-0.024-0.032-0.04-0.048-0.056-0.064-0.072-0.08
x/c=0.40∆cpT
y/c
z/c
3.153.23.253.33.353.4
-0.1
-0.05
0
0.05
0.1
0.15
0-0.008-0.016-0.024-0.032-0.04-0.048-0.056-0.064-0.072-0.08
x/c=0.60∆cpT
y/c
z/c
3.153.23.253.33.353.4
-0.1
-0.05
0
0.05
0.1
0.15
0-0.008-0.016-0.024-0.032-0.04-0.048-0.056-0.064-0.072-0.08
x/c=0.80∆cpT
y/c
z/c
3.153.23.253.33.353.4
-0.1
-0.05
0
0.05
0.1
0.15
0-0.008-0.016-0.024-0.032-0.04-0.048-0.056-0.064-0.072-0.08
x/c=0.90∆cpT
y/c
z/c
3.153.23.253.33.353.4
-0.1
-0.05
0
0.05
0.1
0.15
0-0.008-0.016-0.024-0.032-0.04-0.048-0.056-0.064-0.072-0.08
x/c=1.00
∆cpT
Figure 8. Computed contours of the total-pressure-loss coefficient vs. x/c, α = 12◦, M∞ = 0.25.
13 of 20
American Institute of Aeronautics and Astronautics Paper 2007–0896
y/c
z/c
3.153.23.253.33.353.4
-0.1
-0.05
0
0.05
0.1
0.15
cp
0-0.2-0.4-0.6-0.8-1-1.2-1.4-1.6-1.8
x/c=0.20
y/c
z/c
3.153.23.253.33.353.4
-0.1
-0.05
0
0.05
0.1
0.15
cp0.20
-0.2-0.4-0.6-0.8-1-1.2-1.4-1.6-1.8
x/c=0.40
y/c
z/c
3.153.23.253.33.353.4
-0.1
-0.05
0
0.05
0.1
0.15
cp0.20
-0.2-0.4-0.6-0.8-1-1.2-1.4-1.6-1.8-2
x/c=0.60
y/c
z/c
3.153.23.253.33.353.4
-0.1
-0.05
0
0.05
0.1
0.15
cp0.20
-0.2-0.4-0.6-0.8-1-1.2-1.4-1.6-1.8
x/c=0.80
y/c
z/c
3.153.23.253.33.353.4
-0.1
-0.05
0
0.05
0.1
0.15
cp0.20
-0.2-0.4-0.6-0.8-1-1.2-1.4-1.6-1.8
x/c=0.90
y/c
z/c
3.153.23.253.33.353.4
-0.1
-0.05
0
0.05
0.1
0.15
cp0.20
-0.2-0.4-0.6-0.8-1-1.2-1.4-1.6-1.8
x/c=1.00
Figure 9. Computed contours of the static-pressure coefficient vs. x/c, α = 12◦, M∞ = 0.25.
14 of 20
American Institute of Aeronautics and Astronautics Paper 2007–0896
from the sharp lower edge of the wing tip was observed. In the measurements of Birch et al.,6 the two tipvortices separated from the upper and lower edges were observed at various x/c at α = 6◦ as shown in theirFigure 1. The present computed results of Fig. 8 clearly manifests that there exists a third vortex separatedfrom the lower edge near the trailing edge besides the two vortices originated near the leading edge.
V. Downstream tip Vortex in the Near Field, α = 12◦, M∞ = 0.13
V∞
y x
z
O
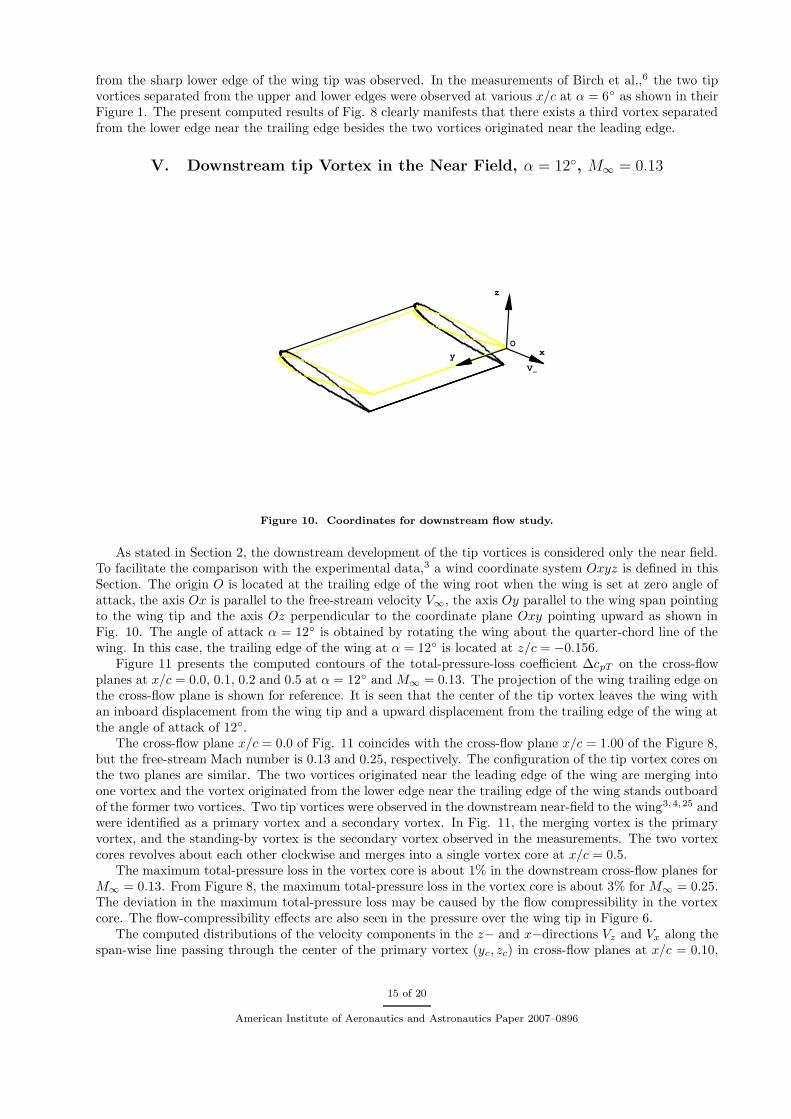
Figure 10. Coordinates for downstream flow study.
As stated in Section 2, the downstream development of the tip vortices is considered only the near field.To facilitate the comparison with the experimental data,3 a wind coordinate system Oxyz is defined in thisSection. The origin O is located at the trailing edge of the wing root when the wing is set at zero angle ofattack, the axis Ox is parallel to the free-stream velocity V∞, the axis Oy parallel to the wing span pointingto the wing tip and the axis Oz perpendicular to the coordinate plane Oxy pointing upward as shown inFig. 10. The angle of attack α = 12◦ is obtained by rotating the wing about the quarter-chord line of thewing. In this case, the trailing edge of the wing at α = 12◦ is located at z/c = −0.156.
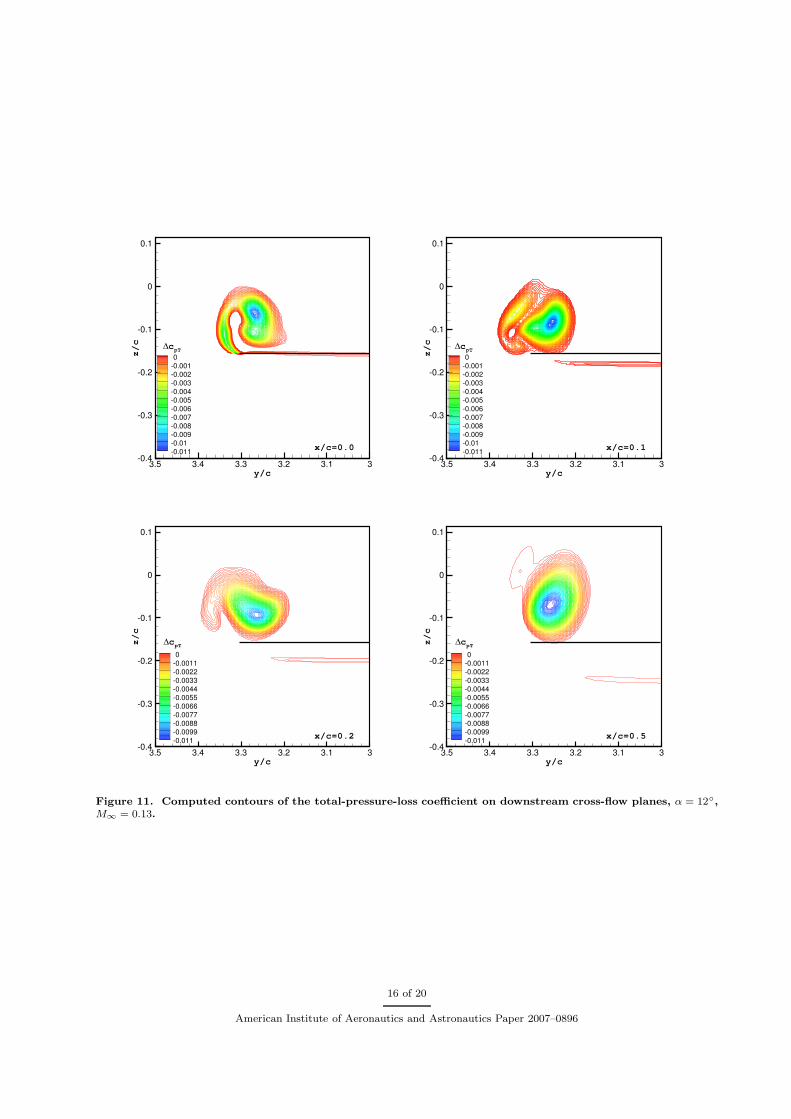
Figure 11 presents the computed contours of the total-pressure-loss coefficient ∆cpT on the cross-flowplanes at x/c = 0.0, 0.1, 0.2 and 0.5 at α = 12◦ and M∞ = 0.13. The projection of the wing trailing edge onthe cross-flow plane is shown for reference. It is seen that the center of the tip vortex leaves the wing withan inboard displacement from the wing tip and a upward displacement from the trailing edge of the wing atthe angle of attack of 12◦.
The cross-flow plane x/c = 0.0 of Fig. 11 coincides with the cross-flow plane x/c = 1.00 of the Figure 8,but the free-stream Mach number is 0.13 and 0.25, respectively. The configuration of the tip vortex cores onthe two planes are similar. The two vortices originated near the leading edge of the wing are merging intoone vortex and the vortex originated from the lower edge near the trailing edge of the wing stands outboardof the former two vortices. Two tip vortices were observed in the downstream near-field to the wing3, 4, 25 andwere identified as a primary vortex and a secondary vortex. In Fig. 11, the merging vortex is the primaryvortex, and the standing-by vortex is the secondary vortex observed in the measurements. The two vortexcores revolves about each other clockwise and merges into a single vortex core at x/c = 0.5.
The maximum total-pressure loss in the vortex core is about 1% in the downstream cross-flow planes forM∞ = 0.13. From Figure 8, the maximum total-pressure loss in the vortex core is about 3% for M∞ = 0.25.The deviation in the maximum total-pressure loss may be caused by the flow compressibility in the vortexcore. The flow-compressibility effects are also seen in the pressure over the wing tip in Figure 6.
The computed distributions of the velocity components in the z− and x−directions Vz and Vx along thespan-wise line passing through the center of the primary vortex (yc, zc) in cross-flow planes at x/c = 0.10,
15 of 20
American Institute of Aeronautics and Astronautics Paper 2007–0896
y/c
z/c
33.13.23.33.43.5-0.4
-0.3
-0.2
-0.1
0
0.1
0-0.001-0.002-0.003-0.004-0.005-0.006-0.007-0.008-0.009-0.01-0.011 x/c=0.0
∆cpT
y/c
z/c
33.13.23.33.43.5-0.4
-0.3
-0.2
-0.1
0
0.1
0-0.001-0.002-0.003-0.004-0.005-0.006-0.007-0.008-0.009-0.01-0.011 x/c=0.1
∆cpT
y/c
z/c
33.13.23.33.43.5-0.4
-0.3
-0.2
-0.1
0
0.1
0-0.0011-0.0022-0.0033-0.0044-0.0055-0.0066-0.0077-0.0088-0.0099-0.011 x/c=0.2
∆cpT
y/c
z/c
33.13.23.33.43.5-0.4
-0.3
-0.2
-0.1
0
0.1
0-0.0011-0.0022-0.0033-0.0044-0.0055-0.0066-0.0077-0.0088-0.0099-0.011 x/c=0.5
∆cpT
Figure 11. Computed contours of the total-pressure-loss coefficient on downstream cross-flow planes, α = 12◦,M∞ = 0.13.
16 of 20
American Institute of Aeronautics and Astronautics Paper 2007–0896
0.20 and 0.50 are compared with the experimental data3 in Fig. 12 at α = 12◦ and M∞ = 0.13.The velocity component Vz along the line passing through the vortex center in Fig. 12 expresses the
circumferential component of the velocity in the vortex core. The position of positive and negative peaks ofVz defines a region within which large gradients of velocity and pressure prevail and viscous forces dominate.This region is known as the sub-core of the vortex core. The sub-core is concentric with the vortex core, hasa diameter dsc and a velocity circulation Γsc around its circumference.
Γsc = πdsc(∆Vz)max/2. (2)
where (∆Vz)max is the difference of the positive and negative peak values of Vz.The double inflections in the distribution of Vz in the cross-flow plane x/c = 0.10 and 0.20 are reproduced
in the Euler computations as shown in Fig. 12. The distortion in the velocity profile is probably due to thesecondary vortex which has not yet been absorbed into the primary vortex. The distribution of Vx alongthe line through the vortex center increases sharply in the sub-core of the primary vortex and reaches itsmaximum value Vx,max at the core center.
Comparison of the computed downstream-flow parameters on the downstream cross-flow planes x/c =0.10, 0.20 and 0.50 at α = 12◦ and M∞ = 0.13 with the experimental data3 is presented in Table 2.
Table 2 Comparison of flow parameters with experiments,3 α = 12◦, M∞ = 0.13.
yc/c zc/c dsc/c (∆Vz)max/V∞ Γsc/V∞c Vx,max/V∞x/c Comp Exp Comp Exp Comp Exp Comp Exp Comp Exp Comp Exp
0.10 3.27 3.26 −0.082 −0.095 0.10 0.089 1.32 1.58 0.21 0.22 1.37 1.52
0.20 3.27 3.25 −0.082 −0.081 0.13 0.108 1.46 1.56 0.30 0.26 1.20 1.55
0.50 3.27 3.24 −0.084 −0.054 0.14 0.112 1.19 1.42 0.26 0.25 1.06 1.46
The computed span-wise coordinate of the vortex center yc agrees well with the experimental result inthe downstream near field. The vortex center is located inboard of the wing tip by a few percent of the wingchord. Large disagreement occurs for the vertical coordinate zc. The computed results yield a downwashfor the passage of the vortex center, whereas the experimental results give a up-wash. It is well known thatthe trailing vortex of rectangular wing with a positive lift experiences a downwash in free-air flow. Theup-wash observed in the test may be caused by the wind-tunnel-wall interference which is not considered inthe computations. On the cross-flow plane x/c = 0.10, the computed vertical position of the vortex centeris higher than that of the experiment by 0.01c. It is unclear for this disagreement.
The computation under-predicted the extreme values of Vz and over-predicted the diameter of the sub-core dsc. But the velocity circulation of the sub-core is predicted well by the Euler method as shown in Table2. The agreement on the velocity circulation around the circumference of the vortex sub-core demonstratesthat the vortex strength of the sub-core is simulated well by the Euler method. The computed distributionof Vx along the line through the vortex center agrees qualitatively with the experiment, but under-predictsthe value of Vx,max. Out of the vortex core, the computed Vx recovers immediately to the free-streamvelocity, but the experimental value is in excess of V∞ by about 10% for unknown reasons. The deficienciesin computing the sub-core diameter and the extreme values of ∆Vz and Vx may be caused by insufficientgrid resolution of the tip vortex in the downstream region which manifests itself in the form of excessivenumerical dissipation in the sub-core.
VI. Conclusions
A robust Euler solver utilizing state-of-art numerical methods is used to study the tip vortices around ahigh-lift rectangular wing with a square tip at low speeds. Good agreement of the computed wing pressurewith known experimental data is achieved and the tip-vortex behavior in the downstream near-field is fairlywell predicted by the computations. Some important findings from this study include the following:
1) Grid independence for the pressure over the wing surface is achieved using clustered grid points aroundthe square tip. More than 30× 30 grid points are used to resolve the cross section of a vortex core, whichis equivalent to a grid spacing of 5× 10⁻³c or smaller. The total grid number of the computational grid isover six millions.
2) Two pressure undulations in the chord-wise distribution of static pressure over the outer portion ofthe wing is a characteristic of high-lift rectangular wing having square tip. They can have a suction peak
17 of 20
American Institute of Aeronautics and Astronautics Paper 2007–0896

y/c
vz/v
∞
2.833.23.43.6-0.9
-0.6
-0.3
0
0.3
0.6
0.9
ExpEuler
x/c=0.10
y/c
vx/v
∞
2.833.23.43.60.6
0.8
1
1.2
1.4
1.6
ExpEuler
x/c=0.10
y/c
vz/v
∞
2.833.23.43.6-0.9
-0.6
-0.3
0
0.3
0.6
0.9
ExpEuler
x/c=0.20
y/c
vx/v
∞
2.833.23.43.60.6
0.8
1
1.2
1.4
1.6
ExpEuler
x/c=0.20
y/c
v z/v∞
2.833.23.43.6-0.9
-0.6
-0.3
0
0.3
0.6
0.9
ExpEuler
x/c=0.50
y/c
vx/v
∞
2.833.23.43.60.6
0.8
1
1.2
1.4
1.6
ExpEuler
x/c=0.50
Figure 12. Comparison of the computed velocity-component distributions along span-wise line passing throughthe vortex center with experiments,3 α = 12◦, M∞ = 0.13.
18 of 20
American Institute of Aeronautics and Astronautics Paper 2007–0896
even larger than the leading-edge suction peak on the same airfoil section. The square-tip affected regionis confined in an outer portion of the wing, whose span-wise width can be as large as the airfoil maximumthickness.
3) There appear three tip vortices. Two vortices are formed by separation starting near the leading edgefrom the lower and upper edge of the square tip of the wing. They merge into a primary tip vortex overthe upper surface of the wing before reaching the trailing edge. A third vortex or the secondary tip vortexis formed from the separation from the lower edge of the wing tip when the primary tip vortex is detachedfrom the upper edge of the wing tip. The secondary tip vortex rotates around the primary tip vortex andmerges into it in the downstream near-field. The pressure-suction regions on the upper and lateral surfacesof the wing tip are induced by the close passages of the tip vortices over the surfaces.
4) Even the free-stream Mach number is as low as 0.25, the flow compressibility effect is noticeable inthe pressure over the outer portion of the wing and the maximum total-pressure loss at the vortex center.
5) The passage of the primary tip-vortex leaves the wing with an inboard displacement from the wing tipand detaches from the upper surface of the wing before reaching the trailing edge. The velocity circulationaround the circumference of the vortex sub-core (or the viscous portion of the vortex core) is predictedwell. But the sub-core diameter is over-predicted and the maximum circumferential- and axial-componentof velocity in the sub-core is under-predicted due to insufficient grid-resolution of the tip vortex in thedownstream field.
6) The presented results support the usefulness of the Euler computations to predict the pressure overthe outer portion of the wing and the behavior of the tip vortices in the near field of a high-lift rectangularwing with a square tip.
References
1Spalart, P., “Airplane trailing vortices,” Annu. Rew. Fluid Mech., Vol. 30, No. 1, 1998, pp. 107–138.2Tung, C.and Pecci, S. C., F.X., and Morse, H., “The structure of trailing vortices generated by model rotor blades,”
Vertica, Vol. 7, No. 1, 1983, pp. 33–43.3McAlister, K. and Takahashi, R., “NACA 0015 wing pressure and trailing vortex measurements,” NASA TP 3151, 1991.4Chigier, N. A. and Corsiglia, V. R., “Tip vortices–velocity distributions,” NASA TM X-62,087, Sept. 1971.5Francis, M. S. and Kennedy, D. A., “Formation of a trailing vortex,” Journal of Aircraft , Vol. 16, No. 3, 1979, pp. 148–154.6Birch, D., Lee, T., Mokhtarian, F., and Kafyeke, F., “Rollup and near-field behavior of a tip vortex,” Journal of Aircraft ,
Vol. 40, No. 3, 2003, pp. 603–607.7Zhang, H., Zhou, Y., and Whitelaw, J., “Near-field wing-tip vortices and exponential vortex solution,” Journal of Aircraft ,
Vol. 43, No. 2, 2006, pp. 445–449.8Landgrebe, A. J., “New directions in rotorcraft computational aerodynamics research in the US,” AGARD CP 552, Aug.
1995.9Maskew, B., “A quadrilateral vortex method applied to configurations with high circulation,” NASA SP 405, May 1976.
10Kandil, O., Mook, D., and Nayfeh, A., “Nonlinear prediction of the aerodynamic loads on lifting surfaces,” Journal ofAircraft , Vol. 13, No. 1, 1976, pp. 22–28.
11Rom, J.and Zorea, C. and Gordon, R., “On the calculation of non-linear aerodynamic characteristics and the near vortexwake,” Paper 74-27, Aug. 1974, Ninth Congress of the International Council of the Aeronautical Sciences.
12Dacles-Mariani, J., Zilliac, G. G., Chow, J. S., and Bradshaw, P., “Numerical/experimental study of a wingtip vortex inthe near field,” AIAA Journal , Vol. 33, No. 9, Sept. 1995, pp. 1561–1568.
13Strawn, R. C., “Wing tip vortex calculations with an unstructured adaptive-grid Euler solver,” Proceedings of the 47thAnnual Forum of the American Helicopter Society , Vol. 1, Phoenix, AZ, 6-8, May 1991, pp. 65–76.
14Murman, E. and Rizzi, A., “Applications of Euler equations to sharp edge delta wings with leading edge vortices,”Proceedings of AGARD Conference on Applications of Computational Fluid Dynamics in Aeronautics, Parais des Congress,Aix-en-Provence, France, 7-10, April 1986, pp. 15–1–15–13.
15Rizzi, A., “Euler solutions of transonic vortex flows around the Dillner wing,” Journal of Aircraft , Vol. 22, No. 4, April1985, pp. 325–328.
16Rizzetta, D. and Shang, J., “Numerical simulation of leading-edge vortex flows,” AIAA Journal , Vol. 24, No. 2, Feb.1986, pp. 237–245.
17Powell, K., Murman, E., Perez, E., and Baron, J., “Total pressure loss in vortical solutions of the conical Euler equations,”AIAA Journal , Vol. 25, No. 3, March 1987, pp. 360–368.
18Cai, J., Tsai, H.-M., Liu, F., and Luo, S., “Vortex core and its effects on the stability of vortex flow over slender conicalbodies,” AIAA Paper 2005-0062, Jan. 2005.
19Liu, F. and Jameson, A., “Multigrid Navier-Stokes calculations for three-dimensional cascades,” AIAA Journal , Vol. 31,No. 10, October 1993, pp. 1785–1791.
20Liu, F. and Zheng, X., “A strongly-coupled time-marching method for solving the Navier-Stokes and k-ω turbulencemodel equations with multigrid,” J. of Computational Physics, Vol. 128, 1996, pp. 289–300.
19 of 20
American Institute of Aeronautics and Astronautics Paper 2007–0896
21Liu, F. and Ji, S., “Unsteady flow calculations with a multigrid Navier-Stokes method,” AIAA Journal , Vol. 34, No. 10,Oct. 1996, pp. 2047–2053.
22Sadeghi, M., Yang, S., and Liu, F., “Parallel computation of wing flutter with a coupled Navier-Stokes/CSD method,”AIAA Paper 2003-1347, Jan. 2003.
23Turkel, E., “Preconditioning techniques in computational fluid dynamics,” Annu. Rev. Fluid Mech., Vol. 31, 1999,pp. 385–416.
24Yang, S., Luo, S., Liu, F., and Tsai, H.-M., “Computation of the flows over flapping airfoil by the Euler equations,”AIAA Paper 2005-1404, Jan. 2005.
25Gray, R. B., McMahon, H. M., Shenoy, K. R., and Hammer, M. L., “Surface pressure measurements at two tips of amodel helicopter rotor in hover,” NASA CR 3281, 1980.
20 of 20
American Institute of Aeronautics and Astronautics Paper 2007–0896