Embed Size (px)
Citation preview

Bettina Bahn-Walkowiak, Arkaitz Usubiaga, Philipp Schepelmann
EU structural and cohesion policy and sustainable development
Originally published as: Bettina Bahn-Walkowiak, Arkaitz Usubiaga, Philipp Schepelmann (2012): EU structural and cohesion policy and sustainable development In: Larry Kreiser ... (ed.): Carbon pricing, growth and the environment. - Cheltenham : Elgar, 2012, pp. 17-32 DOI: 10.4337/9781781952191.00012

Bettina Bahn-Walkowiak a, Arkaitz Usubiaga a, Philipp Schepelmanna
EU structural and cohesion policy and sustainable development
a Wuppertal Institute for Climate, Environment and Energy, Wuppertal, Germany
* Corresponding author: Bettina Bahn-Walkowiak, Wuppertal Institute for Climate, Environment and Energy, Döppersberg 19, 42103 Wuppertal, Germany
E-mail: [email protected]
Phone: +49 202 2492-276
Fax: +49 202 2492-250
1. Introduction
This chapter is an excerpt from a study commissioned by the European Parliament, which
examines EU subsidies for agriculture, fisheries, transport, energy and regional
development. Based on proven methodologies for the identification and assessment of
environmentally harmful subsidies, the study assesses the sustainability level of the sectoral
policies and makes recommendations for a reform that would contribute to the alignment of
the EU budget towards a more sustainable growth. The following sections provide the main
findings of one of the largest fields of expenditure within the EU budget, the structural and
cohesion policy.
2. The Struture and Priorities of the EU Structural and Cohesion Funds
The European Structural and Cohesion Funds aim to reduce social and economic disparities
between the European regions. Due to several tens of thousands of projects being supported
within one programming period, it is difficult to find coherent evidence on the output and
results of the EU regional policy. Aggregated information is rare, whereas diverging and
country-specific indicator-based data of partly insufficient quality are prevalent.
In the programming period 2000 2006, the regional policy instruments mainly focused on the
European regions lagging behind (objective 1) and the regions that were undergoing
structural change (objective 2) at that time (Nordregio, 2009). For the following programming
period, 2007 2013, a reform of the regional policy was implemented by introducing the term
territorial cohesion. The overarching target of the financial support is to reduce imbalances
and disparities between the manifold European regions under the umbrella of convergence,
competitiveness and cooperation (EC, 2004, 2010a, 2010b). At the same time, Article 17
‘Sustainable development’ of the Council Regulation No 1083/2006 declares that the
‘objectives of the funds shall be pursued in the framework of sustainable development and
the Community promotion of the goal of protecting and improving the environment ... ’ (EC,
2006a).
In the running period 2007 2013, the European cohesion policy will benefit from 36 per cent
of the total EU budget (approx €344 billion) (EC, 2010c). The European Regional
Development Fund (ERDF) will assign €200 billion to regional development, economic
change, enhanced competitiveness and territorial cooperation, the European Social Fund
(ESF) €75 billion to employment, social inclusion and tackling discrimination; and the
Cohesion Fund €70 billion to environment and transport.
The programming period 2007 2013 covers the following priorities:
1. Convergence (81.5 per cent): promotion of growth-enhancing conditions and factors
leading to convergence of the least-developed Member States and regions,
2. Regional competitiveness and employment (16 per cent): promotion of economic
change through innovation and the support of the knowledge society,
entrepreneurship and the protection of the environment,
3. Territorial cooperation (2.5 per cent): cross-border and transnational cooperation,
joint local and regional initiatives, interregional cooperation and exchange of
experience (EC, 2007a: Nordregio, 2009).
In the Council Decision ‘Community Strategic Guidelines (CSG) on economic, social and
territorial cohesion, 2007 2013’ it is constituted that the ‘cohesion policy should focus to a
greater extent on knowledge, research and innovation, and human capital’ (EC, 2006b),

while increasing resources accordingly. A second priority is the objective of sustainable
development by emphasising the role of the environment in growth, competitiveness and
employment. Synergies between environmental protection and growth are assumed to be
strengthened by decreasing the external environmental costs and stimulating innovation and
job creation. The requirement ‘to reduce traditional energy dependency through
improvements in energy efficiency and renewable energies’ is also stressed (EC, 2006b).
The programming system follows different stages: The National Strategic Reference
Frameworks (NSRF) 2007 2013 contain the overall development strategies of the Member
States and constitute the scope for the thematic and regional programmes. The Operational
Programmes (OPs) specify the activities and priorities at Member State level. Strategic
Environmental Assessments (SEA) and Environmental Impact Assessments (EIA) have to be
applied where required (GRDP, 2006). SEAs of complete planning processes and EIAs of
individual projects are, however, both often assessed as being insufficient (BirdLife, 2010).
2.1. The Evaluation Process
The evaluation process of the structural and cohesion policy carries out strategic ex-ante
evaluations with an EU-wide dimension, thematic ex-ante evaluations of planned
programmes, intermediate evaluations of running programmes and ex-post evaluations of
completed programmes. The programming and evaluation process are interdependent. The
ex-ante evaluations for the programming period 2007 2013 were conducted at varying
stages in the process of writing the OPs. The objective of the ex-ante process is to improve
the focus of the programmes and to increase transparency and efficiency. Besides, a
consistency check is to be made in order to ensure a correspondence between Community
priorities and the regions’ requirements (Nordregio, 2009).
For the current period, a shift from the concept of mid-term evaluations (compulsory
evaluations at predetermined points of the programming period) towards a more flexible,
demand-driven approach to evaluation (ongoing evaluation in the Member State
responsibility) has been implemented (EC, 2007c; Applica/Ismeri, 2010a). The ongoing
evaluation is being done in the form of a series of evaluation exercises that check the
physical and financial performance of the OPs.
Apart from a great complexity of the whole management and control structure, it is not
always clear if the impacts in some Member States are in fact attributable to the policy, since
the effectiveness of the monitoring and evaluation is sometimes carried out with poor data.
3. Results of the Mid-term Evaluation of the European Regional Development Fund
2007–2013
The added value gained by the cohesion policy and its current design is undoubtedly the
leverage effect of the resources for less developed European regions. The multi-annual
planning allows for consolidated support and potential refocusing of objectives from a mid-
term perspective. The earmarking of public resources and the monitoring and evaluation
process increase the political credibility and accountability. The territorial dimension supports
interregional cooperation and the sharing of best practices. However, interest groups, NGOs
and research institutions are also critical from different perspectives.

3.1. Selection of Resources and the Implementation Process
Interestingly, the implementation of the programmes is delayed in almost all Member States.
The years 2008/2009 have shown that Member States ‘failed to take advantage of a
significant part of the financial support available to them from the Structural Funds’
(Applica/Ismeri, 2010b, p. 59; Applica/Ismeri, 2010a; FoEE, 2010). Figures of €93.4 billion
(27 per cent) of the total available EU cohesion policy resources and €63 billion of the
earmarked projects had been selected at the midway point (EC, 2010b). Contrariwise, it has
to be considered if and to what extent the Structural and Cohesion Funds ‘played an
important role in helping to counter the effects of the economic downturn’ which however,
‘raises a questionmark over additionality’ (Applica/Ismeri, 2010b, p. 59).
Due to the complexity of the funding mechanisms, European projects ‘are driven more and
more by compliance with administrative procedures rather than development strategy’ (CoR,
2010). The fragmentation of the EU funding can also hamper effective implementation.
Moreover, the evaluation of the degree of fund implementation redirects the focus away from
the actual performance and effectiveness of the projects supported. The Committee of the
Regions (CoR, 2010) suggests a reporting methodology focusing on the results rather than
on the financial performance.
3.2. Relationship between Earmarking of Funds and Sustainable Development
A considerable part is earmarked for growth targets. The EU15 Member States are
committed and the EU12 Member States are asked to select their programmes on a
voluntary basis accordingly, that is 60 per cent Lisbon earmarking in respect of the
Convergence programmes and 75 per cent in respect of the Regional and Competitiveness
and Employment programmes. Thus, €230 billion are targeted on Lisbon priorities. During
the programming period, Member States have to report on the progress by submitting a
‘National Strategic Report’ showing how the cohesion policy is contributing to the Lisbon
Strategy (EC, 2007b). This inevitably makes sustainable development targets take a back
seat. A study which compares the cohesion policy expenditure with the policy priorities
expressed in the OPs, and thus investigates the potential for regional policy instruments to
contribute to the Lisbon (for growth and jobs) and Gothenburg objectives (for sustainable
development), claims that – not surprisingly – the OPs related to the Convergence principle
(e.g. infrastructural themes such as ICT accessibility and transport; innovation support and
economic growth) are the most important (Nordregio, 2009). Within the Gothenburg context
and sustainable development objectives, the management of natural resources, clean water,
air and soil and sustainable transport are the most important priority themes.
The study shows that countries that commit less to Lisbon objectives tend to focus on
environmental protection and risk prevention categories (e.g. Bulgaria, Romania, Estonia,
Malta, Lithuania, Hungary and Cyprus at around 20 30 per cent) (Well, 2009). A third of the
programmes have an integrated three-pillar approach to sustainable development, but a ‘de
facto emphasis on [the] economic dimension’ (especially in Convergence OPs) (Nordregio,
2009, p. 93). According to the study, the Lisbon Strategy is more short-term oriented,
whereas Gothenburg goals include longer-term commitments (Nordregio, 2009). It
recommends reconciling this imbalance in the cohesion policy and positioning the concept of
sustainable development as the overarching principle to EU regional funding.
4. Identification of Potientially Environmentally Harmful Subsidies within the
European Regional Development Fund 2007–2013
The OECD ‘quick scan’ tool (1998, 2005) asserts that the impacts of a subsidy on the
environment depend on the conditions of the support and on the size of the subsidy that
determines the distortionary impacts on the marginal costs or revenues of the recipient
sector (Valsecchi et al., 2009). The identification of the key items of the EU structural and
cohesion policies in the current EU budget that do not fulfil the set sustainability criteria is
confronted with a lack of data in the mid-term (or ongoing) evaluation reports (CoR, 2010).
The monitoring reports provide data on the number of projects, the policy implementation
rate, the allocation of financial means, the allocation between the objectives, ‘convergence,
competitiveness and cooperation’, etc. They do not refer to sustainable development
indicators (Eurostat 2009).
Single indicator systems of certain programmes can be of good quality ‘but as soon as we try
to establish a comprehensive picture across programmes, we face severe problems due to
the inconsistency of indicators and the varying quality of data’ (Schwab, 2010, p. 3). There is
no commonly agreed process of relating ERDF environmental indicators to the European
Sustainable Development Strategy. For this reason, the following section will refer to
comprehensive approaches such as the Transport and Environment Reporting Mechanism
(TERM) of the European Environment Agency, which compiles macro-data for the transport
sector of all European countries and draws conclusions at a macro-level.
4.1. Proportions within the Environmental Funding Framework
The total Structural and Cohesion Funds comprise approx €344 billion. The environment
spending is at a record for this period as it is three times higher than in the previous period
2000–2006 (EC, 2009). The budget comes up to about 30 per cent of the total fund, that is
around €105 billion. Although such a high budget is contributing to a wide range of positive
environmental impacts, the proportions of the environmental funding for different themes in
the programming period 2007–2013 have to be examined more closely.
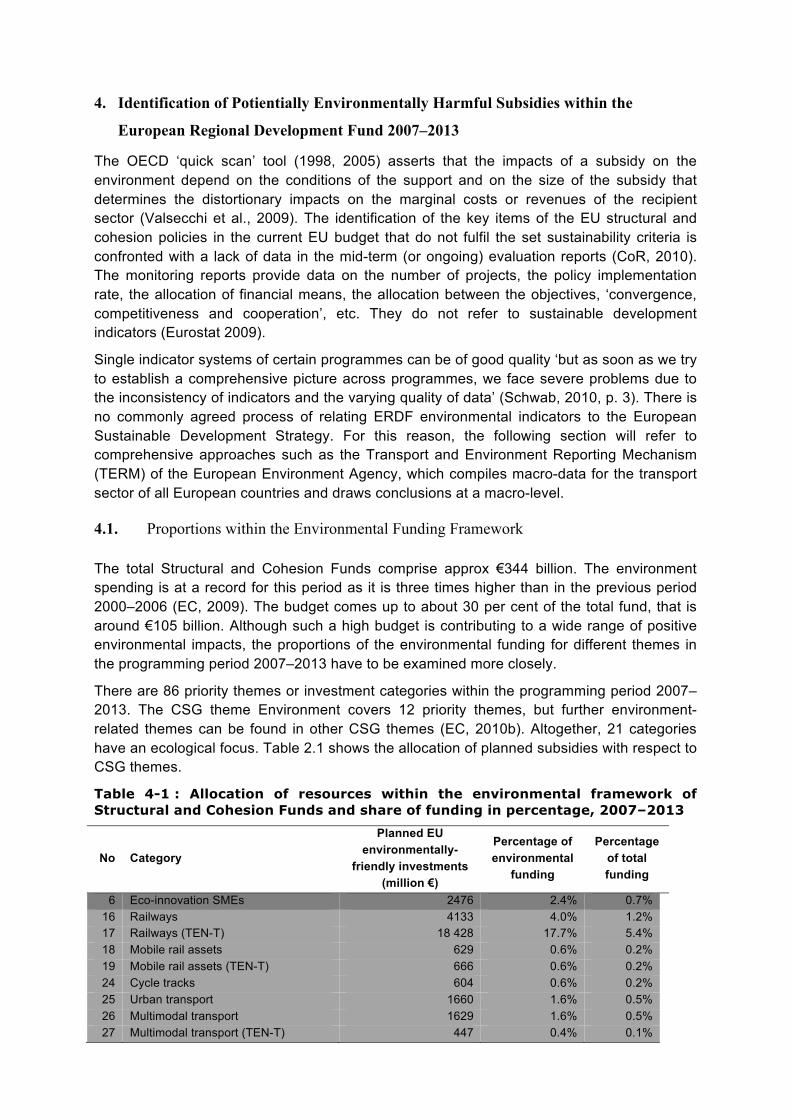
There are 86 priority themes or investment categories within the programming period 2007–
2013. The CSG theme Environment covers 12 priority themes, but further environment-
related themes can be found in other CSG themes (EC, 2010b). Altogether, 21 categories
have an ecological focus. Table 2.1 shows the allocation of planned subsidies with respect to
CSG themes.
Table 4-1 : Allocation of resources within the environmental framework of Structural and Cohesion Funds and share of funding in percentage, 2007–2013
No Category
Planned EU environmentally-
friendly investments (million €)
Percentage of environmental
funding
Percentage of total funding
6 Eco-innovation SMEs 2476 2.4% 0.7%
16 Railways 4133 4.0% 1.2%
17 Railways (TEN-T) 18 428 17.7% 5.4%
18 Mobile rail assets 629 0.6% 0.2%
19 Mobile rail assets (TEN-T) 666 0.6% 0.2%
24 Cycle tracks 604 0.6% 0.2%
25 Urban transport 1660 1.6% 0.5%
26 Multimodal transport 1629 1.6% 0.5%
27 Multimodal transport (TEN-T) 447 0.4% 0.1%

No Category
Planned EU
environmentally-
friendly investments
(million €)
Percentage of
environmental
funding
Percentage
of total
funding
28 Intelligent transport systems 1 086 1.0% 0.3%
29 Inland waterways (regional and local) 268 0.3% 0.1%
30 Inland waterways (TEN-T) 604 0.6% 0.2%
39 Renewable energy: wind 785 0.8% 0.2%
40 Renewable energy: solar 1 064 1.0% 0.3%
41 Renewable energy: biomass 1 786 1.7% 0.5%
42 Renewable energy: hydroelectric,
geothermal and other
1 124 1.1% 0.3%
43 Energy efficiency, cogeneration,
energy management
4 270 4.1% 1.2%
44 Management of household and
industrial waste
6 239 6.0% 1.8%
45 Management and distribution of water
(drink water)
8 144 7.8% 2.4%
46 Water treatment (waste water) 13 887 13.3% 4.0%
47 Air quality 1 018 1.0% 0.3%
48 Integrated prevention and pollution
control
739 0.7% 0.2%
49 Mitigation and adaptation to climate
change
305 0.3% 0.1%
50 Rehabilitation of industrial sites and
contaminated land
3 451 3.3% 1.0%
51 Promotion of biodiversity and nature
protection (Natura 2000)
2 676 2.6% 0.8%
52 Promotion of clean urban transport 6 127 5.9% 1.8%
53 Risk prevention 5 801 5.6% 1.7%
54 Other measures to preserve the
environment and prevent risks
1 676 1.6% 0.5%
55 Promotion of natural assets 1 137 1.1% 0.3%
56 Protection and development of natural
heritage
1 405 1.3% 0.4%
61 Integrated projects for urban and rural
regeneration
10 136 9.7% 2.9%
Total environment funding 104 400 100% 30.3%
Total budget 344 306
CSG theme: RTDI
CSG theme: Transport
CSG theme: Energy
CSG theme: Environment
CSG theme: Territorial dimension
Source: Authors’ own compilation with data from EC (2010b).
In general, the CSG theme Environment is more oriented towards end-of-pipe approaches
such as management of household and industrial waste, rehabilitation of industrial sites and
contaminated land (approx 69 per cent of the financial volume) than towards prevention
approaches such as integrated prevention and pollution control or risk prevention
(approximately 31 per cent of the financial volume of projects).
When the environmental framework is structured alongside the categories infrastructure,
climate change, renewable energy and biodiversity, a very dominant proportion of subsidies
for infrastructural projects becomes apparent in the total Funds 2007–2013.

Source: Authors’ own compilation with data of EC (2010b).
Figure 4-1 : Proportions of environmental funding for different themes, 2007–2013
More than 62 per cent of the budget is selected for infrastructure investment projects in the
field of transport (i.e. environmentally-friendly transport modes such as railways), waste and
waste water. A further 13 per cent refers to rehabilitation and regeneration projects. It is
striking that direct climate change investments only amount to 9.1 per cent (2.6 per cent of
the total Structural and Cohesion Funds budget). Subsidies for renewable energies represent
only 8.6 per cent of the environmental budget (1.5 per cent of the total budget), support for
eco-innovation 2.4 per cent (0.7 per cent of total funding) and projects within the field of
natural heritage and biodiversity 5 per cent (1.5 per cent of total).
4.2. Road-based Transport Infrastructure Investments
When the budget is scrutinised in detail, it is striking that a large proportion of the total
budget is dedicated to transport infrastructure investments (24 per cent). These investments
comprise both sustainable and unsustainable transport modes. In this context, a breakdown
shows that 49 per cent of the investments are selected for motorways and roads (within and
without the Trans-European Networks – Transport (TEN-T) and national and regional roads).
Twenty-nine per cent are planned for railways (within and without TEN-T and mobile assets),
while only 2 per cent are planned for urban transport and 7 per cent for the promotion of
clean urban transport.
In fact, a considerable amount of the cohesion policy funding (almost 12 per cent) is used to
subsidise transport infrastructure projects that contribute to an increased use of non-
renewable resources, irreversible landscape alterations and greenhouse gas emissions (EC,
2010b; BirdLife, 2010). There is a striking imbalance in favour of one of the least efficient and
least sustainable transport modes, that is, roads and motorways, entailing private mobility
and heavy goods traffic.
As for the ten central and eastern European Member States (CEE10), the imbalance is even
greater due to high development gaps in the transport sector. Approximately half of the
amount of the Structural and Cohesion Funds will go to CEE10 countries. It is planned that
approximately 30 per cent of the total for these countries, that is, almost €50 billion, will be

invested in transport. Fifty-three per cent of the total funds will be allocated to road
infrastructures, 30 per cent to rail infrastructures, and the remaining 17 per cent to mixed or
urban transport modes (CEE Bankwatch Network, 2007).
A further difficulty is that Member States are not required to guarantee that the support of the
transport sector would not cause an increase in greenhouse gas emissions (BirdLife, 2010).
The latest trends confirm that road-dominated investments contribute to an unsustainable
path in transport development (EEA, 2010). The report comes to the conclusion that
‘passenger and freight transport by road will remain the principal mode of travel with the
greatest market share if present trends continue and no action is taken to reduce emissions’
(EEA, 2010, p. 22).
If the EU wants to promote sustainable transport and tackle climate change, its transport
funding should be systematically re-focused on urban and regional public transport,
sustainable traffic management, cycling, rail transport, and intermodal infrastructure, shifting
freight from road to rail.
4.3. Direct and Indirect Climate Change Mitigation
The topic of climate change mitigation has to be considered in connection with the previous
section. Greenhouse gas emissions from transport continue to rise steadily and now account
for 19.3 per cent of EEA member country emissions (EEA, 2010). The expenditure for the
category Mitigation and adaptation of climate change within the financial framework in the EU
is rather small, with 9.1 per cent of the funding for environmental projects (2.8 per cent of
total funding, see Figure 2.1; see also BirdLife, 2010).
Following the ‘European Commission Strategy Report’, the following categories are correctly
classified as measures with direct relieving effects (see Figure 2.2): energy efficiency
measures (4.1 per cent), support of renewable energies (4.5 per cent), measures to improve
the air quality (1.0 per cent), risk prevention (5.5 per cent) (EC, 2010b). It is controversial,
however, to what extent investments for the expansion of infrastructures contribute to
environmental relief (ADE, 2008). After using large amounts of resources and energy for the
investment itself, its sustainability will be determined by the mid- to long-term reduction in
greenhouse gas emissions. This is associated with a necessary shift from freight and
passenger transport to rail transport, which will have to grow in order to show environmental
relief.
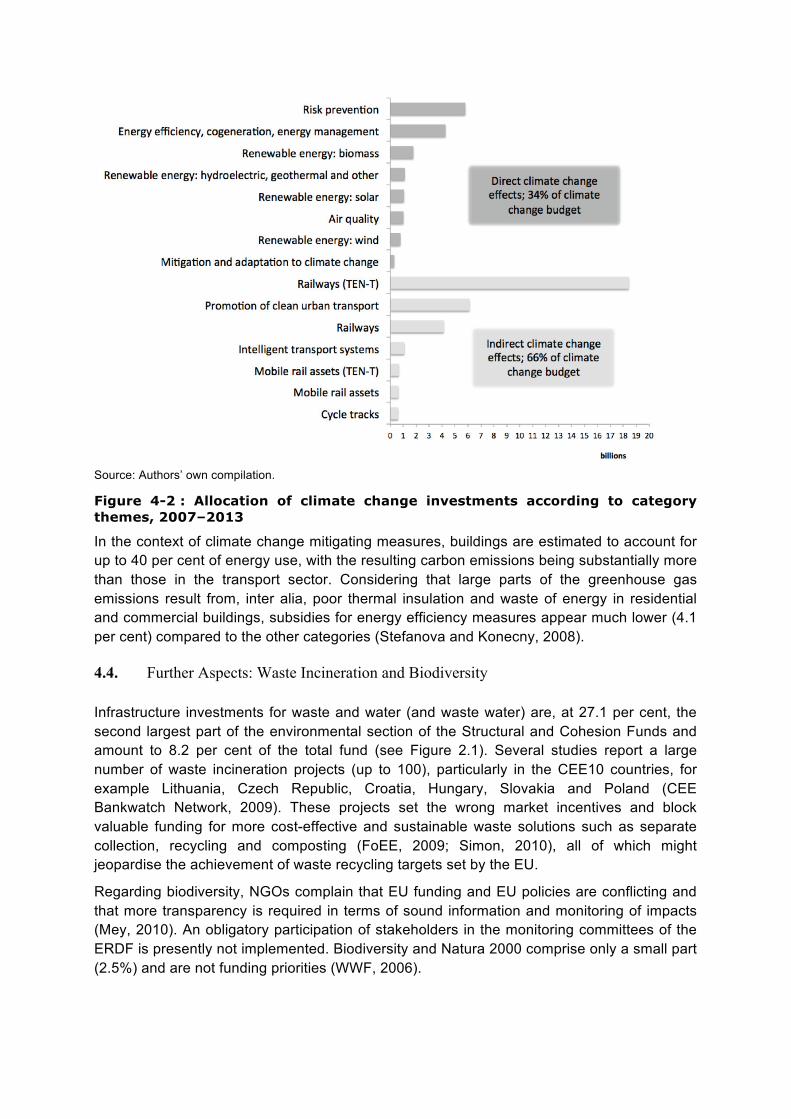
Source: Authors’ own compilation.
Figure 4-2 : Allocation of climate change investments according to category themes, 2007–2013
In the context of climate change mitigating measures, buildings are estimated to account for
up to 40 per cent of energy use, with the resulting carbon emissions being substantially more
than those in the transport sector. Considering that large parts of the greenhouse gas
emissions result from, inter alia, poor thermal insulation and waste of energy in residential
and commercial buildings, subsidies for energy efficiency measures appear much lower (4.1
per cent) compared to the other categories (Stefanova and Konecny, 2008).
4.4. Further Aspects: Waste Incineration and Biodiversity
Infrastructure investments for waste and water (and waste water) are, at 27.1 per cent, the
second largest part of the environmental section of the Structural and Cohesion Funds and
amount to 8.2 per cent of the total fund (see Figure 2.1). Several studies report a large
number of waste incineration projects (up to 100), particularly in the CEE10 countries, for
example Lithuania, Czech Republic, Croatia, Hungary, Slovakia and Poland (CEE
Bankwatch Network, 2009). These projects set the wrong market incentives and block
valuable funding for more cost-effective and sustainable waste solutions such as separate
collection, recycling and composting (FoEE, 2009; Simon, 2010), all of which might
jeopardise the achievement of waste recycling targets set by the EU.
Regarding biodiversity, NGOs complain that EU funding and EU policies are conflicting and
that more transparency is required in terms of sound information and monitoring of impacts
(Mey, 2010). An obligatory participation of stakeholders in the monitoring committees of the
ERDF is presently not implemented. Biodiversity and Natura 2000 comprise only a small part
(2.5%) and are not funding priorities (WWF, 2006).

5. Conclusions
By focusing on competitiveness and growth, the new period of 2007–2013 led to a paradigm
shift in regional policy prompting adjustments in the orientation of the Member States’
programmes content away from the Gothenburg objectives. Moreover, although large parts
of the EU structural funding are environment-related, it is still primarily focused on end-of-
pipe environmental protection (Schepelmann et al., 2009).
5.1. Earmarking for Environmental Priorities
In order to maximise the leverage effect, the EU cohesion policy should concentrate on
projects that deliver the largest environmental benefits at European level, and thus reflect
European priorities. The earmarking of financial means should upgrade the sustainable
development principle to a priority principle. The relationship between growth, infrastructure
and environmental quality, and the dynamic interplay between them, has to be examined
more systematically because investment costs are borne in the short term while benefits
appear in the long run (ADE, 2008, p. 48).
Green Public Procurement could be incorporated as a condition for the granting of funds.
That way EU funds could be systematically used to promote green products and services
and gain additional environmental benefits. The green market segment can essentially be
strengthened, thus sending further transformational messages to economic operators
(BirdLife, 2010).
In this context, subsidies of the Structural and Cohesion Funds should be environmentally
and cost effective in the long term, and the EU should therefore primarily support solutions
that have proven to be environmentally and cost effective over time (ADE, 2008).
5.2. Closing the Knowledge Gap: Review of the Evaluation Process
As the costs are borne by the public (i.e. the taxpayers), transparency, good quality
information and accessible data are most important for political credibility, in particular in the
field of subsidies. The EU Structural and Cohesion Funds should provide full disclosure.
Existing sectoral environmental and sustainability assessments like TERM (EEA, 2010) or
Energy and Environment Reports (EEA, 2006) currently fill the gap of the insufficient
monitoring and ex-post evaluation process as regards the fulfilment of sustainability criteria.
These assessments are an essential and recommended tool to deliver insights on
environmental impacts, and to partly counterbalance methodological and data constraints
that limit comparisons of sector-specific analyses.
In the future, the ex-ante, mid-term and ex-post evaluations could use compulsory indicators
aligned with the ‘Sustainable Development Indicators’. As the current indicators are mainly
concentrated on management and financial control, it is advisable to introduce indicators for
measuring the environmental impacts.
Throughout all evaluation and monitoring tools, there should be more systematic
differentiation between environmental projects with direct and indirect positive impacts in the
short, middle and long term.
5.3. Closing the Governance Gap: Increase of Policy Coherence
In order to increase the coherence within and across European policies and instruments, the
Structural and Cohesion Funds should be both part and the result of an integrated strategy
(Schepelmann, 2010). The targeted spending of public money for a limited number of
priorities that are clearly identified and justified is essential. The Lisbon priorities of growth
and jobs are very broad and partly conflict with environmental objectives. The relationship
between the two main principles growth and jobs and sustainable development needs
clarification. As an important step in order to strengthen the coherence with the Europe 2020
strategy (EC, 2010d) and the Roadmap to a Resource Efficient Europe of 2011 (EC, 2011),
‘resource efficiency’ should be systematically integrated as a core criterion for the projects,
supported by the regional policy of the EU, and related indicators for disclosing Member
States’ performance in this regard have to be established.
6. References
ADE (2008), Ex post evaluation of cohesion policy programmes 2000–2006 co-financed by the
European Fund for Regional Development (Objectives 1 and 2) – Work package 5b: Environment
and Climate Change – Revised First Intermediate Report, Louvain-la-Neuve.
Applica/Ismeri (2010a), Expert Evaluation Network delivering policy analysis on the performance of
cohesion policy 2007–2013: Inception report, Brussels.
Applica/Ismeri (2010b), Evaluation Network delivering policy analysis on the performance of cohesion
policy 2007 2013: Synthesis of national reports 2010, Brussels.
BirdLife Europe et al. (2010), Changing perspectives: How the EU budget can shape a sustainable
future, Brussels.
CEE Bankwatch Network/FoEE (2007), EU funds for public and environment-friendly transport,
Brussels.
CEE Bankwatch Network (2009), Explanatory comments on the Polish incinerator project awarded
with the RegioScars Award 2009, Brussels.
CoR (Committee of the Regions) (2010), Opinion of the Committee of the Regions on ‘Cohesion
policy: Strategic Report 2010 on the implementation of the programmes 2007–2013’ (2011/C
42/09), Luxembourg.
EEA (European Environment Agency) (2006), Energy and environment in the European Union:
Tracking progress towards integration, EEA Report No 8/2006, Copenhagen.
EEA (2010), Towards a resource-efficient transport system: TERM 2009: Indicators tracking transport
and environment in the European Union, EEA Report No 2/2010, Copenhagen.
EC (European Commission) (2004), Third progress report on economic and social cohesion,
COM(2004) 107 final, Brussels.
EC (2006a), Council regulation (EC) No 1083/2006 of 11 July 2006, Brussels.
EC (2006b), Council decision of 6 October 2006 on Community strategic guidelines on cohesion
(2006/702/EC), Brussels.
EC (2007a), Cohesion Policy 2007–13: National Strategic Reference Frameworks, Luxembourg.
EC (2007b), Member States and Regions delivering the Lisbon strategy for growth and jobs through
EU Cohesion Policy, 2007–2013, COM(2007) 798 final, Brussels.
EC (2007c), Indicative Guidelines on Evaluation Methods During the Programming Period: The New
Programming Period 2007–2013, Working Document No 5, Brussels, DG Regional Policy.
EC (2009), Cohesion Policy backs ‘green economy’ for growth and long-term jobs in Europe, press
release IP/09/369, Brussels.
EC (2010a), Conclusions of the fifth report on economic, social and territorial cohesion: The future of
cohesion policy, COM(2010) 642 final, Brussels.
EC (2010b), Cohesion policy: Strategic report 2010 on the implementation of the programmes 2007–
2013, SEC(2010) 360 final, Brussels.

EC (2010c), Commission staff working document on Cohesion Policy, SEC(2010) 360 final, Brussels.
EC (2010d), Europe 2020: A strategy for smart, sustainable and inclusive growth, COM(2010) 2020
final, Brussels.
EC (2011), Roadmap to a resource efficient Europe, COM(2011) 571 final, Brussels.
Eurostat (2009), Sustainable development in the European Union – 2009 monitoring report of the EU
sustainable development strategy, Luxembourg.
FoEE (Friends of the Earth Europe) (2009), Gone to waste: The valuable resources that European
countries bury and burn, Brussels.
FoEE (2010), Green scissors: More than $200 billion in cuts to wasteful and environmentally harmful
spending, Brussels.
GRDP (Greening Regional Development Programmes Network) (2006), Handbook on SEA for Cohesion Policy 2007 2013, Exeter, UK.
Mey, F. (2010), Country case studies: Cohesion Policy Funding – environmental harmful subsidies – a
real threat to biodiversity, Presentation 11 January 2010, Brussels.
Nordregio (Nordic Centre for Spatial Development) (2009), The potential for regional Policy
Instruments, 2007–2013, to contribute to the Lisbon and Gothenburg objectives for growth, jobs
and sustainable development. Final Report to the European Commission, Directorate-General for
Regional Policy, Evaluation Unit, Contract No 2007.CE.16.0.AT.041, Stockholm.
OECD (Organisation for Economic Co-operation and Development) (1998), Improving the Environment through Reducing Subsidies, Paris: OECD.
OECD (2005), Environmentally Harmful Subsidies: Challenges for Reform, Paris: OECD.
Schepelmann, P., Stock, M., Koska, T., Schüle, R. and Reutter, O. (2009), A green new deal for
Europe: Towards green modernisation in the face of crisis, Wuppertal, Wuppertal Institute for
Climate, Environment and Energy.
Schepelmann, P. (2010), A systems theoretical perspective on greening EU regional policy, in Goria,
A. (ed.), Governance for the Environment: a Comparative Analysis of Environmental Policy Integration, Cheltenham, UK and Northampton, MA, USA: Edward Elgar, pp. 121–156.
Schwab, O. (2010), Expert Evaluation Network delivering policy analysis on the performance of
cohesion policy 2007–2013, task 2: Country report on achievements of cohesion policy, Germany,
a report to the European Commission Directorate-General Regional Policy, Brussels.
Simon, J.-M. (2010), When the EU wastes the climate: The EU policy of subsidising energy from
burning waste is worsening the climate, Brussels: Global Anti-Incinerator Alliance.
Stefanova, A. and Konecny, M. (2008), EU Structural and Cohesion Funds and their impact on
climate, Brussels: CEE Bankwatch/FoEE.
Valsecchi, C., ten Brink, P., Bassi, S., Withana, S., Lewis, M., Best, A., Oosterhuis, F., Dias Soares,
C., Rogers-Ganter, H. and Kaphengst ,T. (2009), Environmentally Harmful Subsidies: Identification and Assessment, London and Brussels: IEEP.
Well, L. van (2009), The potential for regional Policy Instruments, 2007 2013, to contribute to the
Lisbon and Gothenburg objectives for growth, jobs and sustainable development. Presentation of
Final Report Results for DG REGIO Evaluation Network, 3 April, Brussels.
WWF (World Wildlife Fund) (2006), Conflicting EU funds: Pitting conservation against unsustainable
development, WWF Global Species Programme, Vienna.
Note: Many items of the evaluation literature above are archived at:
http://ec.europa.eu/regional_policy/information/evaluations/index_en.cfm