Embed Size (px)
Citation preview
Neurobiology of Disease
Ethanol-Responsive Brain Region Expression Networks:Implications for Behavioral Responses to Acute Ethanol inDBA/2J versus C57BL/6J Mice
Robnet T. Kerns,1 Ajay Ravindranathan,3 Sajida Hassan,1 Mary P. Cage,1 Tim York,2 James M. Sikela,4
Robert W. Williams,5 and Michael F. Miles1
1Departments of Pharmacology/Toxicology and Neurology and the Center for Study of Biological Complexity and2Massey Cancer Center, VirginiaCommonwealth University, Richmond, Virginia 23298, 3The Ernest Gallo Clinic and Research Center, University of California at San Francisco, Emeryville,California 94608, 4Department of Pharmacology and Human Medical Genetics, University of Colorado Health Sciences Center at Fitzsimons, Aurora,Colorado 80045, and 5Department of Anatomy and Neurobiology, University of Tennessee Health Science Center, Memphis, Tennessee 38163
Activation of the mesolimbic dopamine reward pathway by acute ethanol produces reinforcement and changes in gene expression thatappear to be crucial to the molecular basis for adaptive behaviors and addiction. The inbred mouse strains DBA/2J and C57BL/6J exhibitcontrasting acute behavioral responses to ethanol. We used oligonucleotide microarrays and bioinformatics methods to characterizepatterns of gene expression in three brain regions of the mesolimbic reward pathway of these strains. Expression profiling includedexamination of both differences in gene expression 4 h after saline injection or acute ethanol (2 g/kg). Using a rigorous stepwise methodfor microarray analysis, we identified 788 genes differentially expressed in control DBA/2J versus C57BL/6J mice and 307 ethanol-regulated genes in the nucleus accumbens, prefrontal cortex, and ventral tegmental area. There were strikingly divergent patterns ofethanol-responsive gene expression in the two strains. Ethanol-responsive genes also showed clustering at discrete chromosomal re-gions, suggesting local chromatin effects in regulation. Ethanol-regulated genes were generally related to neuroplasticity, but regulationof discrete functional groups and pathways was brain region specific: glucocorticoid signaling, neurogenesis, and myelination in theprefrontal cortex; neuropeptide signaling and developmental genes, including factor Bdnf, in the nucleus accumbens; and retinoic acidsignaling in the ventral tegmental area. Bioinformatics analysis identified several potential candidate genes for quantitative trait locilinked to ethanol behaviors, further supporting a role for expression profiling in identifying genes for complex traits. Brain region-specific changes in signaling and neuronal plasticity may be critical components in development of lasting ethanol behavioral phenotypessuch as dependence, sensitization, and craving.
Key words: ethanol; neurobiology; microarray; behavior; bioinformatics; mouse genetics
IntroductionAcute behavioral responses to ethanol have predictive value re-garding risk for long-term ethanol drinking behavior in humans(Schuckit, 1994) and animal models (Metten et al., 1998). Acuteethanol-mediated brain signaling events may have a role in thegenesis of long-lasting behaviors such as dependence, sensitiza-tion, and craving. Drug-induced changes in gene expression areproposed as critical molecular adaptations leading to addiction
with repeated drug exposure (Nestler and Aghajanian, 1997).Characterization of acute ethanol effects on brain gene expres-sion could thus provide insight into mechanisms of rewardingproperties or other acute behavioral responses to ethanol, as wellas the neurobiology of long-term behaviors such as addiction.
Rodent model systems differing in ethanol-related pheno-types have been used extensively to study the behavioral geneticsof ethanol action (Crabbe et al., 1999). The inbred mouse strainsDBA/2J (D2) and C57BL/6 (B6) differ markedly and inversely ina number of ethanol behaviors. D2 mice show larger locomotorresponses to acute ethanol and drink less than B6 mice (Phillips etal., 1994; Metten et al., 1998). We hypothesize that differences ineither specific basal gene expression or acute ethanol-evokedchanges in gene expression could be important determinants ofdivergent behavioral responses to ethanol between D2 and B6mice.
Expression profiling with DNA microarrays has been used toidentify functionally relevant patterns of brain gene expression incomplex behavioral traits (Mirnics et al., 2000). Microarrays havebeen used to study ethanol-responsive genes in neural cell cul-
Received Oct. 21, 2004; revised Jan. 11, 2005; accepted Jan. 11, 2005.This work was supported by Grants AA13678 (M.F.M.), AA11853 (J.M.S.), AA13499 (R.W.W.), and AA13513
(R.W.W.) from the National Institute on Alcohol Abuse and Alcoholism and by funds provided by the State ofCalifornia (M.F.M.) for medical research on alcohol and substance abuse through the University of California, SanFrancisco. WebQTL is also funded by the National Institutes of Health Human Brain Project (Grants P20-MH 62009and IBN-0003982; R.W.W., K. Manley). We thank V. Gene Erwin for providing the dissecting block and tools and fortraining in brain microdissection, Elissa Chesler for many helpful discussions regarding WebQTL studies, and JenniferWolstenholme, Norb Wilke, and Sonya Burger for excellent technical support for this work.
Correspondence should be addressed to Dr. Michael F. Miles, Department of Pharmacology/Toxicology, VirginiaCommonwealth University, P.O. Box 980599, 1217 East Marshall Street, Room 630, Richmond, VA 23298. E-mail:[email protected].
DOI:10.1523/JNEUROSCI.4372-04.2005Copyright © 2005 Society for Neuroscience 0270-6474/05/252255-12$15.00/0
The Journal of Neuroscience, March 2, 2005 • 25(9):2255–2266 • 2255

tures (Thibault et al., 2000) and genes differentially expressed inthe prefrontal cortex and amygdala in response to chronic etha-nol exposure in rats (Rimondini et al., 2002) and the prefrontal ormotor cortex of human alcoholics (Lewohl et al., 2000). Expres-sion profiling has also documented strain-specific differential ex-pression in the D2 and B6 hippocampus during acute andchronic ethanol withdrawal (Daniels and Buck, 2002) or thewhole brain after an anesthetic dose of ethanol (Treadwell andSingh, 2004). This latter study hinted at strain-specific differencesin response to acute ethanol but did not actually report these. Xuet al. (2001) also reported on expression profiling comparison ofuntreated ILS and ISS mice, strains originally selected for differ-ences in ethanol-induced sleep time.
The nucleus accumbens (NAC), prefrontal cortex (PFC), andventral tegmental area (VTA) are major components of the me-solimbocortical dopamine pathway activated by acute ethanol orother drugs of abuse (Koob, 1992). To date, no comprehensivestudy of gene expression patterns across the mesolimbocorticalsystem has been done to compare B6 and D2 mouse responses toacute ethanol. We therefore used oligonucleotide microarraysand bioinformatic tools to characterize expression networks inthe NAC, VTA, and PFC of control or ethanol-treated D2 and B6mice. Our results suggest several discrete mechanisms that maycontribute to differences in ethanol behaviors between B6 and D2mice.
Materials and MethodsAdministration of acute ethanol and animal microdissection. All animalswere treated according to protocols for animal care established by Vir-ginia Commonwealth University and the National Institutes of Health.Adult male B6 or D2 mice (79 –95 d old; The Jackson Laboratory, BarHarbor, ME) were housed five to a cage with ad libitum access to standardrodent chow (catalog #7912; Harlan Teklad, Madison, WI) and water ina 12 h dark/light cycle. All injections were intraperitoneal. The Institu-tional Animal Care and Use Committees of Virginia CommonwealthUniversity, the University of California, San Francisco, and the ErnestGallo Clinic and Research Center approved all experimental procedures.
Mice were given a saline injection once daily for 5 d to habituate themto the injection process. On day 6, mice received either an injection ofsaline or 20% ethanol in saline at doses mentioned in the text. Experi-ments were performed in triplicate with five mice per treatment group,except for an ethanol dose–response study (see Fig. 5) done with dupli-cate ethanol or saline treatment groups of four mice per treatment. After4 h, or as otherwise mentioned in Results, animals were killed by cervicaldislocation. Mouse brains were extracted and chilled for 1 min in phos-phate buffer on ice before microdissection. Dissections were completed5–10 min from the time of death. The mouse brain micropunch dissec-tion method training, dissecting block, and tools were provided by V.Gene Erwin (University of Colorado, Boulder, CO). Briefly, with theventral surface of the brain up, a vertical slice was made just rostral to theoptic chiasm. The rostral section was placed with the caudal face up, andthe PFC was isolated by slicing a pie-shaped wedge overlapping the in-terhemispheric fissure from the dorsal cortical surface extending to thecorpus callosum. The NAC was dissected with a 1.5 mm micropunchcentered over each anterior commissure. The VTA was isolated from theremaining caudal brain section. After removal of the hypothalamus withtweezers, the caudal portion of the brain was placed dorsal side-up. Avertical slice was made rostral to the cerebellum, between the superiorand inferior colliculi, and, after discarding the cerebellum, a slice wasmade at a 45° angle from the dorsal caudal end down toward the ventralrostral end. The cortical regions of the ventral portion were peeled away,and a transverse cut was made to separate the VTA from the dorsalmidbrain. Brain regions were placed in individual tubes, frozen immedi-ately with liquid nitrogen, and stored at �80°C until isolation of totalRNA.
Tissue pooled from four or five animals was homogenized in STAT-60
reagent (Tel-Test, Friendswood, TX) using a Tekmar homogenizer, andtotal RNA was isolated according to the STAT-60 protocol. RNA concen-tration was determined by absorbance at 260 nm, and RNA quality wasanalyzed by agarose gel electrophoresis and 260:280 nm absorbance ra-tios. Total RNA (7 �g) derived from each pool was reverse transcribedinto double-stranded cDNA using the Superscript II system (Invitrogen,Carlsbad, CA). Biotin-labeled cRNA was synthesized from cDNA using aBioArray high-yield RNA-transcript labeling kit (ENZO Diagnostics,Farmingdale, NY) according to the instructions of the manufacturer,purified using an RNAeasy Mini kit (Qiagen, Mountain View, CA), andquantified by absorbance at 260 nm.
Microarray hybridization and scanning. Each treatment group or rep-licate was hybridized to an individual microarray for each of the threebrain regions studied (n � 36 total microarrays for experiment 1). La-beled cRNA samples were analyzed on oligonucleotide microarrays (Mu-rine GeneChip U74Av2; Affymetrix, Santa Clara, CA) that contain�12,000 named genes and expressed sequence tags. Array hybridizationand scanning were performed exactly according to the protocol of themanufacturer and as described previously (Thibault et al., 2000). Arrayswere then washed, stained with streptavidin–phycoerythrin (MolecularProbes, Eugene, OR), and scanned according to standard protocols sup-plied by the manufacturer (Affymetrix).
Microarray data analysis. Microarray data were initially processed us-ing Microarray Suite software (MAS; Affymetrix) version 4.0 or 5.0. Ar-rays were normalized to a median total hybridization intensity (targetaverage intensity, 190). Array quality was assessed by accepting onlyarrays with a scaling factor of �2.3 and a 3�-5�-actin ratio of �2 and byexamining chip validity and linearity of intensity values, according toMAS guidelines. Arrays determined to be acceptable were further ana-lyzed in three steps to identify genes with altered expression patterns.First, the S-score algorithm, developed in this laboratory for analysis ofAffymetrix oligonucleotide arrays (Zhang et al., 2002), was applied tocompare hybridization signals between two arrays from different treat-ment samples. S-score results are independent of the initial analysis al-gorithm used (MAS 4.0 or MAS 5.0), have a normal distribution withmean of 0 and SD of 1, and are correlated with the fold change. AnS-score of 2 corresponds to a p � 0.0455, uncorrected for biologicalvariability or multiple comparisons. Three types of comparisons weremade: (1) to study ethanol responses, S-scores were calculated forethanol-treated samples versus saline control samples within each brainregion and mouse strain; (2) to examine strain expression differencesbetween D2 and B6 mice, S-scores were calculated for B6 saline controlsamples versus D2 saline control samples; and (3) control S-scores werecalculated between biological replicates of the same saline controlgroups. S-scores were calculated within replicates.
To reduce the contribution of biological or technical noise, S-scoreswere divided by the greater of 1 or the SD of control S-scores within brainregions. We found that this general approach, which has been appliedpreviously to microarray data (Hughes et al., 2000), reduces varianceacross experimental replicates, although it does result in a more conser-vative estimate of expression changes. Genes with consistently low ex-pression values were filtered to eliminate genes with MAS 4.0 averagedifference values of �50 in all samples. Statistical analysis of microarrays(SAM), a rank-based permutation method, was used to identify geneswith S-scores significantly different from 0 (Tusher et al., 2001). Thisgene list was used for subsequent multivariate or bioinformatic analyses.Ethanol-regulated genes were identified by performing two-class SAMon ethanol versus saline S-scores (e.g., D2 NAC E1 vs D2 NAC S1) andsaline versus saline S-scores (e.g., D2 NAC S1 vs D2 NAC S2). Genesdifferentially expressed (basal) between mice strains were identified byone- and multi-class SAM on B6 saline versus D2 saline S-scores (e.g., B6PFC S1 vs D2 PFC S1). This basal gene list was further filtered for anaverage S-score of �1.5 or �1.5 or less (composite significance, p �0.01). All SAM analyses used a false discovery rate of �10% to avoideliminating genes that may be biologically important and could assist ininterpretation of expression patterns in multivariate studies. In virtuallyall cases, the S-scores for samples with altered expression had a compositesignificance of p � 0.01 (uncorrected for multiple testing). Qualitativelysimilar results were obtained with multiple other analysis methods as
2256 • J. Neurosci., March 2, 2005 • 25(9):2255–2266 Kerns et al. • Brain Region Ethanol Expression Networks
input for the SAM analysis, including PDNN (position-dependent near-est neighbor) (Zhang et al., 2003). Genes that showed both significantand reproducible changes were further analyzed for correlated gene ex-pression patterns by application of k-means clustering as described byEisen et al. (1998). The number of nodes for k-means clustering wasestimated by principle component analysis and visually adjusted to re-move repetitive nodes.
Our experimental design of including only three biological replicateslikely limited detection of more subtle expression changes, particularly oflow-abundance genes. However, we found that the S-score analysismethod is particularly useful for studies having limited numbers of Af-fymetrix microarrays because the method uses the statistical power of alloligonucleotide pairs for a given gene (Zhang et al., 2002). Our inclusionof a method for decreasing the contribution of technical or biologicalnoise increases the yield of statistical filtering measures such as SAM bydecreasing the overall variance of the data (data not shown). Finally, weused a somewhat liberal false discovery rate in the SAM analysis to in-crease our ability to populate functional networks of genes in subsequentbioinformatic studies. Such measures are unlikely to contribute mislead-ing results because the bioinformatic studies will only detect genes withcoherence in their biological function.
Bioinformatics analysis of microarray data. The Expression AnalysisSystematic Explorer (EASE version 1.21) (Hosack et al., 2003) nonbiasedannotation analysis tool was used to identify biological themes amonggene expression profiles and to group genes into functional classifica-tions developed by several public databases. The following annotationgroupings were analyzed for overrepresentation in gene lists: chromo-some, SwissProt key word, PIR (The Protein Information Resource) keyword, GenMAPP (Gene Map Annotator and Pathway Profiler) pathway,KEGG (Kyoto Encyclopedia of Genes and Genomes) pathway, Pfam(Protein families database of alignments and HMMs) domain, SMART(Simple Modular Architecture Research Tool) domain, Gene OntologyConsortium Biological Process, molecular function, and cellular compo-nent. EASE results were filtered to remove categories with EASE scores of�0.05. Gene Ontology Consortium (2001) categories with �250 mem-bers on the U74Av2 array were considered too broad and were removed.Redundant categories with the same gene members were removed toyield a single representative category.
Additional bioinformatics analysis of genes showing altered basal ex-pression or regulation by ethanol was done by identifying the chromo-somal location of all such genes and superimposing this on supportintervals for various behavioral quantitative trait loci (QTL) data asnoted in Results. Chromosome locations for genes probed by AffymetrixU74Av2 arrays were obtained through the University of California, SantaCruz, Mouse Genome Database (http://www.genome.ucsc.edu). Geneswere also probed for linkage of basal expression to defined chromosomelocations through the WebQTL resource (http://www.webqtl.org). TheWebQTL resource includes MG_U74Av2 expression data of forebrainsamples from �30 B6 � D2 recombinant inbred (BXD RI) lines and canbe used to link gene expression to genetic markers and correlate withbehavioral QTL data contained in the same database (Chesler et al.,2003). Expression QTLs at a position coinciding with that of the geneitself are referred to as “cis-QTLs,” whereas those occurring at remotelocations are “trans-QTLs.” The latter imply that expression for a givengene is controlled by a specific trans-chromosomal region (e.g., where atranscription factor is located). The WebQTL scriptable interface wasused to retrieve single-marker mapping data for lists of ethanol-responsive genes and genes with differences in basal expression betweenstrains. The genetic marker with the highest likelihood ratio statistic(LRS) was selected for each gene. Genes with LRSs of �9.2 [logarithm ofodds (LOD) �2] were used for additional analysis.
Functional or regulatory relationships between genes from k-meansclusters were further studied using several biomedical literature associa-tion tools. Accession numbers or Affymetrix probe set identificationnumbers were used with the BiblioSphere (Genomatix Software, Mu-nich, Germany) or Chilibot (www.chilibot.net) (Chen and Sharp, 2004)programs for discovery of biomedical literature interrelations, conservedpromoter motifs, or association with ethanol in the biomedical literature.
Quantitative real-time reverse transcription-PCR. Total RNA isolated
for microarray hybridizations was used for reverse transcription-PCR.cDNA was generated from 1 �g of total RNA by reverse transcriptionwith an iScript cDNA kit (Bio-Rad, Hercules, CA) according to the in-structions of the manufacturer. Briefly, total RNA was incubated witholigo-dT, random hexamer primers, and reverse transcriptase at 55°C for5 min, 42°C for 30 min, and 85°C for 5 min. cDNA was used eitherimmediately or stored at �20°C. Biological triplicate pools of RNA (seeabove) were used to make three cDNA preparations for each treatmentgroup. Quantitative real-time PCR (Q-rtPCR) was performed using theiCycler iQ system (Bio-Rad) according to the instructions of the manu-facturer for SYBR Green I (Molecular Probes)-based detection. Techni-cal replicate Q-rtPCR reactions (n � 3) were done for each cDNA prep-aration. Technical replicates were averaged before statistical analysis.Background fluorescence was normalized by addition of fluorescein. Allprimers were designed to minimize secondary structure formation andcross intron– exon boundaries (when available) to reduce amplificationof genomic DNA. After Q-rtPCR, all reactions were checked by gel elec-trophoresis to ensure that they produced a single PCR product of theappropriate size. Results were normalized to 18S ribosomal RNA. Gen-Bank accession numbers, forward (F) and reverse (R) primers, and an-nealing temperatures were used for the following genes: brain-derivedneurotrophic growth factor (Bdnf ), accession number X55573: F, 5�-AGC CTC CTC TAC TCT TTC TGC TG-3�; R, 5�-GTG CCT TTT GTCTAT GCC CCT G-3�; FK506-binding protein 5 (Fkbp5), accession num-ber U16959: F, 5�-TTT CAG TGT CCA GCA CAG ATC-3�; R, 5�-CTAAGC AAA TCT CAT CAC CCG C-3�; proteolipid protein (Plp), acces-sion number M14674: F, 5�-GGG TTA CAG AGG CCA ACA TCA AG-3�; R, 5�-TGA CAG GTG GTC CAG GTA TTG AAG-3�; tyrosine hydrox-ylase (Th), accession number M69200: F, 5�-ACA GTA CAT CCG TCATGC CTC C-3�; R, 5�-AGC CCA AAC TCC ACA GTG AAC C-3�; and18S rRNA, accession number X00686: F, 5�-TAA AGG AAT TGA CGGAAG GGC AC-3�; R, 5�-CCA GAC AAA TCG CTC CAC CAA C-3�.
Western blot analysis. D2 mice (n � 3 per treatment group) weretreated with saline or ethanol (2 g/kg) for 6 h before harvesting braintissue as above. The D2 PFC from individual mice was sonicated in 1%SDS, and protein concentration was determined by BCA protein assay(Pierce, Rockford, IL). Samples (5, 10, and 20 �g protein content) wereloaded into 10% Tris-HCl polyacrylamide precast gels (GeneMate; ISCBioExpress, Kaysville, UT), separated by gel electrophoresis at 100 V for1 h in 25 mM Tris, 192 mM glycine, and 0.1% SDS, and transferred to apolyvinylidene difluoride membrane (Bio-Rad) at 30 mA overnight at4°C. All remaining steps were performed at room temperature. Aftertransfer, the membrane was incubated in 10% bovine serum albumin inTris-buffered saline and 0.1% Tween 20 (BSA/TBSt). The membrane wasprobed with rabbit anti-mouse Fkbp5 IgG (PA1-020; Affinity Bio-reagents, Golden, CO), diluted 1:15,000 in 1% BSA/TBSt for 2 h, washedthree times for 15 min with TBSt, probed with HRP-conjugated donkeyanti-rabbit IgG (Jackson ImmunoResearch, West Grove, PA) in 1% BSA/TBSt for 1 h, and finally washed three times for 10 min with TBSt. Mem-branes were incubated with ECL reagent (Amersham Biosciences, Pisca-taway, NJ) according to the instructions of the manufacturer andvisualized with an Eastman Kodak (Rochester, NY) EDAS 290 cameraand software. To further ensure reproducible protein loading, mem-branes were stripped by washing three times for 10 min in 20 mM Tris, 50mM DTT, and 10% SDS at 60°C and reprobed with mouse anti-mouseactin IgM (CP-01; Oncogene Sciences, San Diego, CA) and goat anti-mouse HRP-conjugated IgM (Calbiochem, La Jolla, CA) as above.
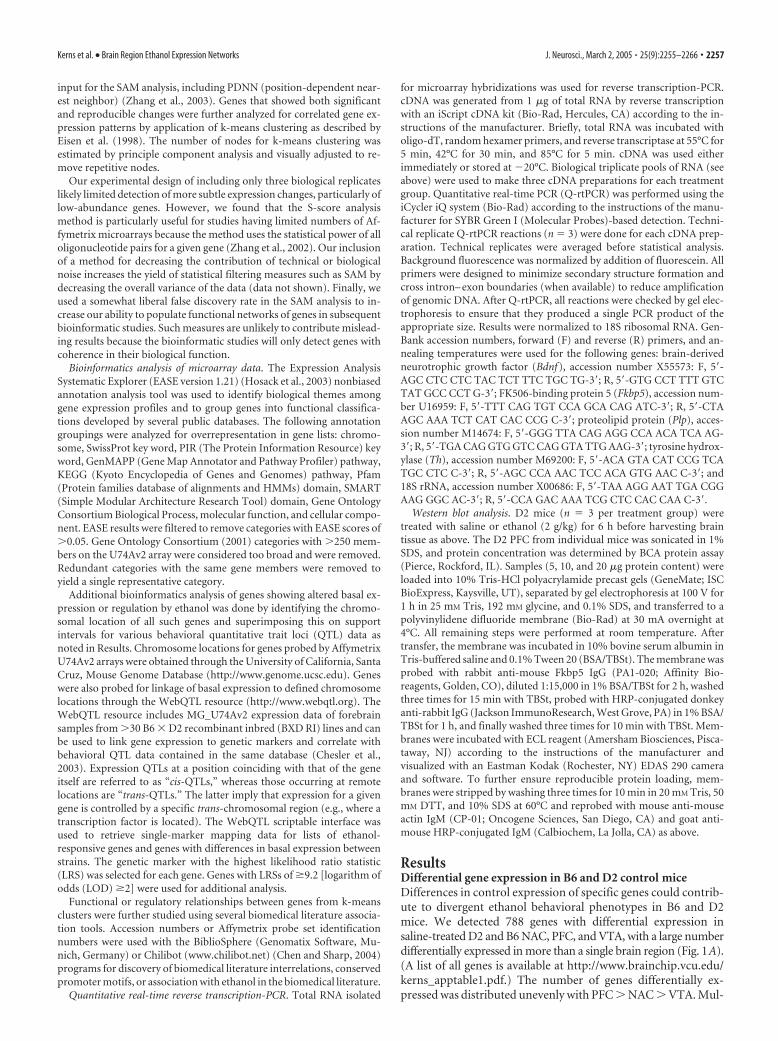
ResultsDifferential gene expression in B6 and D2 control miceDifferences in control expression of specific genes could contrib-ute to divergent ethanol behavioral phenotypes in B6 and D2mice. We detected 788 genes with differential expression insaline-treated D2 and B6 NAC, PFC, and VTA, with a large numberdifferentially expressed in more than a single brain region (Fig. 1A).(A list of all genes is available at http://www.brainchip.vcu.edu/kerns_apptable1.pdf.) The number of genes differentially ex-pressed was distributed unevenly with PFC � NAC � VTA. Mul-
Kerns et al. • Brain Region Ethanol Expression Networks J. Neurosci., March 2, 2005 • 25(9):2255–2266 • 2257
tivariate analysis (k-means clustering) (Fig. 1B) confirmed thatmore genes were differentially expressed in the PFC than otherbrain regions, and most genes were differentially expressed inmore than one brain region of a strain (Fig. 1B, clusters 1, 3).
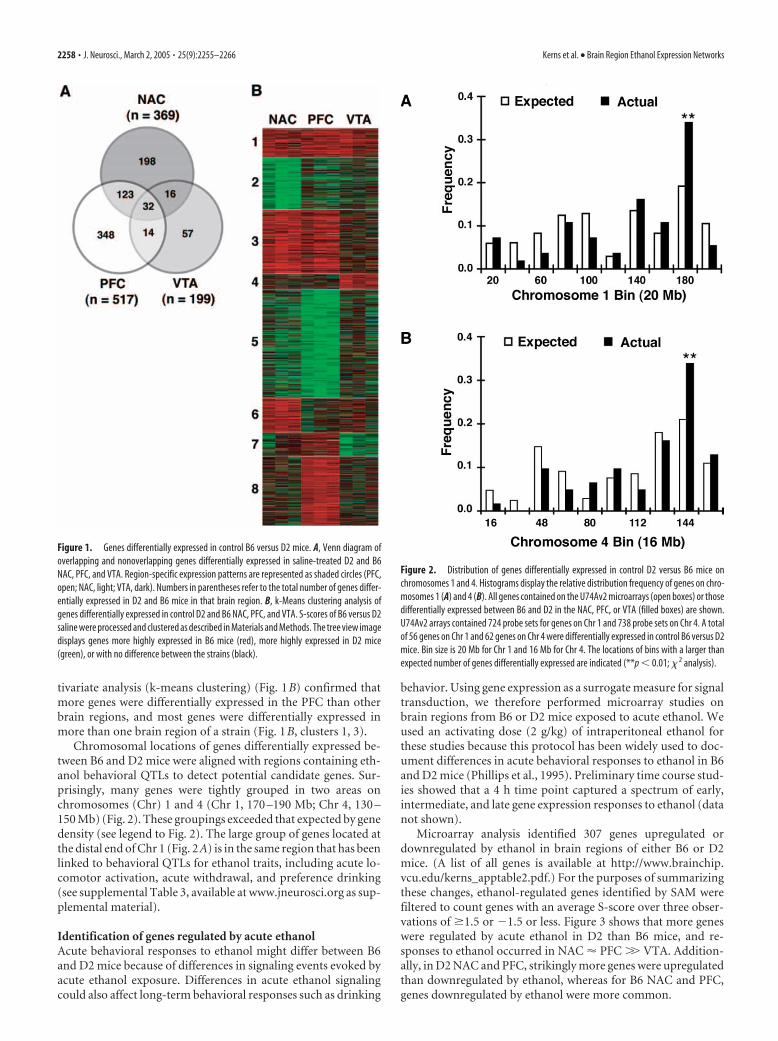
Chromosomal locations of genes differentially expressed be-tween B6 and D2 mice were aligned with regions containing eth-anol behavioral QTLs to detect potential candidate genes. Sur-prisingly, many genes were tightly grouped in two areas onchromosomes (Chr) 1 and 4 (Chr 1, 170 –190 Mb; Chr 4, 130 –150 Mb) (Fig. 2). These groupings exceeded that expected by genedensity (see legend to Fig. 2). The large group of genes located atthe distal end of Chr 1 (Fig. 2A) is in the same region that has beenlinked to behavioral QTLs for ethanol traits, including acute lo-comotor activation, acute withdrawal, and preference drinking(see supplemental Table 3, available at www.jneurosci.org as sup-plemental material).
Identification of genes regulated by acute ethanolAcute behavioral responses to ethanol might differ between B6and D2 mice because of differences in signaling events evoked byacute ethanol exposure. Differences in acute ethanol signalingcould also affect long-term behavioral responses such as drinking
behavior. Using gene expression as a surrogate measure for signaltransduction, we therefore performed microarray studies onbrain regions from B6 or D2 mice exposed to acute ethanol. Weused an activating dose (2 g/kg) of intraperitoneal ethanol forthese studies because this protocol has been widely used to doc-ument differences in acute behavioral responses to ethanol in B6and D2 mice (Phillips et al., 1995). Preliminary time course stud-ies showed that a 4 h time point captured a spectrum of early,intermediate, and late gene expression responses to ethanol (datanot shown).
Microarray analysis identified 307 genes upregulated ordownregulated by ethanol in brain regions of either B6 or D2mice. (A list of all genes is available at http://www.brainchip.vcu.edu/kerns_apptable2.pdf.) For the purposes of summarizingthese changes, ethanol-regulated genes identified by SAM werefiltered to count genes with an average S-score over three obser-vations of �1.5 or �1.5 or less. Figure 3 shows that more geneswere regulated by acute ethanol in D2 than B6 mice, and re-sponses to ethanol occurred in NAC � PFC �� VTA. Addition-ally, in D2 NAC and PFC, strikingly more genes were upregulatedthan downregulated by ethanol, whereas for B6 NAC and PFC,genes downregulated by ethanol were more common.
Figure 1. Genes differentially expressed in control B6 versus D2 mice. A, Venn diagram ofoverlapping and nonoverlapping genes differentially expressed in saline-treated D2 and B6NAC, PFC, and VTA. Region-specific expression patterns are represented as shaded circles (PFC,open; NAC, light; VTA, dark). Numbers in parentheses refer to the total number of genes differ-entially expressed in D2 and B6 mice in that brain region. B, k-Means clustering analysis ofgenes differentially expressed in control D2 and B6 NAC, PFC, and VTA. S-scores of B6 versus D2saline were processed and clustered as described in Materials and Methods. The tree view imagedisplays genes more highly expressed in B6 mice (red), more highly expressed in D2 mice(green), or with no difference between the strains (black).
Figure 2. Distribution of genes differentially expressed in control D2 versus B6 mice onchromosomes 1 and 4. Histograms display the relative distribution frequency of genes on chro-mosomes 1 (A) and 4 (B). All genes contained on the U74Av2 microarrays (open boxes) or thosedifferentially expressed between B6 and D2 in the NAC, PFC, or VTA (filled boxes) are shown.U74Av2 arrays contained 724 probe sets for genes on Chr 1 and 738 probe sets on Chr 4. A totalof 56 genes on Chr 1 and 62 genes on Chr 4 were differentially expressed in control B6 versus D2mice. Bin size is 20 Mb for Chr 1 and 16 Mb for Chr 4. The locations of bins with a larger thanexpected number of genes differentially expressed are indicated (**p � 0.01; � 2 analysis).
2258 • J. Neurosci., March 2, 2005 • 25(9):2255–2266 Kerns et al. • Brain Region Ethanol Expression Networks

Multivariate analysis (k-means clustering) detected groups ofethanol-regulated genes in D2 and B6 NAC, PFC, and VTA withcommon expression patterns (Fig. 4). Control expressionS-scores were included in this multivariate analysis to identifyethanol-responsive genes with differential expression between B6and D2 mice. In addition to general trends noted above, Figure 4displays several features of the ethanol responses: (1) except forcluster 6, which was strongly induced by ethanol in B6 NAC andmildly decreased in B6 PFC, most ethanol-responsive genes wereregulated in only one of the three brain regions analyzed, VTA(clusters 1, 5), NAC (clusters 3, 7, 8, 11), or PFC (clusters 2, 9, 10);(2) a considerable number of genes were regulated by ethanol inopposite directions in D2 and B6 mice (see clusters 1, 5, 6); (3)most clusters showed both altered control expression and differ-ential responses to ethanol between B6 and D2 (see clusters 1, 5,9); and (4) relatively few ethanol-responsive genes were similarlyregulated by ethanol in both D2 and B6 mice (cluster 11).
Bioinformatic analysis of microarray expression patternsTo identify potential biological phenotypes associated with geneexpression patterns contained in Figures 1B and 4, we used amultilayered strategy of bioinformatics analysis as described inMaterials and Methods. All 788 genes with differential expressionin control D2 and B6 mice from Figure 1 were analyzed by EASEfor overrepresentation of functional categories compared with allgenes present on the U74Av2 array (supplemental Table 1, avail-able at www.jneurosci.org as supplemental material). Major sig-nificant groups included genes functioning in glutamate or car-boxylic acid metabolism as well as several categories related toprotein synthesis (translation, chaperones, and peptidases).
Biological function categories of ethanol-responsive expres-sion patterns (supplemental Table 2, available at www.jneurosci.orgas supplemental material) contained a number of categories rel-evant to neuronal function, development, and synaptic plasticity.This was more evident when genes from related brain region-specific clusters were analyzed. The VTA-related clusters (1, 5)were remarkable for overrepresentation of genes related to reti-noic acid signaling. NAC clusters (3, 6 – 8, 11) showed a complexgroup of functions, including categories related to neuronaltransmission (ion channels and synaptic proteins), neuropep-
tides, and signal transduction. The PFC had an overrepresenta-tion of genes related to myelin and neurogenesis. High-throughput literature association analysis of brain region-selective clusters revealed more striking functional relationshipsbetween ethanol-responsive clusters from Figure 4.
Ventral tegmental areaClusters 1 and 5 showed both altered control expression anddivergent ethanol responsiveness in the VTA of D2 and B6 mice.These genes included a POU (Pit1-Oct1/2-Unc86) domain tran-scription factor (Pou5fl or Oct-3/4) and the homeobox proteingastrulation homeobox 2 (Gbx2), both of which function in dif-ferentiation of the hindbrain–midbrain boundary (Reim andBrand, 2002) (Fig. 4, cluster 1). Additionally, ethanol modulatedexpression of retinol-binding protein 4 (Rbp4), which functionsin retinoic acid signaling. Retinoic acid signaling is important indifferentiation and function of dopaminergic neuron pathways(Samad et al., 1997) and has been suggested as a mechanismunderlying ethanol effects on the developing nervous system(Deltour et al., 1996). Retinoic acid signaling is known to regulateGbx2, Pou5fl, Reticulon 1 (Rtn1), and Rbp4, among many othertarget genes. Rtn1 (Fig. 4, cluster 5) is differentially regulated byethanol withdrawal in the cerebellum of D2 versus B6 mice(Schafer et al., 2001). We showed previously that the humanhomolog of Rtn1 is upregulated in prefrontal cortex tissue fromalcoholics (Lewohl et al., 2000).
Nucleus accumbensThis brain region showed complex ethanol-responsive patternswith multiple clusters of genes (Fig. 4, clusters 3, 7, 6, 8, 11).Clusters 3 and 7 had opposing responses to ethanol in the NAC ofD2 mice but responded minimally in B6 mice. EASE and directliterature network analysis identified multiple neuropeptide-signaling genes regulated by ethanol in the NAC, including cholecys-tikinin (Cck1), pituitary adenylate cyclase-activating polypetide 1(Adcyap1/Pacap), preproenkephalin 1 (Penk1), tachykinin 1 (Tac1),and Tac2. All of these neuropeptides are known to interact withdopaminergic signaling. For example, Cck1 modulates mesolimbicdopamine function in response to stress (Rotzinger et al., 2002).Acute ethanol exposure causes release of enkephalin in the nucleusaccumbens (Olive et al., 2001); thus decreases in Penk1 mRNA seenon microarrays may represent a compensatory response.
Several growth factors or developmental genes contained inNAC clusters are likely functional either in acute behavioral re-sponses to ethanol or as part of signaling events leading to behav-iors seen with repeated or long-term ethanol exposure (e.g., sen-sitization and craving). Bdnf has been strongly implicated inneuroplasticity resulting from multiple drugs of abuse (Horger etal., 1999; Akbarian et al., 2002). Bdnf modulates dopamine re-lease in the striatum, is associated with expression of the dopa-mine D3 receptor, and functions in development of behavioralsensitization (Horger et al., 1999; Guillin et al., 2004). The devel-opmental genes T-box brain 1 (Tbr1), and forkhead box P1(Foxp1) were coinduced with Bdnf in the NAC of D2 mice. Ex-pression of the neuropeptide gene Pacap was also closely corre-lated with Bdnf in cluster 7. Pacap regulates Bdnf expressionthrough enhancement of NMDA receptor function (Yaka et al.,2003). Mice lacking Pacap show marked increased locomotorresponses, decreased anxiety (Hashimoto et al., 2001), and re-duced levels of Bdnf (Zink et al., 2004). Mutation of the Drosoph-ila Pacap homolog amnesiac increases sensitivity to sedativeproperties of ethanol (Moore et al., 1998). Additional NAC clus-ter genes that interact with Bdnf or the trkB/Akt-signaling cascade
Figure 3. Number of ethanol-regulated genes by mouse strain and brain region. Ethanol-regulated genes identified by SAM were filtered to summarize the number of ethanol-regulatedgenes in specific brain regions. Genes were included if the mean S-score across three replicateexperiments was �1.5 or �1.5 or less.
Kerns et al. • Brain Region Ethanol Expression Networks J. Neurosci., March 2, 2005 • 25(9):2255–2266 • 2259

included B-cell linker 1 (Blnk1), growth factor receptor-boundsubstrate 2 (Grb2), phosphatase and tension homolog (Pten),Fmr1, and Foxp1. All of these genes were regulated by ethanol inthe NAC, although not all in the same direction or strain.
Ion channels regulated by ethanol in the NAC include the �1subunit of GABAA receptors (Gabrb1) and the �1 subunit of theBK potassium channel K� large conductance Ca 2�-activatedchannel, subfamily M, � member (mSLO1, Kcnma1). Both ofthese have been implicated previously in ethanol responses oralcoholism. Gabrb1 has been suggested as a candidate gene inalcohol dependence in human genetic studies (Song et al., 2003),but this is the first report of ethanol regulation of mRNA for thissubunit. Similarly, several studies in rodent models show thatethanol activates the BK calcium-activated potassium channel(Dopico et al., 1998), thus decreasing neuronal excitation. Recentgenetic studies in Caenorhabditis elegans implicate the worm BKchannel (Slo-1) as a major mediator of acute effects of ethanol onlocomotion in that species (Davies et al., 2003). Again, studieshere are the first to show ethanol regulation of mRNA expressionfor BK channels. The presence of Kcnma1-, Gabrb1-, and Bdnf-related genes in cluster 7 suggests that genes of this cluster mightcollectively have a crucial role in acute responses to ethanol.
Prefrontal cortexAcute ethanol responses in D2 PFC had two distinct patterns:genes upregulated by ethanol in D2 �� B6 PFC (Fig. 4, cluster 10)and genes also with altered control expression in B6 versus D2PFC (Fig. 4, clusters 2, 9). EASE analysis indicated that theseclusters contain an overrepresentation of genes involved inmainly three functions: neurogenesis and plasticity, metal ionhomeostasis, and myelination (supplemental Table 2, available atwww.jneurosci.org as supplemental material). Some of the mostrobust responses to ethanol were genes in cluster 10 that showedstrong induction by ethanol in the PFC of D2 mice. These genesinclude serum/glucocorticoid-regulated kinase (Sgk), Fkbp5, andmetallothioneins 1 and 2 (Mt1 and Mt2). These genes are relatedby their strong response to ethanol in the PFC and dose-responsive steady increases with higher ethanol concentrations(see Fig. 5, results with Mt2, Fkbp5). All of these genes also haveconsensus glucocorticoid-binding sites in their promoters(Scherf et al., 2000) or are known to respond to glucocorticoids(Chilibot analysis). Sgk regulates multiple ion channels (Farmanet al., 2002) and has been implicated in memory consolidation ofspatial learning (Tsai et al., 2002).
A number of genes induced by ethanol in PFC function inneuronal development or plasticity. Immediate early genes, com-monly regulated with neuronal activation, included FBJ osteosar-coma oncogene B (Fosb), early growth response 1 (Egr1) (Jones etal., 2001), and Jun. The extensive group of development-relatedgenes regulated by ethanol in D2 PFC included the homeoboxgenes distal-less homeobox 1 (Dlx1), pre B-cell leukemia tran-scription factor 3 (Pbx3), ephrin B3 (Efnb3), frizzled-related pro-tein (Frzb), neuronatin (Nnat), neuropilin (Nrp), Th, and multi-ple myelin-related genes (see below). Dlx1 and Pbx3 arecolocalized in their brain expression patterns (Toresson et al.,2000). Dlx functions in forebrain development, governing
Figure 4. Multivariate analysis of ethanol-regulated genes in D2 and B6 NAC, PFC, and VTA.A tree-view image of k-means clustering for 307 genes regulated by ethanol in the NAC, PFC,and VTA of D2 and B6 mice is shown. Genes were selected by statistical filtering of ethanolversus saline (D2 Et, B6 Et) S-scores as described in Materials and Methods. Correspondingvalues for B6 saline versus D2 saline S-scores (B6/D2) are also shown. Red, Upregulated byethanol or more highly expressed in B6 mice (B6/D2); green, downregulated by ethanol or morehighly expressed in D2 mice; black, no difference. Relevant functional groups and genes men-tioned in Results are indicated as follows: purple, retinoic acid-signaling, Rbp4 (plasma), Gbx2,Pou5f1, Rtn1; blue, myelin-related, Bin1, Mbp, Ndrg1, Mog (myelin oligodendrocyte glycopro-tein), Mobp, Plp (myelin), Mal (T-cell differentiation protein); light blue, neuronal development,Pbx3, Fosb, Qdpr (quininoid dihydropteridine reductase), Efnb3, Frzb, Mef2c (myocyte enhancerfactor 2C), Jun, Dlx1, Egr1, Th, Nrp, Nnat; green, glucocorticoid-signaling, Fkbp5, Mt1, Mt2, Sgk;navy blue, neuropeptide signaling, Penk1, Tac1, Tac2, Cpe (carboxypeptidase E), Sstr2 (somatostatinreceptor 2); pink, ion channels, Hcn2 (hyperpolarization-activated, cyclic nucleotide-gated K � 2),
4
Chrne (cholinergic receptor, nicotinic, � polypeptide), Grid1, Kcnma1, Kcnb1 (K � voltage-gatedchannel, Shab-related subfamily, member 1), Gabrb1, Gabrg2 (GABAA receptor, subunit �2),Kcnd2 (K � voltage-gated channel, Shal-related family, member 2), Fxyd7 (FXYD domain-containing ion transport regulator 2); lime green, BDNF signaling, Pten, Grb2, Tbr1, Bdnf, Blnk,Adcyap1, Frm1 (fragile X mental retardation syndrome 1 homolog); black, other, Mpdz, Pam.
2260 • J. Neurosci., March 2, 2005 • 25(9):2255–2266 Kerns et al. • Brain Region Ethanol Expression Networks

forebrain-specific combinations of transcription factor expres-sion (Andrews et al., 2003). Efnb3, a ligand for ephrin receptortyrosine kinases, functions in synaptic plasticity and develop-ment of spinal cord circuits underlying locomotor activity (Kul-lander et al., 2003) and was recently identified by microarraystudies as a candidate gene for a QTL for acute functional toler-ance to ethanol (Tabakoff et al., 2003). Coordinate induction ofTh, which catalyzes the rate-limiting step in dopamine biosyn-thesis, and quininoid dihydropteridine reductase (Qpdr), whichrecycles a cofactor for Th, may reflect increased demand for do-pamine biosynthesis after acute ethanol.
Cluster 2 included a number of myelin and myelin-relatedgenes with higher control expression in B6 PFC and upregulatedby ethanol in D2 PFC. The genes N-myc downstream regulated 1(Ndrg1) and bridging integrator 1 (Bin1) were also tightly corre-lated with myelin gene expression in cluster 2. Ndrg1 and Bin1 areboth known to interact with signaling by the c-Myc protoonco-gene (Butler et al., 1997; Shimono et al., 1999). Many of themyelin genes and the c-myc-related signaling molecules (c-Myc,Ndrg1, and Bin1) have known or predicted cAMP responseelement-binding protein (CREB) binding sites in their promot-ers (data not shown; data derived from BiblioSphere analysis).Other signaling molecules and transcription factors related tomyelin and oligodendrocyte function were also induced by etha-nol in the PFC. For example, endothelial differentiation, lyso-phosphatidic acid G-protein-coupled receptor 2 (Edg2), is aG-protein coupled receptor activated by lysophosphatidic acid(for review, see Yoshida and Ueda, 2001) and expressed in brainprimarily on oligodendrocytes. Edg2 was induced by ethanol butgrouped in cluster 10, likely because of a lack of differential con-trol expression in B6 versus D2 mice.
Dose–response studies subdivide ethanol responsesTo further characterize ethanol expression responses, we per-formed additional microarray analyses on limited dose–responsestudies at 0.5–2 g/kg ethanol. A single time point (4 h) was againused because of technical limitations on the number of animalsand microarrays that could be processed at one time. Detailed
analysis of this data will be presented elsewhere (R. T. Kerns andM. F. Miles, unpublished data). However, analysis of select re-gions of clusters from Figure 4 identified several types of doseresponses in DBA/2J mice. For example, Figure 5 shows that themyelin-related genes myelin-associated oligodendrocytic basicprotein (Mobp) and myelin basic protein (Mbp) (Fig. 4, cluster 2)had decreasing inductions in the PFC of D2 animals from 0.5 to 2g/kg ethanol. This suggests that maximal induction by ethanol forthese genes actually occurs at doses lower than 0.5 g/kg. In con-trast, Fkbp5 and Mt2, members of another PFC cluster of genesinduced by ethanol in D2 animals (Fig. 4, cluster 10), showedsignificant inductions only at the 2 g/kg ethanol dose.
Characterization of select genesWe used quantitative Q-rtPCR and Western blot analysis to fur-ther confirm select microarray results. Plp and Fkbp5 were chosenfor Q-rtPCR studies because they represent members of a largegroup of genes induced by ethanol in the PFC of D2 animals (Fig.4, clusters 2, 10). Plp also represents a member of the myelin-related gene group in cluster 2 (Fig. 4). Th is the rate-limitingenzyme in catecholamine biosynthesis, and microarray studiesshowed induction by ethanol in the PFC of D2 mice. Figure 6Ashows expression levels of Bdnf, Fkbp5, Plp, and Th in saline- andethanol-treated D2 PFC normalized to 18S rRNA levels in thesame samples. For comparison, Figure 6B plots mean MAS 5.0intensity values from array hybridizations. Western blot analysisof Fkbp5 showed the protein coded by this gene with qualitativelyincreased abundance in the prefrontal cortex by 6 h after 2 g/kgethanol treatment in DBA/2J animals (Fig. 6C).
Correlation of expression profiling with QTL studies onethanol phenotypesWe predicted that genes identified on microarray studies abovemight be candidate genes contributing to behavioral QTLs iden-tified for acute responses to ethanol or ethanol drinking behavior(for review, see Crabbe et al., 1999). We first mapped expressionchanges identified in our studies versus chromosomal regionsassigned to confirmed QTLs for acute locomotor responses toethanol, acute ethanol withdrawal, or ethanol preference drink-ing (for review, see Belknap et al., 1993). Other ethanol behav-ioral QTLs might also involve genes identified in these studies,but we focused on these behaviors for reasons noted above. Froma total of 996 genes either differentially expressed between B6 andD2 mice after saline injection or differentially regulated by etha-nol in these lines, 151 were mapped to chromosomal regionsimplicated in QTLs. Supplemental Table 3 (available at www.jneurosci.org as supplemental material) summarizes results ob-tained for the subgroup of genes (n � 36) regulated by ethanol.(For a list of all genes with expression differences between controlB6 and D2 mice mapped to confirmed QTLs, see supplementalTable 5, available at www.jneurosci.org as supplemental mate-rial.) This analysis identified the multiple pdz (postsynaptic den-sity-95/Discs large/zona occludens-1) domain protein (Mpdz)gene as a strong candidate for the alcohol withdrawal 2 (Alcw2)acute withdrawal QTL on Chr 4, thus supporting the classic ge-netic approach reported by Shirley et al. (2004). Mpdz was bothdifferentially expressed between B6 and D2 mice and was ethanolresponsive (induced in the PFC of D2 mice) (Fig. 4, cluster 2). Insupport of bioinformatic studies on Bdnf signaling describedabove, Bdnf was located within the support interval for the acutelocomotor responses to ethanol 3 (Actre3) ethanol locomotoractivation QTL.
As an additional approach to link expression profiling results
Figure 5. Ethanol dose–response results for selected genes. Average ethanol versus salineS-scores of gene expression in D2 PFC at 4 h in response to 0.5, 0.75, 1.0, and 2.0 g/kg ethanol areshown. S-scores are the average from two replicate experiments.
Kerns et al. • Brain Region Ethanol Expression Networks J. Neurosci., March 2, 2005 • 25(9):2255–2266 • 2261

to ethanol behaviors, we used the WebQTL Project (http:/www.webqtl.org/) resources as described in Materials and Methods. Bycorrelating expression patterns with genotype data and previousbehavioral QTL analyses across the same BXD lines, it is possibleto link expression patterns to specific chromosomal loci (Chesleret al., 2003). As shown in supplemental Table 4 (available at
www.jneurosci.org as supplemental material), using WebQTL,we identified multiple ethanol-responsive genes as having cis- ortrans-QTLs in regions previously linked to the ethanol behaviorsmentioned above. Peptidylglycine �-amidating monoxygenase(Pam) showed both cis- and trans-QTLs in the region of severalethanol behavioral QTLs contained on chromosome 1. A largenumber of genes with differences in expression between controlB6 and D2 mice also had significant expression QTLs overlappingwith behavioral QTLs (see supplemental Table 6, available atwww.jneurosci.org as supplemental material).
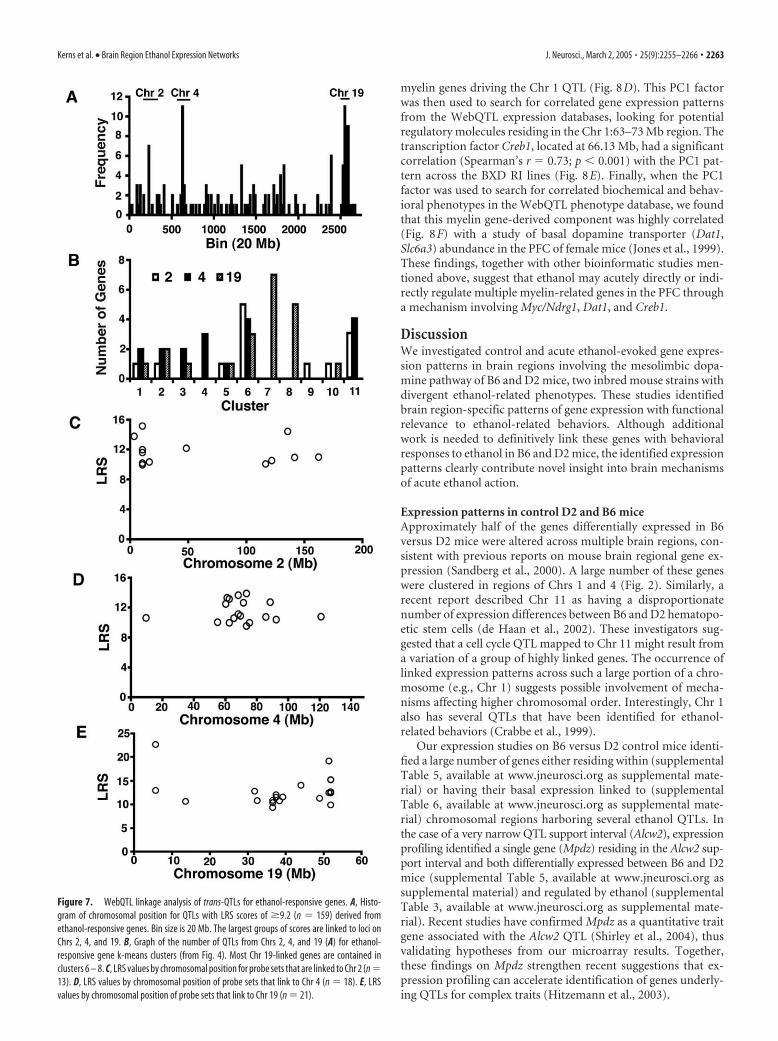
We also identified the distribution of linkage peaks (peak LRSscores) from WebQTL (5/03 U74Av2 database) for all ethanol-responsive genes included in Figure 4. The premise of this analysiswas that common chromosomal regions (trans-QTLs) not studiedabove (supplemental Table 4, available at www.jneurosci.org assupplemental material) might modulate basal expression of thesegenes across BXD RI lines. Figure 7A shows a histogram for LRSscores of �9.2 (LOD �2) for the 307 ethanol-responsive genes.The list of genes and their linkage regions are also included (seesupplemental Table 7, available at www.jneurosci.org as supple-mental material). Strikingly, there were several regions (proximalChr 2, mid Chr 4, and distal Chr 19) linked to the expression forgroups of ethanol-regulated genes. Chromosome 19 had the larg-est such group, with �17 genes having trans-QTLs with LRS of�9.2 within a 20 Mb region (Chr 19, 31–51 Mb). These genes alsoshowed correlated responses to ethanol in our data (Fig. 7B), withthe majority being in NAC clusters 6 – 8 from Figure 4. Theseclusters all predominantly contain genes with increased or de-creased expression in NAC after ethanol treatment. Of the genesin these NAC clusters discussed above, Cck1 and Gabrb1 both hadstrong linkage to the 31–51 Mb region of Chr 19.
Analysis of expression QTLs linked to regions containing eth-anol QTLs of interest (supplemental Table 4, available at www.jneurosci.org as supplemental material) identified the Pam geneas having a strikingly strong cis-QTL peak. Pam had an expressionQTL with an LRS of �40 centered at 100.4 Mb (D1Mit11) on Chr1 (Fig. 8A), and the Pam gene is physically located at 98.36 Mb.The robustness on this QTL and the important role that Pam hasin activating many peptide hormones or neuropeptides via ami-dation (Eipper et al., 1993) encouraged us to pursue further ge-netic correlations to Pam expression. When basal Pam expressionin the BXD RI lines was correlated with behavioral QTL studies inWebQTL, the strongest correlation was to locomotor activity inethanol sensitization (Phillips et al., 1996) (Fig. 8B). On intervalmapping, this trait showed an LRS peak in the same location asPam (Fig. 8C). These data suggest that the basal difference in Pamexpression may contribute to genetic differences in locomotorsensitization after repeated ethanol exposure in the BXD recom-binant inbred lines.
As described above, bioinformatic analysis indicated that anumber of myelin-related genes were induced by ethanol in thePFC of D2 mice (Fig. 4, cluster 2). Such coordinate regulation ofrelated genes suggests a common underlying mechanism. Be-cause genes in cluster 2 also showed control expression differ-ences between B6 and D2 animals, we used WebQTL to deter-mine whether basal expression of myelin-related genes waslinked to common chromosomal regions and whether such hadcorrelations with other phenotypes. A series of myelin-relatedgenes in cluster 2 [myelin and lymphocyte protein (Mal), Mbp,Mobp, and Bin1] had strong trans-QTLs in the 63–73 Mb regionof Chr 1 (data not shown). Using principal components analysisof these myelin genes through WebQTL on-line resources, wederived a major factor [principal component 1 (PC1)] from these
Figure 6. Verification of select microarray data by quantitative real-time PCR and Westernblot analysis. A, Q-rtPCR quantitation of Plp, Fkbp5, and Th mRNA levels in ethanol (2 g/kg, 4 h)-and saline-treated D2 PFC or Bdnf in ethanol- and saline-treated D2 NAC. Primer sequences areprovided in Materials and Methods. Expression levels were normalized relative to 18S rRNA.Significance was determined by two-sample Student’s t test (*p � 0.05; **p � 0.01; ***p �0.001). B, MAS 5.0 intensity values from microarray hybridizations for Plp, Fkbp5, and Th in D2PFC or Bdnf in D2 NAC from the same experiment as in A. Corresponding mean S-score values forD2 EtOH versus saline from three experiments, calculated as described in Materials and Meth-ods, were as follows: Plp, 6.8; Fkbp5, 2.6; Th, 3.2; and Bdnf, 3.0. C, Western blot analysis of Fkbp5in protein isolates from saline (S)- and ethanol (Et)-treated D2 PFC at the indicated times after2 g/kg ethanol. Results are representative of experiments repeated three times. C, Control.
2262 • J. Neurosci., March 2, 2005 • 25(9):2255–2266 Kerns et al. • Brain Region Ethanol Expression Networks
myelin genes driving the Chr 1 QTL (Fig. 8D). This PC1 factorwas then used to search for correlated gene expression patternsfrom the WebQTL expression databases, looking for potentialregulatory molecules residing in the Chr 1:63–73 Mb region. Thetranscription factor Creb1, located at 66.13 Mb, had a significantcorrelation (Spearman’s r � 0.73; p � 0.001) with the PC1 pat-tern across the BXD RI lines (Fig. 8E). Finally, when the PC1factor was used to search for correlated biochemical and behav-ioral phenotypes in the WebQTL phenotype database, we foundthat this myelin gene-derived component was highly correlated(Fig. 8F) with a study of basal dopamine transporter (Dat1,Slc6a3) abundance in the PFC of female mice (Jones et al., 1999).These findings, together with other bioinformatic studies men-tioned above, suggest that ethanol may acutely directly or indi-rectly regulate multiple myelin-related genes in the PFC througha mechanism involving Myc/Ndrg1, Dat1, and Creb1.
DiscussionWe investigated control and acute ethanol-evoked gene expres-sion patterns in brain regions involving the mesolimbic dopa-mine pathway of B6 and D2 mice, two inbred mouse strains withdivergent ethanol-related phenotypes. These studies identifiedbrain region-specific patterns of gene expression with functionalrelevance to ethanol-related behaviors. Although additionalwork is needed to definitively link these genes with behavioralresponses to ethanol in B6 and D2 mice, the identified expressionpatterns clearly contribute novel insight into brain mechanismsof acute ethanol action.
Expression patterns in control D2 and B6 miceApproximately half of the genes differentially expressed in B6versus D2 mice were altered across multiple brain regions, con-sistent with previous reports on mouse brain regional gene ex-pression (Sandberg et al., 2000). A large number of these geneswere clustered in regions of Chrs 1 and 4 (Fig. 2). Similarly, arecent report described Chr 11 as having a disproportionatenumber of expression differences between B6 and D2 hematopo-etic stem cells (de Haan et al., 2002). These investigators sug-gested that a cell cycle QTL mapped to Chr 11 might result froma variation of a group of highly linked genes. The occurrence oflinked expression patterns across such a large portion of a chro-mosome (e.g., Chr 1) suggests possible involvement of mecha-nisms affecting higher chromosomal order. Interestingly, Chr 1also has several QTLs that have been identified for ethanol-related behaviors (Crabbe et al., 1999).
Our expression studies on B6 versus D2 control mice identi-fied a large number of genes either residing within (supplementalTable 5, available at www.jneurosci.org as supplemental mate-rial) or having their basal expression linked to (supplementalTable 6, available at www.jneurosci.org as supplemental mate-rial) chromosomal regions harboring several ethanol QTLs. Inthe case of a very narrow QTL support interval (Alcw2), expressionprofiling identified a single gene (Mpdz) residing in the Alcw2 sup-port interval and both differentially expressed between B6 and D2mice (supplemental Table 5, available at www.jneurosci.org assupplemental material) and regulated by ethanol (supplementalTable 3, available at www.jneurosci.org as supplemental mate-rial). Recent studies have confirmed Mpdz as a quantitative traitgene associated with the Alcw2 QTL (Shirley et al., 2004), thusvalidating hypotheses from our microarray results. Together,these findings on Mpdz strengthen recent suggestions that ex-pression profiling can accelerate identification of genes underly-ing QTLs for complex traits (Hitzemann et al., 2003).
Figure 7. WebQTL linkage analysis of trans-QTLs for ethanol-responsive genes. A, Histo-gram of chromosomal position for QTLs with LRS scores of �9.2 (n � 159) derived fromethanol-responsive genes. Bin size is 20 Mb. The largest groups of scores are linked to loci onChrs 2, 4, and 19. B, Graph of the number of QTLs from Chrs 2, 4, and 19 (A) for ethanol-responsive gene k-means clusters (from Fig. 4). Most Chr 19-linked genes are contained inclusters 6 – 8. C, LRS values by chromosomal position for probe sets that are linked to Chr 2 (n �13). D, LRS values by chromosomal position of probe sets that link to Chr 4 (n � 18). E, LRSvalues by chromosomal position of probe sets that link to Chr 19 (n � 21).
Kerns et al. • Brain Region Ethanol Expression Networks J. Neurosci., March 2, 2005 • 25(9):2255–2266 • 2263

Region-specific, ethanol-responsivegene expression patternsMany ethanol-responsive genes were dif-ferentially regulated in D2 versus B6 mice(Fig. 4), suggesting fundamental geneticdifferences in signaling evoked by acuteethanol in these mice. k-Means analysis(Fig. 4) indicated that ethanol responseswere primarily confined to single brain re-gions. Although there were genes that didrespond to ethanol in multiple regions,these changes were sometimes of differentdirections in D2 versus B6 mice (Fig. 4, clus-ter 6). Bioinformatic analysis confirmed re-gional differences in functional patternsevoked by ethanol (Fig. 4; supplementalTable 2, available at www.jneurosci.org assupplemental material). These findingssuggest that ethanol-evoked, brain region-specific signaling events predominate overmore global responses to ethanol. Thiscould be consistent with neural pathwayactivation of gene expression after acuteethanol stimulation. Strikingly, whenbasal expression of ethanol-responsivegenes was assessed through WebQTL, alarge group of genes from NAC clusters ofFigure 4 were found to have trans-QTLlinks to a common region of Chr 19 (Fig.7). This strongly suggests that these genesmay have an common underlying mecha-nism(s) of regulation.
Bioinformatic analysis of ethanol-responsive clusters revealed regional func-tional changes that can primarily be summarized as follows: VTA,retinoic acid signaling and developmental; NAC, Bdnf signalingand neuropeptide expression; and PFC, glucocorticoid-responsive genes, development, and myelin related. However, theVTA, NAC, and PFC did express patterns all potentially related toa larger functional group, namely, neuroplasticity. For example,retinoic acid signaling, Pou5fl, and Gbx2 (VTA) are all known tobe crucial to development of the hindbrain–midbrain region,Bdnf signaling (NAC) is known to function in a number of dif-ferent models of experience-dependent plasticity (Guillin et al.,2004), and Sgk (PFC) has been shown to modulate spatial learn-ing and long-term potentiation in the hippocampus (Tsai et al.,2002). Furthermore, myelin (PFC)-associated molecules have re-cently been suggested to be a dynamic part of axonal remodeling(Josephson et al., 2003). Our results might thus implicate wide-spread ethanol-evoked neuroplasticity events across the me-solimbocortical dopamine pathway but with differing mecha-nisms within regions.
Our expression data suggests that Pacap-Bdnf signaling is aparticularly important target of acute ethanol action in the NAC.In support of this premise, Bdnf is located within a QTL region(supplemental Table 3, available at www.jneurosci.org as supple-mental material) linked to acute locomotor responses to ethanol(Actre3; Chr 2, 108 –112 Mb; LOD �9) (Demarest et al., 2001).Thus, Bdnf may be a viable candidate gene for the Actre3 QTL. Ina very recent study, McGough et al. (2004) reported that Bdnf, viaa mechanism requiring RACK1 (receptor for activated C kinase)protein, is induced by acute ethanol treatment or voluntary eth-anol drinking in B6 mice. These investigators did not study re-
sponses in D2 mice. Bdnf underexpressing mice (Bdnf�/�) alsoshowed increased ethanol-conditioned place preference, in-creased sensitization after repeated ethanol exposure, and in-creased ethanol drinking after abstinence. These biochemical andbehavioral data, together with our expression data and bioinfor-matic analysis, strongly implicate Bdnf signaling as an importantfactor in acute ethanol behavioral responses and drinkingbehavior.
Region-selective patterns evoked by ethanol can also be con-sidered as being related to acute neurophysiological responses toethanol. For example, GABAA receptor subunits (Gabarb1 andGabarg2), the glutamate receptor ionotropic 1 (Grid1) gluta-mate receptor subunit, and the mSLO1 (Kcnma1) potassiumchannel subunit were all regulated by ethanol in the NAC. All ofthese receptors are known to be sites of acute ethanol action asmentioned in Results. Whether gene expression changes evokedin these receptor systems might therefore be related to moreshort-term adaptive responses, such as tolerance, remains to bedetermined.
Identifying expression differences for genes residing withinethanol QTL intervals is one method for relating genomics resultsto ethanol behaviors (supplemental Tables 3 and 5, available atwww.jneurosci.org as supplemental material). However, overlay-ing our expression results with genetic data on both gene expres-sion and behavior (WebQTL) increased our ability to correlateexpression with behavior. This approach also derived new mech-anistic information by linking basal expression levels for groupsof genes to specific chromosomal regions. For example, our stud-ies showed that ethanol coordinately regulated a group of myelin-
Figure 8. WebQTL analysis of Pam and myelin-related genes. A, Interval mapping of Pam expression pattern across BXDrecombinant inbred lines for loci on mouse Chr 1. Permutation and bootstrap testing (n � 2000) were done for significance ofinterval mapping. B, Correlation of Pam gene expression across BXD lines with locomotor activity (centimeters per 10 min �10 �2; day 11 � day 3) after ethanol sensitization (Phillips et al., 1996). Spearman’s rank-order correlation, r � 0.81 ( p �0.000001). C, Interval mapping of locomotor sensitization phenotype across BXD lines. Trait data shown in B were analyzed byinterval mapping with bootstrap and permutation testing. The Chr 1 linkage peak maps to the same position as the major PamQTL. D, Interval mapping for PC1 of myelin-related genes. Principal component analysis done within WebQTL was used to derivecomponents from expression patterns of Bin1 (probe set 92220_at), Mal (probe set 99089_at), Mbp (probe set 96311_at), Mobp(probe set 99048_g_at), and Plp (probe set 92802_at). A single principle component (PC1) accounted for �70% of the variance.Shown is the Chr 1 interval map for the derived PC1. All genes used for principal component analysis also had linkage peaks in samearea of Chr 1. E, Correlation of myelin PC1 with expression of Creb1 (probe set 100496_at) across BXD lines. Pearson’s correlationanalysis, r��0.7443. F, Correlation of myelin PC1 with dopamine transporter binding activity (�10 �2) in the PFC (Jones et al.,1999). Spearman’s rank-order correlation, r � 0.72 ( p � 0.001). All WebQTL expression data were from the 3/04 robustmulti-array average analysis (www.webqtl.org). BXD line 29 was excluded from all analyses because of anomalous behavior.
2264 • J. Neurosci., March 2, 2005 • 25(9):2255–2266 Kerns et al. • Brain Region Ethanol Expression Networks

related genes. We found that these genes also had basal expres-sion across the BXD RI lines strongly linked to a Chr 1 site nearthe transcription factor Creb1 gene (Fig. 8). Numerous facts sup-port a role for Creb1 in the myelin response: (1) basal myelin geneexpression is strongly linked to an interval on Chr 1 that containsthe Creb1 transcription factor; (2) Creb1, in turn, showed anexpression pattern across the BXD RI lines that was significantlycorrelated with the PC1 factor derived from myelin expressionprofiles (Fig. 8E); (3) many of the myelin genes and c-Myc-related signaling molecules (c-Myc, Nrd1, and Bin1) have knownor predicted CREB-binding sites in their promoters (data derivedfrom BiblioSphere analysis); and (4) acute ethanol is known toactivate cAMP signaling and CREB in multiple cell types androdent brain, whereas chronic ethanol exposure has been shownto downregulate CREB signaling (Diamond and Gordon, 1997;Yang et al., 1998; Asher et al., 2002).
Coordinate upregulation of myelin-related genes in D2 PFCwith acute ethanol contrasts with downregulation of multiplemyelin-related genes observed in our previous microarray stud-ies on postmortem frontal cortex from human alcoholics (Le-wohl et al., 2000). This suggests that acute ethanol may causedirect effects on myelin-related signaling mechanisms subse-quently downregulated with chronic exposure in alcoholism.CREB may be an excellent candidate for a proximal mechanismmediating ethanol effects on myelin-related gene expression,with activation by acute ethanol and downregulation by chronicexposure. Correlation of myelin gene-derived PC1 with dopa-mine transporter expression in the frontal cortex (Fig. 8) is fur-ther suggestive of a role for dopamine signaling in the myelinresponses. It is unknown whether ethanol-induced alterations inmyelin gene expression may have short- or long-term behaviorconsequences. However, clearly, dysfunction of myelin occurs inalcoholism (Kril and Harper, 1989).
WebQTL analysis also indicated a strong Chr 1 cis-QTL forPam expression across the BXD lines (Fig. 8A). Pam is known tomodulate functional activity of multiple neuropeptides, includ-ing NPY and PACAP, both of which influence ethanol behaviors(Moore et al., 1998; Thiele et al., 1998). The significant correla-tion of basal Pam expression with ethanol sensitization (Fig. 8B)further supports the potential importance of Pam in determiningdifferential behavioral responses to ethanol in B6 versus D2 mice.
The results described above illustrate striking divergent regu-lation of gene expression by ethanol in D2 and B6 mice. Brainregion-specific changes in signaling and neuronal plasticity maybe critical components in the development of lasting behavioralphenotypes, such as dependence, sensitization, and craving. Su-perimposing our results on biochemical and genetic data hasidentified a testable set of hypotheses regarding genes related toethanol behavioral QTLs and signaling events evoked by acuteethanol.
ReferencesAkbarian S, Rios M, Liu RJ, Gold SJ, Fong HF, Zeiler S, Coppola V, Tessarollo
L, Jones KR, Nestler EJ, Aghajanian GK, Jaenisch R (2002) Brain-derived neurotrophic factor is essential for opiate-induced plasticity ofnoradrenergic neurons. J Neurosci 22:4153– 4162.
Andrews GL, Yun K, Rubenstein JLR, Mastick GS (2003) Dlx transcriptionfactors regulate differentiation of dopaminergic neurons of the ventralthalamus. Mol Cell Neurosci 23:107–120.
Asher O, Cunningham TD, Yao L, Gordon AS, Diamond I (2002) Ethanolstimulates cAMP-responsive element (CRE)-mediated transcription viaCRE-binding protein and cAMP-dependent protein kinase. J PharmacolExp Ther 301:66 –70.
Belknap JK, Metten P, Helms ML, O’Toole LA, Angeli-Gade S, Crabbe JC,Phillips TJ (1993) Quantitative trait loci (QTL) applications to sub-
stances of abuse: physical dependence studies with nitrous oxide andethanol in BXD mice. Behav Genet 23:213–222.
Butler MH, David C, Ochoa GC, Freyberg Z, Daniell L, Grabs D, Cremona O,De Camilli P (1997) Amphiphysin II (SH3P9; BIN1), a member of theamphiphysin/Rvs family, is concentrated in the cortical cytomatrix ofaxon initial segments and nodes of Ranvier in brain and around T tubulesin skeletal muscle. J Cell Biol 137:1355–1367.
Chen H, Sharp BM (2004) Content-rich biological network constructed bymining PubMed abstracts. BMC Bioinformatics 5:147.
Chesler EJ, Wang J, Lu L, Qu Y, Manly KF, Williams RW (2003) Geneticcorrelates of gene expression in recombinant inbred strains: a relationalmodel system to explore neurobehavioral phenotypes. Neuroinformatics1:343–357.
Crabbe JC, Phillips TJ, Buck KJ, Cunningham CL, Belknap JK (1999) Iden-tifying genes for alcohol and drug sensitivity: recent progress and futuredirections. Trends Neurosci 22:173–179.
Daniels G, Buck KJ (2002) Expression profiling identifies strain-specificchanges associated with ethanol withdrawal in mice. Genes Brain Behav1:35– 45.
Davies AG, Pierce-Shimomura JT, Kim H, VanHoven MK, Thiele TR, BonciA, Bargmann CI, McIntire SL (2003) A central role of the BK potassiumchannel in behavioral responses to ethanol in C. elegans. Cell115:655– 666.
de Haan G, Bystrykh LV, Weersing E, Dontje B, Geiger H, Ivanova N,Lemischka IR, Vellenga E, Van Zant G (2002) A genetic and genomicanalysis identifies a cluster of genes associated with hematopoietic cellturnover. Blood 100:2056 –2062.
Deltour L, Ang HL, Duester G (1996) Ethanol inhibition of retinoic acidsynthesis as a potential mechanism for fetal alcohol syndrome. FASEB J10:1050 –1057.
Demarest K, Koyner J, McCaughran Jr J, Cipp L, Hitzemann R (2001) Fur-ther characterization and high-resolution mapping of quantitative traitloci for ethanol-induced locomotor activity. Behav Genet 31:79 –91.
Diamond I, Gordon AS (1997) Cellular and molecular neuroscience of al-coholism. Physiol Rev 77:1–20.
Dopico AM, Anantharam V, Treistman SN (1998) Ethanol increases theactivity of Ca(��)-dependent K� (mslo) channels: functional interac-tion with cytosolic Ca��. J Pharmacol Exp Ther 284:258 –268.
Eipper BA, Milgram SL, Husten EJ, Yun H, Mains RE (1993) Peptidylgly-cine alpha-amidating monooxygenase: a multifunctional protein withcatalytic, processing, and routing domains. Protein Sci 2:489 – 497.
Eisen MB, Spellman PT, Brown PO, Botstein D (1998) Cluster analysis anddisplay of genome-wide expression patterns. Proc Natl Acad Sci USA95:14863–14868.
Farman N, Boulkroun S, Courtois-Coutry N (2002) Sgk: an old enzymerevisited. J Clin Invest 110:1233–1234.
Gene Ontology Consortium (2001) Creating the Gene Ontology Resource:design and implementation. Genome Res 11:1425–1433.
Guillin O, Griffon N, Diaz J, Le Foll B, Bezard E, Gross C, Lammers C, StarkH, Carroll P, Schwartz JC, Sokoloff P (2004) Brain-derived neurotro-phic factor and the plasticity of the mesolimbic dopamine pathway. IntRev Neurobiol 59:425– 444.
Hashimoto H, Shintani N, Tanaka K, Mori W, Hirose M, Matsuda T, SakaueM, Miyazaki J, Niwa H, Tashiro F, Yamamoto K, Koga K, Tomimoto S,Kunugi A, Suetake S, Baba A (2001) Altered psychomotor behaviors inmice lacking pituitary adenylate cyclase-activating polypeptide (PACAP).Proc Natl Acad Sci USA 98:13355–13360.
Hitzemann R, Malmanger B, Reed C, Lawler M, Hitzemann B, Coulombe S,Buck K, Rademacher B, Walter N, Polyakov Y, Sikela J, Gensler B, BurgersS, Williams RW, Manly K, Flint J, Talbot C (2003) A strategy for theintegration of QTL, gene expression, and sequence analyses. Mamm Ge-nome 14:733–747.
Horger BA, Iyasere CA, Berhow MT, Messer CJ, Nestler EJ, Taylor JR (1999)Enhancement of locomotor activity and conditioned reward to cocaine bybrain-derived neurotrophic factor. J Neurosci 19:4110 – 4122.
Hosack D, Dennis G, Lane H, Lempicki R (2003) Identifying biologicalthemes in gene lists with EASE. Genome Biol 4:R70.
Hughes TR, Marton MJ, Jones AR, Roberts CJ, Stoughton R, Armour CD,Bennett HA, Coffey E, Dai H, He YD, Kidd MJ, King AM, Meyer MR,Slade D, Lum PY, Stepaniants SB, Shoemaker DD, Gachotte D, Chakra-burtty K, Simon J, et al. (2000) Functional discovery via a compendiumof expression profiles. Cell 102:109 –126.
Kerns et al. • Brain Region Ethanol Expression Networks J. Neurosci., March 2, 2005 • 25(9):2255–2266 • 2265

Jones BC, Tarantino LM, Rodriguez LA, Reed CL, McClearn GE, Plomin R,Erwin VG (1999) Quantitative-trait loci analysis of cocaine-related be-haviours and neurochemistry. Pharmacogenetics 9:607– 617.
Jones MW, Errington ML, French PJ, Fine A, Bliss TV, Garel S, Charnay P,Bozon B, Laroche S, Davis S (2001) A requirement for the immediateearly gene Zif268 in the expression of late LTP and long-term memories.Nat Neurosci 4:289 –296.
Josephson A, Trifunovski A, Scheele C, Widenfalk J, Wahlestedt C, Brene S,Olson L, Spenger C (2003) Activity-induced and developmental down-regulation of the Nogo receptor. Cell Tissue Res 311:333–342.
Koob GF (1992) Drugs of abuse: anatomy, pharmacology and function ofreward pathways. Trends Pharmacol Sci 13:177–184.
Kril JJ, Harper CG (1989) Neuronal counts from four cortical regions ofalcoholic brains. Acta Neuropathol (Berl) 79:200 –204.
Kullander K, Butt SJ, Lebret JM, Lundfald L, Restrepo CE, Rydstrom A, KleinR, Kiehn O (2003) Role of EphA4 and EphrinB3 in local neuronal cir-cuits that control walking. Science 299:1889 –1892.
Lewohl JM, Wang L, Miles MF, Zhang L, Dodd PR, Harris RA (2000) Geneexpression in human alcoholism: microarray analysis of frontal cortex.Alcohol Clin Exp Res 24:1873–1882.
McGough NN, He DY, Logrip ML, Jeanblanc J, Phamluong K, Luong K,Kharazia V, Janak PH, Ron D (2004) RACK1 and brain-derived neuro-trophic factor: a homeostatic pathway that regulates alcohol addiction.J Neurosci 24:10542–10552.
Metten P, Phillips TJ, Crabbe JC, Tarantino LM, McClearn GE, Plomin R,Erwin VG, Belknap JK (1998) High genetic susceptibility to ethanolwithdrawal predicts low ethanol consumption. Mamm Genome9:983–990.
Mirnics K, Middleton FA, Marquez A, Lewis DA, Levitt P (2000) Molecularcharacterization of schizophrenia viewed by microarray analysis of geneexpression in prefrontal cortex. Neuron 28:53– 67.
Moore MS, DeZazzo J, Luk AY, Tully T, Singh CM, Heberlein U (1998)Ethanol intoxication in Drosophila: genetic and pharmacological evidencefor regulation by the cAMP signaling pathway. Cell 93:997–1007.
Nestler EJ, Aghajanian GK (1997) Molecular and cellular basis of addiction.Science 278:58 – 63.
Olive MF, Koenig HN, Nannini MA, Hodge CW (2001) Stimulation of en-dorphin neurotransmission in the nucleus accumbens by ethanol, co-caine, and amphetamine. J Neurosci 21:RC184(1–5).
Phillips TJ, Dickinson S, Burkhart-Kasch S (1994) Behavioral sensitizationto drug stimulant effects in C57BL/6J and DBA/2J inbred mice. BehavNeurosci 108:789 – 803.
Phillips TJ, Huson M, Gwiazdon C, Burkhart-Kasch S, Shen EH (1995) Ef-fects of acute and repeated ethanol exposures on the locomotor activity ofBXD recombinant inbred mice. Alcohol Clin Exp Res 19:269 –278.
Phillips TJ, Lessov CN, Harland RD, Mitchell SR (1996) Evaluation of po-tential genetic associations between ethanol tolerance and sensitization inBXD/Ty recombinant inbred mice. J Pharmacol Exp Ther 277:613– 623.
Reim G, Brand M (2002) Spiel-ohne-grenzen/pou2 mediates regional com-petence to respond to Fgf8 during zebrafish early neural development.Development 129:917–933.
Rimondini R, Arlinde C, Sommer W, Heilig M (2002) Long-lasting increasein voluntary ethanol consumption and transcriptional regulation in therat brain after intermittent exposure to alcohol. FASEB J 16:27–35.
Rotzinger S, Bush DE, Vaccarino FJ (2002) Cholecystokinin modulation ofmesolimbic dopamine function: regulation of motivated behaviour.Pharmacol Toxicol 91:404 – 413.
Samad TA, Krezel W, Chambon P, Borrelli E (1997) Regulation of dopami-nergic pathways by retinoids: activation of the D2 receptor promoter bymembers of the retinoic acid receptor-retinoid X receptor family. ProcNatl Acad Sci USA 94:14349 –14354.
Sandberg R, Yasuda R, Pankratz DG, Carter TA, Del Rio JA, Wodicka L,Mayford M, Lockhart DJ, Barlow C (2000) Regional and strain-specific
gene expression mapping in the adult mouse brain. Proc Natl Acad SciUSA 97:11038 –11043.
Schafer GL, Crabbe JC, Wiren KM (2001) Ethanol-regulated gene expres-sion of neuroendocrine specific protein in mice: brain region and geno-type specificity. Brain Res 897:139 –149.
Scherf M, Klingenhoff A, Werner T (2000) Highly specific localization ofpromoter regions in large genomic sequences by PromoterInspector: anovel context analysis approach. J Mol Biol 297:599 – 606.
Schuckit MA (1994) Low level of response to alcohol as a predictor of futurealcoholism. Am J Psychiatry 151:184 –189.
Shimono A, Okuda T, Kondoh H (1999) N-myc-dependent repression ofndr1, a gene identified by direct subtraction of whole mouse embryocDNAs between wild type and N-myc mutant. Mech Dev 83:39 –52.
Shirley RL, Walter NA, Reilly MT, Fehr C, Buck KJ (2004) Mpdz is a quan-titative trait gene for drug withdrawal seizures. Nat Neurosci 7:699 –700.
Song J, Koller DL, Foroud T, Carr K, Zhao J, Rice J, Nurnberger Jr JI, BegleiterH, Porjesz B, Smith TL, Schuckit MA, Edenberg HJ (2003) Associationof GABA(A) receptors and alcohol dependence and the effects of geneticimprinting. Am J Med Genet 117B:39 – 45.
Tabakoff B, Bhave SV, Hoffman PL (2003) Selective breeding, quantitativetrait locus analysis, and gene arrays identify candidate genes for complexdrug-related behaviors. J Neurosci 23:4491– 4498.
Thibault C, Lai C, Wilke N, Duong B, Olive MF, Rahman S, Dong H, HodgeCW, Lockhart DJ, Miles MF (2000) Expression profiling of neural cellsreveals specific patterns of ethanol-responsive gene expression. Mol Phar-macol 58:1593–1600.
Thiele TE, Marsh DJ, Ste Marie L, Bernstein IL, Palmiter RD (1998) Ethanolconsumption and resistance are inversely related to neuropeptide Y levels.Nature 396:366 –369.
Toresson H, Parmar M, Campbell K (2000) Expression of Meis and Pbxgenes and their protein products in the developing telencephalon: impli-cations for regional differentiation. Mech Dev 94:183–187.
Treadwell JA, Singh SM (2004) Microarray analysis of mouse brain geneexpression following acute ethanol treatment. Neurochem Res29:357–369.
Tsai KJ, Chen SK, Ma YL, Hsu WL, Lee EH (2002) sgk, a primaryglucocorticoid-induced gene, facilitates memory consolidation of spatiallearning in rats. Proc Natl Acad Sci USA 99:3990 –3995.
Tusher VG, Tibshirani R, Chu G (2001) Significance analysis of microarraysapplied to the ionizing radiation response. Proc Natl Acad Sci USA98:5116 –5121.
Xu Y, Ehringer M, Yang F, Sikela JM (2001) Comparison of global braingene expression profiles between inbred long- sleep and inbred short-sleep mice by high-density gene array hybridization. Alcohol Clin Exp Res25:810 – 818.
Yaka R, He DY, Phamluong K, Ron D (2003) Pituitary adenylate cyclase-activating polypeptide (PACAP(1–38)) enhances N-methyl-D-aspartatereceptor function and brain-derived neurotrophic factor expression viaRACK1. J Biol Chem 278:9630 –9638.
Yang X, Horn K, Baraban JM, Wand GS (1998) Chronic ethanol adminis-tration decreases phosphorylation of cyclic AMP response element-binding protein in granule cells of rat cerebellum. J Neurochem70:224 –232.
Yoshida A, Ueda H (2001) Neurobiology of the Edg2 lysophosphatidic acidreceptor. Jpn J Pharmacol 87:104 –109.
Zhang L, Wang L, Ravindranathan A, Miles MF (2002) A new algorithm foranalysis of oligonucleotide arrays: application to expression profiling inmouse brain regions. J Mol Biol 317:225–235.
Zhang L, Miles MF, Aldape KD (2003) A model of molecular interactionson short oligonucleotide microarrays. Nat Biotechnol 21:818 – 821.
Zink M, Otto C, Zorner B, Zacher C, Schutz G, Henn FA, Gass P (2004)Reduced expression of brain-derived neurotrophic factor in mice defi-cient for pituitary adenylate cyclase activating polypeptide type-I-receptor. Neurosci Lett 360:106 –108.
2266 • J. Neurosci., March 2, 2005 • 25(9):2255–2266 Kerns et al. • Brain Region Ethanol Expression Networks