Embed Size (px)
Citation preview

The Full Cost of Electricity (FCe-)
Estimation of Transmission Costs for New GenerationP A R T O F A S E R I E S O F W H I T E P A P E R S

THE FULL COST OF ELECTRICITY is an interdisciplinary initiative of the Energy Institute of the University of Texas to identify and quantify the full-system cost of electric power generation and delivery – from the power plant to the wall socket. The purpose is to inform public policy discourse with comprehensive, rigorous and impartial analysis.
The generation of electric power and the infrastructure that delivers it is in the midst of dramatic and rapid change. Since 2000, declining renewable energy costs, stringent emissions standards, low-priced natural gas (post-2008), competitive electricity markets, and a host of technological innovations promise to forever change the landscape of an industry that has remained static for decades. Heightened awareness of newfound options available to consumers has injected yet another element to the policy debate surrounding these transformative changes, moving it beyond utility boardrooms and legislative hearing rooms to everyday living rooms.
The Full Cost of Electricity (FCe-) study employs a holistic approach to thoroughly examine the key factors affecting the total direct and indirect costs of generating and delivering electricity. As an interdisciplinary project, the FCe- synthesizes the expert analysis and different perspectives of faculty across the UT Austin campus, from engineering, economics, law, and policy.In addition to producing authoritative white papers that provide comprehensive assessment and analysis of various electric power system options, the study team developed online calculators that allow policymakers and other stakeholders, including the public, to estimate the cost implications of potential policy actions. A framework of the research initiative, and a list of research participants and project sponsors are also available on the Energy Institute website: energy.utexas.edu
All authors abide by the disclosure policies of the University of Texas at Austin. The University of Texas at Austin is committed to transparency and disclosure of all potential conflicts of interest. All UT investigators involved with this research have filed their required financial disclosure forms with the university. Through this process the university has determined that there are neither conflicts of interest nor the appearance of such conflicts.
This paper is one in
a series of Full Cost
of Electricity white
papers that examine
particular aspects of
the electricity system.
Other white papers
produced through the
study can be accessed
at the University of Texas
Energy Institute website:
energy.utexas.edu

The Full Cost of Electricity (FCe-) Estimation of Transmission Costs for New Generation, January 2017 | 3
Andrade, Juan, Baldick, Ross, “Estimation of Transmission Costs for New Generation,” White Paper UTEI/2016-09-2, 2017, available at http://energy.utexas.edu/the-full-cost-of-electricity-fce/.
Estimation of Transmission Costs for New Generation
Juan Andrade, Department of Electrical and Computer Engineering
Ross Baldick, Department of Electrical and Computer Engineering
ABSTRACT:
This report is focused on the description and estimation of the costs of new transmission developments associated with new generation projects in ERCOT. The report begins by justifying the relevance of transmission costs in particular for utility scale renewable generation. Then a detailed description of each part of transmission system
involved in the interconnection of new generation projects is provided. Based on this description, and using a combination of different public information sources and regression analysis, methodology is presented to estimate ERCOT transmission costs at different voltage levels.

The Full Cost of Electricity (FCe-) Estimation of Transmission Costs for New Generation, January 2017 | 4
1 | INTRODUCTIONThe electric delivery system is the bridge between electricity generation and consumption. Thus, it must accommodate the needs of both end users and generators.
All forms of electricity generation must be sited in areas that meet specific criteria: thermal power plants require a reliable supply of fuel and meet local air emissions standards; hydroelectric dams must be sited in strategic locations along existing waterways; wind turbines require sufficient wind speeds; and solar panels need sufficient sunlight. Thus, the electric grid must extend from the locations of individual generators to collect power for delivery to consumers. In some cases, generators and consumers are in the same location.
The electric delivery system has two major components, transmission and distribution, with a third to possibly become more important in the future, storage. The transmission system uses high-voltage power lines to interconnect electricity generators with major urban areas and other load centers. The distribution system collects power from the transmission system and distributes it to individual consumers using lower-voltage power lines. Unlike transmission and distribution that connect generation and consumption between different locations, storage systems connect between different points in time.
The particular technology focus of this report is transmission, and specifically transmission expansion, which has several purposes as is illustrated in Figure 1. This report is focused on transmission expansion. In particular we estimate the transmission costs associated with the development of new generation. This analysis provides a clear distinction among cost causation, cost allocation, and the interaction between them in the development of generation projects.
Often the discussion about the deployment of different electricity technologies is significantly affected by taxes, subsidies, a lack of complete technical evaluation, and popular trends for development. It is important to consider that a combination of technologies in the electric supply
chain may present the best solution to achieve a desired array of economic, environmental, and security goals. Each investment option has different costs and benefits, whether that option is new utility or distributed generation, transmission and distribution lines, storage systems, efficiency and conservation, or demand response.
This report considers the following aspects:
• Describe the significance of transmission costs for new generation projects
• Describe the cost structure of transmission for new generation
• Present an approximated methodology to estimate these costs
• Present results for the particular case of the Electric Reliability Council of Texas (ERCOT) grid
• Propose a proxy to include these costs into capacity expansion models
To consider these aspects in detail, the remainder of this paper has the following structure. First, in Section 2, we discuss background to transmission expansion. Second, Sections 3 to 5 focus on the three main transmission cost components: the “spur” transmission, the point of interconnection, and the bulk transmission costs. Then, in Section 6, we propose a method to represent the cost components in generation expansion modeling.
FIGURE 1
Relative Transmission Mile Additions > 100 kV by Primary Driver (NERC, 2010).
The Full Cost of Electricity (FCe-) Estimation of Transmission Costs for New Generation, January 2017 | 5
2 | BACKGROUND
How significant are transmission investments for new generation?
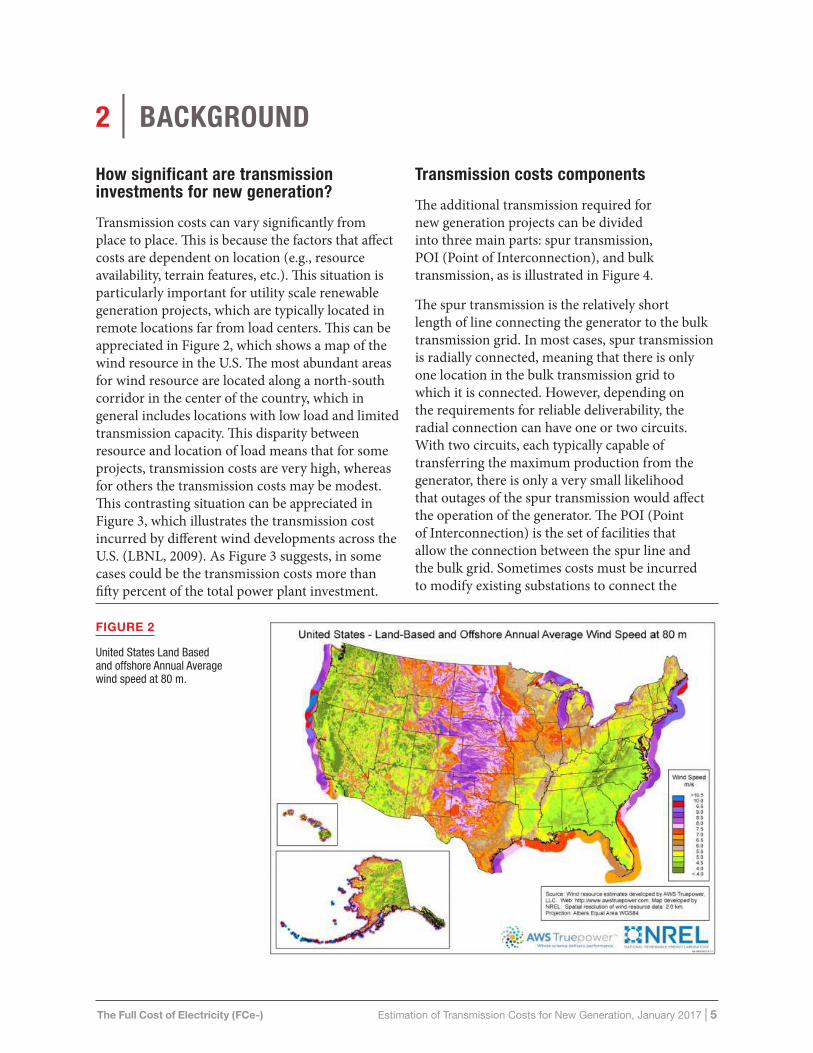
Transmission costs can vary significantly from place to place. This is because the factors that affect costs are dependent on location (e.g., resource availability, terrain features, etc.). This situation is particularly important for utility scale renewable generation projects, which are typically located in remote locations far from load centers. This can be appreciated in Figure 2, which shows a map of the wind resource in the U.S. The most abundant areas for wind resource are located along a north-south corridor in the center of the country, which in general includes locations with low load and limited transmission capacity. This disparity between resource and location of load means that for some projects, transmission costs are very high, whereas for others the transmission costs may be modest. This contrasting situation can be appreciated in Figure 3, which illustrates the transmission cost incurred by different wind developments across the U.S. (LBNL, 2009). As Figure 3 suggests, in some cases could be the transmission costs more than fifty percent of the total power plant investment.
Transmission costs components
The additional transmission required for new generation projects can be divided into three main parts: spur transmission, POI (Point of Interconnection), and bulk transmission, as is illustrated in Figure 4.
The spur transmission is the relatively short length of line connecting the generator to the bulk transmission grid. In most cases, spur transmission is radially connected, meaning that there is only one location in the bulk transmission grid to which it is connected. However, depending on the requirements for reliable deliverability, the radial connection can have one or two circuits. With two circuits, each typically capable of transferring the maximum production from the generator, there is only a very small likelihood that outages of the spur transmission would affect the operation of the generator. The POI (Point of Interconnection) is the set of facilities that allow the connection between the spur line and the bulk grid. Sometimes costs must be incurred to modify existing substations to connect the
FIGURE 2
United States Land Based and offshore Annual Average wind speed at 80 m.

The Full Cost of Electricity (FCe-) Estimation of Transmission Costs for New Generation, January 2017 | 6
spur lines. Finally, the bulk transmission grid is the shared infrastructure that allows transfer of electricity from multiple generation plants to the demands. It is composed of wires, towers, poles, reactive compensation, substations, etc. Sometimes
the introduction of a new generation project would result in overloads to the existing system of certain transmission elements under different conditions. This would then typically require that the existing lines be reinforced or that new lines be incorporated into the system to provide for the new generator. Since a large new line will typically have a much higher capacity than the capacity of the additional generator, there are inevitably joint cost allocation issues that complicate the assessment of the cost of transmission to support a particular generation upgrade.
It is important to bear in mind that in some cases, one or more of the three parts, spur, POI, and bulk transmission, can be neglected according to the type of development involved. At one extreme, in the case of a greenfield project, it is very likely that the necessary development will be required in all three parts. However, in the case of brownfield projects, in which there is already existing transmission for project, no additional significant transmission investment may be required. An example of a brownfield development could be the reuse of transmission infrastructure of a coal-fired power plant that is closed as a result of the new EPA regulations. Repowering of the plant to a combined-cycle gas turbine might allow for essentially zero transmission costs to support a new generator at such a brownfield site.
EIA 2013 wind project total EPC
cost
Transmission cost [$/kW]
0 500
Win
d pr
ojec
ts a
cros
s U
.S
1000 1500 2000
CREZ
FIGURE 3
Distribution of transmission investment costs for wind generation (LBNL, 2009).
FIGURE 4
Transmission cost parts for new generation projects.

The Full Cost of Electricity (FCe-) Estimation of Transmission Costs for New Generation, January 2017 | 7
The challenges for bulk system cost estimation
Bulk transmission cost estimates are particularly problematic because of a number of factors that contribute to uncertainty, including the issues of:
1. Land and construction costs,
2. Overhead versus underground transmission,
3. Extent of transmission upgrades needed between generation and distribution system,
4. Length of needed upgrades, and
5. Economies of scale and scope in transmission expansion.
These issues will be discussed in the following paragraph. To illustrate the first and second issues, consider two polar opposite examples of recent transmission construction:
• TheCompetitiveRenewableEnergyZone(CREZ)transmissioninTexas,involvingapproximately 100 lines, with average costs of around $2,500 per MW.mile, and
• TheSunrisePowerlinkinCalifornia,asingleline, with average costs of around $16,000 per MW.mile (Baldick & Littlechild, 2015).
The differences in costs are in part due to higher average land and construction costs in California compared to Texas. Although the overall average land and construction cost differences between, for example, California and Texas could be utilized to estimate costs of other projects in the respective states, there are also other idiosyncratic issues that will cause further variations in costs. For example, thedifferencesincostsbetweentheCREZandthe Sunrise Powerlink are not fully explicable in terms of the average difference between California and Texas costs, but were also driven by:
• Lowlandcostsandminimalcommunityopposition in West Texas, in contrast with,
• Environmentalimpactissuesinthespecific region in California that resulted in requirements for special construction processes and to underground some of the Sunrise Powerlink.
Underground construction can be an order of magnitude more expensive than overhead, so that the incorporation of significant underground transmission will result in significantly higher costs.
To understand the third issue, the estimation of the extent of needed transmission and distribution upgrades, first consider the contrast with generator construction costs. It is certainly true that land and construction costs for generators vary geographically; however, a generator developer will generally site in a manner that is cognizant of avoiding unnecessarily high costs in its immediate location. A given generation plan may then, however, necessitate particular transmission upgrades that might require transmission routing through expensive terrain, either from the perspective of land acquisition or construction. In some restructured states such as Texas, the costs of such upgrades are not generally paid directly by the generation developer, whereas in other states these costs can be directly charged at least in part to the generation developer. Moreover, it is important to recognize that the land and construction costs will vary over the diverse geographical area along transmission corridors, which can span different terrains. In the context oftheCREZtransmission,forexample,whereasmuch of the construction was in West Texas and had low land costs, some of the lines were close to urban areas such as Austin, where land costs were much higher and where significant siting constraints drove costs locally higher.
Furthermore, the characteristics of the additional generation can affect transmission needs. For example, a wind farm may produce most of its energy off-peak. Consequently, required transmission upgrades relate primarily to providing capacity between the renewable resource and the main high voltage lines nearby to the load zones, but perhaps do not require the upgrading of the transmission capacity all the way to the distribution substations in the load centers. As another example, a low level of redundancy in the transmission interconnection to support wind may be acceptable because the intrinsic variability of the renewable resource makes the joint occurrence of transmission outages and high wind unlikely.
On the other hand, a generator intended for

The Full Cost of Electricity (FCe-) Estimation of Transmission Costs for New Generation, January 2017 | 8
baseload production and built to meet an incremental load slice for most hours of the year may be associated with transmission upgrades in the transmission system at locations along the whole path from the generator to the distribution substations in the load center in order that the generator capacity is deliverable at peak demand times. This may require the routing of new or upgraded line segments that vary in cost depending on the local particulars. The added transmission capability for delivering power to meet peak demand should also be highly reliable, necessitating a higher degree of redundancy. Furthermore, the delivery of that energy may also require additional distribution system upgrades. While this assessment applies for new greenfield construction, repowering at brownfield sites might, on the other hand, involve minimal new transmission expenditures.
Turning to the fourth issue, the length of needed upgrades, let’s consider the location and type of generation. Several cases can be distinguished:
• Distributedresources,suchasrooftop solar, located at load.
• Largethermalgenerationresourcestypically located relatively close to, but outside of, load centers.
• Renewableresources,suchason-shorebut near coastal wind generation in Texas, located relatively close to load centers.
• Otherrenewableresources,suchasWest Texas wind, located relatively far from major load centers.
On average, locational constraints that require a resource to be further from load will require more transmission expenditure, all else equal. A thermal resource that is approximately 100 km or closer to load centers will require less transmission expenditure than a wind resource that is 500 km from load centers.
Even within this categorization, some care should be taken in making blanket assessments about required transmission. For example, in the initial phase of development of West Texas wind,
the historical pattern of generation and load development in Texas meant that West Texas had existing high voltage connections to the rest of Texas that allowed for import of several GW of power. For initial West Texas wind development from around 2000 through 2007, only relatively inexpensive local upgrades to transmission capacity were required, since there was adequate bulk system capacity for exporting wind power to the rest of Texas because the existing bulk system, built for importing power, had significant capacity. With the growth of wind, the dominant flows on the bulk system changed from being East-to-West to being West-to-East whenever there was significant wind production. The existing bulk system capacity allowed for the growth of the initial 7 GW or so of wind capacity in West Texas without significant expansion of the bulk system. TheCREZtransmissioncanbeviewedasallowingfor an additional 11 GW of wind. That is, initial “remote” West Texas wind production required comparatively little expenditure for transmission, but subsequent wind development has necessitated much more significant upgrades of the transmission system. The upgrades required for initial wind were only somewhat more than the minimal upgrades required for a brownfield repowering development.
The fifth issue, which is related to the economies of scale and scale, means that any given transmission line upgrade might be associated with or necessitated by a collection of generation upgrades. Moreover, the timing of the generation and transmission expansion may make it difficult to specifically associate transmission upgrades with particular generation upgrades. Over extended intervals of time, however, we expect generation expansion to be correlated with transmission expansion, so that averaging transmission expenditures over time and associating them with generation expansion over time may provide a reasonable estimate of average costs. Naturally, such average will obscure idiosyncratic issues related to particular developments.
To summarize, the actual costs of transmission per unit length of transmission needed to allow for incremental generation to be delivered to load are highly variable, depending on particulars that are not known or knowable in

The Full Cost of Electricity (FCe-) Estimation of Transmission Costs for New Generation, January 2017 | 9
the context of a nationwide (or even a statewide) assessment. Taken together, these issues mean that estimation of transmission costs will inevitably be a compromise, and should be viewed as representing averages over uncertain particulars.
Overall transmission costs are, however, relatively small on average compared to overall generation costs. Consequently, relatively large uncertainties in transmission costs translate to relatively smaller uncertainties in overall costs of generation. A main exception to this situation is new transmission needed for remote renewables, where transmission costs may be a significant fraction of generation costs. However, even if information about detailed routing of lines were available, this would in most cases only marginally reduce the overall uncertainties in generation plus transmission costs.
For the initial assessment in this paper, averages have been developed for the Electric Reliability Council of Texas (ERCOT) grid, recognizing that the numbers could be refined to be state-specific. The upgrades have been differentiated, in a broad brush fashion, into the following categories:
• Brownfieldgeneration(alsorelevantfor distributed renewable),
• Greenfieldthermalgeneration(alsorelevantfor close-to-load center renewable),
• Remoterenewable.
Transmission costs allocation
The general discussion about transmission cost causation should be carefully distinguished from cost allocation. Cost causation means the overall cost incurred by the development of a new generation project, whereas cost allocation means the identification of who pays for what. To illustrate the significance of this issue, note that in the Eastern Interconnection, at least some of the bulk transmission is directly paid by generators, which we might refer to as “deep” transmission cost allocation. In contrast, in the case of ERCOT, which is illustrated in Figure 5 the generator only pays for the spur and POI, while bulk transmission is paid directly by end-use customers as an adder to retail bills (NREL, 2011). It is important to keep in mind that regardless of the transmission allocation policy in place, and recognizing the usual case that all sectors of the industry break even or make a profit, the demand ultimately pays for all costs either directly or indirectly. The
FIGURE 5
Illustration of transmission cost allocation in ERCOT for a new generation project.

The Full Cost of Electricity (FCe-) Estimation of Transmission Costs for New Generation, January 2017 | 10
indirect case is where the transmission costs are allocated to the generator, but these costs will nevertheless ultimately be transferred through power purchase agreements (PPAs) or other mechanisms to charges to end-use customers.
In the case of ERCOT, the “postage-stamp” method is used (PUCT Substantive Rule 25.192). It requires that regardless of the location of the generator and demand in the system, the end-users have to cover the annual expenses of the transmission service providers based on the power consumption of demand at a time coincident with the overall peak demand periods of the system. In this context, the charges are equivalent to US first class postage, which is priced independent of the address of the sender and the recipient. (Unlike first class postage, however, it is the “recipient,” or end-use demand that pays for the transmission system in ERCOT.)
Figure 6 presents the historical annual transmission charges in ERCOT per kW of coincident peak demand. There is a significant jump in 2014 due tothedevelopmentoftheCREZproject.Itisimportant to distinguish between transmission charges and transmission investment costs. The transmission charges reflect annual payments to transmission investors as determined by concepts of return on investment and to cover maintenance costs, which are different from the total capital expenditures for the transmission. The capital expenditures together with statutory rates of return and “depreciation” schedules, along with annual maintenance costs, do however implicitly determine the overall transmission charges. In the case of
ERCOT, these charges are then allocated to end-users based on their coincident demand, whereas in other jurisdictions there are other allocation methods, including “deep” transmission cost allocation to generation developers.
General considerations for the development of transmission for new generation
The development of new transmission for new generation requires consideration of different aspects that affect the profitability of projects. The aspects that will be discussed here are the connection feasibility, dispatch considerations, reliability, and losses.
TECHNICAL FEASIBILITY OF THE CONNECTION
A transmission solution must foremost provide for technical feasibility to inject the nominal capacity of the generation project into the bulk system. It is important to notice that this does not mean that the power plant will be always committed and dispatched at full load. The actual dispatch will depend on the operation cost and its availability, which is a particular issue for renewable resources.
DISPATCH CONDITION OF THE CONNECTION
As mentioned above, the feasibility to inject does not guarantee dispatch conditions. Thus, the appropriate amount of investment in transmission should consider dispatch as well. This can be illustrated with Figure 7, where there is an existing generator G1, a demand D, and a prospective new generator NG. Without considering the candidate line indicated, it is feasible for the generator NG to generate because if generator G1 has zero production, there will not be any limitation in the existing line to transfer 100 MW. (There are two parallel lines of equal capacity 100MVA in the existing system, and standard “security” requirements would limit the flow on these lines to the capacity if one line were to fail, namely 100 MW.) However, the
0 10 20 30 40 50
2004 2006 2008 2010 2012 2014
Ann
ual t
rans
mis
sion
cha
rge
[US
D/k
W]
Year
ERCOT 4CP postage stamp charge
FIGURE 6
Historical ERCOT postage-stamp charge, dollars per kW of
coincident peak demand (source: PUCT).

The Full Cost of Electricity (FCe-) Estimation of Transmission Costs for New Generation, January 2017 | 11
situation is different if the economic dispatch of the generators is considered. Evidently, the energy price of both generators is lower than the rest of the system, therefore in the absence of transmission limitations, both generators would be dispatched to generate as much as possible. However, due to the transmission limitation, only the cheapest one, in this case G1, can be dispatched unless the transmission capability is expanded.
Another related issue is curtailment of renewable generation. Given that development of bulk transmission is slower than the development of renewable generation such as wind farms, it is very likely that several renewable generation projects can be competing for the use of the same transmission, which may produce curtailments in generators with similar operation costs. This situation can be avoided by developing more transmission.
RELIABILITY OF THE CONNECTION
Sudden tripping of transmission lines is a common occurrence due to lightning, as well as being due physical contact of the transmission conductor with trees or vegetation. In some cases, the line
has been permanently damaged by the event and will be out of service until repaired. However, in most cases, there is no permanent damage, and the line can be (and typically is automatically) reconnected. The impact of short-term and long-term outages on the operation of power plants depends on the type of generation technology. For example, in the case of a wind farm connected to the bulk system through a single circuit spur line, after the trip of the line it may be possible to reconnect the wind power plant without much special impact on it. However, in the case of a thermal generator (e.g. coal fired, CCGT, etc.) there are fuel and maintenance costs associated with the re-synchronizing of the power plant. Therefore, standard North American practice will be to provide redundancy in the spur transmission and reliable capability in the bulk system to avoid the possibility that a transmission outage will result in a generator being tripped (or load being interrupted).
LOSSES IN THE CONNECTION
The layout of wind turbines in a wind farm is carefully optimized in order to maximize the capacity factor of the plant. Under the same rationale, the losses produced in the spur line need to be considered with the same emphasis as well. In most current cases, inland renewable has been developed with relatively short spur lines so that losses are relatively small. However, the lack of close bulk transmission for new renewable development and the advent of new off-shore wind farms can push towards longer spur line length, under which losses need to be considered more carefully.
Summary
There are a number of issues affecting the costs of the three main parts of the transmission system, depending on the generation type and distance between generation and load, among other things. In the next sections, estimation of the costs of these three parts is discussed.
New generator
Candidate line
DtNG
(2x100MVA)(1x100MVA)
G1
10 $/MWhP_max =110 MW
20 $/MWhP_max = 110 MW
10 MW
Grid LMP = 50 $/MWh
FIGURE 7
Illustration of the impact of transmission
investments on generation dispatch conditions.

The Full Cost of Electricity (FCe-) Estimation of Transmission Costs for New Generation, January 2017 | 12
3 | SPUR TRANSMISSION COSTS
The cost of spur transmission is generally a very small fraction of overall power plant capital expenditure (less than 5%). This cost depends on the type of generation involved, characteristics of the terrain and land used, and the voltage of the connection.
Estimation methodology description
The proposed approach is to use an estimation of the length of the spur line between the project location and the existing (or planned) bulk system. With this distance and a uniform cost per unit length, an approximation to the cost of this line per unit of installed power can be obtained. The voltage of the line is chosen according to the installed power of the prospective power plant.
CONSIDERATIONS FOR BROWNFIELD PROJECTS
This component of the cost is neglected for these project types because it is assumed that there is an available spur line than can be re-used.
GENERATION TECHNOLOGY IMPACT
The number of circuits built for the spur line depends on the generation technology. For the case of wind and solar farms, only one circuit is typically considered. For most other types of generators, two lines will be constructed. This consideration is represented as the reliability multiplicative factor that depends on generation technology as shown in Table 1. As a general observation, however, these two lines will be in the form of a double-circuit line, and it should be noted that a double-circuit line is less expensive than two single-circuit lines. This observation is confirmed by the data presented in Table 2, which presents single and double circuits costs for different voltage levels obtained from (Western Electricity Coordinating Council, 2014).
From the cost ratio calculated, it can be observed that regardless of the voltage levels considered, a double circuit line is 25 % cheaper than two single-circuit lines. In this work it is assumed that this ratio is constant for all voltage levels.
UNIFORM LINE COST DENSITY
It is assumed that the cost per unit length of the spur line is uniform over its length. This assumption greatly simplifies the calculations. However, this may be not accurate enough under highly spatially constrained areas (e.g. where the line impacts natural reserves, wetlands, etc.). Nevertheless, the typical short length of the spur line implies that the approximation will typically be reasonable and, in any case, inaccuracies in this estimate will not contribute significantly to overall estimation inaccuracies because the spur line is relatively small compared to generation costs.
LINE ROUTE LENGTH CONSIDERATION
The spur line route is assumed to be the minimum cost path between the generation location and the bulk system. A difficult issue is to identify the connection point between the spur line and the bulk system. The selection depends on the combined costs of the spur line, the location and characteristics of potential POIs, and the desired dispatch level of the power plant. A simplification is to only consider the distance of the project to the set of lines that has a voltage compatible with the amount of installed power desired to be injected, and ignore the detailed location of the actual POI substation.
CONSIDERATION OF THE LOSSES IN THE SELECTION OF THE CONDUCTOR
The impact of the losses in the spur line are not considered in this approach.

The Full Cost of Electricity (FCe-) Estimation of Transmission Costs for New Generation, January 2017 | 13
CONSIDERATION OF TERRAIN FEATURES
A significant factor that affects the cost of the spur line is the characteristics of the terrain in which it is placed. In order to provide adjustments for these situations, it is proposed to incorporate the “terrain multiplier” factors used by the Western Electricity Coordinating
Council (Western Electricity Coordinating Council, 2014), which are presented in Table 4.
Estimation methodology results
Based on the transmission investments data from the Report of Existing and Potential Electric System Constraints and Need (ERCOT, 2006),
TABLE 1
Reliability multiplier for spur transmission.
Technology Reliability multiplier
Hydro 1.6
Gas-CT 1.6
Gas-CC 1.6
Coal 1.6
Coal-IGCC 1.6
Nuclear 1.6
Geothermal 1.6
Biomass 1.6
Co-Fire 1.6
Wind 1
Central PV 1
CSP 1.6
Pumped hydro 1.6
TABLE 2
Cost ratio between double to single circuit lines for WECC (Western Electricity Coordinating Council, 2014).
Voltage [kV] Single-circuit cost [USD/mile] Double-circuit cost [USD/mile] Double over single circuit cost ratio
230 959,700 1,536,400 1.6009
345 1,343,800 2,150,300 1.6002
500 1,919,450 3,071,750 1.6003
1 By “circuit-miles” of a transmission line is understood the product of its number of circuits, and the length of the line. The transmission line data used ERCOT was expressed in those terms.

The Full Cost of Electricity (FCe-) Estimation of Transmission Costs for New Generation, January 2017 | 14
(ERCOT, 2010), the data of Table 3 were obtained. The capacity of the lines by voltage level is shown in the table. As mentioned above, technologies associated with a reliability multiplier of 1.6 will
require 1.6 times more than the single-circuit investment shown in this figure, assuming that double-circuit line construction is used.
TABLE 4
Terrain multipliers for spur line (Western
Electricity Coordinating Council, 2014).
Terrain Terrain Multiplier
Desert 1.05
Scrub/Flat 1.00
Farmland 1.00
Forested 2.25
Rolling Hill (2-8% slope) 1.40
Mountain (>8% slope) 1.75
Wetland 1.20
Suburban 1.27
Urban 1.59
TABLE 3
Spur line costs obtained for ERCOT.
Voltage [kV] Capacity [MW] Cost
[MMUSD/circuit-miles]1
Cost
[USD/circuit-miles*kW]
Single circuit cost
[USD/miles*kW]2
345 1,500 1.114 0.74 0.93
138 230 0.823 3.57 4.5
69 110 0.847 7.71 9.6
2 It is assumed that most of the lines in ERCOT at 345, 138, and 69 kV are double circuit. Therefore, in order to obtain the single circuit cost of a line, first it was obtained the cost for double circuit lines, and then they were converted to single circuit cost by reducing them in 38%. The double circuit cost was obtained by multiplying the cost in [MMUSD/circuit-mile*kW] by 2.

The Full Cost of Electricity (FCe-) Estimation of Transmission Costs for New Generation, January 2017 | 15
4 | POINT OF INTERCONNECTION COSTS (POI)
Point of Interconnection (POI) costs are mainly associated with changes required in the substation to accommodate the new generation at a required reliability level.
Estimation methodology description
The approach is to re-use the methodology used by the model ReEDS developed by NREL to represent this cost (NREL, 2011), which consists in the use of a technology differentiated integration costs.
CONSIDERATIONS FOR BROWNFIELD PROJECTS
As with spur line costs, this component of the cost for these project type is neglected because it is
assumed that the substations were designed with enough capacity for the new project beforehand. In some cases this cost could be avoided or reduced even for greenfield projects if the existing substation had sufficient capability. For example, very often substations are designed with free bays for future use, which can be used for this case.
ESTIMATION METHODOLOGY RESULTS
Table 5 presents the integration costs used by NREL(NREL, 2011). No further explanation about the origin of these data was provided in the reference. These numbers have not been validated for the ERCOT case.
TABLE 5
Grid Connection Costs for Generating Technologies.
Technology Grid connection cost [USD/kW]
Hydro 227
Gas-CT 114
Gas-CC 114
Coal 227
Coal-IGCC 227
OGS 114
Nuclear 227
Geothermal 227
Biomass 114
Co-Fire 227
Wind 114
Central PV 114
CSP 114
Pumped hydro 227

The Full Cost of Electricity (FCe-) Estimation of Transmission Costs for New Generation, January 2017 | 16
4 | BULK SYSTEM TRANSMISSION COST
This cost component represents upgrades in lines, towers, substations, reactive compensation, etc., as well as new infrastructure. This cost varies case by case, and its assessment requires a significant amount of specifications and information in order to obtain an accurate assessment (location and parameters of grid facilities, capacity of existing substations, availability and reliability of transmission service). This situation is illustrated in Figure 9, where the blue line represents the existing bulk transmission, and the letters A-D prospective new generation sites. The sites A and B have available renewable resources, however they are significantly distant from the bulk system, therefore the bulk system transmission upgrade cost is high. This situation is like the one present in El Paso in Texas. In the project site C there is also resource, and a limited amount of existing bulk transmission. Therefore the additional bulk transmission investments are lower than for the sites A and B, and perhaps minimal for small amounts of new generation capacity, but would be high for large amounts of new generation capacity added there.
This situation is similar to the one present in West Texas before the development of Competitive RenewableEnergyZone(CREZ)transmission.Finally, given the closeness of the project site D to the bulk system, the bulk transmission costs are low in comparison to the other cases.
Estimation methodology description
Given the dependence of transmission costs on detailed aspects of particular generation projects, we propose to assess this cost component as an average value for each technology type and general location, based on historical data. The easiest case is to estimate this cost for new greenfield wind projectsinWestTexas,usingactualhistoricalCREZtransmission costs and the expected additional installed wind power capacity accommodated by CREZtransmissiontoobtainthetransmissioninvestment per MW installed. For other than West Texas, most of the recent generation expansions have been CCGTs. For transmission other than
Low Cost
Med Cost
High Cost
A
B
C
D
FIGURE 8
Illustration of the factors involved in
the cost in the bulk transmission

The Full Cost of Electricity (FCe-) Estimation of Transmission Costs for New Generation, January 2017 | 17
CREZ,theapproachistoregressthegenerationexpansion with the transmission expansion.
The transmission cost data used was obtained from several ERCOT studies about transmission limitations (ERCOT, 2006), (ERCOT, 2010). The information about the installed generation was obtained from an ERCOT Capacity, Demand and Reserves (CDR) report (ERCOT, 2015).
CONSEQUENCES OF THE USE OF HISTOR-ICAL DATA
The use of historical cost data to estimate this cost component implies that the methodology cannot provide valid insights for situations that have not happened in the past or for which there are limited statistics. In the case of ERCOT, examples of this situation include the development of wind generation in the coastal area, and the development of utility scale solar PV in West Texas.
DIFFICULTY IN FULLY EXPLAINING BULK TRANSMISSION INVESTMENTS BY NEW GENERATION ADDITIONS
Most of the current transmission expansions currently in place in ERCOT are not only for new generation, but also for reliability issues associated with demand growth that is not necessarily associated with specific new generation development. Therefore for current conditions, cost estimation is an upper bound on what is required for new greenfield generation, all else being equal.
IMPACT OF REAL COSTS FOR NEW TRANSMISSION
On the other hand, given the increasing real costs of construction for new transmission, the cost estimate obtained could be optimistic for future construction given the use of historical data. The development of new transmission tends to be more expensive over time due to the decrease in availability of land compatible with use for transmission.
CONSIDERATIONS FOR BROWNFIELD PROJECTS
The bulk transmission component of the cost is neglected for these project types because it is assumed that in a repowering project the bulk transmission was designed for a project with similar installed power and does not need to be upgraded.
ESTIMATION METHODOLOGY RESULTS
Investment costs for transmission were obtained from ERCOT reports, which provide transmission costs categorized by the in-service date for the years from 2004 to 2015 at different voltage levels, which are presented in Figure 9. These investments include both new transmission infrastructure as well as network upgrades. It can be observed in the figure that there was an abrupt increase in the investments in 345 kV lines in 2013. The reason forthisisthedevelopmentofCREZtransmissionproject, which took place from 2009 to 2014 as
Figure 10. Investments in transmission in ERCOT by in-service date.
Figure 11. CREZ: Number of Projects in Construction by Month.
Another issue that has to been mentioned about the transmission cost data used is the characteristics of
the reports from which it was obtained. These reports presented a forecast for the transmission
0500
100015002000250030003500400045005000
2004 2006 2008 2010 2012 2014
Tran
smiss
ion
inve
stm
ent [
MM
USD]
Year
Investments in transmission in ERCOT byin-service date
345 kV
138 kV
69 kV
FIGURE 9
Investments in transmission in ERCOT by in-service date.

The Full Cost of Electricity (FCe-) Estimation of Transmission Costs for New Generation, January 2017 | 18
presented in Figure 10. It is because of this abrupt development of transmission in anticipation of new wind generation that a special consideration for 345 kV lines cost data was made, which is toonlyconsidertheinvestmentsbeforeCREZfor regression purposes, under the assumption thatthebulkof2013costsareduetoCREZ.
Another issue that has to been mentioned about the transmission cost data used is the characteristics of the reports from which it was obtained. These
reports presented a forecast for the transmission investments. Therefore, the numbers presented may be different from the real costs incurred. In order to detect outliers for the data costs, the accumulated annual transmission investments were compared with the ERCOT annual “transmission cost of service” (TCOS) provided by PUCT and illustrated in Figure 11. The TCOS is the annual payment that considers a return on and of “rate-based” investment together with maintenance cost. The return “of ” investment
FIGURE 10
Number of Projects in Construction by Month.
FIGURE 11
Comparison between accumulated transmission investments and ERCOT TCOS.
Figure 10. Investments in transmission in ERCOT by in-service date.
Figure 11. CREZ: Number of Projects in Construction by Month.
Another issue that has to been mentioned about the transmission cost data used is the characteristics of
the reports from which it was obtained. These reports presented a forecast for the transmission
0500
100015002000250030003500400045005000
2004 2006 2008 2010 2012 2014
Tran
smiss
ion
inve
stm
ent [
MM
USD]
Year
Investments in transmission in ERCOT byin-service date
345 kV
138 kV
69 kV
-‐
2,000
4,000
6,000
8,000
10,000
12,000
14,000
-‐ 500 1,000 1,500 2,000 2,500 3,000
ERCO
T Accum
ulated
tran
smission
inve
stmen
ts by on
date op
eraC
on
[MMUSD
(staring
from
200
4)
ERCOT TCOS [MMUSD]
Total transmission investments by on operaCon date vs TCOS

The Full Cost of Electricity (FCe-) Estimation of Transmission Costs for New Generation, January 2017 | 19
is often described as “depreciation;” however, given that transmission lines are durable capital it is more properly thought of as amortizing the capital cost of the investment. As discussed above, the TCOS is distinct from but related to the total transmission investment. Assuming that the entering of new transmission into the rate-base is more significant than the leaving of already “depreciated” infrastructure, a linear relationship between TCOS and total investment costs is reasonable. In the figure it can be appreciated that, with the exception of the two outliers at the right hand side of the picture (which correspond to the
periodofdevelopmentofCREZ),therelationshipbetween transmission investment costs and TCOS is approximately linear. Therefore, the use of the forecasted transmission investments is considered a reasonable representation of the real transmission costs incurred. The possible errors introduced by using this data can be avoided by a detailed aggregation of the real transmission investments performed in ERCOT utilizing information available from FERC Form 1 (For further information about FERC Form 1, see Full Cost of Electricity White Paper (Fares & Carey, 2016))
-‐ 10,000 20,000 30,000 40,000 50,000 60,000 70,000 80,000 90,000
2001 2003 2005 2007 2009 2011 2013
Installed power [GW]
Year
Annual installed power in ERCOT by technology
Total installed power Non Coastal Wind Coastal Wind
Thermal Hydro Solar
-‐
10,000
20,000
30,000
40,000
50,000
60,000
70,000
80,000
90,000
2001 2003 2005 2007 2009 2011 2013
Installed power [G
W]
Year
Annual installed power in ERCOT by locaJon
Total installed power COASTAL HOUSTON
NORTH PANHANDLE SOUTH
WEST
FIGURE 12
ERCOT installed power by different technologies.
FIGURE 13
ERCOT installed power by location.

The Full Cost of Electricity (FCe-) Estimation of Transmission Costs for New Generation, January 2017 | 20
In order to obtain the changes in transmission investments at different voltage levels, regressions between the annual installed power and accumulated annual transmission investment were performed. The annual installed power by technology, obtained from ERCOT CDR 2015 is presented in Figure 12. Most of the new generation is thermal (i.e. CCGT, gas, Biomass, coal, etc.), while the second most significant generation growth is in non-coastal wind (i.e. West Texas wind). Regarding the location of the power plants, in Figure 13 it can be observed that most of the generation is located in the North, followed by the South and West. The definition of the locations considered by ERCOT is presented in Figure 14.
The results of the regressions for 345 kV, 138 kV, and 69 kV are presented in Figure 15, Figure 16, and Figure 17 respectively. For 345 kV the data between 2009 and 2014 was discarded, but not for the other voltages. This is because at that time period, the transmission was developed significantly in advance of the generation, which affected the regressions performed. The data suggests that CREZdidnothaveasignificantimpactontheexpenditures for lower voltage lines. The results of these regressions are summarized in Table 6.
Using the information of the technology type and the location of the installed generation, regressions in terms of the generation were
Figure 15. ERCOT zones.
Figure 16. Regression performed to obtain 345 kV contribution to the transmission bulk cost incurred by new installed power.
y = 78.423x - 4520R² = 0.8356
0
200
400
600
800
1000
55 57 59 61 63 65 67 69Accu
mul
ated
tran
s. in
. 345
kV
[MM
USD]
Installed capacity [GW]
ERCOT accumulated trans. inv. 345 kV(since 2004) vs installed capacity
(Without CREZ dev. period)
FIGURE 14
ERCOT zones.
FIGURE 15
Regression performed to obtain 345 kV contribution to the transmission bulk cost incurred by new installed power.

The Full Cost of Electricity (FCe-) Estimation of Transmission Costs for New Generation, January 2017 | 21
performed, which are summarized in Table 7 and Table 8. In most of the cases, particularly at lower voltages, the dependence of cost at a particular voltage level was not statistically different from zero. Furthermore, since 345 kV datapointsbuiltduringCREZdevelopment
were discarded, some regressions could not be performed because there were not enough data points.builtduringCREZdevelopmentwerediscarded, some regressions could not be performed because there were not enough data points.
Figure 17. Regression performed to obtain 138 kV contribution to the transmission bulk cost incurred by new installed power.
Figure 18. Regression performed to obtain 69 kV contribution to the transmission bulk cost incurred by new installed power.
y = 166.46x - 9235.7R² = 0.9741
0500
100015002000250030003500400045005000
55 60 65 70 75 80 85Accu
mul
ated
tran
s. in
. 138
kV
[MM
USD]
Installed capacity[GW]
ERCOT accumulated trans. inv. 138 kV(since 2004) vs installed capacity
y = 49.144x - 2915.5R² = 0.9861
0
200
400
600
800
1000
1200
1400
55 60 65 70 75 80 85Accu
mul
ated
tran
s. in
. 69
kV [M
MUS
D]
Installed capacity[GW]
ERCOT accumulated trans. inv. 69 kV(since 2004) vs Summer gen. capacity
FIGURE 16
Regression performed to obtain 138 kV contribution to the transmission bulk cost incurred by new installed power.
FIGURE 17
Regression performed to obtain 69 kV contribution to the transmission bulk cost incurred by new installed power.

The Full Cost of Electricity (FCe-) Estimation of Transmission Costs for New Generation, January 2017 | 22
TABLE 6
Summary of estimations of bulk transmission for ERCOT by total installed power.
New generation project category Total transmission investments [MMUSD/kW Installed]
345 kV 138 kV 69 kV
CREZ-like project 600 (1) 0 0
Brownfield project 0 0 0
Conventional greenfield projects 78 166 49
(1) The total CREZ cost was 6,900 MMUSD. Before the development of CREZ, there were 6,903 MW of wind installed power. The development of CREZ allowed a total installed wind power in West Texas of 18,456 MW. Therefore the 6,900 MMUSD allowed the development of additional 11,553 MW of wind, which implies a transmission investment cost of 597 USD/kW (Madrigal & Stoft, 2012).
TABLE 7
Summary of estimations for greenfield new generation additional bulk transmission in ERCOT by technology.
New generation technology Total transmission investments [MMUSD/kW Installed]
345 kV 138 kV 69 kV
Non-coastal wind ? 227 47
Coastal wind - - -
Thermal ? 148 59
Hydro - - -
Solar - - -
(-): No statistically significant difference from zero.
(?): Not enough data to make a conclusion.
TABLE 8
Summary of estimations for new generation additional bulk transmission in ERCOT by location.
New generation location area Total transmission investments [MMUSD/kW Installed]
345 kV 138 kV 69 kV
Coastal ? - -
Houston ? - -
North ? 312 65
Panhandle ? - -
South ? - -
West ? 241 88
(-): No statistically significant difference from zero.
(?): Not enough data to make a conclusion.

The Full Cost of Electricity (FCe-) Estimation of Transmission Costs for New Generation, January 2017 | 23
6 | INCORPORATION OF ADDITIONAL TRANSMISSION COSTS INTO CAPACITY EXPANSION MODELS
Historically, commercial generation expansion forecast models have neglected the cost of the additional transmission required. Under a scenario of new generation located nearby to load centers, and without complicated development of new transmission (low permitting time, abundance of available land to place it, etc.) that assumption is reasonable. However, this situation has changed, making transmission costs for new generation a significant investment in many cases, particularly for new utility scale remote renewable generation.
Considering the current significance of transmission investments, and noting that there are different policies regarding transmission cost allocation, the pattern of generation development may be affected by the considerations of bulk transmission investments and its allocation. This is because the generator developer profitability is affected by the share of transmission paid directly by the developer and this will affect the pattern of generation development. Generally
speaking, with all else equal, socialization of transmission costs, as in ERCOT, can be expected to result in generation projects that require more transmission expenditure than would be needed for generation projects in the case where generation developers pay directly for transmission costs.
In order to use existing capacity expansion models (e.g. PLEXOS, screening curve, AURORAXmp, etc.), but nevertheless consider the bulk transmission, the data used in those models should be adjusted to reflect what is seen by developers in their decision making process. This is illustrated in Figure 18, where an adjusted generator cost is used that considers allocated transmission costs. It is assumed that estimations of spur line costs, POI cost, and bulk transmission costs are available for each prospective generation project to be considered. The spur cost is multiplied for an estimation of the distance to the bulk system, the POI cost depends on the technology, and the additional bulk transmission cost depends on
FIGURE 18
Scheme for the incorporation of transmission costs into a capacity expansion model.

The Full Cost of Electricity (FCe-) Estimation of Transmission Costs for New Generation, January 2017 | 24
the technology and location of the power plant as presented in Table 6, Table 7, and Table 8.
The amount of the bulk transmission cost that is directly charged to the developer is represented by the K-factor, which is a number between 0 and 1 that represents the share of the bulk transmission cost that is paid by the developer. In the case of ERCOT, this number is very close to zero, whereas in other regions it is closer to one.
After the capacity expansion model is run with the adjusted capital expenditures that account for transmission costs allocated to the developer, the additional generation expansion is estimated. Using this expansion (i.e. the generation units to be developed, their installed power, and their time line for development), the additional bulk transmission required to be directly paid by rate-
payers is obtained by multiplying the actually built generation by the transmission cost per unit capacity and by the factor (1-K). The total cost, including all generation and transmission cost, can be used to evaluate the full cost involved in the generation expansion. It is important to clarify that since new transmission may generate other quantifiable grid level benefits (reliability, connect cheaper generation zones, etc.), there may be an additional offset to these transmission costs that should be associated with benefits to other industry stakeholders (Hogan, 2011). Regardless of the correct assessment of the grid level benefits produced by the additional bulk transmission, the methodology proposed is still valid to provide adjusted generator cost data to understand and rank competing generation investment decisions in a generation expansion tool.

The Full Cost of Electricity (FCe-) Estimation of Transmission Costs for New Generation, January 2017 | 25
7 | REPORT SUMMARY
Transmission infrastructure is a key element in the electricity supply chain. It provides multiple benefits such as reliability improvement, operational costs reduction, environmental policies fulfilment, and new generation facilities connection. The last benefit was the focus of this work. The contributions of this paper can be separated in two areas: the providing of a clarifying discussion about the relevance of transmission investments for new generation in the context of the full cost of electricity project, and the quantification of these costs. Regarding the relevance of transmission costs, it was first indicated that they can be a significant component of the overall costs associated with new generation, particularly in the case of remote renewable utility scale generation. Secondly, a functional decomposition was presented of the transmission parts involved in the interconnection of new generation projects. The parts identified were: spur line, point-of-interconnection, and bulk transmission. This decomposition is also consistent with transmission cost allocation assignation in systems like ERCOT. Finally, based on this discussion about cost
allocation it can be understood why transmission cost is not usually considered by metrics such as LCOE, but is a cost typically allocated to end-use customers (e.g. rate payers). Regarding the quantification of the transmission costs, the estimation of the spur line, and point-of-interconnection components were made by using information from the literature. For the case of bulk transmission, based on historical data, a methodology was developed to estimate these costs in for ERCOT. Using the aforementioned methodology, it was found that there is a correlation between the total annual installed generation and the total annual transmission investments at 69kV, 138kV, and 345kV. Excluding theinvestmentsperformedduringCREZproject,it was found that the generation located at the North and West of Texas are the ones that can explain the transmission investments at 138kV and 69 kV. Regarding generation technologies, it was found that thermal and non-coastal wind are the ones that drive transmission investments.

The Full Cost of Electricity (FCe-) Estimation of Transmission Costs for New Generation, January 2017 | 26
REFERENCES
Baldick, R., & Littlechild, S. (2015). Achievements and lessons of a major transmission expansion program: The Competitive Renewable Energy Zones (CREZ) project in Texas. Working paper.
ERCOT. (2006). Report of Existing and Potential Electric System Constraints and Needs 2006.
ERCOT. (2010). Report of Existing and Potential Electric System Constraints and Needs 2010.
ERCOT. (2015). Capacity, Demand and Reserves.
Fares, R. L., & Carey, C. W. (2016). Trends in Transmission, Distribution, and Administration Costs for U.S. Investor Owned Electric Utilities. Retrieved from http://energy.utexas.edu/the-full-cost-of-electricity-fce/
Hogan, W. (2011). Transmission Benefits and Cost Allocation. Cambridge, MA.
LBNL. (2009). The Cost of Transmission for Wind Energy: A Review of Transmission Planning Studies.
Madrigal, M., & Stoft, S. (2012). Transmission Expansion for Renewable Energy Scale-Up. Washington DC: The World Bank.
NERC. (2010). 2010 Long-Term Reliability Assessment. Princeton, NJ.
NREL. (2011). A Survey of Transmission Cost Allocation MEthodologies for Regional Transmission Organizations. Golden, CO: NREL.
NREL. (2011). Regional Energy Deployment System (ReEDS).
Western Electricity Coordinating Council. (2014). Capital Costs for Transmission and Substations - Updated Recommendation for WECC Transmission Expansion Planning.