Embed Size (px)
Citation preview
Estuarine, Coastal and Shelf Science 59 (2004) 625e638
Estimation of surface chlorophyll on an exposed mudflatusing digital colour-infrared (CIR) photography
R.J. Murphy), T.J. Tolhurst, M.G. Chapman, A.J. Underwood
Centre for Research on Ecological Impacts of Coastal Cities, Marine Ecology Laboratories A11,
University of Sydney, NSW 2006, Australia
Received 15 August 2003; accepted 12 November 2003
Abstract
The usefulness of field-based digital Colour-InfraRed (CIR) photography to quantify concentrations of chlorophyll on thesurface of exposed mudflats is investigated. Multiple images, each 626 mm by 467 mm, were acquired during Austral summertimeusing a Duncantech three-band CIR camera from two areas of mudflat in the upper reaches of Sydney Harbour. Sediment samples
were obtained from within the field of view of the camera and their chlorophyll concentration was estimated spectrophotometrically.After the camera images were normalised to compensate for the effects of variations in the intensity of downwelling solar radiation,chlorophyll was estimated for each 0.9 mm square pixel using a suite of five different vegetation indices. Regression analysis wasused to determine the strength of the relationship between the index values and the estimates of chlorophyll from the in situ samples.
Indices constructed from near-infrared and red bands were found to have the strongest relationships with in situ chlorophyllestimates (R2 ranging from 0.28 to 0.79) and indices derived from near-infrared and green bands the weakest (R2 ranging from 0.16to 0.22). The vegetation indices highlighted complex small-scale variability in chlorophyll distribution that was not evident in the
original camera images. These findings indicate that field-based CIR photography will provide a useful tool for the non-destructivedetermination of benthic chlorophyll.� 2003 Elsevier Ltd. All rights reserved.
Keywords: benthic chlorophyll; digital photography; remote sensing; spatial resolution; vegetation index
1. Introduction
Benthic micro-algae are essential to the functionalecology of intertidal mudflats. They are important con-tributors to primary productivity (Jassby et al., 1993;MacIntyre and Cullen, 1996; Underwood and Krom-kamp, 1999) and, in some areas, are more productivethan the phytoplankton in the water-column (Cadee andHegeman, 1974; Joint, 1978). They play an importantrole in enhancing the stability of mudflats by directlyand indirectly altering the properties of the surface,making it more resistant to erosion (Paterson, 1989;Yallop et al., 1994; Miller et al., 1996; Smith andUnderwood, 1998) and are thought to modulate
) Corresponding author.
E-mail address: [email protected] (R.J. Murphy).
0272-7714/04/$ - see front matter � 2003 Elsevier Ltd. All rights reserved
doi:10.1016/j.ecss.2003.11.006
exchange of nutrients between sediments and thewater-column (Rizzo et al., 1992). Benthic micro-algaeare known to be very variable spatially (Pinckney andSandulli, 1990; Saburova et al., 1995) and temporally(Varela and Penas, 1985; Hay et al., 1993; Kromkampet al., 1998), but there is a paucity of information aboutthe scales at which this variability occurs. Samplingstrategies that do not adequately represent the variabilityin the system are a common source of experimental error(MacIntyre et al., 1996; Kelly et al., 2001) and make the‘‘up-scaling’’ of measurements into the wider spatialcontext meaningless (Underwood and Kromkamp,1999). Because the real variability of benthic micro-algae is unknown, there is a requirement to quantify thisvariability at the smallest possible spatial scale so thatdata can be integrated into a hierarchy of larger spatialscales, as required.
.
626 R.J. Murphy et al. / Estuarine, Coastal and Shelf Science 59 (2004) 625e638
Intertidal mudflats are difficult environments tosample because they are accessible only during low tide,thus limiting the time and area over which samples canbe acquired. Benthic micro-algae are normally sampledindirectly by measuring the concentration of chlorophyllat the surfaceda time-consuming and expensive processwhich destroys the sample area, making it impossible toobserve the same area at frequent intervals. This latterpoint is an important limitation for studies which seekto quantify the temporal variation of micro-algae at thesame location, for example, over a single tidal cycle(Underwood and Kromkamp, 1999). Trampling anddisturbance of study-sites may also alter the character-istics of the sediment and its micro-algal assemblagesand this may, in turn, have an impact on any experiment.Sampling of random point-locations cannot provide thecontiguous small-scale measurements necessary to pro-vide a complete picture of chlorophyll variability overan area of mudflat.
For these reasons, remote sensing, using cameras andsensors mounted on aircraft, has been used to quantifybenthic chlorophyll by measuring the amount of ref-lected sunlight in the visible and near-infrared parts ofthe electromagnetic spectrum (Riethmuller et al., 1998;Hakvoort et al., 1998; Hagerthey et al., 2002). Theability of remote sensing to provide contiguous measure-ments of chlorophyll non-destructively over large, in-accessible and/or dangerous areas at relatively low costis potentially a huge advantage to intertidal research.The spatial resolution provided by current sensors(typically several tens of centimetres to several metres)is, however, coarser than the scale at which micro-algaeare thought to vary in benthic ecosystems (Guillaumontet al., 1997). The usefulness of airborne remote sensingis further constrained by the ability to link it accuratelywith field-based (ground-truth) observations.
New approaches to the measurement of benthicchlorophyll that provide very high resolution datawhilst minimizing the disturbance of the surfaces of softsediment are therefore required. This paper describes afield-based method to estimate chlorophyll non-destructively using digital colour-infrared photography.The approach is designed to incorporate the advantagesassociated with remote sensing (non-destructive sam-pling of relatively large areas of mudflat), but ata superior spatial resolution than that provided by insitu sampling of surface chlorophyll. To do this, a seriesof images is used, each covering an area of mudflat ofabout 626 mm by 467 mm. The size of this area waschosen to encompass the range of scales at whichbenthic micro-algae and associated macro-fauna areknown to vary.
The hypothesis underpinning this work is thatbenthic chlorophyll can be estimated by detecting andquantifying its distinctive spectral characteristics in thevisible and near-infrared using simple vegetation indices.
The efficacy of five different vegetation indices is inves-tigated by comparing them to in situ measurements ofconcentration of surface sediment. Two different mea-sures of chlorophyll are used in the analysis: chlorophyllnormalised to sample area and chlorophyll normalisedto the dry weight of the sediment in each sample. Therelationship between the spectral indices and in situchlorophyll is then used to derive estimates of chloro-phyll concentration for each 0.9 mm square pixel in eachimage.
2.Materials and methods
2.1.Data collection
Colour-infrared digital camera data, high resolutionfield spectra and in situ chlorophyll data were obtainedduring low tide from two exposed intertidal mudflats inthe upper reaches of Sydney Harbour. Each of the sec-tions of mudflat which were sampled, covered an area ofabout 1800 m2. All measurements were obtained be-tween 9:30 am and 3:30 pm in December and January(Austral summertime) in 2002/2003. The mudflats werecomposed of various admixtures of mud and sand withvarying amounts of algal cover. A visual survey of eachsite showed green filamentous algae which were distrib-uted in large (1e10 m) green patches over the mud andsand surface. Benthic diatom bio-films were not present.
2.2.Digital camera data
An MS3100 Duncantech camera was used to obtainimagery of discrete areas of mudflat at high spatialresolution. The camera has three separate CCD arraysto detect light at green, red and Near-InfraRed (NIR)wavelengths (Table 1). Image data are quantized to8 bit (0e255 data range) resolution. The camera wasfitted with a Nikkon F-mount, 15 mm F3.5 rectilinearlens and was mounted on a customized metal stand1.5 m above the surface of the mudflat. The stand waspainted with a matt black paint to prevent light beingreflected from its surface into the field of view of thecamera. The camera was configured to produce a three-band image, 696 by 519 pixels in size, covering an area
Table 1
Wavelengths of the Duncantech MS3100 camera, showing the position
of the centre wavelength of each band, and the band-width at Full
Width Half Maximum (FWHM)
Band Centre wavelength (nm) FWHM (nm)
Green 540 70
Red 665 50
Infrared 800 150
627R.J. Murphy et al. / Estuarine, Coastal and Shelf Science 59 (2004) 625e638
of ground of about 626 mm by 467 mm. The approx-imate spatial resolution of each pixel was 0.90 mm. Tocalibrate the camera data for variations in incomingsolar radiation, two spectrally flat, near-Lambertianreflectance standards (e.g. spectralon panels) withdifferent known reflectances should ideally be used.These are, however, very expensive and were not used inthis study. Downwelling irradiance measurements werealso not available. As an alternative, an 18% reflectiveKodak grey card was used as a reflectance standard.Before each image was acquired, the grey card wasplaced at ground level in one corner of the field of viewof the camera. A white reflectance standard was notused because pixels over the standard would saturateand prevent a proper calibration (Shiebe, 2001).
As far as possible, the same sunesensoretarget geo-metry was maintained for the acquisition of all theimages. The integration (exposure) time for each of thethree bands was optimised to ambient light conditionsusing camera link software tools. Care was taken toselect an integration time that provided a reasonablerange of image values whilst not saturating the valuesover the Kodak grey card. Images were recorded ontoa laptop PC in a three-band TIFF format using a PCIframeegrabber interface.
2.3. In situ chlorophyll data
To validate the accuracy of the image-derived esti-mates of chlorophyll, several in situ samples were col-lected from within each location imaged by the camerafor laboratory analysis. Cores of sediment were collectedusing a mini version of the contact core (Honeywill et al.,2002). The very small size of the core offers fine mea-surement of the small spatial scale variation in chlor-ophyll. The contact core technique freezes the uppersurface of sediment (3 mm in this case) using liquidnitrogen. An aluminium core (21 mm height, 16 mmdiameter) with a plastic collar was placed on the surfaceof the mud. Liquid nitrogen was then poured into thecores. After w30 s, the frozen core of mud was liftedfrom its position, pared level with the base of the hollowtube and then stored in liquid nitrogen. In the labo-ratory, the sediment core was weighed, lyophilised,homogenized and sub-sampled for the analysis. Thesediment water content (W%) was calculated by thefollowing equation:
W%¼ ðWtwet �WtdryÞ=Wtwet!100 ð1Þ
where Wtwet Z wet weight of sediment and Wtdry Z dryweight of the sediment.
Chlorophyll a was were measured spectrophotomet-rically using an overnight dimethyl formamide (DMF)extraction and the following equation (Porra et al.,1989) and expressed as mg cm�2 (area-normalised
values) and mg g�1 dry sediment (weight-normalisedvalues) (Eq. (2)).
Chlorophyll a mg l�1 ¼12ðA664 �A750Þ� 3:11ðA647 �A750Þ ð2Þ
where A is the wavelength.
2.4. Sampling strategy: image and in situ chlorophyll
Because images were to be calibrated to relativereflectance, it was not necessary to establish a separaterelationship between in situ chlorophyll measurementsand spectral indices derived from each image. The ap-proach used here was to take a small number of samplesfor each image and then compare all the samples takenacross all images with their collocated image valuesrepresenting each spectral index or camera band.
The objective of the sampling strategy was to obtainin situ chlorophyll samples that could be matcheddirectly with image estimates of chlorophyll. A total of16 discrete areas of mudflat were identified for imaging.Between four and nine chlorophyll sample cores werethen taken from a range of habitats from within the fieldof view of each image. Habitats were identified visuallyas variations in colour, thought to represent areas ofsmall, medium and large concentrations of chlorophyll.An image was acquired before and after each sample. Sothat the sampled areas could be identified in the images,a black paper disk with the same diameter as the samplecore was placed in the hollow from where each samplewas taken.
2.5. Field spectrometry
Few, if any, data exist on the spectral characteristicsof intertidal mudflats around Sydney. It was thereforedesirable to obtain high resolution spectral measure-ments of the mudflat surface to determine whether chlo-rophyll can be detected against the sand and dark mudsubstratum. Reflectance measurements were obtainedusing an Analytical Spectral Devices (ASD) FieldSpecPro spectroradiometer. This instrument measures reflec-ted visibleeNIR light between 350 and 1050 nm at asampling interval of 1.4 nm, giving a Full Width HalfMaximum (FWHM) spectral resolution of about 3 nm.Areas of sand and mud with varying concentrations ofsurface chlorophyll were identified visually on the basisof their surface colour and representative spectra wereobtained. To reduce noise, 20 separate spectra wereaveraged to produce a reflectance measurement for eacharea and were interpolated to 1 nm intervals usinga cubic spline interpolation function. For reflectancecalibration purposes, a reference spectrum was collectedfrom a w99% reflective spectralon panel prior to the
628 R.J. Murphy et al. / Estuarine, Coastal and Shelf Science 59 (2004) 625e638
measurement of each target spectrum. Reflectance wascalculated as the light reflected from the target dividedby the light reflected from the spectralon panel.
2.6. Selection of spectral indices
Terrestrial vegetation and benthic micro-algae exhibitdistinctive spectral features in the visible and near-infrared electromagnetic spectrum. With increasingamounts of chlorophyll, there is a progressive increasein absorption at visible wavelengths, particularly in theblue and red, coupled with an increase in reflectance inthe NIR (Zbinden, 1985; Chappelle et al., 1992;Paterson et al., 1998).
Methods to extract information on plant pigmentsfrom remotely sensed data are constrained in part bytheir spectral resolution, that is, the number and widthof spectral bands available. Studies with terrestrialvegetation and in clear, shallow-water benthic environ-ments indicate that, where reflectance data are acquiredin many narrow bands (2e10 nm in width), quantitativeinformation on individual pigments can be extractedusing optimised spectral indices, derivative spectra andthe detection of rise in the ‘red-edge’ inflection point(e.g. Horler et al., 1983; Gitelson and Merzlyak, 1994;Filella and Penuelas, 1994; Yoder and Pettigrew-Crosby, 1995; Louchard et al., 2002).
In our case, only three relatively broad spectral bandsat green, red and NIR are sensed by the digital cameraand this limits the ways in which the data can be ana-lysed. Chlorophyll abundance has been correlated withthe spectral reflectance in single bands, but this relation-ship can be masked by differences in the brightness ofthe soil or mud background (Colwell, 1974; Thomas andGausman, 1976). Over the years, many spectral indiceshave been developed to obtain information on vegeta-tion abundance by quantifying the difference in reflec-tance between visible and near-infrared bands. Spectralindices have been used with varying success to quantifychlorophyll in terrestrial and aquatic vegetation (e.g.Yoder and Waring, 1994; Penuelas et al., 1993),
intertidal microphytobenthic assemblages (Hagertheyet al., 2002; Riethmuller et al., 1998) and marinephytoplankton (e.g. Gordon et al., 1983). For terrestrialand intertidal vegetation, indices such as the RatioVegetation Index (RVI) and Normalised DifferenceVegetation Index (NDVI), which use red and near-infrared bands, are commonly used. These spectralindices are also affected to some degree by backgroundvariations in the soil substratum (Elvidge and Lyon,1984) and this has led to the development of ratios suchas the Soil Adjusted Vegetation Index (SAVI) that, atleast partially, compensate for this effect (Huete, 1988;Major et al., 1990). Other spectral indices have beenproposed, including a ratio of NIR and green bands(IRGVI; Lichtenthaler et al., 1996) and the logarithm ofthis ratio (LIRGVI; Buschmann and Nagel, 1993). Withincreasing amounts of chlorophyll, there is a progressiveincrease in the value of all these indices.
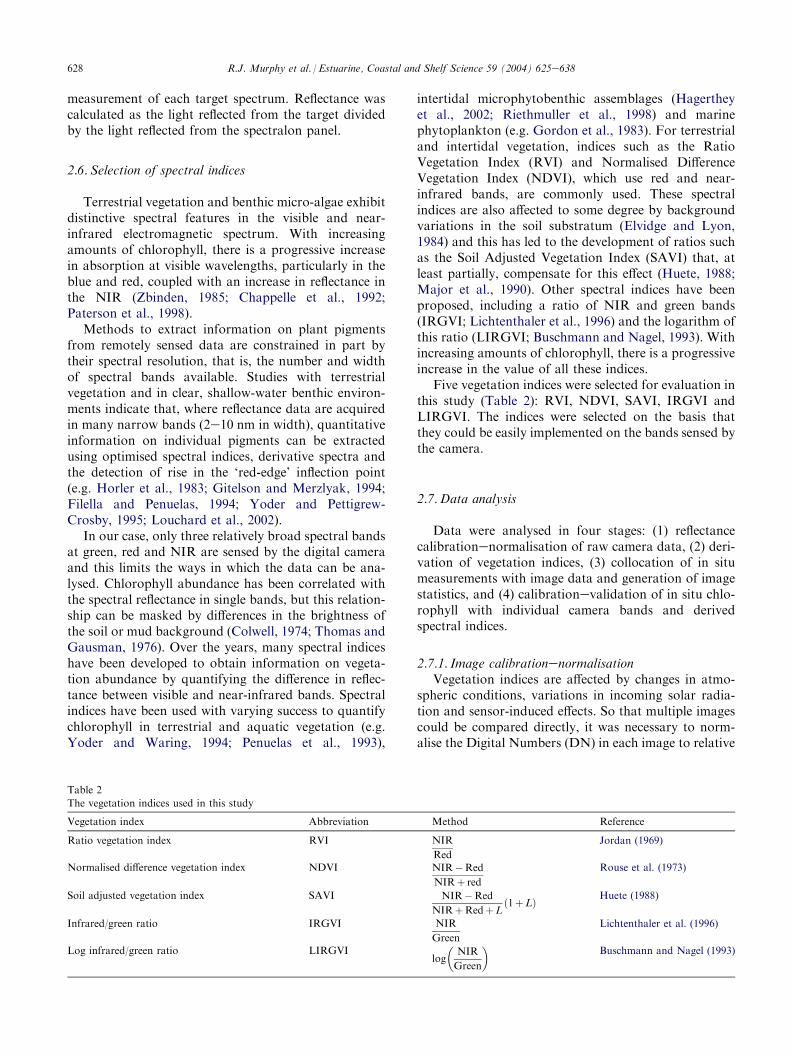
Five vegetation indices were selected for evaluation inthis study (Table 2): RVI, NDVI, SAVI, IRGVI andLIRGVI. The indices were selected on the basis thatthey could be easily implemented on the bands sensed bythe camera.
2.7.Data analysis
Data were analysed in four stages: (1) reflectancecalibrationenormalisation of raw camera data, (2) deri-vation of vegetation indices, (3) collocation of in situmeasurements with image data and generation of imagestatistics, and (4) calibrationevalidation of in situ chlo-rophyll with individual camera bands and derivedspectral indices.
2.7.1. Image calibrationenormalisationVegetation indices are affected by changes in atmo-
spheric conditions, variations in incoming solar radia-tion and sensor-induced effects. So that multiple imagescould be compared directly, it was necessary to norm-alise the Digital Numbers (DN) in each image to relative
Table 2
The vegetation indices used in this study
Vegetation index Abbreviation Method Reference
Ratio vegetation index RVI NIR
Red
Jordan (1969)
Normalised difference vegetation index NDVI NIR�Red
NIRþ red
Rouse et al. (1973)
Soil adjusted vegetation index SAVI NIR�Red
NIRþRedþLð1þLÞ Huete (1988)
Infrared/green ratio IRGVI NIR
Green
Lichtenthaler et al. (1996)
Log infrared/green ratio LIRGVIlog
NIR
Green
� �Buschmann and Nagel (1993)
629R.J. Murphy et al. / Estuarine, Coastal and Shelf Science 59 (2004) 625e638
reflectance using a flat-field calibration (Roberts et al.,1986). For each band in each image, the raw DN valuesover the Kodak grey card were extracted and averaged.The average number of image pixels used in thisoperation was 9500. The DN values in the rest of theimage were converted to relative reflectance (r) using thefollowing equation:
r¼DN ðimageÞRG
DN ðgrey cardÞ ð3Þ
where
DN (image) Z DN at each image pixel,RG Z Reflectivity of the Kodak grey card (18%),DN (grey card) Z Average DN of the image valuesextracted over the grey card.
Henceforth, reflectance calibrated data will be termed as‘reflectance’ data and uncalibrated data as ‘DN’ data.
2.7.2. Derivation of vegetation indicesEach spectral index was applied to both the DN and
reflectance image data. The SAVI compensates forvariations in brightness of the soil (in our case mud,sand, silt) by the use of an additional term, L, whichvaries according to the amount of soil within a scene. Inthis study, a value of 0.5 was selected for L as this hasbeen shown to reduce soil ‘‘noise’’ over a range ofvegetation densities (Huete, 1988). Because this indexwas developed using reflectance data, it was not appliedto uncalibrated camera data.
2.7.3. Collocation of in situ chlorophyll samplesand generation of image statistics
In order to compare in situ chlorophyll samplemeasurements with image data, it was necessary tocollocate/identify the chlorophyll samples within thecamera images. Interactive image analysis was used toidentify all chlorophyll sample locations in all imagesand a Region Of Interest (ROI) was defined for eachsample area marked in the images at the time of imageacquisition. A total of 61 samples were identified andthese were distributed over 16 different camera images.Each ROI contained an average of 650 pixels. ROIstatistics (minimum, maximum, mean, standard devia-tion) were generated from the camera data, specifically:
(1) Individual bands (green, red and NIR) from DNdata.
(2) Individual bands (green, red and NIR) from re-flectance data.
(3) Spectral indices derived from DN data.(4) Spectral indices derived from reflectance data.
2.7.4. CalibrationevalidationIn the statistical analysis presented here, all in situ
measurements of chlorophyll and collocated image
values are considered together. The relationship betweenconcentration of chlorophyll and image values is there-fore derived from all 16 images in the data set and notfor individual images. In situ measurements of chloro-phyll concentration (weight- and area-normalised val-ues) were plotted against the derived spectral indices andindividual camera bands. To determine the strength ofthe relationship between these variables, a linear re-gression analysis was applied. Further analysis of thedata, based on the results of these plots is discussed inthe following section.
3. Results
3.1. Field spectrometry
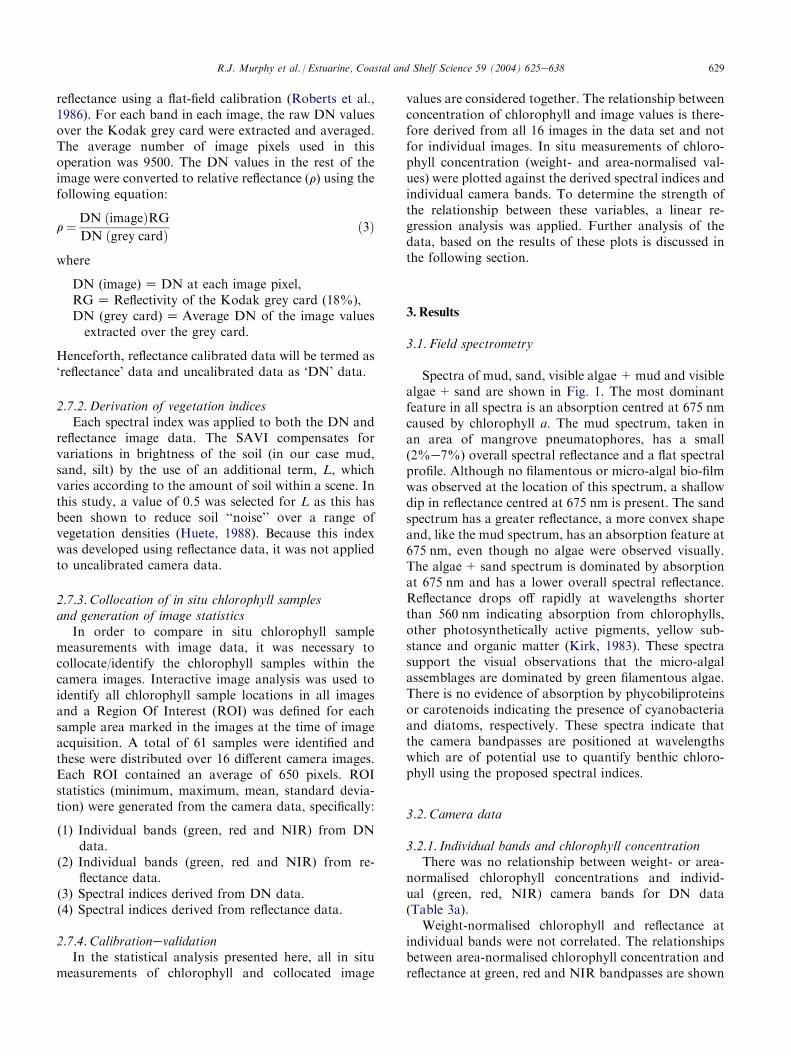
Spectra of mud, sand, visible algae+mud and visiblealgae+ sand are shown in Fig. 1. The most dominantfeature in all spectra is an absorption centred at 675 nmcaused by chlorophyll a. The mud spectrum, taken inan area of mangrove pneumatophores, has a small(2%e7%) overall spectral reflectance and a flat spectralprofile. Although no filamentous or micro-algal bio-filmwas observed at the location of this spectrum, a shallowdip in reflectance centred at 675 nm is present. The sandspectrum has a greater reflectance, a more convex shapeand, like the mud spectrum, has an absorption feature at675 nm, even though no algae were observed visually.The algae+ sand spectrum is dominated by absorptionat 675 nm and has a lower overall spectral reflectance.Reflectance drops off rapidly at wavelengths shorterthan 560 nm indicating absorption from chlorophylls,other photosynthetically active pigments, yellow sub-stance and organic matter (Kirk, 1983). These spectrasupport the visual observations that the micro-algalassemblages are dominated by green filamentous algae.There is no evidence of absorption by phycobiliproteinsor carotenoids indicating the presence of cyanobacteriaand diatoms, respectively. These spectra indicate thatthe camera bandpasses are positioned at wavelengthswhich are of potential use to quantify benthic chloro-phyll using the proposed spectral indices.
3.2. Camera data
3.2.1. Individual bands and chlorophyll concentrationThere was no relationship between weight- or area-
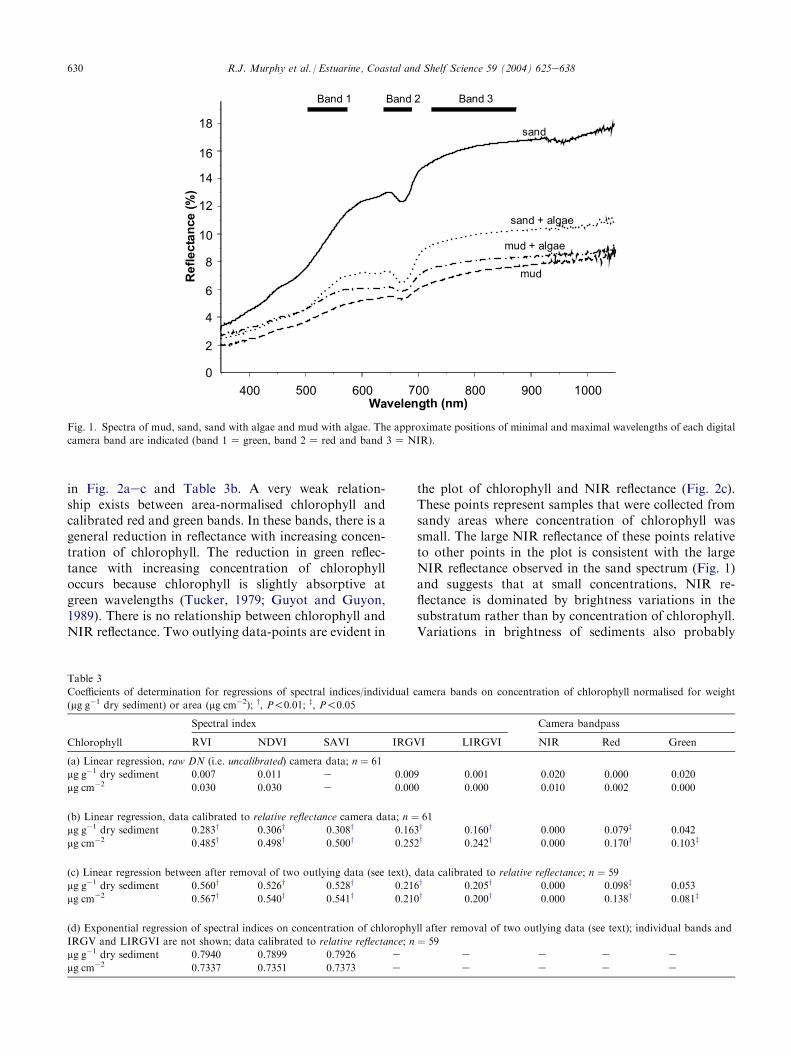
normalised chlorophyll concentrations and individ-ual (green, red, NIR) camera bands for DN data(Table 3a).
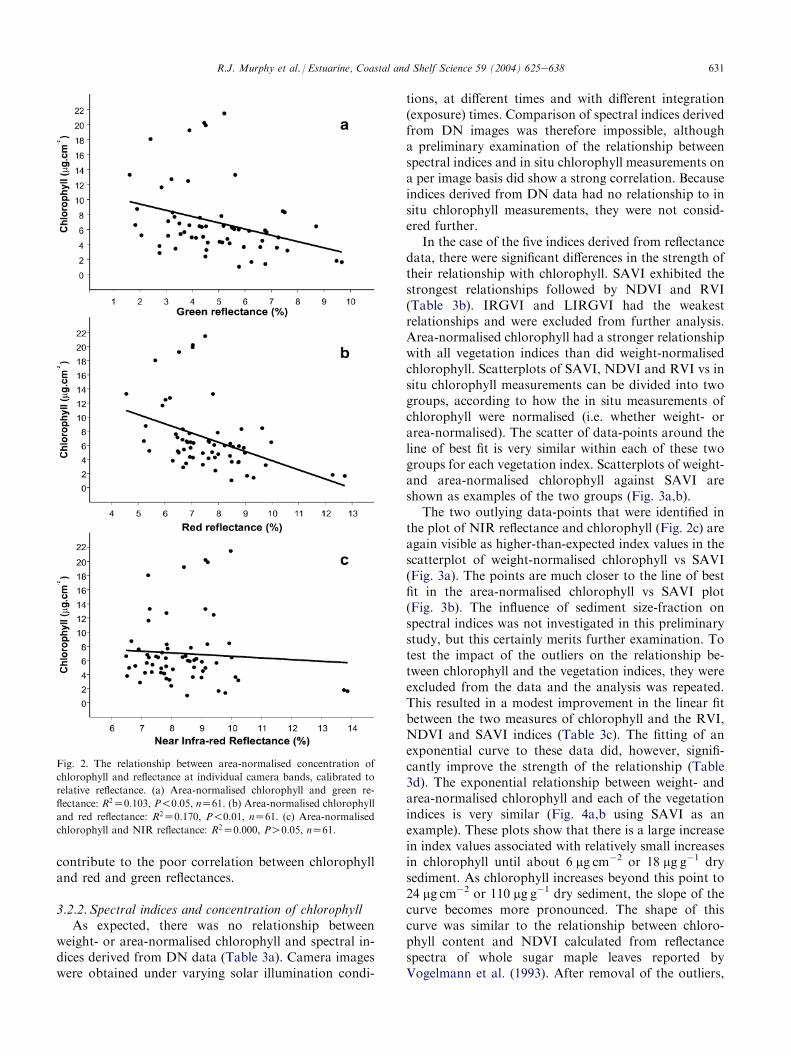
Weight-normalised chlorophyll and reflectance atindividual bands were not correlated. The relationshipsbetween area-normalised chlorophyll concentration andreflectance at green, red and NIR bandpasses are shown
630 R.J. Murphy et al. / Estuarine, Coastal and Shelf Science 59 (2004) 625e638
Fig. 1. Spectra of mud, sand, sand with algae and mud with algae. The approximate positions of minimal and maximal wavelengths of each digital
camera band are indicated (band 1Z green, band 2Z red and band 3ZNIR).
in Fig. 2aec and Table 3b. A very weak relation-ship exists between area-normalised chlorophyll andcalibrated red and green bands. In these bands, there is ageneral reduction in reflectance with increasing concen-tration of chlorophyll. The reduction in green reflec-tance with increasing concentration of chlorophylloccurs because chlorophyll is slightly absorptive atgreen wavelengths (Tucker, 1979; Guyot and Guyon,1989). There is no relationship between chlorophyll andNIR reflectance. Two outlying data-points are evident in
the plot of chlorophyll and NIR reflectance (Fig. 2c).These points represent samples that were collected fromsandy areas where concentration of chlorophyll wassmall. The large NIR reflectance of these points relativeto other points in the plot is consistent with the largeNIR reflectance observed in the sand spectrum (Fig. 1)and suggests that at small concentrations, NIR re-flectance is dominated by brightness variations in thesubstratum rather than by concentration of chlorophyll.Variations in brightness of sediments also probably
Table 3
Coefficients of determination for regressions of spectral indices/individual camera bands on concentration of chlorophyll normalised for weight
(mg g�1 dry sediment) or area (mg cm�2); y, P!0:01; z, P!0:05
Chlorophyll
Spectral index Camera bandpass
RVI NDVI SAVI IRGVI LIRGVI NIR Red Green
(a) Linear regression, raw DN (i.e. uncalibrated) camera data; n ¼ 61
mg g�1 dry sediment 0.007 0.011 e 0.009 0.001 0.020 0.000 0.020
mg cm�2 0.030 0.030 e 0.000 0.000 0.010 0.002 0.000
(b) Linear regression, data calibrated to relative reflectance camera data; n ¼ 61
mg g�1 dry sediment 0.283y 0.306y 0.308y 0.163y 0.160y 0.000 0.079z 0.042
mg cm�2 0.485y 0.498y 0.500y 0.252y 0.242y 0.000 0.170y 0.103z
(c) Linear regression between after removal of two outlying data (see text), data calibrated to relative reflectance; n ¼ 59
mg g�1 dry sediment 0.560y 0.526y 0.528y 0.216y 0.205y 0.000 0.098z 0.053
mg cm�2 0.567y 0.540y 0.541y 0.210y 0.200y 0.000 0.138y 0.081z
(d) Exponential regression of spectral indices on concentration of chlorophyll after removal of two outlying data (see text); individual bands and
IRGV and LIRGVI are not shown; data calibrated to relative reflectance; n ¼ 59
mg g�1 dry sediment 0.7940 0.7899 0.7926 e e e e e
mg cm�2 0.7337 0.7351 0.7373 e e e e e
631R.J. Murphy et al. / Estuarine, Coastal and Shelf Science 59 (2004) 625e638
contribute to the poor correlation between chlorophylland red and green reflectances.
3.2.2. Spectral indices and concentration of chlorophyllAs expected, there was no relationship between
weight- or area-normalised chlorophyll and spectral in-dices derived from DN data (Table 3a). Camera imageswere obtained under varying solar illumination condi-
Fig. 2. The relationship between area-normalised concentration of
chlorophyll and reflectance at individual camera bands, calibrated to
relative reflectance. (a) Area-normalised chlorophyll and green re-
flectance: R2Z0:103, P!0:05, nZ61. (b) Area-normalised chlorophyll
and red reflectance: R2Z0:170, P!0:01, nZ61. (c) Area-normalised
chlorophyll and NIR reflectance: R2Z0:000, PO0:05, nZ61.
tions, at different times and with different integration(exposure) times. Comparison of spectral indices derivedfrom DN images was therefore impossible, althougha preliminary examination of the relationship betweenspectral indices and in situ chlorophyll measurements ona per image basis did show a strong correlation. Becauseindices derived from DN data had no relationship to insitu chlorophyll measurements, they were not consid-ered further.
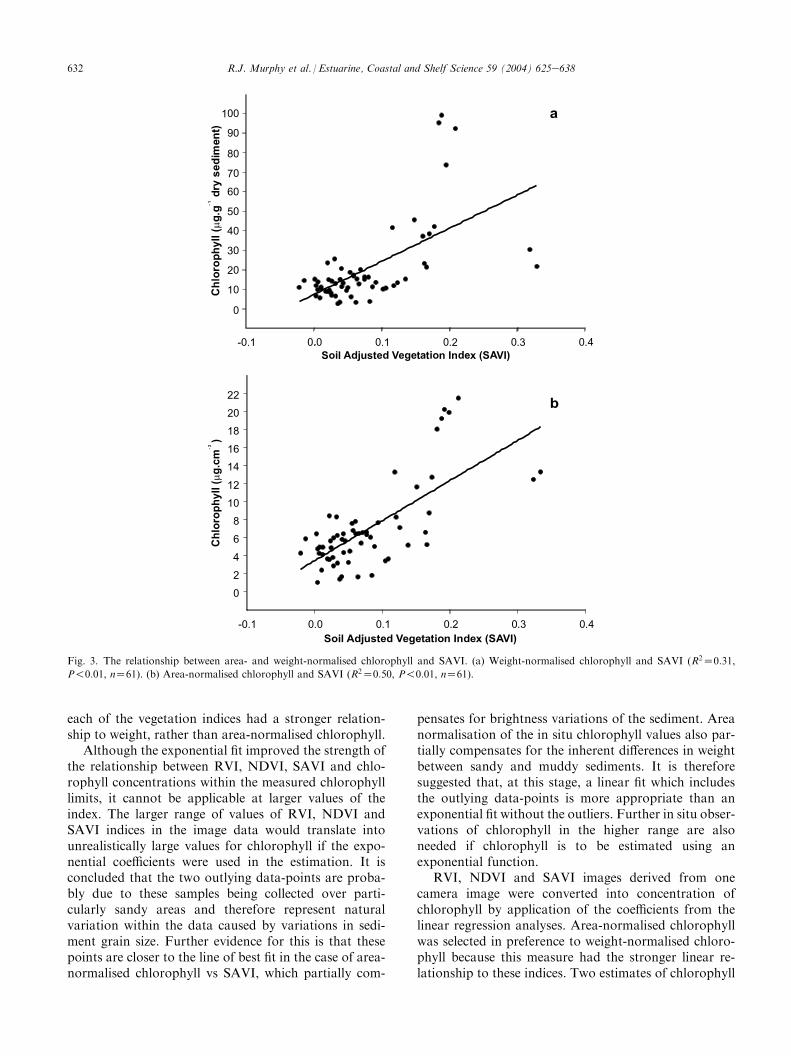
In the case of the five indices derived from reflectancedata, there were significant differences in the strength oftheir relationship with chlorophyll. SAVI exhibited thestrongest relationships followed by NDVI and RVI(Table 3b). IRGVI and LIRGVI had the weakestrelationships and were excluded from further analysis.Area-normalised chlorophyll had a stronger relationshipwith all vegetation indices than did weight-normalisedchlorophyll. Scatterplots of SAVI, NDVI and RVI vs insitu chlorophyll measurements can be divided into twogroups, according to how the in situ measurements ofchlorophyll were normalised (i.e. whether weight- orarea-normalised). The scatter of data-points around theline of best fit is very similar within each of these twogroups for each vegetation index. Scatterplots of weight-and area-normalised chlorophyll against SAVI areshown as examples of the two groups (Fig. 3a,b).
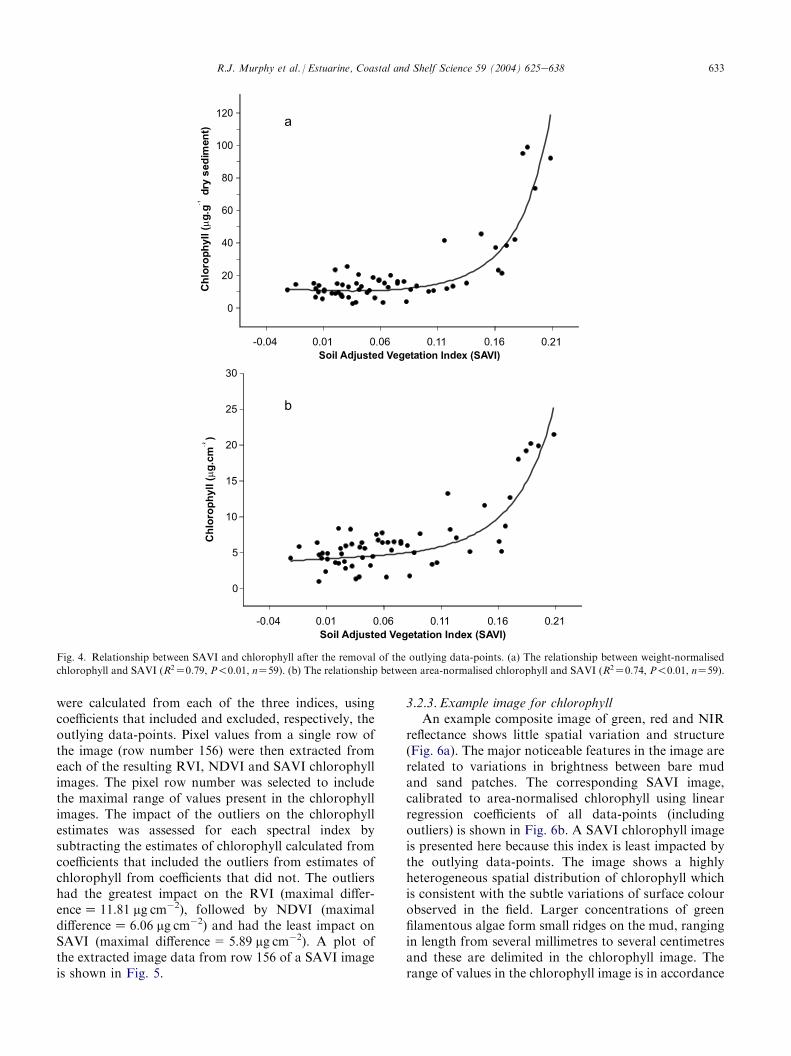
The two outlying data-points that were identified inthe plot of NIR reflectance and chlorophyll (Fig. 2c) areagain visible as higher-than-expected index values in thescatterplot of weight-normalised chlorophyll vs SAVI(Fig. 3a). The points are much closer to the line of bestfit in the area-normalised chlorophyll vs SAVI plot(Fig. 3b). The influence of sediment size-fraction onspectral indices was not investigated in this preliminarystudy, but this certainly merits further examination. Totest the impact of the outliers on the relationship be-tween chlorophyll and the vegetation indices, they wereexcluded from the data and the analysis was repeated.This resulted in a modest improvement in the linear fitbetween the two measures of chlorophyll and the RVI,NDVI and SAVI indices (Table 3c). The fitting of anexponential curve to these data did, however, signifi-cantly improve the strength of the relationship (Table3d). The exponential relationship between weight- andarea-normalised chlorophyll and each of the vegetationindices is very similar (Fig. 4a,b using SAVI as anexample). These plots show that there is a large increasein index values associated with relatively small increasesin chlorophyll until about 6 mg cm�2 or 18 mg g�1 drysediment. As chlorophyll increases beyond this point to24 mg cm�2 or 110 mg g�1 dry sediment, the slope of thecurve becomes more pronounced. The shape of thiscurve was similar to the relationship between chloro-phyll content and NDVI calculated from reflectancespectra of whole sugar maple leaves reported byVogelmann et al. (1993). After removal of the outliers,
632 R.J. Murphy et al. / Estuarine, Coastal and Shelf Science 59 (2004) 625e638
Fig. 3. The relationship between area- and weight-normalised chlorophyll and SAVI. (a) Weight-normalised chlorophyll and SAVI (R2Z0:31,
P!0:01, nZ61). (b) Area-normalised chlorophyll and SAVI (R2Z0:50, P!0:01, nZ61).
each of the vegetation indices had a stronger relation-ship to weight, rather than area-normalised chlorophyll.
Although the exponential fit improved the strength ofthe relationship between RVI, NDVI, SAVI and chlo-rophyll concentrations within the measured chlorophylllimits, it cannot be applicable at larger values of theindex. The larger range of values of RVI, NDVI andSAVI indices in the image data would translate intounrealistically large values for chlorophyll if the expo-nential coefficients were used in the estimation. It isconcluded that the two outlying data-points are proba-bly due to these samples being collected over parti-cularly sandy areas and therefore represent naturalvariation within the data caused by variations in sedi-ment grain size. Further evidence for this is that thesepoints are closer to the line of best fit in the case of area-normalised chlorophyll vs SAVI, which partially com-
pensates for brightness variations of the sediment. Areanormalisation of the in situ chlorophyll values also par-tially compensates for the inherent differences in weightbetween sandy and muddy sediments. It is thereforesuggested that, at this stage, a linear fit which includesthe outlying data-points is more appropriate than anexponential fit without the outliers. Further in situ obser-vations of chlorophyll in the higher range are alsoneeded if chlorophyll is to be estimated using anexponential function.
RVI, NDVI and SAVI images derived from onecamera image were converted into concentration ofchlorophyll by application of the coefficients from thelinear regression analyses. Area-normalised chlorophyllwas selected in preference to weight-normalised chloro-phyll because this measure had the stronger linear re-lationship to these indices. Two estimates of chlorophyll
633R.J. Murphy et al. / Estuarine, Coastal and Shelf Science 59 (2004) 625e638
Fig. 4. Relationship between SAVI and chlorophyll after the removal of the outlying data-points. (a) The relationship between weight-normalised
chlorophyll and SAVI (R2Z0:79, P!0:01, nZ59). (b) The relationship between area-normalised chlorophyll and SAVI (R2Z0:74, P!0:01, nZ59).
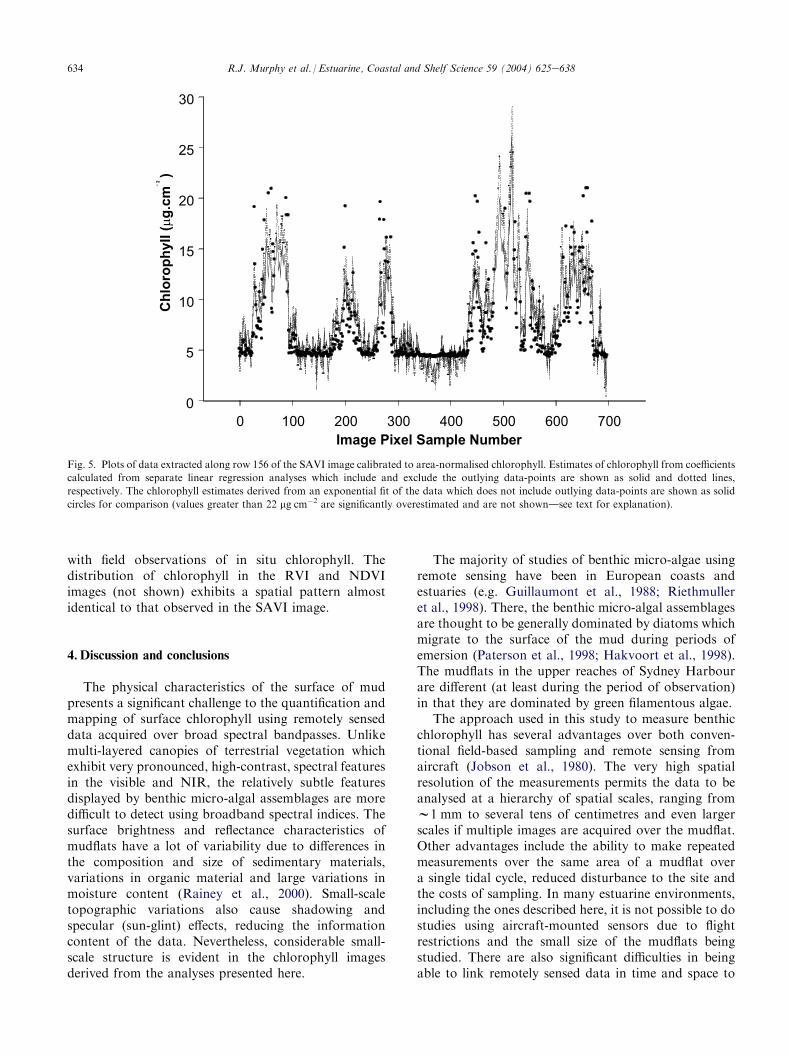
were calculated from each of the three indices, usingcoefficients that included and excluded, respectively, theoutlying data-points. Pixel values from a single row ofthe image (row number 156) were then extracted fromeach of the resulting RVI, NDVI and SAVI chlorophyllimages. The pixel row number was selected to includethe maximal range of values present in the chlorophyllimages. The impact of the outliers on the chlorophyllestimates was assessed for each spectral index bysubtracting the estimates of chlorophyll calculated fromcoefficients that included the outliers from estimates ofchlorophyll from coefficients that did not. The outliershad the greatest impact on the RVI (maximal differ-enceZ 11.81 mg cm�2), followed by NDVI (maximaldifferenceZ 6.06 mg cm�2) and had the least impact onSAVI (maximal difference= 5.89 mg cm�2). A plot ofthe extracted image data from row 156 of a SAVI imageis shown in Fig. 5.
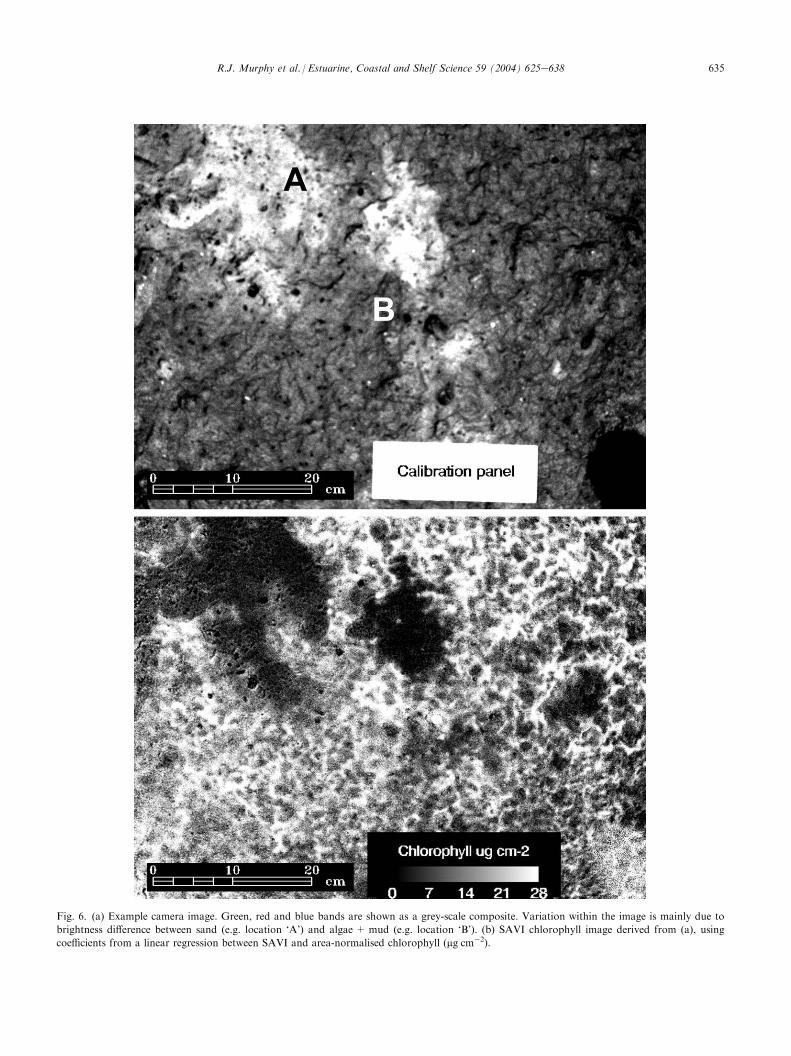
3.2.3. Example image for chlorophyllAn example composite image of green, red and NIR
reflectance shows little spatial variation and structure(Fig. 6a). The major noticeable features in the image arerelated to variations in brightness between bare mudand sand patches. The corresponding SAVI image,calibrated to area-normalised chlorophyll using linearregression coefficients of all data-points (includingoutliers) is shown in Fig. 6b. A SAVI chlorophyll imageis presented here because this index is least impacted bythe outlying data-points. The image shows a highlyheterogeneous spatial distribution of chlorophyll whichis consistent with the subtle variations of surface colourobserved in the field. Larger concentrations of greenfilamentous algae form small ridges on the mud, rangingin length from several millimetres to several centimetresand these are delimited in the chlorophyll image. Therange of values in the chlorophyll image is in accordance
634 R.J. Murphy et al. / Estuarine, Coastal and Shelf Science 59 (2004) 625e638
Fig. 5. Plots of data extracted along row 156 of the SAVI image calibrated to area-normalised chlorophyll. Estimates of chlorophyll from coefficients
calculated from separate linear regression analyses which include and exclude the outlying data-points are shown as solid and dotted lines,
respectively. The chlorophyll estimates derived from an exponential fit of the data which does not include outlying data-points are shown as solid
circles for comparison (values greater than 22 mg cm�2 are significantly overestimated and are not showndsee text for explanation).
with field observations of in situ chlorophyll. Thedistribution of chlorophyll in the RVI and NDVIimages (not shown) exhibits a spatial pattern almostidentical to that observed in the SAVI image.
4.Discussion and conclusions
The physical characteristics of the surface of mudpresents a significant challenge to the quantification andmapping of surface chlorophyll using remotely senseddata acquired over broad spectral bandpasses. Unlikemulti-layered canopies of terrestrial vegetation whichexhibit very pronounced, high-contrast, spectral featuresin the visible and NIR, the relatively subtle featuresdisplayed by benthic micro-algal assemblages are moredifficult to detect using broadband spectral indices. Thesurface brightness and reflectance characteristics ofmudflats have a lot of variability due to differences inthe composition and size of sedimentary materials,variations in organic material and large variations inmoisture content (Rainey et al., 2000). Small-scaletopographic variations also cause shadowing andspecular (sun-glint) effects, reducing the informationcontent of the data. Nevertheless, considerable small-scale structure is evident in the chlorophyll imagesderived from the analyses presented here.
The majority of studies of benthic micro-algae usingremote sensing have been in European coasts andestuaries (e.g. Guillaumont et al., 1988; Riethmulleret al., 1998). There, the benthic micro-algal assemblagesare thought to be generally dominated by diatoms whichmigrate to the surface of the mud during periods ofemersion (Paterson et al., 1998; Hakvoort et al., 1998).The mudflats in the upper reaches of Sydney Harbourare different (at least during the period of observation)in that they are dominated by green filamentous algae.
The approach used in this study to measure benthicchlorophyll has several advantages over both conven-tional field-based sampling and remote sensing fromaircraft (Jobson et al., 1980). The very high spatialresolution of the measurements permits the data to beanalysed at a hierarchy of spatial scales, ranging fromw1 mm to several tens of centimetres and even largerscales if multiple images are acquired over the mudflat.Other advantages include the ability to make repeatedmeasurements over the same area of a mudflat overa single tidal cycle, reduced disturbance to the site andthe costs of sampling. In many estuarine environments,including the ones described here, it is not possible to dostudies using aircraft-mounted sensors due to flightrestrictions and the small size of the mudflats beingstudied. There are also significant difficulties in beingable to link remotely sensed data in time and space to
635R.J. Murphy et al. / Estuarine, Coastal and Shelf Science 59 (2004) 625e638
Fig. 6. (a) Example camera image. Green, red and blue bands are shown as a grey-scale composite. Variation within the image is mainly due to
brightness difference between sand (e.g. location ‘A’) and algae + mud (e.g. location ‘B’). (b) SAVI chlorophyll image derived from (a), using
coefficients from a linear regression between SAVI and area-normalised chlorophyll (mg cm�2).
636 R.J. Murphy et al. / Estuarine, Coastal and Shelf Science 59 (2004) 625e638
ground-based observations. On the other hand, dataacquired from other instruments such as the PulsedAmplitude Modulated (PAM) Fluorometer and Co-hesive Strength Meter (CSM) can be easily integratedwith field-based digital imagery.
The reflected signal that is received by the camera andintegrated into a single (albeit very small) pixel is likelyto contain information from biological components(e.g. diatoms, green filamentous algae) and the min-eral substratum. In the case of micro-algae, cells areinterspersed with mud particles at the surface in all butthe densest bio-films. Green filamentous algae are oftencovered with a thin layer of mud deposited duringperiods of submersion. In these situations, the potentialfor non-linear spectral mixing between algae and sub-stratum is significant because these components aremore likely to constitute a definition of so called‘intimate mixtures’ (Singer and McCord, 1979). In thecase of ‘intimate mixtures’, there is a greater chance thatlight can interact with more than one component of thesubstratum, causing non-linear spectral mixing. Non-linear spectral mixing may reduce the effectiveness ofratio-based indices across a range of concentrations ofchlorophyll because the degree of non-linearity woulddepend upon the amount of chlorophyll at the surface inaddition to the brightness of the mud/sand substratum.These effects make the quantification of benthic chloro-phyll using broadband remote sensing generally moredifficult than is the case for terrestrial plants.
The usefulness of remotely sensed data for anyapplication is dependent upon the acquisition of appro-priate ground-truth data. Remotely sensed imagery ob-tained from airborne platforms is typically acquired ata much coarser spatial scale than corresponding ground-truth data. This study differs from the majority of otherstudies in that it uses remotely sensed data which havebeen acquired at a smaller spatial scale than the ground-truth data with which these are calibrated. Further workis planned to determine if the sampling of ground-truthdata at a smaller spatial scale improves the accuracy of thespectral indices to estimate chlorophyll concentration.
The relationships between chlorophyll and vegetationindices presented in this study are limited by therelatively few observations of in situ chlorophyll at thehigher range (i.e. O18 mg cm�2 or 60 mg g�1 dry sedi-ment). This underlines the difficulty in visual selection ofin situ samples that are representative of the range ofvalues actually present in the study area. It is clear thatnormalisation of reflectance is essential if data frommultiple images are to be compared. In our case, a simpleflat-field calibration was used to accomplish this. AKodak grey card provided an adequate standard re-flectance against which each image was calibrated.Future work would benefit from a more robust strategyfor normalisation of reflectance such as that provided bydirect measurement of incident solar radiation or an
empirical-line approach (e.g. Kruse et al., 1989; Ben-Dor et al., 1994) using two standards for reflectance ofdifferent brightness. The relationship between spectralindices and in situ chlorophyll measurements is influ-enced by how the chlorophyll is normalised. Area-normalised chlorophyll was shown to have a strongerlinear relationship to vegetation indices than weight-normalised chlorophyll, but the reverse was true when anexponential fit was applied to the data after the removalof outliers. Although the R2 values for the regression ofSAVI on chlorophyll concentration are slightly greaterthan for NDVI on chlorophyll, this is not significant.
Field spectrometers typically measure reflected lightat a single point at many different wavelengths. Thespectral resolution of such data is sufficient to permitinformation on individual pigments to be extracted onthe basis of their specific absorption characteristics.Such devices over-sample in the spectral domain, butunder-sample in the spatial domain. The oppositesituation is true for photographic images which under-sample the spectral domain, but provide information athigh spatial resolution by over-sampling in the spatialdomain. This paper has demonstrated that field-baseddata from a digital broadband colour-infrared cameracan yield valuable quantitative information about thespatial distribution of chlorophyll of mudflats at veryhigh spatial resolutions. The spatially contiguous datarepresent a continuum of variation in chlorophyll overan area of mudflat, providing a perspective on dis-tribution of chlorophyll that is not possible using othersampling strategies. Because the approach presentedhere is non-destructive, it permits repeated measure-ments in a single location and this opens up the pos-sibility of ‘real-time’ operational mapping of benthicchlorophyll at hyper-temporal and -spatial resolutions.The increasing availability of digital colour-infraredimagery will contribute to more detailed studies of thespatial dynamics and variability of distribution ofbenthic chlorophyll and how it is related to the structureand functioning of natural assemblages.
Acknowledgements
We thank Craig Myers and Amy Palmer forassistance in the field. Matthew Sage and BasilPanayotakos provided technical assistance in the de-ployment of the field imaging system. Dr Frank Schiebeprovided helpful comments on calibration. We areespecially grateful to Coherent Scientific Pty. Ltd. ofHilton, South Australia and Redlake MASD of SanDiego, CA, USA for the loan of the Digital CIR camerafor the duration of this study, which was supported byfunds from the Australian Research Council through theSpecial Research Centres Programme.
637R.J. Murphy et al. / Estuarine, Coastal and Shelf Science 59 (2004) 625e638
References
Ben-Dor, E., Kruse, F.A., Lefkoff, A.B., Banin, A., 1994. Com-
parison of 3 calibration techniques for utilization of Ger 63-
channel aircraft scanner data of Makhtesh-Ramon, Negev,
Israel. Photogrammetric Engineering & Remote Sensing 60,
1339e1354.
Buschmann, C., Nagel, E., 1993. In vivo spectroscopy of internal
optics of leaves as basis for remote sensing of vegetation.
International Journal of Remote Sensing 14 (4), 711e722.
Cadee, G.C., Hegeman, J., 1974. Primary production of the benthic
microflora living on tidal flats in the Dutch Wadden Sea.
Netherlands Journal of Sea Research 8, 260e291.
Chappelle, E.W., Kim, M.S., McMurtrey, J.E., 1992. Ratio analysis
of reflectance spectra (RARS): an algorithm for the remote estima-
tion of the concentrations of chlorophyll A, chlorophyll B and
carotenoids in soybean leaves. Remote Sensing of Environment 39,
239e247.
Colwell, J.E., 1974. Vegetation canopy reflectance. Remote Sensing of
Environment 3, 175e183.
Elvidge, C.D., Lyon, R.J.P., 1984. Influence of background albedo on
vegetation indices employing red and near-infrared. Proceedings of
the Seminar on Remote Sensing for Geologic Mapping, IUGSeUNESCO Programme on Geological Applications of Remote
Sensing, 2nde4th February, Orleans, France, 11 pp.
Filella, I., Penuelas, J., 1994. The red edge position and shape as in-
dicators of plant chlorophyll content, biomass and hydric status.
International Journal of Remote Sensing 15 (7), 1459e1470.
Gitelson, A., Merzlyak, M.N., 1994. Spectral reflectance changes
associated with autumn senescence of Aesculus hippocastanum L.
and Acer platanoides L. leaves. Journal of Plant Physiology 143,
286e292.
Gordon, H.R., Clarke, D., Brown, J.W., Brown, O.B., Evans, R.H.,
Broenkow, W., 1983. Phytoplankton pigment concentrations in the
Middle Atlantic Bight: comparison of ship determinations and
CZCS estimates. Applied Optics 22, 20e36.
Guillaumont, B., Gentian, P., Viollier, M., 1988. Mesures radio-
metriques haute resolution du microphytobenthos intertidal. Pro-
ceeding of the Fourth International Colloquium on Spectral
Signatures of Objects in Remote Sensing, Aussois, France, 18e22
January 1988, pp. 333e336.
Guillaumont, B., Bajjouk, T., Talec, P., 1997. Seaweed and remote
sensing: a critical review of sensors and data processing. In: Round,
F.E., Chapman, D.J. (Eds.), Progress in Phycological Research,
vol. 12. Biopress Ltd., Bristol, United Kingdom.
Guyot, G., Guyon, D., 1989. Factors affecting the spectral response of
forest canopies: a review. Geocarto International 3, 3e18.
Hagerthey, S.E., Paterson, D.M., Kromkamp, J., 2002. Monitoring
estuarine ecosystems: the Eden Estuary and the BIOPTIS
programme. Estuarine and Coastal Sciences Association, 2003.
Coastal Zone Topics, 5. The Estuaries and Coasts of North-East
Scotland. Aberdeen, Estuarine and Coastal Sciences Association,
pp. 89e97.Hakvoort, J.H.M., Heineke, M., Heyman, K., Kuhl, H., Riethmuller,
R., Witte, G., 1998. A basis for mapping the erodibility of tidal flats
by optical remote sensing. Marine and Freshwater Research 49,
867e873.Hay, S.I., Maitland, T.C., Paterson, D.M., 1993. The speed of diatom
migration through natural and artificial substrata. Diatom Re-
search 8, 371e384.Honeywill, H.G., Paterson, D.M., Hagerthey, S.E., 2002. Deter-
mination of microphytobenthic biomass using pulse modulated
minimum fluorescence. European Journal of Phycology 37, 1e8.
Horler, D.N.H., Dockray, M., Barber, J., 1983. The red edge of plant
leaf reflectance. International Journal of Remote Sensing 4 (2),
273e288.
Huete, A.R., 1988. A soil adjusted vegetation index (SAVI). Remote
Sensing of Environment 25, 295e309.
Jassby, A.D., Cloern, J.E., Powell, T.M., 1993. Organic carbon sources
and sinks in San Francisco Bay: variability induced by river flow.
Marine Ecology Progress Series 95, 39e54.Jobson, D.J., Zingmark, R.G., Katzberg, S.J., 1980. Remote sensing of
benthic microalgal biomass with a tower-mounted multispectral
scanner. Remote Sensing of Environment 9, 351e362.Joint, I.R., 1978. Microbial production of an estuarine mudflat.
Estuarine and Coastal Marine Science 7, 185e195.
Jordan, C.F., 1969. Derivation of leaf area index from quality of light
on the forest floor. Ecology 50, 663e666.Kelly, J.A., Honeywill, C., Paterson, D., 2001. Microscale analysis of
chlorophyll-a in cohesive, intertidal sediments: the implications of
microphytobenthos distribution. Journal of the Marine Biological
Association, U.K. 81, 151e162.Kirk, J.T.O., 1983. Light and Photosynthesis in Aquatic Ecosystems.
Cambridge University Press, Cambridge, New York.
Kromkamp, J., Barranguet, C., Peene, J., 1998. Determination of
microphytobenthos PSII quantum efficiency and photosynthetic
activity by means of variable chlorophyll fluorescence. Marine
Ecology Progress Series 162, 45e55.
Kruse, F.A., Kierein-Young, K.S., Boardman, J.W., 1989. Mineral
mapping at Cuprite, Nevada with a 63-channel imaging spectrom-
eter. Photogrammetric Engineering and Remote Sensing 56 (1),
83e92.
Lichtenthaler, H.K., Gitelson, A., Lang, M., 1996. Non-destructive
determination of chlorophyll content of leaves of a green and an
aurea mutant of tobacco by reflectance measurements. Journal of
Plant Physiology 148, 483e493.Louchard, E.M., Reid, P., Stephens, C.F., Davis, C.O., Leathers, R.A.,
Downes, T.V.,Maffione, R., 2002. Derivative analysis of absorption
features in hyperspectral remote sensing data of carbonate sedi-
ments. Optics Express 10 (26), 1573e1584.MacIntyre, H.L., Cullen, J.J., 1996. Primary production by suspended
and benthic micro-algae in a turbid estuary: time-scales of vari-
ability in San Antonio Bay, Texas. Marine Ecology Progress Series
145, 245e268.MacIntyre, H.L., Geider, R.J., Miller, D.C., 1996. Microphytoben-
thos: the ecological role of the ‘‘Secret Garden’’ of unvegetated,
shallow-water marine habitats. I. Distribution, abundance and
primary production. Estuaries 19 (2A), 186e201.Major, D.J., Baret, F., Guyot, G., 1990. A ratio vegetation index
adjusted for soil brightness. International Journal of Remote
Sensing 11, 727e740.Miller, D.C., Geider, R.J., MacIntyre, H.L., 1996. Microphytoben-
thos: the ecological role of the ‘‘Secret Garden’’ of unvegetated,
shallow-water marine habitats. II. Role in sediment stability and
shallow-water food webs. Estuaries 19 (2A), 202e212.Paterson, D.M., 1989. Short-term changes in the erodibility of
intertidal cohesive sediments related to the migratory beha-
viour of epipelic diatoms. Limnology and Oceanography 34 (1),
223e234.
Paterson, D.M., Wiltshire, K.H., Miles, A., Blackburn, J., Davidson,
I., Yates, M.G., McGrorty, S., Eastwood, J.A., 1998. Microbio-
logical mediation of spectral reflectance from intertidal cohesive
sediments. Limnology and Oceanography 43 (6), 1207e1221.
Penuelas, J., Gamon, J.A., Griffin, K.L., Field, C.B., 1993. Assessing
community type, plant biomass, pigment composition, and photo-
synthetic efficiency of aquatic vegetation from spectral reflectance.
Remote Sensing of Environment 46, 110e115.
Pinckney, J., Sandulli, R., 1990. Spatial autocorrelation analysis of
meiofaunal and microalgal populations on an intertidal sandflat:
scale linkage between consumers and resources. Estuarine, Coastal
and Shelf Science 30, 341e353.
Porra, R.J., Thompson, W.A., Kriedmann, P.E., 1989. Determination
of accurate extinction coefficients and simultaneous equations for
638 R.J. Murphy et al. / Estuarine, Coastal and Shelf Science 59 (2004) 625e638
assaying chlorophyll a and b extracted with four different solvents:
verification of the concentration of chlorophyll standards by
atomic absorption spectroscopy. Biochimica et Biophysica Acta
975, 384e394.
Rainey, M.P., Tyler, A.N., Bryan, R.G., Gilvear, D.J., 2000. The
influence of surface and interstitial moisture on the spectral charac-
teristics of intertidal sediments: implications for airborne image
acquisition and processing. International Journal of Remote
Sensing 21 (16), 3025e3038.
Riethmuller, R., Hakvoort, J.H.M., Heineke, M., Heymann, K.
Kuhl, H., Witte, G., 1998. Relating erosion shear stress to tidal
flat surface colour. In: Black, K.S., Paterson, D.M., Cramp, A.
(Eds.), Sedimentary Processes in the Intertidal Zone. Special Pub-
lications 139. Geological Society, London, pp. 283e293.
Rizzo, W.M., Lackey, G.L., Christian, R.R., 1992. Significance of
euphotic, subtidal sediments to oxygen and nutrient cycling in
a temperate estuary. Marine Ecology Progress Series 86, 51e61.
Roberts, D.A., Yamaguchi, Y., Lyon, R.J.P., 1986. Comparison of
various techniques for calibration of AIS data, Second AIS
Workshop. Jet Propulsion Laboratory, Pasadena, CA, pp. 21e30.
Rouse, J.W., Haas, R.H., Schell, J.A., Deering, D.W., 1973.
Monitoring vegetation systems in the great plains with ERTS,
Third ERTS Symposium, NASA SP-351, vol. 1, NASA, Wash-
ington DC, pp. 309e317.
Saburova, M.A., Polikarpov, I.G., Burkovsky, I.V., 1995. Spatial
structure of an intertidal sandflat microphytobenthic community
as related to different spatial scales. Marine Ecology Progress
Series 129, 229e239.
Shiebe, F.R., 2001. Evaluation of the SST crop reflectance imaging
system. Proceedings of the 18th Biennial Workshop on Colour
Photography and Videography in Resource Assessment, May
16e18, 2001, Amherst, MA 01003.
Singer, R.B., McCord, T.B., 1979. Mars: large scale mixing of bright
and dark surface materials and implications for analysis of spectral
reflectance. In: Proceedings Lunar and Planetary Science Confer-
ence, 10th, pp. 1835e1848.
Smith, D.J., Underwood, G.J.C., 1998. Exopolymer production by
intertidal epipelic diatoms. Limnology and Oceanography 43 (7),
1578e1591.
Thomas, J.R., Gausman, H.W., 1976. Leaf reflectance vs leaf
chlorophyll and carotenoid concentrations for eight crops.
Agronomy Journal 69, 799e802.
Tucker, C.J., 1979. Red and photographic infrared linear combina-
tions for monitoring vegetation. Remote Sensing of Environment
8, 127e150.
Underwood, G.J.C., Kromkamp, J., 1999. Primary production by
phytoplankton and microphytobenthos in estuaries. Advances in
Ecological Research 29, 93e153.Varela, M., Penas, M., 1985. Primary production of benthic micro-
algae in an intertidal sand flat of the Ria de Arosa, NW Spain.
Marine Ecology Progress Series 25, 111e119.Vogelmann, J.E., Rock, B.N., Moss, D.M., 1993. Red edge spectral
reflectance from sugar maple leaves. International Journal of
Remote Sensing 14 (8), 1563e1575.
Yallop, M.L., de Winter, B., Paterson, D.M., Stal, L.J., 1994. Com-
parative structure, primary production and biogenic stabilization
of cohesive and non-cohesive marine sediments inhabited
by microphytobenthos. Estuarine, Coastal and Shelf Science 39,
565e582.Yoder, B.J., Waring, R.H., 1994. The normalised difference vegetation
index of small Douglas fir canopies with varying chlorophyll con-
centrations. Remote Sensing of Environment 49, 81e91.
Yoder, B.J., Pettigrew-Crosby, R.E., 1995. Predicting nitrogen and
chlorophyll content and concentrations from reflectance spectra
(400e2500 nm) at leaf and canopy scales. Remote Sensing of
Environment 53, 199e211.Zbinden, R.M., 1985. Les reflectances de sediments d’estran: resul-
tants de mesure in situ et d’une simulation SPOT en Baie de
Mont Saint-Michel. Proceedings of the Third International
Colloquium Spectral Signatures of Objects in Remote Sensing,
Les Arcs, France, 16e20th December 1985, ESA SP-247, pp.
257e263.