Embed Size (px)
Citation preview

Heredityhttps://doi.org/10.1038/s41437-017-0037-y
ARTICLE
Estimation of contemporary effective population size andpopulation declines using RAD sequence data
Schyler O. Nunziata1 ● David W. Weisrock1
Received: 10 April 2017 / Revised: 12 October 2017 / Accepted: 9 November 2017© The Genetics Society 2017
AbstractLarge genomic data sets generated with restriction site-associated DNA sequencing (RADseq), in combination withdemographic inference methods, are improving our ability to gain insights into the population history of species. We used asimulation approach to examine the potential for RADseq data sets to accurately estimate effective population size (Ne) overthe course of stable and declining population trends, and we compare the ability of two methods of analysis to accuratelydistinguish stable from steadily declining populations over a contemporary time scale (20 generations). Using a linkagedisequilibrium-based analysis, individual sampling (i.e., n ≥ 30) had the greatest effect on Ne estimation and the detection ofpopulation size declines, with declines reliably detected across scenarios ~10 generations after they began. Coalescent-basedinference required fewer sampled individuals (i.e., n= 15), and instead was most influenced by the size of the SNP data set,with 25,000–50,000 SNPs required for accurate detection of population trends and at least 20 generations after declinebegan. The number of samples available and targeted number of RADseq loci are important criteria when choosing betweenthese methods. Neither method suffered any apparent bias due to the effects of allele dropout typical of RAD data. With anunderstanding of the limitations and biases of these approaches, researchers can make more informed decisions whendesigning their sampling and analyses. Overall, our results reveal that demographic inference using RADseq data can besuccessfully applied to infer recent population size change and may be an important tool for population monitoring andconservation biology.
Introduction
One of the most important parameters in wildlife manage-ment and conservation biology is effective population size(Ne), with estimates providing insight into the demographichistory and extinction risk of populations. Although Ne isinformative about population viability and broadly applic-able in ecology, conservation, and evolution, it is notor-iously difficult to estimate (Luikart et al. 2010). Rarely isenough demographic information available from naturalpopulations to directly estimate Ne, making indirect geneticestimates of considerable use, especially given their ease of
generation relative to direct demographic methods(Schwartz et al. 2007; Luikart et al. 2010; Dudgeon andOvenden 2015; Andreotti et al. 2016). It is now possible togenerate population genomic data for almost any species forthe investigation of population and evolutionary history(Narum et al. 2013; Andrews et al. 2016; Nunziata et al.2017). The increase in power and precision offered by agenomic approach is poised to greatly improve estimates ofdemographic history, including Ne, the timing of demo-graphic events, and migration. Genomic-based demographicinference has yielded insight into invasion dynamics(Trucchi et al. 2016), climate-driven population shifts(Prates et al. 2016), and glacial refugium dynamics(Kopuchian et al. 2016) at historical timescales. However,as emphasized in a recent review, the application of geno-mic techniques in conservation studies has been rare (Shaferet al. 2015a). One obvious, but unanswered, question iswhether genomic-based demographic inference methodshave the ability to accurately characterize population historyover a contemporary time scale (e.g., tens of generations),
* Schyler O. [email protected]
1 Department of Biology, University of Kentucky, Lexington, KY40506, USA
Electronic supplementary material The online version of this article(https://doi.org/10.1038/s41437-017-0037-y) contains supplementarymaterial, which is available to authorized users.
1234
5678
90

and whether there is a time lag between decline in censussize and decline in Ne.
Previous work has begun to hint at the ability for geneticdata to uncover recent population history. Simulation stu-dies have suggested that microsatellite markers have theability to detect bottlenecks and population size trends at acontemporary scale, but require sample sizes of 60 or moreindividuals and are not accurate with large (≥1000) popu-lation sizes (Tallmon et al. 2010; Antao et al. 2011). Whileincreasing the number of microsatellite markers employedcan increase the power to detect population size change(Hoban et al. 2013), in many cases researchers will not haveaccess to, or resources to generate, ≥100 microsatellitemarkers. These studies either did not use single-nucleotidepolymorphism (SNP) data which would be common incontemporary population genomic studies, or they simu-lated a small number (100–1000) of SNP markers (Antaoet al. 2011; Hollenbeck et al. 2016). It is possible that theincreased power offered by large genomic data sets canresult in accurate estimates of population size trends overshort timescales while using smaller numbers of sampledindividuals.
Recent empirical studies have shown that coalescent-based demographic inference can accurately date docu-mented introductions of populations occurring in the pastfew decades (McCoy et al. 2013; Fraser et al. 2015). Coa-lescence theory states that the probability of coalescence tgenerations ago is (1−(1/2Ne))
t−1(1/2Ne), with the coales-cent Ne estimated as the expected time of coalescence ingenerations, T, or T= 2Ne (Nordborg and Krone 2002;Wakeley and Sargsyan 2009). Given these equations, whenNe is small enough, as is often the case in species of con-servation concern, large sample sizes (individuals and/orloci) may be effective in estimating coalescent Ne at acontemporary scale as coalescent events will be clustered inthe recent past. Consistent with this theory, a simulationstudy found that although large sample sizes are generallynot needed for accurate demographic inference of ancientevents, increased sampling of individuals increases accu-racy of parameter estimates for more recent events(Robinson et al. 2014). Before these methods can be appliedto real-world conservation biology, vigorous exploration isneeded to estimate their accuracy with realistic samplingconditions to gain an understanding of implicit limitationsand biases (Shafer et al. 2015a).
Restriction site-associated DNA sequencing (RADseq) isarguably the most popular method for generating genome-wide population genetic data from a reduced subset of thegenome (Davey et al. 2011; Andrews et al. 2016). WhileRADseq can yield many thousands or tens of thousands ofshared orthologous loci across individuals and populations,it also has inherent properties that lead to allele dropout, andconsequently, missing data that may create biases in
population genetic results. Allele dropout via mutations inrestriction cut sites and the shotgun nature of Illuminasequencing, which under-sequences loci or alleles can ran-domly lead to either missing genotypes for loci, or themisinterpretation of null alleles as homozygous at hetero-zygous loci. Both of these scenarios can result in skewedestimation of allele frequencies (Arnold et al. 2013), and amisrepresentation of the site frequency spectrum (Shaferet al. 2017). Simulation studies have highlighted thedownstream effects of these biases in commonly estimatedpopulation genetic summary statistics (Gautier et al. 2013;Arnold et al. 2013) and in phylogenetic inferences (Huangand Knowles 2014). However, the effect of allele dropout inRADseq-based studies of Ne and contemporary populationsize trends has not been investigated.
Here we use an approach similar to Tallmon et al. (2010)and assess the ability of RADseq-generated SNP data anddifferent Ne estimators to infer population abundance andpopulation size trends (λ) over a contemporary time scale.We simulated ideal Wright–Fisher (W–F) populations overa range of known census sizes (NC) and with either stablepopulation size, or a steadily declining population. In idealW–F populations NC= Ne, so that estimates of Ne can bedirectly compared to the simulated NC. Using both linkagedisequilibrium-based analysis, and a coalescent-based ana-lysis, we assess the estimation of Ne and population sizetrends. In doing so, we also evaluate the impacts of thevarious aspects of the population model (initial populationsize and the number of generations since λ began) on esti-mation, as well as the impacts of sampling, number of SNPssampled, allele dropout, and data filtering.
Methods
Data simulation
We conducted simulations of RADseq data for populationswith both stable and declining population sizes using thePython program simuPOP v1.1.4 (Peng and Kimmel 2005),a forward-time and individual-based population geneticmodeling program. Prior to simuPOP simulations, initialhaploid allele frequencies were generated with the coales-cent simulator fastsimcoal2 v2.5.2.21 (fsc2; Excoffier et al.2013) for 20,000 150 base pair (bp) loci using a diploid Ne
of 1000. A mutation rate (µ) was randomly assigned to eachlocus from a log-normal distribution with a mean µ of 2.5E−8 and a log standard deviation of 1.3. This mutation ratehas been robustly estimated in humans (Nachman andCrowell 2000) and similarly used in other RADseq simu-lation studies (Huang and Knowles 2014). We used this log-normal distribution of mutation rates among loci to accountfor variance in the mutation rate across the genome, and to
S. O. Nunziata and D. W. Weisrock

generate a large number of highly diverse loci. Our rationalwas to generate a large number of SNPs typical of empiricalRAD studies, while balancing computational demand ofsimulating even greater numbers of individual RAD locivariable in one or a few SNPs. This created a larger pro-portion of allele dropout than would be typical of empiricalstudies, but the loci retained to assess impacts of alleledropout should be comparable to those typical of empiricalstudies. Loci were generated as Arlequin-formatted files andwere subsequently converted to Phylip format using theprogram PGDSpider v2.0.5.1 (Lischer and Excoffier 2012).Initial diploid genotypes for individuals in the simuPOPpopulation were generated by pairing the fsc2-simulatedalleles for each locus using random sampling with repla-cement, which approximated random mating and W–Fpopulations. Diploid populations were constructed withinitial population sizes of n= 250, 500, and 1000, with 100replicates constructed for each initial population size.Throughout the subsequent simulations, populations main-tained an average sex ratio of 1 with random mating, non-overlapping generations, a fixed µ= 2.5E−8 across all loci,and with no assignment to chromosomes. Under theseconditions NC should be approximately equal to Ne. Allsimulated populations went through an equilibrium phase of10 generations to reach Hardy–Weinberg equilibrium(Waples 2006; Tallmon et al. 2010; Antao et al. 2011), afterwhich each replicate diploid population evolved for onegeneration (t−1) according to two separate deterministicgrowth rates that approximated a stable population (λ= 1.0)and a declining population (λ= 0.9). Data collection beganat generation t0 as the population evolved at the same λ for20 generations as in Tallmon et al. (2010). In each simu-lation, genotypes from all loci were recorded after 0, 5, 10,15, and 20 generations. Sample collection began with onegeneration after the initiation of the deterministic growthrate because inbreeding Ne estimates are reflective of thenumber of parents in the parental generation (Waples 2005).To assess the effect of the sample size of individuals, wesampled 15, 30, and 60 individuals from each of the spe-cified generations.
In silico RADseq mutations and data filtering
Using custom Python scripts, we filtered RADseq loci fromsampled individuals to mimic empirical RADseq datarecovery and filtering conditions typically used in popula-tion genomic studies. To simulate allelic dropout as a resultof a mutation in the restriction enzyme cutting site, allindividual sequences were deleted containing a mutation inthe first 8 bp, which represents our restriction cut site. Tosimulate missing data as a result of variation in sequencingcoverage, we simulated the number of reads for each indi-vidual allele by drawing randomly from a Poisson
distribution with a mean of 10 (Huang and Knowles 2014).We imposed a sequencing coverage cutoff of 10, which isconsidered an efficient sequencing coverage cutoff fordiploids. To be genotyped as heterozygous, individualswere required to have a coverage ≥5 reads per allele for agiven locus. If one allele had a coverage ≥10 reads and theother had o5, the locus was recorded as homozygous forthe higher-coverage allele due to allele dropout. Loci belowthese coverage cutoffs were recorded as missing data. Allother sources of missing data and biases from sequencingerrors, coverage cutoffs, and alignment errors were ignoredhere as they are not the focus of our study. These have beenthoroughly reviewed in other studies, and are expected tocause general biases in all sequencing projects (Rokas andAbbot 2009, Pool et al. 2010, Huang and Knowles 2014).
We next filtered our simulated RADseq data using thecriteria specific to the two analytical programs used indemographic estimation.
Linkage disequilibrium-based estimation
Linkage disequilibrium (LD) methods for Ne estimationassume unlinked loci. To remove the inclusion of linkedsites within a RADseq locus, we used only the first SNP in alocus in all LD-based data sets. To examine whether theLD-based method produced unbiased Ne estimates withperfect detection of allele dropout, we analyzed data setsthat removed all loci with missing data exclusively due toRADseq cut site mutations, hereafter referred to as the LDRAD mutation data set. We further examined how LD-based Ne estimation would be affected by the combinedimpacts of missing data from allele dropout due to RADseqcut site mutation and low sequencing coverage. For theseanalyses, we generated two filtered data sets that removedloci with ≥10% and ≥50% missing data; hereafter referredto as the 10% missing and 50% missing data sets,respectively.
Fastsimcoal2
In fsc2, the use of linked SNPs should not bias parameterestimation, so all data sets analyzed in this study used allSNPs in a locus. However, the inclusion of loci withmissing data is expected to lead to a biased site frequencyspectrum (SFS) and result in inaccurate parameter estimates(Excoffier et al. 2013). Therefore, we included only lociwith no missing data across all sampled individuals. Onlyvariable sites were included in the SFS. To examine thepotential effects of allele dropout on Ne estimation in theprogram fsc2, we analyzed our simulated RADseq dataunder a range of filtering strategies that accounted for alleledropout due to mutations in restriction cut sites and insuf-ficient sequencing coverage. First, we analyzed an unfiltered
RADseq demography estimation

data matrix with no allele dropout. Here the SFS wasconstructed using the complete 20,000 locus (3,000,000 bp)simulated data set, and is hereafter referred to as the fsc2complete data set. Next, we examined the performance ofNe estimation in fsc2 when accounting for the perfectdetection of allele dropout due to restriction cut site muta-tions. Here the SFS was constructed after removal of all lociwith a restriction cut site mutation, hereafter referred to asthe fsc2 RAD mutation data set. We examined the perfor-mance of Ne estimation in fsc2 when allowing for alleledropout due to both cut site mutation and low sequencingcoverage, hereafter referred to as the fsc2 RAD mutationand coverage data set. Finally, to examine the impact ofnumber of SNPs included in the joint SFS, we subsampledthe fsc2 complete data set for 5000, 15,000, 25,000, 50,000,100,000, and 150,000 SNPs.
Ne estimation and demographic inference
We used the program NeEstimator v2.01 (Do et al. 2014) toestimate Ne using the linkage disequilibrium method (Hill1981). With finite population size and a limited number ofparents, nonrandom associations of alleles at differentgenetic markers occur (i.e., linkage disequilibrium), evenwithout any physical linkage on a chromosome (Waples andDo 2010). We estimated Ne from all sampled generations ofour temporally simulated populations, employing all threeLD-based data-filtering scenarios described above. Inaddition, we assessed the effect of excluding rare allelesusing Pcrit cutoffs, which is important in LD-based Ne
estimation. For all data sets, we separately applied a Pcrit of0.01, 0.02, and 0.05. A Pcrit of 0.02 has been recommendedto balance precision and bias (Waples and Do 2010),although 0.05 is a common value used in SNP-basedstudies.
We used fsc2 to perform demographic inference usingthe joint SFS generated from serial samples taken at gen-erations 0 (t0) and 20 (t20) in our temporally simulatedpopulations. For all fsc2 analyses, we used a simple modelof a single population with Ne at t0 fixed at the knownstarting value and Ne in subsequent generations allowed tovary according to the model. Fixing Ne at t0 allowed us toreduce the number of parameters estimated from the model,scale Ne estimation without a mutation rate, and ignoreinvariant sites in the SFS. Defined parameter ranges wereuniformly distributed with Ne ranging from 1 to 10,000. Atotal of 100,000 simulations were performed to estimate theSFS, with a minimum and maximum of 10 and 100 loops(ECM cycles), respectively. The stopping criterion wasdefined as the minimum relative difference in parametersbetween two iterations, and was set to 0.001. A total of 50replicate fsc2 runs were performed for each replicatesimulation of a demographic scenario, and for each of the
three fsc2 filtering options described above. The overallmaximum likelihood run across all 50 fsc2 replicates wasretained as a point estimate for Ne
t20. Due to computationallimitations, for each combination of initial population sizeand population growth rate, only the first 40 temporallysimulated replicates (out of 100) were analyzed with fsc2.
Accuracy assessments
The performance of each Ne estimation method was eval-uated for the overall accuracy of Ne estimates. To char-acterize the accuracy of Ne estimates across simulationreplicates, we measured the root mean squared error(RMSE) calculated after removing infinitely large estimatesby
RMSE ¼ffiffiffiffiffiffiffiffiffiffiffiffiffiffiffiffiffiffiffiffiffiffiffiffiffiffiffiffiffiffiffiffiffiffiffiffiffi
1m
X
m
i¼1
1
N̂ei� 1Ne
� �2v
u
u
t ;
where bNei is the estimated Ne in the ith (i= 1–100) replicate,and Ne is the simulated Ne. The RMSE was not calculated ifover 50% of the estimates of bNei reached infinity.
Detection of population size change
To estimate population size trends, we calculated bλ as theslope of a linear regression of the log transformation of Ne
estimates from current and historical samples within asimulated replicate and we compared these to known λ. Weperformed these calculations for results generated from bothNeEstimator and fsc2 using all simulated demographicscenarios, data-filtering scenarios, and Pcrit levels. Follow-ing Tallmon et al. (2010), we recorded the proportion oftimes bλ o 0.95 when true λ= 0.9. This is a practical con-servation scenario to identify populations that are decliningby at least 5% per generation. We also assessed how often astable population was incorrectly identified as declining asthe proportion of times bλ o 0.95 when true λ= 1.0 (falsepositive rate).
Results
The number of SNPs generated in the simulation dependedon the initial population size, imposed lambda, and the post-simulation filtering scenario used (LD-based data: Table 1;fsc2 data: Table S1). Consistent with theoretical expecta-tions, in the LD-based SNP data sets, larger populationsgenerally had more SNPs and lost genetic diversity lessrapidly due to drift, and declining populations lost geneticdiversity more rapidly than stable populations. The meannumber of SNPs in the joint SFS was highly dependent ondata-filtering method, with the number of shared SNPs
S. O. Nunziata and D. W. Weisrock

between t0 and t20 declining with allele dropout from bothRADseq mutation and insufficient sequencing coverage.Although the number of SNPs will vary with study design,such as the number of individuals multiplexed in an Illu-mina sequencing lane, and coverage cutoffs, the number ofSNPs we recovered in our simulations is comparable toempirical RADseq studies.
Stable population size estimation
LD-based estimation
Here we focus on results from estimation of bNe at t20 under aλ= 1.0, where the accuracy of bNe estimation was mostinfluenced by the number of individuals sampled and thePcrit employed (Fig. 1; Fig. S1). Estimates of bNe at timepoints t0 through t15 were nearly identical to bNe at t20, andare not presented here. RMSE calculations yielding thelowest measures of error for all simulated demographic andfiltering scenarios are presented in Table 2. The lowestindividual sample size (n= 15) only produced meaningfulresults at a simulated population size of n= 250 and a Pcrit
= 0.05, with the majority of replicates at higher simulatedpopulation sizes and/or different filtering methods yieldingeither infinite bNe or very wide ranges of parameter esti-mates. A full summary of the proportion of replicate esti-mates that reached infinity can be found in Tables S2–S4. Incontrast, increased individual sampling (n= 30 and n= 60)produced more accurate estimates of bNe over most demo-graphic and data-filtering scenarios. Analyses of the LDRAD mutation data set generated bNe estimates with thegreatest accuracy and least variance; however, data sets with10 and 50% missing data due to both cut site mutations and
insufficient read coverage also generated similarly accuratebNe estimates under many simulated population sizes andPcrit levels. The Pcrit level yielding the most accurate resultsvaried with the number of individuals sampled and simu-lated population size. Generally, including low frequencyalleles with an Pcrit= 0.01 appeared to have the largesteffect by upwardly biasing bNe and yielding the greatestvariance (Fig. S1).
Fig. 1 Boxplots of the distribution of bNe estimates from 100 replicatesimulations for LD-based estimation at generation 20 from temporalsimulations under stable population sizes (λ= 1.0) with a Pcrit= 0.05.Dashed lines represent true Ne for the three population size models(1000, 500, and 250). Different missing data-filtering strategies areshown at the bottom of the figure. The number of individuals sampledis shown at the top
Table 1 Number of SNPs used for LD-based analysis resulting fromsimulations in simuPop
Initial variation at t0 Final variation at t20
RADmutation
10% 50% RADmutation
10% 50%
N λ # SNPs # SNPs # SNPs # SNPs # SNPs # SNPs
250 1.0 3660 3938 4527 3521 3695 4223
500 1.0 3718 4054 4657 3629 3876 4451
1000 1.0 3756 4130 4742 3703 4013 4611
250 0.9 3915 3941 4676 3099 2965 3457
500 0.9 3719 4053 4661 3392 3493 3975
1000 0.9 3756 4128 4739 3570 3773 4327
SNPs were calculated as average across the 100 replicates for eachsimulated scenario and are presented for the initial generation (t0) afterthe 10-generation equilibrium phase and from the final generation (t20).SNP levels are broken down across the different initial populationsizes (N), population growth rates (λ), and data-filtering methods (LDRAD mutation, 10% missing, and 50% missing data sets).
RADseq demography estimation

Fastsimcoal2
Estimation of bNe at t20 under a λ= 1.0 population modelwas most influenced by the number of SNPs included in theSFS (Fig. 2a, b, c) and, therefore, the allele dropout filteringscenario was used (Fig. 2S A–C). Overall, the fsc2 RADmutation and fsc2 RAD mutation and coverage data setsyielded similar precision and accuracy compared to datasets using a similar number of randomly chosen SNPs fromthe fsc2 complete data set. Increased individual samplinghad a slight improvement on accuracy and/or precisionunder all three population size models. However, analysisof 60-individual data sets in combination with lower num-bers of SNPs (5000 and 10,0000), including the fsc2 RADmutation and coverage data sets, yielded a very wide rangeof estimates under all three population size models, withhighly inaccurate and negatively biased estimates under a n= 250 model. In general, accuracy and precision in allscenarios proportionally decreased with the number ofSNPs in the data set.
The 150,000 SNP data set yielded the lowest RMSEvalues for the n= 250 and n= 500 population models, andwhen sampling 60 individuals in the n= 1000 model (Table3). Subsampled SNP data sets with 25,000 or more SNPsyielded only small decreases in RMSE with increasingnumbers of SNPs. In the allele dropout data sets, the fsc2complete data set yielded the lowest RMSE values for the n= 250 and n= 500 population models, and when sampling60 individuals in the n= 1000 model (Table S5). Overall,fsc2 RAD mutation and fsc2 RAD mutation and coveragedata sets had similar RMSE values.
Declining population size estimation
LD-based estimation
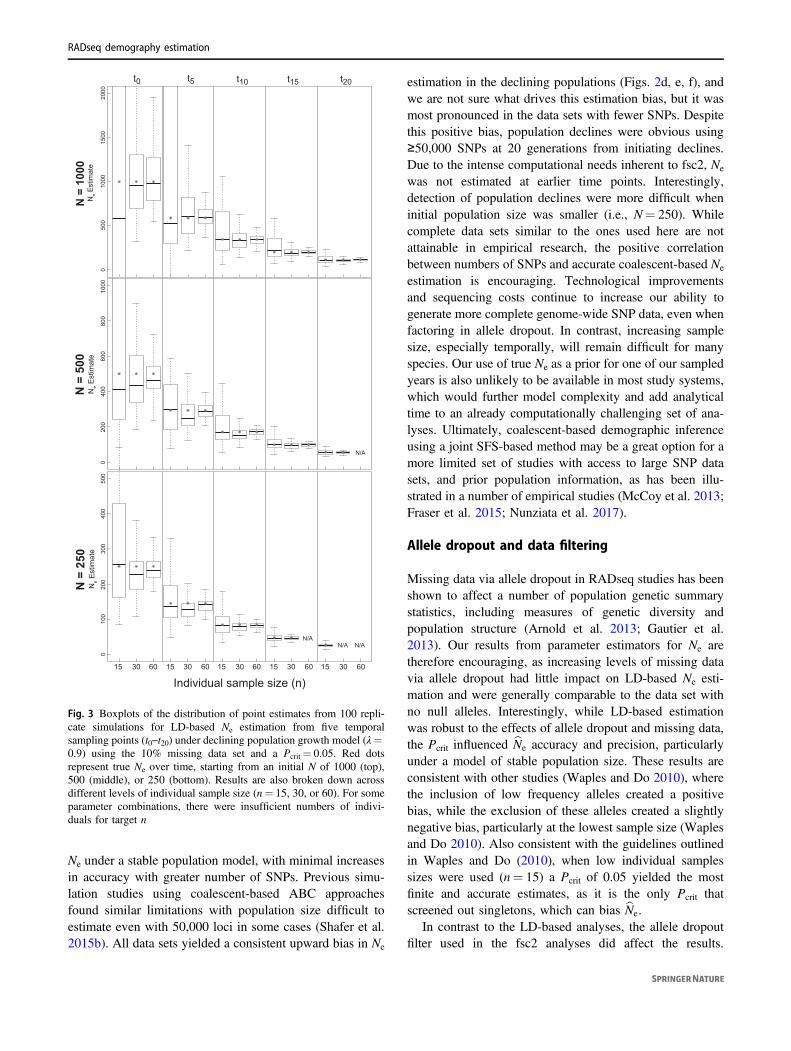
The number of generations since the beginning of a popu-lation decline was the biggest factor affecting the accuracyand precision of bNe estimation (Fig. 3, Figs. S3–S5), withthe variance in estimates decreasing over time as populationsize declined. Individual sampling also affected results, withan n= 15 yielding a greater estimation variance, particu-larly in earlier generations of the decline. Estimation usingan n= 30 or 60 produced highly accurate estimates of bNe int10 through t20. In general, bNe estimation over time was onlyminimally affected by the initial population size, the miss-ing data filter used, or the Pcrit used. However, with indi-vidual samples size of n= 15 a Pcrit of 0.05 lead to a greaterproportion of finite bNe (Table S8–S10).
Similarly, estimation of bλ over different time intervalswas most influenced by the number of generations passingbetween sampling events. The data filter used had minimalimpact on the accuracy of bλ estimation and we presentresults from analyses of the 10% missing data here (Table 4)with results from analysis of additional allele dropout datasets presented in Tables S6–S7. When sampling 30–60individuals, the Pcrit did not have a large impact on popu-lation trend detection, but with an individual samples size of15, a Pcrit of 0.05 improved population trend detection. Forexample, when sampling 15 individuals, populationdeclines with an initial n ≤ 500 were detected 67% of thetime when at least ten generations passed, and increased to85% of the time when 20 generations passed. With n= 15and an initial n= 1000, at least 20 generations must pass forpopulation declines to be detected 64% of the time. How-ever, with n= 15 using a Pcrit of 0.05 also increased the
Table 2 RMSE values for all filtering scenarios for LD-based analysis in NeEstimator under a stable population (λ= 1.0)
LD RAD mutation 10% missing data 50% missing data
(&Pcrit level) (&Pcrit level) (&Pcrit level)
0.01 0.02 0.05 0.01 0.02 0.05 0.01 0.02 0.05
N= 250 n= 15 2.73E−03 2.73E−03 2.95E−03 3.41E−03 3.41E−03 2.73E−03 3.68E−03 3.68E−03 2.70E−03
n= 30 1.41E−03 1.10E−03 1.25E−03 1.55E−03 1.11E−03 1.18E−03 1.532E−03 1.11E−03 1.23E−03
n= 60 6.88E−04 6.17E−04 6.10E−04 1.55E−03 1.11E−03 1.18E−03 1.53E−03 1.11E−03 1.23E−03
N= 500 n= 15 Inf. Inf. 1.60E−03 Inf. Inf. 1.54E−03 Inf. Inf. 1.62E−03
n= 30 9.65E−04 7.98E−04 8.41E−04 1.16E−03 7.79E−04 8.06E−04 1.16E−03 7.79E−04 8.15E−04
n= 60 4.59E−04 4.63E−04 4.40E−04 4.99E−04 4.56E−04 4.54E−04 5.02E−04 4.47E−04 4.43E−04
N= 1000 n= 15 Inf. Inf. 1.99E−03 Inf. Inf. 1.84E−03 Inf. Inf. 1.87E−03
n= 30 6.65E−04 7.76E−04 8.90E−04 8.03E−04 7.44E−04 7.87E−04 8.23E−04 7.32E−04 8.14E−04
n= 60 3.01E−04 3.14E−04 3.04E−04 8.03E−04 7.44E−04 7.87E−04 8.23E−04 7.32E−04 8.14E−04
Bold values identify the lowest RMSE for a particular combination of population size (N), individual sampling level (n), and minor allelefrequency cutoff (Pcrit). Bold and italicized values identify the lowest RMSE for a particular population size. RMSE was not estimated if over 50%of the estimates of bNe reached infinity for a particular parameter combination (Inf.)
S. O. Nunziata and D. W. Weisrock

false positive rate, where stable populations were incor-rectly identified as declining with bλ estimates of o0.95across many replicates (Table 5, Tables S11–S12).Increased individual sampling greatly improved the correctidentification of a declining population. For example, underan n= 1000 model, sampling 60 individuals resulted in thecorrect identification of a population decline 495% of the
time when 10 generations passed and correct identification471% of the time after just five generations.
Fastsimcoal2
The accuracy of bNe at t20 was most influenced by thenumber of SNPs included in the joint SFS (Figs. 2d, e, f),
Fig. 2 Boxplots of the distribution of fastsimcoal2 estimates of bNe att20 from 40 replicate temporal simulations. a–cbNe estimates under astable population size (λ= 1.0) for population sizes of (a) 1000, (b)500, and (c) 250. d–fbNe estimates under declining population size (λ=0.9), for initial population size of (d) 1000, (e) 500, and (f) 250. Red
dots represent the true Ne at t20. Results are broken down across thenumber of individuals sampled (identified at the top of each panel) andthe different numbers of SNPs used in analysis (identified at the bot-tom of each panel). For some parameter combinations, there wereinsufficient numbers of individuals for target n
RADseq demography estimation

and therefore also the allele dropout filter used (Fig. S2 D-F). Estimates of bNe at t20 were positively biased across alldata sets, with greater bias in data sets with fewer numbersof SNPs. Similarly, estimation of bλ was most influenced bythe number of SNPs included in the joint SFS. Whensampling 5000–10,000 SNPs, population declines weredetected o50% of the time across most scenarios (TableS13). With samples of 50,000–150,000 SNPs, populationdeclines were detected across most replicates for an initial Nof 500 and 1000. Population declines were not reliablydetected for an initial N of 250 for any sampling scenario.For the allele dropout data sets, population declines of bλ o0.95 were detected across all 40 analyzed replicates usingthe fsc2 complete data set (Fig. S2 D–F). In contrast, noneof the replicates for either fsc2 RAD mutation, or fsc2 RADmutation and coverage data sets meet our criteria of bλ o0.95, although most qualitatively indicated decline relativeto Ne at t0. Stable populations were never identified asdeclining in any data set examined.
Discussion
Our results demonstrate that RADseq data have the poten-tial to improve the inference of population demography andthe detection of population declines on a very recent timescale. The linkage disequilibrium and coalescent methodswe applied to estimate Ne use largely different sources ofinformation from genomic data sets. The relative perfor-mance of these methods was influenced by different factorsrelated to the study design, such as the number of indivi-duals sampled (important for LD-based estimation) and theamount of variable data generated (important for coalescentestimation). Given that the accuracy and precision of Ne
estimators hinge on aspects of the study design and theunderlying population history, we further discuss theseinfluences and provide guidelines for inferring Ne and
population size trends. While we compare and contrast theperformance of both estimators, combining results fromboth methods in empirical studies may be the best approachto develop an encompassing view of overall populationdemographic history, as suggested by Waples (2016).
Performance of estimators
In our analysis of RADseq data, LD-based demographicinference generally outperformed coalescent-based infer-ence for Ne estimation and the detection of populationdeclines. However, there were limitations with LD-basedinference, most notably with the number of sampled indi-viduals required to provide both accurate and preciseresults. Sampling of 15 individuals led to large variance inestimates. This was most evident under a stable populationsize and in early generations of a population decline, par-ticularly when population size was large (e.g., N= 1000). Incontrast, increasing sampling to 30 individuals greatlyincreased the accuracy and precision of Ne estimates. Thismay be discouraging from the perspective of sampling, asmany-population genetic studies sample far fewer than 30individuals per population. However, in light ofmicrosatellite-based simulations showing that 30 indivi-duals resulted in largely biased Ne estimation (Tallmon et al.2010), LD-based analysis of RADseq appears to providenew opportunities for accurate demographic inference.
In contrast, coalescent-based Ne estimation (using fsc2)was not greatly affected by the number of individualssampled, with highly precise Ne estimates produced using asfew as 15 individuals. This result is similar to thoseobtained with ABC estimates based on large genomic datasets (Robinson et al. 2014). The most significant limitationfor the coalescent approach was the number of SNPs in thejoint SFS, and therefore the data filter used. We found thatsampling 25,000 SNPs, and in some cases as many as50,000 SNPs, were required to obtain accurate estimates of
Table 3 RMSE values for increasing number of SNPs using fastsimcoal2 under a stable population (λ= 1.0)
5000 10,000 25,000 50,000 100,000 150,000
N= 250 n= 15 0.000357 0.000357 0.000267 0.000201 0.000136 0.000101
n= 30 0.000118 0.000234 0.000178 0.00014 0.000103 8.58E−05
n= 60 0.000738 0.000367 0.000153 6.30E−05 6.14E−05 5.73E−05
N= 500 n= 15 0.000233 0.00017 0.000105 0.000153 0.000152 0.000147
n= 30 0.00019 6.69E−05 8.29E−05 6.43E−05 6.10E−05 8.13E−05
n= 60 0.000352 0.000191 8.78E−05 5.30E−05 5.33E-05 5.28E-05
N= 1000 n= 15 0.000217 0.000208 0.000217 0.000208 0.00022 0.000234
n= 30 0.000205 8.59E−05 9.19E−05 9.73E−05 0.000115 0.000113
n= 60 0.000188 1.18E−04 4.66E−05 4.04E-05 4.52E−05 5.50E−05
Bold values identify the lowest RMSE for a particular combination of population size (N) and individual sampling level (n). Bold and italicizedvalues identify the lowest RMSE for a particular population size
S. O. Nunziata and D. W. Weisrock
Ne under a stable population model, with minimal increasesin accuracy with greater number of SNPs. Previous simu-lation studies using coalescent-based ABC approachesfound similar limitations with population size difficult toestimate even with 50,000 loci in some cases (Shafer et al.2015b). All data sets yielded a consistent upward bias in Ne
estimation in the declining populations (Figs. 2d, e, f), andwe are not sure what drives this estimation bias, but it wasmost pronounced in the data sets with fewer SNPs. Despitethis positive bias, population declines were obvious using≥50,000 SNPs at 20 generations from initiating declines.Due to the intense computational needs inherent to fsc2, Ne
was not estimated at earlier time points. Interestingly,detection of population declines were more difficult wheninitial population size was smaller (i.e., N= 250). Whilecomplete data sets similar to the ones used here are notattainable in empirical research, the positive correlationbetween numbers of SNPs and accurate coalescent-based Ne
estimation is encouraging. Technological improvementsand sequencing costs continue to increase our ability togenerate more complete genome-wide SNP data, even whenfactoring in allele dropout. In contrast, increasing samplesize, especially temporally, will remain difficult for manyspecies. Our use of true Ne as a prior for one of our sampledyears is also unlikely to be available in most study systems,which would further model complexity and add analyticaltime to an already computationally challenging set of ana-lyses. Ultimately, coalescent-based demographic inferenceusing a joint SFS-based method may be a great option for amore limited set of studies with access to large SNP datasets, and prior population information, as has been illu-strated in a number of empirical studies (McCoy et al. 2013;Fraser et al. 2015; Nunziata et al. 2017).
Allele dropout and data filtering
Missing data via allele dropout in RADseq studies has beenshown to affect a number of population genetic summarystatistics, including measures of genetic diversity andpopulation structure (Arnold et al. 2013; Gautier et al.2013). Our results from parameter estimators for Ne aretherefore encouraging, as increasing levels of missing datavia allele dropout had little impact on LD-based Ne esti-mation and were generally comparable to the data set withno null alleles. Interestingly, while LD-based estimationwas robust to the effects of allele dropout and missing data,the Pcrit influenced bNe accuracy and precision, particularlyunder a model of stable population size. These results areconsistent with other studies (Waples and Do 2010), wherethe inclusion of low frequency alleles created a positivebias, while the exclusion of these alleles created a slightlynegative bias, particularly at the lowest sample size (Waplesand Do 2010). Also consistent with the guidelines outlinedin Waples and Do (2010), when low individual samplessizes were used (n= 15) a Pcrit of 0.05 yielded the mostfinite and accurate estimates, as it is the only Pcrit thatscreened out singletons, which can bias bNe.
In contrast to the LD-based analyses, the allele dropoutfilter used in the fsc2 analyses did affect the results.
Fig. 3 Boxplots of the distribution of point estimates from 100 repli-cate simulations for LD-based Ne estimation from five temporalsampling points (t0–t20) under declining population growth model (λ=0.9) using the 10% missing data set and a Pcrit= 0.05. Red dotsrepresent true Ne over time, starting from an initial N of 1000 (top),500 (middle), or 250 (bottom). Results are also broken down acrossdifferent levels of individual sample size (n= 15, 30, or 60). For someparameter combinations, there were insufficient numbers of indivi-duals for target n
RADseq demography estimation

However, allele dropout data sets did not appear to createany systematic bias compared to data sets using a similarnumber of randomly chosen SNPs from the fsc2 completedata set. Because these analyses preclude the use of lociwith missing data, the direct impact of filtering loci by alleledropout was a major reduction of the number of SNPsincluded in the joint SFS. Contemporary populationdeclines purge rare alleles, creating a predictable signaturein the SFS (Nei et al. 1975; Gattepaille et al. 2013), with thelikelihood of detecting this signature increasing with thenumber of SNPs included in the data set. We found that Ne
estimation was accurate, and declines were reliably detec-ted, using our data set containing ≥50,000 SNPS. Thegeneration of empirical data sets robust enough to detect
population declines may, therefore, require increasedsequencing efforts to offset the effects of allele dropout byincreasing the number of loci sampled and their coverage.Maybe counter intuitively, increased individual samplingdoes not solve this problem as adding individuals increasesthe probability of allele dropout through a cut site mutationor insufficient sequencing coverage, creating a smaller SNPmatrix and decreasing precision in bNe (Fig. 2S). Potentially,this result can be overcome by subsampling individuals fornon-missing data (e.g., Papadopoulou and Knowles 2015).
Allele dropout often goes undetected in many studies,and our preliminary exploration suggests that the under-lying population history of either stable or decliningpopulations were recovered and point estimates were almost
Table 4 Number of times that a declining population trend was correctly identified out of 100 replicate runs for LD-based analysis in NeEstimatorunder a declining population model (λ= 0.9)
t0–t5 t0–t10 t0–t15 t0–t20
(&Pcrit level) (&Pcrit level) (&Pcrit level) (&Pcrit level)
0.01 0.02 0.05 0.01 0.02 0.05 0.01 0.02 0.05 0.01 0.02 0.05
N= 250 n= 15 49 49 68 63 63 83 71 71 95 72 72 99
n= 30 86 79 79 99 94 93 100 100 100 — — —
n= 60 94 94 94 100 100 100 — — — — — —
N= 500 n= 15 8 8 48 18 18 67 25 25 79 29 29 85
n= 30 79 73 72 94 84 86 100 99 98 100 99 99
n= 60 80 81 84 97 98 98 100 100 100 — — —
N= 1000 n= 15 0 0 35 0 0 40 2 2 53 2 2 64
n= 30 57 65 66 70 80 79 76 91 91 78 97 97
n= 60 71 73 74 96 95 96 100 100 100 100 100 100
Results are presented for increasing intervals of time and by the combination of population size (N), individual sampling level (n), and minor allelefrequency cutoff (Pcrit). Results are based on the analysis of data sets with 10% missing data.
For some parameter combinations, there were insufficient numbers of individuals for target n (—)
Table 5 Number of times that a population trend was incorrectly identified as declining out of 100 replicate runs for LD-based analysis inNeEstimator under a stable population model (λ= 1.0)
t0–t5 t0–t10 t0–t15 t0–t20
(&Pcrit level) (&Pcrit level) (&Pcrit level) (&Pcrit level)
0.01 0.02 0.05 0.01 0.02 0.05 0.01 0.02 0.05 0.01 0.02 0.05
N= 250 n= 15 26 26 38 24 24 29 24 24 24 20 20 10
n= 30 29 27 25 20 13 12 15 9 8 3 1 1
n= 60 8 9 8 1 1 1 1 1 1 0 0 0
N= 500 n= 15 1 1 38 0 0 32 2 2 29 3 3 23
n= 30 47 41 43 36 21 22 29 16 15 20 8 8
n= 60 26 24 27 6 6 6 1 1 1 0 0 0
N= 1000 n= 15 1 1 20 0 0 12 0 0 10 0 0 9
n= 30 16 36 37 11 30 28 16 27 27 7 18 18
n= 60 21 18 25 14 13 12 4 4 4 1 1 0
Results are presented for increasing intervals of time and by combination of population size (N), individual sampling level (n), and minor allelefrequency cutoff (Pcrit). Results are based on the analysis of data sets with 10% missing data.
S. O. Nunziata and D. W. Weisrock

always within an order of magnitude of real Ne. Previoussimulation work has revealed that non-equilibrium demo-graphy, such as a population decline, can cause low Ne andresult in fewer loci with missing data and more accurateallele frequency estimation (Arnold et al. 2013). Therefore,our findings should not be interpreted as applicable acrosssystems, since we may have modeled scenarios (i.e., low Ne,steadily declining) that create evident signatures in the SFSat a contemporary time scale.
Practical considerations
Many additional factors influence Ne that we have notmodeled here, including selection, migration, and over-lapping generations (Slatkin 2008). In real populations, Ne
rarely equals NC, and changes in Ne could track any numberof demographic changes, not exclusively NC (Palstra andRuzzante 2008). Further simulations are needed under morerealistic scenarios to determine the application of evaluatedmethods across systems. One factor that must be consideredwith RADseq data sets and the LD-based approach is thatalthough pairwise r2 values (correlation of genes withinindividuals) increase with number of loci, SNPs on the samechromosome are not independent and will reduce the pre-cision of bNe because LD will be the result of physicallinkage and not drift (Waples et al. 2016). The use of linkedSNPs could be corrected for by using known genomicarchitecture (Waples et al. 2016); and is an important con-sideration in the application of LD-based Ne estimation toRADseq data.
Both LD and coalescent methods produced a time lagbetween census size declines and corresponding decline inNe. The LD-based method has potential for accuratedetection of population declines, generally after only 10generations from initiation of a decline. However, ifworking with long-lived species with long-generation times,these 10 generations could equate to several decades withinwhich populations could decline rapidly toward extinctionwith a little change in Ne. Given these findings, weemphasize that genomic monitoring is not a replacement fortraditional census size monitoring in many cases, but mayserve as an informative complement.
When inferring bλ from bNe for conservation purposes,false positives can lead to a waste of management resourceswhen stable populations are misidentified as declining(Schwartz et al. 2007). The absence of any false positives inthe fsc2-based λ estimation, and the lower number ofindividuals required, is promising for its application inconservation studies. However, the failure to detect declinesin most replicates with o25,000 SNPs highlights the needfor very large SNP data sets, as well as temporal sampling,especially if quick detection of population declines is a goal.False positives for LD-based λ estimates were also low,
although this typically required larger sample sizes of atleast 30 individuals. With large resources available toresearchers, the application of both methods for demo-graphic inference will be the ideal approach to take, butgiven constraints on sampling or sequencing, the resultshere can be useful for guiding decisions about how todesign a conservation genetic study aimed at detectingrecent population declines. Finally, even when temporalsampling is unavailable, Ne is itself an important indicatorof population viability and evolutionary potential andRADseq data can serve as a valuable source of informationfor this parameter.
Data archiving
All simulation scripts Data available from the Dryad DigitalRepository: https://doi.org/10.5061/dryad.6d925.
Acknowledgements We thank D. Herring and three anonymousreviewers for constructive comments on this manuscript. We thank theUniversity of Kentucky Center for Computational Sciences and theLipscomb High-Performance Computing Cluster for access to com-puting resources, and Vikram Gazula for help with script optimization.This research was supported by the National Science Foundationthrough a DDIG award (DEB-1601470 to S.O.N.), and by awardsDEB-0949532 and DEB-1355000 (to D.W.W.).
Compliance with ethical standards
Conflict of interest The authors declare that they have no conflict ofinterest.
References
Andreotti S, Rutzen M, Van der Walt S, von der Heyden S, HenriquesR, Meÿer M, Oosthuizen H, Matthee CA (2016) An integratedmark-recapture and genetic approach to estimate the populationsize of white shark in South Africa. Mar Ecol Progress Ser552:241–253
Andrews KR, Good JM, Miller MR, Luikart G, Hohenlohe PA (2016)Harnessing the power of RADseq for ecological and evolutionarygenomics. Nat Rev Genet 17:81–92
Antao T, Pérez-Figueroa A, Luikart G (2011) Early detection ofpopulation declines: high power of genetic monitoring usingeffective population size estimators. Evol Appl 4:144–154
Arnold B, Corbet-Detig RB, Hartl D, Bomblies K (2013) RAD-sequnderestimates diversity and introduces genealogical biases dueto nonrandom haplotype sampling. Mol Ecol 22:3179–3190
Davey JW, Hohenlohe PA, Etter PD, Boone JQ, Catchen JM, BlaxterML (2011) Genome-wide genetic marker discovery and geno-typing using next-generation sequencing. Nat Rev Genet12:499–510
Do C, Waples RS, Peel D et al. (2014) NeEstimator V2: re-implementation of software for the estimation of contemporaryeffective population size (Ne) from genetic data. Mol Ecol Resour14:209–214
Dudgeon CL, Ovenden JR (2015) The relationship between abundanceand genetic effective population size in elasmobranchs: anexample from the globally threatened zebra shark Stegostoma
RADseq demography estimation
fasciatum within its protected range. Conserv Genet16:1443–1454
Excoffier L, Dupanloup I, Huerta-Sanchez E, Sousa VC, Foll M(2013) Robust demographic inference from genomic and SNPdata. PLoS Genet 9:e1003905
Fraser BA, Kunstner A, Reznick DN, Dreyer C, Weigel D (2015)Population genomics of natural and experimental populations ofguppies (Poecilia reticulata). Mol Ecol 24:389–408
Gautier M, Gharbi K, Cezard T et al. (2013) The effect of RAD alleledropout on the estimation of genetic variation within and betweenpopulations. Mol Ecol 22:3165–3178
Gattepaille LM, Jakobsson M, Blum MGB (2013) Inferring populationsize changes with sequence and SNP data: lessons from humanbottlenecks. Heredity 110:409–419
Gutenkunst RN, Hernandez RD, Williamson SH, Bustamante CD(2009) Inferring the joint demographic history of multiplepopulations from multidimensional SNP frequency data. PLoSGenet 5:1–11
Hill WG (1981) Estimation of effective population size from data onlinkage disequilibrium. Genet Res 38:209–216
Hoban SM, Gaggiotti OE, Bertorelle G (2013) The number of markersand samples needed for detecting bottlenecks under realisticscenarios, with and without recovery: a simulation-based study.Mol Ecol 22:3444–3450
Hollenbeck CM, Portnoy DS, Gold JR (2016) A method for detectingrecent changes in contemporary effective population size fromlinkage disequilibrium at linked and unlinked loci. Heredity117:207–216
Huang H, Knowles LL (2014) Unforeseen consequences of excludingmissing data from next-generation sequences: simulation Study ofRAD Sequences. Syst Biol 65:357–365
Kopuchian C, Campagna L, Di Giacomo AS et al. (2016) Demo-graphic history inferred from genome-wide data reveals twolineages of sheldgeese endemic to a glacial refugium in thesouthern Atlantic. J Biogeogr 43:1979–1989
Lischer HEL, Excoffier L (2012) PGDSpider: an automated dataconversion tool for connecting population genetics and genomicsprograms. Bioinformatics 28:298–299
Luikart G, Ryman N, Tallmon DA, Schwartz MK, Allendorf FW(2010) Estimation of census and effective population sizes: theincreasing usefulness of DNA-based approaches. Conserv Genet11:255–373
McCoy RC, Garud NR, Kelley JL, Boggs CL, Petrov D (2013)Genomic inference accurately predicts the timing and severity ofa recent bottleneck in a nonmodel insect population. Mol Ecol23:136–150
Nachman MW, Crowell SL (2000) Estimate of the mutation rate pernucleotide in humans. Genetics 156:297–304
Narum SR, Buerkle CA, Davey JW, Miller MR, Hohenlohe PA (2013)Genotyping-by-sequencing in ecological and conservation geno-mics. Mol Ecol 22:2841–2847
Nei M, Maruyama T, Chakraborty R (1975) The bottleneck effect andgenetic variability in populations. Evolution 29:1–10
Nordborg M, Krone SM (2002) Separation of time scales and con-vergence to the coalescent in structured populations. In: SlatkinM, Veuille M (eds) Modern developments in theoretical popu-lation genetics. Oxford University Press, Oxford, p 130–164
Nunziata SO, Lance SL, Scott DE, Lemmon EM, Weisrock DW(2017) Genomic data detect corresponding signatures of popu-lation size change on an ecological time scale in two salamanderspecies. Mol Ecol 26:1060–1074
Palstra FP, Ruzzante DE (2008) Genetic estimates of contemporaryeffective population size: what can they tell us about the
importance of genetic stochasticity for wild population persis-tence? Mol Ecol 17:3428–3447
Papadopoulou A, Knowles LL (2015) Genomic tests of the species-pump hypothesis: recent island connectivity cycles drive popu-lation divergence but not speciation in Caribbean crickets acrossthe Virgin Islands. Evolution 69:1501–1517
Peng B, Kimmel M (2005) simuPOP: a forward-time populationgenetics simulation environment. Bioinformatics 21:3686–3687
Pool JE, Hellmann I, Jensen JD, Nielsen R (2010) Population geneticinference from genomic sequence variation. Genome Res20:291–300
Prates I, Xue AT, Brown JL, Alvarado-Serrano DF, Rodrigues MT,Hickerson MJ, Carnaval AC (2016) Inferring responses to climatedynamics from historical demography in neotropical forestlizards. Proc Natl Acad Sci USA 113:7978–7985
Robinson JD, Coffman AJ, Hickerson MJ, Gutenkunst RN (2014)Sampling strategies for frequency spectrum-based populationgenomic inference. BMC Evol Biol 14:254
Rokas A, Abbot P (2009) Harnessing genomics for evolutionaryinsights. Trends Ecol Evol 24:192–200
Schwartz MK, Luikart G, Waples RS (2007) Genetic monitoring as apromising tool for conservation and management. Trends EcolEvol 22:25–33
Shafer ABA, Wolf JBW, Alves PC et al. (2015a) Genomics and thechallenging translation into conservation practice. Trends EcolEvol 30:78–87
Shafer ABA, Gattepaille LM, Stewart RE, Wolf JB (2015b) Demo-graphic inferences using short-read genomic data in an approx-imate Bayesian computation framework: in silico evaluation ofpower, biases and proof of concept in Atlantic walrus. Mol Ecol24:328–345
Shafer ABA, Peart CR, Tusso S, Maayan I, Brelsford A, Wheat CW,Wolf JBW (2017) Bioinformatic processing of RAD-seq datadramatically impacts downstream population genetic inference.Methods Ecol Evol 8:907–917
Slatkin M (2008) Linkage disequilibrium – understanding the evolu-tionary past and mapping the medical future. Nat Rev Genet9:477–485
Tallmon DA, Gregovich D, Waples RS et al. (2010) When are geneticmethods useful for estimating contemporary abundance anddetecting population trends? Mol Ecol Resour 10:684–692
Trucchi E, Facon B, Gratton P, Mori E, Stenseth NC, Jentoft S (2016)Long live the alien: is high genetic diversity a pivotal aspect ofcrested porcupine (Hystrix cristata) long-lasting and successfulinvasion? Mol Ecol 25:3527–3539
Wakeley J, Sargsyan O (2009) Extensions of the coalescent effectivepopulation size. Genetics 181:341–345
Waples RS (2005) Genetic estimates of contemporary effectivepopulation size: to what time periods to estimates apply? MolEcol 14:3335–3352
Waples RS (2006) A bias correction for estimates of effective popu-lation size based on linkage disequilibrium at unlinked gene loci.Conserv Genet 7:167–184
Waples RS, Do C (2010) Linkage disequilibrium estimates of con-temporary Ne using highly variable genetic markers: a largelyuntapped resource for applied conservation and evolution. EvolAppl 3:244–262
Waples RK, Larson WA, Waples RS (2016) Estimating contemporaryeffective population size in non-model species using linkagedisequilibrium across thousands of loci. Heredity 117:233–240
Waples RS (2016) Making sense of genetic estimates of effectivepopulation size. Mol Ecol 25:4689–4691
S. O. Nunziata and D. W. Weisrock