Embed Size (px)
Citation preview

ESTIMATING THE FAIR RATE OF RETURN FOR A'SUBSIDIARY OF A PUBLIC UTILITY HOLDING COMPANY
Eugene F~ Brigham and Dilip K. Shame
Public Utility Research CenterUniversity of ~lorida
January 1982
PURC Working paper 1-82
ESTIMATING THE FAIR RATE OF RETURN FOR ASUBSIDIARY OF A PUBLIC UTILITY HOLDING COMPANY
Eugene F. Brigham and-Dilip K. Shome
Electric utilities and- telephone companies are natural
I, 1
monopo leSe Therefore, they have the potential to charge
excessive prices for their services and, hence, to exploit
the public. To prevent any such abuses, these companies
have been subjected to regulation almost since their inception.
As a rule, public utility regulation relates to both service
standards and prices: (I) minimum standards for service are
prescribed, and the utilities must provide service at the
stated levels to all customers who desire service, and (2)
the prices they may charge for this service are designed by
regulatory authori ties to enable the coro~panies to earn the
cost of the capital required to provide this service.
lThe telephone industry has always been subjected to competitionfor certain of its services, and the extent of competitionhas increased sharply in recent years. Still, telephonecompanies do have a monopoly position in certain markets,especially the market for local telephone service.
-2-
It has long been recognized that a holding company
which owns both regulated utility operations and manufac
turing/supply subsidiaries which provide products or services
to the utility could, theoretically, thwart the regulatory
process. For example, Pacific Power & Light, TECO Ener~J,
and other holding companies which own both electric utilities
and non-regulated coal mining/transportation subsidiaries
could, in theory, earn excessive returns by having their
utility sUbsidiarie~_ buy coal at excessive prices from
their coal subsidiaries. The regulated utility....,would appear
to be earning only reasonable returns, but of course the
owners of the utility would be earning excessive returns.
Similarly, telephone holding companies such as AT&T and
GT&E could have their manufacturing subsidiaries charge
prices to their operating telephone companies that would
cause the manufacturing subsidiaries to earn very excessive
returns on their capital. The operating telephone companies
might then appear to be earning reasonable rates of return,
but the parent companies might be earning excessive profits
overall because of the high returns on their manufacturing
operations.
Recognizing this potential problem, regulators have
for many years scrutinized unregulated subsidiaries'
rates of return. If the subsidiaries were found to
have earned excessive profits, then regulators would
-3-
reduce the rate bases of the operating companies by the
amount of these excessive profits, thus constraining the
entire holding company enterprise to a reasonable rate of
return.
The practical question facing regulators is this: What
is a fair rate of return for the unregulated subsidiaries?
This is the issue we address in this paper. Although we are
interested in the broadest aspects of the question, we
concentrate our analysis on AT&T/Western Electric for four
reasons. First, Western is by far the largest subsidi
ary/supplier in the utility industry. Second, more data are
available on Western, and they go back further, than is true
of other subsidiaries. Third, the issue of Western's
profits and rate of return is an active one today in a
number of actual rate cases. And, fourth, the basic methodology
as applied to Western could be used, with minor modifications,
in other situations involving regulated and unregulated
subsidiaries alike.
Subsidiary versus Consolidated Approach
Two basic, and fundamentally different, approaches
could be taken to the issue of a proper rate of return for
a non-utility subsidiary: (1) Use the consolidated approach,
under which one treats the entire holding company operation
as a single enterprise and allows the same rate of return to
all subsidiaries. (2) Use the subsidiary approach, under

-4-
which one regards each subsidiary as a separate entity and
allows each to earn a rate of return that is appropriate for
it, given its own risk characteristics.
The consolidated approach has the major advantage of
being relatively simple and easy to apply. However, this
approach is conceptually unsound for a number of reasons:
1. Operations such as manufacturing, mining, and trans
portation are quite different from regular utility
operations. In general, the business risk/~ssociated
with utilities is relatively small, which permits them
to employ more debt, which in turn increases the
utilities' financial risk. Because of these differences
in business and financial risks, one would expect to
find different degrees of overall risk, hence differences
in the cost of capital, in the utility and non-utility
segments of a holding company system.
2. If the risks vary for the different units of a holding
company system, then economic efficiency requires that
the different units earn different rates of return in
order to recognize their different costs of caoital.
Otherwise, there vvould be a tendency for too much capi tal
(from a social standpoint) to flow into the lower risk
operations and too little into the higher risk operations.
-5-
3. It is now generally recognized that competition pro
duces better" results for society than does regulation,
provided a workable degree of competition exists or can
be developed. Therefore, the current trend in all
regulated industries (airlines, railroads, trucking,
telecommunications, gas, and electric) is toward
deregulation. However, competition can only work if
utility holding company systems are structured so as to
permit differential, competitively-determined rates of
return on the different segments of the enterprise.
This fact strongly favors the use of differentiated,
risk-adjusted rates of return for different segments of
holding company systems. Indeed, to use a consolidated
cost'of capital approach for utility regulation would
seriously impede, if not effectively kill, the movement
toward increased competition.
4. Finally, from a purely pragmatic standpoint, historical
precedent in most jurisdictions has been to recognize
differential rates of return for manufacturing/supply
subsidiaries, and a movement away from this position
toward the consolidated view would create some thorny
yet completely unnecessary problems.
-6-
ESTIMATING A FAIR ~~TE OF RETURN FOR WESTERN ELECTRIC
From the late 1800's, when most utility systems were
organized, until the 1960's, the fair rate of return was
estimated almost exclusively by the "comparable earnings"
method. Under this approach, one proceeds as follows: (1)
Determine a set of companies deemed to have investment risks
which are comparable to those of the utility in question.
(2) Calculate the rate of return on average boo~. equity for
each of these comparable companies. (3) Determine the
ave~age rate of return on the sample of comparable companies.
(4) Set service rates for the utility in question such that
it will earn, under normal operating conditions, a rate of
return equal to the average return earned by the comparable
companies.
The comparable earnings approach has two major adv~ntages.
First, it would seem to be inherently fair, as its application
would provide investors in a utility enterprise with the
same rate of return that they would have earned had they put
their capital into other enterprises of comparable risk.
Second, the procedure has been used throughout the utility
industry's history, and there is merit, in any legal or
quasi-legal proceeding, to maintaining established practices
unless there are compelling reasons to break with earlier
precedents.

-7-
On the other hand, the comparable earnings approach
does have drawbacks. First, it is difficult to select a set
of companies whose risks can be demonstrated to be truly
comparable to those of the utility in question. Second,
even if comparability were established, the average book
rate of return for the comparable companies could be higher
or lower than the rate of return the comparable companies
currently require in order to attract capital. To illustrate,
one might conclude that other electric utilities are most
comparable to a given utility, but if all utilities are
ea~ning returns that are below the supply price of capital,
then it would be unreasonable to hold down the earnings of
the company in question to the level of the average utility
company--this is the familiar "circular reasoning" argument.
By the same token, the comparable companies could, over
time, have book returns on investment that exceed their
supply price of capital--in this case, one could logically
argue that the use of .the comparable earnings approach
would result in utility service rates that are higher than
required to attract capital and to compensate the utilities'
investors.
In spite of these problems, the comparable earnings
method cannot be completely rejected as an approach to
estimating the fair rate of return for a regulated utility.
-8-
As already mentioned, there is historical precedent
for its use, and -it continues to be used in many
jurisdictions. In addition, the comparable earnings
method has equity considerations built into it. For
example, even if a group of comparable risk companies
happened to be earning more than their costs of capital,
it could be considered "equitable" for the utility to
earn a comparable return since this is the return which
an investor would have earned had his funds been invested
in the unregulated sector. Also, the utilities must
compete with unregulated companies for capital in the
market. If all product and capital markets were competitive
and efficient, all firms would be earning their costs of
capital and the comparable earnings approach would insure
that the utility would also earn exactly its cost of capital.
However, the ideal level of competition clearly does not
exist in all sectors of the economy, and, therefore, it
is possible that the comparable earnings approach would
result in a recommended rate of return which is fair on
equity considerations, yet higher than the utility's
minimum cost of capital.
Since the 1960's commissions have increasingly chosen
to regulate utilities so as to simulate perfect competition.
Under such regulation, the cost of capital is defined to
be the fair rate of return on invested capital. This has
-9--
led to the use of the "cost of capital" approaches to the
fair rate of return. Here we seek to determine the current
supply price of equity as established in the capital markets,
and then to set utility rates that will enable the company
to earn the market-determined cost of equity on its book
equity capital. The two most commonly used methods for
estimating the market value cost of equity are (1) the DCF
approach and (2) the risk premium approach. Most utility
rate cases today include evidence on comparable earnings
plus one or both of the cost of capital approaches. Therefore,
in. this study we will estimate the fair rate of return for
Western Electric using both the comparable earnings and the
cost of capital approaches.
Comparable Earnings Approach. The traditional approach
to judging the fairness of Western's profits and rate of
return has been the comparable earnings method. In virtually
all state and federal rate cases involving AT&T's subsidiaries,
Western Electric presents testimony which (1) establishes
risk comparability by comparing Western's risk as measured
by sales and/or earnings volatility with those of a group of
large manufacturing companies, then (2) compares Western's
rate o£ return on total invested capital and/or equity to
returns earned by a set of comparable companies. A
-10-
potential criticism of Western's approach is that the
methods used to establish risk comparability reflect only
variability, whereas financial theory indicates that the
covariance of returns on a given enterprise with returns on
other investments also has an important bearing on the risk
of the enterprise. In this study we will use measures of
variability and covariability to establish risk compar
ability.
Cost of Capital Approach. To apply the cost of capital
method, especially the DCF approach, to publicly traded
companies, it is not necessary to establish comparability--
one simply recognizes that market forces take account of
risk differences when security prices are established, so,
to estimate the cost of capital for the company in question,
it is necessary only to add its expected dividend yield to
its expected growth rate. However, for a subsidiary such as
Western, which has no publicly owned stock, the DCF method
cannot be applied directly--we must apply this approach
indirectly, by estimating the DCF cost of capital for a set
of comparable-risk companies and then assigning this cost to
the subsidiary. Thus, in the type of situation that exists
with Western Electric, the cost of capital approach is quite
similar to the traditional comparable earnings approach, the
difference being that ~'Jestern's earnings would be measured
against the average estimated cost of equity of the comparable
companies rather than their average rate of return on book equity.
-11-
We see, then, that to apply either the traditional com-
parable earnings-approach or the cost of capital approach to
a subsidiary such 'as Western it is necessary to establish a
group of comparable-risk companies for use in the analysis.
Western is a manufacturing company, and it seems
reasonable to use as the comparable companies a set of
large, unregulated manufacturers. Fortune Magazine pub-
lishes such a list. For convenience, and also to increase
comparability, we compare Western with the 50 largest
publicly owned manufacturing firms on the Fortune list;
these we call the "Fortune 50" companies. l The set of
included companies is shown in Appendix Table A-I.
Even though we have good a priori reasons for thinking
that Western's business risk would be similar to that of
other large manufacturers such as General Electric, IBM,
General Motors, du Pont, U. S. Steel, and the like, it is
clear that either its product line or its affiliation with
AT&T, or both, could cause its risk to be materially dif-
ferent from that of other manufacturers. Therefore, it is
necessary to run certain tests which measure relative risk.
When structuring tests of rel~tive risk, it is important
to recognize that the riskiness inherent in any firm consists
of two components: (1) systematic or market-determined
risk, which reflects the fact that the economy varies over
1Fortune actually lists all major industrial companies. Toobtain the set of manufacturing firms, we excluded the oiland mining group, which have very different characteristics.Lockheed and LTV were excluded because in rec~nt years theyhad zero projected dividends, which makes the DCF estimateof their equity cost meaningless.
-12-
time and causes the returns of individual firms to move up
and down, and (2) unsystematic or company-specific risk,
which reflects events unique to the firm and its industry.
These two components, when added together, make up the
firm's total risk.
An investor who holds the stock of a firm in a single-
stock portfolio is exposed to the firm's total risk, mea-
sured as the variance of the firm's rate of return. On the
other hand, if an investor holds a well-diversified portfolio,••GiI'·;~
the unsystematic, company-specific risk will be diversified
away, leaving the investor exposed only to the systematic
risk of each stock in the portfolio. The firm's systematic
risk is measured by the covariance of its rate of return
with that of "the market," generally measured by a rea-
sonably large sample of firms. Since studies reported in
the finance literature suggest that both systematic and
unsystematic risk are important to investors, hence affect
firms' costs of capital, we consider both types of risk in
1. 1our ana YS1S.
Total Risk Comparability: Variability of Returns
The variance-type or total risk of an enterprise depends
primarily on three elements: (1) the inherent uncertainty
Isee Pages 20 and 21 for further details and ref~rences.
-13-
in demand for its products, which can be measured by
sales variability over time; (2) its degree of operating
leverage as measured by its ratio of fixed to total costs;
and (3) its use of financial leverage. The first two
factors affect the firm's business risk, while the third
reflects the extent to which business risk is concentrated
on the equity investors.
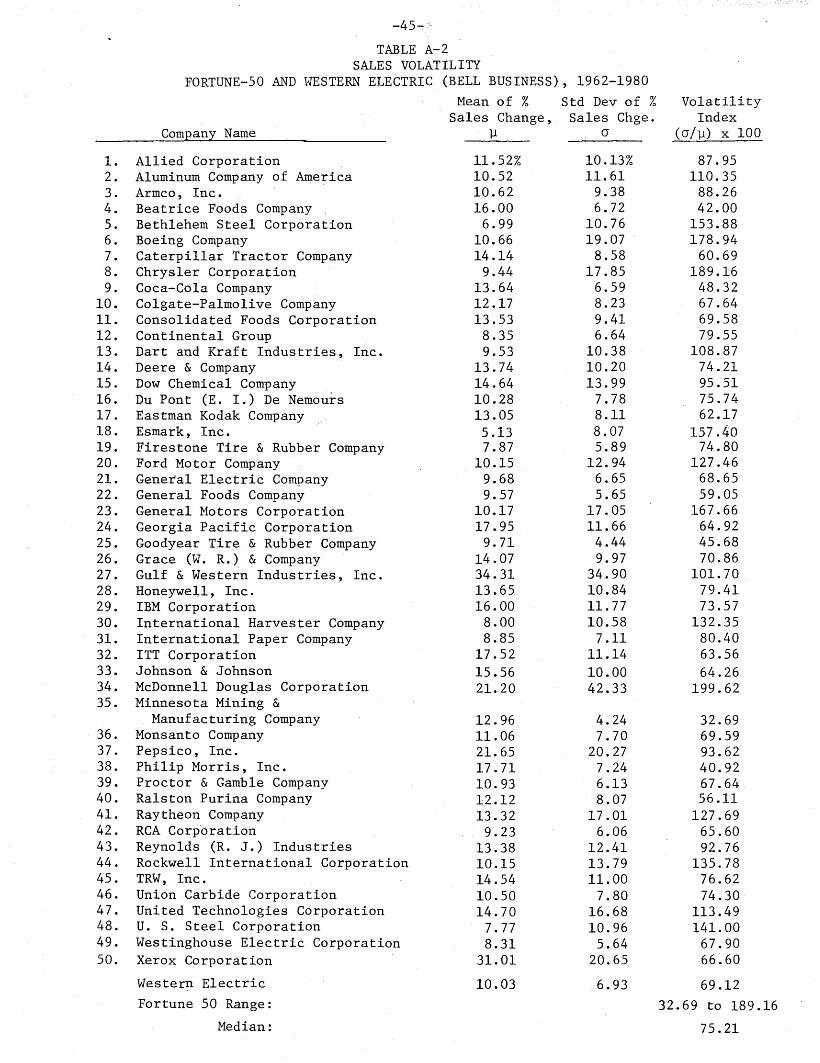
Sales Volatility. Since most companies are growing,
both because of p~oduct market growth and because of
inflation, a meaningful index of sales stability must be
based on the predictability of the sales growth rate.
Accordingly, we (1) calculated for each of the Fortune 50
companies the annual percentage change in sales for each
year; (2) determined each company's mean growth rate, the
standard deviation of this growth rate, and its coefficient
of variation; and (3) ranked the companies by their sales
growth rate volatility, using the coefficient of variation
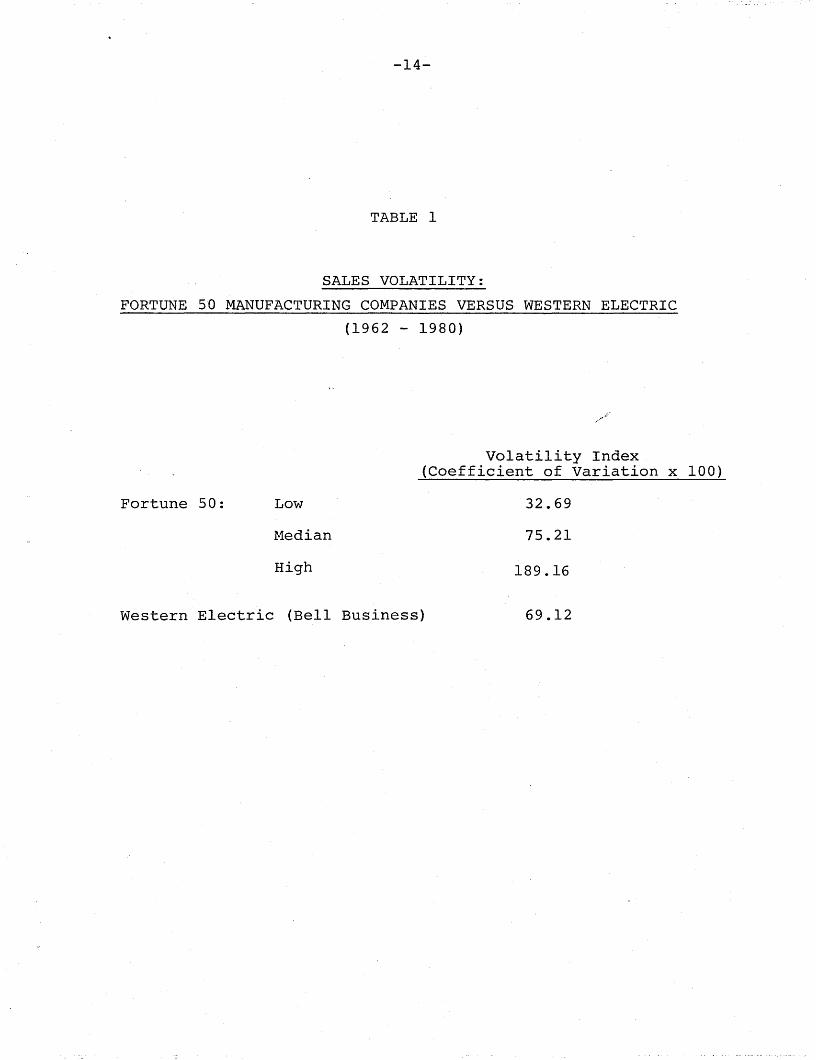
as the index of volatility. Table 1 summarizes the results
of this study over the period 1962-1980; . the full set of
data are given in Appendix Table A-2. The data show that
Western's sales volatility is, on .average, slightly less
than but generally comparable to the sales volatility of
other large manufacturing companies.
Operating Leverage. A company could have relatively
volatile sales, yet still not be very risky if most of its
costs are variable, hence decline when sales drop.
-14-
TABLE 1
SALES VOLATILITY:
FORTUNE 50 MANUFACTURING COMPANIES VERSUS WESTERN ELECTRIC
(1962 - 1980)
Volatility Index(Coefficient of Variation x 100)
Fortune 50: Low
r.1edian
High
32.69
75.21
189.16
Western Electric (Bell Business) 69.12

-15-
Conversely, if a relatively large percentage of its costs
are fixed, hence continue even if sales decline, then a
company's profit volatility can be high even though its
sales are relatively stable. This situation is reflected in
a firm's operating leverage, defined as the ratio of fixed
costs to total costs.
Although the concept of operating leverage is extremely
useful in finance and economics, it can only be applied in a,-
judgmental manner--companies do not report costs broken down
into fixed and variable components, so it is impossible to
measure the degree of operating leverage for comparative
purposes. However, data do exist which can at least give
us an idea about Western's operating leverage vis-a-vis
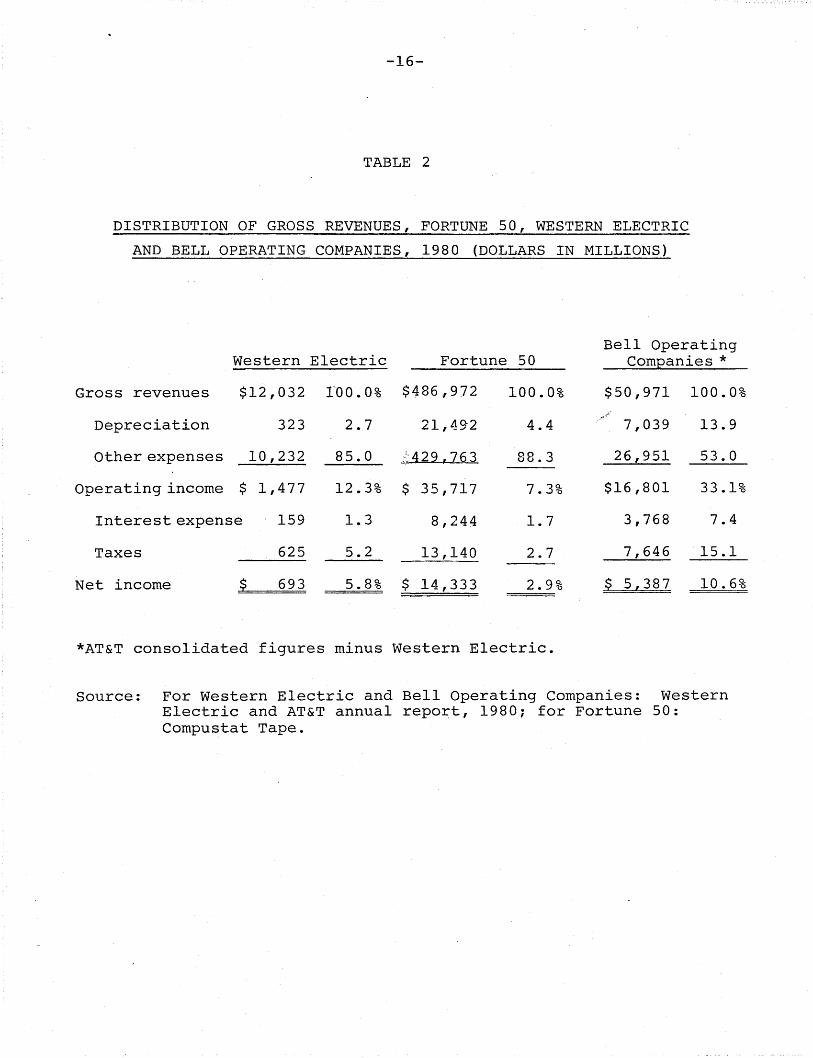
that of the Fortune 50 companies. As shown in Table 2,
Western's depreciation, taxes, wages & materials, and net
income as a percentage of sales are all similar to
those of other manufacturers, but quite different from those
of the telephone companies. Therefore, Table 2 indicates
that Western's operating leverage is in line with that of
other large manufacturers, but quite different from that
of Bell's telephone subsidiaries.
Business Risk. Although its sales volatility and
degree of operating leverage are the primary determinants
of a firm's business risk, the best single measure of
-16-
TABLE 2
DISTRIBUTION OF GROSS REVENUES, FORTUNE 50, WESTERN ELECTRIC
AND BELL OPERATING COMPANIES, 1980 (DOLLARS IN MILLIONS)
Bell OperatingWestern Electric Fortune 50 Companies *
Gross revenues $12,032 TOO.O% $486 1 972 100.0% $50,971 100.0%
Depreciation 323 2.7 21,49-2 4.4 7,039 13.9
Other expenses 10,232 85.0 ;~~429,763 88.3 26,951 53.0
Operating income $ 1,477 12.3% $ 35,717 7.3% $16,801 33.1%
Interest expense 159 1.3 8,244 1.7 3,768 7.4
Taxes 625 5.2 13,140 2.7 7,646 15.1
Net income $ 693 5.8% $ 14,333 2.9% $ 5,387 10.6%
*AT&T consolidated figures minus Western Electric.
Source: For Western Electric and Bell Operating Companies: WesternElectric and AT&T annual report, 1980; for Fortune 50:Compustat Tape.

-17-
business risk itself for most companies is the volatility,
over time, of its. return on investment (ROI).l Table 3
summarizes our ROI,analysis, while more details are given in
Appendix Table A-3. These data show that Western has
slightly more business risk than the average of the Fortune
50 companies, but that, in general, it is comparable to
these other manufacturers.
Total Risk. As noted earlier, financial leverage
reallocates a firm's business risk among investors--the
greater the use of financial leverage, the greater the
concentration of business risk on the equity investors,
hence the greater the equity investors' total risk. Western's
use of debt is in line with that of other large manufacturers.
Therefore, we would expect Western's total equity risk as
measured by its coefficient of variation of return on equity
(ROE) to be close to that of the median Fortune 50 company.
Table 4 (and Appendix Table A-4) indicates that this is
indeed the case.
Summary on Relative Total Risk. Our analysis thus far
indicates that Western Electric has both business and
financial risk, hence total investment risk, which is
Ipast ROI volatility is a good measure of business risk unlesswe have reason to believe that a company's future operatingenvironment. will be substantially diffetent from its pastenvironment. In this case, historic ROI volatility may understate or overstate future business risk.

-18-
TABLE 3
ROI VOLATILITY:
FORTUNE 50 MANUFACTURING COMPANIES VERSUS WESTERN ELECTRIC
(1962 - 1980)
Volatility Index(Coefficient of Variation x 100)
Fortune 50: Low
Median
High
4.98
21.97
336.17
Western Electric (Bell Business) 30.03

-19-
TABLE 4
ROE VOLATILITY:
FORTUNE 50 MANUFACTURING COMPANIES VERSUS WESTERN ELECTRIC
(1962 - 1980)
Volatility Index(Coefficient of Variation x 100)
Fortune 50: Low
Median
High
5.64
23.66
100.82
Western Electric (Bell Business) 35.42
Note: This analysis excludes Chrysler Corporation, which hada negative mean ROE, hence a non-meaningful coefficientof variation.
-20-
comparable to that of the average Fortune 50 Company. This
being the case, it would seem to be appropriate to use the
Fortune 50 as a comparable sample, either for the traditional
comparable earnings test or for purposes of establishing a
DCF return for Western. However, before finalizing our
conclusions with regard to risk, it is necessary to examine
Western's systematic, or "beta" risk. This is done in the
next section.
Market Risk Comparability: Covariance of Returns
As noted earlier, financial analysts today recognize
two distinctly different types of risk--company specific
risk and market-related or covariance-type risk. It has
been shown that company specific risk can be eliminated by
holding a diversified portfolio of investment securities.
However, market risk cannot be eliminated. Since investors
can eliminate company-specific risk, its presence in a
company such as Western, or one of the Fortune 50, may not
be particularly important. This distinction between types
of risk, and the effects of each, is covered in depth in
virtually all corporate finance and investments textbooks
today, generally under the heading of the Capital Asset
Pricing Model (CAPM) or Portfolio Theory.l Under
IFor example, see E. F. Brigham, Financial Management, 3rdEdition (1982), Chapters 5, 12, and 15.
-2l~
the CAPM, the "relevant riskiness" of any security is
measured by its beta coefficient, which is an index of the
security's risk in relation to other securities. A beta
of 1.0 indicates average risk; a beta which is less than
1.0 signifies lower than average risk; and a beta greater
than 1.0 signifies above average risk.
Both academicians and practitioners argue about the
exact correctness of the CAPM, about how to measure betas,
and about other elements of the theory, but the~e is general
agreement that the general concept of the CAPM is correct. 1
Therefore, it is appropriate to consider, as best we can,
Western's riskiness in a CAPM framework.
Relative risk in a CAPM framework is reflected by a
company's' beta coefficient, which is calculated as the slope
coefficient in a regression of the market returns of the
company in question on the market returns of an index of
investment securities such as the NYSE Index. This
procedure cannot be used for a subsidiary such as Western
Electric which has no publicly traded stock. However, it
is possible to estimate "accounting betas" for both Western
and the Fortune 50 and to use these accounting betas as the
basis for an analysis of comparable systematic risk.
1The arguments revolve around measurement problems. The CAPMis so logical that people who understand it do not argue againstit in principle. However, all the variables needed to implement it for purposes of determining risk and consequentlyrequired rates of return are expectations of investors, and noone knows how to measure the expectatlons of all lnvestorswith precision. This creates problems and arguments ove~
attempts to apply the CAPM
-22-
An accounting beta is defined as the covariance between
a given company's accounting rate of return and the rate of
return on an index of companies. Operationally, the accounting
beta is obtained by running a time series least squares
regression between the company's accounting rate of return
and the accounting returns of the market index. This type
of analysis was reported in 1970 in a study by Beaver,
Kettler, and Scholes [2]. These authors found that a
significant relationship exists between market and accounting
betas, making it meaningful to proxy market betas with
accounting betas. They also found significant relationships
between market betas and such accounting variables as
earnings variability, dividend payout, growth in earnings,
and financial leverage.
Further work in the area of accounting betas as proxies
for market betas has been done by "Beaver and Manegold [3],
Ball and Brown [1], and Rosenberg and McKibben [5]. Based
on these works, it is clear that a positive relationship
exists between accounting and market betas and, therefoie,
we can use accounting betas as proxies for market betas for
f d " k 'k b'l' Ipurposes 0 etermlnlng mar et rlS compara 1 lty.
I Gordon and Halpern [4] actually used the CAPM approach,with accounting betas, to estimate the cost of capital fordivisions of diversified firms. However, their procedurerequires the assumption that the CAPM can be utilized toestimate the cost of capital, a result which has been seriouslyquestioned in recent years. Indeed, even Gordon no longeruses the CAPM to estimate the rate of return for utilities.Our approach--using the CAPM concept, to help establish riskcomparability--does not rely on the assumption that the CAPMis exactly accurate and operationally valid.

-23--
In our analysis, we estimated two different sets of
accounting betas" for Western Electric and for each of the
Fortune 50 companies:
1. Accounting betas based on return on investment (ROI)
data. These betas measure relative systematic business
risk.
2. Accounting betas based on return 01 equity (ROE) data.
These betas extend the analysis to reflect financial
leverage, and they measure relative systematic equity
risk.
Operationally, we proceeded as follows:
1. The accounting beta coefficient is measured as b i
in this equation:
( 1)
Here
Rit = the ROI or ROE for Firm i in Period t, basedon either average investment or equity;
= the average ROI or ROE earned on the market indexcompanies during Period t, using the S&P 500companies as the market indexil
a.1
= the constant (or intercept) term;
= the error term for Firm i in Period t.
ITO avoid problems of comparability, we used only those companiesin the S&P 500 Index which have fiscal years ending in November,December, or January, and for which data were available on theCompustat Tapes over the period 1961 - 1980. This set included330 companies.
-24-
Data were obtained from the Compustat Tapes over the period
1961 - 1980, and the regression was run over the period
1962 - 1980 (1961 data were needed to obtain the average
investment and equity needed to calculate ROI and ROE for 1962).
The results of this analysis are shown in Tables 5 and 6.
These data show that Western Electric is in the upper risk
quartile--it has more market risk than the average of the
Fortune 50 companies. l Thus, our systematic, market risk
analysis confirms the conclusions reached in the total risk
analysis, namely, that Western Electric is at l~ast as risky
as the Fortune 50 group of companies.
lwestern's total risk is slightly higher than that of theaverage Fortune 50 Company, but its systematic marke~risk is much higher than avera~e. The re~son f~r.~hlssituation probably has to do wlth Western s p~sltlon as acapital goods producer. The returns of a ca~ltal goo~sproducer should, logically, fluctuate more dlrectly wlthgeneral economic conditions than would be true of theaverage manufacturer, which would produce at least somegoods and services for direct consumer use.

-25-
TABLE 5
COMPARISON OF SYSTEMATIC BUSINESS RISK: WESTERN
ELECTRIC AND THE FORTUNE 50 COMPANIES
Number of Fortune 50 companies with ROI betas greater thanWestern Electric's = 10.
Number of Fortune 50 companies with ROI betas less thanWestern Electric's = 40.

-26-
TABLE 6
COMPARISON OF SYSTEMATIC EQUITY RISK:
WESTERN ELECTRIC VERSUS THE FORTUNE 50 COMPANIES
Number of Fortune 50 companies with ROE betas greater thanWestern Electric's = 11.
Number of Fortune 50 companies with ROE betas less thanWestern Electric's = 39.

-27-
FAIR RATE OF RETURN: COMPARABLE EARNINGS
The preceding' analysis has established that Western
Electric is at least. as risky as the average of the Fortune 50
companies. Therefore, under the comparable earnings standard,
Western's ROI and ROE should, on average, be at least as high
as the average of the Fortune 50 companies.
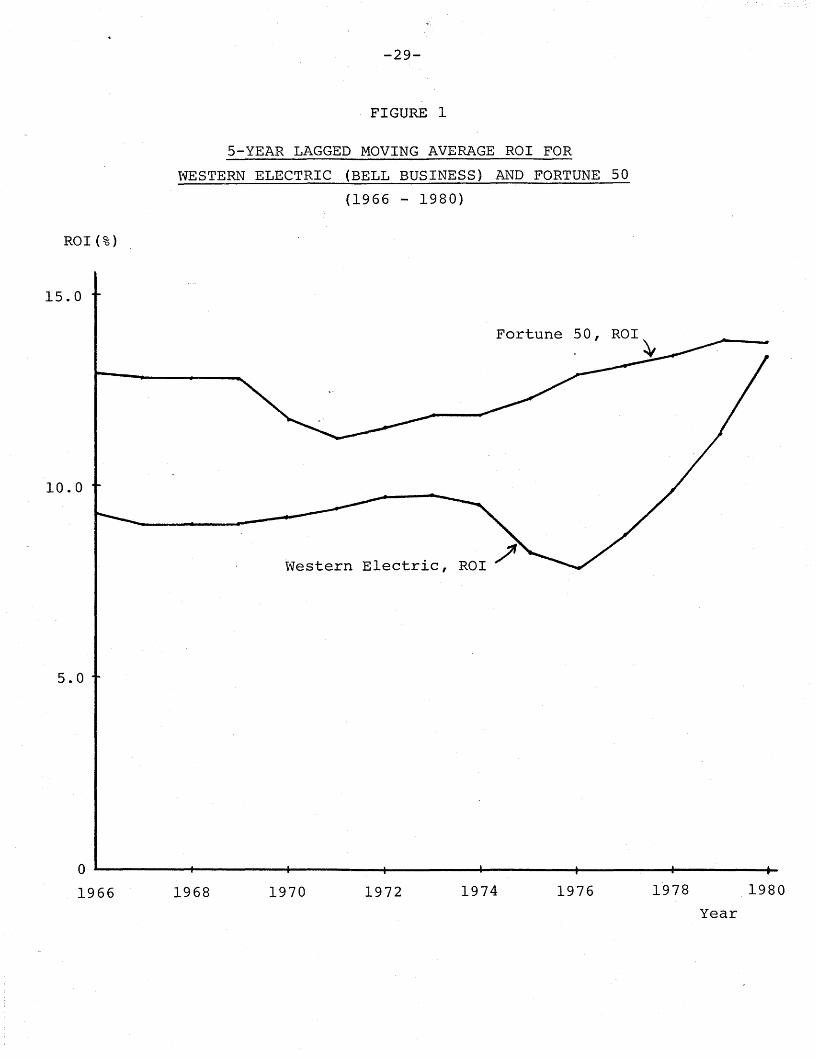
Western's ROI, together wi th the Fortune 50 average, is
shown in Table 7 and plotted in Figure 1. Over the period
1962 - 1980, Western's earned ROI exceeded that of the Fortune 50
in only 4 years. W'estern's average ROI for this period was
2.3 percentage points below the Fortune ,50 average. On a 5 year
moving average basis, Western's ROI has never exceeded that
of the Fortune 50 group.
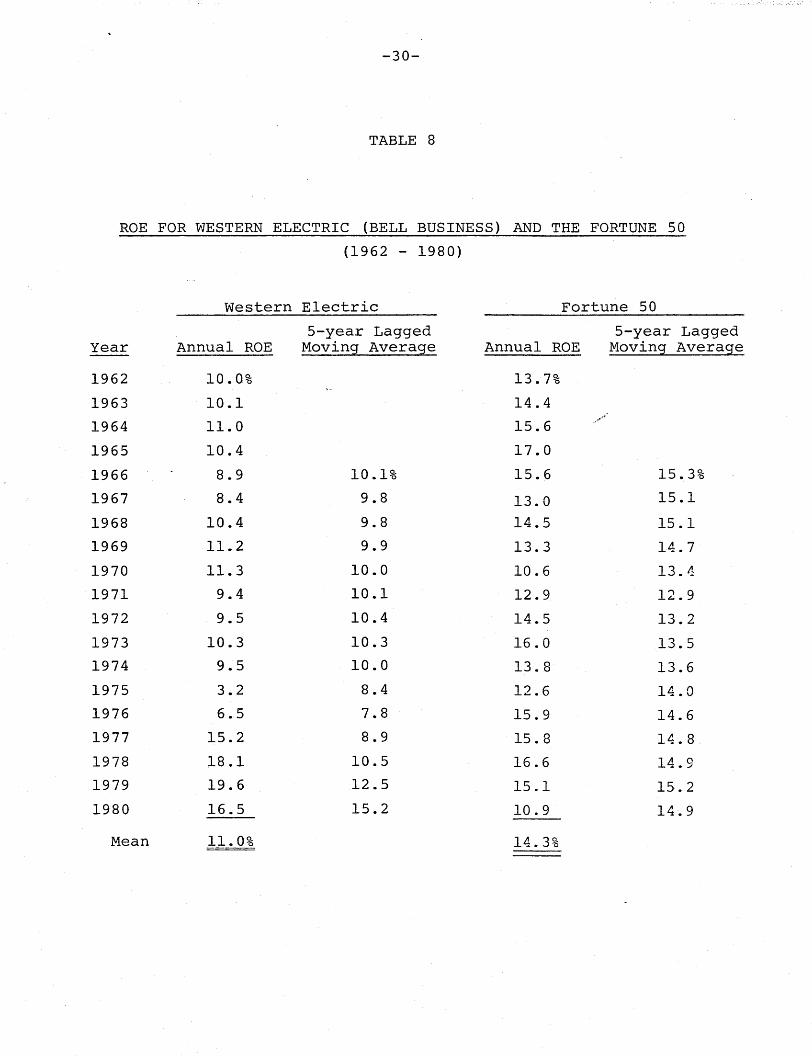
Western's ROE and the average ROE for the Fortune 50 group
is shown in Table 8 and plotted in Figure 2. Western's average
ROE for this period was 3.3 percentage points below that for
the Fortune-50 group, and on an annual basis, Western's ROE
exceeded the Fortune 50 average ROE in only 4 out of the 19
years. On a 5 year moving 'average basis, Western's ROE exceeded
the Fortune 50 in only one year and then by only 0.3 percentage
points.
These dates show that by the comparable earnings standard,
Western's returns have not been excessive. Indeed, by this
standard, Western's returns have been decidedly low.

-28-
TABLE 7
ROI FOR WESTERN ELECTRIC (BELL BUSINESS) AND THE FORTUNE 50
(1962 - 1980)
Western Electric Fortune 50
5-year Lagged 5-year LaggedYear Annual ROI Moving Average Annual ROI Moving Average
1962 9.2% 11.7%
1963 9.2 12.3
1964 10.2 13.4
1965 9.6 14.5
1966 8.1 9.3% 12.9 13.0%
1967 7.7 9.0 10.9 12.8
1968 9.4 9.0 12.1 12.8
1969 10.4 9.0 11.3 12.3
1970 10.4 9.2 9.5 11.3
1971 9.0 9.4 11.0 11.0
1972 9.1 9.7 12.2 11.2
1973 9.7 9.7 13.6 11.51974 9.3 9.5 12.5 11.81975 4.3 8.3 11.7 12.21976 6.7 7.8 13.9 12.81977 13.6 8.7 13.9 13.11978 15.6 9.9 14.6 13.31979 16.8 11.4 13.8 13.61980 14.5 13.4 11.4 13.5
Mean 10.2% 12.5%
-29-
FIGURE 1
5-YEAR LAGGED MOVING AVERAGE ROI FOR
WESTERN ELECTRIC (BELL BUSINESS) AND FORTUNE 50
(1966 - 1980)
ROI(%)
15.0
Western Electric, ROI ~
Fortune
10.0
5.0
1980197819761974197219701968
0~----+------+-----+-----4-----+-----+------6-
1966Year
-30-
TABLE 8
ROE FOR WESTERN ELECTRIC (BELL BUSINESS) AND THE FORTUNE 50
(1962 - 1980)
Year
Western Electric
5-year LaggedAnnual ROE Moving Average
Fortune 50
5-year LaggedAnnual ROE Moving Average
1962
1963
1964
1965
1966
1967
1968
1969
1970
1971
1972
1973
1974
1975
1976
1977
1978
1979
1980
Mean
10.0%
10.1
11.0
10.4
8.9
8.4
10.4
11.2
11.3
9.4
9.5
10.3
9.5
3.2
6.5
15.2
18.1
19.6
16.5
1.1.0%
10.1%
9.8
9.8
9.9
10.0
10.1
10.4
10.3
10.0
8.4
7.8
8.9
10.5
12.5
15.2
13.7%
14.4
15.6
17.0
15.6
13.0
14.5
13.3
10.6
12.9
14.5
16.0
13.8
12.6
15.9
15.8
16.6
15.1
10.9
14.3%
15.3%
15.1
15.1
14.7
13.11
12.9
13.2
13.5
13.6
14.0
14.6
14.8
14.9
15.2
14.9

ROE (%)
15.0
10.0
5.0
-31-
FIGURE 2
5-YEAR LAGGED MOVING AVERAGE ROE FOR
WESTERN ELECTRIC (BELL BUSINESS) AND FORTUNE 50
(1966 - 1980)
Fortune 50, ROE:..
Western Electric, ROE ~
o1966 1968 1970 1972 1974 1976 1978
Year
1980
-32-
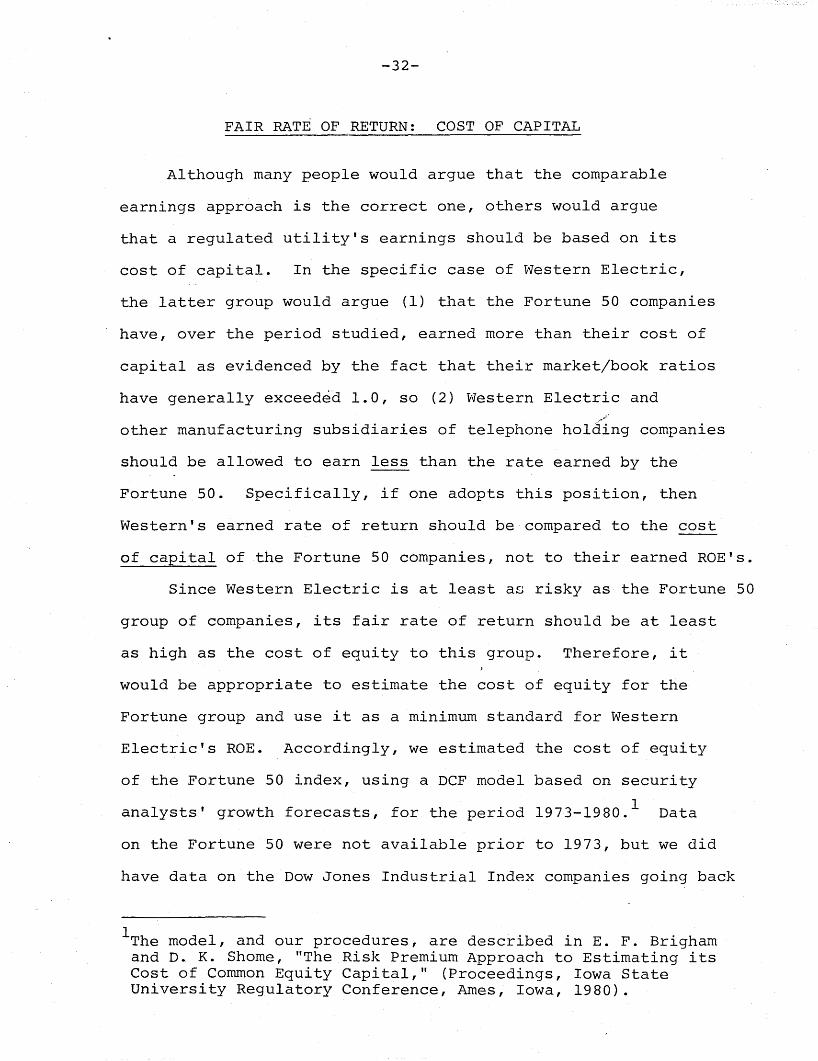
FAIR RATE OF RETURN: COST OF CAPITAL
Although many people would argue that the comparable
earnings approach is the correct one, others would argue
that a regulated utility's earnings should be based on its
cost of capital. In the specific case of Western Electric,
the latter group would argue (l) that the Fortune 50 companies
have, over the period studied, earned more than their cost of
capital as evidenced by the fact that their market/book ratios
have generally exceeded 1.0, so (2) Western Electric and
other manufacturing subsidiaries of telephone holding companies
should be allowed to earn less than the rate earned by the
Fortune 50. Specifically, if one adopts this position, then
Western's earned rate of return should be compared to the cost
of capital of the Fortune 50 companies, not to their earned ROE's.
Since Western Electric is at least as risky as the Fortune 50
group of companies, its fair rate of return should be at least
as high as the cost of equity to this group. Therefore, it
would be appropriate to estimate the cost of equity for the
Fortune group and use it as a minimum standard for Western
Electric's ROE. Accordingly, we estimated the cost of equity
of the Fortune 50 index, using a DCF model based on security
analysts' growth forecasts, for the period 1973-1980. 1 Data
on the Fortune 50 were not available prior to 1973, but we did
have data on the Dow Jones Industrial Index companies going back
IThe model, and our procedures, are described in E. F. Brighamand D. K. Shome, "The Risk Premium Approach to Estimating itsCost of Cornmon Equity Capital," (Proceedings, Iowa StateUniversity Regulatory Conference, Ames, Iowa, 1980).

-33-
to 1965. This permitted us to ex±Endthe cost of capital
analysis back to 1965, using the following techniques:
1. We compared the cost of equity estimates for the
Fortune 50 and the :!dov1 Jones Industrial companies
over the period 1973-1980. (See Table 9 and Figure 3.)
On average, the Fortune 50's cost of equity exceeded
that of the Dow Jones Industrials by 0.25 percentage
points over this period.
2. By adding 0.25 percentage points to the estimated cost
of equity for the Dow Jones companies for each year
during 1965-1972, we obtained an estimate of the
Fortune 50's cost of equity over this earlier period.
(See Table 9 and Figure 3.)
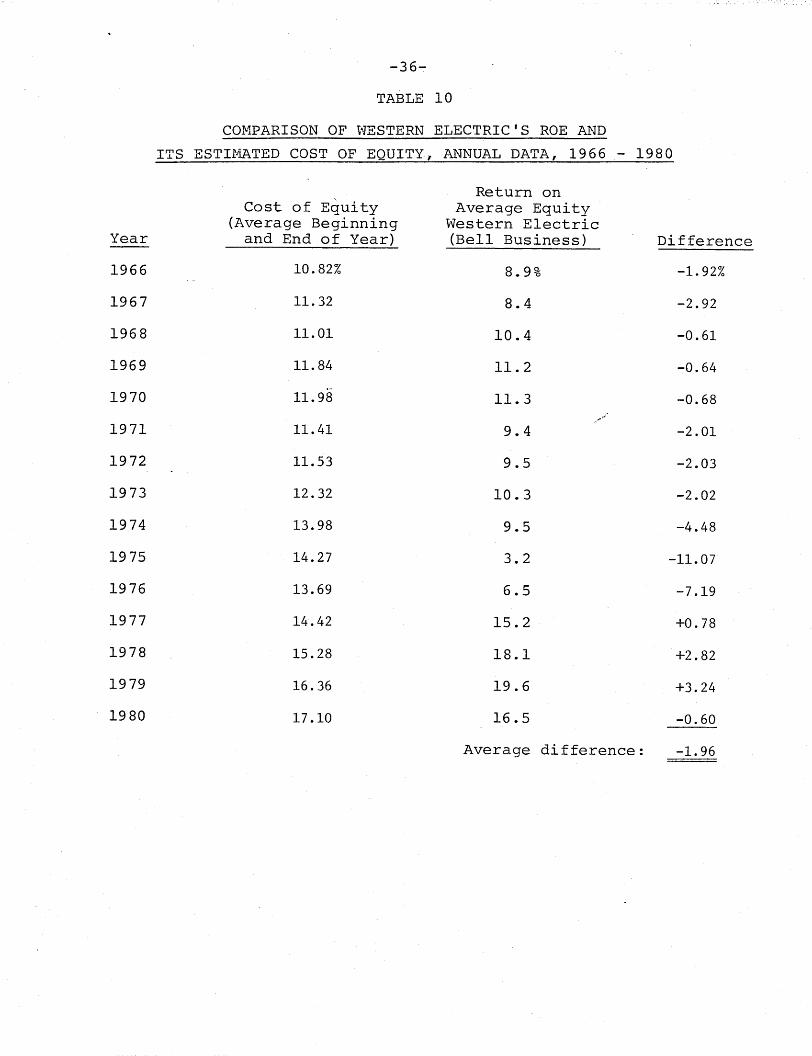
Given estimates of Western's cost of capital as based on
the set of comparable companies, we can assess the reason
ableness of its returns over the period 1965-1980 by
comparing its earned ROE with its estimated cost of
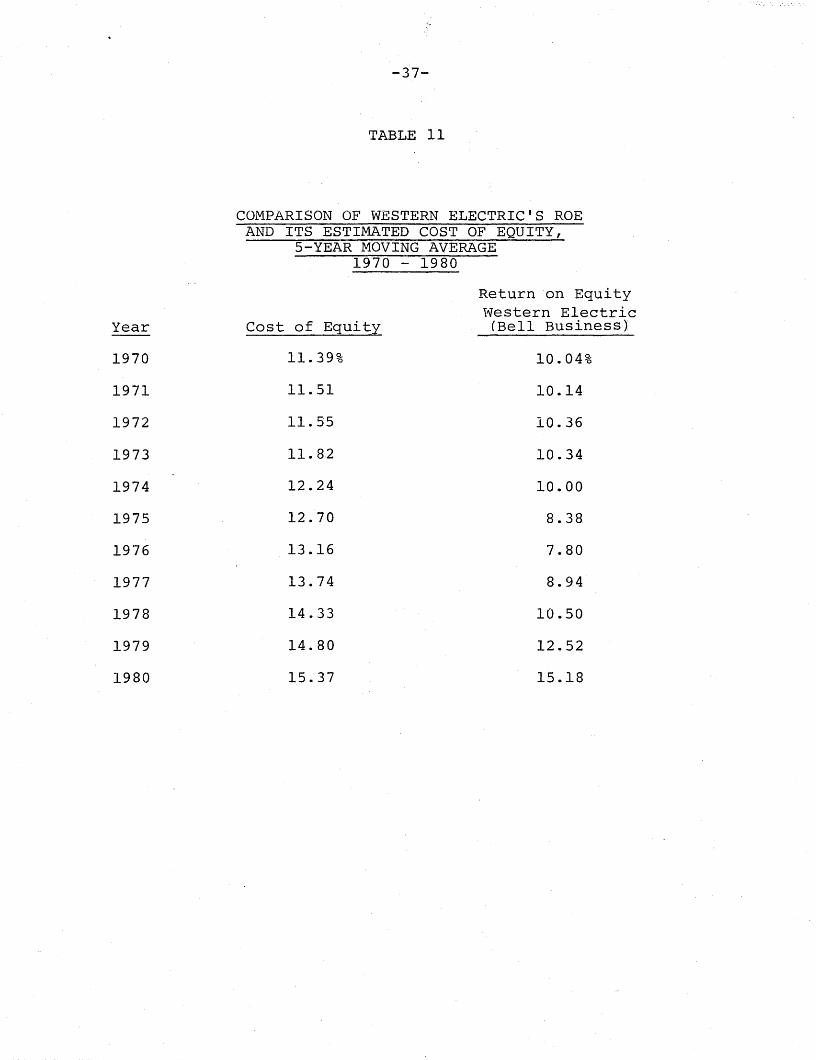
equity. This comparison is shown in Table 10 (for annual
data) and in Table 11 (for 5-year moving averages). The 5-year
moving average data are also plotted in Figure 4. Based on
thAse data, we can make the following points:
1. In 12 of the 15 years examined, Western's earned ROE
was less than its estimated cost of equity.
2. On average, over the entire period, Western's cost of
equity exceeded its earned ROE by 1.96 percentage points.

-34-
TABLE 9
COST OF EQUITY FOR FORTUNE 50AND DOW-JONES INDUSTRIALS
Cost of EquityDow Jones
Year-End Industrials Fortune 50
1965 9.56% 9.81%
1966 11.57 11.82
1967 10.56 10.81
1968 10.96 11.21
1969 12.22 12.47
1970 11.23 11.48
1971 11.09 11.34
1972 11.47 11.72 Difference
1973 12.38 12.92 0.54
1974 14.83 15.04 0.21
1975 13.32 13.50 0.18
1976 13.63 13.87 0.24
1977 14.75 14.96 0.21
1978 15.50 15.59 0.09
1979 16.53 17.12 0.59
1980 17.14 17.08 -0.06
Average 0.25--
Note: Prior to 1973, the Fortune 50 cost of equity was estimated by
adding 0.25 percentage points to the Dow Jones cost.

FIGURE 3
COST OF EQUITY FOR THE DOW-JONES INDUSTRIALS AND THE FORTUNE 50
Cost ofEquity (%)
20.0
-36-
TABLE 10
COMPARISON OF WESTERN ELECTRIC'S ROE AND
ITS ESTIt1ATED COST OF EQUITY, ANNUAL DATA, 1966 - 1980
Cost of Equity(Average Beginning
Year and End of Year)
1966 10.82%
1967 11.32
1968 11.01
1969 11.84
1970 11.98
1971 11.41
1972 11.53
1973 12.32
1974 13.98
1975 14.27
1976 13.69
1977 14.42
1978 15.28
1979 16.36
1980 17.10
Return onAverage Equity
Western Electric(Bell Business) Difference
8.9% -1.92%
8.4 -2.92
10.4 -0.61
11.2 -0.64
11.3 -0.68
9. 4 -2.01
9.5 -2.03
10.3 -2.02
9.5 -4.48
3.2 -11.07
6 • 5 -7.19
15.2 +0.78
18.1 +2.82
19.6 +3.24
16.5 -0.60
Average difference: -1.96
-37-
TABLE 11
COMPARISON OF WESTERN ELECTRIC'S ROEAND ITS ESTIMATED COST OF EQUITY,
5-YEAR MOVING AVERAGE1970 - 1980
Return on EquityWestern Electric
Year Cost of Equity (Bell Business)
1970 11.39% 10.04%
1971 11.51 10.14
1972 11.55 10.36
1973 11.82 10.34
1974 12.24 10.00
1975 12.70 8.38
1976 13.16 7.80
1977 13.74 8.94
1978 14.33 10.50
1979 14.80 12.52
1980 15.37 15.18
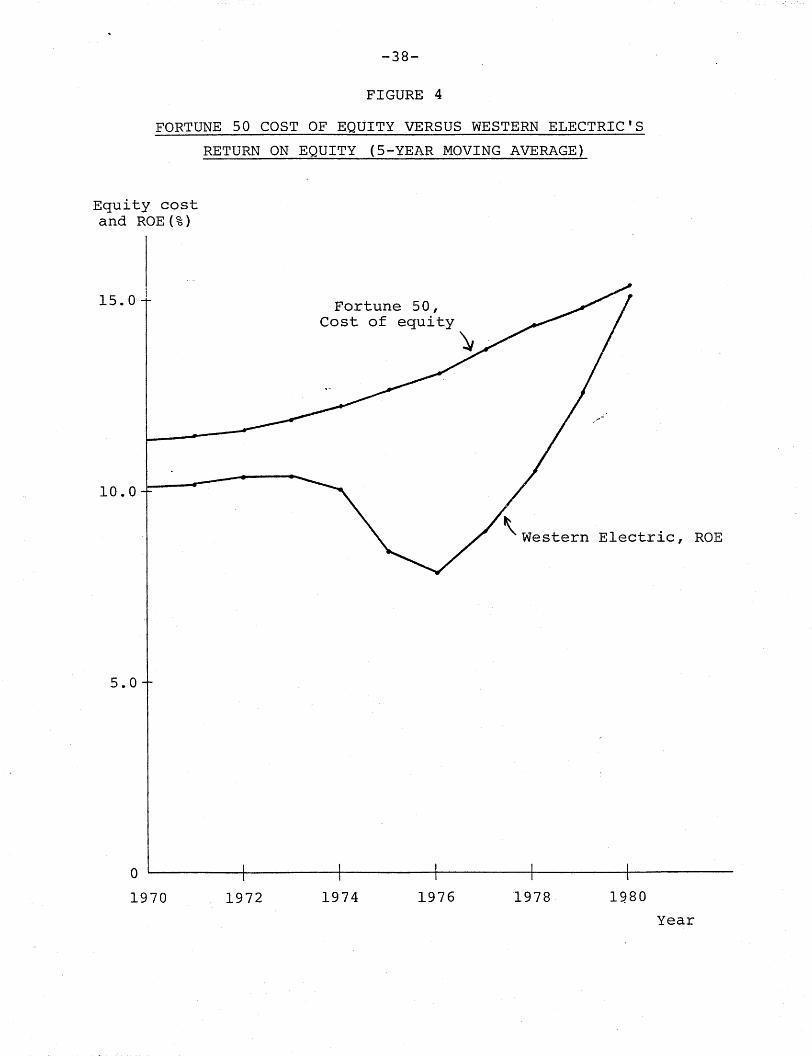
-38-
FIGURE 4
FORTUNE 50 COST OF EQUITY VERSUS WESTERN ELECTRIC'S
RETURN ON EQUITY (5-YEAR MOVING AVERAGE)
Equity costand ROE(%)
15.0
10.0
5.0
Fortune 50,Cost of equity
~
\ Western Electric, ROE
o1970 . 1972 1974 1976 1978 1980
Year

-39-
3. On a 5-year moving average basis, Western's earned ROE
never exceeded its cost of equity for this period 1965-
1980.
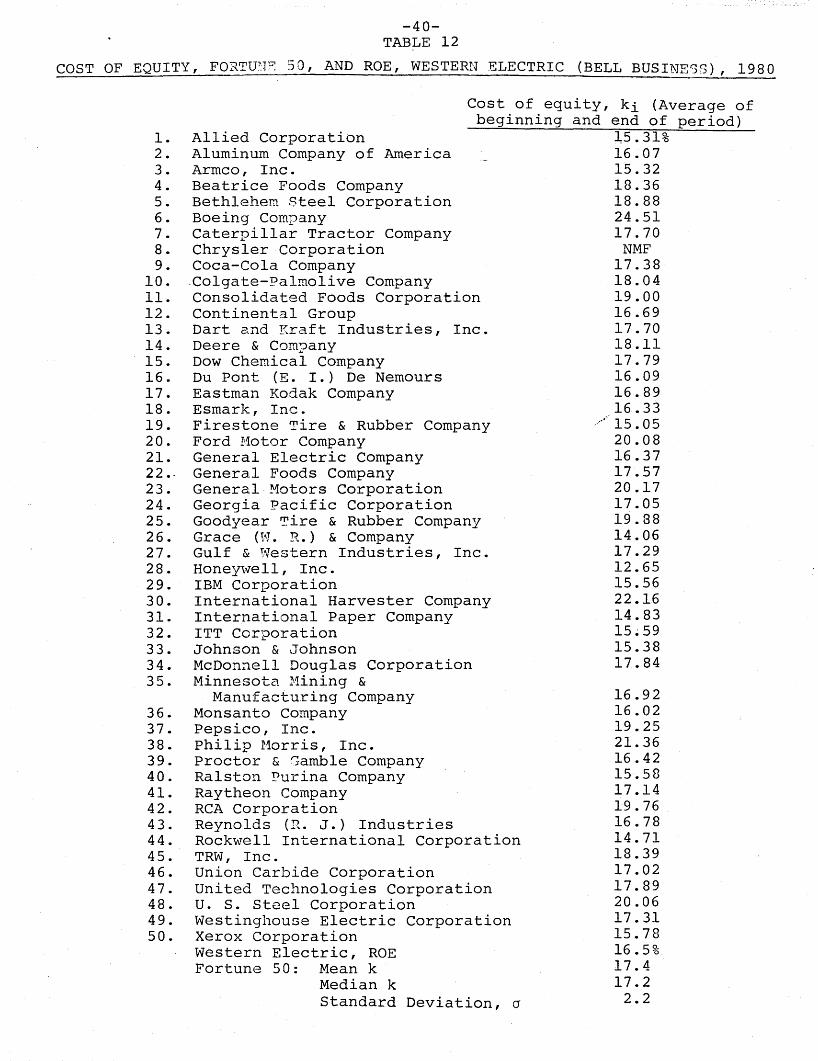
In Table 12 we show a more detailed comparison between
Western Electric's ROE and the cost of equity for the Fortune
50 firms for the year 1980. The comparison shows that:
1. The simple average of the equity costs for the Fortune 50
companies is 17.4% compared to Western's earned ROE of
16.5%.1
2. The median cost· of equi ty for the group is 17.2%.
3. The standard deviation of the cost of equity for the
Fortune 50 companies is 2.2%. Thus Western's ROE is
l7.42~2l6.5 = 0.4 standard deviations below the mean
cost of equity for the Fortune 50 companies.
4. Western's ROE is greater than the cost of equity of
18 out of the Fortune 50 companies and less than the
cost of equity of 32 out of the Fortune 50 companies.
Based on these comparisons, using the comparable earnings
criteria and the cost of capital criteria, we can conclude that
Western's profi ts have not been excessive. Even allowing for a
substantial margin of error in our estimates, the study suggests
that Western's profits on its sales to the Bell telephone
companies and to their custoners have been fair.
lNote that in Table 10 the comparison is between the valueweighted cost of equity (17.1% in 1980) for the Fortune 50companies and Western's earned ROE (16.5% in 1980).
-40TABLE 12
COST OF EQUITY, FORTUTT~ 50, AND ROE, WESTERN ELECTRIC (BELL BUSINESS), 1980
Cost of equity, ki (Average ofbeginning and end of period)
1. Allied Corporation ~5.3l%
2. Aluminum Company of America 16.073. Armco, Inc. 15.324. Beatrice Foods Company 18.365. Bethlehem Steel Corporation 18.886. Boeing Company 24.517. Caterpillar Tractor Company l7~70
8. Chrysler Corporation NMF9. Coca-Cola Company 17.38
10. Colgate-Palmolive Company 18.0411. Consolidated Foods Corporation 19.0012. Continental Group 16.6913. Dart and Kraft Industries, Inc. 17.7014. Deere & COffi?any 18.1115. Dow Chemical Company 17.7916. Du Pont (E. I.) De Nemours 16.0917. Eastman Kodak Company 16.8918. Esmark, Inc. 16.3319. Firestone Tire & Rubber Company 15.0520. Ford Motor Company 20.0821. General Electric Company 16.3722 .. General Foods Company 17.5723. General Motors Corporation 20.1724. Georgia Pacific Corporation 17.0525. Goodyear Tire & Rubber Company 19.8826. Grace (W. R.) & Company 14.0627. Gulf & Western Industries, Inc. 17.2928. Honeywell, Inc. 12.6529. IBM Corporation 15.5630. International Harvester Company 22.1631. International Paper Company 14.8332. ITT Corporation 15~59
33. Johnson & Johnson 15.3834. McDonnell Douglas Corporation 17.8435. Minnesota Mining &
Manufacturing Company 16.9236. Monsanto Company 16.0237. Pepsico, Inc. 19.2538. Philip Morris, Inc. 21.3639. Proctor & Gamble Company 16.4240. Ralston Purina Company 15.5841. Raytheon Company 17.1442. RCA Corporation 19.7643. Reynolds (R. J.) Industries 16.7844. Rockwell International Corporation 14.7145. TRW, Inc. 18.3946. Union Carbide Corporation 17.0247. United Technologies Corporation 17.8948. U. S. Steel Corporation 20.0649. Westinghouse Electric Corporation 17.3150. Xerox Corporation 15.78
Western Electric, ROE 16.5%Fortune 50: Mean k 17.4
Median k 17.2Standard Deviation, a 2.2
-41-
SUr~RY AND CONCLUSIONS
The purposes of this study have been (1) to set forth
a methodology for evaluating the reasonableness of the profits
earned by the manufacturing/supply subsidiary of a public
utility holding company system to the systems' regulated
operating subsidiaries and (2) to use the procedure to examine
the profit situation for Western Electric since 1965.
Two theories exist regarding an appropriate profit level
for a subsidiary such 'as Western Electric. Under the first-
the comparable earnirigs approach--Western should earn a rate
of return on its book investment which is, on average over
time, about equal to the rate of return earned by a group of
comparable risk but unregulated industrial firms. Under the
second--the cost of capital approach--Western should earn a
rate of return which approximates the cost of capital of a
comparable-risk set of industrial companies. The first standard
is based primarily on fairness--investors in the regulated
company should be permitted to earn returns that are similar,
ex post, to the return which they would have earned had they
committed their capital to an equally risky unregulated enter
prise. The second standard focuses on capital attraction--the
regulated company must raise capital 1f it is to meet its
service obligations, so if regulators determine the supply
price of capital (the cost of capital) and permit the regulated
enterprise to earn that rate of return, then the company will
be able to raise capital and thereby discharge its public duties.

-42-
Under either regulatory theory, it is necessary to establish
a comparison set of unregulated companies whose invest~ent risk
is comparable to ~hRt of the subsidiary of the regulated
enterprise. Traditionally, Western Electric has analyzed
risk in terms of total enterprise risk as measured by the
variance or coefficient of variation of sales growth,- ROI,
and ROE for the 50 largest manufacturing companies in the
Fortune 50 g~oup~ The variables used clearly do (in our
judgement) have an eftect on risk as it is perceived by
investors, but some if not most investors are also/concerned'
about covariance, or "beta" risk. Accordingly, we calculated
accou~ting betas (which may be used as proxies for market
betas) for Western Electric and the comparison group of
companies.
Our comparative risk analysis, using both the variance
and covariance approaches, indicates that Western Electric
is at least as risky as the average Fortune 50 company.
Therefore, Western's profit rate would be "fair" under the
comparable earnings standard if its ROE did not exceed, over
time, that of the Fortune 50 group. Under the cost of capital
standard, Western's earned ROE should, over time, be equal to
or slightly above the average cost of capital of the Fortune
50 group.
Western's actual earned ROE has, over time, averaged
well below that of the Fortune 50 group. Further, its ROE
has also tended to fall below the Fortune 50 group's cost of

-43-
equity capital, though the gap has been narrower. Based on
these data, we can conclude that Western has not been earning
excessive returns, and that Western's prices have not been
unfair to the Bell System's telephone customers.
The general methodology as set forth here could be applied
to the subsidiaries or major divisions of any holding company
system, regulated or not. Further, the methodology is likely
to have increased applicability to utility system manufacturer/
supply subsidiaries i~_ the years ahead in the light of the
trend toward deregulation in the telecommunications industry
and the continuing efforts of the electric/gas industries to
diversify.
-44-
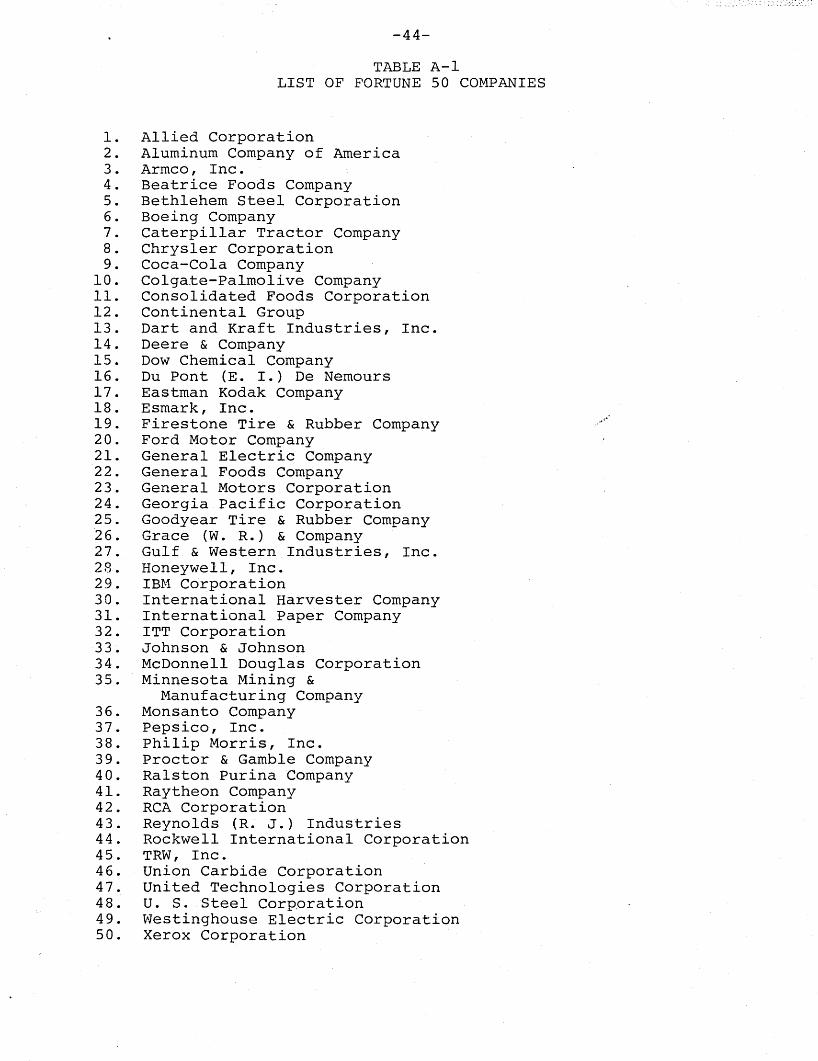
TABLE A-ILIST OF FORTUNE 50 COMPANIES
1. Allied Corporation2. Aluminum Company of America3. Armco, Inc.4. Beatrice Foods Company5. Bethlehem Steel Corporation6. Boeing Company7. Caterpillar Tractor Company8. Chrysler Corporation9. Coca-Cola Company
10. Colga.te-Palmolive Company11. Consolidated Foods Corporation12. Continental Group13. Dart and Kraft Industries, Inc.14. Deere & Company15. Dow Chemical Company16. Du Pont (E. I.) De Nemours17. Eastman Kodak Company18. Esmark, Inc.19. Firestone Tire & Rubber Company20. Ford Motor Company21. General Electric Company22. General Foods Company23. General Motors Corporation24. Georgia Pacific Corporation25. Goodyear Tire & Rubber Company16. Grace (W. R.) & Company27. Gulf & Western Industries, Inc.28. Honeywell, Inc.29. IBM Corporation30. International Harvester Company31. International Paper Company32. ITT Corporation33. Johnson & Johnson34. McDonnell Douglas Corporation35. Minnesota Mining &
Manufacturing Company36. Monsanto Company37. Pepsico, Inc.38. Philip Morris, Inc.39. Proctor & Gamble Company40. Ralston Purina Company41. Raytheon Company42. RCA Corporation43. Reynolds (R. J.) Industries44. Rockwell International Corporation45. TRW, Inc.46. Union Carbide Corporation47. United Technologies Corporation48. U. S. Steel Corporation49. Westinghouse Electric Corporation50. Xerox Corporation
-45-:
TABLE A-2SALES VOLATILITY
FORTUNE-50 AND \{ESTERN ELECTRIC (BELL BUSINESS), 1962-1980Mean of % Std Dev of %
Sales Change, Sales Chge.Company Name l:l cr
1. Allied Corporation2. Aluminum Company of America3. Armco, Inc.4. Beatrice Foods Company5. Bethlehem Steel Corporation6. Boeing Company7. Caterpillar Tractor Company8. Chrysler Corporation9. Coca-Cola Company
10. Colgate-Palmolive Company11. Consolidated Foods Corporation12. Continental Group13. Dart and Kraft Industries, Inc.14. Deere & Company15. Dow Chemical Company16. Du Pont (E. I.) De Nemours17. Eastman Kodak Company18. Esmark, Inc.19. Firestone Tire & Rubber Company20. Ford Motor Company21. General Electric Company22. General Foods Company23. General Motors Corporation24. Georgia Pacific Corporation25. Goodyear Tire & Rubber Company26. Grace (W. R.) & Company27. Gulf & Western Industries, Inc.28. Honeywell, Inc.29. IBM Corporation30. International Harvester Company31. International Paper Company32. ITT Corporation33. Johnson & Johnson34. McDonnell Douglas Corporation35. Minnesota Mining &
Manufacturing Company36. Monsanto Company37. Pepsico, Inc.38. Philip Morris, Inc.39. Proctor & Gamble Company40. Ralston Purina Company41. Raytheon Company42. RCA Corporation43. Reynolds (R. J.) Industries44. Rockwell International Corporation45. TRW, Inc.46. Union Carbide Corporation47. United Technologies Corporation48. U. S. Steel Corporation49. Westinghouse Electric Corporation50. Xerox Corporation
Western ElectricFortune 50 Range:
Median:
11.52%10.5210.6216.00
6.9910.6614.14
9.4413.6412.1713.53
8.359.53
13.7414.6410.2813.055.137.87
10.159.689.57
10.1717.95
9.7114.0734.3113.6516.00
8.008.85
17.5215.5621.20
12.9611.0621.6517.7110.9312.1213.32
9.2313.3810.1514.5410.5014.70
7.778.31
31.01
10.03
10.13%11.61
9.386.72
10.7619.07
8.5817.85
6.598.239.416.64
10.3810.2013.99
7.788.118.075.89
12.946.655.65
17.0511.66
4.449.97
34.9010.8411.7710.58
7.1111.1410.0042.33
4.247.70
20.277.246.138.07
17.016.06
12.4113.7911.00
7.8016.6810.96
5.6420.65
6.93
VolatilityIndex
(crIll) x 100
87.95110.35
88.2642.00
153.88178.94
60.69189.16
48.3267.6469.5879.55
108.8774.2195.5175.7462.17
157.4074.80
127.4668.6559.05
167.6664.9245.6870.86
101.7079.4173.57
132.3580.4063.5664.26
199.62
32.6969.5993.6240.9267.6456.11
127.6965.6092.76
135.7876.6274.30
113.49141.00
67.9066~60
69.1232.69 to 189.16
75.21

-46-
11.2327.4915.3820.85
7.4411.9938.9120.124.98
21.2517.8222.6942.3649.6128.62
9.8930.03
4.98 to 336.1721.97
VolatilityROI Index
(O'/ll) x 100
23.5437.5028.4911.4067.3964.8020.78
336.179.83
19.6111.0616.0616.4125.6828.4423.2816.1833.8440.1454.6417.0212.4739.3124.059.55
25.4626.1220.1411.9142.8022.7115.4816.9933.95
2.142.792.482.511.611.435.212.310.752.432.232.534.11_3.062.671.823.05
19.0610.1616.1612.0215.6211.8913.3911.4715.1311.4412.51
-11.149.706.169.34
18.3910.15
TABLE A-3ROI VOLATILITY
FORTUNE 50 AND WESTERN ELECTRIC (BELL BUSINESS), 1962-1980
Mean % ROI Std Dev of %II 0' _
9.29% 2.19%8.54 3.208.60 2.45
14.46 1.686.79 4.58
11.76 7.6215.67 3.26
3.84 12.9021.78 2.1412.56 2.4611.91 1.3210.71 1.7211.99 1.9711.90 3.0612.70 3.6114.31 3.3119.90 3.22
7.38 ~f50
8.32 3.3410.77 5.8914.58 2.4814.22 1.7717.00 6.6810.63 2.56
9.98 0.959.47 2.41
10.51 2.7410.78 2.1718.24 2.17
7.83 3.359.73 2.21
10.61 1.4615.75 2.6814.84 5.04
Company Name
Allied CorporationAluminum Company of AmericaArmco, Inc.Beatrice Foods CompanyBethlehem Steel CorporationBoeing CompanyCaterpillar Tractor CompanyChrysler CorporationCoca-Cola CompanyColgate-Palmolive CompanyConsolidated Foods CorporationContinental GroupDart and Kraft Industries, Inc.Deere & CompanyDow Chemical CompanyDu Pont (E. I.) De NemoursEastman Kodak CompanyEsmark, Inc.Firestone Tire & Rubber CompanyFord Motor CompanyGeneJ;al Electric CompanyGeneral Foods CompanyGeneral Motors CorporationGeorgia Pacific CorporationGoodyear Tire & Rubber CompanyGrace (W. R.) & CompanyGulf & Western Industries, Inc.Honeywell, Inc.IBM CorporationInternational Harvester CompanyInternational Paper CompanyITT CorporationJohnson & JohnsonMcDonnell Douglas CorporationMinnesota Mining &
Manufacturing CompanyMonsanto CompanyPepsico, Inc.Philip Morris, Inc.Proctor & Gamble CompanyRalston Purina CompanyRaytheon CompanyRCA CorporationReynolds (R. J.) IndustriesRockwell International CorporationTRW, Inc.Union Carbide CorporationUnited Technologies CorporationU. S. Steel CorporationWestinghouse Electric CorporationXerox CorporationWestern ElectricFortune 50 Range:
Median:
36.37.38.39.40.41.42.43.44.45.46.47.48.49.50.
1.2.3.4.5.6.7 •8.9.
10.11.12.13.14.15.16.17.18.19.20.21.22.23.24.25.26.27.28.29.30.31.32.33.34.35.

-47-.'TABLE A-4
ROE VOLATILITYFORTUNE-50 AND WESTERN ELECTRIC (BELL BUSINESS), 1962-1980
1.2.3.4.5.6.7 •8.9.
10.11.12.13.14.15.16.17.18.19.20.21.22.23.24.25.26.27.28.29.30.31.32.33.34.35.
36.37.38.39.40.41.42.43.44.45.46.47.48.49.50.
Company Name
Allied CorporationAluminum Company of AmericaArmco, Inc.Beatrice Foods CompanyBethlehem Steel CorporationBoeing CompanyCaterpillar Tractor CompanyChrysler CorporationCoca-Cola CompanyColgate-Palmolive CompanyConsolidated Foods CorporationContinental GroupDart and Kraft Industries, Inc.Deere & CompanyDow Chemical CompanyDu Pont (E. I.) De NemoursEastman Kodak CompanyEsmark, Inc.Firestone Tire & Rubber CompanyFord Motor CompanyGeneral Electric CompanyGeneral Foods CompanyGeneral Motors CorporationGeorgia Pacific CorporationGoodyear Tire & Rubber CompanyGrace (W. R.) & CompanyGulf & Western Industries, Inc.Honeywell, Inc.IBM CorporationInternational Harvester CompanyInternational Paper CompanyITT CorporationJohnson & JohnsonMcDonnell Douglas CorporationMinnesota Mining &
Manufacturing CompanyMonsanto CompanyPepsico, Inc.Philip Morris, Inc.Proctor & Gamble CompanyRalston Purina CompanyRaytheon CompanyRCA CorporationReynolds (R. J.) IndustriesRockwell International CorporationTRW, Inc.Union Carbide CorporationUnited Technologies CorporationU. S. Steel CorporationWestinghouse Electric CorporationXerox CorporationWestern ElectricFortune 50 Range:
Median:
Mean % ROE1.1
10.93%10.34
9.4315.85
6.7212.4619.01-7.9122.0513.7412.8412.2713.3012.8417.1915.6820.298.188.11
10.8816.6716.0917.7015.5610.9211.2115.5112.1919.77
7.1711.0813.6016.0615.89
20.1011.7619.6318.0217.1614.4214~78
15.0918.1912.5114.2613.5711.58
6.2410.3823.4511.03
Std Dev of % ROEo
3.25%4.453.162.006.558.784.00
5.602.152.571.722.042.064.105.933.873.293.276.488.082.601.557.783.112.003.394.912.571.837.233.563.022.806.22
2.093.832.113.621.322.175.233.411.033.643.043.545.904.482.855.313.91
VolatilityIndex
(0/1.1) x 100
29.7143.0233.4912.6397.4870.4421.02
-702.809.77
18.7113.4316.6415.4931.9334.4924.6716.2339.9679.8674.2615.60
9.6243.9619.9918.3030.2231.6921.10
9.25100.82
32.1422.2317.4239.16
10.3932.5710.7320.097.69
15.0935.4022.595.64
29.0821.3026.0650.9971.7027.4522.6535.42
5.64 to 100.8223.66
-48-
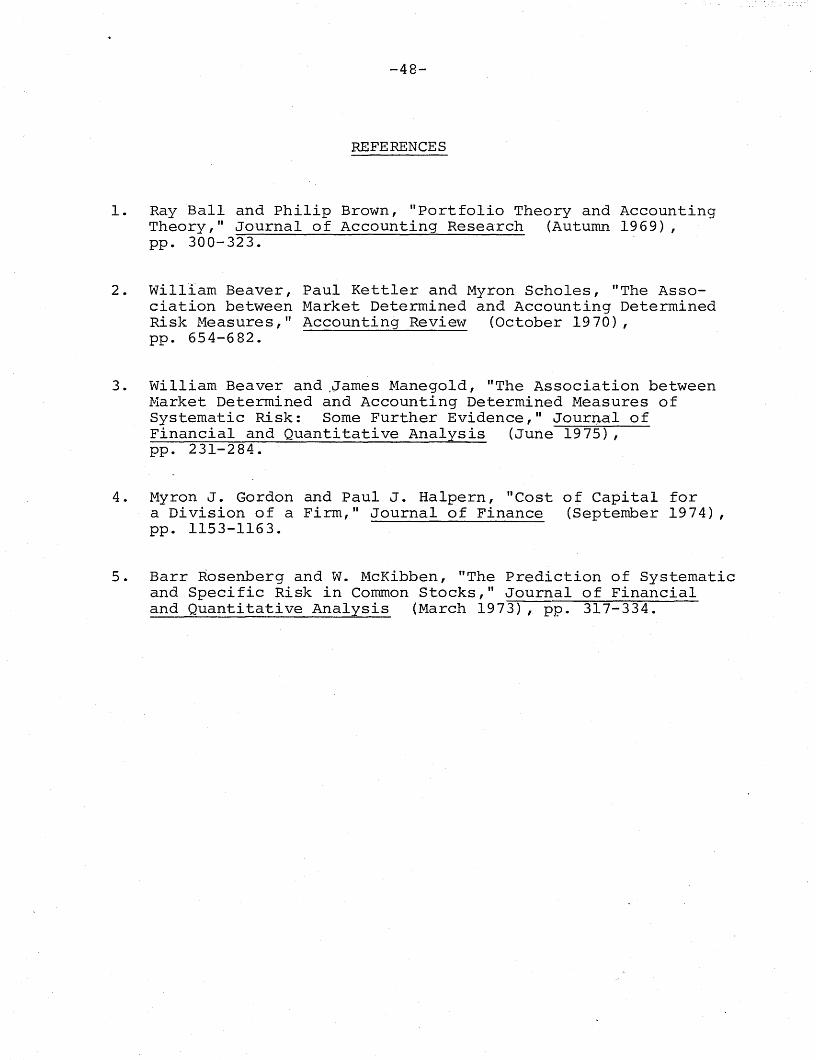
REFERENCES
1. Ray Ball and Philip Brown, "Portfolio Theory and AccountingTheory," Journal of Accounting Research (Autumn 1969) ,pp . 300- 323 .
2. William Beaver, Paul Kettler and Myron Scholes, "The Association between Market Determined and Accounting DeterminedRisk Measures," Accounting Review (October 1970),pp. 654-682.
3. William Beaver and .James t-1anegold, "The Association betweenMarket Determined and Accounting Determined Measures ofSystematic Risk: Some Further Evidence," Journ..al ofFinancial and Quantitative Analysis (June 1975),pp. 231-284.
4. Myron J. Gordon and Paul J. Halpern, "Cost of Capital fora Division of a Firm," Journal of Finance (September 1974),pp. 1153-1163.
5. Barr Rosenberg and W. McKibben, "The Prediction of Systematicand Specific Risk in Cornmon Stocks," Journal of Financialand Quantitative Analysis (March 1973), pp. 317-334.