Embed Size (px)
Citation preview
1. INTRODUCTION
Measurements of rock mass elastic modulus are scale-dependent (Heuze, 1980), complicating efforts to translate laboratory results from core sample testing to scales relevant for most rock engineering problems (Cai et al., 2004). Micro- and macroscopic discontinuities separating intact rock fragments are variably compliant features (Li, 2001; Zangerl et al., 2008), making the rock mass deformation (Em) and elastic (Ee) moduli (sensu ISRM, 1975) well below the Young’s modulus obtained from corresponding intact rock specimens (Ei) (Farmer and Kemeny, 1992; Wyllie, 2003). Accurate prediction of rock mass deformation is crucial in a wide variety of rock engineering applications (e.g. tunnel support, foundations), highlighting the relevance of modulus measurements at engineering-relevant scales.
Different approaches have been proposed to measure or estimate the deformation and elastic moduli of in-situ rock masses (ISRM, 1979; Palmström and Singh, 2001; Cai et al., 2004; Hoek and Diederichs, 2006). In-situ tests, such as plate jacking, measure stresses and strain over relevant scales (usually by diametrically loading a small tunnel or test adit), but they are time consuming and expensive to perform, and the results are affected by excavation damage. A more common approach is to estimate rock mass modulus from empirical relations,
often non-linear, developed by comparing in-situ test measurements with rock mass classification schemes, e.g. RMR, GSI, and Q (Hoek and Diederichs, 2006). For massive rock (i.e. rock masses containing few joints), Palmström and Singh (2001) proposed the simplified relationship Em = 0.5 ∙ Ei. In all cases, a high degree of variability is anticipated between the estimated and performance-based rock mass modulus.
Seismic methods represent an alternative means of measuring in-situ elastic properties of rock masses. A variety of surface and borehole techniques can be used to measure p- and s-wave velocities over different length scales, and thus calculate the elastic material constants (Barton, 2007). However, a large difference in strain amplitudes between static (e.g. compression testing) and dynamic seismic loads (strains on the order 10-3, 10-6, respectively) gives rise to the common observation that dynamic moduli resolved from field seismic data are typically several times larger than the corresponding in-situ rock mass elastic modulus (Link, 1964; Kujundzíc and Grujíc, 1966). In general, elastic moduli increase at higher confining pressures with closure of cracks, but can decrease for larger magnitude loading cycles (about the same mean stress) as more discontinuities close (Deere and Miller, 1966; Barton, 2007).
Here we describe an unconventional method to resolve global rock mass elastic modulus (Ee) from seismic
ARMA 17-734 Estimating rock mass elastic modulus from seismic resonance measurements Moore, J.R., Geimer, P., and Thorne, M.S. University of Utah, Department of Geology & Geophysics, Salt Lake City, Utah, USA
Copyright 2017 ARMA, American Rock Mechanics Association This paper was prepared for presentation at the 51st US Rock Mechanics / Geomechanics Symposium held in San Francisco, California, USA, 25-28 June 2017. This paper was selected for presentation at the symposium by an ARMA Technical Program Committee based on a technical and critical review of the paper by a minimum of two technical reviewers. The material, as presented, does not necessarily reflect any position of ARMA, its officers, or members. Electronic reproduction, distribution, or storage of any part of this paper for commercial purposes without the written consent of ARMA is prohibited. Permission to reproduce in print is restricted to an abstract of not more than 200 words; illustrations may not be copied. The abstract must contain conspicuous acknowledgement of where and by whom the paper was presented.
ABSTRACT: Measuring the elastic modulus of in-situ rock masses over scales of tens of meters remains an important challenge in experimental rock mechanics. We present a new approach using ambient resonance measurements of freestanding rock masses to identify vibrational modes, which are then matched with numerical models implementing bulk, globally representative material properties. The result is an experimentally determined, albeit numerically calibrated, estimate of rock mass elastic modulus. We demonstrate the approach at four natural rock arches in southern Utah where we have acquired resonance data and been able to match experimental resonant modes using 3D numerical analysis. Two material properties can be varied to match experimental data, density and modulus; we hold the former constant applying measured or common values and solve for modulus using a forward approach. The resolved modulus is representative of the global small-strain dynamic behavior, integrating rock mass heterogeneity over the scale of the feature. The technique works well for freestanding geological features that exhibit clear vibrational modes. Errors arise with uncertain mechanical boundary conditions. We propose the resolved global value of modulus adds relevant information describing the variation of elastic properties over scales from lab samples to in-situ rock masses.
resonance measurements of freestanding geological features with dimensions of tens of meters. We present data from four natural arches in Utah formed in Navajo Sandstone, where we have measured resonant modes from ambient seismic data and used these results to calibrate 3D numerical models. The elastic modulus resolved from this procedure represents the small-strain dynamic behavior of the entire feature, thus integrating rock mass heterogeneity over large scales to provide a representative value not readily determined from alternative in-situ testing procedures.
2. STUDY SITES AND MATERIALS
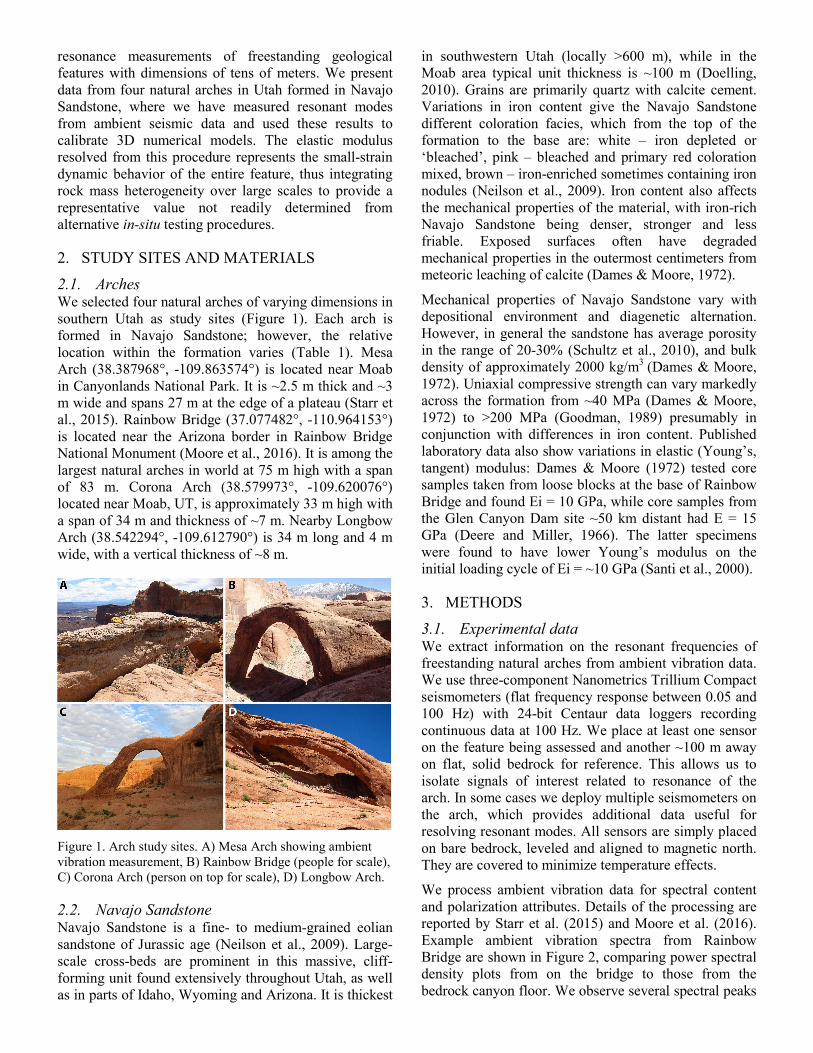
2.1. Arches We selected four natural arches of varying dimensions in southern Utah as study sites (Figure 1). Each arch is formed in Navajo Sandstone; however, the relative location within the formation varies (Table 1). Mesa Arch (38.387968°, -109.863574°) is located near Moab in Canyonlands National Park. It is ~2.5 m thick and ~3 m wide and spans 27 m at the edge of a plateau (Starr et al., 2015). Rainbow Bridge (37.077482°, -110.964153°) is located near the Arizona border in Rainbow Bridge National Monument (Moore et al., 2016). It is among the largest natural arches in world at 75 m high with a span of 83 m. Corona Arch (38.579973°, -109.620076°) located near Moab, UT, is approximately 33 m high with a span of 34 m and thickness of ~7 m. Nearby Longbow Arch (38.542294°, -109.612790°) is 34 m long and 4 m wide, with a vertical thickness of ~8 m.
Figure 1. Arch study sites. A) Mesa Arch showing ambient vibration measurement, B) Rainbow Bridge (people for scale), C) Corona Arch (person on top for scale), D) Longbow Arch.
2.2. Navajo Sandstone Navajo Sandstone is a fine- to medium-grained eolian sandstone of Jurassic age (Neilson et al., 2009). Large-scale cross-beds are prominent in this massive, cliff-forming unit found extensively throughout Utah, as well as in parts of Idaho, Wyoming and Arizona. It is thickest
in southwestern Utah (locally >600 m), while in the Moab area typical unit thickness is ~100 m (Doelling, 2010). Grains are primarily quartz with calcite cement. Variations in iron content give the Navajo Sandstone different coloration facies, which from the top of the formation to the base are: white – iron depleted or ‘bleached’, pink – bleached and primary red coloration mixed, brown – iron-enriched sometimes containing iron nodules (Neilson et al., 2009). Iron content also affects the mechanical properties of the material, with iron-rich Navajo Sandstone being denser, stronger and less friable. Exposed surfaces often have degraded mechanical properties in the outermost centimeters from meteoric leaching of calcite (Dames & Moore, 1972).
Mechanical properties of Navajo Sandstone vary with depositional environment and diagenetic alternation. However, in general the sandstone has average porosity in the range of 20-30% (Schultz et al., 2010), and bulk density of approximately 2000 kg/m3 (Dames & Moore, 1972). Uniaxial compressive strength can vary markedly across the formation from ~40 MPa (Dames & Moore, 1972) to >200 MPa (Goodman, 1989) presumably in conjunction with differences in iron content. Published laboratory data also show variations in elastic (Young’s, tangent) modulus: Dames & Moore (1972) tested core samples taken from loose blocks at the base of Rainbow Bridge and found Ei = 10 GPa, while core samples from the Glen Canyon Dam site ~50 km distant had E = 15 GPa (Deere and Miller, 1966). The latter specimens were found to have lower Young’s modulus on the initial loading cycle of Ei = ~10 GPa (Santi et al., 2000).
3. METHODS
3.1. Experimental data We extract information on the resonant frequencies of freestanding natural arches from ambient vibration data. We use three-component Nanometrics Trillium Compact seismometers (flat frequency response between 0.05 and 100 Hz) with 24-bit Centaur data loggers recording continuous data at 100 Hz. We place at least one sensor on the feature being assessed and another ~100 m away on flat, solid bedrock for reference. This allows us to isolate signals of interest related to resonance of the arch. In some cases we deploy multiple seismometers on the arch, which provides additional data useful for resolving resonant modes. All sensors are simply placed on bare bedrock, leveled and aligned to magnetic north. They are covered to minimize temperature effects.
We process ambient vibration data for spectral content and polarization attributes. Details of the processing are reported by Starr et al. (2015) and Moore et al. (2016). Example ambient vibration spectra from Rainbow Bridge are shown in Figure 2, comparing power spectral density plots from on the bridge to those from the bedrock canyon floor. We observe several spectral peaks
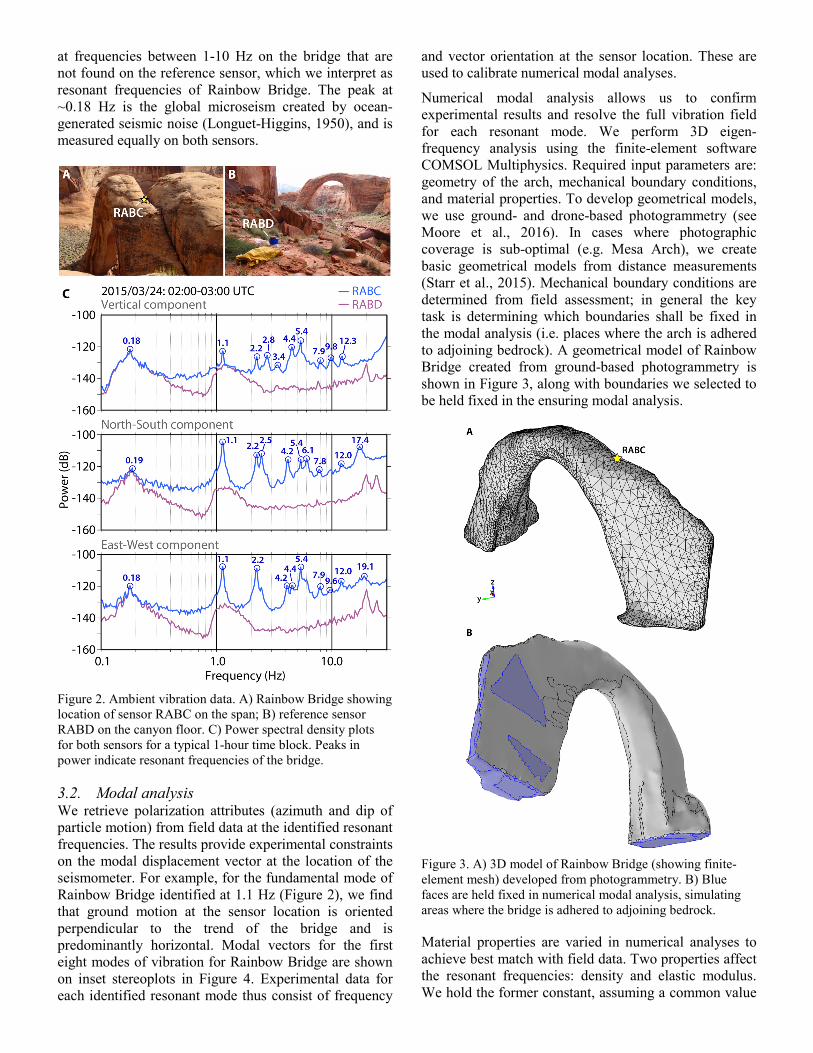
at frequencies between 1-10 Hz on the bridge that are not found on the reference sensor, which we interpret as resonant frequencies of Rainbow Bridge. The peak at ~0.18 Hz is the global microseism created by ocean-generated seismic noise (Longuet-Higgins, 1950), and is measured equally on both sensors.
Figure 2. Ambient vibration data. A) Rainbow Bridge showing location of sensor RABC on the span; B) reference sensor RABD on the canyon floor. C) Power spectral density plots for both sensors for a typical 1-hour time block. Peaks in power indicate resonant frequencies of the bridge.
3.2. Modal analysis We retrieve polarization attributes (azimuth and dip of particle motion) from field data at the identified resonant frequencies. The results provide experimental constraints on the modal displacement vector at the location of the seismometer. For example, for the fundamental mode of Rainbow Bridge identified at 1.1 Hz (Figure 2), we find that ground motion at the sensor location is oriented perpendicular to the trend of the bridge and is predominantly horizontal. Modal vectors for the first eight modes of vibration for Rainbow Bridge are shown on inset stereoplots in Figure 4. Experimental data for each identified resonant mode thus consist of frequency
and vector orientation at the sensor location. These are used to calibrate numerical modal analyses.
Numerical modal analysis allows us to confirm experimental results and resolve the full vibration field for each resonant mode. We perform 3D eigen-frequency analysis using the finite-element software COMSOL Multiphysics. Required input parameters are: geometry of the arch, mechanical boundary conditions, and material properties. To develop geometrical models, we use ground- and drone-based photogrammetry (see Moore et al., 2016). In cases where photographic coverage is sub-optimal (e.g. Mesa Arch), we create basic geometrical models from distance measurements (Starr et al., 2015). Mechanical boundary conditions are determined from field assessment; in general the key task is determining which boundaries shall be fixed in the modal analysis (i.e. places where the arch is adhered to adjoining bedrock). A geometrical model of Rainbow Bridge created from ground-based photogrammetry is shown in Figure 3, along with boundaries we selected to be held fixed in the ensuring modal analysis.
Figure 3. A) 3D model of Rainbow Bridge (showing finite-element mesh) developed from photogrammetry. B) Blue faces are held fixed in numerical modal analysis, simulating areas where the bridge is adhered to adjoining bedrock.
Material properties are varied in numerical analyses to achieve best match with field data. Two properties affect the resonant frequencies: density and elastic modulus. We hold the former constant, assuming a common value
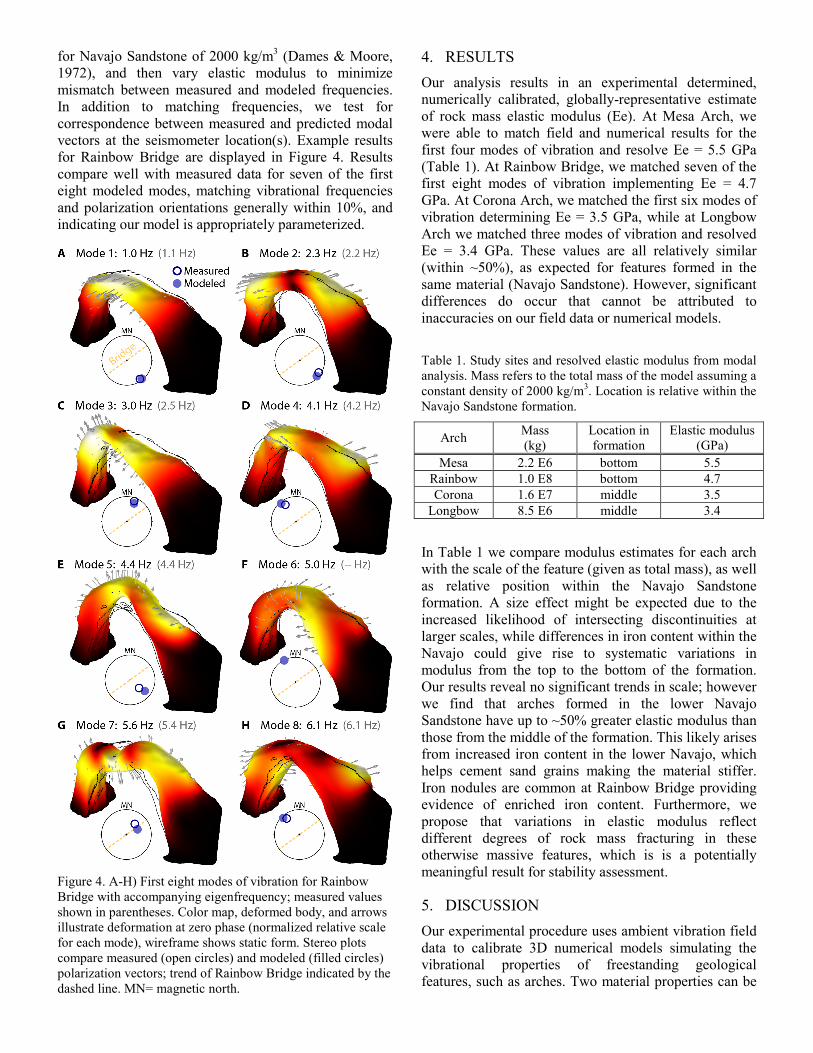
for Navajo Sandstone of 2000 kg/m3 (Dames & Moore, 1972), and then vary elastic modulus to minimize mismatch between measured and modeled frequencies. In addition to matching frequencies, we test for correspondence between measured and predicted modal vectors at the seismometer location(s). Example results for Rainbow Bridge are displayed in Figure 4. Results compare well with measured data for seven of the first eight modeled modes, matching vibrational frequencies and polarization orientations generally within 10%, and indicating our model is appropriately parameterized.
Figure 4. A-H) First eight modes of vibration for Rainbow Bridge with accompanying eigenfrequency; measured values shown in parentheses. Color map, deformed body, and arrows illustrate deformation at zero phase (normalized relative scale for each mode), wireframe shows static form. Stereo plots compare measured (open circles) and modeled (filled circles) polarization vectors; trend of Rainbow Bridge indicated by the dashed line. MN= magnetic north.
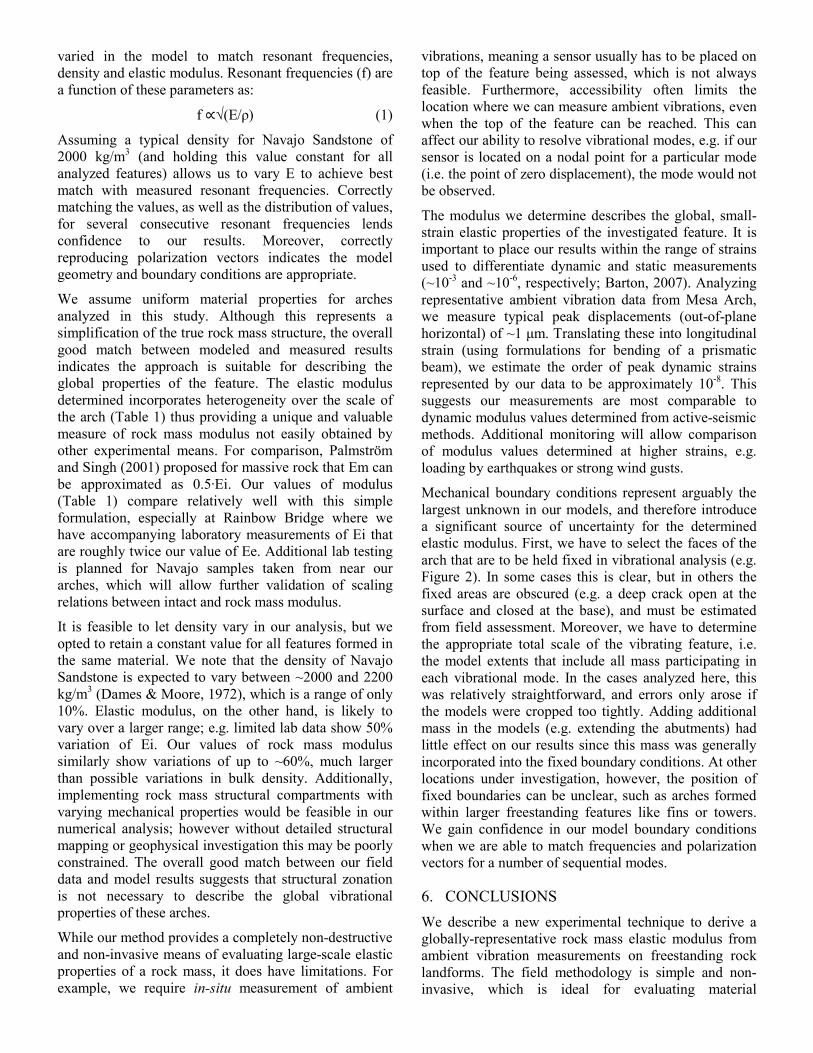
4. RESULTS Our analysis results in an experimental determined, numerically calibrated, globally-representative estimate of rock mass elastic modulus (Ee). At Mesa Arch, we were able to match field and numerical results for the first four modes of vibration and resolve Ee = 5.5 GPa (Table 1). At Rainbow Bridge, we matched seven of the first eight modes of vibration implementing Ee = 4.7 GPa. At Corona Arch, we matched the first six modes of vibration determining Ee = 3.5 GPa, while at Longbow Arch we matched three modes of vibration and resolved Ee = 3.4 GPa. These values are all relatively similar (within ~50%), as expected for features formed in the same material (Navajo Sandstone). However, significant differences do occur that cannot be attributed to inaccuracies on our field data or numerical models.
Table 1. Study sites and resolved elastic modulus from modal analysis. Mass refers to the total mass of the model assuming a constant density of 2000 kg/m3. Location is relative within the Navajo Sandstone formation.
Arch Mass (kg)
Location in formation
Elastic modulus (GPa)
Mesa 2.2 E6 bottom 5.5 Rainbow 1.0 E8 bottom 4.7 Corona 1.6 E7 middle 3.5
Longbow 8.5 E6 middle 3.4
In Table 1 we compare modulus estimates for each arch with the scale of the feature (given as total mass), as well as relative position within the Navajo Sandstone formation. A size effect might be expected due to the increased likelihood of intersecting discontinuities at larger scales, while differences in iron content within the Navajo could give rise to systematic variations in modulus from the top to the bottom of the formation. Our results reveal no significant trends in scale; however we find that arches formed in the lower Navajo Sandstone have up to ~50% greater elastic modulus than those from the middle of the formation. This likely arises from increased iron content in the lower Navajo, which helps cement sand grains making the material stiffer. Iron nodules are common at Rainbow Bridge providing evidence of enriched iron content. Furthermore, we propose that variations in elastic modulus reflect different degrees of rock mass fracturing in these otherwise massive features, which is is a potentially meaningful result for stability assessment.
5. DISCUSSION Our experimental procedure uses ambient vibration field data to calibrate 3D numerical models simulating the vibrational properties of freestanding geological features, such as arches. Two material properties can be
varied in the model to match resonant frequencies, density and elastic modulus. Resonant frequencies (f) are a function of these parameters as:
f ∝√(E/ρ) (1)
Assuming a typical density for Navajo Sandstone of 2000 kg/m3 (and holding this value constant for all analyzed features) allows us to vary E to achieve best match with measured resonant frequencies. Correctly matching the values, as well as the distribution of values, for several consecutive resonant frequencies lends confidence to our results. Moreover, correctly reproducing polarization vectors indicates the model geometry and boundary conditions are appropriate.
We assume uniform material properties for arches analyzed in this study. Although this represents a simplification of the true rock mass structure, the overall good match between modeled and measured results indicates the approach is suitable for describing the global properties of the feature. The elastic modulus determined incorporates heterogeneity over the scale of the arch (Table 1) thus providing a unique and valuable measure of rock mass modulus not easily obtained by other experimental means. For comparison, Palmström and Singh (2001) proposed for massive rock that Em can be approximated as 0.5∙Ei. Our values of modulus (Table 1) compare relatively well with this simple formulation, especially at Rainbow Bridge where we have accompanying laboratory measurements of Ei that are roughly twice our value of Ee. Additional lab testing is planned for Navajo samples taken from near our arches, which will allow further validation of scaling relations between intact and rock mass modulus.
It is feasible to let density vary in our analysis, but we opted to retain a constant value for all features formed in the same material. We note that the density of Navajo Sandstone is expected to vary between ~2000 and 2200 kg/m3 (Dames & Moore, 1972), which is a range of only 10%. Elastic modulus, on the other hand, is likely to vary over a larger range; e.g. limited lab data show 50% variation of Ei. Our values of rock mass modulus similarly show variations of up to ~60%, much larger than possible variations in bulk density. Additionally, implementing rock mass structural compartments with varying mechanical properties would be feasible in our numerical analysis; however without detailed structural mapping or geophysical investigation this may be poorly constrained. The overall good match between our field data and model results suggests that structural zonation is not necessary to describe the global vibrational properties of these arches.
While our method provides a completely non-destructive and non-invasive means of evaluating large-scale elastic properties of a rock mass, it does have limitations. For example, we require in-situ measurement of ambient
vibrations, meaning a sensor usually has to be placed on top of the feature being assessed, which is not always feasible. Furthermore, accessibility often limits the location where we can measure ambient vibrations, even when the top of the feature can be reached. This can affect our ability to resolve vibrational modes, e.g. if our sensor is located on a nodal point for a particular mode (i.e. the point of zero displacement), the mode would not be observed.
The modulus we determine describes the global, small-strain elastic properties of the investigated feature. It is important to place our results within the range of strains used to differentiate dynamic and static measurements (~10-3 and ~10-6, respectively; Barton, 2007). Analyzing representative ambient vibration data from Mesa Arch, we measure typical peak displacements (out-of-plane horizontal) of ~1 μm. Translating these into longitudinal strain (using formulations for bending of a prismatic beam), we estimate the order of peak dynamic strains represented by our data to be approximately 10-8. This suggests our measurements are most comparable to dynamic modulus values determined from active-seismic methods. Additional monitoring will allow comparison of modulus values determined at higher strains, e.g. loading by earthquakes or strong wind gusts.
Mechanical boundary conditions represent arguably the largest unknown in our models, and therefore introduce a significant source of uncertainty for the determined elastic modulus. First, we have to select the faces of the arch that are to be held fixed in vibrational analysis (e.g. Figure 2). In some cases this is clear, but in others the fixed areas are obscured (e.g. a deep crack open at the surface and closed at the base), and must be estimated from field assessment. Moreover, we have to determine the appropriate total scale of the vibrating feature, i.e. the model extents that include all mass participating in each vibrational mode. In the cases analyzed here, this was relatively straightforward, and errors only arose if the models were cropped too tightly. Adding additional mass in the models (e.g. extending the abutments) had little effect on our results since this mass was generally incorporated into the fixed boundary conditions. At other locations under investigation, however, the position of fixed boundaries can be unclear, such as arches formed within larger freestanding features like fins or towers. We gain confidence in our model boundary conditions when we are able to match frequencies and polarization vectors for a number of sequential modes.
6. CONCLUSIONS We describe a new experimental technique to derive a globally-representative rock mass elastic modulus from ambient vibration measurements on freestanding rock landforms. The field methodology is simple and non-invasive, which is ideal for evaluating material
properties of culturally significant or fragile geologic features. We determined the elastic modulus of four natural arches in southern Utah, each formed in Navajo Sandstone. The estimated rock mass modulus ranges from 3.4-5.5 GPa, values which are approximately half the intact rock modulus measured from laboratory core testing. Variations across the studied features are significant (i.e. not explained by error or uncertainty), and are most likely related to differing amounts of iron content correlated with stratigraphic position. We study rock arches in particular, but the technique is equally suitable for assessing other natural and man-made features. Complications arise in the case of uncertain mechanical boundary conditions implemented in numerical modal analyses. We propose the approach offers a useful method for in-situ assessment of global rock mass modulus, an important material property not easily determined from field testing.
REFERENCES Barton, N. 2007. Rock quality, seismic velocity, attenuation and anisotropy. CRC press.
Cai, M., P.K. Kaiser, H. Uno, Y. Tasaka, and M. Minami. 2004. Estimation of rock mass deformation modulus and strength of jointed hard rock masses using the GSI system, International Journal of Rock Mechanics and Mining Sciences, 41(1), 3-19.
Dames & Moore. 1972. Geological and structural evaluation of Rainbow Bridge, Rainbow Bridge National Monument, Utah, Unpublished consultant's report to the Upper Colorado River Commission, Salt Lake City.
Deere, D.U. and R.P. Miller. 1966. Engineering classification and index properties for intact rock, Technical Report AFWL-TR-65-116 for the Air Force Weapons Laboratory, NM.
Doelling, H.H. 2010. Geology of Arches National Park, Utah, in: D.A. Sprinkel, T.C. Chidsey, P.B. Anderson (Eds.), Geology of Utah's Parks and Monuments, Utah Geological Association Publication, 28, 11-36.
Farmer I. W. and J.M. Kemeny. 1992. Deficiencies in rock test data. Proc. Int. Conf. Eurock '92, Thomas Telford, London, pp. 298-303.
Goodman, R.E. 1989. Introduction to Rock Mechanics, Wiley.
Heuze, F.E. 1980. Scale effects in the determination of rock mass strength and deformability, Rock Mechanics, 12(3-4), 167-192.
Hoek, E. and M.S. Diederichs. 2006. Empirical estimation of rock mass modulus, International Journal of Rock Mechanics and Mining Sciences, 43(2), 203-215.
ISRM. 1975. Commission on terminology, symbols and graphic representation, International Society for Rock Mechanics (ISRM).
ISRM. 1979. Suggested methods for determining in situ deformability of rock. Int. J. Rock Mech. Min. Sci. & Geomech. Abstr., 16, 195-214.
Kujundzíc, B. 1979. Use of tests and monitoring in the design and construction of rock structures. Proc. of 4th Int. Congr. Rock Mech. (ISRM), Montreux: 3: 181–186. Rotterdam: Balkema.
Li, C. 2001. A method for graphically presenting the deformation modulus of jointed rock masses, Rock mechanics and rock engineering, 34(1), 67-75.
Link, H. 1964. Evaluation of elasticity moduli of dam foundation rock determined seismically in comparison to those arrived at statically. Int. Congress on Large Dams, 8. Edinburgh 1964. 1(Q28): 833–858. Paris: ICOLD.
Longuet-Higgins, M.S. 1950. A theory of the origin of microseisms, Philos. Trans. R. Soc. London Ser. A Math. Phys. Sci., 243, 1–35.
Moore, J.R., M.S. Thorne, K.D. Koper, J.R. Wood, K. Goddard, R. Burlacu, S. Doyle, E. Stanfield, and B. White. 2016. Anthropogenic sources stimulate resonance of a natural rock bridge, Geophysical Research Letters, 43, 9669–9676, doi:10.1002/2016GL070088.
Nielsen, G., M.A. Chan, and E.U. Petersen. 2009. Diagenetic coloration facies and alteration history of the Jurassic Navajo Sandstone, Zion National Park and vicinity, southwestern Utah, in Tripp, B.T., Krahulec, K., and Jordan, J.L., eds., Geology and Geological Resources and Issues of Western Utah, Utah Geological Association Publication 38, 67–96.
Palmström, A., and R. Singh. 2001. The deformation modulus of rock masses—comparisons between in situ tests and indirect estimates. Tunnelling and Underground Space Technology, 16(2), 115-131.
Santi, P.M., J.E. Holschen, and R.W. Stephenson. 2000. Improving elastic modulus measurements for rock based on geology, Environmental & Engineering Geoscience, 6(4), 333-346.
Schultz, R.A., C.H. Okubo, and H. Fossen. 2010. Porosity and grain size controls on compaction band formation in Jurassic Navajo Sandstone, Geophys. Res. Lett., 37, L22306, doi:10.1029/2010GL044909.
Starr, A.M., J.R. Moore, and M.S. Thorne 2015. Ambient resonance of Mesa Arch, Canyonlands National Park, Utah, Geophys. Res. Lett., 42, doi:10.1002/ 2015GL064917.
Wyllie, D.C. 2003. Foundations on rock: engineering practice, CRC Press.
Zangerl, C., K. F. Evans, E. Eberhardt, and S. Loew. 2008 Normal stiffness of fractures in granitic rock: A compilation of laboratory and in-situ experiments, Int. J. Rock Mech. Min. Sci., 8, 1500–1507.