Embed Size (px)
Citation preview

Establishing the IntegrityEstablishing the Integrity
of Data: of Data: Measurement Systems Measurement Systems
AnalysisAnalysis
prepared byprepared by
Jeffrey T. Luftig, Ph.D.Jeffrey T. Luftig, Ph.D.W. Edwards Deming Professor of ManagementW. Edwards Deming Professor of Management
Lockheed Martin Engineering Management ProgramLockheed Martin Engineering Management Program
University of Colorado at Boulder University of Colorado at Boulder

TopicsTopics
Measurement Scales and Types of Data
Establishing the Reliability and Validity of
Instrumentation, or Precision and Accuracy of
Instrumentation
Measurement Scales and DataMeasurement Scales and Data

Measurement Scales and DataMeasurement Scales and Data

Measurement as a ProcessMeasurement as a Process
As in any process, regardless of the nature of data collected or generated, measurement systems must demonstrateStability through time, or controlMinimal variation as a proportion of
specifications, or capabilityMinimal variation as a proportion of
process variation

Measurement as a ProcessMeasurement as a Process
MEASUREMENTPROCESS Equipment
Standard
Procedure
Operator
Measurement
AmbientEnvironmentalCharacteristics
Product or Process to be
Measured

Definition of TermsDefinition of Terms
Reference ValueThe theoretically or agreed upon correct value of
the characteristic being measured, traceable to some standard
ResolutionThe smallest increment, or unit of measure,
available from a measurement processGenerally at least 1/10th of the specification range

PrecisionThe degree of agreement (or variability)
between individual measurements or test results from measuring the same specimen(s)
Accuracy (Bias)The difference between the average of the
measurement error distribution and the reference value of the specimen measured
Definition of TermsDefinition of Terms

Precision vs. AccuracyPrecision vs. Accuracy
Accuracy
Pre
cisi
on

RepeatabilityThe variation in repeated measurements of the
same items with a single measurement systemWithin appraiser/system variation
ReproducibilityThe variation in the average measurements by
different appraisers or systems measuring the same items
Between appraiser/system variation
Definition of TermsDefinition of Terms

Measurement ErrorMeasurement Error
Reference Value
Accuracy(Bias)
Distribution of repeatedmeasures on a singlespecimen or part
Precision - Repeatability - Reproducibility

TermsTerms
LinearityThe degree to which bias changes with
changes in the magnitude of the characteristic measured
StabilityThe dependability, or consistency of the
measurement process over time

MeasurementMeasurementSystems CapabilitySystems Capability
The variability resulting from measurement error must not exceed a significant proportion of the intended specifications said to be capable
In addition, it is not desirable for measurement error to exceed a significant proportion of the total process variability
Capability is not the same as acceptability, acceptability must be determined on a case by case basis

Measurement Systems CapabilityMeasurement Systems Capability
22RpdRptE
LSL USL
5.15E
(USL - LSL)
MeasurementError Distribution
100LSL USL
5.15 R&R % E
Measurement System StudiesMeasurement System Studies
Potential StudiesAssess potential of a measurement system
to be capable over the long term10 parts measured 2–3 times by one or
more appraisersA “quick and dirty” study to find out if you
are in the ballparkAssesses repeatability and reproducibilityOften called an R&R study

Measurement System StudiesMeasurement System StudiesPotential Studies
Error Through Time
Bias Through Time
Tests of Between-Subjects Effects
Dependent Variable: ADAS ADA within Period
54.021 3 18.007 .876 .469
325.873 7 46.553
431.604 21 20.553
811.498 31
SourceTime Period
Specimen
Residual
Total
Type III Sumof Squares df Mean Square F Sig.
Tests of Between-Subjects Effects
Dependent Variable: MEASURE Gram Weight
21.844 3 7.281 .097 .961
925.719 7 132.246
1571.406 21 74.829
2518.969 31
SourceTime Period
Specimen
Residual
Total
Type III Sumof Squares df Mean Square F Sig.

Measurement System StudiesMeasurement System Studies
Multiple Comparisons
Dependent Variable: Gram Weight
Tukey HSD
-.75 4.33 .998 -12.81 11.31
1.50 4.33 .985 -10.56 13.56
-.13 4.33 1.000 -12.18 11.93
.75 4.33 .998 -11.31 12.81
2.25 4.33 .953 -9.81 14.31
.63 4.33 .999 -11.43 12.68
-1.50 4.33 .985 -13.56 10.56
-2.25 4.33 .953 -14.31 9.81
-1.63 4.33 .981 -13.68 10.43
.13 4.33 1.000 -11.93 12.18
-.63 4.33 .999 -12.68 11.43
1.63 4.33 .981 -10.43 13.68
(J) Time of Day PartsWere Measured2 Late Morning
3 Early Afternoon
4 Late Afternoon
1 Early Morning
3 Early Afternoon
4 Late Afternoon
1 Early Morning
2 Late Morning
4 Late Afternoon
1 Early Morning
2 Late Morning
3 Early Afternoon
(I) Time of Day PartsWere Measured1 Early Morning
2 Late Morning
3 Early Afternoon
4 Late Afternoon
MeanDifference
(I-J) Std. Error Sig. Lower Bound Upper Bound
95% Confidence Interval
Based on observed means.
Gram Weight
Tukey HSDa,b
8 461.63
8 463.13
8 463.25
8 463.88
.953
Time of Day PartsWere Measured3 Early Afternoon
1 Early Morning
4 Late Afternoon
2 Late Morning
Sig.
N 1
Subset
Means for groups in homogeneous subsets are displayed.Based on Type III Sum of SquaresThe error term is Mean Square(Error) = 74.829.
Uses Harmonic Mean Sample Size = 8.000.a.
Alpha = .05.b.
Mean Gram Weight Values Repeated Through Time
Time of Day Parts Were Measured
Late AfternoonEarly AfternoonLate MorningEarly Morning
Est
ima
ted
Me
an
s
464.0
463.5
463.0
462.5
462.0
461.5
Potential Studies (continued)

Results & Conclusions: Evaluating the Results & Conclusions: Evaluating the Precision & Accuracy of the Measurement Precision & Accuracy of the Measurement
SystemSystem This result of the
previous analysis allows us to calculate the
average variance of the repeated
measures, which when we take its square root gives us the estimate of
the standard deviation due to
measurement error:
2 = 66.39 = 8.15

Results & Conclusions: Evaluating the Results & Conclusions: Evaluating the Precision & Accuracy of the Measurement Precision & Accuracy of the Measurement
SystemSystem Using the estimate of
measurement error, we can calculate the Precision-Tolerance
ratio, which in the case of short-term studies, should be
less than 10%. Assuming the
engineering tolerance for this process is 470 (USL) – 450(LSL) =
20:
2 = 66.39 = 8.15
P/T = Precision-Tolerance Ratio = = 6() / USL-LSL = 6(8.15) / 470 – 450 = 2.44 = 244% > 10% Requirement (S-T)

Results & Conclusions: Evaluating the Results & Conclusions: Evaluating the Precision & Accuracy of the Measurement Precision & Accuracy of the Measurement
SystemSystem
Likewise, we can estimate the
Accuracy (amount of Bias) in the scale by calculating the
average of the differences between
the Means of the Repeated Measures and the True Values for the associated
specimens:
= -3.09
Estimate Bias at 3.09 Grams; as compared to the Precision estimate, this is arguably an inconsequential value.

Measurement System StudiesMeasurement System Studies
Short-term Studies25 parts measured 5-8 times by one or
more appraisersA more thorough short-term assessment
Long-term Studies8-10 parts measured 25+ times by one or
more appraisersAssesses through time stability

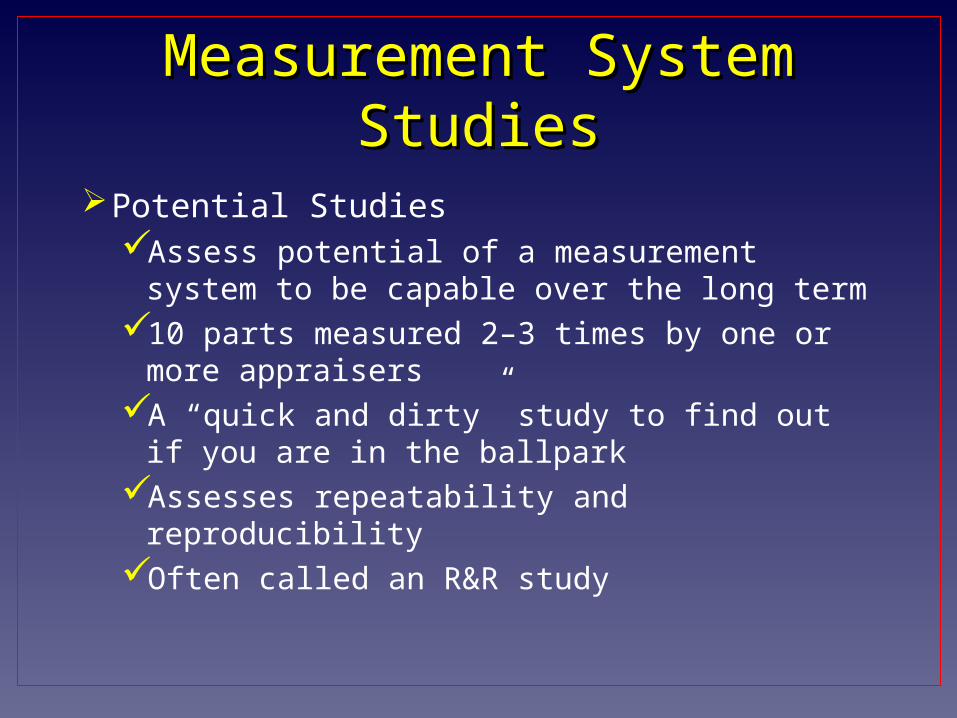
Measurement System StudiesMeasurement System Studies
Long-term Studies
Measurement System StudiesMeasurement System Studies
Long-term Studies

Measurement Systems Measurement Systems RequirementsRequirements
SummarySummary Regardless of the type of data gathered by an
instrument, and the assessment methodology employed, the instrument or device utilized to obtain criterion data must meet three requirements before the experiment should proceed: The instrument must be precise or reliable; The instrument must be accurate or valid; and The instrument should be / must be operating in a state
of statistical control.

25
Sources and References The material used in the PowerPoint presentations associated with this course was drawn from a number of sources. Specifically, much of the content included was adopted or adapted from the following previously-published material:
Luftig, J. A Quality Improvement Strategy for Critical Product and Process Characteristics. Luftig & Associates, Inc. Farmington Hills, MI, 1991
Spooner-Jordan, V. Understanding Variation. Luftig & Warren International, Southfield, MI 1996
Luftig, J. and Petrovich, M. Quality with Confidence in Manufacturing. SPSS, Inc. Chicago, IL 1997
Littlejohn, R., Ouellette, S., & Petrovich, M. Black Belt Business Improvement Specialist Training, Luftig & Warren International, 2000
Ouellette, S. Six Sigma Champion Training, ROI Alliance, LLC & Luftig & Warren, International, Southfield, MI 2005
Luftig, J. An Overview of Total Quality Management, Luftig & Warren, International, 1992
Luftig, J. Dr. Deming’s Theory of Profound Knowledge as a Foundation for Strategic Planning and Policy Deployment, Luftig & Warren, International, 1997
Luftig, J. and Jordan, V. Design of Experiments in Quality Engineering, McGraw-Hill/Irwin Publishing Company, 1998