Embed Size (px)
Citation preview

ESTABLISHING SCALE INHIBITOR RETENTION
MECHANISMS IN PURE ADSORPTION AND COUPLED
ADSORPTION/PRECIPITATION TREATMENTS
The Thesis by
JAMAL MOHAMAD BIN MOHAMAD IBRAHIM
Submitted for the Degree of
Doctor of Philosophy in Petroleum Engineering
Institute of Petroleum Engineering
Heriot-Watt University
Edinburgh, Scotland, UK
November 2011
This copy of the thesis has been supplied on condition that anyone who consults it is understood
to recognise that the copyright rests with its author and that no quotation from the thesis and no
information derived from it may be published without the prior written consent of the author or
of the University (as may be appropriate).

ii
ABSTRACT
One of the most common and efficient ways for preventing formation of inorganic
solids deposition such as carbonate and sulphate scales in reservoir and near wellbore
formation is by applying scale inhibitor (SI) squeeze treatments. The two main
mechanisms that govern the scale inhibitor retention and release process in the
formation are by adsorption/desorption and precipitation/dissolution. They are
described by different but related modelling approaches, and there is not complete
agreement in the literature about when to use one mechanistic description or another.
The equilibrium adsorption isotherm determines the general nature and extent of the
scale inhibitor return process in the low concentration flow regime. However, the
additional SI “loading” within the near wellbore formation may be greatly enhanced by
precipitation. The dynamic effects of adsorption and precipitation, also have a strong
bearing on a field squeeze treatment and may significantly affect the profile of the
inhibitor return curve.
Field observations are not accurate enough to distinguish between different mechanisms
and a detailed analysis of a given retention mechanism (e.g. pure adsorption or coupled
adsorption/ precipitation) requires carefully designed laboratory experiments at the
appropriate “field relevant” conditions. In this study, we present novel experimental
techniques systematically from static to dynamic tests, as follows;
1. Static Adsorption/Compatibility Experiments – these experiments were
conducted on two phosphonate scale inhibitors; namely DETPMP (a penta-
phosphonate) and OMTHP (an hexa-phosphonate) using sand, kaolinite and
siderite as the mineral phase. Adsorption experiments were carried out at a range
of adsorbent mass/ fluid volume ratios (m/V), since this indicates whether we
are in the purely adsorbing or in the coupled adsorption/precipitation regime.
2. Dynamic Sand Pack Experiments – based on the static tests, OMTHP scale
inhibitor and sand mineral were selected for dynamic tests as it has the most
clearly interpretable results. The experiments were conducted using a sand pack
flow apparatus at different flow rates using identical procedures, which
demonstrates the non-equilibrium effects which occur in both adsorption and
precipitation treatments.

iii
The experimental results from static tests show excellent agreement with the theory in
different regions of pure adsorption and coupled adsorption/precipitation. Whereas for
dynamic sand pack experiments, the effect on post flush effluent inhibitor concentration
is in the same direction for each system under test, i.e. reduced flow rate leads to higher
effluent concentrations and vice-versa. These results also show clearly how such
laboratory measurements should be carried out to determine both the levels of SI
retention and the precise retention mechanism. The generated data from this work will
be used as a basis to further develop existing coupled adsorption-precipitation ()
models within the Flow Assurance Scale Team (FAST) in Institute of Petroleum
Engineering, Heriot-Watt University to improve the future prediction of scale inhibitor
squeeze treatments.

iv
ACKNOWLEDGEMENTS
I would like to express my sincere gratitude to my supervisor, Professor Ken Sorbie, for
his invaluable guidance, motivation and support throughout the course of my PhD. It
would have been difficult for me to have reached this point in my academic journey,
without the guidance and technical criticism from him, which is highly appreciated.
My endless gratitude goes to my parents for their prayers and patients through the
course of my study. Their sacrifice for providing me with all necessities and education
during the early years is immesurable. All assistance and concern from my brother,
sisters, relatives, friends, and well wishers is highly appreciated.
I am also grateful to Petroliam Nasional Berhad (PETRONAS) for their sponsorship for
funding my PhD at Heriot-Watt University, Edinburgh, UK. My sincere gratitude goes
to FAST sponsors (Baker Petrolite, BP, BG Group, BWA Water Additives, Champion
Technologies, Chevron, Clariant Oil Services, Conoco-Phillips, Halliburton, MI Swaco,
Nalco, PETROBRAS, PETRONAS, PTT, REP, Rhodia, Saudi Aramco, Shell, Statoil
Hydro, Talisman Energy, ThermPhos and Total) for their feedback during the steering
meeting.
Needless to say to all the members of the Flow Assurance and Scale Team (FAST) for
making my stay at Heriot-Watt a memorable one. Prof. Eric Mackay deserves praise for
his guidance and provision of motivation, both academic and non-academic issues. I am
grateful to Lorraine Boak for her guidance in the laboratory especially with the ICP and
the knowledge she shared throughout the years at HWU. I would like to acknowledge
Dr. Oscar Vasquez for the modelling work; Dr. Jim Buckman in providing ESEM-
EDAX data and images analysis; and Robin Shield for helping in sand pack apparatus
and Malvern particle size analyzer. I must mention William Thomas, Ivan Davies, Tom
Clark and Thomas McGravie for their assistance in the laboratory. Thanks to Mike
Singleton for leading Petronas scale project. Finally, thanks to Heather O'Hara for the
administrative help.
Special thanks to Dr. Nicholas Odling of School of Geosciences in Edinburgh
University for the XRD analysis.
I am also grateful to Dr. Ping Chen of Champion Technologies, Aberdeen and Prof.
Mehran Sohrabi of Institute of Petroleum Engineering, Heriot-Watt University for

v
agreeing to examine this thesis. Their time invested in reading and evaluation of this
thesis was invaluable.
Finally, I am sincerely grateful to my beloved wife Shamila, and my kids, Sabrina,
Hazim and Haziq. Their prayers, patience and support throughout the roller-coaster of
this PhD is highly appreciated. She made unique contributions at every step during my
research period and that really made things a lot much easier.

vi
TABLE OF CONTENTS
ABSTRACT ..................................................................................................................... II
ACKNOWLEDGEMENTS ............................................................................................ IV
TABLE OF CONTENTS ................................................................................................ VI
LIST OF FIGURES ......................................................................................................... X
LIST OF TABLES ........................................................................................................ XX
NOMENCLATURE .................................................................................................. XXIII
LIST OF PUBLICATIONS ....................................................................................... XXV
CHAPTER 1: INTRODUCTION ..................................................................................... 1
1.1 CONTROLLING SCALE PROBLEM IN THE OIL INDUSTRY .................... 1
1.2 OUTLINE ........................................................................................................... 3
CHAPTER 2: LITERATURE REVIEW .......................................................................... 6
2.1 INTRODUCTION .............................................................................................. 6
2.2 GENERAL MECHANISM GOVERNING SCALE INHIBITOR RETENTION
PROCESSES....................................................................................................... 6
2.3 REVIEW OF PREVIOUS EXPERIMENTAL STUDIES ............................... 12
2.4 SUMMARY AND CONCLUSIONS ............................................................... 21
CHAPTER 3: EXPERIMENTAL METHODOLOGY ................................................... 23
3.1 INTRODUCTION ............................................................................................ 23
3.2 STATIC COMPATIBILITY AND COUPLED ADSORPTION/
PRECIPITATION EXPERIMENTS ................................................................ 23
3.2.1 Objective .......................................................................................................... 24

vii
3.2.2 Materials ........................................................................................................... 24
3.2.3 Experimental Methodology .............................................................................. 27
3.3 NON-EQUILIBRIUM SAND PACK EXPERIMENTS .................................. 36
3.3.1 Objective .......................................................................................................... 36
3.3.2 Materials ........................................................................................................... 36
3.3.3 Experimental Methodology .............................................................................. 38
CHAPTER 4: ESTABLISHING RETENTION MECHANISMS THROUGH STATIC
COMPATIBILITY AND COUPLED ADSORPTION / PRECIPITATION
EXPERIMENTS SAMPLES .......................................................................................... 50
4.1 INTRODUCTION ............................................................................................ 50
4.2 BACKGROUND AND NOMENCLATURE................................................... 51
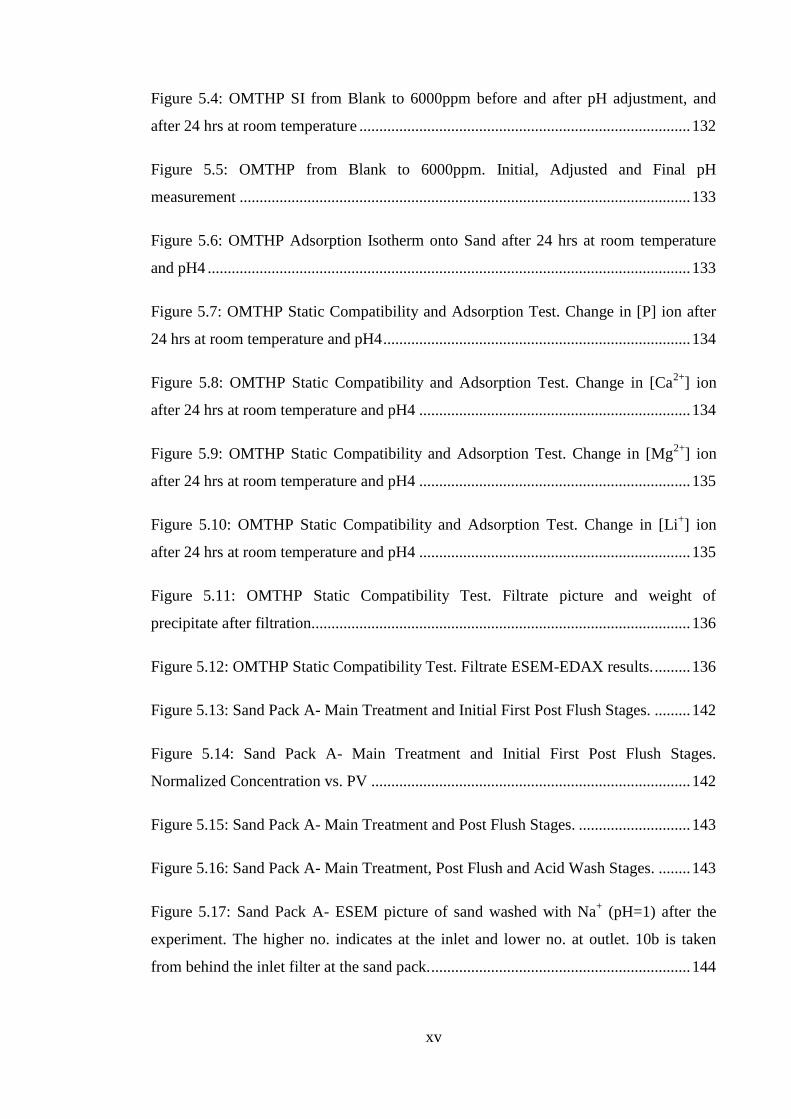
4.2.1 Retention .......................................................................................................... 52
4.2.2 Adsorption/Desorption ..................................................................................... 52
4.2.3 Precipitation ...................................................................................................... 52
4.3 THEORY OF COUPLED ADSORPTION AND PRECIPITATION .............. 53
4.3.1 Static Adsorption .............................................................................................. 53
4.3.2 Coupled Adsorption/Precipitation .................................................................... 55
4.4 EXPERIMENTAL DETAILS .......................................................................... 57
4.4.1 Materials ........................................................................................................... 58
4.4.2 Experimental Procedure ................................................................................... 63
4.5 EXPERIMENTAL RESULTS AND DISCUSSION ....................................... 64
4.5.1 DETPMP-SAND Adsorption/Compatibility Test ............................................ 64

viii
4.5.2 OMTHP-SAND Adsorption/Compatibility Test .............................................. 76
4.5.3 DETPMP-KAOLINITE Adsorption/Compatibility Test ................................. 88
4.5.4 OMTHP-KAOLINITE Adsorption/Compatibility Test ................................... 98
4.5.5 DETPMP-SIDERITE Adsorption/Compatibility Test ................................... 106
4.6 SUMMARY AND CONCLUSIONS ............................................................. 116
4.6.1 DETPMP and OMTHP Scale Inhibitors onto SAND Mineral ....................... 117
4.6.2 DETPMP and OMTHP Scale Inhibitors onto KAOLINITE Mineral ............ 118
4.6.3 DETPMP Scale Inhibitor onto SIDERITE Mineral ....................................... 119
CHAPTER 5: NON-EQUILIBRIUM SAND PACK EXPERIMENTS ON OMTHP
SCALE INHIBITOR APPLIED IN BOTH ADSORPTION AND PRECIPITATION
TREATMENTS ............................................................................................................ 120
5.1 INTRODUCTION .......................................................................................... 120
5.2 EXPERIMENTAL DETAILS ........................................................................ 121
5.2.1 Materials ......................................................................................................... 122
5.2.2 Experimental Apparatus ................................................................................. 124
5.2.3 Experimental Procedure ................................................................................. 126
5.3 EXPERIMENTAL RESULTS AND DISCUSSION ..................................... 129
5.3.1 Static Adsorption/Compatibility Study at Room Temperature ...................... 130
5.3.2 Sand Pack A: Dynamic Precipitation Flood –Singe Flow rate....................... 137
5.3.3 Sand Pack C: Dynamic Precipitation Flood – Multi Flow rate ...................... 147
5.3.4 Sand Pack D: Dynamic Precipitation Flood – Multi Flow rate and Solubility
Effect ..... ................................................................................................................. 161
5.3.5 Sand Pack E: Low Conc. Dynamic Adsorption Flood–Multi Flow Rate ...... 175

ix
5.3.6 Sand Pack F: High Concentration Adsorption Flood – Multi Flow rate ........ 192
5.3.7 Sand Pack G: 2000ppm Concentration Adsorption Flood – Multi Flow rate 203
5.4 SUMMARY, DISCUSSION AND CONCLUSIONS .................................... 216
5.4.1 Methodology .................................................................................................. 217
5.4.2 Non-Equilibrium Returns ............................................................................... 217
5.4.3 Adsorption vs. Precipitation ........................................................................... 218
5.4.4 Desorption and Dissolution ............................................................................ 218
5.4.5 Inhibitor Retention ......................................................................................... 219
5.4.6 Irreversible Behaviour .................................................................................... 219
CHAPTER 6: CONCLUSIONS AND RECOMMENDATIONS ................................ 225
6.1 CONCLUSIONS............................................................................................. 225
6.2 STATIC COMPATIBILITY AND COUPLED ADSORPTION /
PRECIPITATION EXPERIMENTS .............................................................. 225
6.3 NON-EQUILIBRIUM SAND PACK EXPERIMENTS ON BOTH
ADSORPTION AND PRECIPITATION FLOOD ........................................ 228
6.4 SUMMARY .................................................................................................... 231
6.5 RECOMMENDATIONS FOR FUTURE WORK ......................................... 231
APPENDIX A: FULL DERIVATION OF COUPLED ADSORPTION/
PRECIPITATION MODEL .......................................................................................... 234
APPENDIX B: MATERIAL SAFETY DATA SHEET (MSDS) ................................ 244
APPENDIX C: GENERAL EQUIPMENT AND APPARATUS ................................ 257
REFERENCES .............................................................................................................. 272

x
LIST OF FIGURES
Figure 2.1: The effect of the velocity of threshold inhibitor level on squeeze lifetime
(Sorbie, 1991) .................................................................................................................. 10
Figure 2.2: The advancement of inhibitor solution along the sandpack showing a
relevant adsorption isotherm (Gregg, 1965) ................................................................... 10
Figure 2.3: Demonstration of how the inhibitor slug is placed in the formation relative
to a tracer slug for equilibrium inhibitor adsorption (Sorbie, 1991) ............................... 11
Figure 2.4: Demonstration of how the inhibitor slug is placed in the formation relative
to a tracer slug for non-equilibrium inhibitor adsorption (Sorbie, 1991) ........................ 11
Figure 3.1: Schematic showing how both coupled adsorption and precipitation can
occur. ............................................................................................................................... 35
Figure 3.2: Schematic Diagram of the Sand Pack Flooding Apparatus .......................... 39
Figure 3.3: Actual view of sand packed in the column ................................................... 39
Figure 3.4: Schematic diagram of sand pack “packing” technique ................................ 40
Figure 3.5: Column without sand for dead volume measurement .................................. 42
Figure 4.1: Shows the process of simple static adsorption on a porous medium
comprising a mineral separate, of mass m e.g. sand, kaolinite, siderite etc. See units. .. 54
Figure 4.2: Experimental static adsorption isotherms, Γ(C), for DETPMP on crushed
core material. At various pH values, 2, 4 and 6 at T = 25oC (Yuan et al., 1994). .......... 55
Figure 4.3: Schematic showing how both coupled adsorption and precipitation can occur
showing how this could be interpreted as an “apparent adsorption”, .App .................... 56
Figure 4.4: DETPMP SI structure and properties ........................................................... 59
Figure 4.5: OMTHP SI structure and properties ............................................................. 59
Figure 4.6: Sand distribution, elements and SEM........................................................... 60

xi
Figure 4.7: Kaolinite distribution, elements and SEM .................................................... 61
Figure 4.8: Siderite distribution, elements and SEM ...................................................... 62
Figure 4.9: DETPMP in NFFW at 10,000ppm active. It is soluble at this concentration
and yellowish in colour. .................................................................................................. 65
Figure 4.10: DETPMP-Sand Static Adsorption/Compatibility Test. Initial pH
measurement of stock solutions vs. SI concentrations before pH adjustment. .............. 66
Figure 4.11: DETPMP-Sand Static Adsorption/Compatibility Test. DETPMP
Adsorption Isotherm onto different masses of sand at pH4 & 95°C. ............................. 67
Figure 4.12: DETPMP-Sand Static Adsorption/Compatibility Test. DETPMP
Adsorption Isotherm onto different masses of sand at pH4 & 95°C; zoomed down to
lower concentrations. ...................................................................................................... 67
Figure 4.13: DETPMP-Sand Static Adsorption/Compatibility Test (5g, 10g, 20g & 30g
Sand). Change in [P] vs [DETPMP]. .............................................................................. 70
Figure 4.14: DETPMP-Sand Static Adsorption/Compatibility Test (5g, 10g, 20g & 30g
Sand). Change in [Ca2+
] vs [DETPMP]. ......................................................................... 71
Figure 4.15: DETPMP-Sand Static Adsorption/Compatibility Test (5g, 10g, 20g & 30g
Sand). Change in [Mg2+
] vs [DETPMP]. ........................................................................ 71
Figure 4.16: DETPMP-Sand Static Adsorption/Compatibility Test (5g, 10g, 20g & 30g
Sand). Change in [Li+] vs [DETPMP]. ........................................................................... 72
Figure 4.17: DETPMP-Sand Static Adsorption/Compatibility Test. Precipitates on filter
papers at different concentration of DETPMP. Traces of precipitates can be observed at
2000ppm and clear precipitates at 4000ppm. .................................................................. 73
Figure 4.18: DETPMP-Sand Static Adsorption/Compatibility Test. Morphology of
precipitates on ESEM photographed samples. ................................................................ 74
Figure 4.19: DETPMP-Sand Static Adsorption/Compatibility Test. pH Measurement –
Adjusted and Final .......................................................................................................... 76

xii
Figure 4.20: OMTHP SI in NFFW at 10,000ppm active. It is whitish in colour and
insoluble at this concentration. It precipitates when left for a few hours. ...................... 77
Figure 4.21: OMTHP SI initial pH measurement of each stock solutions before
adjustment. The decreasing trend of the pH indicates acidic nature of OMTHP SI. ...... 78
Figure 4.22: OMTHP-Sand Static Adsorption/Compatibility Test. OMTHP Adsorption
Isotherm onto different masses of sand at pH4 & 95°C. ................................................ 79
Figure 4.23: OMTHP-Sand Static Adsorption/Compatibility Test. OMTHP Adsorption
Isotherm onto different masses of sand at 95°C and pH4; zoomed down to lower
concentration. .................................................................................................................. 80
Figure 4.24: OMTHP-Sand Static Adsorption/Compatibility Test (10g, 20g & 30g
Sand). Change in [P] vs [OMTHP]. ................................................................................ 82
Figure 4.25: OMTHP-Sand Static Adsorption/Compatibility Test (10g, 20g & 30g
Sand). Change in [Ca2+
] vs [OMTHP]. ........................................................................... 83
Figure 4.26: OMTHP-Sand Static Adsorption/Compatibility Test (10g, 20g & 30g
Sand). Change in [Mg2+
] vs [OMTHP]. .......................................................................... 83
Figure 4.27: OMTHP-Sand Static Adsorption/Compatibility Test (10g, 20g & 30g
Sand). Change in [Li+] vs [OMTHP]. ............................................................................. 84
Figure 4.28: OMTHP-Sand Static Adsorption/Compatibility Test. Precipitates on filter
papers at different concentrations of OMTHP. ............................................................... 85
Figure 4.29: OMTHP-Sand Static Adsorption/Compatibility Test. Morphology of
precipitates on ESEM photographed samples. ................................................................ 86
Figure 4.30: OMTHP-Sand Static Adsorption/Compatibility Test. pH Measurement –
Adjusted and Final .......................................................................................................... 88
Figure 4.31: DETPMP SI initial pH measurement of each stock solutions before
adjustment. The decreasing trend of the pH indicates acidic nature of OMTHP SI. ...... 89
Figure 4.32: DETPMP-Kaolinite Static Adsorption/Compatibility Test. DETPMP
Adsorption Isotherm onto different masses of sand at pH4 & 95°C. ............................. 90

xiii
Figure 4.33: DETPMP-Kaolinite Static Adsorption/Compatibility Test. DETPMP
Adsorption Isotherm onto different masses of sand at 95°C and pH4; zoomed down to
lower concentration. ........................................................................................................ 91
Figure 4.34: DETPMP-Kaolinite Static Adsorption/Compatibility Test (10g, 20g & 30g
Sand). Change in [P] vs [DETPMP]. .............................................................................. 93
Figure 4.35: DETPMP-Kaolinite Static Adsorption/Compatibility Test (10g, 20g & 30g
Sand). Change in [Ca2+
] vs [DETPMP]. ......................................................................... 94
Figure 4.36: DETPMP-Kaolinite Static Adsorption/Compatibility Test (10g, 20g & 30g
Sand). Change in [Mg2+
] vs [DETPMP]. ........................................................................ 94
Figure 4.37: DETPMP-Kaolinite Static Adsorption/Compatibility Test (10g, 20g & 30g
Sand). Change in [Li+] vs [DETPMP]. ........................................................................... 95
Figure 4.38: DETPMP-Kaolinite Static Adsorption/Compatibility Test. Precipitates on
filter papers and weight of precipitates at different concentrations of DETPMP. .......... 96
Figure 4.39: DETPMP-Kaolinite Static Adsorption/Compatibility Test. Morphology of
precipitates on ESEM photographed samples. ................................................................ 97
Figure 4.40: OMTHP SI initial pH measurement of each stock solutions before
adjustment. The decreasing trend of the pH indicates acidic nature of OMTHP SI. ...... 99
Figure 4.41: OMTHP-Kaolinite Static Adsorption/Compatibility Test. OMTHP
Adsorption Isotherm onto different masses of sand at pH4 & 95°C. ........................... 100
Figure 4.42: OMTHP-Kaolinite Static Adsorption/Compatibility Test (10g, 20g & 30g
Sand). Change in [P] vs [OMTHP]. .............................................................................. 102
Figure 4.43: OMTHP-Kaolinite Static Adsorption/Compatibility Test (10g, 20g & 30g
Sand). Change in [Ca2+
] vs [OMTHP]. ......................................................................... 102
Figure 4.44: OMTHP-Kaolinite Static Adsorption/Compatibility Test (10g, 20g & 30g
Sand). Change in [Mg2+
] vs [OMTHP]. ........................................................................ 103
Figure 4.45: OMTHP-Kaolinite Static Adsorption/Compatibility Test (10g, 20g & 30g
Sand). Change in [Li+] vs [OMTHP]. ........................................................................... 103

xiv
Figure 4.46: OMTHP-Kaolinite Static Adsorption/Compatibility Test. Precipitates on
filter papers and weight of precipitates at different concentrations of OMTHP. .......... 104
Figure 4.47: OMTHP-Kaolinite Static Adsorption/Compatibility Test. Morphology of
precipitates on ESEM photographed samples. .............................................................. 105
Figure 4.48: DETPMP SI initial pH measurement of each stock solutions before
adjustment. The decreasing trend of the pH indicates acidic nature of DETPMP SI. .. 107
Figure 4.49: DETPMP-Siderite Static Adsorption/Compatibility Test. DETPMP
Adsorption Isotherm onto different masses of siderite at pH4 & 95°C. ....................... 108
Figure 4.50: DETPMP-Siderite Static Adsorption/Compatibility Test (10g, 20g & 30g
siderite). Change in [Fe3+
] vs [DETPMP]. .................................................................... 109
Figure 4.51: DETPMP-Siderite Static Adsorption/Compatibility Test (10g, 20g & 30g
siderite). Change in [P] vs [DETPMP]. ........................................................................ 111
Figure 4.52: DETPMP-Siderite Static Adsorption/Compatibility Test (10g, 20g & 30g
siderite). Change in [Ca2+
] vs [DETPMP]. ................................................................... 112
Figure 4.53: DETPMP-Siderite Static Adsorption/Compatibility Test (10g, 20g & 30g
siderite). Change in [Mg2+
] vs [DETPMP]. .................................................................. 112
Figure 4.54: DETPMP-Siderite Static Adsorption/Compatibility Test (10g, 20g & 30g
siderite). Change in [Li+] vs [DETPMP]. ...................................................................... 113
Figure 4.55: DETPMP-Siderite Static Adsorption/Compatibility Test. Precipitates on
filter papers and weight of precipitates at different concentrations of DETPMP. ........ 114
Figure 4.56: DETPMP-Siderite Static Adsorption/Compatibility Test. Morphology of
precipitates on ESEM photographed samples. .............................................................. 115
Figure 5.1: Chemical Structure of Scale Inhibitor – Octa-methylene-tetramine hexa
(methylene-phosphonicn acid) - OMTHP ..................................................................... 124
Figure 5.2: Schematic diagram of sand pack flooding apparatus ................................. 125
Figure 5.3: Schematic diagram of sand pack “packing” technique .............................. 125
xv
Figure 5.4: OMTHP SI from Blank to 6000ppm before and after pH adjustment, and
after 24 hrs at room temperature ................................................................................... 132
Figure 5.5: OMTHP from Blank to 6000ppm. Initial, Adjusted and Final pH
measurement ................................................................................................................. 133
Figure 5.6: OMTHP Adsorption Isotherm onto Sand after 24 hrs at room temperature
and pH4 ......................................................................................................................... 133
Figure 5.7: OMTHP Static Compatibility and Adsorption Test. Change in [P] ion after
24 hrs at room temperature and pH4 ............................................................................. 134
Figure 5.8: OMTHP Static Compatibility and Adsorption Test. Change in [Ca2+
] ion
after 24 hrs at room temperature and pH4 .................................................................... 134
Figure 5.9: OMTHP Static Compatibility and Adsorption Test. Change in [Mg2+
] ion
after 24 hrs at room temperature and pH4 .................................................................... 135
Figure 5.10: OMTHP Static Compatibility and Adsorption Test. Change in [Li+] ion
after 24 hrs at room temperature and pH4 .................................................................... 135
Figure 5.11: OMTHP Static Compatibility Test. Filtrate picture and weight of
precipitate after filtration............................................................................................... 136
Figure 5.12: OMTHP Static Compatibility Test. Filtrate ESEM-EDAX results. ......... 136
Figure 5.13: Sand Pack A- Main Treatment and Initial First Post Flush Stages. ......... 142
Figure 5.14: Sand Pack A- Main Treatment and Initial First Post Flush Stages.
Normalized Concentration vs. PV ................................................................................ 142
Figure 5.15: Sand Pack A- Main Treatment and Post Flush Stages. ............................ 143
Figure 5.16: Sand Pack A- Main Treatment, Post Flush and Acid Wash Stages. ........ 143
Figure 5.17: Sand Pack A- ESEM picture of sand washed with Na+ (pH=1) after the
experiment. The higher no. indicates at the inlet and lower no. at outlet. 10b is taken
from behind the inlet filter at the sand pack. ................................................................. 144

xvi
Figure 5.18: Sand Pack A- Summary of mass balance base on total mass throughput and
mass after main treatment + 2PV .................................................................................. 147
Figure 5.19: Sand Pack C - Main treatment and initial post flush stages. .................... 154
Figure 5.20: Sand Pack C- Main treatment and initial post flush stages. Normalized
concentration vs. PV ..................................................................................................... 154
Figure 5.21: Sand Pack C- Main treatment and all post flush stages. ........................... 155
Figure 5.22: Sand Pack C- Main treatment, post flush and acid wash stages. .............. 155
Figure 5.23: Sand Pack C- ESEM picture of sand washed with Na+ (pH=1) after the
experiment. The picture indicates no precipitation of SI .............................................. 156
Figure 5.24: Sand Pack C- Mass still in sand pack base on total mass throughput ...... 158
Figure 5.25: Sand Pack C- Cumulative mass out base on total mass throughput ......... 158
Figure 5.26: Sand Pack C- Mass balance base on after main treatment + 2PV ............ 160
Figure 5.27: Sand Pack C- %Mass out base on total mass throughput and after main
treatment + 2PV ............................................................................................................ 161
Figure 5.28: Sand Pack D- Main treatment and initial post flush stages. ..................... 167
Figure 5.29: Sand Pack D- Main treatment and initial post flush stages. Normalized
Concentration vs. PV .................................................................................................... 168
Figure 5.30: Sand Pack D- Main treatment and post flush stages. ............................... 168
Figure 5.31: Sand Pack D- Main treatment, post flush and acid wash stages............... 169
Figure 5.32: Sand Pack D- ESEM picture of sand washed with Na+ (pH=1) after the
experiment. .................................................................................................................... 169
Figure 5.33: Sand Pack D- Mass still in sand pack base on total mass throughput ...... 172
Figure 5.34: Sand Pack D- Cumulative mass out base on total mass throughput ......... 172
Figure 5.35: Sand Pack D- Mass balance base on mass after Main Treatment + 2PV . 174

xvii
Figure 5.36: Sand Pack D- %Mass out base on total mass throughput and mass after
main treatment + 2PV ................................................................................................... 175
Figure 5.37: OMTHP Static Compatibility Test at 95°C. Change in P and Li+ ion after
24 hrs at 95°C and pH4 ................................................................................................. 176
Figure 5.38: OMTHP Static Compatibility Test at 95°C. Filtrate picture and weight of
precipitate after filtration............................................................................................... 177
Figure 5.39: OMTHP Static Compatibility Test. ESEM picture of filtrate. ................. 177
Figure 5.40: Sand Pack E- Main treatment and initial post flush stage. ....................... 184
Figure 5.41: Sand Pack E- Main treatment and initial post flush stage. Normalized
concentration vs. PV ..................................................................................................... 184
Figure 5.42: Sand Pack E- Main treatment and post flush stages. ................................ 185
Figure 5.43: Sand Pack E- Main treatment, post flush and acid wash stages. .............. 185
Figure 5.44: Sand Pack E- ESEM picture of sand washed with Na+ (pH=1) after the
experiment. The picture indicates no precipitation of SI .............................................. 186
Figure 5.45: Sand Pack E- Mass still in sand pack base on total mass throughput ...... 188
Figure 5.46: Sand Pack E- Cumulative mass out base on total mass throughput ......... 188
Figure 5.47: Sand Pack E: Mass balance base on after main treatment + 2PV ............ 190
Figure 5.48: Sand Pack E- %Mass out base on total mass throughput and after main
treatment + 2PV ............................................................................................................ 191
Figure 5.49: OMTHP Static Compatibility Test at 95°C. Change in P, Ca2+
, Mg2+
and
Li+ ion after 24 hrs at 95°C and pH4............................................................................. 193
Figure 5.50: OMTHP Static Compatibility Test at 95°C. Filtrate picture and weight of
precipitate after filtration............................................................................................... 193
Figure 5.51: Sand Pack F- Main treatment and initial post flush stage. ....................... 198

xviii
Figure 5.52: Sand Pack F- Main treatment and initial post flush stage. Normalized
concentration vs. PV ..................................................................................................... 199
Figure 5.53: Sand Pack F- Main treatment and initial post flush stage. Change in Ca2+
and Mg2+
ions. ............................................................................................................... 199
Figure 5.54: Sand Pack F- Main treatment and post flush stages. ................................ 200
Figure 5.55: Sand Pack F- ESEM-EDAX results of sand washed with Na+ (pH=1) after
the experiment. The results indicates no precipitation of SI ......................................... 200
Figure 5.56: Sand Pack F- Mass still in sand pack base on total mass throughput ....... 201
Figure 5.57: Sand Pack F- Cumulative mass out base on total mass throughput ......... 202
Figure 5.58: Sand Pack F- %Mass out base on total mass throughput and after main
treatment + 2PV ............................................................................................................ 203
Figure 5.59: 2000ppm OMTHP in NFFW. It shows the observation before and after 24
hrs at 95°C and filtration. .............................................................................................. 204
Figure 5.60: OMTHP Static Compatibility Test. Change in P, Ca2+, Mg2+ and Li+ ion
after 24 hrs at 95°C and pH4. ........................................................................................ 204
Figure 5.61: OMTHP Static Compatibility Test. Filtrate picture and weight of
precipitate after 24 hrs at 95°C and filtration. ............................................................... 205
Figure 5.62: OMTHP Static Compatibility Test. ESEM-EDAX results of filtrate after 24
hrs at 95°C. .................................................................................................................... 205
Figure 5.63: Sand Pack G – Main treatment and initial post flush stage. ..................... 211
Figure 5.64: Sand Pack G – Main treatment and initial post flush stage. Normalized
concentration vs. Pore Volume. .................................................................................... 211
Figure 5.65: Sand Pack G – Main treatment and all post flush stages. ......................... 212
Figure 5.66: Sand Pack G – Main treatment, post flush and acid wash stages. ............ 212

xix
Figure 5.67: Sand Pack G – ESEM-EDAX results of sand extracted from sand pack
column after acid wash treatment. ................................................................................ 213
Figure 5.68: Sand Pack G – %Mass out base on total mass throughput and mass after
main treatment + 2PV. .................................................................................................. 216
Figure 5.69: Summary of main treatment and post flush behaviour. Sand pack A, C, D,
E, F & G ........................................................................................................................ 221
Figure 5.70: Summary of main treatment and post flush behaviour. Sand pack C, D, E,
F & G ............................................................................................................................ 222
Figure 5.71: Summary of main treatment and post flush behaviour. Sand pack C, D, & F
....................................................................................................................................... 222
Figure 5.72: Summary of main treatment and initial post flush behaviour. ................. 223
Figure 5.73: ESEM-EDAX analysis of sand after final acid wash. These are repeat
analysis done independently ......................................................................................... 224

xx
LIST OF TABLES
Table 3.1: Details of phosphonate SI, group and activity ............................................... 24
Table 3.2: Synthetic Nelson Forties formation water brine composition ....................... 26
Table 3.3: Volume required to make different concentrations ....................................... 31
Table 3.4: Example of Sand Pack Characterization Results ........................................... 43
Table 3.5: Summary of Experimental Details of Adsorption and Precipitation Flood ... 49
Table 4.1: Synthetic Nelson Forties Formation Water Composition (NFFW) ............... 63
Table 4.2: : DETPMP-Sand Static Adsorption/Compatibility Test. pH measurement of
Initial, Adjusted and Final ............................................................................................... 65
Table 4.3: DETPMP-Sand Static Adsorption/Compatibility Test. It shows the weight of
precipitate on filter papers after filtration. ...................................................................... 73
Table 4.4: DETPMP-Sand Static Adsorption/Compatibility Test. EDAX signals on the
precipitates from ESEM. ................................................................................................. 75
Table 4.5: OMTHP-Sand Static Adsorption/Compatibility Test. pH measurement –
Initial, Adjusted and Final ............................................................................................... 77
Table 4.6: OMTHP-Sand Static Adsorption/Compatibility Test. Weight of precipitates
on filter paper after filtration. .......................................................................................... 85
Table 4.7: OMTHP-Sand Static Adsorption/Compatibility Test. EDAX signals on the
precipitates from ESEM. ................................................................................................. 87
Table 4.8: DETPMP-Kaolinite Static Adsorption/Compatibility Test. EDAX signals on
the precipitates from ESEM. ........................................................................................... 98
Table 4.9: OMTHP-Kaolinite Static Adsorption/Compatibility Test. EDAX signals on
the precipitates from ESEM. ......................................................................................... 106
Table 4.10: DETPMP-Siderite Static Adsorption/Compatibility Test. EDAX signals on
the precipitates from ESEM. ......................................................................................... 115

xxi
Table 5.1: Synthetic Nelson Forties Formation Water (NFFW) Composition ............. 124
Table 5.2: Sand Pack Characterization Results ............................................................ 126
Table 5.3: Sand Pack Experimental Details and Chronologies of Injection ................. 128
Table 5.4: Sand Pack A – Characterization Results ...................................................... 137
Table 5.5: Sand Pack A – Experimental Details and Chronologies of Injection .......... 139
Table 5.6: Sand Pack A- EDAX results of sand washed with Na+ (pH=1) after the
experiment. The higher no. indicates at the inlet and lower no. at outlet. 10b is taken
from behind the inlet filter at the sand pack. ................................................................. 144
Table 5.7: Sand Pack A- Mass balance base on total mass throughput ........................ 145
Table 5.8: Sand Pack A- Summary of mass balance base on total mass throughput and
mass after main treatment + 2PV .................................................................................. 146
Table 5.9: Sand Pack C – Characterization Results ...................................................... 148
Table 5.10: Sand Pack C – Experimental Details and Chronologies of Injection ........ 149
Table 5.11: Sand Pack C - EDAX results of sand washed with Na+ (pH=1) after the
experiment. No P, Ca2+
or Mg2+
was seen. ................................................................... 156
Table 5.12: Sand Pack C- Mass balance base on total mass throughput ...................... 157
Table 5.13: Sand Pack C – Summary of mass balance base on total mass throughput and
mass after main treatment + 2PV .................................................................................. 159
Table 5.14: Sand Pack D – Characterization Results .................................................... 162
Table 5.15: Sand Pack D – Experimental Details and Chronologies of Injection ........ 163
Table 5.16: : Sand Pack D: EDAX results of sand washed with Na+ (pH=1) after the
experiment. No P, Ca2+
or Mg2+
was seen. ................................................................... 170
Table 5.17: Sand Pack D- Mass balance base on total mass throughput ...................... 171

xxii
Table 5.18: Sand Pack D- Mass balance base on total mass throughput and mass after
main treatment + 2PV ................................................................................................... 173
Table 5.19: OMTHP Static Compatibility Test. EDAX results of filtrate. ................... 178
Table 5.20: Sand Pack E – Characterization Results .................................................... 179
Table 5.21: Sand Pack E – Experimental Details and Chronologies of Injection......... 180
Table 5.22: Sand Pack E: EDAX results of sand washed with Na+ (pH=1) after the
experiment. No presence of P, Ca2+
or Mg2+
was seen. ................................................ 186
Table 5.23: Sand Pack E- Mass balance base on total mass throughput....................... 187
Table 5.24: Sand Pack E: Summary of Mass Balance base on total mass throughput and
mass after Main Treatment + 2PV ................................................................................ 189
Table 5.25: Synthetic Nelson Forties Formation Water (NFFW) Composition used for
Sand Pack F. Note the changes in Calcium concentration. ........................................... 192
Table 5.26: Sand Pack F – Characterization Results .................................................... 194
Table 5.27: Sand Pack F – Experimental Details and Chronologies of Injection ......... 195
Table 5.28: Sand Pack F- Mass balance base on total mass throughput ....................... 201
Table 5.29: Sand Pack F- Summary of mass balance base on total mass throughput and
mass after main treatment + 2PV .................................................................................. 202
Table 5.30: Sand Pack G – Characterization Results .................................................... 206
Table 5.31: Sand Pack G – Experimental Details and Chronologies of Injection ........ 207
Table 5.32: Sand Pack G – Mass balance base on total mass throughput. ................... 214
Table 5.33: Sand Pack G – Summary of mass balance base on total mass throughput and
mass after main treatment + 2PV. ................................................................................. 215
Table 5.34: Normalized [SI], [Ca2+
] and [Mg2+
] ........................................................... 220
Table 5.35: Summary of floods characteristics and mass balance ................................ 221

xxiii
NOMENCLATURE
MIC Minimum Inhibitor Concentration
SI Scale Inhibitor
SR Saturation Ratio
Ksp Solubility Product
m/V Mass Volume Ratio
α, β Freundlich Constants
Φ Fraction of the Precipitation
ppm Parts per million
pH Negative logarithm of the solution hydrogen ion activity
HEDP Hexamethylenediamine tetramethylene phosphonic acid
DETPMP Diethylenetriamine penta (methylene phosphonic acid)
OMTHP Octa-methylene-tetramine hexa (methylene-phosphonic acid)
Ca2+
_DETPMP Calcium Inhibitor Complex Precipitation
Γ(C) Rock adsorption isotherm, where C = concentration of inhibitor
Γapp Apparent adsorption
[Ca2+
] Calcium cation concentration
[Mg2+
] Magnesium cation concentration
[Li+] Lithium cation concentration
Co Initial inhibitor concentration (mg/L)
C1f Final inhibitor concentration (mg/L)
MW Molecular weight

xxiv
SW Sea water
NSSW North Sea Sea Water
FW Formation Water
NFFW Nelson Forties Formation Water
ICP Inductively Coupled Plasma
ESEM Scanning Electron Microscope
EDAX Energy-dispersive X-ray Spectroscopy
XRD X-Ray Diffraction
FAST Flow Assurance and Scale Team
Cm Mobile-phase inhibitor concentration
ф Porosity
ρ Density
PV Pore volume
SW Sea water

xxv
LIST OF PUBLICATIONS
Ibrahim, J., Sorbie, K.S. and Boak, L.S.: "Coupled Adsorption/Precipitation
Experiments: 1.Static Results", SPE 155109, puplished at the SPE International
Conference on Oilfield Scale held in Aberdeen, United Kingdom, 30-31 May 2012.
Ibrahim, J., Sorbie, K.S. and Boak, L.S.: "Coupled Adsorption/Precipitation
Experiments: 1.Non-Equilibrium Sand Pack Treatments", SPE 155110, puplished at the
SPE International Conference on Oilfield Scale held in Aberdeen, United Kingdom, 30-
31 May 2012.

1
CHAPTER 1: INTRODUCTION
1.1 CONTROLLING SCALE PROBLEM IN THE OIL INDUSTRY
In an oilfield production system, one of the main problem affecting productivity is the
formation of inorganic mineral scales (Kerver and Heilhecker, 1969; Miles, 1970;
Vetter, 1973; Meyers et al., 1985; and King and Warden, 1989). Mineral scale
deposition can occur once water –has broken through in producer wells and the type
and severity of the scale depends on the water chemistry of the injected and formation
brines and the physical conditions (temperature and pressure). Ironically, water injection
into the injection well is required in order to maintain reservoir pressure which creates a
driving force to push oil towards production wells. The inorganic scale precipitation is
mainly due to comingling of injection water (i.e. sea water) and formation water in the
case of sulphate scales such as barium sulphate, and due to pressure drops in the system
in the case of calcium carbonate scale but other factors such as pH and temperature
may also play a role (Boyle and Mitchell, 1979; Cowan, 1976; Johnson, 1983; and
Vetter, 1975). There are many type of mineral scales, but 90% or more are likely to be
calcium carbonate, calcium sulphate, barium sulphate and strontium sulphate (Goulding,
1987; Pucknell, 1983 and Yuan, 1989). A common feature of all of these inorganic
scales is that they have very low solubility and indeed that is why they are deposited as
solid.
Scale can deposit in the reservoir, the near wellbore formation, in the production well,
in transportation pipelines and in topsides equipment, such as pumps and valves. That
is, mineral scale can occur at almost any location within an oilfield water production
system. Within the reservoir formation, scale deposition may block pores and reduce
formation permeability, and hence cause formation damage. Scale deposition in
production tubing and transportation pipelines may cause reduction in the diameter of
the tubing and pipelines, sometimes totally blocking it (Carrell, 1987 and Payne, 1987).
The replacements of pumps and valves is frequent required due to scale deposition and
this can be very expensive. The scale deposit can also intensify corrosion attack on

Chapter 1: Introduction
2
tubing and pipelines (Carlberg and Matthews, 1975; Charleston, 1968 and Matthews
and Carlberg, 1975).
To remediate oilfield scale, a number of techniques (such as chemical, mechanical,
electrical and magnetic) have been introduced over the past few decades. However, out
of the many techniques which have been proposed and applied, chemical and
mechanical approaches are the most commonly used methods applied to remove or
prevent scale deposition. However, chemical scale control is usually preferred over
mechanical techniques because it is generally cheaper and more applied and is a
preventative measure, and chemical approaches are especially convenient in offshore
and deep water fields.
Chemical scale control is divide into three categories; removal acids, sequestrant or
dissolver and scale inhibitors. The first and most common method for removal of
calcium carbonate mineral is acidizing, which is also used routinely to restore well
productivity. The downside of acidizing is that it does not stop the problem from re-
occurring and mineral scale such as barium sulphate is insoluble in acid (Bonnett et al.,
1991, Smith et al., 1968 and Vetter, 1975). The second chemical approach is through
the use of sequestrants or scale dissolvers, and the most common one used in oilfield
operations is EDTA. In few cases, use of EDTA shows some productivity improvement
(Charleston, 1968 and Shaughnessy and Kline, 1983); but in the majority of cases, it has
failed to show significant improvement. These poor results may be due to EDTA having
a poor surface to bulk ratio in tubular environments thus leading to slow rates of
dissolution (Carrell, 1987; Mazzolini et al., 1990 and Vetter, 1976). The third chemical
approach to mineral scale control is through the use of chemical scale inhibitors. Unlike
acids and dissolver chemicals, these acts as crystal distortion reagents at sub-
stoichiometric concentration levels. This is achieved by adsorption of the scale inhibitor
onto the active growth sites of the scale crystal (or initial scale nucleation), leading to a
changes in the crystal morphology and thereby retarding nucleation and crystal growth.
As such, use of scale inhibitor has been used widely to control scale formation in
oilfield industry; such chemicals may be applied by continual dosing in topside

Chapter 1: Introduction
3
applications to protect the surface equipment and in downhole operations where the
process is known as a inhibitor squeeze treatment.
Although initially downhole squeeze treatments were developed to prevent corrosion
problem, the process has been adapted and is now applied more widely for
treating/preventing downhole scale formation in oilfield operations. Much experience
has been gathered in both the field application of scale inhibitors and in their
development by the service sector, although most of the research on developing scale
inhibitors has been focused on making new improved chemical which are principally
very good at preventing scale formation (i.e. they show very good levels of inhibition
efficiency). Much less effort has been put into developing scale inhibitors which are
retained very efficiently on to formation rocks. Nevertheless, the success of any
inhibitor squeeze treatment depends on both factors; the efficiency of scale inhibitor in
preventing scale formation at a low minimum inhibitor concentration (MIC) level,
typically at 5 to 15ppm, and on the ability of the inhibitor must to give a long return
curves at or above the MIC during back production after a squeeze treatment. In
squeeze treatments, the squeeze lifetime is measured either in terms of the time it takes
for the scale inhibitor concentration to drop below MIC or, more commonly, on how
many barrels of produced water are “protected” in this period. In terms of time, such
treatments may often last from 3 months to 1 year and in terms of protected volume of
produced water, they may be from 250Mbbl to 3MMbbl.
Given the background above, this thesis will focus on the inhibitor interaction with the
formation minerals through adsorption/desorption and precipitation/dissolution process.
That is, our study in principally on the retention mechanisms that govern scale inhibitor
squeeze processes.
1.2 OUTLINE
This thesis is focused on understanding the governing mechanism of adsorption/
desorption and precipitation/dissolution that are taking place during scale inhibitor
squeeze treatments. The thesis consists of six chapters which are briefly described as
follows:

Chapter 1: Introduction
4
Chapter 1 briefly reviews the importance of scale inhibitor squeeze treatments in the oil
industry and explains the main objectives of the study as well as giving a thesis outline.
Chapter 2 presents a detailed literature review of the governing mechanisms of scale
inhibitor adsorption and precipitation squeeze processes. This includes a discussion of
the theoretical and experimental studies that have been published in the literature which
are relevant to this work.
Chapter 3 explains the experimental methodology used to study the governing
adsorption and precipitation mechanisms throughout the work. This includes:
(i) beaker tests for static adsorption and compatibility experiments to uncover the pure
adsorption and coupled adsorption/precipitation region.
(ii) sand pack test for non-equilibrium experiments to study the influence of flow rate
on inhibitor return concentration for both adsorption and precipitation floods.
Chapter 4 presents results from static adsorption and compatibility experiments for two
type of phosphonate scale inhibitors in synthetic Nelson Forties Formation Water
(NFFW); viz. DETPMP - a penta phosphonate and OMTHP - an hexa phosphonate. The
minerals used in these experiments are silica sand, kaolinite and siderite. The chapter
defines how to differentiate between pure adsorption and the coupled
adsorption/precipitation region. The factors that influence adsorption or precipitation
mechanisms have been elucidated.
Chapter 5 present results from a series of non-equilibrium sand pack experiments at
different flow rates for both adsorption and precipitation floods. Based on the
corresponding static adsorption and precipitation results, scale inhibitor OMTHP, silica
sand mineral and NFFW brine was chosen for all the sand pack floods. The conditions
maintained in these pack floods were T = 95°C and pH4, throughout the study. The
findings explain the influence of flow rate on inhibitor effluent concentrations and
reveals the parameters that govern the adsorption or precipitation processes.

Chapter 1: Introduction
5
Chapter 6 gives the summary and overall conclusions reached during the course of this
study and presents recommendations for future research work related to this area.
In the Appendices, the following subjects has been presented in order to support the
discussion and findings in the main chapters of this thesis;
Appendix A: Full derivation of coupled adsorption/precipitation model.
Appendix B: Materials Safety Data Sheet (MSDS) of the main phosphonate
scale inhibitors.
Appendix C: General equipment and apparatus.

6
CHAPTER 2: LITERATURE REVIEW
2.1 INTRODUCTION
It has been known for many years that adsorption and/or coupled
adsorption/precipitation are the main mechanisms contributing to long term scale
inhibitor retention in reservoir formations. Therefore, many experimental and field
studies have been carried out to investigate these phenomena. In reviewing this subject
matter, the significance of inhibitor adsorption and/or coupled adsorption/precipitation
in squeeze treatment is clarified by reassessing the governing mechanisms of the scale
inhibitor squeeze process. Previous experimental and field studies of phosphonate and
polymeric adsorption onto various minerals are reviewed.
2.2 GENERAL MECHANISM GOVERNING SCALE INHIBITOR
RETENTION PROCESSES
It has been perceived that the long inhibitor tail during the back production stage of an
inhibitor squeeze treatment is due to the inhibitor "desorbing slowly" over a long period
of time after adsorption/desorption squeeze process. However, work carried out by
Sorbie et al. (1990 and 1991) has revealed that this view can be further expanded. They
have demonstrated that the mechanism of tailing in adsorption/desorption squeeze
treatments is a propagation phenomenon, associated with the profile of the inhibitor
adsorption isotherm on the reservoir rock as analyzed using mathematical modelling for
both laboratory experiments and field systems. The equilibrium behaviour of
adsorption-type inhibitor squeeze treatments is being governed by the adsorption
isotherm, although in addition to kinetic (non-equilibrium) effects may be observed in
our experiments. The following review is based on their analytical results.
Dispersion and adsorption of a chemical solution flowing through a porous medium can
be derived by a mass balance, which can be translated to a chemical transport equation.
The 1D (one dimensional) linear form of this equation is as follows:

Chapter 2: Literature Review
7
2
2
1m m mC C CD v
t x x t
(Eq. 2.1)
The local concentrations in the adsorbed and mobile fluid phases is related to the rate of
adsorption, ( ) through the kinetic rate equation. The linear driving force rate can
be expressed as:
2[ ( ) ]eq mr Ct
(Eq. 2.2)
where;
Cm = mobile phase inhibitor concentration, (mg/L);
Γ = actual adsorbed level of inhibitor (mg of SI /g of rock or mineral substrate);
Γeq(Cm) = equilibrium adsorption level (mg/g) associated with mobile concentration, Cm
(mg/L);
D = dispersion coefficient (cm2/s);
v = superficial velocity (cm/s); v= q/(Aф);
q=fluid volumetric injection rate (cm3/s);
A = cross sectional core or sand pack area, (cm2);
ф = porosity;
r2 = inhibitor desorption rate parameter in non-equilibrium model, seconds-1
(s-1
);
t = time, seconds (s);
x = distance, (cm).
Equilibrium theory may be applied when kinetic effects are secondary (i.e. when the
adsorption rate is so fast compared with the fluid flow rate, that the system is effectively
at equilibrium). At equilibrium, and neglecting dispersion, the inhibitor advancement
velocity can then be obtained from Equation (2-1) and is given by;
1
1
fluid
c
VV
d
dC
(Eq. 2.3)

Chapter 2: Literature Review
8
where Vc and Vct are the inhibitor advancement velocities at concentration C and at the
threshold concentration value, Ct, respectively; and Vfluid is the fluid velocity. The above
equation distinctly shows that the inhibitor advancement velocity is governed by the
quantity ( ), the slope of the adsorption isotherm. The velocity for an inhibitor
concentration value C (Vc), is inversely proportional to the slope of the isotherm. In the
case of a “favourable” adsorption isotherm, the slope is larger for lower concentration
values than for higher values and these lower values hence propagate more slowly back
to the wellbore as shown in Figure 2.1 (Sorbie, 1991).
In addition, the phenomenon of “front sharpening” in the flow process can give a further
demonstration of the effect of the isotherm shape, as illustrated in Figure 2.2. Let us
imagine a band of inhibitor solution already on the column, as shown in the figure.
When it is subjected to elution, new solvent enters at the top (the 'rear') of the band, and
the inhibitor solution emerges from the bottom of the band (the 'front'); as it leaves its
concentration will correspond to a point at the high concentration end of the isotherm
(Figure 2.2) where the slope is small and the value of inhibitor advancement velocity
corresponding large (Gregg, 1965). As the solution moves forward on to clean
adsorbent it will begin to lose solute, the concentration C will decrease; this will cause
( ) to increase and the advancement velocity to fall. Thus, the further forward the
point of deposition is, the more slowly it tends to move, and this means that the front of
the band will be self sharpening: any portion of the low concentration SI front that tend
to get ahead is automatically slowed down. At the rear of the band the converse set of
conditions applies; as the solution moves further into the band it becomes more and
more concentrated so that progressively decreases, and the velocity
correspondingly increases. Thus the further to the rear point is, the more slowly will it
move, so that the rear must become progressively more spread out as a “tail”. Therefore,
Sorbie et al., (1990) concluded that the squeeze lifetime is essentially the time it takes
for the threshold concentration, Ct, to get back to the wellbore and hence an inhibitor
having a very steeply rising isotherm at low concentrations will lead to a long lifetime
of a squeeze treatment.

Chapter 2: Literature Review
9
Qualitatively, kinetic effects do not introduce any significantly new pattern of behaviour
of inhibitor adsorption in terms of the long tail in the SI return curve. However, non-
equilibrium effects do play a role in the governing mechanism of scale inhibitor
adsorption squeeze processes. For example, if the SI adsorption process with the rock is
at equilibrium during the injection period as in Figure 2.3, then the SI slug is retarded
as shown. Figure 2.3 shows that the inhibitor is retarded compared to the non-adsorbing
tracer in the case of equilibrium inhibitor adsorption (fast adsorption). That is, the
inhibitor is closer to the well and this is not ideal considering the distance which the
inhibitor must travel back to the wellbore. Figure 2.4 shows the situation of slow
inhibitor adsorption (non-equilibrium), where the inhibitor slug is further into the
formation and is more like a tracer slug. Thus, on the way back to the wellbore, the
threshold concentration velocity for the case of non-equilibrium adsorption is the same
as that for equilibrium adsorption but it has farther to travel in the non-equilibrium case
thereby extending the squeeze lifetime. In addition to this overall effect on squeeze
performance, non-equilibrium effects may appear as “spikes” in SI concentration both
in core floods and in the field returns as discussed below.
From the above brief review of the governing mechanism of inhibitor squeeze
processes, the key factors influencing an inhibitor squeeze lifetime are the steeply rising
isotherm in the low concentration region, the maximum adsorption level at high SI
concentration (since higher maximum adsorptions lead to “stripping” of the SI at the
front of the SI slug) and non-equilibrium inhibitor adsorption. As such, these key factors
should be considered as the basis for choosing the right adsorption/desorption inhibitor
for a given field application.

Chapter 2: Literature Review
10
Figure 2.1: The effect of the velocity of threshold inhibitor level on squeeze lifetime
(Sorbie, 1991)
Figure 2.2: The advancement of inhibitor solution along the sandpack showing a
relevant adsorption isotherm (Gregg, 1965)

Chapter 2: Literature Review
11
Figure 2.3: Demonstration of how the inhibitor slug is placed in the formation relative
to a tracer slug for equilibrium inhibitor adsorption (Sorbie, 1991)
Figure 2.4: Demonstration of how the inhibitor slug is placed in the formation relative
to a tracer slug for non-equilibrium inhibitor adsorption (Sorbie, 1991)

Chapter 2: Literature Review
12
2.3 REVIEW OF PREVIOUS EXPERIMENTAL STUDIES
In relation to experimental work on scale inhibitor adsorption and/or coupled
adsorption/precipitation, there are two types of experimental methodologies that were
engaged to study this phenomenon. These are (i) static adsorption/compatibility tests
which are performed using mineral separates (sand, clays etc.) and a volume of SI
solution in a beaker or bottle, and (ii) dynamic core flood tests, which utilize sand pack
or core displacement apparatus. For static adsorption/compatibility tests, the main factor
influencing the inhibitor adsorption/desorption properties are pH, inhibitor type,
mineral substrate type, brine composition, time and temperature. For Static Adsorption
Tests, the experiments were performed using minerals a fixed volume of SI solution to
evaluate the coupled adsorption/precipitation behaviour. In the corresponding Static
Compatibility Tests, the precipitation behaviour was evaluated, since no mineral was
used in these tests, and therefore any loss in concentration of SI from solution must be
due to precipitation. Initial stock samples were taken and then small samples of the
liquid were withdrawn from the solution at predetermined times. The inhibitor
concentration was measured in these samples and the amount of inhibitor adsorbed is
calculated (Kerver and Morgan, 1965; Vetter et al., 1979 and 1987). The adsorption
isotherm is obtained by plotting the amount of inhibitor adsorbed as a function of the
final equilibrium inhibitor concentration in solution. In dynamic tests, the inhibitor
adsorption/desorption and/or precipitation/dissolution is evaluated using sand packs or
core displacement tests, thus simulating the inhibitor squeeze treatment by flooding
through formation porous media. The method involves the injection of an inhibitor slug
into a sand pack followed by a post flush slug and then monitoring the effluent
composition as a function of time or produced cumulative pore volumes (PV) of fluid.
The inhibitor effluent profiles, in particular in the inhibitor desorption region (tail
region) have been used by many worker to evaluate the SI squeeze lifetime (Hughes and
Whittinghan, 1982; Olson and Moore, 1990; Ray and Fielde, 1988 and Tomson and
Rogers, 1986).
Squeeze treatments were first introduced in the 1950s as an adsorption/desorption
process in corrosion inhibitors applications (Poetker and Stone, 1956). The use of

Chapter 2: Literature Review
13
inhibitors in such squeeze treatments led further studies to inhibit calcium sulphate in
water flooding projects (Smith et al., 1968; Smith, 1978, and Kerver and Heilhecker,
1969). At this stage, little was known about the SI mechanism that was taking place to
either inhibit scale formation or indeed to retain the SI in the rock formation. The
assumption was that the adsorption/ desorption retention of scale inhibitors was driven
by physical processes although there did not exist in the literature a systematic study of
the exact mechanisms of inhibitor adsorption/desorption onto rock minerals in the
formation. These earlier studies used both static tests for isotherm measurement and
core floods for dynamic tests. The results showed that the slope of the adsorption
isotherm at low concentrations which implied that the inhibitor would be adsorbed and
desorbed gradually, and rather slowly. They also stated that the concentration of the
produced fluid could provide sufficient information on the following; (i) adsorptive
capacity of the formation, (ii) volume of formation treated, (iii) well production rate and
(iv) desorption characteristics of the formation.
The first detailed scale inhibitor squeeze mechanistic study was probably conducted by
Vetter (1973 and 1975). His study was designed to examine the feedback mechanisms
of liquid scale inhibitor from formation rock. He sought to differentiate between
adsorption/desorption, chemical precipitation, and slow feedback mechanisms based on
the inhibitor feed from small fractures. He worked with a combination of P32-tagged
ortho-phosphoric acids (which do not act as scale inhibitors) and tritium-labelled liquid
scale inhibitors such as commercially available phosphonates, organic polymers and
organic phosphate esters for all the laboratory and field studies. Adsorption isotherms
were determined on sand and dolomite at various temperatures, concentration levels and
pH values. The dynamic tests were executed using glass columns packed with sand,
limestone, or dolomite. The results from adsorption isotherm determination shows that
the adsorption characteristics of the phosphonate and polymer are unusual and
complicated. He emphasized that true isotherm exist only between 0 and 100ppm (in
solution) and at low concentration. Vetter chose orthophosphoric acid (OPA) for his
study because it is a major component of many chemical inhibitors. All the liquid
phosphate esters and phosphonates that were checked contained various concentrations
of OPA. He also found that the "isotherms" of sand at different pH values at low

Chapter 2: Literature Review
14
temperature are almost identical and there was a very small increase at the higher pH.
He assumed that this may be due to the minute clay content of the sand. However, a
large difference was found at high temperatures where the adsorption was much smaller
at high pH than at low pH. This is due to the neutralized OPA reacting less with the
sand than the acid OPA solutions. He indicated that temperature had the (then) expected
effect on the isotherm; the adsorption should decrease with increasing temperature
because physical adsorption is an exothermic reaction; Note that later this was shown to
incorrect for the vast majority of commercial scale inhibitors. With regards to kinetic
effects, inhibitor adsorption showed that adsorption increased with time. That is, the
equilibrium between mineral concentration on the solid and in the liquid phase is not
established instantaneously. Based on dynamic pack floods, he pointed out that the
desorption is strongly dependent on the flow velocity and that both adsorption and
desorption are highly time dependent. Although Vetter’s work showed some early
insights, it was wrong in some details regarding commercial scale inhibitors and also he
made no attempt to model his results or apply them in a quantitative manner.
Works on the laboratory design and field implementation of scale inhibitor squeeze
treatments in Prudhoe Bay field was reported by Meyers et al. (1985). It was found that
DETPMP (a penta-phosphonate) was the best inhibitor screened out of five generic
phosphonate scale inhibitors for possible application in Prudhoe Bay. It also showed
that DETPMP SI exhibits better adsorption values, calcium tolerance and higher
solubility in comparison with other scale inhibitors tested. For adsorption/desorption
experiments, both crushed and consolidated reservoir formation rock with synthetic
NaCl formation brine with no divalent ions was used. The test was meant to study the
impact of adsorption/precipitation without the involvement of calcium ions in solution.
For static adsorption/desorption tests at 95°C, the scale inhibitor and mineral showed (i)
a steep isotherm in the low concentration region, which was consistent with the
Langmuir form, (ii) considerable reversible desorption, and (iii) apparent adsorption of
inhibitor solution concentration stabilised at less than 25 mg/L.
In dynamic sand pack/core flood tests at 25°C, the results indicated that the inhibitor
achieved equilibrium essentially instantaneously at pH of 4.7. This was expected base

Chapter 2: Literature Review
15
on static adsorption tests where it achieved equilibrium in less than one hour. Due to the
relatively fast kinetics, it was suggested that long shut-in periods (more than 2 hrs) were
not required to maximise the adsorption during squeeze treatments when the inhibitor
solution is injected at reservoir conditions.
Meyers et al. also investigated the effects of temperature, pH, divalent cations, salinity
and the presence of surfactant on the scale inhibitor adsorption. The main conclusions
were that, (i) there was an increase in adsorption by 25% when temperature is increased
from 25 to 90°C, which was also confirmed by other workers; (ii) pH plays a major role
on inhibitor adsorption. At pH4 and below, the inhibitor adsorption is constant, but
decreased steeply between pH5 and 6, and go down to almost zero at pH greater than 7.
Thus, to maximise adsorption and to minimise shut-in time, inhibitor slugs near
reservoir pH (4.7) were highly recommended. However, why phosphonate adsorption
was high at low pH and vice-versa was not proven at that time; (iii) there was no effect
on phosphonate adsorption when Ca2+
ion concentration is less than that required to
precipitate the phosphonate. Only at pH6, was the adsorption enhanced by the presence
of calcium. The conclusion was made mainly due to the low pH value they used; (iv) by
varying temperature, pH, [SI], [Fe3+
] and [Ca2+
]; precipitation of Fe3+
and Ca2+
salts can
be induced. But, although such precipitation in the matrix increases inhibitor retention,
and thus treatment life, the adverse effect was to reduce near-well bore permeability and
possibly cause near well formation damage; (v) a surfactant concentration (0 to 1.5 wt
%), salinity (0.5 to 5 % NaCl), and winterizing agents (0 to 15 wt% methanol / 0 to 15
wt% ethylene glycol) had noticeable effects on the adsorption of DETPMP.
Durham stated that adsorption was probably caused by electrostatic attraction between
the reservoir formation and scale inhibitors, since most of inhibitors used for squeezing
were highly ionic compounds (Durham, 1983). This type of attraction can be readily
observed with scale inhibitors as they are anionic in nature, which includes acrylates,
phosphates and phosphonates. A hypothesis from King and Warden (1989) stated that:
(i) adsorption refers to a plating mechanisms in which a compound at the molecular
level, without substantial chemical modification, sticks to the surface of the formation
pore or a mineral growth in the pore, by means of electrical or physical forces; (ii) in the

Chapter 2: Literature Review
16
absence of calcium ion, adsorption is the cause of adherence of a scale inhibitor
compound onto sandstone formation; (iii) the amount of adsorption is dependent on the
amount of active surface area contacted and the thickness to which the inhibitor
molecules adsorb.
The adsorption isotherm, Γ(C), is the key characteristics of inhibitor
adsorption/desorption behaviour, which quantitatively relates the amount of inhibitor
adsorbed on a formation rock surface, Γ (in mg/g or mg/m2), as a function of inhibitor
concentration (C) in the bulk formation fluid. As will be emphasised throughout this
work, the behaviour of the adsorption isotherm curve is the most important factor in
squeeze treatments. This parameter is measured using static adsorption tests. Two types
of experimental approach have been engaged to investigate the scale inhibitors
adsorption/desorption for the field applications: (i) static compatibility/adsorption
beaker tests and (ii) dynamic sand pack column and/or core displacement tests. Static
compatibility/ adsorption beaker tests are conducted using sand, clay (such as illite,
kaolinite, siderite, etc.) or crushed core to ascertain bulk adsorption isotherms and to
investigate the sensitivities of pH, temperature, time and concentration to adsorption.
On the other hand, dynamic sand packed columns or core displacement tests are utilized
to simulate scale inhibitor squeeze treatments by flooding through the porous media in
the sand packed column or rock core. Dynamic studies involve injection of an inhibitor
slug followed by a postflush into a sand pack and then monitoring the effluent
composition as a function of produced cumulative fluid or time. The shape of the
effluent inhibitor desorption curve (long tail region at the end) have often been used by
researches to evaluate the squeeze lifetime.
In a study by Przybylinski, five different inhibitors were investigated using a dynamic
sand packed column/core flood displacement technique (Przybylinski, 1989). The five
scale inhibitors were (a) phosphonate inhibitor DETPMP; (b) an alkyl phosphonate
HEDP; (c) a phosphate ester (TEAPE); (d) a tagged poly acrylic acid (PAA) and (e) a
proprietary polymeric phosphonate inhibitor (PPI). The experimental work was
conducted using silica sand or limestone packed columns at 40°C and 80°C. A synthetic
brine with similar composition to the oilfield brines was used.

Chapter 2: Literature Review
17
The results from Przybylinski led to number of conclusions, as follows;
(i) The experimental results indicated that: (a) the adsorption level of phosphonate on
silicate sand is higher than the value which is estimated based on monomolecular
layer adsorption; (b) the adsorption of inhibitors increases with increase in
temperature and (c) a significant fraction of the adsorbed inhibitor is not readily
released to the produced brine. Thus, some of the SI is strongly adsorbed onto the
minerals and some is more readily adsorbed just onto the surface. These
observations lead to the suggestion that two or more adsorption mechanisms are at
work. These may include surface precipitation and strong adsorption.
(ii) Adsorption/desorption very much depends on the partitioning of the SI between the
solution and the solid surface which is strongly influenced by the mineral type
(sand, kaolinite, siderite, etc.), the nature of the surface (smooth or rough) and the
solution. Therefore, using irregular minerals or an inappropriate brine may lead to
false conclusions.
(iii) DETPMP phosphonate SI had the highest levels of return on both sand and
limestone of all inhibitors tested in this study. These results lead them to conclude
DETPMP was the best inhibitor for squeeze applications for their test conditions.
(iv) Precipitation can be induced in the reservoirs due to changes in temperature,
resulting in an enhanced squeeze. This conclusion strengthens the findings
previously reported by Vetter (1972 and 1976). Caution must be taken as
precipitation can also cause formation damage of not studied properly.
Przybylinski’s work is in agreement with many workers with regards to the importance
of the kinetics of inhibitor adsorption/desorption process. Work by Vetter (1987) also
shows that both adsorption/desorption depends on time and desorption is strongly
dependent on the flow velocity.
Mathematical modelling was also used to analyse both laboratory experiments and field
systems (Sorbie et al., 1990 and 1991). They described that the mechanism of tailing in
an adsorption squeeze process is a propagation phenomenon associated with the shape
of the inhibitor adsorption isotherm on the reservoir rock. They showed that a steeply

Chapter 2: Literature Review
18
rising isotherm and non-equilibrium inhibitor adsorption are key factors in influencing
an inhibitor squeeze.
They studied the effect of pH, temperature and calcium on the adsorption of
phosphonate scale inhibitors onto consolidated and crushed sandstone (Sorbie et al.,
1993). In summary, (i) SI adsorption onto the crushed rock material increases at higher
temperatures under all conditions; (ii) Inhibitor adsorption onto crushed rock is lower at
pH4 than at pH2 or pH6; when calcium ions are present (i.e. [Ca2+
= 415ppm) at 25°C;
(iii) the adsorption of phosphonate inhibitor (DETPMP) decreased predictably as pH
increases (at 25°C) in the absence of Ca2+
ions, which is due to hydrogen bonding
mechanism for adsorption; (iv) at pH6, involvement of Ca2+
in the inhibitor/rock
interaction was clearly proven (at 25°C); (v) electro kinetic measurements on Clashach
rock particles in seawater solution clearly correlate the phosphonate inhibitor adsorption
behaviour with the surface charge properties (ζ-potential).
Kan et al. (1991 and 1992) have studied both the equilibrium and the kinetics aspects of
phosphonate adsorption in the laboratory using beaker tests and sandstone core floods to
understand further DETPMP SI retention in the reservoir after inhibitor squeeze
treatment. They reported that there are at least four mechanisms involved in inhibitor
retention: (i) acid/base dissolution of the mineral surface; (ii) adsorption to the surface
as the result of acid/base dissolution in step (i), (iii) mass-transport molecular diffusion
of inhibitor in solution to the solid surface; and (iv) solid phase maturation toward a
thermodynamically stable phase, as the solid surface material interacts with the solution.
They concluded that the kinetics of the slow reaction governs the phosphonate flow-
back trend and the rate-limiting step for the slow adsorption reaction is probably a
diffusion-controlled process. Phosphonate contact time and contact area increase the
efficiency of inhibitor squeeze treatment.
In a later study by Kan et al. (2004), four oilfield inhibitors (three phosphonates and one
poly-acrylate) were investigated to study the inhibitor/rock interaction and factors
affecting scale inhibitor retention in carbonate-rich formations during inhibitor squeeze
treatments (Kan et al., 2004). They found there are two mechanisms which are central to
the SI retention in carbonate-rich formations; (i) SI-Ca2+
coating due to reduction of

Chapter 2: Literature Review
19
calcite dissolution and surface poisoning; and (ii) precipitation of SI-Ca2+
solid phase
due to either low or high calcium ion concentrations. For one of the phosphonate SI,
NTMP, an acidic NTMP-Ca2+
salt was formed in a low-pH environment. The nature of
SI to calcium ion complex might be in a crystalline or an amorphous form depending on
the ions present in the formation brine. Quantitative relationships between types of
inhibitors, inhibitor acidity and concentration, and kinetics of calcite dissolution and
phosphonate-calcium precipitation were developed.
Sources of calcium in a typical field squeeze treatments are; (i) Seawater that contains
Ca2+
injected along with the scale inhibitor; (ii) Ca2+
which is injected as an over-flush;
(iii) Ca2+
that is dissolved from calcite and solid formation minerals; and (iv) Ca2+
that
is present in the formation brine itself. Many laboratory experiments and field
observations have pointed out the importance of calcium in the various inhibitor
retention mechanisms. Like Kan et al., many workers have found that the presence of
calcium ions significantly enhance the retention of scale inhibitor within the rock
formation which results in an extended squeeze lifetime. However, there is little detailed
analysis in the literature of the details of this calcium enhanced retention and it is often
described briefly in terms of the formation of an insoluble a Ca-SI complex.
It has been inferred that the formation mineralogy determines how an inhibitor is
retained in a formation (Gdanski, 2008). The pill chemistry is also an important factor
for retention in carbonate reservoirs. Acidic pills are mostly retained near the well bore
whereas more neutralized pills move farther into the formation. Gdanski et al. (2008)
found that three calcium nitrilo methylene phosphonate (NTMP) solid phases, an
amorphous phase and two crystalline Ca2.5HNTMP phases with pKsp = 22.6 and pKsp
= 24.2, were particularly important with respect to inhibitor retention. The relative sizes
of these solid phases formed are governed by the pill composition and acidity. Nearly
all of these field squeezes were done using a common phosphonate inhibitor, NTMP
[nitrilotri (methylene phosphonic) acid], although similar results have been observed
with several other inhibitors and blends. From these studies and observations, the
following conclusions were made; (i) a column apparatus has been developed to
simulate inhibitor squeeze and return. (ii) For acidic pill, approximately 78% of injected

Chapter 2: Literature Review
20
phosphonate precipitates in these experiments. The fraction that precipitated is inversely
related to the amount of base in the pill. Most of the precipitate is near the injection
port. (iii) For partially neutralized pill, approximately 50% of injected phosphonate
precipitated at the output end of the column. (iv) A portion of phosphonate was retained
as the crystalline phosphonate salt and a portion of the acidic pill was retained as a more
soluble calcium phosphonate salt.
Gdanski and Funkhouser (2001, 2005) reported that static adsorption experimental data
can be up-scaled to agree with scale inhibitor adsorption/desorption in non-equilibrium
sand pack. Their studies showed that static adsorption data has a direct bearing on scale
inhibitor adsorption/desorption in dynamic mineral packs (Gdanski and Funkhouser,
2001, 2005). They reported that isotherm fitting with the modified Langmuir equation
provided the mathematical framework for an understanding of desorption kinetics,
though the Langmuir adsorption isotherm often does not fit experimental data very
accurately. In summary, they found that; (i) a wide variety of adsorption data can be fit
by using the modified Langmuir equation, (ii) static adsorption isotherms are useful in
determining the magnitudes of the kinetic effect on desorption in linear flow tests, (iii)
siderite may be responsible for the long-term, low-level inhibitor-return profiles
sometimes observed after squeeze treatments, and (iv) the minerals studied can be
classified into three groups; (a) strongly adsorbing (siderite), (b) moderately adsorbing
silica-like minerals (silica and kaolinite),and (c) weakly adsorbing alumina-like
minerals (illite, smectite and alumina).
Many studies have shown that that Ca2+
ions play an important role in enhancing
inhibitor retention in porous media (Sorbie et al., 1993 and Kahrwad et al., 2008).
Almost all of them thought that this was due to phosphonate inhibitor and Ca2+
binding
to each other and the subsequent formation of a Ca_SI precipitate. No explicit results
were reported where adsorption of Ca2+
ions on the mineral surface would cause a
change in rock surface charge leading to an enhanced inhibitor adsorption. From a series
of core floods, Pardue (1991, 1992) reported that the squeeze lifetime using
phosphonate SI was reduced by one-half when the calcium in the post flush brine
decreases from 5450 to 1000ppm with the same in situ brine. However, the amount of

Chapter 2: Literature Review
21
calcium in the post flush was not significantly seen to affect treatment lifetime. The
reason for this was thought to lie in the way the product was precipitating in the core
where the connate brine had high calcium and precipitation occurred at the inhibitor
slug front during injection. Rogers et al. (1990) carried out column studies with both
ground core samples and intact core plugs. The results showed a four-fold enhancement
of inhibitor retention as a consequence of using CaCl2. They also stated that packed
columns of ground core material were quick and easy to prepare and allowed numerous
variables to be examined. Jacobsen et al. (1989) also used Gullfaks sandstone cores to
conduct phosphonate and phosphino poly carboxylic acid inhibitor floods. Extended
squeeze life was obtained by adding calcium for both inhibitors.
A series of experiments related to static inhibitor adsorption were carried out to
determine if it was possible to differentiate between pure adsorption and coupled
adsorption/precipitation processes (Kahrwad et al., 2008). The results show that for
DETPMP SI with sand mineral at 25°C and 95°C, the experiment was able to
distinguish between the two phenomena. It must be noted that the brine used contains
only 428ppm of Ca2+
, which make it difficult to achieve precipitation. Nonetheless, the
work created a pathway for other research and the basis for part of the study which is
continued in this thesis.
Dynamic examining the influence of flow rate on inhibitor return concentrations in core
flooding of phosphonate scale inhibitors in both adsorption and precipitation flood were
previously reported by Zhang, Chen, Sorbie and MacKay at Heriot-Watt University,
which was later published by Zhang et al. (2000) and Chen et. al. (2000). This work
demonstrated clear non-equilibrium behaviour as the flow rate for the different floods is
varied. At the slower flow rate, higher effluent SI concentrations were observed, and
vice versa. The direction of the non-equilibrium effect was found to be the same for
both adsorption and precipitation floods.
2.4 SUMMARY AND CONCLUSIONS
This survey of the literature on scale inhibitor (SI) retention shows that a significant
body of research exists reporting laboratory experiments studying the adsorption and

Chapter 2: Literature Review
22
adsorption/precipitation of scale inhibitors used in squeeze treatments in oilfields. These
laboratory experiments are related to adsorption/desorption in static and dynamic
conditions. From these various studies, the principal governing mechanisms of inhibitor
retention in squeeze processes have been elucidated. The main mechanisms of inhibitor
adsorption are understood to depend on; (i) the surface chemistry and roughness of the
adsorbing minerals - silica sand, clay, kaolinite, siderite, sandstone, carbonate etc., (ii)
experimental or field conditions - pH, temperature, salinity and hardness, and (iii)
inhibitor properties - functional group, dissociation degree, polarity, etc. This work
shows that the inhibitor adsorption isotherm and associated kinetic properties play
important roles in inhibitor adsorption squeeze treatments. Nevertheless, there are
conflicting statements and missing links between static and dynamic tests that need to
be addressed. For example, there is no comprehensive experimental dataset currently
available in the literature to support modelling for better prediction of squeeze
treatments for all retention processes including pure adsorption and coupled
adsorption/precipitation processes. This work will provides such an experimental
dataset which has results for both the bulk inhibitor/brine/mineral (sand, kaolinite,
siderite) interactions and the corresponding dynamic (sand) pack floods. That is, where
the precise system studied in bulk is applied in a dynamic sand pack flood.
Although work has been carried out on static adsorption and precipitation, there has
been very little research which has set out to clearly differentiate pure adsorption from
coupled adsorption/precipitation. The recent work of Kahrwad et al. (2008) has tackled
this issue and has presented initial experimental work on phosphonate SI and silica
sand as mineral substrate to distinguish between pure adsorption and coupled
adsorption/precipitation. This work presented both the theory showing how this could
be achieved and the corresponding experimental verification of this theory. However,
the work was of Kahrwad et al. only used a brine that contains only 428ppm of calcium
ion. The amount of calcium used prevented them from achieving full precipitation over
a wide range of conditions. Work on the theory of coupled adsorption/precipitation in a
dynamic context was continued by the work of Sorbie (2008), which is part of the basis
of the present work.

23
CHAPTER 3: EXPERIMENTAL METHODOLOGY
3.1 INTRODUCTION
This chapter gives the detailed description of all the experimental procedures used in the
course of this PhD research, they are as follows:
(i) Static Compatibility Tests and Static Coupled Adsorption/Precipitation Tests
(between phosphonate scale inhibitors and sand, kaolinite and siderite minerals) where
the combination of these two experiments will differentiate between pure adsorption ()
and coupled adsorption/precipitation () behaviour. This will be discussed in detail in
Chapter 4;
(ii) Non-equilibrium Sand Pack Flood Experiments using the SI phosphonate OMTHP
and sand minerals, which analyze the effluent concentrations of various species (SI,
Ca2+
, Mg2+
, Li+ ) at various flow rates for both precipitation and adsorption floods. This
will be discussed in Chapter 5.
The equipment/apparatus specifications and settings used for the analysis of both the
experiments above are fully explained in Appendix C.
3.2 STATIC COMPATIBILITY AND COUPLED ADSORPTION/
PRECIPITATION EXPERIMENTS
Static Compatibility Tests and Static Adsorption Tests were performed to evaluate both
pure adsorption and coupled adsorption/precipitation behaviour of DETPMP (a Penta-
Phosphonate) and OMTHP (a Hexa-Phosphonate) scale inhibitors (SI) with synthetic
Nelson Forties Formation Water (NFFW). For Static Adsorption Tests, the experiments
were performed using different masses of sand, kaolinite and siderite (m = 5g, 10g, 20g
and 30g) at a fixed volume of SI solution (V = 0.08L) to evaluate the coupled
adsorption/precipitation behaviour. In the corresponding Static Compatibility Tests, the
experiments were performed to evaluate the precipitation behaviour, since no mineral is

Chapter 3: Experimental Methodology
24
used in these tests. As such, any loss in concentration of SI during the compatibility test
must be due to precipitation.
3.2.1 Objective
The objective of one set of experiments was to investigate the apparent adsorption (app)
vs. [SI] isotherm behaviour when scale inhibitor (SI) is mixed with formation brine in
the presence of selected rock minerals. For such experiment, we must analyse for the
concentrations of phosphorous (P), calcium (Ca2+
), magnesium (Mg2+
), lithium (Li+)
and other related cations in the solution before and after heating and filtration. These
are analyzed using Inductively Couple Plasma (ICP). ICP measures the concentration of
each element under consideration. The difference in concentration of these elements
before and after experiment will denote whether any couple adsorption/precipitation has
taken place.
3.2.2 Materials
Scale Inhibitors: Two scale inhibitors were used in this work. They are;
a) Di-ethylene Tetra-amine Penta (methylene-phosphonic acid) or DETPMP, a penta-
phosphonate
b) Octa-methylene Tetra-amine Hexa (methylene-phosphonic acid) or OMTHP, a
hexa-phosphonate
Both of these SIs are from the phosphonate family group. They are commercial products
widely used in oilfield applications and the particular products used here were supplied
by Rhodia. Chapter 4 shows the structure and properties of these products. Appendix B
shows the material safety data sheets (MSDS) for both DETPMP and OMTHP. Details
of SI commercial name and activity are presented in Table 3.1.
Generic name Type Activity% SI name Supplier
DETPMP Penta-phosphonate 45% Briquest 543-45AS Rhodia
OMTHP Hexa-phosphonate 30% Briquest 684-30S Rhodia
Table 3.1: Details of phosphonate SI, group and activity

Chapter 3: Experimental Methodology
25
Minerals: Three types of minerals are used in this work, viz. sand, kaolinite and
siderite, to study the retention of scale inhibitors onto these mineral substrates.
a. Dry silica sand (BDH GPR, 40 – 100 mesh, purified by acid) was chosen as one of
the adsorbent as the majority of sandstone rock is quartz. Silica sand also represents a
simple model of a sandstone formation. The chemical compound silicon dioxide, also
known as silica, is an oxide of silicon with a chemical formula SiO2. Refer to
Chapter 4 for details of the sand characteristics.
b. Kaolinite is a clay minerals, with the composition Al2Si2O5(OH)4. It is a layered
silicate mineral, with one silica tetrahedral sheet linked through oxygen atoms to one
octahedral sheet of alumina. Formations that are rich in kaolinite are known as China
clays, which is the case for this particular mineral. The structure is rarely as crystals
but rather as thin platy or stacked, aggregated into compact, claylike masses. Refer
to Chapter 4 for a detailed charaterisation of the kaolinite used in this work.
c. Siderite is a mineral compound of iron carbonate, FeCO3. Generally it has more than
50% iron mineral and contain no sulphur or phosphorous. The sample used in this
work also contains ~25% illite and ~20% quartz. Its crystals belong to the hexagonal
system, and are rhombohedral in shape, typically with curved and striated faces.
Refer to Chapter 4 for details of siderite characterisation.
Brine: Synthetic Nelson Forties Formation Water (NFFW)
All brine solutions are prepared by dissolving appropriate quantities of salts in distilled
water. The composition of this NFFW is given in Table 3.2. The brine solution was
filtered through a 0.45µmfilter paper which is commonly used by the industry to filter
water samples. This gives us an adequate filtration level to remove any suspended solid
content in the water.

Chapter 3: Experimental Methodology
26
Table 3.2: Synthetic Nelson Forties formation water brine composition
Notes:
a. 50ppm Li+ has been added as an inert tracer in the brine. This is to check for
evaporation (if any) which would directly affect the change in concentration of all
elements during the heating process. Since Li+ is an inert tracer, it does not react with
solutions or adsorb onto any rock minerals. The change in concentration due to
evaporation will lead to wrong adsorption and precipitation values and this is
corrected for using the Li+ results.
b. All prepared brines are filtered using 0.45 µm Whatman filter paper. This is to
remove any dirt and physical impurities during preparation.
c. No degassing is required as it does not go through core or sand pack at high
temperature. Degassing would be required only for experiments involving core or
sand pack at high temperature where the brines flowing through the core/sand pack
expands at high temperature and influence the calculation of pore volume, porosity
and permeability.

Chapter 3: Experimental Methodology
27
3.2.3 Experimental Methodology
Test Conditions:
Test conditions for the whole cycle of experiment must be set to achieve consistent
results. The details are;
Temperature (T) = 95°C
Pressure(P) = atmosphere
pH = 4
Volume of test solution, V = 80 ml
Mass of substrate, m = 10g, 20g and 30g minerals (varies)
Mixing ratio = n/a
Flow rates = n/a (static)
Flow conditions = n/a (static)
Coupon material & finish = n/a
Core properties (including formation mineralogy, permeability, porosity and
particle size) = n/a
Sampling times: 24 hrs after heating at 95°C. Each test is performed in
duplicate.
Notes:
a. All stock samples (blank and with inhibitor) are pH adjusted to pH 4 using dilute HCl
or NaOH prior to being mixed with the substrate (sand) and heating.
b. The mass of mineral substrate in a given experiment varies and is m = 10, 20 and
30g, while the fluid volume of the inhibitor solution is maintained at V = 80ml =
0.08L. The precise (m/V) ratio used is important since apparent adsorption vs. [SI]
results at different (m/V) ratios allow us to differentiate between pure adsorption and
coupled adsorption/precipitation behaviour.
Inventories and Preparation:
Brine: chemicals compound, grade and supplier
Chemicals Grade Supplier
Sodium chloride Analar VWR
Calcium chloride 6-hydrate Analar VWR

Chapter 3: Experimental Methodology
28
Magnesium chloride 6-hydrate Analar VWR
Potassium chloride Analar VWR
Barium chloride Analar VWR
Strontium chloride Analar VWR
Sodium Sulphate Analar VWR
pH adjustment: chemicals compound, grade and supplier
Chemicals Grade Supplier
HCl Analar VWR
NaOH Analar VWR
Standards: chemicals compound, grade and suppliers
Chemicals Grade Suppliers
Calcium 1000ppm Standard Spectrosol VWR
Magnesium 1000ppm Standard Spectrosol VWR
Iron (III) 1000ppm Standard Spectrosol VWR
Lithium 1000ppm Standard Spectrosol Merck
Minerals: grade and suppliers
Minerals Grade Supplier
Sand Analar VWR
Kaolinite Industry Northern Geological Supplies
Siderite Industry Northern Geological Supplies
Glassware and Apparatus:
a. Apparatus: fan-assisted oven or water bath, balance and : 1000ml, 250ml and 150ml
plastic bottles
b. For pH measurement: pH meter, pH 7 & pH 4 buffer solutions for calibration
c. For scale inhibitor dilutions: 1000ml, 500ml, 250ml, 100ml volumetric flasks, and
250ml and 100ml measuring cylinder
d. For diluent solution preparation: 5L volumetric flask, 5L plastic container, 1L beaker
and funnel

Chapter 3: Experimental Methodology
29
e. For filtration: filtering equipment (vacuum pump, conical flasks and tubing) and
filter papers (0.45µm & 0.20µm).
f. For ICP standard preparation: 250ml volumetric flasks, 10ml and 2.5ml variable and
1ml variable pipettes
Preparation of Bottles and Labelling:
80ml (0.08 L) of brine was used for each static adsorption test. The bottles are
numbered to track each concentration used. Experiments at each concentration are
carried out in duplicate to assure the consistency of the results.
Bottle No. [SI], ppm active Bottle No. [SI], ppm active
1 Blank 9 500
2 Blank 10 500
3 20 11 1,500
4 20 12 1,500
5 50 13 4,000
6 50 14 4,000
7 100 15 10,000
8 100 16 10,000
Volume of FW Brine required:
For one (1) experiment :
10,000ppm stock SI in FW solution was prepared in a 1000ml flask; where 1000ml
of FW is required, which can be used for one complete experiment (which consists of
four tests). So, for each experiment, 1000/4 = 250ml is required;
For blank samples and each [SI], 250ml is required each; so for 8 samples = (8X250)
ml = 2,000ml.
For four(4) experiments :
Therefore, for four(4) experiments; 1,000ml of FW is required.
For blank samples and each [SI]; for all the four (4) tests; 2,000x4 = 8,000ml is
required.

Chapter 3: Experimental Methodology
30
Preparation of SI Concentration and Volume:
To elaborate the procedure, DETPMP SI is chosen for all calculations. The
difference in calculation is the activity% involved, where they are 45% and 30% for
DETPMP and OMTHP, respectively.
To prepare 1,000ml of 10,000ppm active SI: use a 1000ml volumetric flask. For the
selected scale inhibitor, the amount was prepared to cater for four experiments;
1. Static Adsorption Test - 10g minerals
2. Static Adsorption Test - 20g minerals
3. Static Adsorption Test - 30g minerals
4. Static Compatibility Test (no mineral)
Each experiment requires 250ml solution. It is highly recommended that the stock
solutions for all these four experiments are prepared together to make sure they are
exactly the same and for good consistency in the final results.
Prepare a 10,000ppm active scale inhibitor stock solution in FW:
10,000ppm = 10,000 mg/L = 10 g/L as supplied
@ 45% active (as written on supplier bottle)
x (g) = 10g / active concentration)
x (g) = 10 / 0.450 = 22.22 g/l
So, 22.22 g would be required to prepare 1,000ml of 10,000ppm DETPMP active at
45%.

Chapter 3: Experimental Methodology
31
Dilute down 10,000ppm active SI stock solution in FW brine to give other
concentrations (Table 3.3):
SI Name SI Activity (%)
Concentration required (ppm)
Volume of SI used (in 1000ml ‘FW’ brine)
DETPMP
45 Blank
20
50
100
500
1,500
4,000
10,000
0/10000*1000 = 0 ml
20/10,000*1000 = 2 ml
50/10,000*1000 = 5 ml
100/10,000*1000 = 10 ml
500/10,000*1000 = 50 ml
1500/10,000*1000 = 150 ml
4000/10,000*1000 = 400 ml
10000/10,000*1000 =1000 ml
Total stock SI solution = 0+2+5+10+50+150+400+1000 = 1617.0 ml
Table 3.3: Volume required to make different concentrations
Since the above requirement is more than the prepared bulk volume of 1,000ml at
10,000ppm; another batch of 1,000ml at 10,000ppm is prepared independently to
complete the range of concentrations.
Notes :
a. In the above table, instructions for the preparation of 1000 ml of each concentration
is given. For one experiment, only 250 ml of each concentration is required. The
other 750 ml was then used for the next three experiments using DETPMP SI. The
stock sample was prepared once, so that all of the four experiments were using
exactly the same stock sample.
b. For one experiment, 250ml of each concentration was taken from the prepared bulk
solution of 1000ml. This enables the same solution to be used for duplicate tests;
which means 2 bottles i.e. test and a duplicate bottle. Each test at each SI
concentration, required 160ml (2x80ml). The remaining 90ml (250-160) was kept in
stock, as the initial solutions were analyzed by ICP to find initial concentration, Co.
We must ensure that the stock solution was pH adjusted before using as test samples
and ICP analysis.

Chapter 3: Experimental Methodology
32
Preparation of Diluent Solution:
Diluent solution was used to dilute samples taken for ICP analysis. For all the ICP
samples, 1% Na+ is used as its diluent solution because the brine used contains the
highest amount of Na+ (~31,000ppm) compared to other cations in the brine. As such,
Na+ as its diluent would provide the closest matrix match when analyzed using ICP. For
all the analysis in these experiments, they are diluted 10 times so that they would match
the calibrated standards.
1% Na+ (aq) ≡ 10,000ppm Na
+ (aq) ≡ 25.42g of NaCl (s) in 1 litre of distilled water
So; in 5 litre of distilled water, it requires 25.42g x 5 = 127.10g of NaCl
Preparation of Standards used for ICP Analysis:
DETPMP at 45% active is used for all calculation to illustrate the procedures.
2,500ppm DETPMP was prepared and used as stock to make all the other
concentrations used as standards.
2,500ppm = 2,500 mg/L = 2.5 g/L as supplied
@ 45% active (as written on supplier bottle)
x (g) = 2.5g / active concentration)
x (g) = 2.5 / 0.45 = 5.56 g/l
Therefore to prepare 250ml of 2,500ppm active DETPMP;
(5.56 / (1000/250))g = 1.39g is required
The diluent / matrix used is 1% Na+ (aq) ≡ 10,000ppm Na
+ (aq). 250ml of each
standard was prepared.
Standard
number
Constituent(s) Active
concentration(s)
Dilution requirements, in 1%
Na+ (aq), using a 250ml
volumetric flask
1 Only 1% Na+ (aq) 10,000ppm N / A
2 DETPMP 5ppm 25ml of Standard 3

Chapter 3: Experimental Methodology
33
3 DETPMP 50ppm 25ml of Standard 4
4 DETPMP 500ppm 50ml of Standard 5
5 DETPMP 2500ppm 1.39g of DETPMP SI*
6*
Ca2+
Mg2+
Li+
Fe3+
50ppm Ca2+
25ppm Mg2+
10ppm Fe3+
5ppm Li+
12.5ml of 1000ppm Std Ca2+
6.25ml of 1000ppm Std Mg2+
2.5ml of 1000ppm Std Fe3+
1.25ml of 1000ppm Std Li+
7*
Ca2+
Mg2+
Li+
Fe3+
200ppm Ca2+
100ppm Mg2+
40ppm Fe3+
20ppm Li+
50ml of 1000ppm Std Ca2+
25ml of 1000ppm Std Mg2+
10ml of 1000ppm Std Fe3+
5ml of 1000ppm Std Li+
Notes: The iron is added to standards 6 & 7 because in some analyses, these ions may
be present when other substrates are used for this experiment, e.g. siderite. Fe3+
should
not be present in this experiment using sand.
Experimental Procedure:
1. Prepare FW brine according to the composition as provided in Table 3.2. Stir and
leave it for 24 hours so that the brine is homogeneous.
2. Filter the FW brine through 0.45um filter paper. This is to remove any dirt and
physical impurities.
3. Use the filtered brine to prepare a 10,000ppm SI stock solution.
4. Use this stock solution to prepare the different SI concentrations for the adsorption
test in the test brine. Refer to Table 3.3 for detail calculation.
5. Weight appropriate amount (10g, 20g or 30g) of substrate (sand, kaolinite or
siderite) into 150ml plastic bottles.
6. pH adjust all stock solution (blank & SI/FW samples) to the required pH, i.e. pH 4.
Record the pH values, before and after adjusted – pHo @ 20oC / room temperature.
7. After pH adjusting all the stocks, aliquot 80ml into the appropriately labelled /
numbered 150ml plastic bottles.

Chapter 3: Experimental Methodology
34
8. Add the pH adjusted test solutions to the bottles containing the minerals and shake
well - ensuring thorough mixing, and transfer into a pre-heated oven at 95oC
immediately. Note the time the samples are mixed and put in the oven – to
9. After approximately one hour, check the bottle lids are tight, to avoid any
evaporation.
10. After 24 hours (t = 24), take out the samples from the oven and filter them under
vacuum through a 0.20 µm pore size filter paper. Filtration is carried out at the
specific temperature of interest in that experiment. For example, samples from
these 95˚C experiments are filtered immediately after they are taken out of the
oven. Transfer the filtrate into labelled / numbered 150ml plastic bottles.
11. After the temperature has settled to room temperature, measure the pH of the
filtrate samples and record the values – pHf @ 20oC / room temperature. Be
consistent with the timing when the bottles are stabilized and the pH is measured.
12. Prepare some diluent solution (see diluent preparation).
13. Prior to ICP analysis, dilute 1ml samples in 9ml of 1% Na+ (aq) diluent solution.
Use 10ml test tubes. The initial stock solutions of each concentration retained
earlier are diluted – to confirm Co values (initial concentrations), and the filtrate
samples are diluted in the same way, to find Cf values (final concentrations after the
adsorption process).
14. ALL stocks and samples are analysed by ICP to confirm Co values, i.e. [SI]o ,
[Ca2+
]o , [Mg2+
]o [Li+]o and find Cf values, ie. [SI]f , [Ca
2+]f , [Mg
2+]f, [Li
+]f in order
to determine the effect of the adsorption process.
15. The amount of SI retained by the mineral, (in mg SI/ g rock), was calculated
using the expression o fV c c m (where oc and fc are the initial and final SI
concentrations respectively, V is the SI solution volume and m is the mass of
substrate). Figure 3.1 shows the schematic diagram of how coupled adsorption and
precipitation occur and this could be interpreted as an “apparent adsorption”, .App

Chapter 3: Experimental Methodology
35
Notes:
The above procedure are applicable for both Static Compatibility Test and Static
Coupled Adsorption/Precipitation Test, with a few exception for Static Compatibility
Test, as follows;
1. There is no mineral involves, as such no mixing between pH adjusted stock solution
and minerals. The pH adjusted stock solutions are to be placed into the pre-heated
oven immediately.
2. The filtered precipitates on filter paper are weighted and sent for ESEM-EDAX
analysis to quantify the amount of phosphorous, calcium and magnesium.
Notes: Disposal procedure= dilute solution can be washed down the sink with copious
amounts of water.
Figure 3.1: Schematic showing how both coupled adsorption and precipitation can
occur.

Chapter 3: Experimental Methodology
36
3.3 NON-EQUILIBRIUM SAND PACK EXPERIMENTS
Non-equilibrium experiments are conducted to analyze the effect of both, (i) the
adsorption and coupled adsorption/precipitation processes and (ii) the flow rate (non-
equilibrium/kinetic effects), on the SI effluent concentrations. Theoretically, the
effluent concentration changes as the flow rates changes if the system is not fully at
equilibrium. Analysis of the return profile of each flood allows us to make comparisons
between precipitation and adsorption floods. The concentrations of calcium and
magnesium were also analyzed to investigate their involvement in the retention
mechanism.
3.3.1 Objective
The objective of these floods was to investigate the adsorption-desorption and
precipitation-dissolution characteristics of pure adsorption and coupled
adsorption/precipitation squeezes at various flow rates for OMTHP SI and SAND
minerals. The data from these can then be used to validate the various mathematical
models which have been proposed for these processes (Sorbie, 2010).
3.3.2 Materials
Scale Inhibitor: The SI used in the non-equilibrium sand pack work is the hexa-
phosphonates, OMTHP which is 30% active. This scale inhibitor is one of a range of
commercial products used in oilfield applications (Briquest). Refer to Chapter 4 for
structure and properties of the OMTHP SI. All inhibitor solutions were prepared in the
standard Nelson Forties Formation Water (NFFW), composition in Table 4.1. The
postflush or back production stage was carried out with synthetic NFFW degassed under
vacuum and pH adjusted to pH= 4. The composition is similar to brine without lithium
ion.
For the precipitation floods, 4000ppm OMTHP was introduced into sand pack column;
whereas for adsorption floods, in addition to 4000ppm, 500ppm and 2000ppm OMTHP
SI was injected.

Chapter 3: Experimental Methodology
37
Minerals: Refer to Chapter 4 for details of the silica sand characterisation. Silica sand
was chosen as the solid phase since it represents a simple model of a sandstone
formation and the results are also very reproducible. The sand used in these experiments
is commercially available (BDH GPR, 40-100mesh) from VWR.
Brine: This brine is Nelson Forties Formation Water (NFFW), similar to the one used
for static adsorption and compatibility tests. Refer to Table 3.2 above for composition
and details of the brine.
For Static Adsorption and Compatibility Tests, no degassing is required. Whereas, for
non-equilibrium sand pack experiments, degassing is required as the fluid passes
through the core or sand pack at high temperature, and any degassing may influence the
calculation of pore volume, porosity and permeability. Generally, for every litre of
brine, it is degassed for an hour. `
Post Flush: There are two types of post flush used in this experiment. The most
common case is where a similar postflush composition to the original brine composition
is applied but usually without any lithium ion present. It is degassed under vacuum and
pH adjusted to pH4. The alternative post flush which is used in this work is 1% Na+,
which is also degassed and adjusted to pH4.
Tracers: Lithium ion is used as a tracer for all the floods in these experiments. Lithium
is known as an inert tracer, which does not react with brine, scale inhibitor or sand.
Lithium tracer ions are incorporated within the scale inhibitor slug in order to allow
direct comparison of the inhibitor and tracer profiles for inhibitor retardation (due to any
retention mechanism) and at the end of a particular inhibitor flood.
Iodide ions may be introduced in the synthetic brine as sodium iodide (NaI) where it is
used as a tracer to determine the dead volume and pore volume of the sand pack in this
study. Iodide tracer analysis is used to characterise the sand packs in term of pore
volume prior to an inhibitor flood. The iodide ion can be detected by UV in-line in our
floods i.e. it can be analysed directly as the fluid exits the sand pack and we do not need
to gather samples and analyse it later (as for Li+ for example).

Chapter 3: Experimental Methodology
38
3.3.3 Experimental Methodology
Experimental Apparatus
The sand pack experimental set-up consists of the following apparatus:
High pressure liquid chromatography (HPLC) Pump - Pharmacia Pump P-500
Pressure transducer (only if permeability is measured)
High pressure glass column (Pyrex)
UV spectrophotometer
Magnetic stirrer
Auto diluter
ICP
Fraction collector -Pharmacia LKB FRAC-100
Vacuum filter funnel & vacuum pump.
A schematic diagram of the sand pack flooding apparatus is shown in Figure 3.2 and this
is essentially a one dimensional (1D) flow experiments. The apparatus was designed to
carry out low pressure flooding experiments. The main components are a sand pack
column, water bath, pump or a feed unit for injection of fluid into the porous bed, UV
spectrophotometer and a sample collector. The column fitting and tubing for the sand
pack model were supplied by Anachem. The sand pack column is made from heavy
walled borosilicate pyrex glass, which allows a clear view of the packing and provides a
metal free environment in which undesirable chemical reaction between the flowing
fluid and the conducting media is avoided. Refer to Figure 3.3 for an actual view of the
sand packed in the column. The column has an internal diameter of 1.50cm. The
associated inlet and outlet fittings have an average dead volume of ~1.36ml. The dead
volume determination is very important for accurate effluent profile calculations since a
correction factor must be used to allow for this in the effluent profiles. A wet slurry
method was adopted for packing the sand in order to prevent the formation of air
bubbles in the column and to minimise sagging of the sand. The fluids were injected
into the porous pack using a Pharmacia P-500 model HPLC pump. As the fluids exited
the sand pack samples were collected in an automatic fraction collector (Pharmacia
LKB FRAC-100 model) capable of operating by time intervals. Alternatively, in some

Chapter 3: Experimental Methodology
39
floods the fluids were passed through a UV/Vis Spectrophotometer for in-line iodide
tracer analysis.
0 3 0 ml/hr
Max P Set Flow Rate
Run
Solvent
ChangePressure MPa
Pump Reset
0 3 0 ml/hr
Max P Set Flow Rate
Run
Solvent
ChangePressure MPa
Pump Reset UV/Vis Spectrophotometer
UV Beam
Flow Cell
Pharmacia P500 Pump
Fraction
Collector
Drain
0 3 0 ml/hr
Max P Set Flow Rate
Run
Solvent
ChangePressure MPa
Pump Reset
0 3 0 ml/hr
Max P Set Flow Rate
Run
Solvent
ChangePressure MPa
Pump Reset UV/Vis Spectrophotometer
UV Beam
Flow Cell
UV Beam
Flow Cell
Pharmacia P500 Pump
Fraction
Collector
Drain
Figure 3.2: Schematic Diagram of the Sand Pack Flooding Apparatus
Figure 3.3: Actual view of sand packed in the column
Packing Technique
The column packing method used in this work was the wet slurry packing method. In
this method, a very reproducible, air free and homogeneous sand pack can be produced.
Care must be taken to ensure that the sand and the model were free from any impurities
before and after packing. Figure 3.4 shows the set up of the sand pack in the column with
the procedure introduced as follows:

Chapter 3: Experimental Methodology
40
1. Mix a constant mass of sand with 6% NaCl for 1 hour to prevent dusting during
dry mixing.
2. One end piece is fitted first and then the 6% NaCl solution is introduced to fill
about 1/3 of the column length.
3. Open the valve connected to the bottom end fitting to allow the 6% NaCl
solution in the column to flow out slowly to adjust the liquid level.
4. Load the column with sand slurry until it is 1 or 2 cm from the top of the
column.
5. Close the valve and take out the excess solution using syringe.
6. The second end piece is fitted once the column has been loaded
7. The column is connected to the pump and the UV Spectrophotometer.
The 6% NaCl solution is used to prepare the slurry because it is the suitable salinity to
prevent any precipitation with divalent cation if it is to be prepared with formation water
brine. The 6% NaCl is also suitable as to prevent early swelling effect on the sand.
Figure 3.4: Schematic diagram of sand pack “packing” technique

Chapter 3: Experimental Methodology
41
Sand Pack Characterization
Dead Volume Measurement: The dead volume determination is carried out by
connecting two end pieces of an empty column (without sand packed in the column) as
shown in Figure 3.5. The solutions that were required for this test are the synthetic
NFFW with the composition as in Table 3.2 or any base brine used to make scale
inhibitor solutions for a particular experiment, and 10ppm sodium iodide in NFFW.
Sodium Iodide is an inert tracers which is used in the in-line tracer experiments to
determine dead volumes, pore volume etc.
For the dead volume determination using iodide tracer, the pump is first flushed (solvent
changed) with the synthetic formation brine to purge out the previously used brine in the
pump. The column is then flushed with the same formation brine to get the UV/Vis
baseline level. The column is then injected with the iodide tracer solution. The UV/Vis
Spectrophotometer is automatically started and logs the iodide tracer that passes through
the exit cell using UV light. The system was allowed to reach the full input
concentrations before the test was stopped. The tracer brine is then displaced by the
non-tracer brine and a second dead volume calculation is made. The average of the two
values is taken as the final dead volume measurement.
For dead volume characterisation using lithium tracer (Li+), the analysis is done using
Inductively Couple Plasma Optical Emission Spectroscopy (ICP-OES). Lithium tracer
is used to investigate the true dead volume of the tubing that flows to the fraction
collection as the remainder of the experiment will use the fraction collection line. The
shape of the Li+ or iodide tracer profiles can also be used to diagnose heterogeneity
within the sand packs.

Chapter 3: Experimental Methodology
42
Figure 3.5: Column without sand for dead volume measurement
Pore Volume and Porosity Measurement
The iodide tracer flood was carried out to determine the pore volume and porosity of the
sand pack. The pore volume determination is done by using the same method as
described above with sand pack placed in the system. For each sand pack, the pore
volume characterisation is done by flowing in the iodide tracer into the pack and
measuring the effluent profile using the UV Vis Spectrophotometer. The remaining
procedure for pore volume characterisation follows the same procedure as in dead
volume characterisation using the iodide tracer. The porosity can then be calculated
from the pore volume value obtained from the experiment by determining the fraction
of the sand pack volume available for fluid flow.
The values of dead volume and pore volume are important to determine the total volume
that needs to be injected during the main treatment and post flush of the squeeze
experiment. The dead volume determination is measured at room temperature (T=200C)
while the pore volume determination is carried out at 950C. Table 3.3 shows results for
the the dead volume, pore volume and porosity of all the sand packs used in this study.
In all the experiments reported later in this thesis, the pore volume at room temperature
will be used for all calculation.

Chapter 3: Experimental Methodology
43
Sand Pack ID A C D E F G
Length (cm) 20.05 20.50 20.40 20.40 20.70 20.9
Diameter (cm) 1.5 1.5 1.5 1.5 1.5 1.5
Dead Volume (ml) 1.54 1.54 1.24 1.34 1.34 1.34
Pore Volume (ml) 13.64 14.69 14.73 14.60 14.66 14.11
Porosity (%) 38.49 40.52 40.85 40.87 40.06 38.21
Sand Wt. (g) 93.58 95.68 95.21 95.21 96.61 97.87
Table 3.4: Example of Sand Pack Characterization Results
Chemical Preparation:
a. Brine: Synthetic Nelson Forties Formation Water (NFFW)
Weigh out the correct amount of the salt compounds based on the composition
given in Table 3.2.
Dissolve the salt in the required amount of distilled water.
Mix and stir the solution for 4-5 hours to allow for adequate mixing.
Leave the brine for 24 hours before use if 20L brine prepared.
Filter through 0.45m filter paper prior to use.
Degas the brine prior to use. Degas for one (1) hour for every litre of brine.
Do the pH adjustment to 4 after the pH meter has been calibrated.
b. Tracer: 10ppm Sodium Iodide
0.29 gram of Sodium Iodide is weighed out using a 3 figure balance.
Dissolve the salt in 250ml with formation water brine. This will give 1000ppm
of Sodium Iodide solution.
Pipette 10ml of 1000ppm Sodium Iodide solution and make up to 1000ml with
formation water.
This will give the required 10ppm Sodium Iodide solution.
Filter the solution with 0.45m filter paper.
Degas the solution for 1 hours.
Do the pH adjustment to 4 after the pH meter has been calibrated.

Chapter 3: Experimental Methodology
44
c. Tracer: 50ppm Lithium Ion
3.06 gram Lithium Chloride is weighed out using a 3 figure balance
Dissolve the salt in 500ml formation water brine. This will give 1000ppm of
Lithium Chloride solution
Pipette 50ml of 1000ppm Lithium Chloride solution and make up to 1000ml
with formation water to give 50ppm Lithium Chloride solution
Filter the solution with 0.45m filter paper
Degas the solution for 1 hours
Do the pH adjustment to 4 after the pH meter has been calibrated.
d. 1% Na+ Diluents Solution
1% Na+ (aq) ≡ 10,000ppm Na
+ (aq) ≡ 25.42g of NaCl (s) / 1L H2O (l) ≡ 127.10g
of NaCl (s) / 5L H2O (l)
Dissolve 127.10g of NaCl (s) in 5L of distilled water.
e. 4000ppm active SI Solution with 50ppm Lithium ion in NFFW
Determination of the amount of scale inhibitor needed:
4000ppm = 4000mg/L = 4 g/L as supplied @30% active
X (g) = 4 x (4000/active concentration)
X (g) = 4 x (4000/1200)
= 13.33 g/L
Weigh out 13.33g OMTHP SI, commercial name = Briquest 684-30S
Dissolve the scale inhibitor in 1000ml formation water brine that contains
50ppm Lithium for inert tracer and scale inhibitor adsorption comparison
Filter the solution with 0.45m filter paper
Degas the solution for at least 1 hour
Do the pH adjustment to 4 after the pH meter has been calibrated.
f. Preparation of Standards used for Diluted Samples for ICP analysis
OMTHP at 30% active is used for all calculation to elaborate the procedure.
2,500ppm = 2,500 mg/L = 2.5 g/L as supplied
@ 30% active (as written on supplier bottle)
x (g) = 2.5g x (2500/active concentration)
x (g) = 2.5 x (2500/750) = 8.3333 g/l
Therefore to prepare 250ml of 2,500ppm active OMTHP, (8.3333/4)g = 2.08 g is
required.

Chapter 3: Experimental Methodology
45
The diluent / matrix used is 1% Na+ (aq) ≡ 10,000ppm Na
+ (aq). 250ml of each
standard will be prepared.
Standard
Number
Constituent(s) Active
Concentration(s)
Dilution requirements, in 1% Na+
(aq), using a 250ml volumetric flask
1 Only 1% Na+ (aq) N/A N / A
2 OMTHP 5ppm 25ml of Standard 3
3 OMTHP 50ppm 25ml of Standard 4
4 OMTHP 500ppm 50ml of Standard 5
5 OMTHP 2500ppm * 2.08g of OMTHP SI
6** Ca2+
Mg2+
Li+
Fe3+
50ppm Ca2+
25ppm Mg2+
10ppm Fe3+
5ppm Li+
12.5ml of 1000ppm Std Ca2+
6.25ml of 1000ppm Std Mg2+
2.5ml of 1000ppm Std Fe3+
1.25ml of 1000ppm Std Li+
7** Ca2+
Mg2+
Li+
Fe3+
200ppm Ca2+
100ppm Mg2+
40ppm Fe3+
20ppm Li+
50ml of 1000ppm Std Ca2+
25ml of 1000ppm Std Mg2+
10ml of 1000ppm Std Fe3+
5ml of 1000ppm Std Li+
Notes: **The Iron is added to standards 6 & 7 because in some analyses, this ion may
be present when other substrates are used for this experiment, e.g. siderite. Fe3+
should
not be present in this experiments using sand.
g. Preparation of Standards used for Neat Samples for ICP analysis in NFFW.
Use Main Treatment at 2000ppm active as initial stock
The diluent / matrix used is NFFW. 250ml of each standard will be prepared.
Standard
Number
Constituent(s) Active
Concentration(s)
Volume required in 250ml
volumetric flask
1 NFFW n/a n/a
2 (Stock) OMTHP 2000ppm active Use prepared stock
3 OMTHP 500ppm 62.5 of Std-2
4 OMTHP 50ppm 25 ml of Std-3
5 OMTHP 5ppm 25 ml of Std-4

Chapter 3: Experimental Methodology
46
6 OMTHP 0ppm n/a
Notes:
Referring to the (g) preparation of standards used for neat samples for ICP analysis in
NFFW; it is advisable to make 2500ppm again from neat to check that the solution is
diluted first from Sand Pack stock correctly.
Sand Pack SI Flood - Experimental Procedure
The procedure comprises the injection of a scale inhibitor (SI) slug into the pre-
conditioned substrate (in this case, the sand pack), followed by a shut-in for a certain
period of time to allow the adsorption/precipitation to take place. For all the sand packs
in these experiments, the shut in took place at 95°C. This is followed by post flushing
with a synthetic NFFW brine (with various compositions as specified) where
desorption/dissolution will then take place.
The procedure applied in the sand pack study replicates to some extent the squeeze
treatment process carried out in the actual production well. The test was started by pre-
flushing the sand pack to pre-condition it with synthetic NFFW brine (or any base brine
used to make scale inhibitor concentrations) solution at a flow rate of 20ml/hr. Pre-
flushing is carried out at room temperature in order to prevent any precipitation in the
pack. This is followed by a main treatment, i.e. injecting the scale inhibitor into the pack
at 20ml/hr, which is also carried out at room temperature. The total volume of scale
inhibitor to be injected is approximately 10PV, where the objective is to inject the scale
inhibitor into the pack until maximum concentration is reached i.e. the pack is fully
saturated with SI at input concentration. The effluent samples were collected every 2ml
for the duration of the injection stage. All these samples were collected in a fraction
collector and analysed later by the ICP.
After the main treatment, the sand pack is shut-in for at least 20 hours in the water bath
which is then set at 95oC. At this stage all the injected scale inhibitor solutions are
expected to have reached maximum equilibrium adsorption or precipitation on the
mineral sand.

Chapter 3: Experimental Methodology
47
After the shut-in, the system is post-flushed by injecting the synthetic NFFW brine into
the system at various rate (refer to Table 3.5) at reservoir temperature of 95°C. At this
stage a large volume of post flush must be injected into the pack (typically 11+PV). The
idea is to continuously flush out all the adsorbed/retained scale inhibitor in the pack
until a low [SI] in the effluent is reached; this low concentration is equivalent to a
nominal “minimum inhibitor concentration” (MIC) of about 1ppm or until the
concentration stabilizes. Over all of this postflush period, effluent samples were
collected as shown in Table 3.5. All of these samples were collected in a fraction
collector and diluted 1 in 10 for the first 60 samples (1ml of sample in 9ml of 1%Na+
solution = 10ml per sample). All the samples were analysed by ICP for calcium,
lithium, magnesium, and phosphorus (SI) concentrations.
Step-by-Step General Experimental Procedure:
Dead Volume Measurement
1. To calculate dead volume; connect the end pieces without sand pack and perform
in-line trace in/out with 10ppm iodide in NFFW.
2. The pump must first be flushed with the synthetic formation water brine (NFFW) to
purge out the previously used brine in the pump.
3. Flush with NFFW to get the UV/Vis spectrophotometer baseline level.
4. Solvent change the pump with the iodide tracer solution to condition the pump with
the solvent required for the test.
5. Inject the pack with the iodide tracer solution. Switch on the UV/Vis
spectrophotometer as soon as the first drop appears at the outlet end of the tubing.
6. Stop the pump and UV-Vis when the system reaches the plateau. Save the UV file.
7. Solvent change to non-dosed FW. Repeat steps 5-6 for the trace out.
8. Repeat the dead volume determination with lithium tracer by using the same
procedure as the iodide tracer.
9. Send the effluent samples collected by fraction collector to ICP for analysis of
lithium ion to determine the dead volume.

Chapter 3: Experimental Methodology
48
Pore Volume and Porosity Measurement
10. After loading the column with minerals equilibrate the column with NFFW (pH4)
at flow rates of (30-250) ml/hr for 1hr until steady ΔP.
11. (Trace in) Pump several pore volumes of 10ppm iodide in NFFW (pH4) at 150
ml/hr and analyze for iodide using the in-line UV spectrophotometer to calculate
the pore volume.
12. (Trace out) inject NFFW (pH4) at flow rate of 150 ml/hr.
13. Place Pack in water bath at 95’C.
14. Repeat stages 10-12 at 95’C.
15. Remove pack from water bath.
16. Repeat stages 10-12 at room temperature.
Main Treatment and Post Flush
17. Preflush to precondition the column with NFFW (pH4) at 150 ml/hr at room
temperature.
18. Main treatment: Introduce the prepared scale inhibitor and (50ppm Li+) lithium
tracer in NFFW (pH4) at a flow rate of 30 ml/hr and collect every 2 ml of the
effluent (2ml sample/4min) for 160 min (48 samples) at room temperature.
19. The inhibitor flow is stopped after (3PV to 5PV) pore volumes when 100% injected
inhibitor concentration is recorded in the effluent.
20. Place the pack back into the water bath at 95’C. Shut-in overnight (24 hrs). The
remainder of the experiment will now take place in the water bath at 95’C
21. Post-flush treatment: Collect every 2ml of the effluent in the first 2PV (32
samples); 5ml for 5PV (32 samples) and 10 for 10PV (32 samples) (i.e. Post-flush
the packed column with NFFW (pH4) until the [effluent] drops below minimum
inhibitor (active) concentration).
22. The collected samples for the main treatment and initial post flush are diluted 10
times (1ml of sample in 9ml of 1% Na+ solution = 10ml total) and analyzed (using
ICP) for calcium, lithium, magnesium, inhibitor (Phosphonate based inhibitors) and
pH is monitored.

Chapter 3: Experimental Methodology
49
23. Late post-flush samples are analyzed ‘neat’ (i.e. no dilution) using the FW
standards prepared in (f) to determine the [SI].
Sand Pack
ID
Flood Type
Main Treatment Shut-In Post Flush
[SI] (ppm)
[Ca] (ppm)
pH T (°C)
Q (ml/hr)
T (°C)
T (hrs)
T (°C)
Q (ml/hr)
[Ca] (ppm)
SP-A
Pptn
4000
2000
4
20
20
95
>20
95
20
2000
SP-C
Pptn
4000
2000
4
20
20
95
>20
95
20 10 5 5 2
2000 2000 2000 2000 2000
SP-D
Pptn
4000
2000
4
20
20
95
>20
95
20 20 10 5 2
2000
0 0 0 0
SP-E
Ads
500
2000
4
20
20
95
>20
95
20 10 5 2
2000 2000 2000 2000
SP-F
Ads
4000
428
4
20
20
95
>20
95
20 10 5 2
428 428 428 428
SP-G
Ads
2000
428
4
20
20
95
>20
95
20 10 5 2
428 428 428 428
Table 3.5: Summary of Experimental Details of Adsorption and Precipitation Flood
Notes: Between each flow rate, shut-in took place for more than at least 20 hrs

50
CHAPTER 4: ESTABLISHING RETENTION MECHANISMS
THROUGH STATIC COMPATIBILITY AND COUPLED
ADSORPTION / PRECIPITATION EXPERIMENTS SAMPLES
4.1 INTRODUCTION
The retention of the scale inhibitor (SI) within the formation is central to a squeeze
treatment having a long lifetime (Kerver and Heilhecker, 1969; Miles, 1970; Vetter,
1973; King et al., 1985, 1989; Yuan et al., 1993; Boreng et al., 1994 and Sorbie et al.,
1994). Scale inhibitors are retained within porous media by the two main mechanisms
of “adsorption” (Γ) and “precipitation” (Π) . There is not complete agreement in the
literature about when we should use one mechanistic description or another and three
“schools” of thought on the retention issue have emerged, as follows:
(i) Heriot-Watt University (HWU) – where adsorption is described by a generalised
adsorption isotherm, Γ(C), and precipitation is described by a solubility function,
Π(C), and a dissolution rate constant (denoted, 2r );
(ii) Halliburton – Gdanski and Funkhouser(2001) describe retention through an
adsorption mechanism based on the specific mineralogy of the (sandstone) rock;
(iii) Rice University – describe SI retention by a precipitation/dissolution mechanism
based on the precipitation and solubility of the various Ca-SI salts that are formed.
Field SI squeeze treatments have been modelled quite successfully using all three of the
above approaches, but often the field observations are not accurate enough to
distinguish clearly between different models. A detailed analysis of a given retention
mechanism – for example pure adsorption or coupled adsorption and precipitation –
requires careful laboratory experiments at the appropriate “field relevant” conditions. A
central objective of current research within the FAST group at Heriot-Watt University is
to (i) provide data for the development of a fully consistent generalised model that can
describe both coupled* adsorption and precipitation, and (ii) devise experiments which
can test this model experimentally. (*By “coupled” here, we mean that the SI species

Chapter 4: Establishing Retention Mechanisms Through Static Compatibility and Coupled Adsorption/
Precipitation Experiments
51
may be involved in both adsorption and precipitation and hence these processes are not
independent. This feature must consistently and correctly described by any
mathematical model of the coupled processes).
In this chapter, we present the results on static compatibility and coupled
adsorption/precipitation experiments using a range of phosphonate scale inhibitors and
several minerals. Scale inhibitors DETPMP (a penta-phosphonate) and OMTHP (an
hexa-phosphonate) are used to study this behaviour. These experiments were carried out
at a range of fluid volume/adsorbent mass ratio, since, as we will show below, this
indicates whether we are in the purely adsorbing or in the coupled
adsorption/precipitation regime. For the static adsorption tests; m = 10g, 20g and 30g
sand, kaolinite and siderite were used (with a fixed volume of SI solution; V= 80ml)) as
minerals to analyse the adsorption behaviour. On the other hand, static compatibility test
were conducted with no minerals present, and these are used to determine whether or
not any pure precipitation is observed. The experimental results for phosphonate scale
inhibitors show excellent agreement with the theory in different regions of pure
adsorption and coupled adsorption/precipitation. These results show clearly how such
laboratory measurements should be carried out to determine both the levels of SI
retention and the precise retention mechanism.
4.2 BACKGROUND AND NOMENCLATURE
Chemical scale inhibitors (SI) are applied routinely in downhole “squeeze” treatments
to prevent mineral scale formation (Kerver and Heilhecker, 1969; Miles, 1970; Vetter,
1973 and King et al., 1985, 1989). One of the most important issues in this process is
how long the squeeze lifetime will last where this lifetime is defined as the time until
the returned SI concentration drops below the MIC (Minimum Inhibitor Concentration)
to prevent/delay scale formation. The squeeze lifetime in turn depends very strongly on
precisely how – i.e. through which mechanism - the SI is “retained” within the porous
medium. To assist the discussion on this chapter we clarify the terms we use in the
following terminology:
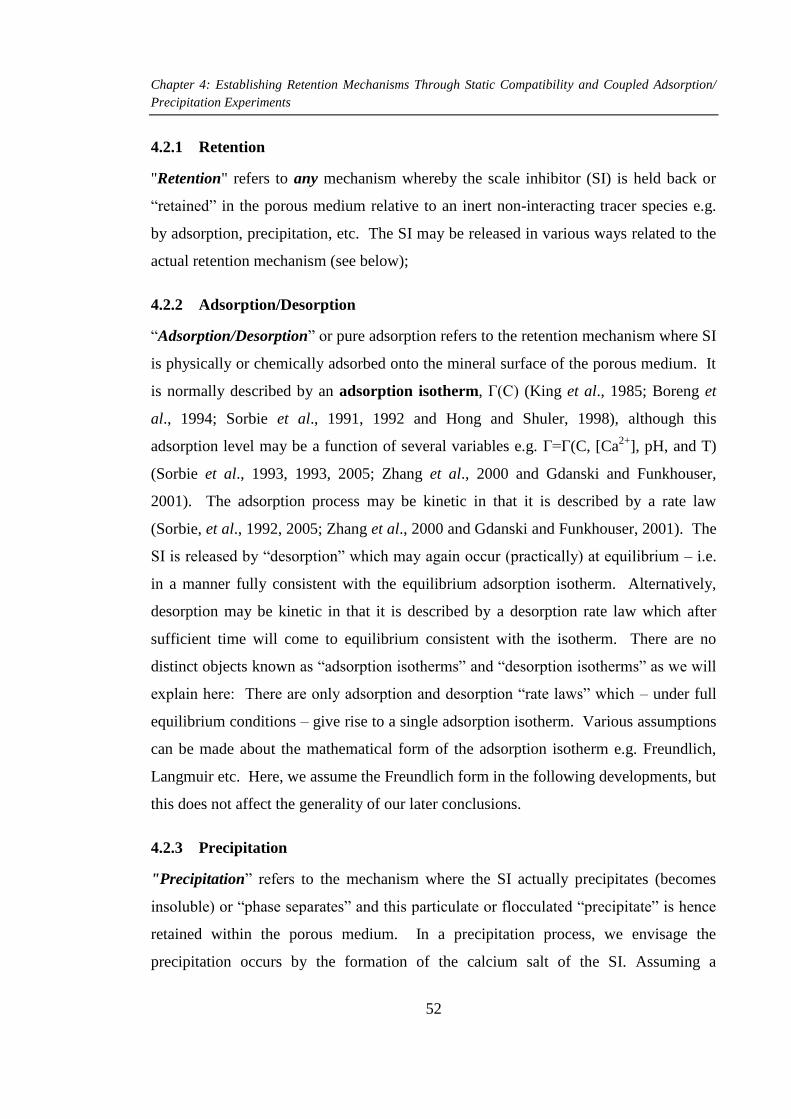
Chapter 4: Establishing Retention Mechanisms Through Static Compatibility and Coupled Adsorption/
Precipitation Experiments
52
4.2.1 Retention
"Retention" refers to any mechanism whereby the scale inhibitor (SI) is held back or
“retained” in the porous medium relative to an inert non-interacting tracer species e.g.
by adsorption, precipitation, etc. The SI may be released in various ways related to the
actual retention mechanism (see below);
4.2.2 Adsorption/Desorption
“Adsorption/Desorption” or pure adsorption refers to the retention mechanism where SI
is physically or chemically adsorbed onto the mineral surface of the porous medium. It
is normally described by an adsorption isotherm, Γ(C) (King et al., 1985; Boreng et
al., 1994; Sorbie et al., 1991, 1992 and Hong and Shuler, 1998), although this
adsorption level may be a function of several variables e.g. Γ=Γ(C, [Ca2+
], pH, and T)
(Sorbie et al., 1993, 1993, 2005; Zhang et al., 2000 and Gdanski and Funkhouser,
2001). The adsorption process may be kinetic in that it is described by a rate law
(Sorbie, et al., 1992, 2005; Zhang et al., 2000 and Gdanski and Funkhouser, 2001). The
SI is released by “desorption” which may again occur (practically) at equilibrium – i.e.
in a manner fully consistent with the equilibrium adsorption isotherm. Alternatively,
desorption may be kinetic in that it is described by a desorption rate law which after
sufficient time will come to equilibrium consistent with the isotherm. There are no
distinct objects known as “adsorption isotherms” and “desorption isotherms” as we will
explain here: There are only adsorption and desorption “rate laws” which – under full
equilibrium conditions – give rise to a single adsorption isotherm. Various assumptions
can be made about the mathematical form of the adsorption isotherm e.g. Freundlich,
Langmuir etc. Here, we assume the Freundlich form in the following developments, but
this does not affect the generality of our later conclusions.
4.2.3 Precipitation
"Precipitation” refers to the mechanism where the SI actually precipitates (becomes
insoluble) or “phase separates” and this particulate or flocculated “precipitate” is hence
retained within the porous medium. In a precipitation process, we envisage the
precipitation occurs by the formation of the calcium salt of the SI. Assuming a

Chapter 4: Establishing Retention Mechanisms Through Static Compatibility and Coupled Adsorption/
Precipitation Experiments
53
precipitation reaction such as22 . _ nSI n Ca SI Ca , where 2n Ca ions may bind to
a single SI molecule. The solubility of this sparingly soluble salt would be described by
an equilibrium solubility product, spK , of the form: 2[ ].[ ]n
spK SI Ca . However, a more
complex form of this precipitation law may be formulated but again this derives from
the steady-state form of the various rate laws for deposition and re-dissolution, as
explained in detail in this chapter.
4.3 THEORY OF COUPLED ADSORPTION AND PRECIPITATION
The discussion of when SI “adsorption” and/or “precipitation” are occurring in a given
system provides much confusion to the oil industry. Hence, detailed and clear
description of these processes will be put forward since it is straightforward to establish
experimentally when adsorption or adsorption/precipitation is taking place for a given
porous medium (or a mineral separate), SI, brine composition, pH and temperature (T).
4.3.1 Static Adsorption
A schematic diagram of a static adsorption experiment is shown in Figure 4.1, which is
the basic concepts of scale inhibitor adsorption. A SI of initial concentration, c0 (ppm
or mg/L), in a volume, V (L), is allowed to come to equilibrium with a mass, m (g), of
mineral. At equilibrium concentration of the SI, ceq, then by material balance the
adsorption level is as follows:
0( )eqV c c
m
(5.1)
where in the units used, then Γ is in mg of SI/g of rock. The apparent adsorption
isotherm may depend on the mass/volume (m/V) ratio if a coupled
adsorption/precipitation process occurs. However if the pure adsorption is the main
mechanism of the bulk inhibitor then the adsorption results at different m/V ratio will
change along the isotherm curve. In this case it is clearly observed that the apparent
adsorption is not a function of the m/V ratios. Therefore plotting adsorption Γ vs.
inhibitor concentrations C and doubling the mass/volume ratios (m/V) would appear to
reduce the results to the half values for the apparent adsorption which is coupled
inhibitor adsorption/precipitation, but we know that at low inhibitor concentrations

Chapter 4: Establishing Retention Mechanisms Through Static Compatibility and Coupled Adsorption/
Precipitation Experiments
54
region the pure adsorption isotherm is responsible.
Figure 4.2 shows measured experimental static adsorption isotherms, Γ (C), for
DETPMP on crushed core material. At various pH values, 2, 4 and 6 at T = 25oC (Yuan
et al, 1994). It is quite clear from these results that the level of SI adsorption is also
strongly dependent on pH as well as on [SI] and hence we should strictly write,
(C, pH) or (C, [H+]). However, for the moment, we will persist with simpler
assumption that Γ is a function of C = [SI] only.
Figure 4.1: Shows the process of simple static adsorption on a porous medium
comprising a mineral separate, of mass m e.g. sand, kaolinite, siderite etc. See units.

Chapter 4: Establishing Retention Mechanisms Through Static Compatibility and Coupled Adsorption/
Precipitation Experiments
55
(C) mg/g
Figure 4.2: Experimental static adsorption isotherms, Γ(C), for DETPMP on crushed
core material. At various pH values, 2, 4 and 6 at T = 25oC (Yuan et al., 1994).
4.3.2 Coupled Adsorption/Precipitation
The analysis for pure adsorption can be extended to the case where both adsorption and
precipitation can occur simultaneously. This is shown schematically in Figure 4.3,
where we envisage that precipitation occurs by the formation of the calcium salt of the
SI, SI_Can, as follows:
. _ nSI nCa SI Ca
(5.2)
where n Ca2+
ions may bind to a single SI molecule. The solubility of this sparingly
soluble salt would be described by an equilibrium solubility product,spK , of the form:
[ ].[ ]n
spK SI Ca (5.3)

Chapter 4: Establishing Retention Mechanisms Through Static Compatibility and Coupled Adsorption/
Precipitation Experiments
56
Figure 4.3: Schematic showing how both coupled adsorption and precipitation can occur
showing how this could be interpreted as an “apparent adsorption”, .App
The following additional notation is introduced in Figure 4.3:
10c and
1 fc - initial (t = 0) and final equilibrium (t ) SI Molar concs. (M);
20c and
2 fc - initial (t = 0) and final equilibrium (t ) Ca Molar concs. (M);
Γ is the adsorption which depends on 1 fc , 1 fc (mg/g);
the precipitation process depends on both 1 fc (SI conc.) and
2 fc (Ca conc.) through
spK as follows: 1 2.n
sp f fK c c in this notation when the system is at equilibrium; units
of spK M
n+1;
pm is the actual mass of precipitate which forms.
Note that the initial and final values of SI concentration are 10c and
1 fc . Some of this SI
which is “missing” from the bulk solution is adsorbed and the remainder of it is part of
the precipitate. However, if we assumed that all of this “missing” SI is adsorbed, then
we would calculate an “apparent adsorption”, .App , as follows:
10 1
.
( )f
App
V c c
m
(5.4)
which would clearly be an over-estimate of the actual adsorption (since some of this

Chapter 4: Establishing Retention Mechanisms Through Static Compatibility and Coupled Adsorption/
Precipitation Experiments
57
would be precipitate) but it is what would be measured in an actual experiment if the
above formula were applied.
In Appendix A, a full derivation of the equations is presented describing coupled
adsorption/precipitation based on the view of the process shown schematically in Figure
4.3 (Kahrwad, M et al., 2008). Using the notation above, the final working equation for
c1f (the equilibrium [SI]) is given by:
1/
10 1 1 20
1
1.
. 1000
n
sp
f f
SI f
Kmc c c c
V M n c
(5.5)
and this equation can be rewritten in the final working form as:
1/
1 1 1 20 10
1
1( ) .
. 1000
n
sp
f f f
SI f
KmF c c c c c
V M n c
(5.6)
Where, at equilibrium adsorption/precipitation, we must solve this equation for c1f i.e.
find the root of 1( ) 0fF c . Note that Eq. 5.6 applies if (and only if) there is definitely a
precipitate i.e. 1 2.n
f fc c > Ksp. If there is no precipitate, then the substitution,
1/
2 1
n
f sp fc K c , does not apply and the quantity 1/
20 1
n
sp fc K c < 0 which is unphysical.
Hence in solving the main working Eq. 5.6, we can use it for all cases of adsorption
only or coupled adsorption/precipitation by setting the quantity 1/
20 1
n
sp fc K c to
its actual value if it is 0, or to zero otherwise.
4.4 EXPERIMENTAL DETAILS
Static Adsorption Tests and Static Compatibility Tests were performed to evaluate pure
adsorption and coupled adsorption/precipitation behaviour of DETPMP (a Penta-
Phosphonate) and OMTHP (an Hexa-Phosphonate) scale inhibitors (SI) with synthetic
Nelson Forties Formation Water (NFFW). For static adsorption tests, the experiments
were performed using different masses of sand, kaolinite and siderite (m = 5g, 10g, 20g

Chapter 4: Establishing Retention Mechanisms Through Static Compatibility and Coupled Adsorption/
Precipitation Experiments
58
and 30g) to evaluate the coupled adsorption/precipitation behaviour. In the
corresponding static compatibility tests, the experiments were performed to evaluate the
precipitation behaviour, since no mineral was used in these tests. As such, any lost in
concentration of SI during compatibility test must be due to precipitation.
The following experiments were conducted to study the adsorption and coupled
adsorption/precipitation phenomena.
1. DETPMP-Sand Static Adsorption/Compatibility at 95°C
2. OMTHP-Sand Static Adsorption/Compatibility at 95°C
3. DETPMP-Kaolinite Static Adsorption/Compatibility at 95°C
4. OMTHP-Kaolinite Static Adsorption/Compatibility at 95°C
5. DETPMP-Siderite Static Adsorption/Compatibility at 95°C
4.4.1 Materials
Scale Inhibitors (SI): Two scale inhibitors were used in this work. They are;
a) Di-ethylene Tetra-amine Penta (methylene-phosphonic acid) or DETPMP, a penta-
phosphonate
b) Octa-methylene Tetra-amine Hexa (methylene-phosphonic acid) or OMTHP, a
hexa-phosphonate
Both SIs are from the phosphonate family group. They are commercial products widely
used in oilfield applications. Figure 4.4 and Figure 4.5 show the structure and properties
of DETPMP and OMTHP, respectively. Appendix B table shows a table of the material
safety data sheet (MSDS). All SI concentration with lithium tracers were prepared in
standard synthetic NFFW and were pH adjusted to any suitable value chosen for these
experiments. Inductive Coupled Plasma (ICP) analytical method (Water Analysis
Handbook, 1989) was used in this study for many of the elements e.g. P, Ca, Mg, Li
etc., and we are able to assay down to <1ppm (±0.2ppm) for all of these species. Results
for different SI concentrations using phosphonate inhibitors with sand mineral were
conducted earlier by Kahrwad et al. (2008).

Chapter 4: Establishing Retention Mechanisms Through Static Compatibility and Coupled Adsorption/
Precipitation Experiments
59
N
N
N
P
P
P
P
P
O
O
O
O
O
HO
OH
HO
OH
HO
OH
HO
OH
OH
HO
Properties
Appearance - Brown liquid
Iron (as Fe) - 100ppm max
Chloride (as Cl) - 6% w/w max
Active Solids (as acids) - 45% w/w
pH (1% w/v soln, 20 C) - 2 max
SG (20 C) - 1.20 – 1.26
MWt. - 573.25 g/mol
Figure 4.4: DETPMP SI structure and properties
N N
N N
P
P
P P
P
O O
O
O
HO
OH
HO
OH
HO
OH
OH
HO
OHO
OHP
O OH
HOProperties
Appearance - Amber liquid
Iron (as Fe) - < 30ppm
Chloride (as Cl) - < 6%
Active Solids (as acids) - 30% w/w
pH (1% w/v soln, 20 C) - 2
SG (20 C) - 1.34
MWt. - 738.40 g/mol
Figure 4.5: OMTHP SI structure and properties
Minerals: Three types of minerals were used in the work, viz. sand, kaolinite and
siderite, to study the retention of scale inhibitor onto these minerals.
Dry silica sand (BDH GPR, 40 – 100 mesh, purified by acid) was chosen as one of the
adsorbent as the majority of sandstone rock is quartz and hence silica sand represents a
simple model of a sandstone formation. The chemical compound silicon dioxide, also
known as silica, is an oxide of silicon with the chemical formula SiO2. Analysis by X-
Ray Diffraction shows this sand has a composition of ~80 to 90% quartz. Analysis by
particle size analyzer instrument shows that the particle size is around 80 to 400 um
with a distribution mode of 180 um. The size and distribution is about the same from
other workers who has performed similar work. The shapes are quite round and square
which agrees well with the size of the particles. Refer to Figure 4.6 for details of sand
characteristic.

Chapter 4: Establishing Retention Mechanisms Through Static Compatibility and Coupled Adsorption/
Precipitation Experiments
60
0
2
4
6
8
10
12
14
16
18
20
1 10 100 1000
(%)
Particle size (um)
Particle Size AnalyzerSand Distribution
Sample : SAND
No 1 2 3
Quartz 89.7 85.1 80.4
Kaolinite 0.7 0.5 0.6
Illite 0 11.8 14.4
Calcite 0 0 0.2
Rutile 0.5 0.1 0.1
Orthoclase 6.3 0.9 2.1
Microcline 2.8 1.6 2.2
Total 100 100 100
•Sand distribution analyzed using Particle Size Analyzer. •Elements in sand analyzed usingX-Ray Diffraction.
•Industrial sand. •Sand particles analyzed using SEM.
Figure 4.6: Sand distribution, elements and SEM
Figure 4.7 shows the characteristic of kaolinite minerals. Kaolinite is a clay minerals,
with the composition Al2Si2O5(OH)4. It is a layered silicate mineral, with one
tetrahedral sheet linked through oxygen atoms to one octahedral sheet of alumina
octahedral. Formations that are rich in kaolinite are known as China clay, which is the
case for this particular mineral. It has a low shrink-swell capacity and a low cation
exchange capacity (1 to 15 meq/100g), produced by the chemical weathering of
aluminium silicate minerals like feldspar. The structure is rarely as crystals but tend to
be thin platy or stacked, or aggregated into compact, clay-like masses, as shown in the
SEM picture in Figure 4.7. X-Ray Diffraction analysis shows that the kaolinite sample
has about 75% kaolinite with 21% illite and 4% quartz. It has a wide distribution size

Chapter 4: Establishing Retention Mechanisms Through Static Compatibility and Coupled Adsorption/
Precipitation Experiments
61
from 0.5 to 60 µm, which is why it has a large surface area. The distribution mode is
~10 µm.
0
1
2
3
4
5
6
7
8
9
10
0.1 1 10 100 1000
(%)
Particle size (um)
Particle Size DistributionKaolinite Distribution
Sample : KAOLINITE
No. 1 2 3 4 5 6 7 8
Quartz 3.70 3.20 4.10 4.20 4.20 4.20 3.70 4.00
Kaolinite 74.30 75.60 76.00 75.70 75.70 75.60 75.80 76.20
Illite 22.00 21.20 19.90 20.10 20.10 20.20 20.50 19.80
Total 100.00 100.00 100.00 100.00 100.00 100.00 100.00 100.00
•Kaolinite distribution analyzed using Particle Size Analyzer.
•Elements in kaolinite analyzed using X-Ray Diffraction.
•Kaolinite, from China clay
•Kaolinite analyzed using SEM.
Figure 4.7: Kaolinite distribution, elements and SEM
Figure 4.8 shows the characteristic of siderite minerals. Siderite is a mineral compound
of iron carbonate, FeCO3. Generally it has more than 50% iron mineral and contain no
sulphur or phosphorous. It also contains 25% illite and 20% quartz. Its crystals belong
to the hexagonal system, and are rhombohedral in shape, typically with curved and
striated faces. In sedimentary rocks, siderite commonly forms at shallow burial depths
and its elemental composition is often related to the depositional environment of the
enclosing sediments. It has a very wide distribution from 0.2 to 60 µm, with an average
mode of 20 µm. This produces a large surface area similar to kaolinite.

Chapter 4: Establishing Retention Mechanisms Through Static Compatibility and Coupled Adsorption/
Precipitation Experiments
62
0
1
2
3
4
5
6
7
8
9
10
0.1 1 10 100 1000
(%)
Particle size (um)
Particle Size DistributionSiderite Distribution
Sample : SIDERITE
No. 1 2 3 4 5 6 7 8
Quartz 23.20 20.70 22.90 18.50 14.30 17.00 15.00 16.80
Kaolinite 3.90 3.70 3.50 3.70 2.70 3.30 2.90 2.80
Illite 25.10 22.90 24.70 21.00 19.80 21.20 17.80 21.11
Siderite 47.80 52.70 48.90 56.80 63.20 58.50 64.30 59.29
Total 100.00 100.00 100.00 100.00 100.00 100.00 100.00 100.00
•Kaolinite distribution analyzed using Particle Size Analyzer.
•Elements in siderite analyzed using X-Ray Diffraction.
•Siderite, from Lancashire
•Siderite analyzed using SEM.
Figure 4.8: Siderite distribution, elements and SEM
Brine: The brine solution used in this study is synthetic brine, where the composition is
similar to Nelson Forties Formation Water (NFFW). The composition is given in Table
4.1. The brine used in this study is sulphate free formation water, to avoid any
precipitation due sulphate scale. The calcium level in the brine also has been increased
to 2000ppm to induce precipitation at 95°C for some cases. Lithium has been added as
an inert tracer to observe if there any evaporation took place in the static compatibility
and adsorption/precipitation experiments.

Chapter 4: Establishing Retention Mechanisms Through Static Compatibility and Coupled Adsorption/
Precipitation Experiments
63
Ion Conc. Comp Mass
(ppm) g/l g/5L g/10L g/15L g/20L
Na+ 31275 NaCl 79.50 397.50 795.00 1192.50 1590.01
Ca2+ 2000 CaCl26.H20 10.93 54.66 109.32 163.98 218.64
Mg2+ 739 MgCl2.6H20 6.18 30.90 61.80 92.69 123.59
K+ 654 KCl 1.25 6.23 12.47 18.70 24.94
Ba2+ 269 BaCl2.2H2O 0.48 2.39 4.78 7.18 9.57
Sr2+ 771 SrCl2.6H2O 2.35 11.73 23.46 35.19 46.92
SO4-2 0 Na2SO4 0.00 0.00 0.00 0.00 0.00
Li+ 50 LiCl 0.305 1.53 3.05 4.58 6.11
Cl- 50000
Actual Cl ppm 55278.64
If CaCl2.2H2O is used 7.32 36.62 73.25 109.87 146.49
TDS = 91036.64 ppm
Table 4.1: Synthetic Nelson Forties Formation Water Composition (NFFW)
4.4.2 Experimental Procedure
Both experiments were performed at a “reservoir-like” temperature of 95˚C and the pH
was adjusted to 4 in all cases. Stock solutions of DETPMP and OMTHP SI were
prepared using synthetic NFFW as in Table 4.1. Experiments were conducted at various
concentrations, as follows – Blank (0) , 10, 20, 50, 100, 300, 500, 800, 1000, 1500,
2000, 4000 and 10000ppm. After 24hrs at 95°C, the solutions were filtered through a
0.20μm filter paper and then analysed for phosphorus, calcium, magnesium, lithium and
the pH values were measured. Inductively Coupled Plasma (ICP) was used to analyse
the ions in the solution before and after filtration. The amount of SI retained by the
mineral, (in mg SI/ g rock), was calculated using the expression o fV c c m
(where oc and fc are the initial and final SI concentrations respectively, V is the SI
solution volume and m is the mass of substrate). For static compatibility tests, the filter
papers were weighed and sent for ESEM-EDAX analysis to quantify the amount of
phosphorous, calcium and magnesium. Refer to Chapter 4 for details.

Chapter 4: Establishing Retention Mechanisms Through Static Compatibility and Coupled Adsorption/
Precipitation Experiments
64
4.5 EXPERIMENTAL RESULTS AND DISCUSSION
In this section, we present the results on the coupled (static) adsorption/precipitation
experiments using a range of phosphonate scale inhibitors. Scale inhibitors DETPMP (a
penta-phosphonate), OMTHP (an hexa-phosphonate) and HMDP (a tetra-phosphonate)
were used to study this behaviour. These experiments were carried out at a range of
adsorbent mass/ fluid volume ratios, (m/V), since this indicates whether we are in the
purely adsorbing or in the coupled adsorption/precipitation regime (Kahrwad et al,
2008). For the static adsorption tests, m = 10g, 20g and 30g sand, kaolinite and siderite
were used (with a fixed volume of SI solution, V = 80ml = 0.08L) as minerals to
analyse the coupled adsorption/precipitation behaviour.
4.5.1 DETPMP-SAND Adsorption/Compatibility Test
Figure 4.9 shows DETPMP SI in NFFW at 10,000ppm. This is the stock concentration
used to prepare the various concentrations used in the experiments. At this
concentration, DETPMP SI is fully dissolved, completely clear and slightly yellowish in
colour. No precipitation is observed even after the solution was left for 24 hours. It was
then diluted to attain lower concentrations of 10, 20, 50, 100, 300, 500, 800, 1000, 2000
and 4000ppm which were used for all the experiments. pH was measured for all the
stock solutions and was later adjusted to pH4. At pH4, most of the particles dissolved in
the solutions at the various concentrations at which they were prepared. No precipitation
was seen even after the solutions were left for 24 hours at pH 4. The observation of
precipitation is important as this will indicate whether only adsorption or precipitation is
taking place in the later adsorption/precipitation experiments. Table 4.2 and Figure 4.10
shows the initial pH of these SI solutions at various concentrations before adjustment
(to pH 4). The blank sample has a pH value of 4.93 and this decreases gradually to pH
1.96 at 4000 ppm of DETPMP SI. The decreasing trend of pH is due to the acidic nature
of the DETPMP scale inhibitor as the concentration increases.

Chapter 4: Establishing Retention Mechanisms Through Static Compatibility and Coupled Adsorption/
Precipitation Experiments
65
Figure 4.9: DETPMP in NFFW at 10,000ppm active. It is soluble at this concentration
and yellowish in colour.
Conc. pH (Initial)
DETPMP Compatibility Adsorption Adsorption Adsorption Adsorption
(ppm) Test (5g Sand) (10g Sand) (20g Sand) (30g Sand)
0 4 4.03 4.24 4.35 4.61 4.59
10 4 4.01 4.30 4.45 4.67 4.78
20 4 4.00 4.31 4.48 4.72 4.80
50 4 4.00 4.27 4.37 4.54 4.74
100 4 4.00 4.22 4.31 4.39 4.51
300 4 4.00 4.19 4.25 4.24 4.30
500 4 3.99 4.16 4.18 4.17 4.23
800 4 3.99 4.11 4.10 4.10 4.14
1000 4 3.96 4.05 4.04 4.00 4.09
2000 4 3.81 3.84 3.84 3.82 3.86
4000 4 3.70 3.70 3.70 3.66 3.69
pH (Final)
Table 4.2: : DETPMP-Sand Static Adsorption/Compatibility Test. pH measurement of
Initial, Adjusted and Final

Chapter 4: Establishing Retention Mechanisms Through Static Compatibility and Coupled Adsorption/
Precipitation Experiments
66
1.0
1.5
2.0
2.5
3.0
3.5
4.0
4.5
5.0
0 500 1000 1500 2000 2500 3000 3500 4000 4500
pH
[DETPMP] (ppm)
DETPMP-Sand Static Adsorption/Compatibility Test
Initial pH Measurement
Initial
Figure 4.10: DETPMP-Sand Static Adsorption/Compatibility Test. Initial pH
measurement of stock solutions vs. SI concentrations before pH adjustment.
Figure 4.11 and 4.12 show the adsorption (“apparent” or actual) level of scale inhibitor
(DETPMP in mg SI / g rock) for different masses of sand as a function of the scale
inhibitor concentration in synthetic NFFW at pH 4 at 95°C. The adsorption (or apparent
adsorption), (in mg SI/ g rock), was calculated using the expression
o fV c c m (where oc and fc are the initial and final SI concentrations
respectively, V is the SI solution volume and m is the mass of substrate). The main
observation from these figures is whether pure adsorption or coupled
adsorption/precipitation is taking place. The figures clearly indicate that both pure
adsorption and coupled adsorption/precipitation took place in different concentration
regimes. Only pure adsorption is seen for [SI] up to ~750ppm, before the different
(m/V) curves starts to deviate due to coupled adsorption/precipitation behaviour
occurring. This is evident since, if pure adsorption occurred, then this curve would
plateau at a level of up to ~0.20 – 0.25 mg/g – in fact, we see that level of “coupled
adsorption/precipitation” of ~1.0 – 5.0 mg/g are observed. This indicates that the
mixture of DETPMP and NFFW onto sand shows both “pure adsorption” up to
~750ppm and coupled adsorption/precipitation above ~750ppm. From these figure, at

Chapter 4: Establishing Retention Mechanisms Through Static Compatibility and Coupled Adsorption/
Precipitation Experiments
67
~750ppm, the coupled adsorption/precipitation starts to be noticeable as the curve
deviates from pure adsorption (plateau) behaviour.
0
2
4
6
8
10
12
14
0 500 1000 1500 2000 2500 3000 3500
Ap
par
en
t A
dso
rpti
on
(m
g/g)
[DETPMP] (ppm)
DETPMP-Sand Static Adsorption/Compatibility Test
DETPMP Ads Isotherm onto Sand at pH4 & 95°C
20g Sand
30g Sand
5g Sand
10g Sand
Figure 4.11: DETPMP-Sand Static Adsorption/Compatibility Test. DETPMP
Adsorption Isotherm onto different masses of sand at pH4 & 95°C.
0.0
0.1
0.2
0.3
0.4
0.5
0.6
0.7
0 100 200 300 400 500 600 700 800 900 1000
Ap
par
en
t A
dso
rpti
on
(m
g/g)
[DETPMP] (ppm)
DETPMP-Sand Static Adsorption/Compatibility Test
DETPMP Ads Isotherm onto Sand at pH4 & 95°C
20g Sand
30g Sand
5g Sand
10g Sand
Zoom down to lower concentrations
Figure 4.12: DETPMP-Sand Static Adsorption/Compatibility Test. DETPMP
Adsorption Isotherm onto different masses of sand at pH4 & 95°C; zoomed down to
lower concentrations.

Chapter 4: Establishing Retention Mechanisms Through Static Compatibility and Coupled Adsorption/
Precipitation Experiments
68
In summary, the results in Figure 4.11 and Figure 4.12 show the “apparent adsorption”
vs. [SI] (strictly this is the final [SI] after the adsorption/precipitation process, cf – see
above). The region of “pure adsorption” is seen up to [SI] ~750ppm since all the (m/V)
curves collapse onto one cure, the static adsorption isotherm. Above [SI] ~750,
“coupled adsorption/precipitation” is observed since the various apparent adsorption
curves for different (m/V) separate i.e. follow different curves. Thus, the regions of
“pure adsorption” and “coupled adsorption/ precipitation” behaviour are strictly
established by the results shown.
To further establish the pure adsorption and coupled adsorption/precipitation behaviour,
changes of [phosphorous], [Ca2+
] and [Mg2+
] concentration before and after the
experiments in the mixture of SI and NFFW solution in both adsorption and
compatibility test were measured. Any divalent ion levels above stock solution
concentration are not expected or must be within its analytical error of less than 5%.
The decrease in the solution divalent ion levels are due to either precipitation of M-
DETPMP complex or because of involvement of the divalent ions in the pure adsorption
process (e.g. by cation bridging). Any changes in [Li+] were also noted in order to
check whether there was any evaporation taking place. There should not be any changes
in [Li+] as it is an inert tracer ion which does not adsorb onto sand or react with
DETPMP SI. The estimated amount of evaporation (as measured by Li+ increase) was
used to correct the concentration for all the other elements.
Figure 4.13, Figure 4.14 and Figure 4.15 show the differences in [phosphorous], [Ca2+
]
and [Mg2+
] amount for both compatibility and adsorption test. The differences in the
amounts show that there is definitely pure adsorption and coupled
adsorption/precipitation taking place. It is known that Ca2+
and Mg2+
ions do not
significantly adsorb* onto sand, so the differences are due to cation bridging between
the SI and the Ca2+
and Mg2+
ions onto the sand. [*NB however, there may be some
ion exchange of Ca2+
and Mg2+
ions onto the rock/mineral surface but this is not a large
effect for such pure quartz sand – it is much larger in clays]. It is also noted that in
almost all cases, there is a small increase in [Ca2+
] and [Mg2+
] ions, which is not
expected, but they are all within its analytical error of less than 5%. Even changes in

Chapter 4: Establishing Retention Mechanisms Through Static Compatibility and Coupled Adsorption/
Precipitation Experiments
69
[Li+] ions are observed for all the cases, but again, they are within its analytical error of
less than 5%. The increase in Li+ also shows slight evaporation was taking place. The
% increase was used to correct the concentrations for all the other elements.
Figure 4.13 shows the changes in phosphorous ion concentrations for both compatibility
and adsorption test. Referring to adsorption test at 5g to 30g sand; the figure shows that
phosphorous starts adsorbing onto sand even at a lower concentration of 10ppm for the
different masses of sand used, where the difference between the stock solution and the
filtrate is about 3 to 8ppm as the mass of sand increases from 5g to 30g sand. As the
concentration of DETPMP SI increases from 10ppm to 4000ppm, the changes in
phosphorous (i.e. SI) concentration are also increased. Two things can be observed from
this figure; firstly, phosphorous starts adsorbing or precipitating even at a lower
concentration of 10ppm and increases as the DETPMP concentration increases;
secondly, as the mass of sand increases from 5g to 30g, increase in phosphorous
concentration is also observed. Whereas, in the precipitation case (referring to
compatibility test) where there was no sand present, reduction in phosphorous
concentration can only be observed at 2000ppm, where 180ppm was left as precipitates,
and increases to 650ppm (left as precipitates) as the DETPMP concentration increases
to 4000ppm. The figure indicates pure adsorption of phosphorous onto sand until
~1000ppm and coupled adsorption/precipitation from 2000ppm onward.
Figure 4.14 shows the change in Ca2+
ion concentrations for both compatibility and
adsorption test. Referring to adsorption test at 5g to 30g sand; the figure shows that Ca2+
ions starts to show a significant reduction from 2000ppm and are even further reduced
at 4000ppm. The reduction in Ca2+
ions increases as the mass of sand increases from 5g
to 30g. Whereas, for the compatibility tests, reduction in Ca2+
is observed only at 4000
ppm. The difference of Ca2+
ion in both experiments shows that Ca2+
some must have
precipitated to some extent from 2000ppm onwards due to M-DETPMP complex
precipitation. At 4000ppm DETPMP, 115 to 135ppm of Ca2+
precipitated out of
solution depending on the mass of sand tested.
Figure 4.15 shows the change in Mg2+
ions concentration for both compatibility and

Chapter 4: Establishing Retention Mechanisms Through Static Compatibility and Coupled Adsorption/
Precipitation Experiments
70
adsorption test. Referring to adsorption test at 5g to 30g sand; the figure shows that the
changes in Mg2+
ion concentrations can only be seen clearly at 4000ppm although the
measured adsorption level appears to fluctuate at 2000ppm as well. For compatibility
tests with no minerals, significant reduction in Mg2+
is observed at only 4000ppm.
Again, the difference in Mg2+
ion concentration proves that Mg2+
some have
precipitated from 2000ppm onward due to M-DETPMP complex precipitation. At
4000ppm DETPMP, 10 to 20ppm Mg2+
precipitated out of solution at different mass of
sand tested. Comparing phosphorous to Ca2+
and Mg2+
binding, Ca2+
has much more
affinity to DETPMP SI as shown from the amount of concentration change observed on
precipitation.
Figure 4.16 shows the change in Li+ ions concentration. The figure shows there is no
change in Li+ concentration. Li
+ as an inert tracer ion does not adsorb or precipitate onto
sand mineral. It clearly shows that there is no adsorption or precipitation. It is analysed
to see if there was any evaporation. Base on the figure, there is an increase of 1% to 3%
in Li+ concentration, which shows slight evaporation taking place apart from analytical
error. This factor was taken into account for all the calculation made for all the
elements.
-1000
-900
-800
-700
-600
-500
-400
-300
-200
-100
0
100
0 10 20 50 100 300 500 800 1000 2000 4000
Ch
ange
in [P
] (p
pm
)
[DETPMP] (ppm)
DETPMP-Sand Static Adsorption/Compatibility Test
Change in [P] after 24 hrs heating and filtration process, pH4 & 95°C
delta[P] - Compatibility
delta[P] - 5g Sand
delta[P] - 10g Sand
delta[P] - 20g Sand
delta[P] - 30g Sand
Figure 4.13: DETPMP-Sand Static Adsorption/Compatibility Test (5g, 10g, 20g & 30g
Sand). Change in [P] vs [DETPMP].

Chapter 4: Establishing Retention Mechanisms Through Static Compatibility and Coupled Adsorption/
Precipitation Experiments
71
-200
-100
0
100
200
300
400
500
0 10 20 50 100 300 500 800 1000 2000 4000
Ch
ange
in [C
a2+ ]
(pp
m)
[DETPMP] (ppm)
DETPMP-Sand Static Adsorption/Compatibility TestChange in [Ca2+] after 24 hrs heating and filtration process, pH4 & 95°C
delta[Ca2+] - Compatibility
delta[Ca2+] - 5g Sand
delta[Ca2+] - 10g Sand
delta[Ca2+] - 20g Sand
delta[Ca2+] - 30g Sand~ analytical error of 3% at the highest
[Ca] = 2000ppm
Figure 4.14: DETPMP-Sand Static Adsorption/Compatibility Test (5g, 10g, 20g & 30g
Sand). Change in [Ca2+
] vs [DETPMP].
-30
20
70
120
170
0 10 20 50 100 300 500 800 1000 2000 4000
Ch
ange
in [M
g2+
] (p
pm
)
[DETPMP] (ppm)
DETPMP-Sand Static Adsorption/Compatibility TestChange in [Mg2+] after 24 hrs heating and filtration process, pH4 & 95°C
delta[Mg2+] - Compatibility
delta[Mg2+] - 5g Sand
delta[Mg2+] - 10g Sand
delta[Mg2+] - 20g Sand
delta[Mg2+] - 30g Sand
~ analytical error of 2.7% at the highest
[Mg] = 739ppm
Figure 4.15: DETPMP-Sand Static Adsorption/Compatibility Test (5g, 10g, 20g &
30g Sand). Change in [Mg2+
] vs [DETPMP].

Chapter 4: Establishing Retention Mechanisms Through Static Compatibility and Coupled Adsorption/
Precipitation Experiments
72
-25
-20
-15
-10
-5
0
5
10
15
20
25
0 10 20 50 100 300 500 800 1000 2000 4000
Ch
ange
in [L
i+] (
pp
m)
[DETPMP] (ppm)
DETPMP-Sand Static Adsorption/Compatibility TestChange in [Li+] after 24 hrs heating and filtration process, pH4 & 95°C
delta[Li+] - Compatibility
delta[Li+] - 5g Sand
delta[Li+] - 10g Sand
delta[Li+] - 20g Sand
delta[Li+] - 30g Sand~ analytical error of 3.0% at the highest
[Li] = 50ppm
Figure 4.16: DETPMP-Sand Static Adsorption/Compatibility Test (5g, 10g, 20g &
30g Sand). Change in [Li+] vs [DETPMP].
After the filtration, all the filter papers were dried, weighed, photographed and sent for
ESEM-EDAX analysis. The sample solutions were measured for pH. The weight of the
samples that precipitated out of the solutions are given in Table 4.3 and the
corresponding photographed filter papers after filtration are shown in Figure 4.17. Only
at 2000ppm do we clearly see clear differences in both the weight and the appearance of
precipitate, although there is some tracers of precipitate seen on the filter paper at
1000ppm. As the concentration increases, the weight increases as expected and more
significant amounts of precipitate can be seen clearly on the filter paper. These results
are very consistent with observations (above) on the amount of phosphorous, Ca2+
ions
and Mg2+
ions that were measure in solution, which was less than in the stock solutions.
The results prove that precipitation took place from 2000ppm onward, with some
indication it starts as early as 1000ppm.

Chapter 4: Establishing Retention Mechanisms Through Static Compatibility and Coupled Adsorption/
Precipitation Experiments
73
Blank 10 ppm 20 ppm 50 ppm
100 ppm 300 ppm 500 ppm 800 ppm
1000 ppm 2000 ppm 4000 ppm
Figure 4.17: DETPMP-Sand Static Adsorption/Compatibility Test. Precipitates on filter
papers at different concentration of DETPMP. Traces of precipitates can be observed at
2000ppm and clear precipitates at 4000ppm.
DETPMP Weight of Ppt
Conc.
(ppm) (g)
0 0.02
10 0.02
20 0.02
50 0.02
100 0.02
300 0.02
500 0.02
800 0.02
1000 0.02
2000 0.04
4000 0.12
Table 4.3: DETPMP-Sand Static Adsorption/Compatibility Test. It shows the weight of
precipitate on filter papers after filtration.
Table 4.4 and Figure 4.18 show ESEM-EDAX atomic and weight percentage and
photographed samples of phosphorous, Ca2+
, Mg2+
and other ions presents on the filter
papers. For each concentration, two points were taken for analysis. The hazy black
background was identified to be the filter paper itself, the solid white marks are the salts

Chapter 4: Establishing Retention Mechanisms Through Static Compatibility and Coupled Adsorption/
Precipitation Experiments
74
and the hazy white background is the compound of phosphorous (SI), Ca2+
and Mg2+
ions. The blank samples without any SI shows only filter paper and some salts. Based
on the atomic% from ESEM-EDAX, there is no phosphorous, Ca2+
and Mg2+
compound
identified below 500ppm. It must be noted that the EDAX signals are localized and
inconsistent values are expected since they depend on precisely which point has been
analyzed. Only when it reaches 800ppm and above, can a clear hazy white background
be seen on the filter paper samples, which is identified to be phosphorous, Ca2+
and
Mg2+
ions base on EDAX signal. Above 800ppm concentration, based on the atomic%,
phosphorous, Ca2+
and Mg2+
are seen consistently. Atomic% of phosphorous ranges
from 4 to 14; Ca2+
from 2 to 6 and Mg2+
from 1 to 2. Although the values are not
accurate, the presence of phosphorous, Ca2+
and Mg2+
as precipitates above 800ppm is
clearly proven.
Blank (1600x) 10ppm (1600x) 20ppm (1600x) 50ppm (6400x)
100ppm (6400x) 300ppm (3200x) 500ppm (1600x) 800ppm (800x)
1000ppm (3200x) 2000ppm (3200x) 4000ppm (3200x)
Figure 4.18: DETPMP-Sand Static Adsorption/Compatibility Test. Morphology of
precipitates on ESEM photographed samples.

Chapter 4: Establishing Retention Mechanisms Through Static Compatibility and Coupled Adsorption/
Precipitation Experiments
75
Element Wt % At % Wt % At % Wt % At % Wt % At % Wt % At % Wt % At % Wt % At % Wt % At % Wt % At % Wt % At %
C K 55.06 66.83 37.72 53.05 21.98 41.23 21.98 41.23 28.27 48.95 11.19 35.64 14.87 39.4 39.35 51.57 30.74 43.3 25.72 38.92
N K 4.27 5.15 7.48 9.04 4.92 6.38
O K 28.92 26.35 32.46 34.27 32.17 45.3 32.17 45.3 24.82 32.27 1.12 2.68 7.63 15.18 39.01 38.38 29.2 30.88 29.62 33.64
NaK 1.66 1.06 1.12 0.82 1.01 0.99 1.01 0.99 0.87 0.79 0.8 0.55 4.11 3.02 1.19 0.94
MgK 0.27 0.16 0.61 0.42 1.61 1.04 1.82 1.27 2.2 1.64
AlK 0.47 0.25 1.3 1.01
SiK 0.77 0.4 0.7 0.51 1.01 1.37 1.05 1.19
SrL 1.26 0.24 1.03 0.26 1.03 0.26 1.08 0.19 2.07 0.4 2.64 0.55
P K 8.2 4.17 10.58 5.78 17.95 10.53
S K 3.51 1.85 8.23 5.78 8.23 5.78 1.03 0.67
ClK 9.26 3.81 4.02 1.91 0.92 0.58 0.92 0.58 1.53 0.9 1.04 1.13 0.86 0.77 3.86 1.71 7.57 3.61 4.1 2.1
CrK 15.74 11.58 13.83 8.47
K K 0.4 0.17 0.42 0.24 0.42 0.24
CaK 0.71 0.26 1.07 0.45 0.58 0.3 6.1 2.39 6.43 2.71 11.67 5.29
BaL 13.57 1.67 34.25 5.62 34.25 5.62 1.92 0.29
FeK 34.4 12.81 61.57 42.17 53.96 30.76
NiK 8.33 5.43 7.82 4.24
CuK 4.58 1.5
TiK 2.87 0.87
Total 100 100 100 100 100 100 100 100 100 100 100 100 100 100 100 100 100 100 100 100
300 ppmBlank 10 ppm 20 ppm 50 ppm 100 ppm 500 ppm 800 ppm 1000 ppm 2000 ppm
Table 4.4: DETPMP-Sand Static Adsorption/Compatibility Test. EDAX signals on the
precipitates from ESEM.
Table 4.2 and Figure 4.19 show the pH values of the adjusted and filtered samples. All
the stock solutions were adjusted to a pH value of 4. At pH4, it had been proven that the
solutions do not precipitate at room condition. After 24 hrs heating and filtration, the pH
values were measured again. For compatibility test with no minerals, the pH values
stays around pH4 until 800ppm, and they reduce to 3.96, 3.81 and 3.70 at 1000, 2000
and 4000ppm, respectively. It shows that the pH value starts to reduce when significant
P, Ca2+
and Mg2+
are missing due to precipitation during filtration. Thus, significant
precipitation of P, Ca2+
and Mg2+
on the filter paper has caused reduction of pH. For
adsorption tests at different masses of sand; 5g, 10g, 20g and 30g sand, the pH value
increases for blank sample, and increases further up to 50ppm before it then reduces
until 4000ppm. Although different masses of sand result in different values of pH, they
all decrease gradually. At 4000ppm, the pH value converges at pH ~3.7 for all the
different masses of sand. The hypothesis that can be made from pH behaviour alone is,
there must be only P (slight Ca2+
and Mg2+
) ions missing due to adsorption onto sand
from blank up to 4000ppm. pH reduces significantly at 2000 and 4000ppm due to all
three component; P, Ca2+
and Mg2+
missing due to precipitation.

Chapter 4: Establishing Retention Mechanisms Through Static Compatibility and Coupled Adsorption/
Precipitation Experiments
76
3.4
3.6
3.8
4
4.2
4.4
4.6
4.8
5
0 500 1000 1500 2000 2500 3000 3500 4000 4500
pH
[DETPMP] (ppm)
DETPMP-Sand Static Adsorption/Compatibility Test
pH Measurement - Adjusted & Final
Adjusted
Compatibility
5g Sand
10g Sand
20g Sand
30g Sand
Figure 4.19: DETPMP-Sand Static Adsorption/Compatibility Test. pH Measurement
– Adjusted and Final
4.5.2 OMTHP-SAND Adsorption/Compatibility Test
Figure 4.20 shows OMTHP in NFFW at 10,000ppm. At this concentration, OMTHP SI
is not fully dissolved and is whitish and opaque in appearance. After it is left for about
two hours, the solution starts to precipitate. This is the stock solution which was used
for all the experiments in this particular set. This preparation was then diluted to attain
the lower concentration levels, 10, 20, 50, 100, 300, 500, 800, 1000, 2000 and 4000ppm
which were used for all the experiments. pH was measured for all the stock solutions
and was later adjusted to pH 4. At pH4, the particles dissolved in the solutions at the
different concentrations at which they were prepared. Table 4.5 and Figure 4.21 shows
the initial pH values of the various stock solutions before adjustment. The blank sample
has a pH value of 4.91 and this decrease gradually to pH 4.52 at 4000ppm. The
decreasing trend of pH indicates the acidic nature of the OMTHP scale inhibitor as the
concentration increases. OMTHP is less acidic than DETPMP (DETPMP has pH 1.93 at
4000ppm). At this point, it is assured that no precipitation occurs for all the
concentration up to 4000ppm at pH4 which is important before the 24 hours of heating
at 95°C in the compatibility tests.

Chapter 4: Establishing Retention Mechanisms Through Static Compatibility and Coupled Adsorption/
Precipitation Experiments
77
Figure 4.20: OMTHP SI in NFFW at 10,000ppm active. It is whitish in colour and
insoluble at this concentration. It precipitates when left for a few hours.
Conc. pH (Initial) pH (Adjusted)
OMTHP Compatibility Adsorption Adsorption Adsorption
(ppm) Test (10g Sand) (20g Sand) (30g Sand)
0 4.91 4 3.97 4.37 4.47 4.69
10 4.77 4 3.96 4.53 4.73 4.88
20 4.73 4 3.97 4.47 4.77 4.98
50 4.68 4 3.96 4.37 4.62 4.90
100 4.66 4 3.95 4.23 4.30 4.45
300 4.65 4 3.97 3.98 3.93 4.02
500 4.64 4 3.96 3.95 3.88 3.93
800 4.61 4 3.90 3.90 3.84 3.88
1000 4.59 4 3.86 3.84 3.80 3.82
2000 4.54 4 3.72 3.69 3.63 3.64
4000 4.52 4 3.65 3.63 3.59 3.59
pH (Final)
Table 4.5: OMTHP-Sand Static Adsorption/Compatibility Test. pH measurement –
Initial, Adjusted and Final

Chapter 4: Establishing Retention Mechanisms Through Static Compatibility and Coupled Adsorption/
Precipitation Experiments
78
4.5
4.55
4.6
4.65
4.7
4.75
4.8
4.85
4.9
4.95
0 500 1000 1500 2000 2500 3000 3500 4000 4500
pH
[OMTHP] (ppm)
OMTHP-Sand Static Adsorption/Compatibility TestInitial pH Measurement
Initial
Figure 4.21: OMTHP SI initial pH measurement of each stock solutions before
adjustment. The decreasing trend of the pH indicates acidic nature of OMTHP SI.
Figure 4.22 and Figure 4.23 show the adsorption (“apparent” or actual) level of scale
inhibitor (OMTHP in mg SI / g rock) on different masses of sand (i.e. at varying m/V
ratios) as a function of the scale inhibitor concentration in synthetic NFFW at pH 4 and
95°C. These figures clearly indicate that both pure adsorption and coupled
adsorption/precipitation took place at this set of conditions. Clearly, pure adsorption is
seen for SI concentrations up to ~700ppm since the data for the different (m/V) ratios
collapse onto the same curve. Above [SI] ~700ppm, the different (m/V) curves starts to
deviate thus indication that coupled adsorption/precipitation occurring (since apparent
adsorption becomes a function of m/V ratio). These types of behaviour are also
evidenced by the actual values of the apparent adsorption itself. In the pure adsorption
region, then Γ ~0.35mg/g which is a reasonable level for pure adsorption. However, in
the “couple adsorption/precipitation” regime at [SI] > 700ppm, the Γapp ~4.0 – 11.0
mg/g and this is far too high to be pur adsorption. Thus, in summary, like the
DETPMP/NFFW/sand system, the OMTHP/NFFW/sand system shows both “pure
adsorption” up to ~700ppm and coupled adsorption/precipitation above ~700ppm.
To further establish the pure adsorption and coupled adsorption/precipitation regimes in

Chapter 4: Establishing Retention Mechanisms Through Static Compatibility and Coupled Adsorption/
Precipitation Experiments
79
the OMTHP/NFFW/sand system, changes of [phosphorous], [Ca2+
] and [Mg2+
]
concentration in the mixture of SI and NFFW solution in both adsorption and
compatibility tests were observed. Any divalent ion level above stock solution
concentration is not expected or must be within its analytical error of less than 5%. The
decrease in the solution divalent ion levels are due to either precipitation of M-OMTHP
complex or involvement of the divalent ions in the pure adsorption process (e.g. by
cation bridging). The change in [Li+] is also observed to establish if any evaporation has
taken place. There should not be any changes in [Li+] as it is an inert tracer ion which
does not react with OMTHP SI or adsorb onto sand.
0
2
4
6
8
10
12
0 500 1000 1500 2000 2500 3000
Ap
par
en
t Ad
sorp
tio
n (m
g/g)
[OMTHP] (ppm)
OMTHP-Sand Static Adsorption/Compatibility TestOMTHP Ads Isotherm onto Sand at pH4 & 95°C
10g Sand
20g Sand
30g Sand
Figure 4.22: OMTHP-Sand Static Adsorption/Compatibility Test. OMTHP
Adsorption Isotherm onto different masses of sand at pH4 & 95°C.

Chapter 4: Establishing Retention Mechanisms Through Static Compatibility and Coupled Adsorption/
Precipitation Experiments
80
0.0
0.2
0.4
0.6
0.8
1.0
1.2
0 100 200 300 400 500 600 700 800 900 1000
Ap
par
en
t Ad
sorp
tio
n (m
g/g)
[OMTHP] (ppm)
OMTHP-Sand Static Adsorption/Compatibility TestOMTHP Ads Isotherm onto Sand at pH4 & 95°C
10g Sand
20g Sand
30g Sand
~ zoom down to lower concentrations
Figure 4.23: OMTHP-Sand Static Adsorption/Compatibility Test. OMTHP Adsorption
Isotherm onto different masses of sand at 95°C and pH4; zoomed down to lower
concentration.
Figure 4.24, Figure 4.25 and Figure 4.26 show the differences in the solution levels of
[phosphorous], [Ca2+
] and [Mg2+
] for both static compatibility and adsorption tests for
the OMTHP/NFFW/sand system. The differences in the amounts in each test show that
there is definitely pure adsorption and coupled adsorption/precipitation taking place in
different concentration regions. It is known that Ca2+
and Mg2+
ions do not significantly
adsorb* onto sand, so the differences are probably due to cation bridging of
phosphorous to Ca2+
and Mg2+
ions onto the sand or to precipitation. [*NB however,
there may be some ion exchange of Ca2+
and Mg2+
ions onto the rock/mineral surface
but this is not a large effect for such pure quartz sand – it is much larger in clays]. It is
also noted that in almost all cases, there is a small increase in [Ca2+
] and [Mg2+
] ions,
which is not expected, but they are all within its analytical error of less than 5%. Even
changes in [Li+] are observed for all the cases, but again, they are within its analytical
error of less than 5%. The increase in Li+ also shows slight evaporation was taking
place. The %increase was used to correct the concentrations for all the other elements
involved.

Chapter 4: Establishing Retention Mechanisms Through Static Compatibility and Coupled Adsorption/
Precipitation Experiments
81
Figure 4.24 shows the change in phosphorous ions concentration for both compatibility
and adsorption test. Referring to adsorption tests at 10g to 30g sand; the figure shows
that phosphorous starts adsorbing onto sand even at a lower concentration of 10ppm
OMTHP for the different masses of sand used, where the difference between the stock
solution and the filtrate is about 5 to 10 ppm as the mass of sand increases from 10g,
20g and 30g sand. As the concentration of OMTHP SI increases from 10ppm to
4000ppm, the changes in phosphorous ions also increase. Two important points can be
made from the results in this figure; firstly, phosphorous starts adsorbing even at a
lower concentration of 10ppm and increases as the DETPMP concentration increases;
secondly, as the mass of sand increases from 5g to 30g, an increase in phosphorous
concentration change is also observed. Whereas, in the precipitation case where there is
no sand present, reduction in phosphorous can only be observed at ~800ppm, where
40ppm was left as precipitates, and increases to 1450ppm (left as precipitates) as the
DETPMP concentration increases to 4000ppm. The figure indicates pure adsorption of
phosphorous onto sand until 500ppm and coupled adsorption/precipitation from
800ppm onward.
Figure 4.25 shows the change in Ca2+
ions concentration for both compatibility and
adsorption tests. Referring to adsorption test at 10g to 30g sand; the figure shows that
Ca2+
ions starts to show a significant reduction from 2000ppm and is further reduced at
4000ppm, in the adsorption test. There was some indication of Ca2+
ion reduction at
1000ppm based on the fluctuation in Ca2+
concentration. For the compatibility tests,
reduction in Ca2+
is also observed starting at 2000 ppm. The difference of Ca2+
ion in
both experiments shows that some must have precipitated and some must have
adsorbed, probably the Ca2+
is bridged along with phosphorous onto the mineral surface.
At 4000ppm OMTHP, between 150 and 180ppm of Ca2+
was lost from solution at
different mass of sand tested.
Figure 4.26 shows the change in Mg2+
ion concentrations for both compatibility and
adsorption tests. Referring to adsorption tests at 10g to 30g sand; the figure shows that
significant changes can only be seen at 4000ppm though some adsorption can be seen at
30g sand at 2000ppm. For compatibility test with no minerals, significant reduction is

Chapter 4: Establishing Retention Mechanisms Through Static Compatibility and Coupled Adsorption/
Precipitation Experiments
82
observed at only 4000ppm. Again, the difference in these experiments only proves that
some precipitated and some adsorbed, bridged along with phosphorous divalent ions. At
4000ppm OMTHP, only about 30ppm Mg2+
was lost from solution at different masses
of sand tested. Comparing phosphorous to Ca2+
and Mg2+
binding, again Ca2+
has more
affinity to OMTHP SI as shown from the amount of concentration lost in these tests.
Figure 4.27 shows the change in Li+ ion concentration. The figure shows that there is
virtually no change in Li+ concentration. Li
+ is an inert tracer ion and is not expected to
show any adsorption or precipitation. It is analysed to determine whether there was any
evaporation. Base on the figures, there is an increase of 1% to 2% in Li+ concentration,
which shows slight evaporation taking place apart from analytical error. This factor was
taken into account for all the calculation made for all the other elements (P, Ca and Mg).
-1600
-1400
-1200
-1000
-800
-600
-400
-200
0
200
0 10 20 50 100 300 500 800 1000 2000 4000
Ch
ange
in [P
] (p
pm
)
[OMTHP] (ppm)
OMTHP-Sand Static Adsorption/Compatibility Test
Change in [P] after 24 hrs heating and filtration process, pH4 & 95°C
delta[P] - Compatibility
delta[P] - 10g Sand
delta[P] - 20g Sand
delta[P] - 30g Sand
Figure 4.24: OMTHP-Sand Static Adsorption/Compatibility Test (10g, 20g & 30g
Sand). Change in [P] vs [OMTHP].
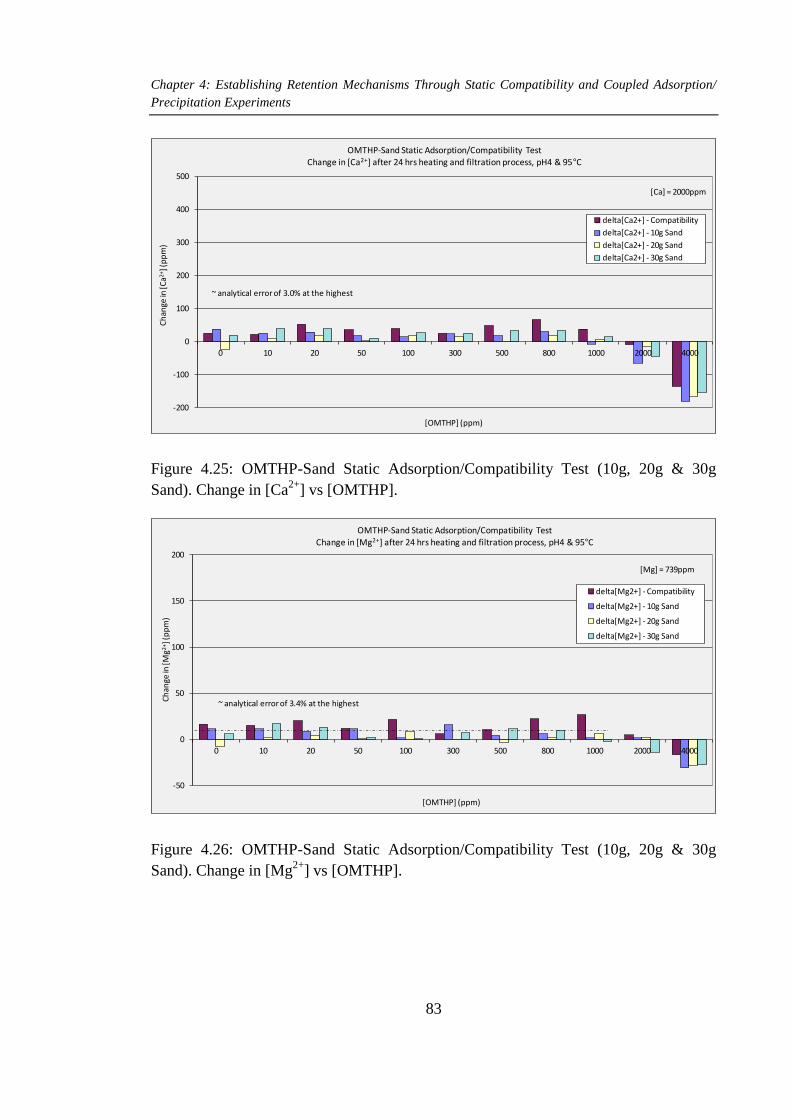
Chapter 4: Establishing Retention Mechanisms Through Static Compatibility and Coupled Adsorption/
Precipitation Experiments
83
-200
-100
0
100
200
300
400
500
0 10 20 50 100 300 500 800 1000 2000 4000
Ch
ange
in [C
a2+] (
pp
m)
[OMTHP] (ppm)
OMTHP-Sand Static Adsorption/Compatibility TestChange in [Ca2+] after 24 hrs heating and filtration process, pH4 & 95°C
delta[Ca2+] - Compatibility
delta[Ca2+] - 10g Sand
delta[Ca2+] - 20g Sand
delta[Ca2+] - 30g Sand
[Ca] = 2000ppm
~ analytical error of 3.0% at the highest
Figure 4.25: OMTHP-Sand Static Adsorption/Compatibility Test (10g, 20g & 30g
Sand). Change in [Ca2+
] vs [OMTHP].
-50
0
50
100
150
200
0 10 20 50 100 300 500 800 1000 2000 4000
Ch
ange
in [M
g2+] (
pp
m)
[OMTHP] (ppm)
OMTHP-Sand Static Adsorption/Compatibility Test
Change in [Mg2+] after 24 hrs heating and filtration process, pH4 & 95°C
delta[Mg2+] - Compatibility
delta[Mg2+] - 10g Sand
delta[Mg2+] - 20g Sand
delta[Mg2+] - 30g Sand
[Mg] = 739ppm
~ analytical error of 3.4% at the highest
Figure 4.26: OMTHP-Sand Static Adsorption/Compatibility Test (10g, 20g & 30g
Sand). Change in [Mg2+
] vs [OMTHP].

Chapter 4: Establishing Retention Mechanisms Through Static Compatibility and Coupled Adsorption/
Precipitation Experiments
84
-10
0
10
20
30
40
50
0 10 20 50 100 300 500 800 1000 2000 4000
Ch
ange
in [L
i+ ] (
pp
m)
[OMTHP] (ppm)
OMTHP-Sand Static Adsorption/Compatibility TestChange in [Li+] after 24 hrs heating and filtration process, pH4 & 95°C
delta[Li+] - Compatibility
delta[Li+] - 10g Sand
delta[Li+] - 20g Sand
deltaLi+] - 30g Sand
[Li] = 50ppm
~ analytical error of 3% at the highest
Figure 4.27: OMTHP-Sand Static Adsorption/Compatibility Test (10g, 20g & 30g
Sand). Change in [Li+] vs [OMTHP].
After filtration, all the filter papers were dried, weighed, photographed and sent for
ESEM-EDAX analysis. The sample solutions were measured for pH. The weight of the
samples that precipitated out of the solutions is presented in Table 4.6 and the
corresponding photographed filter papers after filtration are shown in Figure 4.28. Only
at 2000ppm and 4000ppm do we clearly see differences in both the weight and the
appearance of precipitate, though traces of precipitate can be seen on filter paper along
with very slight increases in weight. These results are very consistent with observations
(above) on the amount of phosphorous, Ca2+
ions and Mg2+
ions that were measure in
the filtered samples, which is less than in the stock solutions. The results prove that
precipitation took place from 1000ppm onward.

Chapter 4: Establishing Retention Mechanisms Through Static Compatibility and Coupled Adsorption/
Precipitation Experiments
85
Blank 10 ppm 20 ppm 50 ppm
100 ppm 300 ppm 500 ppm 800 ppm
1000 ppm 2000 ppm 4000 ppm
Figure 4.28: OMTHP-Sand Static Adsorption/Compatibility Test. Precipitates on filter
papers at different concentrations of OMTHP.
OMTHP Weight of Ppt
Conc.
(ppm) (g)
0 0.02
10 0.02
20 0.02
50 0.02
100 0.02
300 0.02
500 0.02
800 0.02
1000 0.03
2000 0.08
4000 0.21
Table 4.6: OMTHP-Sand Static Adsorption/Compatibility Test. Weight of precipitates
on filter paper after filtration.
Table 4.7 and Figure 4.29 show ESEM-EDAX atomic and weight percentage, and
photographed samples of phosphorous, Ca2+
, Mg2+
and other ions presents on the filter
papers. For each concentration, two points were taken for analysis. The hazy black
background was identified as being the filter paper itself, the solid white marks are the
salts and the hazy white background is the compound of phosphorous, Ca2+
and Mg2+
ions. The blank samples without any SI show only filter paper and some salts on them.
Base on the atomic% from ESEM-EDAX, there is no phosphorous compound identified

Chapter 4: Establishing Retention Mechanisms Through Static Compatibility and Coupled Adsorption/
Precipitation Experiments
86
below 500ppm, but very small variable levels of Ca2+
and Mg2+
ions are identified. It
must be noted that the EDAX signals are localized and values are not expected to be
very accurate. Only when it reaches 800ppm and above, is clear hazy white background
seen on the filter paper samples, which is identified to be phosphorous, Ca2+
and Mg2+
ions. Above 800ppm concentration, base on the atomic %, phosphorous, Ca2+
and Mg2+
are seen consistently, although the atomic % values are quite variable. Atomic% of
phosphorous ranges from 7 to 12; Ca2+
from 3 to 6 and Mg2+
about 1. Although the
values are rather variable, the presence of phosphorous, Ca2+
and Mg2+
as precipitates
above 800ppm is clearly proven.
Blank (3200x) 10 ppm (1600x) 20 ppm (800x) 50 ppm (400x)
100 ppm (800x) 300 ppm (800x) 500 ppm (3200x) 800 ppm (3200x)
1000 ppm (1200x) 2000 ppm (1900x) 4000 ppm (1600x)
Figure 4.29: OMTHP-Sand Static Adsorption/Compatibility Test. Morphology of
precipitates on ESEM photographed samples.

Chapter 4: Establishing Retention Mechanisms Through Static Compatibility and Coupled Adsorption/
Precipitation Experiments
87
Element Wt % At % Wt % At % Wt % At % Wt % At % Wt % At % Wt % At %
C K 48.73 61.32 43.91 52.85 45.28 54.37 44.34 59.88 42.35 57.27
N K 4.59 4.96 10.63 10.98 9.88 10.18 4.37 5.06
O K 39.44 53.34 22.43 21.19 34.56 31.23 33.58 30.27 20.62 20.9 17.04 17.3
NaK 9.05 5.95 2.76 1.74 2.58 1.62 12.95 9.13 15.27 10.79
MgK 0.45 0.28 0.24 0.14
AlK 0.39 0.22
SiK 60.56 46.66 0.85 0.46 0.23 0.12
SrL 0.35 0.06
P K
S K 0.23 0.11
ClK 11.41 4.87 7.32 2.99 7.71 3.14 21.54 9.85 20.41 9.35
K K
CaK 1.3 0.49 0.46 0.17 0.5 0.18 0.56 0.22 0.56 0.23
FeK 0.55 0.15
Total 100 100 100 100 100 100 100 100 100 100 100 100
Element Wt % At % Wt % At % Wt % At % Wt % At % Wt % At %
C K 43.11 53.31 40.17 53.51 29.96 44.41 31.5 45 32.28 46.64
N K 7.57 8.03 3.16 4.02 6.08 7.44 0 0
O K 34.13 31.68 34.21 34.22 28.33 31.53 28.38 30.44 32.54 35.29
NaK 2.36 1.52 1.12 0.78 0.95 0.74 1.08 0.81 1.63 1.23
MgK 0.95 0.58 1.46 0.96 1.61 1.18 1.47 1.04 1.7 1.22
AlK
SiK
SrL 0.69 0.12 1.13 0.21 2.34 0.47 2.2 0.43 2.44 0.48
P K 3.43 1.65 11.85 6.12 18.51 10.64 16.64 9.22 17.15 9.61
S K 0.17 0.08
ClK 4.69 1.96 3.58 1.62 5.06 2.54 3.76 1.82 4.1 2.01
K K 0.26 0.1
CaK 2.64 0.98 6.48 2.59 10.08 4.48 8.9 3.81 8.16 3.53
FeK
Total 100 100 100 100 100 100 100 100 100 100
300ppm
500ppm 800ppm 1000ppm 2000ppm 4000ppm
Blank 10ppm 20ppm 50ppm 100ppm
Table 4.7: OMTHP-Sand Static Adsorption/Compatibility Test. EDAX signals on the
precipitates from ESEM.
Table 4.5 and Figure 4.30 show the pH values of the adjusted and filtered samples. All
the stock solutions were adjusted to pH 4 to make sure it does not precipitate at room
condition. After 24 hrs at 95oC and filtration, the pH values were measured. For
compatibility test with no minerals, the pH value is retained at ~4 until 500ppm; and
reduces to 3.90, 3.86, 3.72 and 3.65 at 800, 1000, 2000 and 4000ppm, respectively. It
shows that the pH value starts reducing when significant P, Ca2+
and Mg2+
are missing
due to precipitation during filtration. Thus, significant precipitation of P, Ca2+
and Mg2+
on the filter paper has caused a reduction of pH. For adsorption tests at different masses

Chapter 4: Establishing Retention Mechanisms Through Static Compatibility and Coupled Adsorption/
Precipitation Experiments
88
of sand, the pH value increases for the blank sample, and increases further up to 50ppm
before pH reduces at 4000ppm. Although different masses of sand lead to different final
pH values, they behave similarly in a reducing trend. At 4000ppm, the pH value
converges to ~3.6 for all the different masses of sand. The observation here is similar to
that seen in the DETPMP/NFFW/sand experiments; i.e. as more phosphorous, Ca2+
and
Mg2+
are lost from the solution due to adsorption and precipitation, the lower is the pH
value.
3
3.5
4
4.5
5
5.5
0 500 1000 1500 2000 2500 3000 3500 4000 4500
pH
[OMTHP] (ppm)
OMTHP-Sand Adsorption/Compatibility TestpH Measurement - Adjusted and Final
Adjusted
Compatibility
10g Sand
20g Sand
30g Sand
Figure 4.30: OMTHP-Sand Static Adsorption/Compatibility Test. pH Measurement –
Adjusted and Final
4.5.3 DETPMP-KAOLINITE Adsorption/Compatibility Test
A stock solution of 10,000ppm DETPMP in NFFW was prepared for this experiment.
At this concentration, DETPMP SI is fully dissolved and yellowish in colour. It was
then diluted to attain lower concentrations of 10, 20, 50, 100, 500, 800, 1000, 1500,
2000, 3000 and 4000ppm which were used for all the experiments. In addition to that,
additional DETPMP solutions at concentrations 15000 and 25000ppm in NFFW were

Chapter 4: Establishing Retention Mechanisms Through Static Compatibility and Coupled Adsorption/
Precipitation Experiments
89
prepared to complete the total concentrations used for the experiment. pH was measured
for all the stock solutions and was later adjusted to pH 4. At pH 4, the particles (if any)
dissolved in the solutions at the various concentrations at which they were prepared.
Figure 4.31 shows the initial and adjusted pH values of these SI solutions at various
concentrations. The blank sample has pH 4.95 and this decreases gradually to pH 1.44
at 25000ppm of DETPMP SI. The decreasing trend of pH indicates the acidic nature of
the DETPMP scale inhibitor as the concentration increases. The figure also shows some
fluctuation in pH readings which is due to the fact that measurements were taken from
two different experiments.
1.0
1.5
2.0
2.5
3.0
3.5
4.0
4.5
5.0
0 5000 10000 15000 20000 25000 30000
pH
[DETPMP] (ppm)
DETPMP-Kaolinite Adsorption/Compatibility TestInitial pH Measurement
Initial
DETPMP pH pH
Conc Initial Adjusted
(ppm)
0 4.95 3.99
10 4.45 4.01
20 4.07 4
50 3.64 4
100 3.35 4
500 2.71 4
800 2.57 4
1000 2.23 4
1500 2.09 4
2000 2.22 4
3000 1.84 4
4000 1.97 4
10000 1.45 4
15000 1.35 4
25000 1.44 4
Figure 4.31: DETPMP SI initial pH measurement of each stock solutions before
adjustment. The decreasing trend of the pH indicates acidic nature of OMTHP SI.
Figure 4.32 and Figure 4.33 show the adsorption (“apparent” or actual) level of scale
inhibitor (DETPMP in mg SI / g rock) for different masses of kaolinite as a function of
the scale inhibitor concentration (after adsorption, i.e. [SI] = c1f – see above) in
synthetic NFFW at pH 4 at 95°C. From these figures, we mainly wish to determine
whether, and in which concentration regions, only pure adsorption or coupled
adsorption/precipitation are taking place. Results in Figure 4.32 and Figure 4.33 show
that only pure adsorption is seen up to ~500ppm of SI, before the Γapp vs. [SI] curves for
different (m/V) values start to deviate at higher concentration values due to the
occurrence of coupled adsorption/precipitation behaviour. This is evident also from the
actual numerical levels of apparent adsorption; if only pure adsorption were present,

Chapter 4: Establishing Retention Mechanisms Through Static Compatibility and Coupled Adsorption/
Precipitation Experiments
90
Γapp would plateau at a level of ~5.0 mg/g. In fact, at higher concentrations, we see that
app level is ~20.0 – 50.0 mg/g which is clearly indicative of a “coupled
adsorption/precipitation” process. We note that, although normally pure adsorption only
occurred to levels below 1.0 mg/g, in these experiments it is seen as high as 5.0 mg/g.
This is expected as kaolinite contains clay minerals and the size distribution is such that
its surface area is much larger than that of sand; in fact it is approximately 10x larger,
and hence the 5 mg/g of DETPMP adsorption on kaolinite is quite reasonable.
-10
0
10
20
30
40
50
60
0 2000 4000 6000 8000 10000 12000 14000 16000 18000
App
aren
t Ads
orpt
ion
(mg
/g)
[DETPMP] (ppm)
DETPMP-Kaolinite Static Adsorption/Compatibility TestDETPMP Ads Isotherm onto Kaolinite at pH4 & 95°C
10g Kaolinite
20g Kaolinite
30g Kaolinite
Figure 4.32: DETPMP-Kaolinite Static Adsorption/Compatibility Test. DETPMP
Adsorption Isotherm onto different masses of sand at pH4 & 95°C.

Chapter 4: Establishing Retention Mechanisms Through Static Compatibility and Coupled Adsorption/
Precipitation Experiments
91
-2
0
2
4
6
8
10
12
14
16
0 500 1000 1500 2000 2500
App
aren
t Ads
orpt
ion
(mg
/g)
[DETPMP] (ppm)
DETPMP-Kaolinite Static Adsorption/Compatibility TestDETPMP Ads Isotherm onto Kaolinite at pH4 & 95°C
10g Kaolinite
20g Kaolinite
30g Kaolinite
~ zoom down to lower concentrations
Figure 4.33: DETPMP-Kaolinite Static Adsorption/Compatibility Test. DETPMP
Adsorption Isotherm onto different masses of sand at 95°C and pH4; zoomed down to
lower concentration.
To further establish the pure adsorption and coupled adsorption/precipitation behaviour,
changes of [phosphorous], [Ca2+
] and [Mg2+
] concentration in the mixture of SI and
NFFW solution in both adsorption and compatibility tests were measured. Any divalent
ion level above stock solution concentration is not expected or must be within its
analytical error of less than 5%. The decrease in the solution divalent ion levels are due
to either precipitation of M-DETPMP complex or because of involvement of the
divalent ions in the adsorption process (e.g. by cation bridging). The change in [Li+] is
also observed to check whether there was any evaporation taking place. There should
not be any changes in [Li+] as it is an inert tracer ion which does not adsorb onto sand
or react with DETPMP SI. The [Li+] value was used to correct for the increase in
concentration for all the other elements due to evaporation.
Figure 4.34, Figure 4.35 and Figure 4.36 show the differences in the levels of
[phosphorous], [Ca2+
] and [Mg2+
] for both compatibility and adsorption tests. The
differences in the amounts show that there are definitely concentrations regions where
pure adsorption and where coupled adsorption/precipitation are taking place. It is known
that Ca2+
and Mg2+
ions do not significantly adsorb* onto kaolinite, and so any
Chapter 4: Establishing Retention Mechanisms Through Static Compatibility and Coupled Adsorption/
Precipitation Experiments
92
differences are due to cation bridging of phosphorous to Ca2+
and Mg2+
ions onto the
kaolinite. [*NB however, there may be some ion exchange of Ca2+
and Mg2+
ions onto
the rock/mineral surface but this is not a very large effect for kaolinite and is even less
for pure quartz sand]. It is also noted that in almost all cases, there is a small increase
in [Ca2+
] and [Mg2+
] ions, which is not expected, but they are all within the analytical
error of less than 5%. Even changes in [Li+] ions are observed for all the cases, but
again, they are within its analytical error of less than 5%. The increase in Li+ also shows
slight evaporation was taking place. The % increase was used to correct the
concentrations for all the other elements.
Figure 4.34 show that phosphorous starts adsorbing onto sand even at a low
concentration of 10ppm for the different masses of sand used, where the difference
between the stock solution and the filtrate is about 8 to 12ppm as the mass of sand
increases from 10g to 30g sand. As the concentration of DETPMP SI increases from
10ppm to 25000ppm, the changes in phosphorous ion loss from solution are also
increased. Whereas, in the precipitation case where there is no kaolinite present,
reduction in phosphorous can only be observed at 800ppm, where 4ppm was left as
precipitates, and increases to 5000ppm (left as precipitates) as the DETPMP
concentration increases to 25000ppm. The figure indicates pure adsorption of
phosphorous onto kaolinite until 500ppm and coupled adsorption/precipitation from
800ppm onward.
Figure 4.35 shows the change in Ca2+
ion concentrations for both compatibility and
adsorption tests. Referring to adsorption tests at 10g to 30g kaolinite; the figure shows
that Ca2+
ions starts to show a significant reduction from 2000ppm and are even further
reduced at 25000ppm. The reduction in Ca2+
ions increases as the mass of sand
increases from 10g to 30g. Whereas for precipitate ion test (referring to compatibility
tests), reduction in Ca2+
is also observed at 2000ppm. The difference of Ca2+
ion in both
experiments shows that Ca2+
must have precipitated at 2000ppm and above as an M-
DETPMP complex. At 25000ppm DETPMP, 700 to 850ppm of Ca2+
was lost from the
solution at different masses of sand tested.

Chapter 4: Establishing Retention Mechanisms Through Static Compatibility and Coupled Adsorption/
Precipitation Experiments
93
Figure 4.36 shows the change in Mg2+
ion concentrations for both compatibility and
adsorption tests. Referring to adsorption tests at 10g to 30g kaolinite; the figure shows
significant changes in Mg2+
can only be seen at 4000ppm onward. The difference in
Mg2+
ion concentration shows that Mg2+
must have precipitated as an M-DETPMP
complex. For compatibility test with no minerals, significant reduction in Mg2+
is also
observed at 4000ppm and above. Again, comparing phosphorous to Ca2+
and Mg2+
binding, Ca2+
has more affinity to DETPMP SI as shown from the amount of
concentration precipitated; where 800ppm and 175ppm of Ca2+
and Mg2+
loss from
solution, respectively.
Figure 4.37 shows the change in Li+ ions. Li
+ is an inert tracer ion and should not
adsorb or precipitate. It is analysed to determine if any evaporation occurred in the
experiment. Based on the variation in Li+ concentration, its analytical error is < 2% on
and only slight evaporation is indicated which was taken into account for the
calculation made for all the other elements (P, Ca, Mg).
-9000
-8000
-7000
-6000
-5000
-4000
-3000
-2000
-1000
0
1000
0 10 20 50 100 500 800 2000 4000 25000
Ch
an
ge
in [
P]
(pp
m)
[DETPMP] (ppm)
DETPMP-Kaolinite Static Adsorption/Compatibility TestChange in [P] after 24 hrs heating and filtration process, pH4 & 95°C
delta[P] - Compatibility-3
delta[P] - 10g Kaolinite
delta[P] - 20g Kaolinite
delta[P] - 30g Kaolinite
Figure 4.34: DETPMP-Kaolinite Static Adsorption/Compatibility Test (10g, 20g & 30g
Sand). Change in [P] vs [DETPMP].

Chapter 4: Establishing Retention Mechanisms Through Static Compatibility and Coupled Adsorption/
Precipitation Experiments
94
-1000
-800
-600
-400
-200
0
200
400
0 10 20 50 100 500 800 2000 4000 25000
Ch
an
ge
in [
Ca
2+]
(pp
m)
[DETPMP] (ppm)
DETPMP-Kaolinite Static Adsorption/Compatibility TestChange in [Ca2+] after 24 hrs heating and filtration process, pH4 & 95°C
delta[Ca2+] - Compatibility-3
delta[Ca2+] - 10g Kaolinite
delta[Ca2+] - 20g Kaolinite
delta[Ca2+] - 30g Kaolinite
[Ca] = 2000ppm
Figure 4.35: DETPMP-Kaolinite Static Adsorption/Compatibility Test (10g, 20g & 30g
Sand). Change in [Ca2+
] vs [DETPMP].
-200
-150
-100
-50
0
50
100
0 10 20 50 100 500 800 2000 4000 25000
Ch
an
ge
in [
Mg
2+]
(pp
m)
[DETPMP] (ppm)
DETPMP-Kaolinite Static Adsorption/Compatibility TestChange in [Mg2+] after 24 hrs heating and filtration process, pH4 & 95°C
delta[Mg2+] - Compatibility-3
delta[Mg2+] - 10g Kaolinite
delta[Mg2+] - 20g Kaolinite
delta[Mg2+] - 30g Kaolinite
[Mg] = 739ppm
Figure 4.36: DETPMP-Kaolinite Static Adsorption/Compatibility Test (10g, 20g & 30g
Sand). Change in [Mg2+
] vs [DETPMP].

Chapter 4: Establishing Retention Mechanisms Through Static Compatibility and Coupled Adsorption/
Precipitation Experiments
95
-25
-20
-15
-10
-5
0
5
10
15
20
25
0 10 20 50 100 500 800 2000 4000 25000
Ch
an
ge
in [
Li+]
(pp
m)
[DETPMP] (ppm)
DETPMP-Kaolinite Static Adsorption/Compatibility TestChange in [Li+] after 24 hrs heating and filtration process, pH4 & 95°C
delta[Li+] - Compatibility-3
delta[Li+] - 10g Kaolinite
delta[Li+] - 20g Kaolinite
delta[Li+] - 30g Kaolinite
[Li] = 50ppm
Figure 4.37: DETPMP-Kaolinite Static Adsorption/Compatibility Test (10g, 20g & 30g
Sand). Change in [Li+] vs [DETPMP].
After the filtration, all the filter papers were dried, weighed, photographed and sent for
ESEM-EDAX analysis. The sample solutions were measured for pH. The weight of the
samples that precipitated out of the solutions and the corresponding photographed filter
papers after filtration are shown in Figure 4.38. Only at 1000ppm do we clearly see
differences in both the weight and the appearance of precipitate, although there were
some tracers of precipitates at 800ppm. As the concentration increases, the weight
increases as expected and more significant precipitates can be seen clearly on the filter
paper. These results are very consistent with observations (above) on the amount of
phosphorous, Ca2+
ions and Mg2+
ions that were measured in solution, which was less
than in the stock solutions.

Chapter 4: Establishing Retention Mechanisms Through Static Compatibility and Coupled Adsorption/
Precipitation Experiments
96
DETPMP Weight of Ppt
Conc.
(ppm) (g)
0 0.02
10 0.02
20 0.02
50 0.02
100 0.02
500 0.02
800 0.02
1000 0.04
1500 0.06
2000 0.06
3000 0.12
4000 0.14
10000 0.48
15000 0.69
25000 0.86
Blank10 ppm
20ppm50ppm
100ppm500ppm
800ppm2000ppm
4000ppm 25000ppm
Figure 4.38: DETPMP-Kaolinite Static Adsorption/Compatibility Test. Precipitates on
filter papers and weight of precipitates at different concentrations of DETPMP.
Table 4.8 and Figure 4.39 show ESEM-EDAX atomic and weight percentage, and
photographed samples of phosphorous, Ca2+
, Mg2+
and other ions presents on the filter
papers. For each concentration, one or two points were taken for analysis. The hazy
black background was identified to be the filter paper itself, the solid white marks are
the salts and the hazy white background is the compound of phosphorous, Ca2+
and
Mg2+
ions. The blank samples without any SI shows only filter paper and some salts on
them. Based on the atomic % from ESEM-EDAX, there is no phosphorous compound
identified below 500ppm, but variable values of Ca2+
and Mg2+
ions are identified. It
must be noted that the EDAX signals are localized and variable and inaccurate values
are expected depending on which point has been analyzed. Only when it reached
800ppm and above, was a clear hazy white background seen on the filter paper samples,
which is identified to be phosphorous, Ca2+
and Mg2+
ions. Above 800ppm

Chapter 4: Establishing Retention Mechanisms Through Static Compatibility and Coupled Adsorption/
Precipitation Experiments
97
concentration, base on the atomic%, phosphorous, Ca2+
and Mg2+
are seen consistently,
although the atomic % are quite variable. Atomic% of phosphorous ranges from 2 to 11;
Ca2+
from 2 to 5 and Mg2+
from 1 to 2. Though the value are quite variable, the clear
presence of phosphorous, Ca2+
and Mg2+
as precipitates above 800ppm is proven.
Blank (800x) 10ppm (3500x) 20ppm (6500x) 50ppm (5000x)
100ppm (2000x) 500ppm (2000x) 800ppm (800x)
2000ppm (1000x) 4000ppm (1500x)
20000ppm (2000x)
1000ppm (3500x)
1000ppm (3500x) 3000ppm (3500x)
10000ppm (3500x) 15000ppm (3500x)
Figure 4.39: DETPMP-Kaolinite Static Adsorption/Compatibility Test. Morphology of
precipitates on ESEM photographed samples.

Chapter 4: Establishing Retention Mechanisms Through Static Compatibility and Coupled Adsorption/
Precipitation Experiments
98
Element Wt % At % Wt % At % Wt % At % Wt % At % Wt % At % Wt % At % Wt % At % Wt % At %
C K 27.51 37.73 28.91 45.73 33.65 43.96 52.84 65.22 26.25 35.81 26.89 51.85 43.6 55.01 26.97 41.26
N K
O K 45.61 46.96 37.82 44.92 45.44 44.57 27.05 25.07 47.96 49.12 14.51 21 38.4 36.38 32.35 37.16
NaK 1.94 1.39 1.45 1.2 1.17 0.8 5.86 3.78 0.63 0.45 1.25 1.26 1.88 1.24 0.77 0.62
MgK 0.96 0.65 0.61 0.58 1.25 0.78 2.96 2.24
P K 7.43 3.64 16.72 9.92
AlK 8.18 5 0.16 0.11 7.74 4.5 1.02 0.62 0.57 0.49
SrL 8.45 4.96 2.78 0.6 3.18 0.67
S K 5.52 2.56 6.48 3.84
SiK 0.53 0.22 8.35 4.66 23.5 13.71 2.19 1.81
ClK 1.31 0.54 0.63 0.34 1.3 0.58 13.75 5.75 0.63 0.29 1.18 0.77 2.92 1.25 5.32 2.76
K K 2.34 0.94 0.27 0.16
CaK 0.53 0.25 0.49 0.18 0.45 0.26 4.52 1.71 11.71 5.37
BaL 20.93 2.9
CrK 10.03 4.47
FeK 0.32 0.11 37.41 15.52
NiK 4.64 1.83
Total 100 100 100 100 100 100 100 100 100 100 100 100 100 100 100 100
Element Wt % At % Wt % At % Wt % At % Wt % At % Wt % At % Wt % At % Wt % At %
C K 27.86 42.54 28.85 42.82 26.67 39.99 29.08 43.95 27.65 40.35 26.91 39.25 30.67 44.01
N K 5.37 6.91 4.86 6.09 4.76 5.96
O K 30.83 35.34 33.85 37.71 29.05 32.69 30.47 34.57 32.27 35.36 33.56 36.75 36.01 38.8
NaK 1.25 1 1.44 1.12 1.07 0.83 1.69 1.33 1.63 1.24 1.88 1.44 2.06 1.54
MgK 2.47 1.86 1.81 1.33 2.03 1.5 1.93 1.44 1.95 1.41 1.68 1.21 1.81 1.28
P K 18.24 10.8 16.8 9.67 2.46 0.51 2.79 10.88 16.71 9.46 17.15 9.7 2.35 9.17
AlK 17.77 10.33 18.57 16.48
SrL 2.64 0.55 2.34 0.48 4.08 0.58 2.57 0.51 2.66 0.53 2.8 0.46
S K 11.4 0.08
SiK 100 7.74
ClK 4.41 2.28 4.36 2.19 4.1 2.08 2.09 3.15 1.56 3.06 1.51 100 1.36
K K 0.04
CaK 12.3 5.63 10.54 4.69 11.48 5.16 5.16 9.2 4.02 8.33 3.64 3.33
BaL
CrK
FeK
NiK
Total 100 100 100 100 100 100 100 100 100 100 100 100
3000ppm 4000ppm 10000ppm 15000ppm 25000ppm
100ppm 500ppm 800ppm 1000ppm
1500ppm 2000ppm
Blank 10ppm 20ppm 50ppm
Table 4.8: DETPMP-Kaolinite Static Adsorption/Compatibility Test. EDAX signals on
the precipitates from ESEM.
4.5.4 OMTHP-KAOLINITE Adsorption/Compatibility Test
A stock solution of 10,000ppm OMTHP in NFFW was prepared for these experiments.
At this concentration, OMTHP SI is not fully dissolved and is whitish and opaque in
appearance. It starts to precipitate/phase separate after a few hours and distinctly
precipitates after ~24 hours. This preparation was then diluted to attain the lower
concentration levels of 10, 20, 50, 100, 500, 800, 2000 and 4000ppm which were used
for all the experiments. pH was measured for all the stock solutions and was later
adjusted to pH 4. At pH4, all the particles (if any) dissolved in the solutions at the
different concentrations at which they were prepared. Figure 4.40 shows the initial pH
values of the various OMTHP stock solutions before pH adjustment. The blank sample
(0 ppm OMTHP) had a pH value of 5.41 and this decreased gradually to pH 4.46 at
4000ppm. The decreasing trend of pH indicates the acidic nature of the OMTHP scale

Chapter 4: Establishing Retention Mechanisms Through Static Compatibility and Coupled Adsorption/
Precipitation Experiments
99
inhibitor as the concentration increases. OMTHP is less acidic than DETPMP (
DETPMP, had pH 1.97 at 4000ppm).
4
4.2
4.4
4.6
4.8
5
5.2
5.4
5.6
5.8
6
0 500 1000 1500 2000 2500 3000 3500 4000 4500
pH
[OMTHP] (ppm)
OMTHP-Kaolinite Static Adsorption/Compatibility TestInitial pH Measurement
Initial
OMTHP pH pH
Conc. (Initial) (Adjusted)
(ppm)
0 5.41 4.01
10 5.47 3.99
20 5.13 3.99
50 4.81 3.99
100 4.72 4
500 4.62 4
800 4.59 4.01
2000 4.52 4
4000 4.46 4
Figure 4.40: OMTHP SI initial pH measurement of each stock solutions before
adjustment. The decreasing trend of the pH indicates acidic nature of OMTHP SI.
Figure 4.41 shows the adsorption (“apparent” or actual) level of scale inhibitor
(OMTHP in mg SI / g rock) on different masses of kaolinite as a function of the scale
inhibitor concentration (i.e. after adsorption, [SI] = c1f – see above) in synthetic NFFW
at pH values of 4 and 95°C. The apparent adsorption value ranges from near zero to 16
mg/g as the SI concentration increases to 1300ppm. The Γapp vs. [SI] curves for the
different values of (m/V) overlap (with +/- 4% error) up to around 150ppm which
indicating pure adsorption behaviour. At higher concentrations, the behaviour is
observed to change to coupled adsorption/precipitation as the different (m/V) curves
start to deviate from each other. At 150ppm, the Γapp value is around ~4 - 5 mg/g,
which is quite high for pure adsorption but this is due to the large surface area of the
kaolinite as discussed above. Also, the very high adsorption levels for OMTHP onto
kaolinite (due to high surface areas) lead to a less clear transition between the pure
adsorption and the coupled adsorption/precipitation regions.

Chapter 4: Establishing Retention Mechanisms Through Static Compatibility and Coupled Adsorption/
Precipitation Experiments
100
0
2
4
6
8
10
12
14
16
18
0 200 400 600 800 1000 1200 1400
Ap
pa
ren
t A
dso
rpti
on
(m
g/g
)
[OMTHP] (ppm)
OMTHP-Kaolinite Static Adsorption/Compatibility TestOMTHP Ads Isotherm onto Kaolinite at pH4 & 95°C
10g Kaolinite
20g Kaolinite
30g Kaolinite
10g Kaolinite-Repeat
Figure 4.41: OMTHP-Kaolinite Static Adsorption/Compatibility Test. OMTHP
Adsorption Isotherm onto different masses of sand at pH4 & 95°C.
To further establish the pure adsorption and coupled adsorption/precipitation behaviour,
change in [phosphorous], [Ca2+
] and [Mg2+
] concentration in the mixture of SI and
NFFW solution in both adsorption and compatibility test were measured. Any divalent
ion level above stock solution concentration is not expected or must be within its
analytical error of less than 5%. The decrease in the solution divalent ion levels are due
to either precipitation of M-OMTHP complex or involvement of the divalent ions in the
pure adsorption process (e.g. by cation bridging). The change in [Li+] is also observed
to establish if any evaporation takes place. There should not be any changes in [Li+] as
it is an inert tracer ion which does not react with OMTHP SI or adsorb onto sand.
Figure 4.42, Figure 4.43 and Figure 4.44 show the differences in the solution levels of
[phosphorous], [Ca2+
] and [Mg2+
] for both compatibility and adsorption tests for the
OMTHP/NFFW/kaolinite system. The differences in the amounts in each test show that
there are definitely regions of pure adsorption and coupled adsorption/precipitation
occurring in the range of concentrations tested. It is known that Ca2+
and Mg2+
ions do
not significantly adsorb* onto kaolinite, so the differences are due to cation bridging of

Chapter 4: Establishing Retention Mechanisms Through Static Compatibility and Coupled Adsorption/
Precipitation Experiments
101
phosphorous to Ca2+
and Mg2+
ions onto the kaolinite. [*NB however, there may be
some ion exchange of Ca2+
and Mg2+
ions onto the rock/mineral surface but this is not a
large effect for kaolinite and is even less for pure quartz sand]. It is also noted that in
almost all cases, there is a small increase in [Ca2+
] and [Mg2+
] ions, which is not
expected, but they are all within its analytical error of less than 5%. Even changes in
[Li+] are observed for all the cases, but again, they are within its analytical error of less
than 5% and due to small amounts of evaporation. The % increase in [Li+] was used to
correct the concentrations for all the other elements.
Figure 4.42 shows the change in phosphorous ions for both compatibility and adsorption
tests. Referring to adsorption tests, the figure shows that phosphorous starts adsorbing
onto kaolinite even at a low concentration of 10ppm for the different masses of kaolinite
used, where the difference between the stock solution and the filtrate is about 9, 10 and
11 ppm as the mass of kaolinite increases for 10g, 20g and 30g of kaolinite. As the
concentration of OMTHP SI increases from 10ppm to 4000ppm, the changes in
phosphorous ions also increase. Essentially, pure adsorption is observed up to 500ppm
and coupled adsorption/precipitation is seen from 800ppm onward for the
OMTHP/NFFW/kaolinite system.
Figure 4.43 shows the change in Ca2+
ion concentrations in both compatibility and
adsorption tests. Referring to adsorption tests, the Ca2+
ions start to show a significant
reduction from 2000ppm and is further reduced at 4000ppm. For the compatibility tests,
reduction in Ca2+
is only observed at 4000 ppm, but with less precipitation.
Figure 4.44 shows the change in Mg2+
ion concentrations in both compatibility and
adsorption tests. Significant changes in Mg can only be seen at 4000ppm for all the
masses of kaolinite used. For compatibility test with no minerals, significant reduction
is also observed at 4000ppm, but with much smaller amounts of ion loss from solution
compared to adsorption tests. Comparing phosphorous (SI) to Ca2+
and Mg2+
binding,
phosphorous has more affinity to Ca2+
than Mg2+
as shown in the amount of
concentration precipitated.
Figure 4.45 shows the change in Li+ ion concentration. It is analyzed to see if there was

Chapter 4: Establishing Retention Mechanisms Through Static Compatibility and Coupled Adsorption/
Precipitation Experiments
102
any evaporation. The figure shows there was fluctuation in the region of 1 to 3%. This
indicates the fluctuation was due to analytical error and small evaporation. Li+ is an
inert tracer ion does not adsorb or precipitates onto kaolinite minerals. This factor was
taken into account for all the calculation made for all the elements.
-3000
-2500
-2000
-1500
-1000
-500
0
500
0 10 20 50 100 500 800 2000 4000
Cha
nge
in [p
hosp
horo
us]
(ppm
)
[OMTHP] (ppm)
OMTHP-Kaolinite Static Adsorption/Compatibility TestChange in [P] after 24 hrs heating and filtration process, pH4 & 95°C
delta[P] - Compatibility
delta[P] - 10g Kaolinite-Repeat
delta[P] - 20g Kaolinite
delta[P] - 30g Kaolinite
Figure 4.42: OMTHP-Kaolinite Static Adsorption/Compatibility Test (10g, 20g & 30g
Sand). Change in [P] vs [OMTHP].
-200
-100
0
100
200
300
400
500
0 10 20 50 100 500 800 2000 4000
Cha
nge
in [C
a2+] (
ppm
)
[OMTHP] (ppm)
OMTHP-Kaolinite Static Adsorption/Compatibility TestChange in [Ca2+] after 24 hrs heating and filtration process, pH4 & 95°C
delta[Ca2+] - Compatibility
delta[Ca2+] - 10g Kaolinite-Repeat
delta[Ca2+] - 20g Kaolinite
delta[Ca2+] - 30g Kaolinite
[Ca] = 2000ppm
Figure 4.43: OMTHP-Kaolinite Static Adsorption/Compatibility Test (10g, 20g & 30g
Sand). Change in [Ca2+
] vs [OMTHP].

Chapter 4: Establishing Retention Mechanisms Through Static Compatibility and Coupled Adsorption/
Precipitation Experiments
103
-50
0
50
100
150
200
0 10 20 50 100 500 800 2000 4000
Cha
nge
in [M
g2
+] (
ppm
)
[OMTHP] (ppm)
OMTHP-Kaolinite Static Adsorption/Compatibility TestChange in [Mg2+] after 24 hrs heating and filtration process, pH4 & 95°C
delta[Mg2+] - Compatibility
delta[Mg2+] - 10g Kaolinite-Repeat
delta[Mg2+] - 20g Kaolinite
delta[Mg2+] - 30g Kaolinite
[Mg] = 739ppm
Figure 4.44: OMTHP-Kaolinite Static Adsorption/Compatibility Test (10g, 20g & 30g
Sand). Change in [Mg2+
] vs [OMTHP].
-50.0
-40.0
-30.0
-20.0
-10.0
0.0
10.0
20.0
30.0
40.0
50.0
0 10 20 50 100 500 800 2000 4000
Cha
nge
in [L
i+] (
ppm
)
[OMTHP] (ppm)
OMTHP-Kaolinite Static Adsorption/Compatibility TestChange in [Li+] after 24 hrs heating and filtration process, pH4 & 95°C
delta[Li+] - Compatibility
delta[Li+] - 10g Kaolinite-Repeat
delta[Li+] - 20g Kaolinite
delta[Li+] - 30g Kaolinite
[Li] = 50ppm
Figure 4.45: OMTHP-Kaolinite Static Adsorption/Compatibility Test (10g, 20g &
30g Sand). Change in [Li+] vs [OMTHP].
After filtration, all the filter papers were dried, weighed, photographed and sent for
ESEM-EDAX analysis. The sample solutions were measured for pH. The weight of the
samples that precipitated out of the solutions and the corresponding photographed filter

Chapter 4: Establishing Retention Mechanisms Through Static Compatibility and Coupled Adsorption/
Precipitation Experiments
104
papers after filtration are shown in Figure 4.46. Only at 2000ppm and 4000ppm do we
clearly see differences in both the weight and the appearance of precipitate on filter
paper, although some traces of precipitate may be seen at 800ppm. These results are
very consistent with observations (above) on the amount of phosphorous, Ca2+
ions and
Mg2+
ions that were measure in the filtered samples, which took place at 2000ppm and
above. The result proves that precipitation starts from 800ppm onward.
OMTHP Weight of Ppt
Conc.
(ppm) (g)
0 0.02
10 0.02
20 0.02
50 0.02
100 0.02
500 0.02
800 0.02
2000 0.10
4000 0.27
Blank10ppm
20ppm50ppm
100ppm 500ppm
800ppm 2000ppm
4000ppm
Figure 4.46: OMTHP-Kaolinite Static Adsorption/Compatibility Test. Precipitates on
filter papers and weight of precipitates at different concentrations of OMTHP.
Table 4.9 and Figure 4.47 show ESEM-EDAX atomic percentage and photographed
samples of phosphorous, Ca2+
, Mg2+
and other ions presents on the filter papers. For
each concentration, two points were taken for analysis. The hazy black background was
identified as being the filter paper itself, the solid white marks are the salts and the hazy
white background is the compound of phosphorous, Ca2+
and Mg2+
ions. The blank
samples without any SI shows only filter paper and some salts on it. Based on the
atomic% from ESEM-EDAX, there is no phosphorous compound identified below

Chapter 4: Establishing Retention Mechanisms Through Static Compatibility and Coupled Adsorption/
Precipitation Experiments
105
500ppm, but variable value of Ca2+
and Mg2+
ions were identified. It must be noted that
the EDAX signals are localized and inaccurate values are expected. Only when it
reaches 800ppm and above, can a clear hazy white background be seen on the filter
paper samples, which is identified to be phosphorous, Ca2+
and Mg2+
ions. Above
800ppm concentration, based on the atomic %; phosphorous, Ca2+
and Mg2+
are seen
consistently, although the atomic % values are quite variable. Atomic % of phosphorous
ranges from 3 to 8; Ca2+
from 1 to 3 and Mg2+
about 1. Although the values are rather
inaccurate, the presence of phosphorous, Ca2+
and Mg2+
as precipitates above 800ppm is
proven.
Blank (3500x) 10ppm (2500x) 20ppm (2000x)
50ppm (1500x) 100ppm (1200x) 500ppm (800x)
800ppm (1500x) 2000ppm (800x) 4000ppm (650x)
Figure 4.47: OMTHP-Kaolinite Static Adsorption/Compatibility Test. Morphology of
precipitates on ESEM photographed samples.

Chapter 4: Establishing Retention Mechanisms Through Static Compatibility and Coupled Adsorption/
Precipitation Experiments
106
Element Wt % At % Wt % At % Wt % At % Wt % At % Wt % At % Wt % At % Wt % At % Wt % At % Wt % At %
C K 54.5 64.97 31.76 43.11 54.32 65.21 33.07 45.01 53.57 64.68 51.41 61.82 45.06 56.17 38.43 53.35 35.41 50.64
O K 32.42 29.01 39.36 40.12 31.21 28.13 36.95 37.75 30.79 27.91 35.48 32.03 38.85 36.37 28.69 29.9 29.03 31.16
NaK 3.46 2.15 1.62 1.15 3.68 2.31 0.95 0.68 4.64 2.93 3.69 2.32 1.03 0.67 1.45 1.05 2.01 1.51
MgK 0 0 1.1 0.68 1.27 0.87 1.64 1.16
P K 0.38 0.18 6.59 3.18 16.38 8.82 15.56 8.63
AlK 11.6 7.01 2.45 1.48
SiK 11.95 6.94 23.74 13.82
SrL 1.96 0.38
ClK 9.22 3.72 2.93 1.35 9.97 4.06 1.68 0.78 10.74 4.39 8.56 3.49 3.55 1.5 5.2 2.44 6.32 3.06
CaK 0.4 0.14 0.81 0.29 0.27 0.1 0.47 0.17 3.83 1.43 8.59 3.57 8.06 3.45
K K 0.78 0.32 1.16 0.49
Total 100 100 100 100 100 100 100 100 100 100 100 100 100 100 100 100 100 100
100ppm 500ppm 800ppm 2000ppm 4000ppmBlank 10ppm 20ppm 50ppm
Table 4.9: OMTHP-Kaolinite Static Adsorption/Compatibility Test. EDAX signals on
the precipitates from ESEM.
4.5.5 DETPMP-SIDERITE Adsorption/Compatibility Test
A stock solution of 10,000ppm DETPMP in NFFW was prepared for this experiment on
the static adsorption/precipitation of DETPMP onto the iron mineral, siderite (FeCO3).
At this concentration, DETPMP SI is fully dissolved and yellowish in colour. It was
then diluted to attain lower concentrations of 20, 50, 100, 500, 1500, 4000 and
10000ppm which were used for all the experiments. In addition to that, 15000ppm of
DETPMP in NFFW was prepared to complete the total set of concentrations used for
this experiment. pH was measured for all the stock solutions and was later adjusted to
pH 4. At pH 4, all of the particles (if any) dissolved in the solutions at the different
concentrations at which they were prepared. No precipitation was observed even after
the solution was left for 24 hours at room temperature. Figure 4.48 shows the initial pH
values of the various stock solutions before adjustment. The blank sample has a pH
value of 6.05 and this decreased gradually to pH 1.48 at 15000ppm. The decreasing
trend of pH indicates the acidic nature of the DETPMP scale inhibitor as the
concentration increases.

Chapter 4: Establishing Retention Mechanisms Through Static Compatibility and Coupled Adsorption/
Precipitation Experiments
107
1.0
1.5
2.0
2.5
3.0
3.5
4.0
4.5
5.0
0 2000 4000 6000 8000 10000 12000 14000 16000
pH
[DETPMP] (ppm)
DETPMP-Siderite Static Adsorption/Compatibility TestInitial pH Measurement
Initial
DETPMP pH pH
Conc. (Initial) (adjusted)
(ppm)
0 6.05 4.01
20 3.98 4.01
50 3.54 4
100 3.28 4
500 2.67 4
1500 2.23 4
4000 1.88 4
10000 1.58 4
15000 1.48 4
Figure 4.48: DETPMP SI initial pH measurement of each stock solutions before
adjustment. The decreasing trend of the pH indicates acidic nature of DETPMP SI.
Figure 4.49 shows the adsorption (“apparent” or actual) level of scale inhibitor
(DETPMP in mg SI / g rock) on different masses of siderite as a function of the scale
inhibitor concentration (i.e. the concentration after adsorption, [SI] = c1f – see above) in
synthetic NFFW at pH 4 at 95°C. The main observations from these figures can
establish whether only pure adsorption or coupled adsorption/precipitation is taking
place. From the Γapp vs. [SI] results in , it is less clear where the regions of pure
adsorption and coupled adsorption/precipitation occur for the siderite mineral substrate
under these conditions. However, at the very low concentration of around 100ppm, the
Γapp vs. [SI] lines do appear to overlap for each values of (m/V) before they start to
deviate and diverge somewhat at higher concentration levels. Above [SI] ~ 1500, it
appears that the Γapp vs. [SI] curves do depend on the (m/V) ratio- hence indicating that
coupled adsorption/precipitation behaviour is occurring. Also, in the pure adsorption
region ([SI] ≤ ~100ppm), the absolute values of the adsorption are quite high, with Γapp
~2 – 3 mg/g. This may be associated with the higher surface area of the siderite or
indeed the surface may have a very high adsorptive affinity for scale inhibitor (as noted
by earlier work, Gdanski and Funkhouser, 2001). However, at [SI] > 1500ppm, then
very high levels of Γapp are observed, Γapp ~ 20 – 70 mg/g onto the siderite and these
levels can only be due to precipitation.

Chapter 4: Establishing Retention Mechanisms Through Static Compatibility and Coupled Adsorption/
Precipitation Experiments
108
In addition to the relatively high surface area, another factor that may have contributed
to the high apparent adsorption results for the DETPMP/siderite system may be the
amount of [Fe3+
] in the system. Results in Figure 4.50 show that, at 1500ppm, 25ppm
[Fe3+
] went through the filter paper while at 15000ppm, 200ppm [Fe3+
] went through
the filter paper. It shows that not only phosphorous, calcium and magnesium ions
leached out of the system, but also iron, which is part of siderite minerals also leached
out of the system. The full effects of the Fe3+
will need further investigation to assess its
impact on the pure adsorption or couple adsorption/precipitation behaviour in the
DETPMP/siderite system.
0
10
20
30
40
50
60
70
80
0 500 1000 1500 2000 2500 3000 3500 4000 4500 5000
Ap
par
ent A
dso
rpti
on
(m
g/g
)
[DETPMP] (ppm)
DETPMP-Siderite Static Adsorption/Compatibility TestDETPMP Ads Isotherm onto Siderite at pH4 & 95°C
10g Siderite
20g Siderite
30g Siderite
Figure 4.49: DETPMP-Siderite Static Adsorption/Compatibility Test. DETPMP
Adsorption Isotherm onto different masses of siderite at pH4 & 95°C.

Chapter 4: Establishing Retention Mechanisms Through Static Compatibility and Coupled Adsorption/
Precipitation Experiments
109
0
50
100
150
200
250
0 20 50 100 500 1500 4000 10000 15000
Cha
nge
in [F
e3
+] (
ppm
)
[DETPMP] (ppm)
DETPMP-Siderite Static Adsorption/Compatibility TestChange in [Fe3+] after 24 hrs heating and filtration process, pH4 & 95°C
delta[Fe3+] - 20g …
Figure 4.50: DETPMP-Siderite Static Adsorption/Compatibility Test (10g, 20g & 30g
siderite). Change in [Fe3+
] vs [DETPMP].
To further establish the pure adsorption and coupled adsorption/precipitation behaviour,
changes of [phosphorous], [Ca2+
] and [Mg2+
] concentration in the mixture of SI and
NFFW solution in both adsorption and compatibility test were observed. Any divalent
ion level above stock solution concentration is not expected or must be within its
analytical error of less than 5%. The decrease in the solution divalent ion levels are due
to either precipitation of M-DETPMP complex or involvement of the divalent ions in
the pure adsorption process (e.g. by cation bridging). The change in [Li+] is also
observed to establish if any evaporation takes place. There should not be any changes in
[Li+] as it is an inert tracer ion which does not react with DETPMP SI or adsorb onto
sand. The %evaporation was used to correct the increase in concentration for all the
other elements involved.
Figure 4.51, Figure 4.52 and Figure 4.53 show the differences in the solution levels of
[phosphorous], [Ca2+
] and [Mg2+
] for both compatibility and adsorption tests. The
differences in the amounts in each test show that regions of pure adsorption and couple
adsorption/precipitation occur in different SI concentration regions. It is known that
Ca2+
and Mg2+
ions do not significantly adsorb* onto siderite, so the differences are
probably due to cation bridging of phosphorous to Ca2+
and Mg2+
ions onto the siderite.

Chapter 4: Establishing Retention Mechanisms Through Static Compatibility and Coupled Adsorption/
Precipitation Experiments
110
[*NB however, there may be some ion exchange of Ca2+
and Mg2+
ions onto the
rock/mineral surface but this is not a large effect for siderite and is even less for pure
quartz sand]. It is also noted that in almost all cases, there is an increase in [Ca2+
] and
[Mg2+
] ions, which is not expected, but they are all within its analytical error of less
than 5%. Even changes in [Li+] are observed for all the cases, but again, they are within
its analytical error of less than 5%. Apart from the analytical error, slight evaporation
was observed in these tests which was corrected for.
Figure 4.51 shows the change in phosphorous ion concentrations for both compatibility
and adsorption tests. Figure 4.51 shows that phosphorous starts adsorbing onto siderite
even at a low concentration of 20ppm for the different masses of siderite used, where
the difference between the stock solution and the filtrate is about 15 to 20ppm as the
mass of siderite increases from 10g, 20g and 30g siderite. As the concentration of
DETPMP SI increases from 20ppm to 15000ppm, the changes in phosphorous ions also
increase to show more precipitation. At stock concentration of 15000ppm DETPMP;
about 9000ppm to 11800ppm of DETPMP is lost from solution by precipitation (clearly
due to the m/V dependence and also the very high apparent adsorption value). Thus, it
appears that we are observing pure adsorption in the DETPMP/siderite system up to
[SI] ~500ppm, before going into coupled adsorption/precipitation region for [SI] >
500ppm.
Figure 4.52 shows the change in Ca2+
ion concentrations for both compatibility and
adsorption tests. Ca2+
ions start to show a significant reduction from 4000ppm and they
are further reduced at 15000ppm. The reduction in Ca2+
increases as the mass of siderite
increases. For the compatibility tests, reduction in Ca2+
is also observed starting at 4000
ppm, but with less precipitation. The difference of Ca2+
ion in both experiments shows
that some must have precipitated and some bridged along with phosphorous onto the
mineral surface.
Figure 4.53 shows the change in Mg2+
ion concentrations for both compatibility and
adsorption tests. Referring to adsorption tests at 10g to 30g siderite; the figure shows
that significant changes can only be seen at 10000ppm for all the masses of siderite

Chapter 4: Establishing Retention Mechanisms Through Static Compatibility and Coupled Adsorption/
Precipitation Experiments
111
used. For compatibility test with no minerals, significant reduction is also observed at
10000ppm, but with a lower amount of precipitation. Again, the difference in these
experiments only proves that some calcium precipitated and some bridged along with
phosphorous(SI). The results show that only at 10000ppm onward, Mg2+
ion starts
bridge along with phosphorous and adsorb/precipitate onto siderite minerals.
Figure 4.54 shows the change in Li+ ion concentration. Li
+ is an inert tracer ion and
there should not be any adsorption or precipitation. It is analysed to see if there was any
evaporation. Base on the figure, there is an increase of 1% to 3% in Li+ concentration,
which is due to slight evaporation apart from analytical error. The evaporation % factor
was taken into account for all the calculation made for all the other elements involved.
-14000
-12000
-10000
-8000
-6000
-4000
-2000
0
2000
0 20 50 100 500 1500 4000 10000 15000
Ch
an
ge
in [
P]
(pp
m)
[DETPMP] (ppm)
DETPMP-Siderite Static Adsorption/Compatibility TestChange in [P] after 24 hrs heating and filtration process, pH4 & 95°C
delta[P] - Compatibility
delta[P] - 10g Siderite
delta[P] - 20g Siderite
delta[P] - 30g Siderite
Figure 4.51: DETPMP-Siderite Static Adsorption/Compatibility Test (10g, 20g & 30g
siderite). Change in [P] vs [DETPMP].

Chapter 4: Establishing Retention Mechanisms Through Static Compatibility and Coupled Adsorption/
Precipitation Experiments
112
-1200
-1000
-800
-600
-400
-200
0
200
400
0 20 50 100 500 1500 4000 10000 15000
Ch
an
ge
in [
Ca
2+]
(pp
m)
[DETPMP] (ppm)
DETPMP-Siderite Static Adsorption/Compatibility TestChange in [Ca2+] after 24 hrs heating and filtration process, pH4 & 95°C
delta[Ca2+] - Compatibility
delta[Ca2+] - 10g Siderite
delta[Ca2+] - 20g Siderite
delta[Ca2+] - 30g Siderite
[Ca] = 2000ppm
Figure 4.52: DETPMP-Siderite Static Adsorption/Compatibility Test (10g, 20g & 30g
siderite). Change in [Ca2+
] vs [DETPMP].
-200
-100
0
100
200
300
400
0 20 50 100 500 1500 4000 10000 15000Ch
an
ge
in [
Mg
2+]
(pp
m)
[DETPMP] (ppm)
DETPMP-Siderite Static Adsorption/Compatibility TestChange in [Mg2+] after 24 hrs heating and filtration process, pH4 & 95°C
delta[Mg2+] - Compatibility
delta[Mg2+] - 10g Siderite
delta[Mg2+] - 20g Siderite
delta[Mg2+] - 30g Siderite
[Mg] = 739ppm
Figure 4.53: DETPMP-Siderite Static Adsorption/Compatibility Test (10g, 20g & 30g
siderite). Change in [Mg2+
] vs [DETPMP].

Chapter 4: Establishing Retention Mechanisms Through Static Compatibility and Coupled Adsorption/
Precipitation Experiments
113
-25
-20
-15
-10
-5
0
5
10
15
20
25
0 20 50 100 500 1500 4000 10000 15000
Ch
an
ge
in [
Li+]
(pp
m)
[DETPMP] (ppm)
DETPMP-Siderite Static Adsorption/Compatibility TestChange in [Li+] after 24 hrs heating and filtration process, pH4 & 95°C
delta[Li+] - Compatibility
delta[Li+] - 10g Siderite
delta[Li+] - 20g Siderite
delta[Li+] - 30g Siderite
[Li] = 50ppm
Figure 4.54: DETPMP-Siderite Static Adsorption/Compatibility Test (10g, 20g & 30g
siderite). Change in [Li+] vs [DETPMP].
After filtration, all the filter papers were dried, weighed, photographed and sent for
ESEM-EDAX analysis. The sample solutions were measured for pH. The weights of the
various samples that precipitated out of the solutions and the corresponding
photographed filter papers after filtration are shown in Figure 4.55. Only at 1500ppm
and above do we clearly see differences in both the weight and the appearance of
precipitate. As the concentration increases, the weight of filter paper also increases as
expected and more significant precipitates can be seen clearly on the filter papers. These
results are very consistent with observations (above) on the amount of phosphorous,
Ca2+
ions and Mg2+
ions that were measure in the filtered samples, which is less than in
the stock solutions. The results proves that precipitation took place from 1500ppm
onward.

Chapter 4: Establishing Retention Mechanisms Through Static Compatibility and Coupled Adsorption/
Precipitation Experiments
114
DETPMP Weight of Ppt
Conc.
(ppm) (g)
0 0.02
20 0.02
50 0.02
100 0.02
500 0.02
1500 0.04
4000 0.14
10000 0.42
15000 0.60
Blank 20ppm
50ppm100ppm
500ppm 1500ppm
4000ppm 10000ppm
15000ppm
Figure 4.55: DETPMP-Siderite Static Adsorption/Compatibility Test. Precipitates on
filter papers and weight of precipitates at different concentrations of DETPMP.
Table 4.10 and Figure 4.56 show ESEM-EDAX atomic percentage and photographed
samples of phosphorous, Ca2+
, Mg2+
and other ions presents on the filter papers. For
each concentration, two points were taken for analysis. The hazy black background was
identified as being the filter paper itself, the solid white marks are the salts and the hazy
white background is due to the compound of phosphorous, Ca2+
and Mg2+
ions. The
blank samples without any SI show only filter paper and some salts on them. Based on
the atomic % from ESEM-EDAX, there is no phosphorous compound identified below
500ppm, but traces and variable values of Ca2+
and Mg2+
ions are identified. It must be
noted that the EDAX signals are localized and inaccurate values are expected. Only
when it reaches 1500ppm and above, was a clear hazy white background seen on the
filter paper samples, which is identified to be phosphorous, Ca2+
and Mg2+
ions based
on EDAX. Above 1500ppm SI concentration, based on the atomic %, phosphorous,
Ca2+
and Mg2+
are seen consistently. Atomic% of phosphorous ranges from 10 to 11;
Ca2+
from 4 to 5 and Mg2+
about 1.5. The results prove the presence of phosphorous,
Ca2+
and Mg2+
as precipitates above 1500ppm.

Chapter 4: Establishing Retention Mechanisms Through Static Compatibility and Coupled Adsorption/
Precipitation Experiments
115
Blank (200x) 20ppm (1200x) 50ppm (250x)
100ppm (1000x) 500ppm (100x) 1500ppm (2500x)
4000ppm (1500x) 10000ppm (3500x) 15000ppm (2000x)
Figure 4.56: DETPMP-Siderite Static Adsorption/Compatibility Test. Morphology of
precipitates on ESEM photographed samples.
Element Wt % At % Wt % At % Wt % At % Wt % At % Wt % At % Wt % At % Wt % At % Wt % At % Wt % At %
C K 29.33 44.34 28.69 42.9 29.26 43.87 27.66 41.72
O K 8.17 13.94 12.32 20.22 6.5 11.17 7.5 12.92 4.82 8.53 30.14 34.2 31.38 35.23 31.33 35.27 32.89 37.24
NaK 36.6 43.49 36.95 42.21 38.78 46.39 35.82 42.97 35.77 44.04 1.3 1.02 1.75 1.36 1.82 1.42 1.94 1.52
MgK 2.19 1.63 2.06 1.52 2.03 1.51 2.12 1.58
SrL 2.66 0.55 2.99 0.61 3.05 0.63
P K 18.02 10.56 19.19 11.13 18.94 11.01 18.72 10.95
ClK 55.24 42.57 50.73 37.57 54.71 42.44 56.69 44.1 59.4 47.43 4.63 2.37 4.48 2.27 3.29 1.67 3.56 1.82
CaK 11.75 5.32 12.45 5.58 10.34 4.65 10.06 4.55
Total 100 100 100 100 100 100 100 100 100 100 100 100 100 100 100 100 100 100
4000ppm 10000ppm 15000ppmBlank 20ppm 50ppm 100ppm 500ppm 1500ppm
Table 4.10: DETPMP-Siderite Static Adsorption/Compatibility Test. EDAX signals on
the precipitates from ESEM.

Chapter 4: Establishing Retention Mechanisms Through Static Compatibility and Coupled Adsorption/
Precipitation Experiments
116
4.6 SUMMARY AND CONCLUSIONS
Scale inhibitor retention within the reservoir formation is the main feature which
governs the lifetime of a scale inhibitor squeeze treatment. In this part of the work, we
present the results on our coupled (static) adsorption/precipitation experiments using
two phosphonate scale inhibitors, namely DETPMP and OMTHP, and three types of
minerals, e.g. sand, kaolinite and siderite.
In this chapter, we studied the possible SI retention mechanisms onto rocks due to either
pure adsorption (Γ) or by coupled adsorption/precipitation (Γ/Π). The theory
describing pure adsorption and coupled adsorption/precipitation processes has been
summarised. We performed various series of carefully designed experiments on
DETPMP and OMTHP SIs onto sand, kaolinite and siderite. This theory suggested a
way of analysing static adsorption results for Γapp vs. [SI] at various (m/V) ratios (i.e.
[SI] is the final level after adsorption has occurred, [SI] = c1f – see above). When all
these Γapp/c1f curves for different (m/V) ratios collapse onto a single curve, then this
indicates pure adsorption (Γ). However, when these curves diverge for different values
of (m/V), then coupled adsorption/precipitation (Γ/Π) is being observed. Thus,
experimentally, we are sure when the system exhibits either pure adsorption only or it is
in the coupled adsorption/precipitation regime.
Two SIs, namely DETPMP (a penta-phosphonate) and OMTHP (a hexa-phosphonate)
have been studied in a series of adsorption/precipitation experiments at a range of (m/V)
ratios. A fixed volume of SI solution has been used in all experiments (V = 0.08L) with
different masses of sand, kaolinite and siderite as adsorbent; m = 10g, 20g & 30g
samples of each minerals were used to investigate this theory. The analysis of these is
assisted by using the solution ion data – particular the effect of adsorption/precipitation
on the [Ca] and [Mg] levels in solution. ESEM-EDAX analysis is also used to establish
the presents of phosphorous, calcium and magnesium in the deposits (although this is
not a quantitatively accurate technique). The brine used in this work was a synthetic
Nelson Forties Formation Water (NFFW) with the composition given in Table 4.1;
NFFW has [Ca2+
] = 2000ppm and [Mg2+
] = 739 ppm and all experiments were
performed at pH 4 and T = 95°C.

Chapter 4: Establishing Retention Mechanisms Through Static Compatibility and Coupled Adsorption/
Precipitation Experiments
117
4.6.1 DETPMP and OMTHP Scale Inhibitors onto SAND Mineral
At pH 4 and T = 95°C, both pure adsorption and coupled adsorption/precipitation
regions were observed for DETPMP and OMTHP onto sand mineral in NFFW. Based
on the “apparent adsorption” isotherm figures at various (m/V) ratios, only pure
adsorption was observed below ~750ppm and coupled adsorption/precipitation
behaviour was observed above ~750ppm for all the (m/V) ratios used for both SIs. For
each (m/V) ratio, the isotherm curves plateau at a level of ~ 0.25mg/g and 0.30mg/g for
DETPMP and OMTHP respectively at ~750ppm. Above ~750ppm, the “apparent
adsorption” isotherm curves deviate for different (m/V) ratios, clearly indicative of
coupled adsorption/precipitation. That is, below ~750ppm, the measured adsorption
isotherms are independent of the (m/V) ratio and all collapse onto one curve. Whereas,
above ~750ppm, the “apparent adsorption” isotherm depends on the (m/V) ratio, where
the curves branches out independently at the different mass used. This is precisely in
line with theory in terms of the qualitative observed behaviour.
The levels of pure adsorption seen in the lower SI concentration region for both
phosphonates are ~0.2 – 0.3 mg/g and this is quite consistent with the lower adsorptive
capacity of quartz and the low surface area of this sand (size range ~80 – 400µm). In
the coupled adsorption/precipitation region, the apparent adsorption values rang
e from ~2 – 12mg/g and these much higher levels are certainly too high for pure
adsorption of DETPMP or OMTHP onto low surface area quartz sand.
A significant reduction is observed in [phosphorous], [Ca2+
] and [Mg2+
] as the
concentration of SI increases in both bulk solution and in the adsorption experiments for
both SIs. This M2+
reduction in solution is mainly associated with the precipitation of a
M2+
-DETPMP complex. This has been analysed by ESEM EDAX in all cases and this
is clearly a Ca/Mg-DETPMP precipitated complex (Ca, Mg and P are all seen in the
EDAX signal).
These results on the coupled adsorption/precipitation of DETPMP and OMTHP SIs
onto sand agree very well with the theory.

Chapter 4: Establishing Retention Mechanisms Through Static Compatibility and Coupled Adsorption/
Precipitation Experiments
118
4.6.2 DETPMP and OMTHP Scale Inhibitors onto KAOLINITE Mineral
The DETPMP /kaolinite system again shows clear regions of pure adsorption (Γ) and
coupled adsorption/precipitation (Γ/Π) at pH4 and T=95°C. Based on the “apparent
adsorption” isotherm figures (Γapp vs. [SI]) at various (m/V) ratios, pure adsorption was
observed below [SI] ~800ppm and coupled adsorption/precipitation behaviour was
observed above ~800ppm. That is, below ~800ppm, the measured adsorption isotherms
are independent of the (m/V) ratio and all collapse onto one curve. Whereas, above
~800ppm, the “apparent adsorption” isotherm depends on the (m/V) ratio, as discussed
above. This conclusion is further strengthen by the observed changes in phosphorous
(SI) concentration, where clear reduction in phosphorous (SI) was seen at ~800ppm and
phosphorous was also found in precipitates base on the EDAX signal at 800ppm.
From the Γapp vs. [SI] curves for the OMTHP/kaolinite system, it is less clear where the
transition occurs between the s pure adsorption and coupled adsorption/precipitation
regions at pH4 and T=95°C although both are present. However, these regions are
better defined by considering the observed difference in the amounts of phosphorous
concentration in solution since these results show that clear adsorption and coupled
adsorption/precipitation regions occur. Up to [SI] ~ 500ppm, a region of pure adsorption
is observed for this system and for [SI] > 500ppm, coupled adsorption/precipitation is
observed. This finding is further strengthened by from the filtered precipitate and
ESEM-EDAX data. It is thought that the reason for the less clear transition between
the two regions of Γ and Γ/Π is due to the very high levels of DETPMP pure adsorption
onto the kaolinite due to its very high specific surface area. Both DETPMP and
OMTHP SIs show pure adsorption levels onto kaolinite minerals between Γ ~ 7 to 13
mg/g at 800ppm SI.
Significant reduction is also observed in both [Ca2+
] and [Mg2+
] as the concentration of
SI increases in coupled adsorption/precipitation experiments both SIs. This M2+
reduction in solution is mainly associated with the precipitation of a M2+
-
DETPMP/OMTHP complex. This has been analysed by ESEM EDAX in some cases
and this is clearly a Ca/Mg-DETPMP/OMTHP precipitated complex (Ca, Mg and P are
all seen in the EDAX signal).

Chapter 4: Establishing Retention Mechanisms Through Static Compatibility and Coupled Adsorption/
Precipitation Experiments
119
4.6.3 DETPMP Scale Inhibitor onto SIDERITE Mineral
For the DETPMP/siderite system, results similar to those for the OMTHP/kaolinite
system are observed where the transition between pure adsorption and coupled
adsorption/precipitation is not clear, although both regions are observed. From the
compatibility and adsorption tests, it appears that pure adsorption is observed up to [SI]
~500ppm, and at higher concentrations, then coupled adsorption/precipitation is
observed. This finding is further strengthened by the filtered precipitate and ESEM-
EDAX results. Again, the reason for the less clear transition observed for the
DETPMP/siderite system maybe due to both (i) the high levels of adsorption of the
DETPMP onto the siderite, and also (ii) the role of the higher levels of [Fe3+
] released in
these lower pH (pH 4) experiments. At 1500ppm, 25ppm [Fe3+
] was observed in the
bulk solution while at 15000ppm, 200ppm [Fe3+
] was found (see Figure 4.50). .
Again, significant reductions were observed in both [Ca2+
] and [Mg2+
] as the
concentration of SI increases in coupled adsorption/precipitation experiments for the
DETPMP/siderite system. This M2+
reduction in solution is mainly associated with the
precipitation of a M2+
-DETPMP complex and this has been confirmed by ESEM
EDAX.

120
CHAPTER 5: NON-EQUILIBRIUM SAND PACK EXPERIMENTS
ON OMTHP SCALE INHIBITOR APPLIED IN BOTH
ADSORPTION AND PRECIPITATION TREATMENTS
5.1 INTRODUCTION
In a scale inhibitor squeeze treatment, it is known that adsorption/desorption (Vetter,
1973; Meyers et al., 1985; Yuan et al., 1993; and Sorbie et al., 1993) or a
precipitation/dissolution (Yuan et al., 1993; Carlberg, 1983, 1987; and Olson et al.,
1992) (phase separation) mechanism governs the interaction between the scale inhibitor
and the formation rock system. Previous work has demonstrated that the adsorption
isotherm, Γ(C) (Sorbie et al., 1992; Hong and Shuler, 1987; and Jordan et al., 1997)
governs the inhibitor/rock interaction for adsorption/desorption inhibitor squeeze
processes. This adsorption isotherm is the key parameter required for successful
modelling of both core flood returns and also field treatment design using computer
codes such as SQUEEZE V. On the other hand, in the precipitation squeeze mechanism
two factors govern the return curve, viz. the solubility (Cs) of the inhibitor-calcium
complex and the rate of dissolution (r4) of the precipitation complex (Yuan et al., 1993;
Jordan et al., 1997; and Malandrino et al., 1995). The dissolution rate effect implies that
the steady state concentration level in the returns depends on the local fluid velocity as
it sweeps over the rock containing the surface precipitated complex. This local velocity
depends on the depth of penetration of the precipitated slug into the radial near well
formation, which therefore affects the level of inhibitor concentration in the return
curves. A simple model for this process has been developed within FAST and this will
be published in the near future (“Sorbie –personal communication, June 2011”).
Non-equilibrium adsorption/desorption (Bourne et al., 1992) and non-equilibrium
inhibitor return behaviour during precipitation/dissolution (phase separation) core
flooding experiments of a phosphonate based scale inhibitor on limestone material
(Lawless et al., 1994) have been published previously. The reported results demonstrate
that the actual inhibitor desorption process occurring under the conditions tested is a

Chapter 5: Non-Equilibrium Sand Pack Experiments on OMTHP Scale Inhibitor Applied in Both
Adsorption and Precipitation Treatments
121
non-equilibrium process, whereby the concentration of scale inhibitor in the post flush
effluent is affected by the post flush flow rate.
In this current study, we designed a set of variable rate adsorption and precipitation sand
pack flooding experiments using OMTHP scale inhibitor under a range of carefully
controlled similar conditions. Very comprehensive dynamic flood data was measured in
order to extend our understanding both of inhibitor adsorption/desorption and the
precipitation/dissolution processes including non-equilibrium systems. From the results
obtained in this study, very clear non equilibrium effects are apparent for OMTHP scale
inhibitors, when applied both as adsorption and coupled adsorption/precipitation
treatments. Furthermore, the effect on post flush effluent inhibitor concentration is in
the same direction for each system under tests, i.e. reduced flow rate leads to higher
effluent concentrations and vice versa. The extent and quality of this dataset make it the
most complete available to date for modelling studies.
5.2 EXPERIMENTAL DETAILS
As mentioned earlier, the unique feature of this series of floods is that the bulk coupled
adsorption/precipitation behaviour of this system (OMTHP/sand) has been fully
characterized in previous bulk work and further extended in this pack flooding work.
Therefore, we know precisely when the system is in the adsorption only or in the
coupled adsorption/precipitation regime.
In Chapter 4, all the bulk static compatibility and adsorption tests were conducted at
95°C; whereas, in this work, they were conducted at room temperature. It must be noted
that all main treatments were carried out at room temperature.
In chronological order, the following experiments were conducted to give a systematic
approach to the study of these adsorption and adsorption/precipitation phenomena:
1. Static Compatibility/Adsorption Test @ room temperature
2. Sand Pack A: Dynamic Precipitation Flood –Singe Flow rate
3. Sand Pack C: Dynamic Precipitation Flood – Multi Flow rate

Chapter 5: Non-Equilibrium Sand Pack Experiments on OMTHP Scale Inhibitor Applied in Both
Adsorption and Precipitation Treatments
122
4. Sand Pack D: Dynamic Precipitation Flood – Multi Flow rate with Solubility
Effect
5. Static Compatibility Test @ 95°C designed for Sand Pack E
6. Sand Pack E: Low Concentration Adsorption Flood – Multi Flow rate
7. *Static Compatibility Test @ 95°C designed for Sand Pack F
8. Sand Pack F: High Concentration Adsorption Flood – Multi Flow rate
9. *Static Compatibility Test @ 95°C designed for Sand Pack G
10. Sand Pack G: Medium-High Concentration Adsorption Flood – Multi Flow rate
Notes: *This Static Compatibility Test @ 95°C uses a different brine composition,
where [Ca2+
] is 428ppm; whereas, in other experiments [Ca2+
] is 2000ppm. Sand Packs
F and G utilize this brine composition in their flood experiments.
5.2.1 Materials
Adsorbents: Silica sand was chosen as the mineral adsorbent since it replicates a
simple model of a sandstone formation and the results are also reproducible. The sand
used in these experiments is commercially available (BDH GPR, 150-300mesh). A
Malvern Master Particle Size Analyzer was used to analyze the sand. The particle size is
less than 300 µm with a distribution mode of 253 µm. Refer to Chapter 4 for details on
size of particles and elements in the sand which were obtained from particle size
analyzer (PSA) and X-Ray Diffraction (XRD). It has been reported that the surface of
hydroxylated amorphous silica, which plays an important role in adsorption of inhibitor,
is negatively charged at pH 4 (Lecourtier et al., 1981 and Iler, 1979). Experimental
results show that this sand has a point of zero charge (pzc), which carry the same SiOH
group on the surface which is between pH ~ 1.5 (Lecourtier et al., 1981) and ~2 (Iler,
1979). The concentration of negative surface charge increases as the pH increases. Core
minerals are not used because they show complex petrography effects and the results
are not easily reproducible.
Adsorbate: The adsorbate or scale inhibitor (SI) used in this work is Octa-methylene-
tetramine hexa (methylene-phosphonic acid) or OMTHP, which is a hexa-phosphonate.
This is one of a range of commercial products used in oilfield applications (Briquest

Chapter 5: Non-Equilibrium Sand Pack Experiments on OMTHP Scale Inhibitor Applied in Both
Adsorption and Precipitation Treatments
123
684-30S). The typical active content is 30%. The structure is shown in Figure 5.1. Refer
to Chapter 4 and Appendix for details of OMTHP SI properties and MSDS. All SI
concentrations including lithium tracers were prepared in the standard Synthetic NFFW
and pH adjusted to pH4. Inductive Coupled Plasma (ICP) analytical method (Water
Analysis Handbook, 1989) was used in this study and we are able to assay down to
1ppm (±0.2ppm). Results from different concentration and inhibitors floods using the
phosphonate inhibitor in outcrop sandstone core were presented in a previous paper
(Sorbie et al., 1992) and other workers have reported work on this material (Meyers et
al., 1985; Sorbie et al., 1993; Przybylinski, 1989; and Kan et al., 1991, 1992).
Brine: The brine solution used in the experiment is Synthetic Nelson Forties Formation
Water (NFFW), which is prepared by dissolving appropriate quantity of salts in distilled
water. The composition is given in Table 5.1. The synthetic brine used in this study is
sulphate free formation water, which is used to prevent any precipitation due to barium
sulphate. For this study, it is important not to have other form of precipitation except SI
related precipitation. The brine solution was filtered through 0.45µm filter paper and
degassed overnight prior to use. 0.45µm filter paper is commonly used by the industry
to filter water sample to allow for adequate filtration of suspended solid content in the
water (Patton, Oilfield Water System, 1977).
This brine was used to make all SI concentration; whereas, the post-flush or back
production stage was carried out with the same brine but excluding Li+ ion. For both
purposes, the brine was degassed under vacuum and pH adjusted to pH4.

Chapter 5: Non-Equilibrium Sand Pack Experiments on OMTHP Scale Inhibitor Applied in Both
Adsorption and Precipitation Treatments
124
Ion Conc. Comp
(ppm) g/l g/5L g/10L g/15L g/20L
Na+
31275 NaCl 79.50 397.50 795.00 1192.50 1590.01
Ca2+
2000 CaCl26.H20 10.93 54.66 109.32 163.98 218.64
Mg2+
739 MgCl2.6H20 6.18 30.90 61.80 92.69 123.59
K+
654 KCl 1.25 6.23 12.47 18.70 24.94
Ba2+
269 BaCl2.2H2O 0.48 2.39 4.78 7.18 9.57
Sr2+
771 SrCl2.6H2O 2.35 11.73 23.46 35.19 46.92
SO4-2
0 Na2SO4 0.00 0.00 0.00 0.00 0.00
Li+
50 LiCl 0.305 1.53 3.05 4.58 6.11
Cl-
50000
Actual Cl ppm 55278.64
If CaCl2.2H2O is used 7.32 36.62 73.25 109.87 146.49
TDS = 91036.64 ppm
Mass
Table 5.1: Synthetic Nelson Forties Formation Water (NFFW) Composition
5.2.2 Experimental Apparatus
Schematic diagram of the sand pack flooding apparatus is shown in Figure 5.2. The
apparatus was designed to carry out low pressure flood experiments, as opposed to core
flood apparatus which is designed to tackle high pressure and high temperature core
floods. The adsorption column, fittings and tubing were supplied by Anachem. The sand
N N
N N
P
P P P
P
O O
O
O
H O
O H
H O
O H
H O
O H
O H
H O
O H O
O H P
O O H
H O
Figure 5.1: Chemical Structure of Scale Inhibitor – Octa-methylene-tetramine hexa
(methylene-phosphonicn acid) - OMTHP
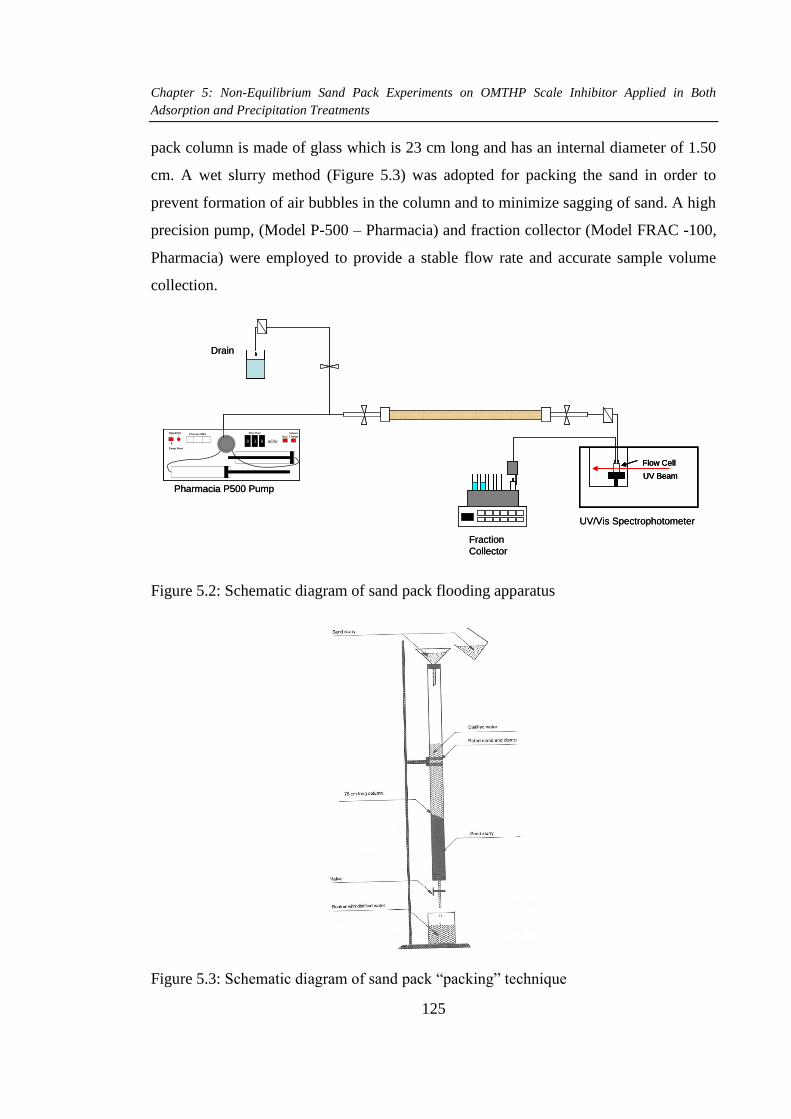
Chapter 5: Non-Equilibrium Sand Pack Experiments on OMTHP Scale Inhibitor Applied in Both
Adsorption and Precipitation Treatments
125
pack column is made of glass which is 23 cm long and has an internal diameter of 1.50
cm. A wet slurry method (Figure 5.3) was adopted for packing the sand in order to
prevent formation of air bubbles in the column and to minimize sagging of sand. A high
precision pump, (Model P-500 – Pharmacia) and fraction collector (Model FRAC -100,
Pharmacia) were employed to provide a stable flow rate and accurate sample volume
collection.
0 3 0 ml/hr
Max P Set Flow Rate
Run
Solvent
ChangePressure MPa
Pump Reset
0 3 0 ml/hr
Max P Set Flow Rate
Run
Solvent
ChangePressure MPa
Pump Reset
UV/Vis Spectrophotometer
UV Beam
Flow Cell
Pharmacia P500 Pump
Fraction
Collector
Drain
0 3 0 ml/hr
Max P Set Flow Rate
Run
Solvent
ChangePressure MPa
Pump Reset
0 3 0 ml/hr
Max P Set Flow Rate
Run
Solvent
ChangePressure MPa
Pump Reset
UV/Vis Spectrophotometer
UV Beam
Flow Cell
UV Beam
Flow Cell
Pharmacia P500 Pump
Fraction
Collector
Drain
Figure 5.2: Schematic diagram of sand pack flooding apparatus
Figure 5.3: Schematic diagram of sand pack “packing” technique

Chapter 5: Non-Equilibrium Sand Pack Experiments on OMTHP Scale Inhibitor Applied in Both
Adsorption and Precipitation Treatments
126
5.2.3 Experimental Procedure
The whole set of experiments in this chapter was executed systematically from bulk
static to dynamic sand pack tests. Many of the static experiments were conducted
previously and these have been reported in Chapter 4. In this chapter, we perform some
further static experiments (mainly at room temperature) in order to understand what the
conditions are for certain dynamic experiments, in terms of being able to clearly define
when adsorption and coupled adsorption/precipitation are occurring.
Sand Pack Characterization- Dead Volume and Pore Volume/Porosity
Measurement: Before each sand pack experiment, dead and pore volume (and porosity
by calculation) must be measured. A similar setup as for the sand pack experiments is
required to perform these measurements. For dead volume measurements, no sand was
introduced into the sand pack; whereas for pore volume/porosity measurements, sand
was introduced and the same pack was used for the rest of each experiment. Although
the packing method and its results are known to be reproducible (Sorbie et al., 1993),
each flood went through dead and pore volume/porosity measurements to ascertain the
reproducibility of these quantities. Table 5.2 shows the sand pack characterization for
all the sand pack experiments. The diameter is exactly the same for all but the length
differs slightly due to how tightly they were packed in the column. As shown from the
results, the dead and pore volume/ porosity are very similar to each other, which show
the reproducibility of the methodology to pack the sand. Based on these parameters and
sand density (ρ= 2.65 g/cm3), the sand weight is calculated.
Sand Pack ID A C D E F G
Length (cm) 20.05 20.50 20.40 20.40 20.70 20.9
Diameter (cm) 1.5 1.5 1.5 1.5 1.5 1.5
Dead Volume (ml) 1.54 1.54 1.24 1.34 1.34 1.34
Pore Volume (ml) 13.64 14.69 14.73 14.60 14.66 14.11
Porosity (%) 38.49 40.52 40.85 40.87 40.06 38.21
Sand Wt. (g) 93.58 95.68 95.21 95.21 96.61 97.87
Table 5.2: Sand Pack Characterization Results

Chapter 5: Non-Equilibrium Sand Pack Experiments on OMTHP Scale Inhibitor Applied in Both
Adsorption and Precipitation Treatments
127
Flood Procedures: After the measurement of dead and pore volume/porosity, the sand
pack was conditioned by flushing with NFFW brine (no Li+) overnight before any
measurements were taken. This is to make sure that the sand pack is fully saturated with
only NFFW brine, as such there is no unwanted materials that would cause uncontrolled
adsorption or precipitation. The methodology for adsorption and precipitation floods is
the same for all the experiments. The only experimental differences between the
adsorption and precipitation floods are in the applied concentration of SI chosen and the
calcium level in the main treatment. As for the post flush, the presence and/or amount of
calcium were different and the flow rates were changed accordingly, depending of the
objective for that specific flood. In each flood, the flow was stopped for at least 24
hours at 95°C between each flow rate from main treatment to end of the post flush.
Table 5.3 gives the main experimental details for all sand pack experiments.
Sand Pack
ID
Flood Type
Main Treatment Shut-In Post Flush
[SI] (ppm)
[Ca] (ppm)
pH T (°C)
Q (ml/hr)
T (°C)
T (hrs)
T (°C) Q (ml/hr)
[Ca] (ppm)
SP-A
Pptn
4000
2000
4
20
20
95
>20
95
20
2000
SP-C
Pptn
4000
2000
4
20
20
95
>20
95
20 10 5 5 2
2000 2000 2000 2000 2000
SP-D
Pptn
4000
2000
4
20
20
95
>20
95
20 20 10 5 2
2000
0 0 0 0
SP-E
Ads
500
2000
4
20
20
95
>20
95
20 10 5 2
2000 2000 2000 2000

Chapter 5: Non-Equilibrium Sand Pack Experiments on OMTHP Scale Inhibitor Applied in Both
Adsorption and Precipitation Treatments
128
SP-F
Ads
4000
428
4
20
20
95
>20
95
20 10 5 2
428 428 428 428
SP-G
Ads
2000
428
4
20
20
95
>20
95
20 10 5 2
428 428 428 428
Table 5.3: Sand Pack Experimental Details and Chronologies of Injection
For all the precipitation floods, namely SP-A, SP-C and SP-D; during the main
treatment, the SI and calcium concentrations are set at, [OMTHP] = 4000ppm and
[Ca2+
] = 2000ppm. Whereas, for the adsorption floods, SI and calcium concentration
were set at [OMTHP] = 500ppm and [Ca2+
] = 2000ppm for sand pack (SP-E);
[OMTHP] = 4000ppm and [Ca2+
] = 428ppm for sand pack (SP-F) and [OMTHP] =
2000ppm and [Ca2+
] = 428ppm for sand pack (SP-G).
All main treatment SI solutions were adjusted to pH 4. The solutions were injected at
20ml/hr at room temperature thus ensuring that no precipitation took place during the
main treatment placement (this had already been established in the bulk jar tests).
Referring to chapter 4, detailed study has been conducted in static jar tests to define at
which condition (temperature, pH, and SI and calcium concentration) either adsorption
only or coupled adsorption/precipitation occurred. From the experimental results, it is
clear that no precipitation takes place at room temperature. After ~10 pore volumes of
SI injection, the sand pack inlet and outlet valves were closed and the whole pack was
put into a water bath and heated to 95°C. Once the temperature reaches 95°C, the whole
set up was left at this temperature for at least 24 hours. After the 24hrs heating at 95°C,
brine without lithium was injected as post flush.
Effluents from the main treatment and the subsequent post flush were collected at
regular intervals for analysis. The effluents were analyzed for SI, Ca2+
, Mg2+
and Li+
elements using Inductive Coupled Plasma (ICP). The relative positions of Lithium
tracer and SI effluents profile during the main treatment gave a direct indication of the

Chapter 5: Non-Equilibrium Sand Pack Experiments on OMTHP Scale Inhibitor Applied in Both
Adsorption and Precipitation Treatments
129
extent of SI retention either by adsorption or coupled adsorption/precipitation. Whereas,
the SI concentration during post flush indicates the amount of SI retrieved due to
desorption/dissolution that has occurred.
5.3 EXPERIMENTAL RESULTS AND DISCUSSION
Considering the rate of desorption and dissolution compared with the fluid flow rate
close to a well, it is evident that process often does not have sufficient time to reach
equilibrium. Whereas, when the fluid is stagnant for a long period, the fluid-rock system
has enough time to reach equilibrium which replicates static adsorption or desorption
test in the lab. These phenomena can be studied directly using dynamic sand pack
and/or static bulk adsorption/precipitation experiments. In sand pack experiments, the
process taking place, whether it is adsorption/desorption or precipitation/dissolution, is
likely to be a non-equilibrium or kinetic process. The non-equilibrium behaviour can be
seen as a change of inhibitor effluent concentration as the flow rate changes
(Malandrino et al., 1995; Bourne et al., 1992; and Lawless et al., 1994).
In order to study such non-equilibrium behaviour, dynamic sand pack experiments were
designed using well characterized silica sand, in which the post-flush was performed at
different flow rates. This chapter will summarize the results obtained from hexa-
phosphonate (OMTHP) SI in both kinetic adsorption and precipitation sand pack floods.
For this purpose, these experiments have been designed directly from static
experiments, which have mostly been described and reported in Chapter 4, but some
further results are presented in this section to ascertain the conditions for adsorption and
precipitation for certain cases. These experiments are very important before moving to
dynamic experiments as we must be sure whether we are performing an adsorption
flood or an adsorption/precipitation flood. The following sets of experiments were
designed to study these various retention processes in detail. Details and chronologies of
these experiments can be found in experimental details, which are elaborated in this
section individually.

Chapter 5: Non-Equilibrium Sand Pack Experiments on OMTHP Scale Inhibitor Applied in Both
Adsorption and Precipitation Treatments
130
5.3.1 Static Adsorption/Compatibility Study at Room Temperature
Prior to conducting the non-equilibrium sand pack studies, some additional static
compatibility/adsorption tests were conducted at room temperature. This is to make sure
that there is no precipitation taking place at room temperature but only pure adsorption.
Main treatments for all the sand pack study were carried out at room temperature, which
is why this part of the study was carried out.
A stock solution at 10,000ppm OMTHP in NFFW was prepared. At this concentration,
the OMTHP SI is not fully dissolved and is whitish in colour. When left for a few hours,
it starts to precipitate. The solution was then diluted to attain the desired concentrations
of 500, 750, 1000, 2000, 3000, 4000 and 6000ppm which were used for adsorption and
compatibility experiments. pH was measured for all the stock solutions and adjusted to
pH4. Figure 5.4 shows the solutions before and after pH adjustment. Before pH was
adjusted to 4, it was seen that some tracers of precipitate at the lowest concentration of
500ppm. As the concentration increases, the amount of precipitate increases as well and
can be observed clearly. After pH adjustment to 4, all precipitates dissolved in the
solution except at 6000ppm. They are yellowish in colour from 1000ppm. Even after
24hrs, there were no changes taking place after the pH adjustment. The initial and
adjusted pH values are shown in Figure 5.5. The blank solution without any SI is at
pH6, whereas the other concentrations are between pH 4.7 to 4.9. The initial pH
decreases as the concentration increases to 6000ppm, which shows the acidic nature of
the OMTHP SI.
Immediately after the pH adjustment, samples at all concentrations were used in both
compatibility and adsorption tests. The adsorption tests were conducted with 10g and
20g silica sand. Figure 5.6 shows the adsorption isotherm onto sand at room
temperature after 24hrs. It is clearly observed that only adsorption is taking place up to
4000ppm stock solution of OMTHP. The adsorption of SI onto sand shows a plateau at
0.25mg/g. For both masses of sand used, only pure adsorption behaviour observed since
both results collapse onto a single line. If there was any precipitation, the lines would
deviate and branch out independently, as discussed and shown in the result in Chapter 4.
For pure adsorption, the behaviour is independent of (m/V) ration, whereas for coupled

Chapter 5: Non-Equilibrium Sand Pack Experiments on OMTHP Scale Inhibitor Applied in Both
Adsorption and Precipitation Treatments
131
adsorption/precipitation, the behaviour depends on the (m/V) ratio (i.e. V=0.08L and
m= 10g & 20g). Slight pH reduction (below pH4) also indicates that some SI was
absorbed onto sand (refer to Figure 5.5).
Figure 5.7, Figure 5.8, Figure 5.9 and Figure 5.10 show the change in concentration of
phosphorous, calcium, magnesium and lithium respectively after 24 hrs at room
temperature for these static compatibility and adsorption tests. Negative value indicates
adsorption or precipitation. In the compatibility tests, SI precipitation is only observed
at 6000ppm. Some slight calcium precipitation is seen but no loss of magnesium is
measured. If left at 95°C, calcium and magnesium would both show significant drops in
concentration based on the compatibility results in Chapter 4. The binding between
calcium and magnesium to SI to form a SI_M complex is not observed at room
temperature (or at least the complex is not insoluble). Lithium exhibits no change for all
concentrations, which indicates almost no evaporation or loss in fluids during the
experiments. For static adsorption test at 10g and 20g sand, phosphorous can been seen
to adsorb from the lowest stock concentrations from 500ppm onward. As in the
compatibility tests, calcium and magnesium were not seen adsorbing (or bridging along
with SI). Detail analysis of the absolute value of the differences in these elements show
slight adsorption.
After the static compatibility test, the filter papers were weighted and sent for ESEM-
EDAX analysis to find out if any precipitate present on the filter papers. Figure 5.11
shows the observation and weight of filter papers. Only at 6000ppm, clear precipitates
observed and change in weight measured. The remaining filtrate is yellowish in colour
from 500ppm and above, changing from light to dark yellow. Figure 5.12 shows ESEM-
EDAX analysis. ESEM pictures show phosphorous precipitate at 6000ppm and EDAX
table show clear presents of phosphorus on the filter paper. Very low amount of calcium
and magnesium are found at 6000ppm. At 4000ppm and below, only traces or zero
concentrations of phosphorous, calcium and magnesium were found on the filter paper.
These data prove that only pure adsorption is taking place at 4000ppm and below.

Chapter 5: Non-Equilibrium Sand Pack Experiments on OMTHP Scale Inhibitor Applied in Both
Adsorption and Precipitation Treatments
132
Blank 500ppm 750ppm 1000ppm 2000ppm 300ppm 400ppm 600ppm
[OMTHP] before pH adjustment
[OMTHP] after pH adjustment
[OMTHP] after pH adjustment & 24 hrs at room temperature
Figure 5.4: OMTHP SI from Blank to 6000ppm before and after pH adjustment, and
after 24 hrs at room temperature

Chapter 5: Non-Equilibrium Sand Pack Experiments on OMTHP Scale Inhibitor Applied in Both
Adsorption and Precipitation Treatments
133
3.7
4.2
4.7
5.2
5.7
0 1000 2000 3000 4000 5000 6000 7000
pH
[OMTHP] (ppm)
OMTHP Compatibility and Adsorption TestpH Measurement - Initial, Adjusted and Final
Inital
Adjusted
Compatibility
10g Sand
20g Sand
Figure 5.5: OMTHP from Blank to 6000ppm. Initial, Adjusted and Final pH
measurement
-0.2
0.0
0.2
0.4
0.6
0.8
1.0
0 500 1000 1500 2000 2500 3000 3500 4000
Ads
orpt
ion
(mg
/g)
[OMTHP] (ppm)
OMTHP Static Adsorption TestAds Isotherm onto Sand at RT & pH4
10g Sand
20g Sand
Figure 5.6: OMTHP Adsorption Isotherm onto Sand after 24 hrs at room temperature
and pH4

Chapter 5: Non-Equilibrium Sand Pack Experiments on OMTHP Scale Inhibitor Applied in Both
Adsorption and Precipitation Treatments
134
-200
0
200
400
600
800
1000
0 500 750 1000 2000 3000 4000 6000
Ch
an
ge
in [
P]
(pp
m)
[OMTHP] (ppm)
OMTHP Static Adsorption TestChange in [P] after 24 hrs, RT and pH4
delta[P]-Compatibility
delta[P]-10g Sand
delta[P]-20g Sand
Figure 5.7: OMTHP Static Compatibility and Adsorption Test. Change in [P] ion after
24 hrs at room temperature and pH4
-200
0
200
400
600
800
1000
0 500 750 1000 2000 3000 4000 6000
Ch
an
ge
in [
Ca
2+]
(pp
m)
[OMTHP] (ppm)
OMTHP Static Adsorption TestChange in [Ca2+] after 24 hrs, RT and pH4
delta[Ca2+]-Compatibility
delta[Ca2+] - 10g Sand
delta[Ca2+] - 20g Sand
[Ca] = 2000ppm
Figure 5.8: OMTHP Static Compatibility and Adsorption Test. Change in [Ca2+
] ion
after 24 hrs at room temperature and pH4

Chapter 5: Non-Equilibrium Sand Pack Experiments on OMTHP Scale Inhibitor Applied in Both
Adsorption and Precipitation Treatments
135
-200
0
200
400
600
800
1000
0 500 750 1000 2000 3000 4000 6000
Cha
nge
in [M
g2
+] (
ppm
)
[OMTHP] (ppm)
OMTHP Static Adsorption TestChange in [Mg2+] after 24 hrs, RT and pH4
delta[Mg2+]-Compatibility
delta[Mg2+] - 10g Sand
delta[Mg2+] - 20g Sand
[Mg] = 739ppm
Figure 5.9: OMTHP Static Compatibility and Adsorption Test. Change in [Mg2+
] ion
after 24 hrs at room temperature and pH4
-10.0
0.0
10.0
20.0
30.0
40.0
50.0
0 500 750 1000 2000 3000 4000 6000
Ch
an
ge
in [
Li+]
(pp
m)
[OMTHP] (ppm)
OMTHP Static Adsorption TestChange in [Li+] after 24 hrs, RT and pH4
delta[Li+]-Compatibility
delta[Li+] - 10g Sand
delta[Li+] - 20g Sand
[Li] = 50ppm
Figure 5.10: OMTHP Static Compatibility and Adsorption Test. Change in [Li+] ion
after 24 hrs at room temperature and pH4

Chapter 5: Non-Equilibrium Sand Pack Experiments on OMTHP Scale Inhibitor Applied in Both
Adsorption and Precipitation Treatments
136
[OMTHP] Weight of Ppt
(ppm) (g)
0 0.01
500 0.01
750 0.01
1000 0.01
2000 0.01
3000 0.01
4000 0.01
6000 0.04
Blank 500ppm 750ppm 1000ppm
2000ppm 3000ppm 4000ppm 6000ppm
Figure 5.11: OMTHP Static Compatibility Test. Filtrate picture and weight of
precipitate after filtration.
Blank (Zoom 2000x) 500ppm (Zoom 1500x) 750ppm (Zoom 6500x) 1000ppm (Zoom 5000x)
2000ppm (Zoom 2000x) 3000ppm (Zoom 5000x) 4000ppm (Zoom 1500x) 6000ppm (Zoom 800x)
Element Weight% Atomic% Weight% Atomic% Weight% Atomic% Weight% Atomic% Weight% Atomic% Weight% Atomic% Weight% Atomic%
- - - - - - - - - - - - - - -
C 40.57 50.53 30.51 45.37 35.75 51.73 31.77 47.95 21.69 37 25.5 37.71
O 45.08 42.15 26.36 29.43 19.4 21.07 21.44 24.29 22.3 40.45 17.82 22.83 35.99 39.96
Na 1.08 0.7 12.77 9.92 19.58 14.8 17.36 13.69 16.7 21.08 20.06 17.87 9.6 7.42
Al 0.96 0.53
Si 8.27 4.4
Mg 1.45 1.06
P 1.13 0.75 3.02 1.73
Cl 3.54 1.49 29.81 15.02 25.28 12.39 25.99 13.29 40.67 33.29 35.5 20.52 22.27 11.16
K 0.51 0.19 0 0
Ca 0.56 0.25 0.6 0.27 1.22 0.88 1.31 0.67 2.17 0.96
Sr 1.7 0.35 2.1 0.7
Ba 1.15 0.15 17.02 3.6 2.49 0.37
Totals 100 100 100 100 100 100 100
6000 ppmBlank 500 ppm 750 ppm 1000 ppm 2000 ppm 4000 ppm
Figure 5.12: OMTHP Static Compatibility Test. Filtrate ESEM-EDAX results.

Chapter 5: Non-Equilibrium Sand Pack Experiments on OMTHP Scale Inhibitor Applied in Both
Adsorption and Precipitation Treatments
137
5.3.2 Sand Pack A: Dynamic Precipitation Flood –Singe Flow rate
Sand Pack A represents a Dynamic Precipitation Flood at a single flow rate. The main
treatment uses 4000ppm OMTHP in NFFW (+Li+) brine at 20 ml/hr flow rate; whereas
all post flush uses NFFW (no Li+) brine at 20 ml/hr. The main treatment was conducted
at room temperature (~20°C) and the post flushes were conducted at 95°C. The pH
values of all fluids injected, which includes main treatment and post flush, were
adjusted to pH4. OMTHP at 4000ppm does not precipitate at pH4 at room temperature
as reported above in the static compatibility/adsorption tests. At each interval from main
treatment to post flush, the flow was stopped and maintained for at least 24 hrs at 95°C.
This is the first sand pack experiment with the new set-up of the sand pack apparatus.
The purpose of this particular sand pack experiment is to understand the behaviour of
the phosphorous (SI), calcium, magnesium and lithium throughout the experiment.
Before the dynamic experiment was conducted, the sand pack was characterized. The
characterization of sand pack measures dead volume and pore volume and based on this
information, porosity was calculated. The dead volume and pore volume were measured
as being 4.54ml and 13.64ml respectively. The dead volume and pore volume were used
for the entire experiment to track the amount of volume passed through the sand pack.
Details of Sand Pack characterization are presented in Table 5.4.
Length of Sandpacking = 20.05 cm
Diameter = 1.5 cm
Dead Volume = 4.54 ml
Pore Volume @ RT = 13.64 ml
Porosity @ RT = 38.49 %
Sand Pack A : Characterization Results
Table 5.4: Sand Pack A – Characterization Results
Once the sand pack characterization is completed, NFFW (no Li+) brine was injected
through the sand pack overnight to saturate the column. The purpose is to remove
unwanted materials and any impurities present in the sand pack. Immediately, the

Chapter 5: Non-Equilibrium Sand Pack Experiments on OMTHP Scale Inhibitor Applied in Both
Adsorption and Precipitation Treatments
138
dynamic sand pack experiment was initiated starting with main treatment. Refer to
Table 5.5 for experimental details and chronologies of injection.
The main treatment was carried out with 4000ppm OMTHP in NFFW (+Li+) at room
temperature, at 20 ml/hr. The flow continued for about 8 PV before shutting in the pack.
At this point, the system must be saturated with 4000ppm OMTHP. Normally, it took
only 3 to 4 PV to have the sand pack saturated as shown in Figure 5.13, where the
concentration of phosphorous and lithium level was up at its stock concentration. The
temperature was increased to 95°C and left for at least 24 hrs. Based on OMTHP static
compatibility/adsorption tests, precipitation will have taken place at 95°C. After the 24
hrs shut in, the first post flush with NFFW (no Li+) brine was initiated at 20 ml/hr. This
was continued for about 400PV, stopping from time to time for a few hours to add to
the water bath and/or to change the carousel. The post flush was continued for a long
time to make sure the effluent concentration reaches a very low values of [SI] (which
we expect to be below any likely MIC level); in this case it was set at 1ppm. Effluents
were taken at a set interval and sent for inductive coupled plasma (ICP) analysis.
Based on the concentration analyzed using ICP, the mass of recovered from the pack SI
is calculated and compared with the known injected mass to decide whether further flow
is required. If the mass-out does not match the mass-in of the SI, further flow is required
to establish the where about of the SI mass. The mass balance shows that there is still
significant SI mass in the sand pack when these low levels of [SI] are first reached. In
this case, additional flow was required, where acidized Na+(pH=1) ion was used to
extract the SI left in the sand pack since it is expected that the solubility of the SI_M
complex will be higher in this low calcium brine. Details of the flow rate of this
acidized NaCl brine and injected pore volumes are presented in Table 5.5.
No. Description Conditions Flow rate (ml/hr)
PV (Total PV)
Volume (ml) (Total Vol)
1 Main Treatment – 4000ppm OMTHP in NFFW (+50ppm Li+)
T = 20°C pH = 4
20 1–7.99 (7.99)
1-109 (109)
Shut-in at reservoir temperature (95°C) for 24 hrs.
2 Post Flush # 1 : NFFW (no Li+)
T = 95°C pH = 4
20 7.99–21.19 (13.2)
109-289 (180)
3 Post Flush # 2 : NFFW (no Li+)
T = 95°C pH = 4
20 21.19–41.64 (20.45)
289-568 (279)

Chapter 5: Non-Equilibrium Sand Pack Experiments on OMTHP Scale Inhibitor Applied in Both
Adsorption and Precipitation Treatments
139
4 Post Flush # 3 : NFFW (no Li+)
T = 95°C pH = 4
20 41.64–48.09 (6.45)
568-656 (88)
5 Post Flush # 4 : NFFW (no Li+)
T = 95°C pH = 4
20 48.09–73.31 (25.22)
656-1000 (344)
6 Post Flush # 5 : NFFW (no Li+)
T = 95°C pH = 4
20 73.31–87.39 (14.08)
1000-1192 (192)
7 Post Flush # 6 : NFFW (no Li+)
T = 95°C pH = 4
20 87.39–114.66 (27.27)
1192-1564 (372)
8 Post Flush # 7 : NFFW (no Li+)
T = 95°C pH = 4
20 114.66-183.36 (68.7)
1564-2501 (937)
9 Post Flush # 8 : NFFW (no Li+)
T = 95°C pH = 4
20 183.36-253.01 (69.65)
2501-3451 (950)
10 Post Flush # 9 : NFFW (no Li+)
T = 95°C pH = 4
20 253.01-322.65 (69.64)
3451-4401 (950)
11 Post Flush # 10 : NFFW (no Li+)
T = 95°C pH = 4
20 322.65-391.57 (68.92)
4401-5341 (940)
12 Post Flush # 11 : NFFW (no Li+)
T = 95°C pH = 4
20 391.57–417.23 (25.66)
5341-5691 (350)
Shut-in at room temperature (20°C) for 4 days. COMPLETED POST FLUSH.
13 Acid Wash # 1 : NFFW (no Li+) T = 20°C pH = 1
20 417.23–427.49 ( 10.26)
5691-5831 (140)
14 Acid Wash # 2 : 1% Na+ T = 20°C pH = 1
20 427.49–533.43 (105.94)
5831-7276 (1445)
15 Acid Wash # 3 : 1% Na+ T = 20°C pH = 1
20 533.43–705.90 (172.47)
7276-9628 (2352)
16 Acid Wash # 4 : 1% Na+ T = 20°C pH = 1
20 705.90–780.68 (74.78)
9628-10648 (1020)
Shut-In at room temperature (20°C). COMPLETED.
Table 5.5: Sand Pack A – Experimental Details and Chronologies of Injection
The outcomes of the main treatment and initial post-flush stages are shown in Figure
5.13 and Figure 5.14. These figures show the actual and normalized concentrations
against pore volumes (PV) respectively for each element. The profiles of each element
under study, viz. OMTHP SI and lithium (Li+) concentrations vs. PV can be observed
from these figures. Li+ is an inert element which is being used as a tracer in this study.
The first eight (8) PV is the main treatment using 4000ppm OMTHP in NFFW (+ Li+)
where the acidity/alkalinity has been adjusted to pH4 and it is known that no
precipitation will occur at room temperature. The main treatment is carried out at 20
ml/hr and room temperature, 20°C. As the flow goes through the first 3 to 4 PV, the
OMTHP SI starts deviating from the Lithium (inert tracer) curve. Thus, the deviation
between the SI and Lithium tracer is a measure of the amount of SI adsorption and/or
precipitation. In this case, it is due to pure adsorption, as this has been established in the

Chapter 5: Non-Equilibrium Sand Pack Experiments on OMTHP Scale Inhibitor Applied in Both
Adsorption and Precipitation Treatments
140
corresponding static adsorption/compatibility tests at room temperature (reported
above)where it is known that no precipitation is taking place. From 4PV to 9PV, all the
elements stabilized at their stocks concentrations; which indicates the sand pack is fully
saturated.
After 8 PV of injection, flow is stopped and the sand pack is placed in a water bath. The
water bath temperature is increased from room temperature to 95°C. The set-up is left
shut in under these conditions for 65 hrs. After the shut-in, the flow is returned at 20
ml/hr and 95°C. This is the initial post flush using NFFW brine with no Li+, where the
pH is adjusted to 4. The post flush was carried out until 400PV.
When the flow is initiated after the shut-in after 8 PV, a considerable drop in SI
concentration from 4000ppm to 1000ppm (normalized at 0.25) was observed, which
indicates a very high SI retention due to coupled adsorption/precipitation. The observed
behaviour is clear evidence of SI coupled adsorption/precipitation onto sand minerals.
Similar behaviour has been observed in our bulk studies of this exact system.
As the post flush flow continues, initially the SI concentration dropped drastically and
stabilizes at ~0.2ppm, see Figure 5.15. It is not expected to drop much further below
this baseline trend which is stabilizing. An important observation can be seen; when the
flow was stopped and restart after several hours, the effluent concentration went back
almost to the same level, i.e. in this case ~0.2ppm. No change in effluent concentration
is observed when the flow rate remains the same.
At the end of post flush, the flow is shut-in and the temperature was reduced from 95°C
to room temperature, 20°C. In this flood, the sand pack was then shut-in for 4 days. The
mass balance of SI left in the sand pack and returned during post flush is also calculated
to determine if all the retained SI mass in the sand pack is returned after the final post
flush. Details of the mass balance are presented in Table 5.7. After the main treatment,
76% of the SI mass has been returned. But after the main treatment, the returned SI
mass during the post flush was only an additional of 8%, which add up to 84%; leaving
16% SI mass in the sand pack. This shows that there is still SI in the sand pack after the
final post flush.

Chapter 5: Non-Equilibrium Sand Pack Experiments on OMTHP Scale Inhibitor Applied in Both
Adsorption and Precipitation Treatments
141
The mass balance results led us to carry out an acid wash on the sand pack. Table 5.7
shows the results of the acid wash mass balance. Figure 5.16 shows the results of the
whole injection chronologies including the acid wash. Initially, NFFW brine at pH=1
was used to extract the SI in the sand pack, where only an additional of 0.2% SI mass
was out after 10PV. Then 1% Na+ at pH=1 was used to acid wash the sand pack. The
flush with 1% Na+ produce another 6.6% SI mass after 350PV, still leaving almost 9%
SI mass in the sand pack.
Finally, the sand was removed from the sand pack and was stirred in a 1% Na+ at pH 1
for 24 hours. Fluid samples were extracted and sent for ICP analysis and the sand was
sent for ESEM-EDAX analysis to determine if SI was still present on the sand.
Referring to Table 5.7, an additional of 1% SI mass was found in the sand solution. No
SI mass is found in the ESEM-EDAX analysis, referring to Table 5.6 and Figure 5.17. It
must be noted that ESEM-EDAX does not detect these elements at micro level and the
detection refers only to a very localized area. In contrast, the mass balance shows that
there is still 8% SI mass present in the sand pack undetected, which indicates
irreversible retention has occurred (Kerver and Heilhecker, 1969).
Mass balance based on the mass left in sand pack after the main treatment + 2PV of post
flush: All the above mass balance calculation were made base on total mass-in
(throughput) during main treatment. Here, mass balance is calculated base on mass left
in sand pack after main treatment + 2PV of initial post flush. The additional SI mass of
2PV is removed from the post flush to take into account the mobile phase in the sand
pack. As such, mass left in sand pack is the actual amount of mass that is being
absorbed and/or precipitated. By this definition, the mass left in sand pack is 72.47mg,
which is being used as the “total mass”. Base on this calculation, only 54% of the SI
came out of sand pack, leaving 46% SI mass left in sand pack. Again, these findings
demonstrate irreversible retention of SI. Detailed mass balance comparison are
presented in Table 5.8 and Figure 5.18.

Chapter 5: Non-Equilibrium Sand Pack Experiments on OMTHP Scale Inhibitor Applied in Both
Adsorption and Precipitation Treatments
142
-10
0
10
20
30
40
50
60
70
-500
0
500
1000
1500
2000
2500
3000
3500
4000
-1 1 3 5 7 9 11 13 15
[OM
THP
] (p
pm
)
Pore Volume (PV)
Sand Pack A : OMTHP Dynamic Precipitation FloodMain Treatment & Initial Post Flush
Conc. vs PV
[OMTHP] 177[OMTHP] 214[Li+]
Main TreatmentOMTHP in NFFWpH4 (20 ml/hr)
Post Flush(NFFW)pH4 (20 ml/hr)
[Li+] (ppm)
Figure 5.13: Sand Pack A- Main Treatment and Initial First Post Flush Stages.
-0.2
0
0.2
0.4
0.6
0.8
1
1.2
-1 1 3 5 7 9 11
C /
Co
Pore Volume (PV)
Sand Pack A : OMTHP Dynamic Precipitation FloodMain Treatment & Initial Post Flush
C / Co vs PV
[OMTHP] 177
[OMTHP] 214
[Li+]
Main TreatmentOMTHP in NFFWpH4 (20 ml/hr)
Post Flush(NFFW)pH4 (20 ml/hr)
OMTHP: C/Co=0.25
C/Co= 1
Figure 5.14: Sand Pack A- Main Treatment and Initial First Post Flush Stages.
Normalized Concentration vs. PV

Chapter 5: Non-Equilibrium Sand Pack Experiments on OMTHP Scale Inhibitor Applied in Both
Adsorption and Precipitation Treatments
143
-10
0
10
20
30
40
50
60
70
0.001
0.01
0.1
1
10
100
1000
10000
0 20 40 60 80 100 120 140 160 180 200
[OM
THP
] (pp
m)
Pore Volume (PV)
Sand Pack A : OMTHP Dynamic Precipitation FloodSummary of Main Treatment & Post Flush
Conc. vs PV
[OMTHP] 177
[OMTHP] 214
[Li+]
Main TreatmentOMTHP in NFFWpH4 (20 ml/hr)
Post Flush(NFFW)pH4 (20 ml/hr)
[Li+] (ppm)
Shutdown 24hrs
Figure 5.15: Sand Pack A- Main Treatment and Post Flush Stages.
-10
0
10
20
30
40
50
60
70
0.001
0.01
0.1
1
10
100
1000
10000
0 100 200 300 400 500 600 700
[OM
THP
] (pp
m)
Pore Volume (PV)
Sand Pack A : OMTHP Dynamic Precipitation FloodSummary of Main Treatment, Post Flush & Acid Wash
Conc. vs PV
[OMTHP] 177
[OMTHP] 214
[Li+]
Main TreatmentOMTHP in NFFWpH4 (20 ml/hr)
Post Flush(NFFW)pH4 (20 ml/hr)
[Li+] (ppm)
Acid Wash #1(NFFW)pH1 (20 ml/hr)
Acid Wash #1(Na+)pH1 (150 ml/hr)
Acid Wash #1(Na+)pH1 (20 ml/hr)
Figure 5.16: Sand Pack A- Main Treatment, Post Flush and Acid Wash Stages.
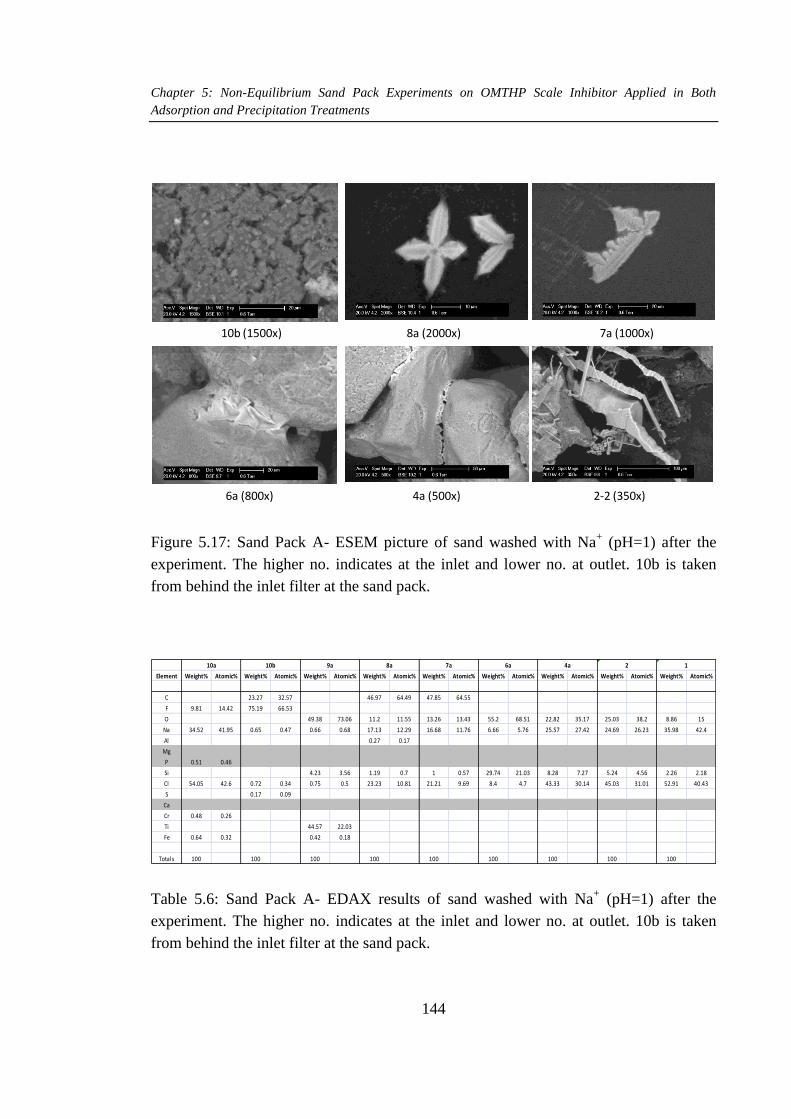
Chapter 5: Non-Equilibrium Sand Pack Experiments on OMTHP Scale Inhibitor Applied in Both
Adsorption and Precipitation Treatments
144
10b (1500x) 8a (2000x) 7a (1000x)
6a (800x) 4a (500x) 2-2 (350x)
Figure 5.17: Sand Pack A- ESEM picture of sand washed with Na+ (pH=1) after the
experiment. The higher no. indicates at the inlet and lower no. at outlet. 10b is taken
from behind the inlet filter at the sand pack.
Element Weight% Atomic% Weight% Atomic% Weight% Atomic% Weight% Atomic% Weight% Atomic% Weight% Atomic% Weight% Atomic% Weight% Atomic% Weight% Atomic%
C 23.27 32.57 46.97 64.49 47.85 64.55
F 9.81 14.42 75.19 66.53
O 49.38 73.06 11.2 11.55 13.26 13.43 55.2 68.51 22.82 35.17 25.03 38.2 8.86 15
Na 34.52 41.95 0.65 0.47 0.66 0.68 17.13 12.29 16.68 11.76 6.66 5.76 25.57 27.42 24.69 26.23 35.98 42.4
Al 0.27 0.17
Mg
P 0.51 0.46
Si 4.23 3.56 1.19 0.7 1 0.57 29.74 21.03 8.28 7.27 5.24 4.56 2.26 2.18
Cl 54.05 42.6 0.72 0.34 0.75 0.5 23.23 10.81 21.21 9.69 8.4 4.7 43.33 30.14 45.03 31.01 52.91 40.43
S 0.17 0.09
Ca
Cr 0.48 0.26
Ti 44.57 22.03
Fe 0.64 0.32 0.42 0.18
Totals 100 100 100 100 100 100 100 100 100
110a 10b 9a 8a 7a 6a 4a 2
Table 5.6: Sand Pack A- EDAX results of sand washed with Na+ (pH=1) after the
experiment. The higher no. indicates at the inlet and lower no. at outlet. 10b is taken
from behind the inlet filter at the sand pack.
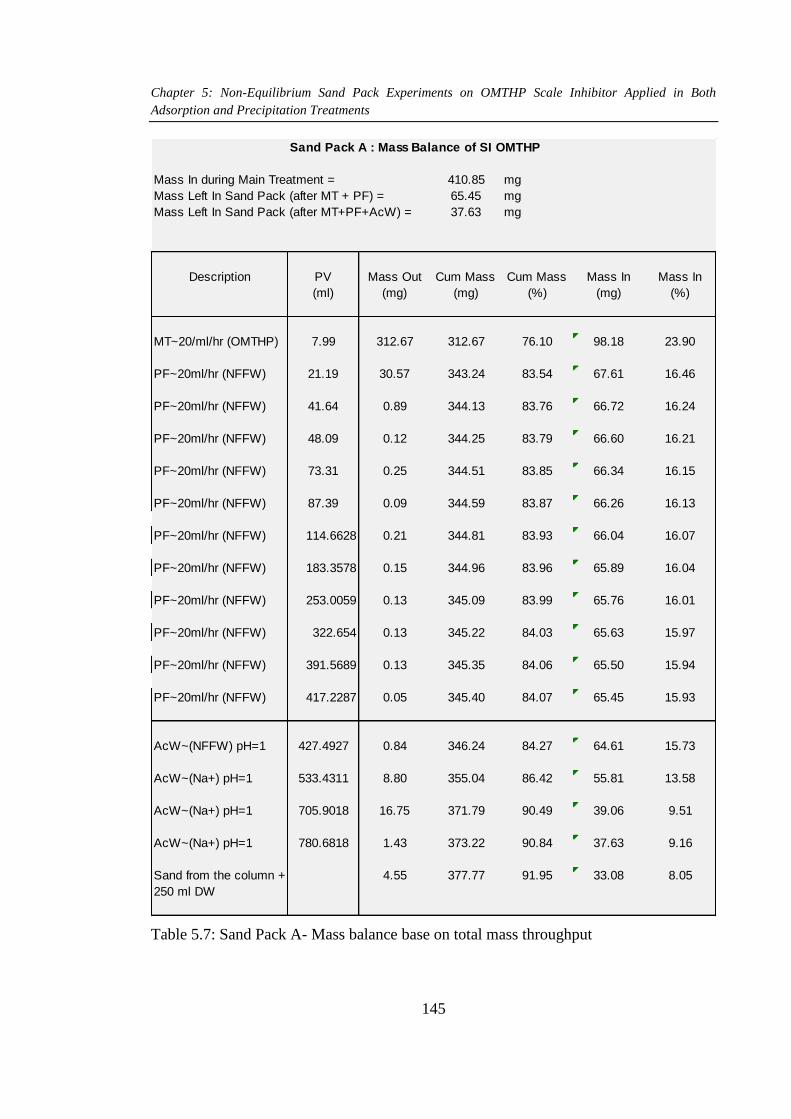
Chapter 5: Non-Equilibrium Sand Pack Experiments on OMTHP Scale Inhibitor Applied in Both
Adsorption and Precipitation Treatments
145
Sand Pack A : Mass Balance of SI OMTHP
Mass In during Main Treatment = 410.85 mg
Mass Left In Sand Pack (after MT + PF) = 65.45 mg
Mass Left In Sand Pack (after MT+PF+AcW) = 37.63 mg
Description PV Mass Out Cum Mass Cum Mass Mass In Mass In
(ml) (mg) (mg) (%) (mg) (%)
MT~20/ml/hr (OMTHP) 7.99 312.67 312.67 76.10 98.18 23.90
PF~20ml/hr (NFFW) 21.19 30.57 343.24 83.54 67.61 16.46
PF~20ml/hr (NFFW) 41.64 0.89 344.13 83.76 66.72 16.24
PF~20ml/hr (NFFW) 48.09 0.12 344.25 83.79 66.60 16.21
PF~20ml/hr (NFFW) 73.31 0.25 344.51 83.85 66.34 16.15
PF~20ml/hr (NFFW) 87.39 0.09 344.59 83.87 66.26 16.13
PF~20ml/hr (NFFW) 114.6628 0.21 344.81 83.93 66.04 16.07
PF~20ml/hr (NFFW) 183.3578 0.15 344.96 83.96 65.89 16.04
PF~20ml/hr (NFFW) 253.0059 0.13 345.09 83.99 65.76 16.01
PF~20ml/hr (NFFW) 322.654 0.13 345.22 84.03 65.63 15.97
PF~20ml/hr (NFFW) 391.5689 0.13 345.35 84.06 65.50 15.94
PF~20ml/hr (NFFW) 417.2287 0.05 345.40 84.07 65.45 15.93
AcW~(NFFW) pH=1 427.4927 0.84 346.24 84.27 64.61 15.73
AcW~(Na+) pH=1 533.4311 8.80 355.04 86.42 55.81 13.58
AcW~(Na+) pH=1 705.9018 16.75 371.79 90.49 39.06 9.51
AcW~(Na+) pH=1 780.6818 1.43 373.22 90.84 37.63 9.16
Sand from the column + 4.55 377.77 91.95 33.08 8.05
250 ml DW
Table 5.7: Sand Pack A- Mass balance base on total mass throughput

Chapter 5: Non-Equilibrium Sand Pack Experiments on OMTHP Scale Inhibitor Applied in Both
Adsorption and Precipitation Treatments
146
Sand Pack A : Mass Balance of SI OMTHP
Mass In during Main Treatment = 410.85 mg
Mass Left In Sand Pack (after MT + PF) = 65.45 mg
Mass Left In Sand Pack (after MT+PF+AcW) = 37.63 mg
Description PV Mass Out
Cum Mass
Return
Cum Mass
Return
Mass Left
In Sand
Pack
Mass Left
In Sand
Pack
Cum Mass
Return
Cum Mass
Return
(ml) (mg) (mg) (%) (mg) (%) (mg) (%)
MT~20/ml/hr (OMTHP) 10.04 338.38 338.38 82.36 72.47 17.64
PF~20ml/hr (NFFW) 19.14 4.86 343.24 83.54 67.61 16.46 4.86 6.70
PF~20ml/hr (NFFW) 41.64 0.89 344.13 83.76 66.72 16.24 5.75 7.93
PF~20ml/hr (NFFW) 48.09 0.12 344.25 83.79 66.60 16.21 5.87 8.10
PF~20ml/hr (NFFW) 73.31 0.25 344.51 83.85 66.34 16.15 6.13 8.45
PF~20ml/hr (NFFW) 87.39 0.09 344.59 83.87 66.26 16.13 6.21 8.57
PF~20ml/hr (NFFW) 114.6628 0.21 344.81 83.93 66.04 16.07 6.43 8.87
PF~20ml/hr (NFFW) 183.3578 0.15 344.96 83.96 65.89 16.04 6.58 9.07
PF~20ml/hr (NFFW) 253.0059 0.13 345.09 83.99 65.76 16.01 6.71 9.26
PF~20ml/hr (NFFW) 322.654 0.13 345.22 84.03 65.63 15.97 6.84 9.44
PF~20ml/hr (NFFW) 391.5689 0.13 345.35 84.06 65.50 15.94 6.97 9.62
PF~20ml/hr (NFFW) 417.2287 0.05 345.40 84.07 65.45 15.93 7.02 9.69
AcW~(NFFW) pH=1 427.4927 0.84 346.24 84.27 64.61 15.73 7.86 10.85
AcW~(Na+) pH=1 533.4311 8.80 355.04 86.42 55.81 13.58 16.66 22.99
AcW~(Na+) pH=1 705.9018 16.75 371.79 90.49 39.06 9.51 33.41 46.10
AcW~(Na+) pH=1 780.6818 1.43 373.22 90.84 37.63 9.16 34.84 48.07
Sand from the column + 4.55 377.77 91.95 33.08 8.05 39.39 54.35
250 ml DW
( X ) ( Y )
Table 5.8: Sand Pack A- Summary of mass balance base on total mass throughput and
mass after main treatment + 2PV
Note:
X: %Mass out base on total mass throughput; m= 410.85mg
Y: %Mass out base on mass after main treatment + 2PV, which is the mass left in the
sand pack as being absorbed or/and precipitated; m= 72.47mg

Chapter 5: Non-Equilibrium Sand Pack Experiments on OMTHP Scale Inhibitor Applied in Both
Adsorption and Precipitation Treatments
147
0
10
20
30
40
50
60
70
80
90
100
0 100 200 300 400 500 600 700 800 900
% M
ass
Out
PV
Sand Pack A : Mass Balance% Mass Out vs PV
X
Y
Figure 5.18: Sand Pack A- Summary of mass balance base on total mass throughput and
mass after main treatment + 2PV
5.3.3 Sand Pack C: Dynamic Precipitation Flood – Multi Flow rate
Sand Pack C was used in a dynamic precipitation flood with at a range of flow rates.
The main treatment contains 4000ppm OMTHP in NFFW (+Li+) brine at 20 ml/hr flow
rate; whereas the post flush is carried out with NFFW(no Li+) brine at 20, 10, 5 and 2
ml/hr. The main treatment was conducted at room temperature and all post flushes were
carried out at reservoir condition at 95°C. The pH of all fluids injected, which includes
main treatment and post flush were adjusted to pH4, where it is known that SI solution
at 4000ppm will not precipitate. At each interval from main treatment to post flush, the
flow was stopped and maintained for at least 24 hrs at 95°C. The details and
chronologies of the experiment can be found in Table 5.10.
Before the dynamic experiment was conducted, the sand pack was fully characterized.
The characterization of the sand pack measures dead volume and pore volume. Based
on this information, porosity was calculated. The dead volume and pore volume were
measured to be 1.54ml and 14.69ml respectively. These volumes were used for the
Notes: X- %Mass out base on total mass throughput Y- %Mass out base on mass after main treatment + 2PV
Notes: X- %Mass out base on total mass throughput Y- %Mass out base on mass after main treatment + 2PV

Chapter 5: Non-Equilibrium Sand Pack Experiments on OMTHP Scale Inhibitor Applied in Both
Adsorption and Precipitation Treatments
148
entire experimental cycle to track the amount of volume passing through the sand pack.
Details of sand pack characterization are presented in Table 5.9.
Length of Sandpacking = = 20.5 cm
Diameter = = 1.5 cm
Dead Volume = = 1.54 ml
Pore Volume @ RT = = 14.69 ml
Porosity @ RT = = 40.52 %
Sand Pack C : Characterization Results
Table 5.9: Sand Pack C – Characterization Results
Once the characterization was completed, NFFW (no Li+) brine was injected into the
sand pack overnight to saturate the system. The dynamic sand pack experiment was then
immediately initiated starting with main treatment. Refer toTable 5.10 for experimental
details and chronologies of injection.
The main treatment was performed using 4000ppm OMTHP in NFFW (+Li+) at room
temperature, at 20 ml/hr. The flow was continued for ~9 PV before a shut in. At this
point, the system must be saturated with 4000ppm OMTHP. Normally, it took only ~3
to 4 PV to have the sand pack saturated with full concentration SI. This can be seen
from where Figure 5.19 all the elements are level at their stock concentrations by this
time. After the shut-in, the temperature was increased to 95°C and left for at least 24
hrs. Based on the OMTHP static tests, coupled adsorption/precipitation is expected to
take place under these conditions. After the 24 hrs shut in, the first post flush with
NFFW (no Li+) brine was initiated at 20 ml/hr. This was continued for ~72PV. The
initial post flush was continued for this long duration to ensure the effluent
concentration reached a very low concentration level or no large changes in effluent
concentration were observed; in this case it was set at 1ppm. The flow was stopped and
left for at least 24 hrs at 95°C. Then the flow was continued at 10, 5, 5 and 2 ml/hr.
After each flow rate, the flow is stopped for at least 24 hrs at 95°C. Effluents were
collected at set intervals at all flow rates, which were sent for ICP analysis.

Chapter 5: Non-Equilibrium Sand Pack Experiments on OMTHP Scale Inhibitor Applied in Both
Adsorption and Precipitation Treatments
149
Based on the concentration analyzed using ICP, the mass of SI produced was calculated
to decide whether further flow was required. If the mass-out does not match the mass-in
of the SI, further flow was carried out. In this case, acidized Na+(pH=1) ion was used to
extract the SI. Details of acidized flood can be found in Table 5.10.
No. Description Conditions Flow rate (ml/hr)
PV (Total PV)
Volume (ml) (Total Vol)
1 Main Treatment – 4000ppm OMTHP in NFFW (+50ppm Li
+)
T = 20°C pH = 4
20 1–9.46 (9.4)
1-138 (138)
Shut-in at reservoir temperature (95°C) for 65 hrs.
2 Post Flush # 1 : NFFW (no Li+)
T = 95°C pH = 4
20 9.4–81.8 (72.4)
138-1202 (1064)
Shut-in at reservoir temperature (95°C) for 17 hrs.
3 Post Flush # 2 : NFFW (no Li+)
T = 95°C pH = 4
10 81.8–103.2 (21.4)
1202-1516 (314)
Shut-in at reservoir temperature (95°C) for 24 hrs.
4 Post Flush # 3 : NFFW (no Li+)
T = 95°C pH = 4
5 103.2–126.3 (23.1)
1516-1856 (340)
Shut-in at reservoir temperature (95°C) for 24 days.
5 Post Flush # 4 : NFFW (no Li+)
T = 95°C pH = 4
5 126.3–151.3 (25)
1856-2223 (367)
Shut-in at reservoir temperature (95°C) for 21 hrs.
6 Post Flush # 5 : NFFW (no Li+)
T = 95°C pH = 4
2 151.3–164.3 (13)
2223-2413 (190)
Shut-in at room temperature (20°C) for 4 days 1 hrs. COMPLETED POST FLUSH.
7 Acid Wash # 1 : 1% Na+ T = 20°C pH = 1
20 164.3–233.7 ( 69.4)
2413-3433 (1020)
Shut-in at room temperature (20°C) for 18 hrs.
8 Acid Wash # 2 : 1% Na+ T = 20°C pH = 1
20 233.7–243.6 (9.9)
3433-3578 (145)
Shut-in at room temperature (20°C) for 16 hrs.
9 Acid Wash # 3 : 1% Na+ T = 20°C pH = 1
20 243.6–254.1 (10.5)
3578-3733 (155)
Shut-in at room temperature (20°C) for 16 hrs.
10 Acid Wash # 4 : 1% Na+ T = 20°C pH = 1
20 254.1–265.7 (11.6)
3733-3903.5 (170.5)
Shut-in at room temperature (20°C) for 5 ½ days.
11 Acid Wash # 5 : 1% Na+ T = 20°C pH = 1
60 265.7-297 (31.3)
3903.5-4363.5 (460)
Shut-In at room temperature (20°C). COMPLETED.
Table 5.10: Sand Pack C – Experimental Details and Chronologies of Injection
The outcomes of the main treatment and first post-flush stages are shown in Figure 5.19
and Figure 5.20. These figures show the actual and normalized concentrations vs. pore
volumes (PV) respectively for each element. The profiles of each element under study,

Chapter 5: Non-Equilibrium Sand Pack Experiments on OMTHP Scale Inhibitor Applied in Both
Adsorption and Precipitation Treatments
150
namely, OMTHP SI, calcium (Ca2+
), magnesium (Mg2+
) and lithium (Li+)
concentrations vs. PV can be observed from these figures. Ca2+
and Mg2+
are divalent
cations known to bind together with phosphonates. Li+ is an inert element which is
being used as a tracer in the study.
The first 9 PV of injection contained the main treatment with 4000ppm OMTHP in
NFFW (+50ppm Li+) where the acidity/alkalinity was adjusted to pH4. The main
treatment is carried out at 20 ml/hr and room temperature, 20°C. As the flow goes
through the first 2 to 3 PV, the OMTHP SI starts deviating from Lithium tracer curve.
Thus, the deviation between the SI and Lithium tracer is a measure of the amount of SI
adsorption and/or precipitation. In this case, it is due to pure adsorption, as already
established by our static adsorption/compatibility tests described above. These tests
showed that at room temperature no precipitation took place. The instant drop in
calcium and magnesium concentrations is also evident in these figures which indicates
that binding between SI and calcium and SI and magnesium occurs during adsorption.
The affinity of calcium for SI is more distinct in these results compared to magnesium.
From ~2 to 9 PV, all the elements stabilized at their stock concentrations; which
indicates the sand pack is fully saturated with the injected brine.
After 9 PV of injection, flow is stopped and the sand pack is placed in a water bath. The
water bath temperature is increased from room temperature to 95°C. The set-up was left
for 65 hrs shut-in. After the shut-in, the flow was restarted at 20 ml/hr and 95°C. This is
the first post flush using NFFW brine with no Li+, where the pH is also 4. The first post
flush was carried out from 10 to 80 PV.
When the flow recommenced after the shut-in at 9 PV, a considerable drop in SI
concentration from 4000ppm to 750ppm (normalized at 0.2) was observed, which
indicates a very high SI retention due to coupled adsorption/precipitation. Similar trends
are also observed for calcium and magnesium; where Ca2+
is reduced from 1925ppm to
1550ppm (normalized at 0.85) and Mg2+
is reduced from 720ppm to 610ppm
(normalized at 0.89). The observed behaviour is clear evidence of SI coupled
adsorption/precipitation onto sand minerals; and the affinity of Ca2+
and Mg2+
with

Chapter 5: Non-Equilibrium Sand Pack Experiments on OMTHP Scale Inhibitor Applied in Both
Adsorption and Precipitation Treatments
151
OMTHP SI in the process of precipitation. The binding of SI to calcium/magnesium to
form a SI_M complex which was retained in the pack is a clear diagnostic that
precipitation has occurred. Similar behaviour has been observed in our bulk studies of
this exact system.
At the end of first post flush (~80PV) based on Figure 5.21, the SI concentration was
still reducing and if the flow continues the concentration is expected to drop further base
on the trend. This behaviour indicates that it has yet to reach its lower concentration
level. Base on the trend, the concentration is expected to go down to 0.4ppm
(extrapolated). Whereas Ca2+
and Mg2+
stabilize around 1800 and 1850ppm and 670 and
690ppm (normalized at around 0.98 to 1.00 for both elements) respectively. Ca2+
and
Mg2+
elements are injected with NFFW brine, as such changes is not expected during
this post flush.
Figure 5.21 shows the later stage return profiles of the OMTHP precipitation floods at
different flow rates using same post flush fluid. The details of the various stages are
described in Table 5.10. The following observation can be summarized from the figure.
The flow was shut-in between the first (Q=20ml/hr) and second (Q=10ml/hr) post
flushes during which time it was shut-in for 20 hours at 95°C. Immediately after the
second post flush was initiated, the SI concentration went as high as 2.4ppm before
went to 0.5ppm. The trend shows that it is stabilizing. The other observation is the
increase in concentration at the start of the second post flush which indicates it reaches
equilibrium at about 2.4ppm after 24 hrs. The increase shows desorption and dissolution
took place during shut-in.
From 2nd
to 5th
post flush, NFFW was used, but at various flow rates. This is done in
order to study if there is any impact due to non-equilibrium or kinetic processes. While
the 1st post flush flow period is carried out at 20 ml/hr; the 2
nd, 3
rd, 4
th and 5
th use 10, 5,
5 and 2 ml/hr respectively. At each interval between changing the flow rates, the flow
was shut in more than 20 hours at 95°C. It can be observed that the concentration spikes
up for all the flow rates depending upon shut-in time, before gradually decreasing to
threshold concentration levels in the period of flow after this shut-in. The high

Chapter 5: Non-Equilibrium Sand Pack Experiments on OMTHP Scale Inhibitor Applied in Both
Adsorption and Precipitation Treatments
152
concentration at each shut-in is indicative of the dissolution of the precipitated SI where
it reaches (near) equilibrium and the lowest point is when it stabilizes at its steady-state
flowing level. An important point to note about the profile of SI concentration at the
various flow rates is that, at the lower flow rates, a higher SI return concentration is
observed (and vice versa). This behaviour is due to non-equilibrium effects and is as
expected. At one point between the 3rd
and 4th
post flush, where the shut-in took place
for 24 days; the flow rates for both post flush stages were at 5 ml/hr each. They show
very similar stabilized flowing concentrations and this further confirms the non-
equilibrium effect; i.e. at the same flow rate there was no changes in flowing
concentration. After the final post flush at 2 ml/hr, the flow is shut-in and the
temperature was reduced from 95°C to room temperature, 20°C. In this flood, the sand
pack was shut-in for 4 days 1 hour.
The mass balance of SI left in the sand pack and returned during the post flush period
was calculated. This analysis is conducted to study if all the SI mass is returned after the
final post flush. Details of the mass balance at each stage are presented in Table 5.12.
After the main treatment, 89.5% of the SI mass has been returned. But after the main
treatment, the returned SI mass from 1st to 5
th post flush only recovers an additional of
2%. Total mass returned after the 5th
post flush period is 91.5%, leaving 8.5% in the
sand pack. This shows that there is still SI in the sand pack after the final post flush.
The above mass balance results led us to carry out an acid wash on the sand pack using
1% Na+ at pH=1. The purpose of this stage is to extract any SI left in the sand pack.
Figure 5.22 shows the results of the whole injection chronology including the acid wash
stage. Table 5.12 shows the results of the acid wash mass balance. Five (5) acid wash
cycles were executed at two (2) different flow rates, which are at 20, 20, 20, 20 and 60
ml/hr. Even the acid wash at different rates show non-equilibrium behaviour. Again, in
this acid wash period, the higher the flow rate, the lower the flowing threshold
concentration (and vice versa).
Only an additional of 1.5% SI mass is collected after the final 5th
acid wash, which
account to a total of 93%, leaving 7% of the original injected SI in the sand pack.

Chapter 5: Non-Equilibrium Sand Pack Experiments on OMTHP Scale Inhibitor Applied in Both
Adsorption and Precipitation Treatments
153
However, one important observation can be made on the influence of flow rate
throughout the 5 acid washes. As for the variable rate post flushes following the main SI
treatment, the acid wash variable rate floods also show non-equilibrium behaviour.
Again, the lower the flow rate, the higher the SI return concentrations (and vice versa).
Figure 5.24 and Figure 5.25 show the mass balance of the sequence of cumulative mass-
in and mass-out, respectively.
Finally, the sand in the sand pack was extracted from the column and dissolved while
stirring in 1% Na+ for 24 hours. Fluid samples were taken and sent for ICP analysis and
the sand was sent for ESEM-EDAX analysis to determine whether SI was detectable in
the sand pack (referring to Figure 5.23 and Table 5.11). There was no SI found from
ESEM-EDAX analysis. It must be noted that ESEM-EDAX does not detect these
elements at very low concentration levels. SI mass balance results shows an additional ~
1% SI in the solution. The mass balance shows that there is still 7% of the SI mass
present in the sand pack undetected, indicating irreversible retention behaviour (Kerver
and Heilhecker, 1969).
Mass Balance based on mass left in the sand pack after main treatment + 2PV of post
flush: All the above mass balance calculations were made base on the total mass-in
(throughput) during the main treatment. Here, mass balance is calculated based on mass
left in sand pack after the main treatment + 2PV of initial post flush. The additional 2PV
of injected is to remove mobile SI (at input concentration) from the sand pack. After
this 2PV postflush, all of the mass left in the sand pack is the actual amount of mass
which has been absorbed or precipitated. After this 2PV brine postflush, we determine
that the mass left in sand pack is 53.91mg, which is then used as the “total mass” for
subsequent 5 retention calculations. Based on this calculation, only 33% of SI came out
of the sand pack, leaving 67% SI mass left in the pack. These calculations indicate that
there is irreversible retention of SI in the pack [28]. Detailed mass balances are
presented inTable 5.13 and Figure 5.26.
A mass balance comparison at various stages of the flood is shown in Figure 5.27.

Chapter 5: Non-Equilibrium Sand Pack Experiments on OMTHP Scale Inhibitor Applied in Both
Adsorption and Precipitation Treatments
154
0
10
20
30
40
50
60
-500
0
500
1000
1500
2000
2500
3000
3500
4000
4500
0 2 4 6 8 10 12 14 16 18
[Li+
] (pp
m)
[OM
THP]
, [C
a2
+] &
[Mg
2+ ]
(ppm
)
Pore Volume (PV)
Sand Pack C : OMTHP Dynamic Precipitation FloodMain Treatment and Post Flush
[OMTHP]
[Ca2+]
[Mg2+]
[Li+]
[Ca2+]= 1850ppm
[Ca2+]= 1550ppm
[Mg2+]= 610ppm
Main TreatmentOMTHP in NFFWpH4 (20 ml/hr)
Post Flush(NFFW)pH4 (20 ml/hr)
[SI]= 750 ppm
[SI]= 4000 ppm
Drop in SI, Ca2+ & Mg2+ concentrationdue to coupled adsorption/precipitation.
[Ca2+]= 1920ppm
[Mg2+]= 720ppm
[Mg2+]= 700ppm
Figure 5.19: Sand Pack C - Main treatment and initial post flush stages.
-0.2
0
0.2
0.4
0.6
0.8
1
1.2
0 2 4 6 8 10 12 14 16 18
C /
Co
Pore Volume (PV)
Sand Pack C : OMTHP Dynamic Precipitation FloodMain Treatment and Post Flush
C/Co vs PV
[OMTHP]
[Ca2+]
[Mg2+]
[Li+]
Main TreatmentOMTHP in NFFWpH4 (20 ml/hr) Post Flush(NFFW)
pH4 (20 ml/hr)C/Co= 1
Drop in Ca2+ & Mg2+ concentrationdue to coupled adsorption/precipitation.
Drop in SI concentration due tocoupled adsorption/precipitation.
Retention of SI due toadsorption ONLY
[Mg2+] C/Co= 0.90
C/Co= 0.2
[Ca2+] C/Co= 0.85
C/Co= 0.98
Figure 5.20: Sand Pack C- Main treatment and initial post flush stages. Normalized
concentration vs. PV

Chapter 5: Non-Equilibrium Sand Pack Experiments on OMTHP Scale Inhibitor Applied in Both
Adsorption and Precipitation Treatments
155
0
10
20
30
40
50
60
0.1
1
10
100
1000
10000
0 20 40 60 80 100 120 140 160 180
[Li+
] (pp
m)
[OM
THP
], [C
a2
+] &
[Mg
2+ ]
(ppm
)
Pore Volume (PV)
Sand Pack C : OMTHP Dynamic Precipitation FloodSummary of Main Treatment and Post Flush
[OMTHP]
[Ca2+]
[Mg2+]
[Li+]
Main Treatment
OMTHP in NFFW
pH4 (20 ml/hr)
Post Flush(NFFW)pH4 (20 ml/hr)
Post Flush(NFFW)pH4 (10 ml/hr)
Post Flush(NFFW)pH4 (2 ml/hr)
Post Flush(NFFW)pH4 (5 ml/hr)
Post Flush(NFFW)
pH4 (5 ml/hr)
[SI]= 0.4 ppm
[SI]= 2.4 ppm
[SI]= 0.5 ppm
[SI]= 1.9 ppm
[SI]= 0.6 ppm
[SI]= 2.8 ppm
[SI]= 0.6 ppm
[SI]= 1.5 ppm
[SI]= 1.2 ppm
Figure 5.21: Sand Pack C- Main treatment and all post flush stages.
0.1
1
10
100
1000
10000
0 50 100 150 200 250 300
[OM
THP
] (pp
m)
Pore Volume (PV)
Sand Pack C : OMTHP Dynamic Precipitation FloodSummary of Main Treatment, Post Flush & Acid Wash Flood
[OMTHP]
Main Treatment
OMTHP in NFFWpH4 (20 ml/hr)
Post Flush(NFFW)
pH4 (20 ml/hr)
Post Flush(NFFW)
pH4
Acid Wash(Na+)pH1
Post Flush(NFFW)pH4 (10 ml/hr)
Post Flush(NFFW)pH4 (5 ml/hr)
Post Flush(NFFW)pH4 (2 ml/hr)
Acid Wash(Na+)
pH1 (20 ml/hr)
Post Flush(NFFW)pH4 (5 ml/hr)
Acid Wash(Na+)
pH1 (20 ml/hr)
Acid Wash(Na+)
pH1 (20 ml/hr)
Acid Wash(Na+)pH1 (20 ml/hr)
Acid Wash(Na+)
pH1 (60 ml/hr)
Even during acid wash,the effect of flowratecan be seed clearly.
Figure 5.22: Sand Pack C- Main treatment, post flush and acid wash stages.

Chapter 5: Non-Equilibrium Sand Pack Experiments on OMTHP Scale Inhibitor Applied in Both
Adsorption and Precipitation Treatments
156
1-1 1-2
3-12-1 4-1
Figure 5.23: Sand Pack C- ESEM picture of sand washed with Na+ (pH=1) after the
experiment. The picture indicates no precipitation of SI
Element Weight% Atomic% Weight% Atomic% Weight% Atomic% Weight% Atomic% Weight% Atomic%
C 20 27.85
O 59.98 72.5 54.58 57.08 60.55 73.01 58.38 71.1 59.71 72.28
Na 0.35 0.26 0.53 0.45
Al 1.03 0.74 1.9 1.18 0.63 0.45 0.9 0.65 0.93 0.67
Si 38.59 26.57 22.19 13.22 38.04 26.13 40.72 28.25 37.84 26.09
Mg
P
Cl 0.43 0.24 0.35 0.19
K 0.41 0.2 0.98 0.42 0.36 0.18 0.64 0.32
Ca
Totals 100 100 100 100 100
1-1 1-2 2-1 3-1 4-1
Table 5.11: Sand Pack C - EDAX results of sand washed with Na+ (pH=1) after the
experiment. No P, Ca2+
or Mg2+
was seen.

Chapter 5: Non-Equilibrium Sand Pack Experiments on OMTHP Scale Inhibitor Applied in Both
Adsorption and Precipitation Treatments
157
Sand Pack C : Mass Balance of SI OMTHP
Mass Throughput @ MT = 520.97 mg
Mass Left In Sand Pack (after MT + PF) = 44.28 mg
Mass Left In Sand Pack (after MT+PF+AcW) = 37.3 mg
Description PV Mass Return
Cum Mass
Return
Cum Mass
Return
Mass Left In
Sand Pack
Mass Left In
Sand Pack
(ml) (mg) (mg) (%) (mg) (%)
MT~20/ml/hr (OMTHP) 9.39 467.06 467.06 89.65 53.91 10.35
PF~20ml/hr (NFFW) 81.82 8.39 475.45 91.26 45.52 8.74
PF~10ml/hr (NFFW) 103.20 0.31 475.76 91.32 45.20 8.68
PF~5ml/hr (NFFW) 126.34 0.33 476.10 91.39 44.87 8.61
PF~5ml/hr (NFFW) 151.33 0.35 476.45 91.45 44.52 8.55
PF~2ml/hr (NFFW) 164.26 0.24 476.69 91.50 44.28 8.50
AcW #1~20ml/hr (Na+) 233.70 4.91 481.60 92.44 39.37 7.56
AcW #2~20ml/hr (Na+) 243.57 0.49 482.09 92.54 38.88 7.46
AcW #3~20ml/hr (Na+) 254.12 0.50 482.60 92.63 38.37 7.37
AcW #4~20ml/hr (Na+) 265.72 0.55 483.15 92.74 37.82 7.26
AcW #5~60ml/hr (Na+) 297.04 0.53 483.67 92.84 37.30 7.16
Sand from the column + 1 484.67 93.03 36.30 6.97
250ml of DW
Table 5.12: Sand Pack C- Mass balance base on total mass throughput

Chapter 5: Non-Equilibrium Sand Pack Experiments on OMTHP Scale Inhibitor Applied in Both
Adsorption and Precipitation Treatments
158
20
25
30
35
40
45
50
55
60
0.1
1
10
100
1000
10000
0 50 100 150 200 250 300
[OM
THP
] (pp
m)
Pore Volume (PV)
Sand Pack C : OMTHP Dynamic Precipitation FloodSummary of Main Treatment, Post Flush & Acid Wash Flood
SI Mass Balance
[SI]
SI Mass still in Sand pack (mg)
Main Treatment
OMTHP in NFFWpH4 (20 ml/hr)
Post Flush(NFFW)
pH4 (20 ml/hr)
Post Flush(NFFW)pH4
Acid Wash(Na+)
pH1
Post Flush(NFFW)pH4 (10 ml/hr)
Post Flush(NFFW)pH4 (5 ml/hr)
Post Flush(NFFW)pH4 (2 ml/hr)
Acid Wash(Na+)
pH1 (20 ml/hr)
Post Flush(NFFW)pH4 (5 ml/hr)
Acid Wash(Na+)pH1 (20 ml/hr)
Acid Wash(Na+)pH1 (20 ml/hr)
Acid Wash(Na+)
pH1 (20 ml/hr)
Acid Wash(Na+)
pH1 (60 ml/hr)
SI Mass still in
Sand
Pack (m
g)
53.91mg
45.52mg(8.74%)
45.20mg(8.68%)
44.87mg
(8.61%)
44.52mg(8.55%)
44.28mg(8.50%)
39.37mg(7.56%) 38.87mg
(7.46%)
38.37mg(7.37%)
37.82mg(7.26%)
37.29mg(7.16%)
Total SI Mass In = 520.97 mg
Figure 5.24: Sand Pack C- Mass still in sand pack base on total mass throughput
80
82
84
86
88
90
92
94
96
98
100
0.1
1
10
100
1000
10000
0 50 100 150 200 250 300
[OM
THP
] (p
pm
)
Pore Volume (PV)
Sand Pack C : OMTHP Dynamic Precipitation FloodSummary of Main Treatment, Post Flush & Acid Wash Flood
SI Mass Balance
[SI] Cum SI Mass Return (%)
Main Treatment
OMTHP in NFFWpH4 (20 ml/hr)
Post Flush(NFFW)
pH4 (20 ml/hr)
Post Flush(NFFW)pH4
Acid Wash(Na+)
pH1
Post Flush(NFFW)pH4 (10 ml/hr)
Post Flush(NFFW)pH4 (5 ml/hr)
Post Flush(NFFW)pH4 (2 ml/hr)
Acid Wash(Na+)
pH1 (20 ml/hr)
Post Flush(NFFW)pH4 (5 ml/hr)
Acid Wash(Na+)pH1 (20 ml/hr)
Acid Wash(Na+)pH1 (20 ml/hr)
Acid Wash(Na+)
pH1 (20 ml/hr)
Acid Wash(Na+)
pH1 (60 ml/hr)
Cum
SI Mass R
eturn (%)
89.65%
(467.06mg)
91.26%(475.45mg) 91.32%
(475.76mg)
91.39%
(476.10mg)
91.45%(476.45mg)
91.50%(476.69mg)
92.44%
(481.60mg)
92.54%(482.09mg)
92.63%
(482.60mg)
92.74%(483.15mg)
92.84%
(483.67mg)
Total SI Mass In = 520.97 mg
Figure 5.25: Sand Pack C- Cumulative mass out base on total mass throughput

Chapter 5: Non-Equilibrium Sand Pack Experiments on OMTHP Scale Inhibitor Applied in Both
Adsorption and Precipitation Treatments
159
Sand Pack C: Mass Balance of SI ~ OMTHP
Mass In during Main Treatment = 520.97 mg
Mass Left In Sand Pack (after MT + PF) = 44.28 mg
Mass Left In Sand Pack (after MT+PF+AcW) = 37.3 mg
Description PV Mass Out
Cum Mass
Return
Cum Mass
Return
Mass Left
In Sand
Pack
Mass Left
In Sand
Pack
Cum Mass
Return
Cum Mass
Return
(ml) (mg) (mg) (%) (mg) (%) (mg) (%)
MT~20/ml/hr (OMTHP) 11.50 467.06 467.06 89.65 53.91 10.35
PF~20ml/hr (NFFW) 79.71 8.39 475.45 91.26 45.52 8.74 8.39 15.56
PF~10ml/hr (NFFW) 103.20 0.31 475.76 91.32 45.20 8.68 8.70 16.15
PF~5ml/hr (NFFW) 126.34 0.33 476.10 91.39 44.87 8.61 9.04 16.76
PF~5ml/hr (NFFW) 151.33 0.35 476.45 91.45 44.52 8.55 9.39 17.42
PF~2ml/hr (NFFW) 164.26 0.24 476.69 91.50 44.28 8.50 9.63 17.87
AcW #1~20ml/hr (Na+) 233.70 4.91 481.60 92.44 39.37 7.56 14.54 26.97
AcW #2~20ml/hr (Na+) 243.57 0.49 482.09 92.54 38.88 7.46 15.03 27.89
AcW #3~20ml/hr (Na+) 254.12 0.50 482.60 92.63 38.37 7.37 15.54 28.82
AcW #4~20ml/hr (Na+) 265.72 0.55 483.15 92.74 37.82 7.26 16.09 29.84
AcW #5~60ml/hr (Na+) 297.04 0.53 483.67 92.84 37.30 7.16 16.61 30.82
Sand from the column + 1.03 484.70 93.04 36.27 6.96 17.64 32.73
250ml of DW
( X ) ( Y )
Table 5.13: Sand Pack C – Summary of mass balance base on total mass throughput and
mass after main treatment + 2PV

Chapter 5: Non-Equilibrium Sand Pack Experiments on OMTHP Scale Inhibitor Applied in Both
Adsorption and Precipitation Treatments
160
0
5
10
15
20
25
30
35
0 50 100 150 200 250 300
% M
ass
Ou
t
PV
Sand Pack C: Mass Balance% Mass Out vs PV
SP-C
Total Total
PV Mass Out Mass Out
(mg) (%)
9.39 8.39 15.56
81.82 8.70 16.15
103.20 9.04 16.76
126.34 9.39 17.42
151.33 9.63 17.87
164.26 14.54 26.97
233.70 15.03 27.89
243.57 15.54 28.82
254.12 16.09 29.84
265.72 16.61 30.82
297.04
Figure 5.26: Sand Pack C- Mass balance base on after main treatment + 2PV
Notes: The % mass out is calculated based on mass left in sand pack after the main
treatment + the first 2 PV of post flush. The additional 2PV postflush is to remove the
“mobile phase” SI concentration ( not SI adsorbed and precipitated).

Chapter 5: Non-Equilibrium Sand Pack Experiments on OMTHP Scale Inhibitor Applied in Both
Adsorption and Precipitation Treatments
161
0
10
20
30
40
50
60
70
80
90
100
0 50 100 150 200 250 300 350
% M
ass
Out
PV
Sand Pack C: Mass Balance% Mass Out vs PV
X
Y
Figure 5.27: Sand Pack C- %Mass out base on total mass throughput and after main
treatment + 2PV
5.3.4 Sand Pack D: Dynamic Precipitation Flood – Multi Flow rate and Solubility
Effect
Sand Pack D represents a Dynamic Precipitation Flood at various flow rates and it also
shows dynamic solubility effects. The main treatment uses 4000ppm OMTHP in NFFW
(+Li+) brine at 20 ml/hr flow rate; whereas the post flush uses NFFW brine (no Li
+) and
1% Na+. The initial post flush is injected at 20ml/hr with NFFW brine (no Li
+). The
rest of the post flush uses 1% Na+ at variable flow rates of 20, 10, 5 and 2 ml/hr. The
two different post flush solutions used (i.e. NFFW and 1% Na+ brine) will define the
solubility/desorption in the postflush period. The NFFW has more total dissolved solids
(TDS =91,000ppm) compared to 1% Na+ which has 10,000ppm. It is expected that Na
+
post flush will dissolve more precipitated SI since it contains no calcium ions. The main
treatment was conducted at room temperature and the pack temperature was increased
to 95°C after shut in, and all post flushes were conducted at 95°C. The pH of all fluids
injected, which includes main treatment and post flush was adjusted to pH 4. At each
Notes: X- %Mass out base on total mass throughput Y- %Mass out base on mass after main treatment + 2PV

Chapter 5: Non-Equilibrium Sand Pack Experiments on OMTHP Scale Inhibitor Applied in Both
Adsorption and Precipitation Treatments
162
interval from the main treatment to post flush, the flow was stopped and maintained for
at least 24 hrs at 95°C. The details and chronologies of the experiment can be found in
Table 5.15.
Once the sand pack is prepared, the dead volume and pore volume were measured. The
pore volume was measured at 14.73ml at room temperature, which was used for all
calculations for this sand pack. Details of the sand pack characterization are presented in
Table 5.14.
Length of Sandpacking = 20.4 cm
Diameter = 1.5 cm
Dead Volume = 1.24 ml
Pore Volume @ RT = 14.73 ml
Porosity @ RT = 40.85 %
Pore Volume @ 95°C = 11.44 ml
Porosity @95°C = 31.72 %
Notes :
1. Pore volume at room temperature is used for all
calculations.
Sand Pack Characterization Results
Table 5.14: Sand Pack D – Characterization Results
Upon completing the characterization, NFFW (no Li+) brine was injected into the sand
pack overnight to saturate the system. The purpose of this stage is to remove any
impurities present in the sand pack so that adsorption or precipitation are the only
reasons for the observed SI behaviour. Following this conditioning stage, the dynamic
sand pack experiment was initiated starting with main treatment. Refer to Table 5.15 for
experimental details and chronologies of the injection stages.

Chapter 5: Non-Equilibrium Sand Pack Experiments on OMTHP Scale Inhibitor Applied in Both
Adsorption and Precipitation Treatments
163
No. Description Conditions Flow rate (ml/hr)
PV (Total PV)
Volume (ml) (Total Vol)
1 Main Treatment – 4000ppm OMTHP in NFFW (+50ppm Li
+)
T = 20°C pH = 4
20 1–10.6 (10.6)
1-157.5 (157.5)
Shut-in at reservoir temperature (95°C) for 40 hrs.
2 Post Flush # 1 : NFFW (no Li+)
T = 95°C pH = 4
20 10.6–84.5 (73.9)
157.5-1249 (1091.5)
Shut-in at reservoir temperature (95°C) for 49 hrs.
3 Post Flush # 2 : Na+ (no Li
+)
T = 95°C pH = 4
20 84.5–108.4 (23.9)
1249-1599 (350)
Shut-in at reservoir temperature (95°C) for 22 hrs.
4 Post Flush # 3 : Na+ (no Li
+)
T = 95°C pH = 4
10 108.4–129.6 (21.2)
1599-1914 (315)
Shut-in at reservoir temperature (95°C) for 21 hrs.
5 Post Flush # 4 : Na+ (no Li
+)
T = 95°C pH = 4
5 129.6–154.9 (25.3)
1914-2284 (370)
Shut-in at reservoir temperature (95°C) for 21 hrs.
6 Post Flush # 5 : Na+ (no Li
+)
T = 95°C pH = 4
2 154.9–168.2 (13.3)
2284-2479 (195)
Shut-in at room temperature (20°C) for 4 days 22 hrs. COMPLETED POST FLUSH.
7 Acid Wash # 1 : 1% Na+ T = 20°C pH = 1
60 168.2–190.4 ( 22.2)
2479-2809 (330)
Shut-in at room temperature (20°C) for 20 hrs.
8 Acid Wash # 2 : 1% Na+ T = 20°C pH = 1
45 190.4–207.6 (17.2)
2809-3061 (207)
Shut-in at room temperature (20°C) for 19 hrs.
9 Acid Wash # 3 : 1% Na+ T = 20°C pH = 1
30 207.6–250.0 (42.4)
3061-3684 (668)
Shut-in at room temperature (20°C) for 25 hrs.
10 Acid Wash # 4 : 1% Na+ T = 20°C pH = 1
15 250.0–271.3 (21.3)
3684-3999 (315)
Shut-In at room temperature (20°C). COMPLETED.
Table 5.15: Sand Pack D – Experimental Details and Chronologies of Injection
The effluent profile results for of the main treatment and initial post-flush stages of the
flood are shown in Figure 5.28 and Figure 5.29 for Sand Pack D. These figures show
the actual and normalized concentrations vs. pore volumes (PV) injected, respectively
for each element. The profiles of each component under study, namely, OMTHP SI,
calcium (Ca2+
), magnesium (Mg2+
) and lithium (Li+) concentrations vs. PV are
presented in these figures.
The first 10 PV injected into the pack is the scale inhibitor main treatment using
4000ppm OMTHP in NFFW(+50ppm Li+) where pH has been adjusted to pH4. The
main treatment was carried out at 20 ml/hr at room temperature. As the flow goes

Chapter 5: Non-Equilibrium Sand Pack Experiments on OMTHP Scale Inhibitor Applied in Both
Adsorption and Precipitation Treatments
164
through the first 2 to 4 PV, the OMTHP SI effluent deviates from the lithium curve.
Lithium as an inert tracer does not react with the sand mineral. Thus, the deviation
between the SI and lithium tracer is a measure of the degree of SI adsorption in the
pack. The small drop in calcium and magnesium concentrations in the frontal
breakthrough region (Figure 5.28) can also be seen in these figures which indicates that
complex formation between SI and calcium and magnesium also occurs during
adsorption. From the 4th
to 10th
PV, all the elements stabilized at their stock
concentrations; which indicates all species were fully saturated in the sand pack system.
After the 10 PV of SI injection, the flow is stopped and the sand pack is placed in a
water bath. The water bath temperature is increased from room temperature to 95°C.
The set-up was left for 40 hours of shut-in in the water bath. Then, the flow is again set
at 20 ml/hr (with the system still at 95°C). In this first post flush period, NFFW (no
Li+) at pH 4 was injected and this post flush period was carried out from the 10 PV to
85 PV of injection.
When the flow recommences after the shut-in at 10 PV, a large drop in SI concentration
was observed from 4000ppm to 950ppm (C/Co ~ 0.2), which indicates a very high SI
retention due to coupled adsorption/precipitation. Similar trends are also observed for
calcium and magnesium; where Ca2+
is reduced from 1850ppm to 1580ppm (C/Co ~
0.84) and Mg2+
is reduced from 680ppm to 615ppm (C/Co ~ 0.89). The observed
behaviour is clear evidence of SI precipitation (and adsorption) onto sand minerals and
the corresponding affinity of Ca2+
and Mg2+
to OMTHP SI in the process. Because of
the corresponding bulk static studies reported in Chapter 4, this is known to be
precipitation of SI as a calcium/magnesium complex onto sand minerals. Similar
behaviour has been seen for this exact system in different studies (Chen and Graham,
2000).
The first postflush was carried out with NFFW (high TDS and high Ca and Mg) and, at
the end of this first post flush period (85 PV) as shown in Figure 5.30 the SI
concentration dropped to ~0.3ppm and, if the flow continues the concentration will
gradually drop from this value. The calcium and magnesium levels are also stabilizing

Chapter 5: Non-Equilibrium Sand Pack Experiments on OMTHP Scale Inhibitor Applied in Both
Adsorption and Precipitation Treatments
165
around 1800 and 1850ppm and 660 and 680ppm (normalized at around C/Co ~ 0.95 for
both elements), respectively. Figure 5.30 also shows the later stage return profiles of
OMTHP precipitation floods at different flow rates and compositions of post flush fluid.
The details of the various flooding stages are described in Table 5.15. The following
observation can be summarized from the figure.
The flow was shut-in between the first and second post flush periods. It was shut-in for
49 hours at 95°C. Immediately after this shut in, the 2nd
post flush was initiated with 1%
NaCl brine (no Ca2+
and no Mg2+
). During this period, the SI concentration went as
high as 18.1ppm before decreasing to 8.6ppm and stabilizing. The 2nd
post flush period
went from 85 PV to 110 PV at a flow rate of 20 ml/hr, similar to the first post flush.
The main observation from this behaviour is that the solubility of the precipitated SI is
much higher in the fresher 1%NaCl brine than in the NFFW brine. Without any calcium
in the post flush the precipitated SI-complex solubility is much higher at which point
the level in the return curve is 8.6ppm compared to in the presence Ca2+
, where the level
was ~0.3ppm. This implies the higher solubility of precipitated SI in the absence of Ca2+
ion.
From the second to the fifth post flush periods (see Figure 5.30), 1% Na+ is used as the
post flush fluid, but at various flow rates. This is done in order to determine if there is
any effect of non-equilibrium or kinetic processes by varying the flow rates. While the
1st and 2
nd post flush flow was carried out at 20 ml/hr, the 3
rd, 4
th and 5
th used 10, 5 and
2 ml/hr, respectively. At each interval between changing the flow rates, the flow was
shut in more than 24 hours at 95°C. It can be observed that the concentration spikes up
for all the flow rates depending upon the length of the shut-in, before gradually
decreasing to a lower level. The high concentration at each shut-in shows the dissolution
of the SI concentration where it reaches (or at least approaches) equilibrium. One very
important point to note is that, the lower the flow rate, the higher the SI return
concentration (and vice versa). During the shut-in after the various flow rates,
dissolution of Ca2+
and Mg2+
can also be seen increases before going down as the flow
rate proceeds, similar to SI behaviour. After the final post flush at 2 ml/hr, the flow is

Chapter 5: Non-Equilibrium Sand Pack Experiments on OMTHP Scale Inhibitor Applied in Both
Adsorption and Precipitation Treatments
166
shut-in and the temperature was reduced from 95°C to room temperature, 20°C. In this
flood, it was shut-in for 4 days 22 hours.
Mass balance of SI left in the sand pack and returned during post flush is also
calculated. The analysis is conducted to study how much of the original SI mass is
returned after the final post flush. Details of the mass balance are presented in Table
5.17. After the main treatment, 87% of the SI mass has been returned. But after the main
treatment, the returned SI mass from 1st to 5
th post flush is only an additional 3.6%.
Total mass returned after the 5th
post flush is 90.7%, leaving 9.3% in the sand pack.
This shows that there is still SI in the sand pack after the final post flush.
The mass balance results suggested that an acid wash treatment should be carried out in
the sand pack using 1% Na+ at pH=1 in order to try to recover this missing 9.3% of the
SI. Figure 5.31 shows the results of the whole injection chronology including the acid
wash stages. Table 5.17 shows the mass balance results for the acid wash stages. Four
(4) acid wash cycles were carried out at four (4) flow rates, viz. 60, 45, 30 and 15 ml/hr.
Only an additional of 1% SI mass is collected after the final 4th
acid wash, which
accounts for a total of 91.7% of the SI, leaving 8.3% of the original SI still in the sand
pack. The influence of flow rate throughout the four (4) acid wash stages was evident
and clear non-equilibrium behaviour was observed. As in all floods, the lower the flow
rate, the higher the SI returned concentration (and vice versa). Thus, significant
quantities of SI remains in the sand pack even after the acid wash.
Finally, the sand in the sand pack was extracted and treated with stirring in 1% Na+ for
24 hours. Fluid samples were taken and sent for ICP analysis and the sand was sent for
ESEM-EDAX analysis to find out if any SI was remaining on the sand surface. Mass
balance results show that an additional 1% SI was found in the solution. However, no
SI could be detected on the sand. Refer to ESEM-EDAX results, Table 5.16 and Figure
5.32. The mass balance shows that there is still 8% SI mass presence in the sand pack
undetected.
Mass Balance base on mass left in sand pack after main treatment + 2PV of post flush:
All of the above mass balance calculation were made base on total mass-in (throughput)

Chapter 5: Non-Equilibrium Sand Pack Experiments on OMTHP Scale Inhibitor Applied in Both
Adsorption and Precipitation Treatments
167
during the main treatment. Here, mass balance is calculated bases on the mass left in
sand pack after the main treatment + 2PV of initial post flush to remove any of the
mobile phase SI (as discussed above). Thus any mass left in the sand pack is the actual
amount of mass that is being absorbed or precipitated. It was found that, the mass left
in sand pack at this stage is 82.56mg, which is being used as the total mass. Based on
this calculation, only 36% of SI came out of the sand pack, leaving 64% SI mass left in
sand pack. These phenomena show irreversible retention of SI (Kerver and Heilhecker,
1969). Detailed mass balances can be found in Table 5.18 and Figure 5.35, and a mass
balance comparison can be found in Figure 5.36.
-10
0
10
20
30
40
50
60
0
500
1000
1500
2000
2500
3000
3500
4000
4500
0 2 4 6 8 10 12 14 16 18
[Li+] (ppm)
[OM
TH
PI]
, [C
a2
+] &
[Mg
2+ ]
(pp
m)
Pore Volume (PV)
Sand Pack D : OMTHP Dynamic Precipitation FloodMain Treatment and Initial Post Flush
Phos177
Ca
Mg
Li+
[SI]= 950 ppm
[SI]= 4000 ppm
[Ca2+]= 1840ppm
[Mg2+]= 675ppm
[Ca2+]= 1550ppm
[Mg2+]= 630ppm
[Ca2+]= 1840ppm
[Ca2+]= 1580ppm
[Mg2+]= 675ppm
[Mg2+]= 615ppm
Figure 5.28: Sand Pack D- Main treatment and initial post flush stages.

Chapter 5: Non-Equilibrium Sand Pack Experiments on OMTHP Scale Inhibitor Applied in Both
Adsorption and Precipitation Treatments
168
0
0.2
0.4
0.6
0.8
1
1.2
0 2 4 6 8 10 12 14 16 18
C /
Co
Pore Volume (PV)
Sand Pack D : OMTHP Dynamic Precipitation Flood Main Treatment and Initial Post Flush(NFFW)
C/Co vs PV
Phos177
Ca
Mg
Li+
Drop in Ca2+ and Mg2+ concentrationdue to coupled adsorption/precipitation.
Drop in SI concentration due tocoupled adsorption/precipitation
Retention of SI due toadsorption ONLY
C/Co= 1 [Mg2+] C/Co= 0.96
SI C/Co= 0.24
[Ca2+] C/Co= 0.96
Figure 5.29: Sand Pack D- Main treatment and initial post flush stages. Normalized
Concentration vs. PV
-10
0
10
20
30
40
50
60
0.01
0.1
1
10
100
1000
10000
0 20 40 60 80 100 120 140 160 180
[OM
THP]
, [C
a2
+] &
[Mg
2+ ]
(ppm
)
Pore Volume (PV)
Sand Pack D : OMTHP Dynamic Precipitation FloodSummary of Main Treatment & Post Flush
[OMTHP] 177
[Ca2+]
[Mg2+]
[Li+]
Main TreatmentOMTHP in NFFWpH4 (20 ml/hr)
Post Flush(NFFW)pH4 (20 ml/hr)
Post Flush(Na+)pH4 (20 ml/hr)
Post Flush(Na+)pH4 (2 ml/hr)
Post Flush(Na+)pH4 (10 ml/hr)
Post Flush(Na+)pH4 (5 ml/hr)
[Li+] (ppm)
[SI]= 18.1 ppm
[SI]= 8.6 ppm
[SI]= 56.8 ppm
[SI]= 7.2 ppm
[SI]= 48.7 ppm
[SI]= 9.0 ppm
[SI]= 46.1 ppm
[SI]= 18.3 ppm
Figure 5.30: Sand Pack D- Main treatment and post flush stages.

Chapter 5: Non-Equilibrium Sand Pack Experiments on OMTHP Scale Inhibitor Applied in Both
Adsorption and Precipitation Treatments
169
0.1
1
10
100
1000
10000
0 50 100 150 200 250 300
[OM
THP]
(ppm
)
Pore Volume (PV)
Sand Pack D: OMTHP Dynamic Precipitation FloodSummary of Main Treatment, Post Flush & Acid Wash
[OMTHP] 177
Main TreatmentOMTHP in NFFWpH4 (20 ml/hr)
Post Flush(NFFW)pH4 (20 ml/hr)
Post Flush(Na+)pH4 (20 ml/hr)
Post Flush(Na+)pH4 (2 ml/hr)
Post Flush(Na+)pH4 (10 ml/hr)
Post Flush(Na+)pH4 (5 ml/hr)
Acid Wash(Na+)pH1 (60 ml/hr)
Acid Wash(Na+)pH1 (45 ml/hr)
Acid Wash(Na+)pH1 (30 ml/hr)
Acid Wash(Na+)pH1 (15 ml/hr)
[SI]= 38.76 ppm
[SI]=9.25 ppm [SI]=8.48 ppm [SI]=8.84 ppm
[SI]=3.25 ppm[SI]=2.37 ppm [SI]=2.57 ppm
[SI]=4.00 ppm
[SI]= 18.1 ppm
[SI]= 8.6 ppm
[SI]= 56.8 ppm
[SI]= 7.2 ppm
[SI]= 48.7 ppm
[SI]= 9.0 ppm
[SI]= 46.1 ppm
[SI]= 18.3 ppm
Figure 5.31: Sand Pack D- Main treatment, post flush and acid wash stages.
a.3a.2 b.3
b.4 c.3 c.4
Figure 5.32: Sand Pack D- ESEM picture of sand washed with Na+ (pH=1) after the
experiment.

Chapter 5: Non-Equilibrium Sand Pack Experiments on OMTHP Scale Inhibitor Applied in Both
Adsorption and Precipitation Treatments
170
Element Weight% Atomic% Weight% Atomic% Weight% Atomic% Weight% Atomic% Weight% Atomic% Weight% Atomic% Weight% Atomic% Weight% Atomic% Weight% Atomic%
- - - - - - - - - - - - - - - - - - -
O 46.25 73.86 58.29 71.25 58.4 71.27 58.24 70.95 49.74 69.53 47.5 73.37 58.35 71.14 35.76 58.3 49.8 63.65
Na 0.43 0.37 0.59 0.5 1.81 1.54 2.5 2.43 1.24 1.33 2.47 2.1 5.09 5.77 9.28 8.25
Al 1.74 1.26 1.46 1.05 0.67 0.48 0.75 0.63 0.35 0.32 - - 0.47 0.46 0.53 0.4
Mg - - - - - - - - - - - - - - - - - -
P - - - - - - - - - - - - - - - - - -
Si 17.61 16.02 37.37 26.02 37.78 26.26 37.7 26.16 18.83 14.99 17.17 15.1 36.11 25.08 15.16 14.08 29.37 21.38
Cl - - 0.42 0.23 0.61 0.34 1.57 0.86 1.84 1.16 1.52 1.06 3.06 1.68 3.69 2.72 10.76 6.21
K - - 1.74 0.87 1.16 0.58 0.21 0.12 - - - - - - - -
Ca - - - - - - - - - - - - - - - - - -
Sr - - - - - - - - - - - - - - - - - -
Zr 36.14 10.12 - - - - - - - - 31.7 8.59 - - - - - -
Ti - - - - - - - - 10.23 4.78 - - - - - - 0.26 0.11
Fe - - - - - - - - 15.89 6.36 0.53 0.23 - - 33.89 15.83 - -
Cr - - - - - - - - - - - - - - 3.38 1.7 - -
Mn - - - - - - - - - - - - - - 0.58 0.28 - -
Ni - - - - - - - - - - - - - - 1.97 0.88 - -
Totals 100 100 100 100 100 100 100 100 100
c-3 c-4 c-5a-2 a-3 a-4 b-3 b-4 b-5
Table 5.16: : Sand Pack D: EDAX results of sand washed with Na+ (pH=1) after the
experiment. No P, Ca2+
or Mg2+
was seen.
Notes: Sand pack samples after the main treatment, post flush and acid wash. Three
samples were sent for analysis.

Chapter 5: Non-Equilibrium Sand Pack Experiments on OMTHP Scale Inhibitor Applied in Both
Adsorption and Precipitation Treatments
171
Sand Pack D: Mass Balance of SI OMTHP
Mass Throughput @ MT = 640.05 mg
Mass Left In Sand Pack (after MT + PF) = 59.62 mg
Mass Left In Sand Pack (after MT+PF+AcW) = 53.19 mg
Description PV Mass Return
Cum Mass
Return
Cum Mass
Return
Mass Left In
Sand Pack
Mass Left In
Sand Pack
(ml) (mg) (mg) (%) (mg) (%)
MT~20/ml/hr (OMTHP) 10.59 538.14 538.14 84.08 101.91 15.92
PF~20ml/hr (NFFW) 84.45 27.35 565.49 88.35 74.56 11.65
PF~20ml/hr (Na+) 108.42 4.26 569.75 89.02 70.30 10.98
PF~10ml/hr (Na+) 129.60 3.09 572.84 89.50 67.20 10.50
PF~5ml/hr (Na+) 154.89 3.94 576.79 90.12 63.26 9.88
PF~2ml/hr (Na+) 168.23 3.64 580.43 90.68 59.62 9.32
AcW~60ml/hr(Na+) 190.36 1.99 582.42 91.00 57.63 9.00
AcW~45ml/hr(Na+) 207.6 0.85 583.27 91.13 56.78 8.87
AcW~30ml/hr(Na+) 250 2.06 585.33 91.45 54.72 8.55
AcW~15ml/hr(Na+) 271.32 1.53 586.86 91.69 53.19 8.31
Sand from the column + 1 587.86 91.85 52.19 8.15
250ml of Na+ (pH=1)
Table 5.17: Sand Pack D- Mass balance base on total mass throughput

Chapter 5: Non-Equilibrium Sand Pack Experiments on OMTHP Scale Inhibitor Applied in Both
Adsorption and Precipitation Treatments
172
101.91mg
74.56mg
70.30mg67.20mg 63.26mg
59.62mg
57.63mg56.78mg
54.72mg 53.19mg
0
20
40
60
80
100
120
0.1
1
10
100
1000
10000
0 50 100 150 200 250 300
[OM
THP]
(ppm
)
Pore Volume (PV)
Sand Pack D : OMTHP Dynamic Precipitation FloodSummary of Main Treatment, Post Flush & Acid Wash
SI Mass Balance
[SI]
SI Mass still in Sand Pack (mg)
Main TreatmentOMTHP in NFFWpH4 (20 ml/hr)
Post Flush(NFFW)pH4 (20 ml/hr)
Post Flush(Na+)pH4 (20 ml/hr)
Post Flush(Na+)pH4 (2 ml/hr)
Post Flush(Na+)pH4 (10 ml/hr)
Post Flush(Na+)pH4 (5 ml/hr)
SI Mass still in Sand Pack (m
g)
Note: Total SI Mass In = 640.05 mg
(15.92%)
(11.65%)
(10.98%)(10.50%)
(9.88%)
(9.32%)
Acid Wash(Na+)pH1 (60 ml/hr)
Acid Wash(Na+)pH1 (45 ml/hr)
Acid Wash(Na+)pH1 (30 ml/hr)
Acid Wash(Na+)pH1 (15 ml/hr)
(9.00%)(8.87%)
(8.55%) (8.31%)
Figure 5.33: Sand Pack D- Mass still in sand pack base on total mass throughput
84.08%
88.35%
89.02%
89.50%
90.12%90.68% 91.00%
91.13%
91.45%
91.69%
83
84
85
86
87
88
89
90
91
92
93
0.1
1
10
100
1000
10000
0 50 100 150 200 250 300
[OM
THP]
(ppm
)
Pore Volume (PV)
Sand Pack D : OMTHP Dynamic Precipitation FloodSummary of Main Treatment, Post Flush & Acid Wash
SI Mass Balance
[SI]
SI Mass still in Sand Pack (mg)
Main TreatmentOMTHP in NFFWpH4 (20 ml/hr)
Post Flush(NFFW)pH4 (20 ml/hr)
Post Flush(Na+)pH4 (20 ml/hr)
Post Flush(Na+)pH4 (2 ml/hr)
Post Flush(Na+)pH4 (10 ml/hr)
Post Flush(Na+)pH4 (5 ml/hr)
Cum
SI Mass R
eturns (%)
Note: Total SI Mass In = 640.05 mg
(538.14mg)
(565.49mg)
(569.75mg)
(572.84mg)
(576.79mg)(580.43mg)
Acid Wash(Na+)pH1 (60 ml/hr)
Acid Wash(Na+)pH1 (45 ml/hr)
Acid Wash(Na+)pH1 (30 ml/hr)
Acid Wash(Na+)pH1 (15 ml/hr)
(582.42mg)
(583.27mg)
(585.33mg)
(586.86mg)
Figure 5.34: Sand Pack D- Cumulative mass out base on total mass throughput

Chapter 5: Non-Equilibrium Sand Pack Experiments on OMTHP Scale Inhibitor Applied in Both
Adsorption and Precipitation Treatments
173
Sand Pack D : Mass Balance of SI OMTHP
Mass In during Main Treatment = 640.05 mg
Mass Left In Sand Pack (after MT + PF) = 59.62 mg
Mass Left In Sand Pack (after MT+PF+AcW) = 52.19 mg
Description PV Mass Out
Cum Mass
Return
Cum Mass
Return
Mass Left
In Sand
Pack
Mass Left
In Sand
Pack
Cum Mass
Return
Cum Mass
Return
(ml) (mg) (mg) (%) (mg) (%) (mg) (%)
MT~20/ml/hr (OMTHP) 12.70 557.49 557.49 87.10 82.56 12.90
PF~20ml/hr (NFFW) 82.35 8.00 565.49 88.35 74.56 11.65 8.00 9.69
PF~20ml/hr (Na+) 108.42 4.26 569.75 89.02 70.29 10.98 12.26 14.86
PF~10ml/hr (Na+) 129.60 3.09 572.85 89.50 67.20 10.50 15.36 18.60
PF~5ml/hr (Na+) 154.89 3.94 576.79 90.12 63.26 9.88 19.30 23.37
PF~2ml/hr (Na+) 168.23 3.64 580.43 90.68 59.62 9.32 22.94 27.78
AcW~60ml/hr(Na+) 190.36 1.99 582.42 91.00 57.63 9.00 24.93 30.19
AcW~45ml/hr(Na+) 207.6 0.85 583.27 91.13 56.78 8.87 25.78 31.22
AcW~30ml/hr(Na+) 250 2.06 585.33 91.45 54.72 8.55 27.84 33.72
AcW~15ml/hr(Na+) 271.32 1.53 586.86 91.69 53.19 8.31 29.37 35.57
Sand from the column + 290 1 587.86 91.85 52.19 8.15 30.37 36.57
250ml of Na+ (pH=1)
( X ) ( Y )
Table 5.18: Sand Pack D- Mass balance base on total mass throughput and mass after
main treatment + 2PV
Notes: The % mass out is calculated based on the total mass after the main treatment +
first 2 PV of post flush. The additional 2PV is to account for the “mobile phase” SI
concentration ( not SI adsorbed and precipitated).
Mass-In Sand Pack after the main treatment + 2PV of post flush is 82.56 mg.

Chapter 5: Non-Equilibrium Sand Pack Experiments on OMTHP Scale Inhibitor Applied in Both
Adsorption and Precipitation Treatments
174
0
5
10
15
20
25
30
35
40
0 50 100 150 200 250 300
% M
ass
Ou
t
PV
Sand Pack D: Mass Balance% Mass Out vs PV
SP-D
Total Total
PV Mass Out Mass Out
(mg) (%)
10.59 8.00 9.69
84.45 12.26 14.86
108.42 15.36 18.60
129.60 19.30 23.37
154.89 22.94 27.78
168.23 24.93 30.19
190.36 25.78 31.22
207.60 27.84 33.72
250.00 29.37 35.57
271.32
Figure 5.35: Sand Pack D- Mass balance base on mass after Main Treatment + 2PV

Chapter 5: Non-Equilibrium Sand Pack Experiments on OMTHP Scale Inhibitor Applied in Both
Adsorption and Precipitation Treatments
175
0
10
20
30
40
50
60
70
80
90
100
0 50 100 150 200 250 300
% M
ass
Out
PV
Sand Pack D: Mass Balance% Mass Out vs PV
X
Y
Figure 5.36: Sand Pack D- %Mass out base on total mass throughput and mass after
main treatment + 2PV
5.3.5 Sand Pack E: Low Concentration Dynamic Adsorption Flood–Multi Flow
Rate
OMTHP Static Compatibility Test designed for Sand Pack E
This static compatibility test was carried out prior to Sand Pack Dynamic Flood E to
ensure the flood is actually a purely adsorption flood. The OMTHP static compatibility
test conducted previously (see Chapter 4), clearly showed that there was no
precipitation at 500ppm OMTHP in NFFW at 95°C after 24hrs. This specific static
compatibility test was executed using the SI and NFFW brine prepared for this
particular sand pack study. The result assures that we use the same system in both static
and dynamic studies.
Figure 5.37 shows the results of phosphorous and Li+ changes as the OMTHP
concentration increases in the static compatibility test. Precipitation is only observed
from 800ppm OMTHP and above. From OMTHP static adsorption tests using different
Notes: X- %Mass Out base on Total Mass Throughput Y- %Mass Out base on after Main Treatment + 2PV

Chapter 5: Non-Equilibrium Sand Pack Experiments on OMTHP Scale Inhibitor Applied in Both
Adsorption and Precipitation Treatments
176
masses of sand (refer to Chapter 4), the result clearly shows that only adsorption is
taking place below 800ppm OMTHP; above this concentration then coupled
adsorption/precipitation is occurring.
-1000
-900
-800
-700
-600
-500
-400
-300
-200
-100
0
100
0 50 100 500 800 1000 2000 4000
Cha
nge
in [P
]& [L
i+] (
ppm
)
[OMTHP] (ppm)
OMTHP Static Compatibility TestChange in [P] and [Li+] after 24hrs heating and filtration process
Phos214 -Avg
Li+ -Avg
Figure 5.37: OMTHP Static Compatibility Test at 95°C. Change in P and Li+ ion after
24 hrs at 95°C and pH4
The filtrate was weighted and sent for ESEM-EDAX analysis to see if there was any
phosphorus in the precipitate. Figure 5.38 shows that traces of filtrate can be seen from
1000ppm and clear precipitate was observed from 2000ppm. The increase in weight of
filtrate can also be seen from 2000ppm onward. Table 5.19 and Figure 5.39 show
ESEM-EDAX results. SI can be clearly seen on the filter paper based on ESEM pictures
from 800ppm and above, which is shown by the hazy white patches to indicate the
presence of phosphorous. Quantitatively, EDAX shows that phosphorous, calcium and
magnesium elements can be found consistently above 1000ppm. This evidence with ICP
analysis above proves that only adsorption is taking place below 800ppm. This is very
important evidence before proceeding to dynamic sand pack study, which shows the
main treatment at 500ppm OMTHP at 95°C is a pure adsorption flood.

Chapter 5: Non-Equilibrium Sand Pack Experiments on OMTHP Scale Inhibitor Applied in Both
Adsorption and Precipitation Treatments
177
Blank 50 ppm
100 ppm 500 ppm
800 ppm 1000 ppm
2000 ppm 4000 ppm
Sample Filtrate
Conc.(ppm) Weight(g)
Blank 0.02
50 0.02
100 0.02
500 0.02
800 0.02
1000 0.02
2000 0.06
4000 0.20
Figure 5.38: OMTHP Static Compatibility Test at 95°C. Filtrate picture and weight of
precipitate after filtration.
Blank 50 ppm 100 ppm 500 ppm
800 ppm 1000 ppm 2000 ppm 4000 ppm
Figure 5.39: OMTHP Static Compatibility Test. ESEM picture of filtrate.

Chapter 5: Non-Equilibrium Sand Pack Experiments on OMTHP Scale Inhibitor Applied in Both
Adsorption and Precipitation Treatments
178
Element Weight% Atomic% Weight% Atomic% Weight% Atomic% Weight% Atomic% Weight% Atomic% Weight% Atomic% Weight% Atomic% Weight% Atomic%
C 36.62 44.28 33.88 42.52 0 0 33.62 42.74 32.82 41.52 0 0 15.85 24.51 18.8 28.21
O 59.16 53.7 55.08 51.89 51.6 66.33 52.98 50.55 55.57 52.77 67.56 80.11 46.87 54.41 47.53 53.54
Na 1.27 0.8 3.97 2.61 17.97 16.08 4.05 2.69 2.5 1.66 7.58 6.25 1.06 0.86
Mg 0.45 0.28 0.94 0.73 1.39 1.06 1.15 0.86
P 0.19 0.09 1.99 0.98 3.49 2.14 20.33 12.19 19.92 11.59
Cl 2.95 1.21 6.81 2.89 29.35 17.03 8.79 3.78 5.45 2.34 17.62 9.43 4.1 2.15 2.48 1.26
K 0.34 0.18 0.49 0.24
Ca 0.26 0.1 0.75 0.39 0.37 0.14 1.21 0.46 2.32 1.1 10.4 4.82 10.11 4.55
Sr 0 0
Totals 100 100 100 100 100 100 100 100
2000 ppm 4000 ppmBlank 50 ppm 100 ppm 500 ppm 800 ppm 1000 ppm
Table 5.19: OMTHP Static Compatibility Test. EDAX results of filtrate.
Sand Pack E: Dynamic Adsorption Flood
The sand pack E flood represents a low concentration dynamic adsorption flood at
variable flow rates. The main treatment uses 500ppm OMTHP in NFFW (+Li+) brine at
20 ml/hr flow rate; whereas the post flush is carried out using NFFW (no Li+) brine at
flow rates of 20, 10, 5 and 2 ml/hr. The main treatment was conducted at room
temperature and all post flushes were conducted at 95°C. All injected fluids were
adjusted to pH 4. Between each interval from the main treatment through to the various
post flush stages, the flow was stopped and shut in for at least 24 hrs at 95°C.
Once the sand pack is prepared, the dead volume and pore volume were measured. The
dead volume and pore volume were measured to be 1.34ml and 14.60ml, respectively.
The pore volume was used for all calculations for this sand pack, which is used to track
the amount of volume which went through the sand pack. Details of sand pack
characterization can be found in Table 5.20.

Chapter 5: Non-Equilibrium Sand Pack Experiments on OMTHP Scale Inhibitor Applied in Both
Adsorption and Precipitation Treatments
179
Length of Sandpacking = 20.4 cm
Diameter = 1.5 cm
Dead Volume = 1.34 ml
Pore Volume @ RT = 14.6 ml
Porosity @ RT = 40.87 %
Pore Volume @ 95°C = 12.18 ml
Porosity @95°C = 33.78 %
Notes :
1. Pore volume at room temperature is used for all
calculations.
Sand Pack Characterization Results
Table 5.20: Sand Pack E – Characterization Results
Once the characterization was completed, NFFW (no Li+) brine was injected into the
sand pack overnight to saturate the system. The purpose of this was to remove any
impurities present in the sand pack. After this, the dynamic sand pack experiment was
initiated starting with main treatment. Refer to Table 5.21 for experimental details and
chronology of the injection stages.
No. Description Conditions Flow rate
(ml/hr)
PV
(Total PV)
Volume (ml)
(Total Vol)
1 Main Treatment – 500ppm OMTHP
in NFFW (+50ppm Li+)
T = 20°C
pH = 4
20 1–9.8
(9.8)
0-146
(146)
Shut-in at reservoir temperature (95°C) for 42 hrs.
2 Post Flush # 1 : NFFW (no Li+)
T = 95°C
pH = 4
20 9.8–109.2
(99.4)
146-1600
(1454)
Shut-in at reservoir temperature (95°C) for 24 hrs.
3 Post Flush # 2 : NFFW (no Li+)
T = 95°C
pH = 4
10 109.2–141.4
(32.2)
1600-2070
(470)
Shut-in at reservoir temperature (95°C) for 44 hrs.
4 Post Flush # 3 : NFFW (no Li+)
T = 95°C
pH = 4
5 141.4–167.8
(26.4)
2070-2455
(385)
Shut-in at reservoir temperature (95°C) for 26 hrs.
5 Post Flush # 4 : NFFW (no Li+)
T = 95°C
pH = 4
2 167.8–184.3
(16.5)
2455-2692
(237)
Shut-in at room temperature (20°C) for 3 days 1 hr. COMPLETED POST FLUSH.

Chapter 5: Non-Equilibrium Sand Pack Experiments on OMTHP Scale Inhibitor Applied in Both
Adsorption and Precipitation Treatments
180
6 Acid Wash # 1 : 1% Na+ T = 20°C
pH = 1
60 184.3–210.1
( 25.8)
2692-3070
(378)
Shut-in at room temperature (20°C) for 24 hrs.
7 Acid Wash # 2 : 1% Na+ T = 20°C
pH = 1
45 210.1–257.6
(47.5)
3070-3763
(693)
Shut-in at room temperature (20°C) for 55 hrs.
8 Acid Wash # 3 : 1% Na+ T = 20°C
pH = 1
30 257.6–290.3
(32.7)
3763-4243
(480)
Shut-in at room temperature (20°C) for 24 hrs.
9 Acid Wash # 4 : 1% Na+ T = 20°C
pH = 1
15 290.3–317.7
(27.4)
4243-4643
(400)
Shut-In at room temperature (20°C). COMPLETED.
Table 5.21: Sand Pack E – Experimental Details and Chronologies of Injection
The main treatment was carried out using 500ppm OMTHP in NFFW (+Li+) at room
temperature, at 20 ml/hr. The flow continued for about 10 PV before shutting in the
system. At this point, the system was saturated with 500ppm OMTHP. In fact, it
normally took only 3 to 4 PV to have the sand pack fully saturated with SI. This
behaviour is shown in Figure 5.41 where the normalized SI concentration rises to its
stock concentration after ~4PV. The temperature was then increased to 95°C and left for
at least 24 hrs. Based on the OMTHP static compatibility/adsorption tests reported
above, only adsorption is expected for this system at both room temperature and 95°C.
After the 24 hrs shut in, the first post flush with NFFW (no Li+) brine was initiated at 20
ml/hr and this stage was continued for 110PV to ensure that the effluent concentration
reached a suitable low value (<1ppm). The flow was then stopped and left for at least
24 hrs at 95°C after which flow recommenced at 10, 5, 5 and 2 ml/hr. After each flow
rate, the flow was stopped for at least 24 hrs at 95°C. Effluents were taken at a set
interval at all flow rates, which were analysed by ICP for the various species of interest.
From the concentrations analyzed by ICP, the mass of returned SI was calculated to
decide whether further flow is required. If the mass-out does not match the mass-in of
the SI, further flow is required. In this case, the results showed there was still mass in
the sand pack. This led to carrying out an acidization treatment of the sand pack with
Na+(pH=1) to extract the SI. Details of acidized flow rate and pore volumes are
presented in Table 5.21.

Chapter 5: Non-Equilibrium Sand Pack Experiments on OMTHP Scale Inhibitor Applied in Both
Adsorption and Precipitation Treatments
181
The effluent results for the main treatment and first post-flush stages of the OMTHP SI
adsorption flood are shown in Figure 5.40 and Figure 5.41 for Sand Pack E. These
figures show the actual and normalized concentrations vs. pore volumes (PV) for each
component, respectively; viz. OMTHP SI, calcium (Ca2+
), magnesium (Mg2+
) and
lithium (Li+) concentrations vs. PV.
The first 10 PV of injection is the main treatment using 500ppm OMTHP in NFFW
(+50ppm Li+) at pH 4 at room temperature, 20°C. At pH4 and 20°C, bulk static
compatibility tests shows there is only adsorption under these conditions, and hence this
flood in Pack E is purely an adsorption flood. The main treatment is carried out at 20
ml/hr, at room temperature. After ~4PV of main SI injection, the OMTHP SI effluent
profile deviates from the Lithium tracer effluent curve due to SI adsorption (as
established in static adsorption/ compatibility tests. A very slight drop in calcium and
magnesium concentrations is observed during the first 4 PV in this adsorption flood
(Figure 5.40 and Figure 5.41); this is much less than was observed in the corresponding
precipitation floods (e.g. see Figure 5.19, Figure 5.20, Figure 5.29 etc). However, all
species reach their input concentrations after a few PV of injection indicating that the
sand pack is fully saturated with SI at full input concentration.
After 10PV of injection of 500ppm SI, the flow is stopped and the sand pack is placed
in a water bath. The water bath temperature is increased from room temperature to 95°C
and the system was then left for 42 hours shut-in. After the shut-in, the flow was
resumed at 20 ml/hr at 95°C. This is the first post flush period and NFFW with no Li+
was injected at pH 4 for 110PV.
When the flow was resumed after the shut-in at 10 PV, a large drop in SI concentration
was observed from 500ppm to 50ppm (normalized to C/C0 ~ 0.1), which indicates a
very high SI retentions due to increased adsorption at the higher temperature. There is a
slight drop in Ca2+
and Mg2+
observed after the main treatment.
At the end of first post flush period (110 PV) , the SI concentration dropped to around
~0.3ppm and seemed to be stabilizing (see Figure 5.42). This figure also shows the later
stage return profiles of OMTHP adsorption flood at various flow rates with the same

Chapter 5: Non-Equilibrium Sand Pack Experiments on OMTHP Scale Inhibitor Applied in Both
Adsorption and Precipitation Treatments
182
post flush fluid. The details of the various stages are described in Table 5.21. The
following observation can be summarized from the figure.
The flow was shut-in for 24 hours at 95°C between the first and second post flush
periods. Immediately after the start of the second post flush, the SI concentration spiked
up before reducing to 0.4ppm and stabilizing. The spike is expected after the shut in of
more than 24hrs, during which time it equilibrates in the adsorption/desorption process.
From second to the fourth post flush periods, the same NFFW was used as the post flush
brine, but at various flow rates. This was done in order to study if there is any impact
due to non-equilibrium or kinetic processes. While the first post flush flow was at 20
ml/hr; the 2nd
, 3rd
and 4th
were carried out at 10, 5 and 2 ml/hr, respectively. At each
point between changing the flow rates, the flow was shut in for more than 20 hours at
95°C. It can be observed that the concentration spikes up in all of these shut in periods
and, when flow is resumed, the [SI] before gradually decreasing to a lower steady level.
Again, it is observed that, the lower the flow rate, the higher the SI flowing
concentration (and vice versa) indicating clear non-equilibrium behaviour. After the
final post flush at 2 ml/hr, the flow is shut-in and the temperature was reduced from
95°C to room temperature, 20°C. The pack was then shut-in for 3 days 1 hour.
The mass balance of SI left in the sand pack and returned during post flush is also
calculated to determine if all the SI mass is returned after the final post flush. Details of
the mass balance are presented in Table 5.23. After the main treatment, 74.5% of the SI
mass has been returned. But after the main treatment, the returned SI mass from 1st to
4th
post flush is only an additional ~1.5%. The total mass returned after the 4th
post flush
is only 76%, thus leaving 24% of the injected SI still in the sand pack after the final post
flush. This SI appears to be irreversibly adsorbed in the sand pack.
The mass balance results led us to carry out an acid wash on the sand pack Using 1%
NaCl brine at pH1 to acidize the sand pack. in order to extract any SI left in the system.
Figure 5.43 shows the results of the whole injection chronology including the acid wash
period.Table 5.23 shows the results of the acid wash mass balance. Four acid washes
were executed at four flow rates, i.e. 60, 45, 30 and 15 ml/hr. An additional of 18% SI

Chapter 5: Non-Equilibrium Sand Pack Experiments on OMTHP Scale Inhibitor Applied in Both
Adsorption and Precipitation Treatments
183
mass was collected after the final 4th
acid wash, which account to a total of 94%,
leaving 6% SI in the sand pack. Figure 5.45 and Figure 5.46 show the %mass still in
sand pack and %mass out respectively over all of the flooding cycles.
Finally, the sand in the sand pack was removed and treated with stirring in 1% Na+ for
24 hours. Fluid samples were taken and sent for ICP analysis and the sand was sent for
ESEM-EDAX analysis to determine if SI was present in the sand pack. Referring to
Figure 5.44 and Table 5.22, the results show that there is no SI mass on the sand based
on ESEM-EDAX analysis. In contrast, base on mass balance analysis there is an
additional of ~ 2% SI in the solution. It must be noted that ESEM-EDAX does not
detect these elements at very low levels. The mass balance shows that there is still 4%
of the SI mass presence in the sand pack undetected, which indicates irreversible
adsorption behaviour (Kerver and Heilhecker, 1969).
Mass Balance base on mass left in sand pack after main treatment + 2PV of post flush:
All the above mass balance calculation were made based on the total mass-in
(throughput) during main treatment. Here, mass balance is calculated base on mass left
in sand pack after main treatment + 2PV of initial post flush to remove the mobile phase
in the sand pack (as discussed above) Thus, the mass left in the sand pack is 17.36mg,
which is being used as the total mass. Based on this calculation, 85% of SI came out of
the sand pack, leaving 15% SI mass left in the system. These results indicate that
irreversible adsorption of SI is occurring. A detailed mass balance can be found in Table
5.24 and Figure 5.47. Comparison between the two methods for calculating %mass out
is shown in Figure 5.48.

Chapter 5: Non-Equilibrium Sand Pack Experiments on OMTHP Scale Inhibitor Applied in Both
Adsorption and Precipitation Treatments
184
0
200
400
600
800
1000
1200
1400
1600
1800
2000
-100
0
100
200
300
400
500
600
-1 1 3 5 7 9 11 13 15
[Ca2
+]
& [
Mg2
+]
(pp
m)
[OM
THP
I] &
[Li+
] (pp
m)
Pore Volume (PV)
Sand Pack E : OMTHP Dynamic Adsorption FloodMain Treatment and Initial Post Flush
Phos177Li+Ca2+Mg2+
[Mg2+]=690ppm
[Ca2+]=1830pm
[SI]=480ppm
[SI]=50ppm
[Ca2+]=1930pm
[Ca2+]=1830pm
[Mg2+]=690ppm
[Mg2+]=700ppm
Figure 5.40: Sand Pack E- Main treatment and initial post flush stage.
-0.2
0
0.2
0.4
0.6
0.8
1
1.2
-1 1 3 5 7 9 11 13 15
[OM
THP
I], [
Ca
2+] &
[Mg
2+ ]
, [Li
+] (
ppm
)
Pore Volume (PV)
Sand Pack E : OMTHP Dynamic Adsorption FloodMain Treatment and Post Flush
C/Co vs PVPhos177Ca2+
[SI] C/Co=0.1
C/Co=1
[Ca2+] C/Co= 0.98
[Mg2+] C/Co= 0.98
[Ca2+] C/Co= 0.98
[Mg2+] C/Co= 0.98
Figure 5.41: Sand Pack E- Main treatment and initial post flush stage. Normalized
concentration vs. PV

Chapter 5: Non-Equilibrium Sand Pack Experiments on OMTHP Scale Inhibitor Applied in Both
Adsorption and Precipitation Treatments
185
-10
0
10
20
30
40
50
60
0.001
0.01
0.1
1
10
100
1000
10000
0 20 40 60 80 100 120 140 160 180 200
[OM
THP
], [C
a2
+] &
[Mg
2+ ]
(ppm
)
Pore Volume (PV)
Sand Pack E: OMTHP Dynamic Adsorption FloodSummary of Main Treatment & Post Flush
Conc. vs PV
[OMTHP]177-Rpt
[Ca2+]
[Mg2+]
[Li+]
Main TreatmentOMTHP in NFFWpH4 (20 ml/hr)
Post Flush(NFFW)pH4 (20 ml/hr)
Post Flush(NFFW)pH4 (10 ml/hr)
Post Flush(NFFW)pH4 (5 ml/hr)
[Li+] (ppm)
Post Flush(NFFW)pH4 (2 ml/hr)
[SI]=0.04ppm [SI]=0.07ppm
[SI]=0.3ppm
[SI]=0.15ppm
Figure 5.42: Sand Pack E- Main treatment and post flush stages.
-10
0
10
20
30
40
50
60
0.001
0.01
0.1
1
10
100
1000
10000
0 50 100 150 200 250 300 350
[OM
THP
], [
Ca2
+]
& [
Mg2
+ ] (
pp
m)
Pore Volume (PV)
Sand Pack E: OMTHP Dynamic Adsorption FloodSummary of Main Treatment, Post Flush & Acid Wash
Conc. vs PV
[OMTHP]177-Rpt
[Ca2+]
[Mg2+]
[Li+]
Main TreatmentOMTHP in NFFWpH4 (20 ml/hr)
Post Flush(NFFW)pH4 (20 ml/hr)
Post Flush(NFFW)pH4 (10 ml/hr)
Post Flush(NFFW)pH4 (5 ml/hr)
[Li+] (ppm)
Post Flush(NFFW)pH4 (2 ml/hr)
Acid Wash #1(Na+)pH1 (60 ml/hr)
Acid Wash #2(Na+)pH1 (45 ml/hr)
Acid Wash #3(Na+)pH1 (30 ml/hr)
Acid Wash #4(Na+)pH1 (15 ml/hr)
Figure 5.43: Sand Pack E- Main treatment, post flush and acid wash stages.

Chapter 5: Non-Equilibrium Sand Pack Experiments on OMTHP Scale Inhibitor Applied in Both
Adsorption and Precipitation Treatments
186
1.a: Zoom 50x 1.b: Zoom 500x
2.a: Zoom 50x 2.b: Zoom 500x
Figure 5.44: Sand Pack E- ESEM picture of sand washed with Na+ (pH=1) after the
experiment. The picture indicates no precipitation of SI
Element Weight% Atomic%
O 58.43 71.36
Na 0.56 0.47
Al 1.18 0.86
Si 37.69 26.22
S 0 0
Cl 0.37 0.2
K 1.77 0.88
Totals 100 99.99
Element Weight% Atomic%
O 57.56 70.59
Al 1.5 1.09
Si 39.49 27.59
K 1.46 0.73
Totals 100 100
Sample 1.b Sample 2.b
Table 5.22: Sand Pack E: EDAX results of sand washed with Na+ (pH=1) after the
experiment. No presence of P, Ca2+
or Mg2+
was seen.
Notes: Sand pack samples after the main treatment, post flush and acid wash. The sand
samples are repeated twice. No phosphorous, calcium and magnesium in the sand
sample was found after acidized with Na+ (pH=1).

Chapter 5: Non-Equilibrium Sand Pack Experiments on OMTHP Scale Inhibitor Applied in Both
Adsorption and Precipitation Treatments
187
Sand Pack E: Mass Balance of SI OMTHP
Mass Througput @ MT = 70.73 mg
Mass Left In Sand Pack (after MT+PF) = 16.97 mg
Mass Left In Sand Pack (after MT+PF+AcW) = 4.18 mg
Description PV Mass Return
Cum Mass
Return
Cum Mass
Return
Mass Left In
Sand Pack
Mass Left In
Sand Pack
(ml) (mg) (mg) (%) (mg) (%)
MT~20/ml/hr (OMTHP) 9.83 52.67 52.67 74.47 18.06 25.53
PF~20ml/hr (NFFW) 109.25 0.94 53.61 75.79 17.12 24.21
PF~10ml/hr (NFFW) 141.44 0.04 53.64 75.84 17.08 24.16
PF~5ml/hr (NFFW) 167.81 0.07 53.71 75.94 17.02 24.06
PF~2ml/hr (NFFW) 184.28 0.05 53.76 76.01 16.97 23.99
AcW~60ml/hr(Na+) 210.07 6.82 60.58 85.65 10.15 14.35
AcW~45ml/hr(Na+) 257.64 3.31 63.89 90.34 6.83 9.66
AcW~30ml/hr(Na+) 290.27 1.50 65.39 92.46 5.34 7.54
AcW~15ml/hr(Na+) 317.67 1.16 66.54 94.09 4.18 5.91
Sand from the column + 1.5 68.04 96.21 2.68 3.79
250ml of Na+ (pH=1).
Table 5.23: Sand Pack E- Mass balance base on total mass throughput
Notes: Finally the sand is extracted from the sand packing column, and washed with
250ml of Na+ (pH=1). The solution is stirred for 24 hrs and representative liquid
samples were taken for ICP analysis. The ICP measurement indicates ~6 ppm of SI in
the extracted brine, which is equivalent to ~1.5 mg of SI.

Chapter 5: Non-Equilibrium Sand Pack Experiments on OMTHP Scale Inhibitor Applied in Both
Adsorption and Precipitation Treatments
188
0
5
10
15
20
25
30
0.001
0.01
0.1
1
10
100
1000
0 50 100 150 200 250 300 350
SI M
ass
still
in S
and
Pack
(%)
[OM
THP
] (p
pm
)
Pore Volume (PV)
Sand Pack E : OMTHP Dynamic Adsorption FloodSummary of Main Treatment, Post Flush & Acid Wash
Conc. vs PV
[OMTHP]177-Rpt
SI Mass still in Sand Pack (%)
Main TreatmentOMTHP in NFFWpH4 (20 ml/hr)
Post Flush(NFFW)pH4 (20 ml/hr)
Post Flush(NFFW)pH4 (10 ml/hr)
Post Flush(NFFW)pH4 (5 ml/hr)
Post Flush(NFFW)pH4 (2 ml/hr)
Acid Wash #1(Na+)pH1 (60 ml/hr)
Acid Wash #2(Na+)pH1 (45 ml/hr)
Acid Wash #3(Na+)pH1 (30 ml/hr)
Acid Wash #4(Na+)pH1 (15 ml/hr)
17.36mg(24.55%)
16.66mg(23.56%)
16.63mg(23.51%)
16.56mg(23.42%)
16.51mg(23.34%)
9.69mg(13.70%)
6.38mg(9.02%)
4.88mg(6.90%)
3.72mg(5.27%)
Figure 5.45: Sand Pack E- Mass still in sand pack base on total mass throughput
70
75
80
85
90
95
100
0.001
0.01
0.1
1
10
100
1000
0 50 100 150 200 250 300 350
Cu
m S
I Ma
ss R
etu
rn (%
)
[OM
THP
] (pp
m)
Pore Volume (PV)
Sand Pack E : OMTHP Dynamic Adsorption FloodSummary of Main Treatment, Post Flush & Acid Wash
Conc. vs PV
[OMTHP]177-Rpt
Cum SI Mass Returns (%)
Main TreatmentOMTHP in NFFWpH4 (20 ml/hr)
Post Flush(NFFW)pH4 (20 ml/hr)
Post Flush(NFFW)pH4 (10 ml/hr)
Post Flush(NFFW)pH4 (5 ml/hr)
Post Flush(NFFW)pH4 (2 ml/hr)
Acid Wash #1(Na+)pH1 (60 ml/hr)
Acid Wash #2(Na+)pH1 (45 ml/hr)
Acid Wash #3(Na+)pH1 (30 ml/hr)
Acid Wash #4(Na+)pH1 (15 ml/hr)
75.45%53.37mg
76.44%54.06mg
76.49%54.10mg
76.58%54.16mg
76.66%54.22mg
86.30%61.03mg
90.98%64.35mg
93.10%65.85mg
94.73%67.00mg
Figure 5.46: Sand Pack E- Cumulative mass out base on total mass throughput

Chapter 5: Non-Equilibrium Sand Pack Experiments on OMTHP Scale Inhibitor Applied in Both
Adsorption and Precipitation Treatments
189
Sand Pack E : Mass Balance of SI OMTHP
Mass In during Main Treatment = 70.73 mg
Mass Left In Sand Pack (after MT + PF) = 16.97 mg
Mass Left In Sand Pack (after MT+PF+AcW) = 3.79 mg
Description PV Mass Return
Cum Mass
Return
Cum Mass
Return
Mass Left
In Sand
Pack
Mass Left
In Sand
Pack
Cum Mass
Return
Cum Mass
Return
(ml) (mg) (mg) (%) (mg) (%) (mg) (%)
MT~20/ml/hr (OMTHP) 11.92 53.37 53.37 75.45 17.36 24.55
PF~20ml/hr (NFFW) 107.16 0.24 53.61 75.79 17.12 24.21 0.24 1.38
PF~10ml/hr (NFFW) 141.44 0.04 53.64 75.84 17.08 24.16 0.28 1.59
PF~5ml/hr (NFFW) 167.81 0.07 53.71 75.94 17.02 24.06 0.34 1.97
PF~2ml/hr (NFFW) 184.28 0.05 53.76 76.01 16.97 23.99 0.39 2.26
AcW~60ml/hr(Na+) 210.07 6.82 60.58 85.65 10.15 14.35 7.21 41.54
AcW~45ml/hr(Na+) 257.64 3.31 63.89 90.34 6.83 9.66 10.52 60.63
AcW~30ml/hr(Na+) 290.27 1.50 65.39 92.46 5.34 7.54 12.02 69.26
AcW~15ml/hr(Na+) 317.67 1.16 66.54 94.09 4.18 5.91 13.18 75.92
Sand from the column + 345 1.5 68.04 96.21 2.68 3.79 14.68 84.56
250ml of Na+ (pH=1).
( X ) ( Y )
Table 5.24: Sand Pack E: Summary of Mass Balance base on total mass throughput and
mass after Main Treatment + 2PV

Chapter 5: Non-Equilibrium Sand Pack Experiments on OMTHP Scale Inhibitor Applied in Both
Adsorption and Precipitation Treatments
190
-10
0
10
20
30
40
50
60
70
80
0 50 100 150 200 250 300
% M
ass
Ou
t
PV
Sand Pack E: Mass Balance% Mass Out vs PV
SP-E
Total Total
PV Mass Out Mass Out
(mg) (%)
9.83 0.70 4.01
109.25 0.73 4.22
141.44 0.80 4.60
167.81 0.85 4.89
184.28 7.67 44.17
210.07 10.98 63.26
257.64 12.48 71.89
290.27 13.64 78.55
317.67
Figure 5.47: Sand Pack E: Mass balance base on after main treatment + 2PV
Notes: The % mass out is calculated base on total mass after the main treatment + first 2
PV of post flush. The additional 2PV is to account for the “mobile phase” SI
concentration ( not SI adsorbed and precipitated).
Mass-In Sand Pack after the main treatment + 2PV of post flush is 17.36 mg.

Chapter 5: Non-Equilibrium Sand Pack Experiments on OMTHP Scale Inhibitor Applied in Both
Adsorption and Precipitation Treatments
191
0
20
40
60
80
100
120
0 50 100 150 200 250 300 350
% M
ass
Ou
t
PV
Sand Pack E: Mass Balance% Mass Out vs PV
X
Y
Figure 5.48: Sand Pack E- %Mass out base on total mass throughput and after main
treatment + 2PV
Notes: X- %Mass Out base on Total Mass Throughput Y- %Mass Out base on after Main Treatment + 2PV

Chapter 5: Non-Equilibrium Sand Pack Experiments on OMTHP Scale Inhibitor Applied in Both
Adsorption and Precipitation Treatments
192
5.3.6 Sand Pack F: High Concentration Adsorption Flood – Multi Flow rate
OMTHP Static Compatibility Test designed for Sand Pack F
For this static compatibility test, the NFFW brine has 428ppm Ca2+
, compared to the
previously used NFFW brine, where the calcium concentration is 2000ppm. The
calcium concentration is reduced to ensure that only adsorption is taking place at
4000ppm SI (Kharwad et al., 2008). Refer to Table 5.25 for the NFFW composition.
To make sure the brine/SI solution used will lead to an adsorption only flood during the
dynamic sand pack study, the corresponding static compatibility tests were carried out.
This lower calcium (428ppm Ca2+
) brine will be used for dynamic study, sand pack F.
Ion Conc. Comp
(ppm) g/l g/5L g/10L g/15L g/20L
Na+ 31275 NaCl 79.50 397.50 795.00 1192.50 1590.01
Ca2+428 CaCl26.H20 2.34 11.70 23.39 35.09 46.79
Mg2+739 MgCl2.6H20 6.18 30.90 61.80 92.69 123.59
K+ 654 KCl 1.25 6.23 12.47 18.70 24.94
Ba2+269 BaCl2.2H2O 0.48 2.39 4.78 7.18 9.57
Sr2+771 SrCl2.6H2O 2.35 11.73 23.46 35.19 46.92
SO4-2 0 Na2SO4 0.00 0.00 0.00 0.00 0.00
Li+
50 LiCl 0.305 1.53 3.05 4.58 6.11
Cl- 50000
Actual Cl ppm 52497.59
If CaCl2.2H2O is used 1.57 7.84 15.67 23.51 31.35
TDS = 86683.59 ppm
Mass
Table 5.25: Synthetic Nelson Forties Formation Water (NFFW) Composition used for
Sand Pack F. Note the changes in Calcium concentration.
Figure 5.49 shows the results for phosphorous, calcium, magnesium and lithium
changes at 4000ppm OMTHP after 24hrs at 95°C in static compatibility tests. It is
observed that there was no precipitation of any components The slight positive increase
in the P figure in Figure 5.49 arises from the analytical error which is less than 1%.

Chapter 5: Non-Equilibrium Sand Pack Experiments on OMTHP Scale Inhibitor Applied in Both
Adsorption and Precipitation Treatments
193
Thus, if there were to be any concentration loss during the sand pack study, it must
definitely be due to adsorption. Figure 5.50 also shows the filtrate picture and its weight
after 24hrs at 95°C. This also shows no precipitate or increase in weight on the filter
paper. All this evidence proves that the conditions for dynamic flood F are such that
only adsorption will take place.
37.321
1.017 5.892 0.2070
50
100
150
200
250
300
350
400
450
500
∆ Phos ∆ Ca ∆ Mg ∆ Li
Co
nce
ntr
atio
n (p
pm
)
Elements
OMTHP Static Compatibility TestChange in conc. after 24hrs heating at 95 C & pH4
(<1%)(<1%)(<1%)
(<1%)
Figure 5.49: OMTHP Static Compatibility Test at 95°C. Change in P, Ca2+
, Mg2+
and
Li+ ion after 24 hrs at 95°C and pH4
Sample
Identification
Filter Paper
(Before)
Filter Paper
(After) Filtrate
F1 0.0908 0.1065 0.02
F2 0.091 0.1067 0.02
FG1 0.0913 0.1097 0.02
FG2 0.0918 0.1154 0.02
(Weight (g)
Figure 5.50: OMTHP Static Compatibility Test at 95°C. Filtrate picture and weight of
precipitate after filtration.

Chapter 5: Non-Equilibrium Sand Pack Experiments on OMTHP Scale Inhibitor Applied in Both
Adsorption and Precipitation Treatments
194
Sand Pack F: Dynamic Flood
Sand Pack F represents a high concentration SI dynamic adsorption flood at variable
flow rates. The main treatment uses 4000ppm OMTHP in NFFW (+Li+) brine at 20
ml/hr flow rate; whereas post flush uses NFFW (no Li+) brine at 20, 10, 5 and 2 ml/hr.
The main treatment was conducted at room temperature and all post flushes were
conducted at 95°C at pH 4. Between each of the flow periods, from the main treatment
to the various post flush stages, the flow was stopped and maintained for at least 24 hrs
at 95°C.
Once the sand pack was prepared, the dead volume and pore volume were measured.
The dead and pore volume were measured at 1.34ml and 14.66ml, respectively. This
pore volume was used for all calculations for this sand pack, presented below. Details
of Sand Pack characterization are presented in Table 5.26.
Length of Sandpacking = 20.7 cm
Diameter = 1.5 cm
Dead Volume = 1.34 ml
Pore Volume @ RT = 14.66 ml
Porosity @ RT = 40.06 %
Sand Pack F : Characterization Results
Table 5.26: Sand Pack F – Characterization Results
Upon completing the characterization, NFFW (no Li+) brine was injected into the sand
pack overnight to saturate the system. The purpose of this stage was to remove any
impurities present in the sand pack. Immediately, the dynamic sand pack experiment
was initiated starting with main treatment. Refer to Table 5.27 for experimental details
and the chronology of injection.

Chapter 5: Non-Equilibrium Sand Pack Experiments on OMTHP Scale Inhibitor Applied in Both
Adsorption and Precipitation Treatments
195
No. Description Conditions Flow
rate
(ml/hr)
PV
(Total PV)
Volume (ml)
(Total Vol)
1 Main Treatment – 4000ppm
OMTHP in NFFW (+50ppm Li+)
T = 20°C
pH = 4
20 1–9.75
(9.75)
0-143
(143)
Shut-in at reservoir temperature (95°C) for 40 hrs.
2 Post Flush # 1 : NFFW (no Li+)
T = 95°C
pH = 4
20 9.75–108.2
(98.4)
143-1586
(1443)
Shut-in at reservoir temperature (95°C) for 24 hrs.
3 Post Flush # 2 : NFFW (no Li+)
T = 95°C
pH = 4
10 108.2–141.2
(33.0)
1586-2070
(484)
Shut-in at reservoir temperature (95°C) for 24 hrs.
4 Post Flush # 3 : NFFW (no Li+)
T = 95°C
pH = 4
5 141.2–173.4
(32.23)
2070-2542
(472)
Shut-in at reservoir temperature (95°C) for 24 hrs.
5 Post Flush # 4 : NFFW (no Li+)
T = 95°C
pH = 4
2 173.4–219.5
(46.1)
2542-3218
(676)
Shut-in at room temperature (20°C) for 4 days. COMPLETED POST FLUSH.
6 Sand Wash using 1% Na+ T = 70°C
pH = 1
- - -
COMPLETED.
Table 5.27: Sand Pack F – Experimental Details and Chronologies of Injection
The effluent profiles of the main treatment and initial post-flush stages of the OMTHP
SI adsorption flood are shown in Figure 5.51 and Figure 5.52 for Sand Pack F. These
figures show the actual and normalized (C/Co) concentrations against pore volumes
(PV) for each component respectively. The profiles of each component under study,
namely, OMTHP SI, Calcium (Ca2+
), Magnesium (Mg2+
) and Lithium (Li+)
concentrations vs. PV are presented in Figure 5.51 and Figure 5.52.
The first 10 PV of injection in sandpack F is the main treatment using 4000ppm
OMTHP in NFFW(+50ppm Li+; with 428ppm Ca
2+) at pH 4 at room temperature, 20°C.
As demonstrated above, at pH4 and 20°C, bulk static compatibility tests show that there
is only adsorption of SI onto the sand under these conditions. The main treatment is
carried out at 20 ml/hr, at room temperature. As the flow goes through the first 4 PV,
the OMTHP SI effluent profile starts deviating from the Lithium effluent curve and this

Chapter 5: Non-Equilibrium Sand Pack Experiments on OMTHP Scale Inhibitor Applied in Both
Adsorption and Precipitation Treatments
196
is a measure of the degree of SI adsorption in the pack. Slight drop in calcium and
magnesium concentrations observed during the 1st two PV in this adsorption flood.
From the 3th
to 10th
PV, all the components stabilized at their injected concentrations
which indicates no further adsorption or precipitation taking place.
After 10 PV of injection, the flow is stopped and the sand pack is placed in a water bath.
The water bath temperature is increased from room temperature to 95°Cand the system
was then left for 40 hrs. After this shut-in period, the flow was resumed at 20 ml/hr and
95°C. This is the first post flush using NFFW with no Li+, at pH 4 which was injected
for ~110PV.
When the flow was resumed after the shut-in at 10PV, a large drop in SI concentration
was observed from 4000ppm to 1000ppm (normalized, C/Co ~0.25), which indicates a
very high SI retentions due to adsorption. There is a slight drop in Ca2+
and Mg2+
observed after the main treatment (refer to Figure 5.53). The observed behaviour is clear
evidence of SI adsorption onto the sand minerals. It also indicates the associated
binding between SI and Ca/Mg to form a complex. The affinity of calcium to SI is more
apparent compared to magnesium to SI.
At the end of first post flush period (110PV), the SI concentration dropped to around
~0.09ppm (see Figure 5.54). It also shows the later stage return profiles of OMTHP
adsorption floods at different flow rates with the same post flush fluid. The details of the
various stages are described in Table 5.27. The flow was shut-in for 24 hours at 95°C
between the first and second post flush periods. Immediately after the 2nd
post flush was
initiated, the SI concentration spiked up to ~0.9ppm before reducing to ~0.2ppm and
then stabilizing. The spike is expected after shutting in for more than 24hrs, during
which time the adsorption/ desorption process equilibrates (or at least approaches
equilibrium).
Over the second to the fourth post flush periods, the same NFFW is used as the post
flush brine, but at various flow rates. This is to study if there is any impact due to non-
equilibrium or kinetic processes. While the 1st post flush flow was at 20 ml/hr; the 2
nd,
3rd
and 4th
were carried out at 10, 5 and 2 ml/hr, respectively. At each interval between

Chapter 5: Non-Equilibrium Sand Pack Experiments on OMTHP Scale Inhibitor Applied in Both
Adsorption and Precipitation Treatments
197
changing the flow rates, the flow was shut in for more than 20 hours at 95°C. In all of
these shut in periods, the SI concentration spikes up depending upon the length of the
shut-in. The most important observation is the effect of the flow rate on the steady level
of [SI] in the pack effluent. The lower the flow rate, the higher the SI flowing
concentration (and vice versa) indicating clear non-equilibrium conditions. After the
final post flush at 2 ml/hr, the flow is shut-in and the temperature was reduced from
95°C to room temperature, 20°C. The pack was then shut-in for 4 days.
The mass balance of SI left in the sand pack and returned during post flush was also
calculated. Details of the mass balance are presented in Table 5.28. After the main
treatment, 89% of the SI mass was returned. But after the main treatment, the returned
SI mass from 1st to 4
th post flush is only an additional ~4%. Total mass returned after
the 4th
post flush is 93%, leaving 7% of the injected SI mass still in the sand pack after
the final post flush.
Finally, the sand was extracted and mixed up in 1% Na+ (at pH 1) for 24 hrs; this was
done rather than acid washing through the sand pack. The purpose is to see if significant
SI mass still exists in the sand pack, similar to the observations for previous sand packs.
Fluid samples were taken and sent for ICP analysis and sand sent for ESEM-EDAX
analysis to determine how much SI was in the original sand pack. Referring to Figure
5.55, the results show that no SI was found on the sand. In contrast, there was an
additional of 6mg (1%) of SI in the solution. It must be noted that ESEM-EDAX does
not detect these elements at very low concentration levels. The mass balance shows that
there is still 6% SI mass presence in the sand pack undetected, which indicates
irreversible behaviour (Kerver and Heilhecker, 1969). Refer to Figure 5.56 and Figure
5.57 for the %mass still in sand pack and %mass out throughout the increasing PV.
Mass Balance base on mass left in sand pack after main treatment + 2PV of post flush:
All the above mass balance calculation were made based on total mass-in (throughput)
during main treatment. Here, mass balance is calculated based on mass left in sand pack
after main treatment + 2PV of initial post flush to allow for the mobile phase in the sand
pack. Thus, the mass left in sand pack is the actual amount of mass that is being
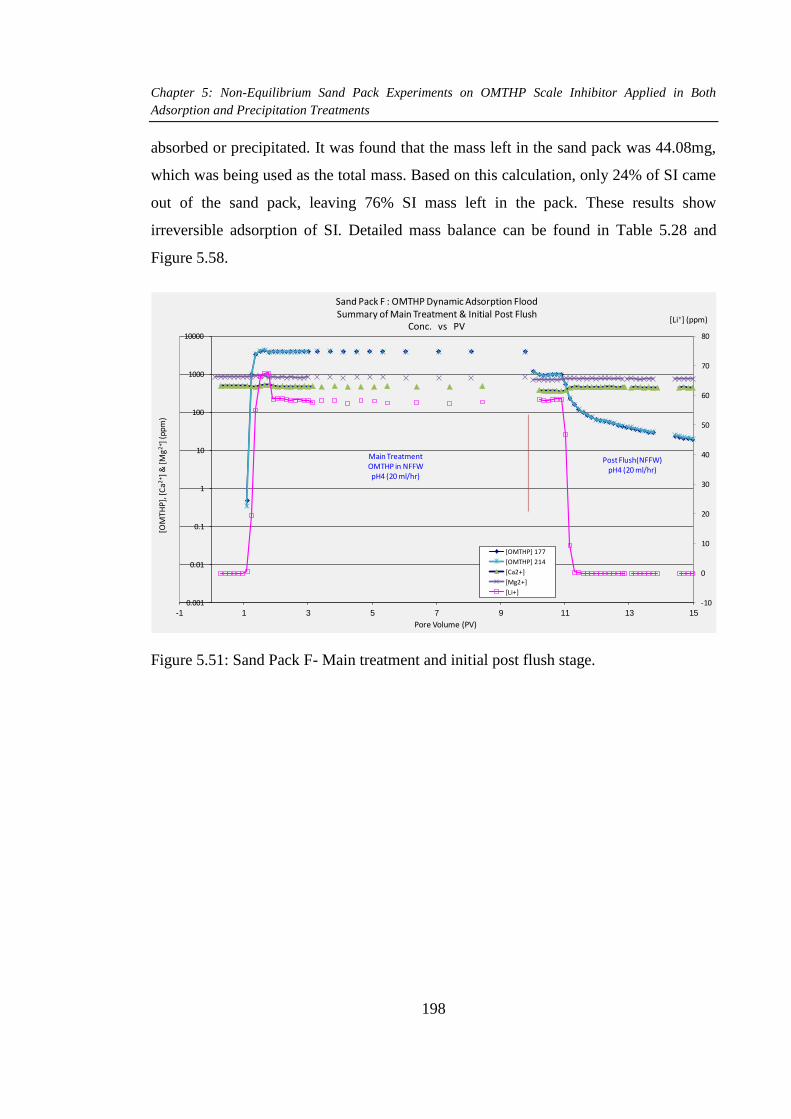
Chapter 5: Non-Equilibrium Sand Pack Experiments on OMTHP Scale Inhibitor Applied in Both
Adsorption and Precipitation Treatments
198
absorbed or precipitated. It was found that the mass left in the sand pack was 44.08mg,
which was being used as the total mass. Based on this calculation, only 24% of SI came
out of the sand pack, leaving 76% SI mass left in the pack. These results show
irreversible adsorption of SI. Detailed mass balance can be found in Table 5.28 and
Figure 5.58.
-10
0
10
20
30
40
50
60
70
80
0.001
0.01
0.1
1
10
100
1000
10000
-1 1 3 5 7 9 11 13 15
[OM
THP
], [
Ca2
+]
& [
Mg2
+ ] (
pp
m)
Pore Volume (PV)
Sand Pack F : OMTHP Dynamic Adsorption FloodSummary of Main Treatment & Initial Post Flush
Conc. vs PV
[OMTHP] 177
[OMTHP] 214
[Ca2+]
[Mg2+]
[Li+]
Main TreatmentOMTHP in NFFWpH4 (20 ml/hr)
Post Flush(NFFW)pH4 (20 ml/hr)
[Li+] (ppm)
Figure 5.51: Sand Pack F- Main treatment and initial post flush stage.

Chapter 5: Non-Equilibrium Sand Pack Experiments on OMTHP Scale Inhibitor Applied in Both
Adsorption and Precipitation Treatments
199
-0.2
0
0.2
0.4
0.6
0.8
1
1.2
-1 1 3 5 7 9 11 13 15
C/C
o
Pore Volume (PV)
Sand Pack F : OMTHP Dynamic Adsorption FloodSummary of Main Treatment & Initial Post Flush
C/Co vs PV
[OMTHP] 177 C/Co
[OMTHP] 214 C/Co
[Ca2+ C/Co]
[Mg2+] C/Co
[Li+] C/Co
Main TreatmentOMTHP in NFFWpH4 (20 ml/hr)
Post Flush(NFFW)pH4 (20 ml/hr)
Figure 5.52: Sand Pack F- Main treatment and initial post flush stage. Normalized
concentration vs. PV
-10
0
10
20
30
40
50
60
70
80
-200
0
200
400
600
800
1000
-1 1 3 5 7 9 11 13 15
[Ca
2+] &
[Mg
2+] (
ppm
)
Pore Volume (PV)
Sand Pack F : OMTHP Dynamic Adsorption FloodSummary of Main Treatment & Post Flush
Conc. vs PV
[Ca2+]
[Mg2+]
[Li+]
Main TreatmentOMTHP in NFFWpH4 (20 ml/hr)
Post Flush(NFFW)pH4 (20 ml/hr)
[Li+] (ppm)
Figure 5.53: Sand Pack F- Main treatment and initial post flush stage. Change in Ca2+
and Mg2+
ions.

Chapter 5: Non-Equilibrium Sand Pack Experiments on OMTHP Scale Inhibitor Applied in Both
Adsorption and Precipitation Treatments
200
-10
0
10
20
30
40
50
60
70
80
0.001
0.01
0.1
1
10
100
1000
10000
0 50 100 150 200 250
[OM
THP]
, [C
a2
+] &
[Mg
2+ ]
(ppm
)
Pore Volume (PV)
Sand Pack F : OMTHP Dynamic Adsorption FloodSummary of Main Treatment & Post Flush
Conc. vs PV
[OMTHP] 177
[OMTHP] 214
[Ca2+]
[Mg2+]
[Li+]
Main TreatmentOMTHP in NFFWpH4 (20 ml/hr)
Post Flush(NFFW)pH4 (20 ml/hr)
Post Flush(NFFW)pH4 (10 ml/hr)
Post Flush(NFFW)pH4 (5 ml/hr)
[Li+] (ppm)
Post Flush(NFFW)pH4 (2 ml/hr)
Figure 5.54: Sand Pack F- Main treatment and post flush stages.
X-1 (Zoom 350x) X-3 (Zoom 250x)
Y-1 (Zoom 350x) Y-2 (Zoom 250x) Y-3 (Zoom 500x)
Element Weight% Atomic% Weight% Atomic% Weight% Atomic% Weight% Atomic% Weight% Atomic% Weight% Atomic%
C - - 23.88 34.54 27.45 38.27 - - 24.07 33.21 21.38 30.37
O 54.02 67.47 39.51 42.9 41.24 43.16 50.38 64.43 49.21 50.98 47.66 50.83
Na 4.66 4.05 9.44 7.13 5.94 4.33 8.85 7.88 2.05 1.48 2.49 1.85
Al 2.04 1.51 - - 0.91 0.57 - - - - 3.59 2.27
Si 33.23 23.64 16.55 10.24 17.43 10.39 27.46 20.01 22.75 13.43 21.48 13.05
Cl 4.54 2.56 10.61 5.2 6.17 2.91 13.32 7.69 1.92 0.9 3.39 1.63
K 1.5 0.77 - - 0.85 0.36 - - - - - -
Totals 100 100 100 100 100 100
Y-3X-1 X-2 X-3 Y-1 Y-2
X-2 (Zoom 250x)
Figure 5.55: Sand Pack F- ESEM-EDAX results of sand washed with Na+ (pH=1) after
the experiment. The results indicates no precipitation of SI

Chapter 5: Non-Equilibrium Sand Pack Experiments on OMTHP Scale Inhibitor Applied in Both
Adsorption and Precipitation Treatments
201
Sand Pack F : Mass Balance of SI OMTHP
Mass In during Main Treatment = 572.75 mg
Mass Left In Sand Pack (after MT + PF) = 39.66 mg
Mass Left In Sand Pack (after MT+PF+AcW) = 33.66 mg
Description PV Mass Out
Cum Mass
Return
Cum Mass
Return
Mass Left
In Sand
Pack
Mass Left
In Sand
Pack
Cum Mass
Return
Cum Mass
Return
(ml) (mg) (mg) (%) (mg) (%) (mg) (%)
MT~20/ml/hr (OMTHP) 11.83 528.67 528.67 92.30 44.08 7.70
PF~20ml/hr (NFFW) 106.11 3.82 532.49 92.97 40.26 7.03 3.82 8.67
PF~10ml/hr (NFFW) 141.17 0.11 532.60 92.99 40.15 7.01 3.93 8.91
PF~5ml/hr (NFFW) 173.40 0.14 532.73 93.01 40.02 6.99 4.06 9.22
PF~2ml/hr (NFFW) 219.47 0.35 533.09 93.07 39.66 6.93 4.42 10.02
Sand Wash using 250ml 290 6.00 539.09 94.12 33.66 5.88 10.42 23.63
of Na+ (pH=1)
( X ) ( Y )
Table 5.28: Sand Pack F- Mass balance base on total mass throughput
6
7
8
9
10
11
12
0.001
0.01
0.1
1
10
100
1000
10000
0 50 100 150 200 250
[OM
TH
P],
[C
a2+]
& [
Mg2
+ ] (
pp
m)
Pore Volume (PV)
Sand Pack F : OMTHP Dynamic Adsorption FloodSummary of Main Treatment & Post Flush
Conc. vs PV
[OMTHP] 177
[OMTHP] 214
SI Mass still in sand pack%
Main TreatmentOMTHP in NFFWpH4 (20 ml/hr)
Post Flush(NFFW)pH4 (20 ml/hr)
Post Flush(NFFW)pH4 (10 ml/hr)
Post Flush(NFFW)pH4 (5 ml/hr)
SI M
ass
Still
In S
and
Pac
k (%
)
Post Flush(NFFW)pH4 (2 ml/hr)
Figure 5.56: Sand Pack F- Mass still in sand pack base on total mass throughput

Chapter 5: Non-Equilibrium Sand Pack Experiments on OMTHP Scale Inhibitor Applied in Both
Adsorption and Precipitation Treatments
202
89
89
90
90
91
91
92
92
93
93
94
0.001
0.01
0.1
1
10
100
1000
10000
0 50 100 150 200 250
[OM
TH
P],
[Ca
2+] &
[Mg
2+ ]
(pp
m)
Pore Volume (PV)
Sand Pack F : OMTHP Dynamic Adsorption FloodSummary of Main Treatment & Post Flush
Conc. vs PV
[OMTHP] 177
[OMTHP] 214
Cum Si Mass Return%
Main TreatmentOMTHP in NFFWpH4 (20 ml/hr)
Post Flush(NFFW)pH4 (20 ml/hr)
Post Flush(NFFW)pH4 (10 ml/hr)
Post Flush(NFFW)pH4 (5 ml/hr)
Cu
m S
I Ma
ss R
etu
rn (
%)
Post Flush(NFFW)pH4 (2 ml/hr)
Figure 5.57: Sand Pack F- Cumulative mass out base on total mass throughput
Sand Pack F : Mass Balance of SI OMTHP
Mass In during Main Treatment = 572.75 mg
Mass Left In Sand Pack (after MT + PF) = 39.66 mg
Mass Left In Sand Pack (after MT+PF+AcW) = 39.66 mg
Description PV Mass Out
Cum Mass
Return
Cum Mass
Return
Mass Left
In Sand
Pack
Mass Left
In Sand
Pack
Cum Mass
Return
Cum Mass
Return
(ml) (mg) (mg) (%) (mg) (%) (mg) (%)
MT~20/ml/hr (OMTHP) 11.83 528.67 528.67 92.30 44.08 7.70
PF~20ml/hr (NFFW) 106.11 3.82 532.49 92.97 40.26 7.03 3.82 8.67
PF~10ml/hr (NFFW) 141.17 0.11 532.60 92.99 40.15 7.01 3.93 8.91
PF~5ml/hr (NFFW) 173.40 0.14 532.73 93.01 40.02 6.99 4.06 9.22
PF~2ml/hr (NFFW) 219.47 0.35 533.09 93.07 39.66 6.93 4.42 10.02
Sand Wash using 250ml 290 6.00 539.09 94.12 33.66 5.88 10.42 23.63
of Na+ (pH=1)
( X ) ( Y )
Table 5.29: Sand Pack F- Summary of mass balance base on total mass throughput and
mass after main treatment + 2PV

Chapter 5: Non-Equilibrium Sand Pack Experiments on OMTHP Scale Inhibitor Applied in Both
Adsorption and Precipitation Treatments
203
0
10
20
30
40
50
60
70
80
90
100
0 50 100 150 200 250 300
% M
ass
Out
PV
Sand Pack F: Mass Balance% Mass Out vs PV
X
Y
Figure 5.58: Sand Pack F- %Mass out base on total mass throughput and after main
treatment + 2PV
5.3.7 Sand Pack G: 2000ppm Concentration Adsorption Flood – Multi Flow rate
OMTHP Static Compatibility Test designed for Sand Pack G
For this static compatibility test, the NFFW brine has 428ppm Ca2+
, similar to the brine
used for sand pack F, compared to all the previous NFFW brine, where the calcium
concentration was 2000ppm. The calcium concentration is reduced to make sure that
only adsorption is taking place at 2000ppm SI (Kharwad et al., 2008). Refer to Table
5.25 for the NFFW composition. To make sure the brine used will yield an adsorption
flood during the dynamic study, static compatibility test were carried out. This
particular brine will be used for dynamic study, sand pack G.
Figure 5.59 shows the observation before and after 24 hrs at 95°C and filtration. The
appearance in the bottles shows that there was no precipitate before and after the
experiment. Samples from these bottles were taken and sent for ICP analysis to
determine if any SI concentration loss had occurred. Figure 5.60 shows the ICP results
for phosphorous, calcium, magnesium and lithium change ion concentrations at
2000ppm OMTHP after 24hrs at 95°C in static compatibility tests. No loss in
Notes: X- %Mass Out base on Total Mass Throughput Y- %Mass Out base on after Main Treatment + 2PV

Chapter 5: Non-Equilibrium Sand Pack Experiments on OMTHP Scale Inhibitor Applied in Both
Adsorption and Precipitation Treatments
204
concentration was observed indicating that no precipitation of any of the elements
occurs. The slight increase in the concentration figure in the experiments is due to the
analytical tolerance which is less than 1.5%. Thus, if any concentration loss in the sand
pack study is observed then it is definitely due to adsorption. Figure 5.61 also shows the
observations on the filter paper and its weight after 24hrs at 95°C. These result again
show no precipitate or increase in weight on the filter paper. All this evidence proves
that no precipitation is taking place at this concentration and conditions which will be
used in the sand pack G adsorption flood presented below.
Before After
24hrs at 95°C&
Filtration
Figure 5.59: 2000ppm OMTHP in NFFW. It shows the observation before and after 24
hrs at 95°C and filtration.
-29.136 1.823 -12.766 0.507
-100
0
100
200
300
400
500
∆ Phos ∆ Ca ∆ Mg ∆ Li
Co
nce
ntr
atio
n (
pp
m)
Elements
OMTHP Static Compatibility TestChange in conc. after 24hrs heating at 95 C & pH4
(~1%)(~1.5%)(<1%)(~1.5%)
Figure 5.60: OMTHP Static Compatibility Test. Change in P, Ca2+, Mg2+ and Li+ ion
after 24 hrs at 95°C and pH4.

Chapter 5: Non-Equilibrium Sand Pack Experiments on OMTHP Scale Inhibitor Applied in Both
Adsorption and Precipitation Treatments
205
(Weight (g)
Sample Identification
Filter Paper (Before)
(g)Filter Paper
(After) Filtrate
1 0.0923 0.1097 0.02
2 0.091 0.1073 0.02
Figure 5.61: OMTHP Static Compatibility Test. Filtrate picture and weight of
precipitate after 24 hrs at 95°C and filtration.
The filtrate was sent for ESEM-EDAX analysis to see if there was any phosphorous,
calcium and magnesium ions on the precipitate. Figure 5.62 shows that there are no
elements observed from the EDAX signal and the ESEM pictures also do not show the
presence of phosphorous. All this evidence along with the ICP analysis above, proves
that only adsorption is taking place at 2000ppm. This is very important evidence before
proceeding to dynamic sand pack study, which shows the main treatment at 2000ppm
OMTHP at 95°C is an adsorption flood.
1 (Zoom 1000x) 2 (Zoom 500x)
1 2
Element Weight% Atomic% Weight% Atomic%
C 37.87 48.98 35.34 45.22
O 41.95 40.73 48.09 46.19
Na 6.09 4.12 6.08 4.06
Al
Si
Cl 14.08 6.17 10.12 4.39
Ca 0.37 0.14
Totals 100 100
Figure 5.62: OMTHP Static Compatibility Test. ESEM-EDAX results of filtrate after 24
hrs at 95°C.

Chapter 5: Non-Equilibrium Sand Pack Experiments on OMTHP Scale Inhibitor Applied in Both
Adsorption and Precipitation Treatments
206
Sand Pack G: Dynamic Flood
Sand Pack G represents a medium-high concentration dynamic adsorption flood at
multiple flow rates. The main treatment uses 2000ppm OMTHP in NFFW (+Li+) brine
at 20 ml/hr flow rate; whereas the post flush uses NFFW (no Li+; 428ppm Ca
2+) brine at
20, 10, 5 and 2 ml/hr. The main treatment was conducted at room temperature and all
post flushes were conducted at 95°C at pH 4. Between each flowing period in the
postflush, the flow was shut in for at least 24 hrs at 95°C.
Once the sand pack was prepared, the dead volume and pore volume were measured.
The dead volume and pore volume were measured at 1.34ml and 14.11ml, respectively.
The pore volume was used for all calculations for this sand pack. Details of Sand Pack
characterization can be found in Table 5.30.
Length of Sandpacking = 20.9 cm
Diameter = 1.5 cm
Dead Volume = 1.34 ml
Pore Volume @ RT = 14.11 ml
Porosity @ RT = 38.21 %
Sand Pack G : Characterization Results
Table 5.30: Sand Pack G – Characterization Results
Upon completing the characterization, NFFW (no Li+; 428ppm Ca
2+) was injected into
the sand pack overnight to saturate the system. The purpose of this stage was to remove
any impurities present in the sand pack. Then, the dynamic sand pack experiment was
initiated starting with main treatment, followed by periods of post flushing and acid
washes. Refer to Table 5.31 for experimental details and the chronology of injection.

Chapter 5: Non-Equilibrium Sand Pack Experiments on OMTHP Scale Inhibitor Applied in Both
Adsorption and Precipitation Treatments
207
No. Description Conditions Flow rate
(ml/hr)
PV (Total PV)
Volume (ml) (Total Vol)
1 Main Treatment – 2000ppm OMTHP in NFFW (+50ppm Li
+)
T = 20°C pH = 4
20 1–10.56 (10.56)
0-153 (153)
Shut-in at reservoir temperature (95°C) for 40 hrs.
2 Post Flush # 1 : NFFW (no Li+)
T = 95°C pH = 4
20 10.56–112.5 (101.91)
153-1592 (1439)
Shut-in at reservoir temperature (95°C) for 24 hrs.
3 Post Flush # 2 : NFFW (no Li+)
T = 95°C pH = 4
10 112.5–146.3 (33.84)
1592-2067 (475)
Shut-in at reservoir temperature (95°C) for 24 hrs.
4 Post Flush # 3 : NFFW (no Li+)
T = 95°C pH = 4
5 146.3–175.6 (29.31)
2067-2483 (416)
Shut-in at reservoir temperature (95°C) for 22 hrs.
5 Post Flush # 4 : NFFW (no Li+)
T = 95°C pH = 4
2 175.6–208.7 (33.1)
2483-2947 (464)
Shut-in at room temperature (20°C) for 7 days. COMPLETED POST FLUSH.
6 Acid Wash # 1 : 1% Na+ T = 20°C pH = 1
40 208.7–211.3 ( 2.62)
2947-2987 (40)
Shut-in at room temperature (20°C) for 17 hrs.
7 Acid Wash # 2 : 1% Na+ T = 20°C pH = 1
60 211.3–247.8 (36.43)
2987-3501 (514)
Shut-in at room temperature (20°C) for 17hrs.
8 Acid Wash # 3 : 1% Na+ T = 20°C pH = 1
20 247.8–276.8 (29.05)
3501-3911 (410)
Shut-in at room temperature (20°C) for 24 hrs.
9 Acid Wash # 4 : 1% Na+ T = 20°C pH = 1
40 276.8–305.9 (29.06)
3911-4321 (410)
Shut-In at room temperature (20°C). COMPLETED.
Table 5.31: Sand Pack G – Experimental Details and Chronologies of Injection
The effluent profiles of the main treatment and initial post-flush stages of the OMTHP
SI adsorption flood are shown in Figure 5.63 and Figure 5.64 for Sand Pack G. These
figures show the actual and normalized (C/Co) concentrations vs. pore volumes (PV)
for each element respectively. The profiles of each element under study, namely,
OMTHP SI, Calcium (Ca2+
), Magnesium (Mg2+
) and Lithium (Li+) concentrations
against PV are shown in these figures.

Chapter 5: Non-Equilibrium Sand Pack Experiments on OMTHP Scale Inhibitor Applied in Both
Adsorption and Precipitation Treatments
208
The first ten (10) PV is the main treatment using 2000ppm OMTHP in NFFW (no Li+;
428ppm Ca2+
) at pH 4 at room temperature, 20°C. At pH4 and 20°C, the bulk static
compatibility tests presented above show that only SI adsorption occurs under these
conditions; hence this Pack G flood is a pure adsorption flood. The main treatment is
carried out at 20 ml/hr, at room temperature. Over the first 4 PV, the OMTHP SI
effluent profile deviates from the Lithium effluent curve which is a measure of the
degree of (pure) SI adsorption in the pack. The very slight drop in calcium and
magnesium concentrations observed during the first four PV in this adsorption flood
shows that these elements do complex to some extent with the SI. All elements reach
full input concentration well before 5 PV in the main treatment stage of this flood.
After 10 PV, the flow is stopped and the sand pack is placed in a water bath. The water
bath temperature is increased from room temperature to 95°C and the set-up was then
left for 7 days. After this shut-in period, the flow was resumed at 20 ml/hr and 95°C.
This is the first post flush period using NFFW (with no Li+; 428ppm Ca
2+) at pH 4 for
~112PV.
When the flow was resumed after the shut-in at 10PV, a large drop in SI concentration
was observed from 2000ppm to 400ppm (normalized C/Co ~0.2), which indicates high
SI retentions due to adsorption. There is a slight drop in Ca2+
and Mg2+
observed after
the main treatment (refer to Figure 5.64). At the end of the first post flush period
(~112PV) based on Figure 5.65, the SI concentration dropped to around ~0.08ppm and
was stabilizing. Figure 5.65 also shows the later stage return profiles of the Pack G
OMTHP adsorption floods at various flow rates with the same post flush fluid. The
details of the various stages are described in Table 5.31. The flow was shut-in for 24
hours at 95°C between the first and second post flush periods. Immediately after the 2nd
,
3rd
and 4th
post flush was initiated, the SI concentration spiked up before reducing and
stabilizing. These spikes are expected after shutting in for more than 24hrs, during
which adsorption/ desorption processes reached (or approached) equilibrium .
From the second to fourth post flush periods, the same NFFW was used as the post flush
brine, but at various flow rates in order to study non-equilibrium or kinetic processes.

Chapter 5: Non-Equilibrium Sand Pack Experiments on OMTHP Scale Inhibitor Applied in Both
Adsorption and Precipitation Treatments
209
While the 1st post flush flow period was at 20 ml/hr; the 2
nd, 3
rd and 4
th were carried out
at 10, 5 and 2 ml/hr, respectively. At each interval between changing the flow rates, the
flow was shut in for more than 20 hours at 95°C and the concentration spikes up in all
cases depending upon the length of the shut-in. The high concentration at each shut-in
shows the adsorption process approaching equilibrium. Due to some discrepancy in the
experiment, the data for second and third post flush cycles were not used to analyse to
study the kinetic behaviour. But the fourth post flush at 2 ml/hr was analysed to
investigate the non-equilibrium behaviour, which stabilise at 0.6ppm. Comparing the
effluent concentration at 20 and 2 ml/hr also clearly shows the impact of non-
equilibrium behaviour. The lower the flow rate, the higher the SI flowing concentration
(and vice versa) as a result of non-equilibrium effects. After the final post flush at 2
ml/hr, the flow is shut-in and the temperature was reduced from 95°C to room
temperature, 20°C and the pack was then shut-in for 7 days.
The mass balance of SI left in the sand pack and returned during post flush was also
calculated to study if all the SI mass is returned after the final post flush. Details of the
mass balance are presented in Table 5.32. After the main treatment, 86% of the SI mass
has been returned. But after the main treatment, the returned SI mass from 1st to 4
th post
flush is only an additional of 2.5% which includes the mobile phase left in the sand
pack. Total mass returned after the 4th
post flush is 88.8%, leaving 11.2% of the injected
SI still in the sand pack after the final post flush.
The mass balance results led us to carry out an acid wash on the sand pack using 1%
Na+ at pH 1. The purpose of the acidization was to extract any SI left in the sand pack.
Figure 5.66 shows the results of the whole injection chronology including acid washes.
Table 5.32 shows the results of the acid wash mass balances. Four acid washes were
carried out at four flow rates, i.e. 40, 60, 20 and 40 ml/hr. An additional of 2.1% SI
mass is collected after the final 4th
acid wash, which accounts for a total of 91% of the
SI being produced from the pack, leaving 9% SI in the sand pack.
Finally, the sand in the sand pack was extracted and stirred in 1% Na+ for 24 hours.
Fluid samples were taken and sent for ICP analysis and the sand was sent for ESEM-

Chapter 5: Non-Equilibrium Sand Pack Experiments on OMTHP Scale Inhibitor Applied in Both
Adsorption and Precipitation Treatments
210
EDAX analysis to determine if SI was present in the sand pack. Referring to Figure
5.67, the results shows that there is no SI mass on the sand based on ESEM-EDAX
analysis. In contrast, based on mass balance analysis there is an additional of ~ 1.5%
(4.8mg) SI in the solution. It must be noted that ESEM-EDAX does not detect these
elements at very low concentration levels. The mass balance shows that there is still 7%
SI mass presence in the sand pack undetected, which indicates irreversible
adsorption/retention behaviour (Kerver and Heilhecker, 1969).
Mass Balance based on mass left in sand pack after main treatment + 2PV of post flush:
All the above mass balance calculations were made based on total mass-in (throughput)
during main treatment. Here, mass balance is calculated based on mass left in sand pack
after main treatment + 2PV of initial post flush to take into account of the mobile SI
phase in the sand pack. Thus, using this approach the mass left in sand pack is the actual
amount of mass that is being absorbed or precipitated. It is found that the mass left in
the sand pack is 35mg, which is then used as the total mass. Base on this calculation,
only 37% of SI came out of the sand pack, leaving 63% SI mass left in sand pack thus
indicating irreversible retention behaviour of SI. Detailed mass balances are presented
in Table 5.33. A comparison between the two methods for calculating %mass out is
shown in Figure 5.48.

Chapter 5: Non-Equilibrium Sand Pack Experiments on OMTHP Scale Inhibitor Applied in Both
Adsorption and Precipitation Treatments
211
-10
0
10
20
30
40
50
60
0
500
1000
1500
2000
2500
0 2 4 6 8 10 12
[OM
TH
P],
[Ca
2+] &
[Mg
2+ ]
(pp
m)
Pore Volume (PV)
Sand Pack G : OMTHP Dynamic Adsorption FloodSummary of Main Treatment and Initial Post Flush
Conc. vs PV
[OMTHP] 177
[OMTHP] 214
[Ca2+]
[Mg2+]
[Li+]
Main TreatmentOMTHP in NFFWpH4 (20 ml/hr)
[Li+] (ppm)
Figure 5.63: Sand Pack G – Main treatment and initial post flush stage.
0
0.2
0.4
0.6
0.8
1
1.2
0 2 4 6 8 10 12
C /
Co
Pore Volume (PV)
Sand Pack G : OMTHP Dynamic Adsorption FloodSummary of Main Treatment and Initial Post Flush
C/Co vs PV
[OMTHP] 177
[OMTHP] 214
[Ca2+]
[Mg2+]
[Li+]
Main TreatmentOMTHP in NFFWpH4 (20 ml/hr)
Figure 5.64: Sand Pack G – Main treatment and initial post flush stage. Normalized
concentration vs. Pore Volume.

Chapter 5: Non-Equilibrium Sand Pack Experiments on OMTHP Scale Inhibitor Applied in Both
Adsorption and Precipitation Treatments
212
-10
0
10
20
30
40
50
60
0.001
0.01
0.1
1
10
100
1000
10000
0 50 100 150 200
[OM
THP
], [C
a2
+] &
[Mg
2+ ]
(ppm
)
Pore Volume (PV)
Sand Pack G : OMTHP Dynamic Adsorption FloodSummary of Main Treatment & Post Flush
Conc. vs PV
[OMTHP] 177[Ca2+][Mg2+][Li+]
Main TreatmentOMTHP in NFFWpH4 (20 ml/hr)
Post Flush(NFFW)pH4 (20 ml/hr)
Post Flush(NFFW)pH4 (10 ml/hr)
Post Flush(NFFW)pH4 (5 ml/hr)
[Li+] (ppm)
Post Flush(NFFW)pH4 (2 ml/hr)
Figure 5.65: Sand Pack G – Main treatment and all post flush stages.
-10
0
10
20
30
40
50
60
0.001
0.01
0.1
1
10
100
1000
10000
0 50 100 150 200 250 300
[OM
THP
], [C
a2
+] &
[Mg
2+ ]
(ppm
)
Pore Volume (PV)
Sand Pack G : OMTHP Dynamic Adsorption FloodSummary of Main Treatment, Post Flush & Acid Wash
Conc. vs PV
[OMTHP] 177
[Ca2+]
[Mg2+]
[Li+]
Main TreatmentOMTHP in NFFWpH4 (20 ml/hr)
Post Flush(NFFW)pH4 (20 ml/hr)
Post Flush(NFFW)pH4 (10 ml/hr)
Post Flush(NFFW)pH4 (5 ml/hr)
[Li+] (ppm)
Post Flush(NFFW)pH4 (2 ml/hr)
Acid Wash(1%Na+)pH1 (60 ml/hr)
Acid Wash(1%Na+)pH1 (20 ml/hr)
Acid Wash(1%Na+)pH1 (40 ml/hr)
Figure 5.66: Sand Pack G – Main treatment, post flush and acid wash stages.

Chapter 5: Non-Equilibrium Sand Pack Experiments on OMTHP Scale Inhibitor Applied in Both
Adsorption and Precipitation Treatments
213
a-1 (Zoom 50x) a-2 (Zoom 650x) a-3 (Zoom 500x)
b-1 (Zoom 50x) b-2 (Zoom 650x) B-3 (Zoom 350x)
Element Weight% Atomic% Weight% Atomic% Weight% Atomic% Weight% Atomic%
C
O 47.88 62.16 59.32 71.91 47.22 61.31 54.4 67.66
Na 7.57 6.84 7.33 6.63 4.1 3.55
Al 0.79 0.61
Si 32.05 23.7 40.68 28.09 34.38 25.43 37.33 26.45
Cl 11.99 7.02 10.27 6.02 4.18 2.34
K 0.52 0.28
Totals 100 100 100 100
a-2 a-3 b-2 b-3
Figure 5.67: Sand Pack G – ESEM-EDAX results of sand extracted from sand pack
column after acid wash treatment.
Notes:
All the sand samples were extracted from the sand pack column after the acid wash
treatment at different flow rates. The only differences are; b is after soaking and stirring
in 1% Na+ (pH1), whereas a sample is purely from the sand pack.

Chapter 5: Non-Equilibrium Sand Pack Experiments on OMTHP Scale Inhibitor Applied in Both
Adsorption and Precipitation Treatments
214
Sand Pack G : Mass Balance of SI OMTHP
Mass In during Main Treatment = 295.17 mg
Mass Left In Sand Pack (after MT + PF) = 33.14 mg
Mass Left In Sand Pack (after MT+PF+AcW) = 22.10 mg
Description PV Mass Out
Cum Mass
Return
Cum Mass
Return
Mass In
Sand Pack
Mass In
Sand Pack
(ml) (mg) (mg) (%) (mg) (%)
MT~20/ml/hr (OMTHP) 10.56 254.56 254.56 86.24 40.61 13.76
PF~20ml/hr (NFFW) 112.47 7.29 261.85 88.71 33.32 11.29
PF~10ml/hr (NFFW) 146.31 0.01 261.86 88.71 33.31 11.29
PF~5ml/hr (NFFW) 175.62 0.00 261.86 88.71 33.31 11.29
PF~2ml/hr (NFFW) 208.72 0.20 262.05 88.78 33.12 11.22
AcW~40ml/hr(Na+) 211.34 0.3108 262.36 88.89 32.81 11.11
AcW~60ml/hr(Na+) 247.77 2.11 264.47 89.60 30.70 10.40
AcW~20ml/hr(Na+) 276.82 1.9999 266.47 90.28 28.70 9.72
AcW~40ml/hr(Na+) 305.88 1.8148 268.29 90.89 26.88 9.11
Sand Wash using 200ml 4.80 273.09 92.52 22.08 7.48
of Na+ (pH=1)
Table 5.32: Sand Pack G – Mass balance base on total mass throughput.

Chapter 5: Non-Equilibrium Sand Pack Experiments on OMTHP Scale Inhibitor Applied in Both
Adsorption and Precipitation Treatments
215
Sand Pack G : Mass Balance of SI OMTHP
Mass In during Main Treatment = 295.17 mg
Mass Left In Sand Pack (after MT + PF) = 33.14 mg
Mass Left In Sand Pack (after MT+PF+AcW) = 22.10 mg
Description PV Mass Out
Cum Mass
Return
Cum Mass
Return
Mass In
Sand Pack
Mass In
Sand Pack
Cum Mass
Return
Cum Mass
Return
(ml) (mg) (mg) (%) (mg) (%) (mg) (%)
MT~20/ml/hr (OMTHP) 10.56 260.16 260.16 88.14 35.01 11.86
PF~20ml/hr (NFFW) 112.47 1.69 261.85 88.71 33.32 11.29 1.69 4.82
PF~10ml/hr (NFFW) 146.31 0.01 261.86 88.71 33.31 11.29 1.70 4.85
PF~5ml/hr (NFFW) 175.62 0.00 261.86 88.71 33.31 11.29 1.70 4.85
PF~2ml/hr (NFFW) 208.72 0.20 262.05 88.78 33.12 11.22 1.89 5.41
AcW~40ml/hr(Na+) 211.34 0.3108 262.36 88.89 32.81 11.11 2.20 6.29
AcW~60ml/hr(Na+) 247.77 2.11 264.47 89.60 30.70 10.40 4.31 12.32
AcW~20ml/hr(Na+) 276.82 1.9999 266.47 90.28 28.70 9.72 6.31 18.03
AcW~40ml/hr(Na+) 305.88 1.8148 268.29 90.89 26.88 9.11 8.13 23.21
Sand Wash using 200ml 340 4.80 273.09 92.52 22.08 7.48 12.93 36.92
of Na+ (pH=1)
( Y )( X )
Table 5.33: Sand Pack G – Summary of mass balance base on total mass throughput and
mass after main treatment + 2PV.

Chapter 5: Non-Equilibrium Sand Pack Experiments on OMTHP Scale Inhibitor Applied in Both
Adsorption and Precipitation Treatments
216
0
10
20
30
40
50
60
70
80
90
100
0 50 100 150 200 250 300
% M
ass
Out
PV
Sand Pack G: Mass Balance% Mass Out vs PV
XY
Figure 5.68: Sand Pack G – %Mass out base on total mass throughput and mass after
main treatment + 2PV.
5.4 SUMMARY, DISCUSSION AND CONCLUSIONS
This chapter presents the experimental results from a novel series of variable rate
adsorption and precipitation sand packs for a hexa-phosphonate SI, OMTHP. The sand
pack floods were carried out using well characterized silica sand which has previously
been used extensively in bulk coupled adsorption/precipitation tests under almost
identical (but not flowing) conditions. All sand pack SI floods were conducted using
almost identical procedures, with minor variants depending on the objective of that
flood. The objective of performing these core flood experiments was to (i) carry out
very well characterised “adsorption only” or “coupled adsorption/precipitation” SI
return experiments in sand packs; (ii) the level of characterisation is intended to give
quantitative results which can be used to test adsorption () and coupled adsorption
precipitation ( models of these processes; and (iii) to quantify the extent of non-
equilibrium (kinetic) effects on the return profile of the inhibitor when applied under
both adsorption and precipitation conditions. This data will help in the development of
a more suitable coupled adsorption/precipitation model describing the non-equilibrium

Chapter 5: Non-Equilibrium Sand Pack Experiments on OMTHP Scale Inhibitor Applied in Both
Adsorption and Precipitation Treatments
217
squeeze processes. Using experiments of this type will enable us to develop more
realistic isotherms and rate kinetic functions for use subsequently in field applications.
To our knowledge, this is the most complete dataset of such floods which has been
carried out to date in this field of study.
The variable rate adsorption and precipitation floods for the hexa-phosphonate
(OMTHP) includes the effects of flow rate and solubility on the effluents of SI
concentration, [Ca2+
] and [Mg2+
], and provides data for testing non-equilibrium flow
models for describing coupled adsorption/precipitation squeeze treatments.
5.4.1 Methodology
The methodology which was developed earlier has been improved to carry out these
dynamic pack flood experiments successfully. Referring to Table 5.2, the results show
consistency in all the sand pack experiments. The pore volume (and porosity) for all the
sand pack are around 14.60 to 14.70ml with porosity of 40.50%. The small difference in
PV is due to how well the sand was packed into the column. Overall results from all the
sand pack also indicate that the assembled sand pack flooding apparatus is reliable.
Refer to Figure 5.3 and Figure 5.4 for schematic diagram of the flooding apparatus and
packing technique.
5.4.2 Non-Equilibrium Returns
The sand pack effluent results demonstrate clear non-equilibrium behaviour as the flow
rate for the different floods is varied and indicates the importance of flow rate on the
derivation of dynamic isotherms prior to field application modelling. That is, as the
brine velocity decreases, the inhibitor concentration level increases (and vice versa).
Figure 5.69 and Figure 5.70 show the variation in effluent concentration as the flow
rates changes and this is observed in both adsorption and coupled adsorption/
precipitation processes. This has important implications for field treatments whereby
the penetration depth may considerably influence the return concentration since deeper
penetration, results in a slower localized fluid velocity.

Chapter 5: Non-Equilibrium Sand Pack Experiments on OMTHP Scale Inhibitor Applied in Both
Adsorption and Precipitation Treatments
218
5.4.3Adsorption vs. Precipitation
For all the sand pack flood experiments main treatments, for both adsorption and
precipitation floods, the deviation between SI to lithium behaviour shows retention of SI
is taking place. Based on static compatibility tests results, the retention in the sand pack
during main treatment is clearly due to pure adsorption at low temperature conditions
since we observe no precipitation at room temperature, 20°C. Calcium and magnesium
also plays some role but this is much clearer in the precipitation floods, and cannot be
easily observed (if indeed it occurs) in the adsorption flood. Table 5.34 clearly indicates
that during the first 3 to 4 PV, the retention is due to pure adsorption.
During shut-in after the main treatment, we observed significant drops in the normalized
calcium and magnesium profiles for all the precipitation floods in the early post flush
period. It is a clear diagnostic that it is precipitation which is occurring in the core
during shut-in at elevated temperature. In one of the adsorption flood, sand pack E;
there is no (or very little) calcium loss observed in adsorption flood, which is probably
due to the low SI concentration, [OMTHP] = 500ppm and/or low calcium
concentration, [Ca2+
] = 428ppm.
Comparing the precipitation and adsorption treatments for the SI, it is found that the
effluent SI concentrations were always much higher for the precipitation treatments.
Figure 5.72 shows effluent concentration at 20ml/hr for all the floods. All adsorption
floods (E, F & G) show lower return effluent concentrations over the main flow back
period compared to precipitation floods (A, C & D). This behaviour is summarised in
Figure 5.72. This gives a good justification as to why the industry should at least
consider the application of precipitation squeeze treatments, although care must be
taken to prevent excessive precipitation, or formation damage in the squeeze process.
5.4.4 Desorption and Dissolution
In sand pack C (precipitation flood), the post flush brine was normal FW contained both
calcium and magnesium ([Ca] = 2000ppm; [Mg] = 700ppm) whereas in sand pack D
(precipitation flood), only 1% Na+ brine was used. Hence, in both precipitation floods
where the calcium concentration is 2000ppm (Pack C), the solubility of SI is lower than

Chapter 5: Non-Equilibrium Sand Pack Experiments on OMTHP Scale Inhibitor Applied in Both
Adsorption and Precipitation Treatments
219
that in the no calcium at all (sand pack D) case. This is shown in the return curve where
the steady state SI return concentration for the Pack C flood ([Ca]=2000ppm) is lower
than that in the Pack D flood ([Ca]=0) for the same flow rate, Q. The direction of the
non-equilibrium effect on the inhibitor concentration level is the same for both
adsorption and precipitation floods i.e. at slower rate the effluent inhibitor concentration
is higher, and vice versa. This is consistent with the theory as presented by Sorbie
(2010) and Vazquez e.tal (2010).
5.4.5 Inhibitor Retention
During shut-in, for all the precipitation and adsorption floods, the mobile inhibitor
concentration declines significantly. As shown in Table 5.34, the normalized inhibitor
concentration for adsorption flood range from 0.15 to 0.20 which is slightly lower than
the precipitation flood from 0.2 to 0.25. It is clear evidence that enhanced
adsorption/precipitation occurs during the shut-in at elevated temperature. At room
temperature, we already know from static compatibility tests that no precipitation (only
adsorption) is taking place.
Calcium is also reduced during the shut-in in the precipitation floods and only a very
slight drop is observed in the adsorption flood. For both precipitation floods (C and D),
the normalized figures for calcium are C/Co ~0.85 and 0.84, respectively. Whereas for
adsorption floods (E, F and G), the normalized figures are C/Co ~0.96, 0.87 and 0.85
respectively. We note the drop in calcium (and magnesium) concentration in adsorption
floods but it may not be observed in sand pack E due to the levels were too low to detect
when using a fairly low level of SI (we used, [SI] = 500ppm).
5.4.6 Irreversible Behaviour
Mass balance base on all the floods screened show that there is still a significant amount
of SI mass left in the sand pack even after sand is washed with acidized Na+ (pH=1).
Table 5.35 shows that the levels of SI mass remaining in the sand pack are in the range
of 5 to 8% of total mass throughput. In contrast, ESEM-EDAX results show that there
is no SI in the sand after the final sand wash. All results show ESEM-EDAX does not
detect these elements at a very low concentrations. Refer to Figure 5.73.

Chapter 5: Non-Equilibrium Sand Pack Experiments on OMTHP Scale Inhibitor Applied in Both
Adsorption and Precipitation Treatments
220
Sand Pack ID Stage(s) Temp. (°C)
SI (C/Co) Ca (C/Co) Mg (C/Co)
A 1st
– 3rd
PV
Shut-In
RT 95°C
Adsorption 0.25
- -
- -
C 1st
– 3rd
PV
Shut-In
RT 95°C
Adsorption 0.20
observed 0.85
observed 0.90
D 1st
– 3rd
PV
Shut-In
RT 95°C
Adsorption 0.24
observed 0.82
observed 0.90
E 1st
– 3rd
PV
Shut-In
RT
95°C
Adsorption
0.15
observed (slight)
0.96
observed (slight)
0.98
F 1st
– 3rd
PV
Shut-In
RT
95°C
Adsorption
0.20
observed (slight)
0.87
observed (slight)
hardly seen
G 1st
– 3rd
PV
Shut-In
RT
95°C
Adsorption
0.18
observed (slight)
0.85
observed (slight)
0.90
Table 5.34: Normalized [SI], [Ca2+
] and [Mg2+
]
No Description A C D E F G
1 Pore Volume (ml) 13.64 14.69 14.73 14.60 14.66 14.11
2 Porosity (%) 38.49 40.52 40.85 40.87 40.06 38.21
3 Sand Mass (g) 93.58 95.68 95.21 95.21 96.61 97.87
4 MT - [SI] (ppm) 4000 4000 4000 500 4000 2000
5 MT - [Ca2+
] (ppm) 2000 2000 2000 2000 428 428
6 PF - [Ca2+
] (ppm) 2000 2000 0 2000 428 428
7 PF Pore Volume 417
(5691ml)
164
(2413ml)
168
(2479ml)
184
(2692ml)
220
(3218ml)
209
(2947ml)
8 AcW Pore Volume 363
(4957ml)
133
(1951ml)
103
(1520ml)
133
(1951ml)
- 97
(1374ml)
9 Total of PF & AcW 780
(10648ml
)
297
(4364ml)
271
(3999ml)
317
(4643ml)
220
(3128ml)
306
(4321ml)
10 Total Mass
Throughput (mg)
410.85 520.97 640.05 70.73 572.75 295.17
11 Mass In Sandpack
after MT + 2PV (mg)
72.47 53.91 82.56 17.36 44.08 35.01
12 Mass in Sand Wash
(mg)
4.55
(1.1%)
1.03
(0.2%)
1.00
(0.16%)
1.50
(2.12%)
6.00
(1.03%)
408
(1.63%)

Chapter 5: Non-Equilibrium Sand Pack Experiments on OMTHP Scale Inhibitor Applied in Both
Adsorption and Precipitation Treatments
221
13 *Mass Out @ end
of MT (%)
82.36 89.65 87.10 75.45 92.30 88.14
14 *Mass Out @ end
of PF (%)
84.07 91.50 90.68 76.01 93.07 88.78
15 *Mass Out @ end
of AcW (%)
91.95 93.04 91.85 96.21 94.12 92.52
16 **Mass Out @ end
of PF (%)
9.69 17.87 27.78 2.26 10.02 5.41
17 **Mass Out @ end
of AcW (%)
54.35 32.73 36.57 84.56 23.63 36.92
Table 5.35: Summary of floods characteristics and mass balance
Notes:
1. *The mass is calculated base on total mass throughput
2. **The mass is calculated base on mass in sand pack after MT + 2PV
3. AcW= Acid Wash
0.001
0.01
0.1
1
10
100
1000
10000
0 20 40 60 80 100 120 140 160 180 200
[Pho
s] (
ppm
)
Pore Volume (PV)
Sand Pack : OMTHP Dynamic Adsorption/Precipitation FloodSummary of Main Treatment & Post Flush
[Phos] vs PV
SP-A
SP-C
SP-D
SP-E
SP-F
SP-G
Main TreatmentOMTHP in NFFWpH4 (20 ml/hr)
Post Flush(NFFW)pH4 (20 ml/hr)
Post Flush(NFFW)pH4 (10 ml/hr)
Post Flush(NFFW)pH4 (5 ml/hr)
Post Flush(NFFW)pH4 (2 ml/hr)
Figure 5.69: Summary of main treatment and post flush behaviour. Sand pack A, C, D,
E, F & G

Chapter 5: Non-Equilibrium Sand Pack Experiments on OMTHP Scale Inhibitor Applied in Both
Adsorption and Precipitation Treatments
222
0.001
0.01
0.1
1
10
100
1000
10000
0 20 40 60 80 100 120 140 160 180 200
[Pho
s] (
ppm
)
Pore Volume (PV)
Sand Pack : OMTHP Dynamic Adsorption/Precipitation FloodSummary of Main Treatment & Post Flush
[Phos] vs PV
SP-C
SP-D
SP-E
SP-F
SP-G
Main TreatmentOMTHP in NFFWpH4 (20 ml/hr)
Post Flush(NFFW)pH4 (20 ml/hr)
Post Flush(NFFW)pH4 (10 ml/hr)
Post Flush(NFFW)pH4 (5 ml/hr)
Post Flush(NFFW)pH4 (2 ml/hr)
Figure 5.70: Summary of main treatment and post flush behaviour. Sand pack C, D, E,
F & G
0.001
0.01
0.1
1
10
100
1000
10000
0 20 40 60 80 100 120 140 160 180 200
[Pho
s] (
ppm
)
Pore Volume (PV)
Sand Pack : OMTHP Dynamic Adsorption/Precipitation FloodSummary of Main Treatment & Post Flush
[Phos] vs PV
SP-C
SP-D
SP-F
Main TreatmentOMTHP in NFFWpH4 (20 ml/hr)
Post Flush(NFFW)pH4 (20 ml/hr)
Post Flush(NFFW)pH4 (10 ml/hr)
Post Flush(NFFW)pH4 (5 ml/hr)
Post Flush(NFFW)pH4 (2 ml/hr)
Figure 5.71: Summary of main treatment and post flush behaviour. Sand pack C, D, & F

Chapter 5: Non-Equilibrium Sand Pack Experiments on OMTHP Scale Inhibitor Applied in Both
Adsorption and Precipitation Treatments
223
0.001
0.01
0.1
1
10
100
1000
10000
0 10 20 30 40 50 60 70 80
[Pho
s] (
ppm
)
Pore Volume (PV)
Sand Pack : OMTHP Dynamic Adsorption/Precipitation FloodSummary of Main Treatment & Post Flush
[Phos] vs PV
SP-A
SP-C
SP-D
SP-E
SP-F
SP-G
Main TreatmentOMTHP in NFFWpH4 (20 ml/hr)
Post Flush(NFFW)pH4 (20 ml/hr)
Figure 5.72: Summary of main treatment and initial post flush behaviour.

Chapter 5: Non-Equilibrium Sand Pack Experiments on OMTHP Scale Inhibitor Applied in Both
Adsorption and Precipitation Treatments
224
S1 (Zoom 50x) S2 (Zoom 50x) C1 (Zoom 50x) C2 (Zoom 1200x)
D1 (Zoom 50x) D2 (Zoom 250x) E1 (Zoom 50x) E2 (Zoom 650x)
Element Weight% Atomic% Weight% Atomic% Weight% Atomic% Weight% Atomic% Weight% Atomic% Weight% Atomic% Weight% Atomic% Weight% Atomic%
C 32.43 42.24 28.75 38.33
O 47.88 46.81 27.85 41.24 59.86 72.58 63.8 75.93 48.96 49 12.8 20.91 58.58 71.38 58.27 71.03
Na 24.7 25.44 0.65 0.45 34.92 39.69 0.45 0.38
Al 0.63 0.36 1.19 0.85 2.64 1.86 0.45 0.27
Mg
P
Si 18.84 10.49 9.22 7.77 37.02 25.57 30.47 20.65 20.14 11.49 4.46 4.15 40.76 28.29 40.93 28.42
Cl 38.24 25.55 0.7 0.39 1.04 0.56 0.8 0.36 47.82 35.25
K 0.23 0.09 1.22 0.61 2.06 1 0.26 0.1 0.66 0.33 0.35 0.18
Ca
Totals 100 100 100 100 100 100 100 100
e1 e2s1 s2 c1 c2 d1 d2
Figure 5.73: ESEM-EDAX analysis of sand after final acid wash. These are repeat
analysis done independently
Notes:
S1 – Pure Sand
S2 – Pure Sand + 6% NaCl
C1&C2 – Sand pack C after experiment
D1&D2 – Sand pack D after experiment
E1&E2 – Sand pack E after experiment

225
CHAPTER 6: CONCLUSIONS AND RECOMMENDATIONS
6.1 CONCLUSIONS
The key objectives of the study undertaken in this PhD thesis were as follows:
(i) To improve and establish an experimental methodology to study static adsorption
and compatibility tests and non-equilibrium sand pack tests for both adsorption and
precipitation processes.
(ii) To study static compatibility and coupled adsorption/precipitation experiments to
understand the mechanism that is taking place and what parameters are involved during
the process. Specifically, we wished to establish pure adsorption and coupled
adsorption/precipitation regions for DETPMP and OMTHP scale inhibitors and NFFW
brine at pH4 and 95°C.
(iii) To study the influence of flow rates on inhibitor return concentrations in non-
equilibrium sand pack floods using OMTHP scale inhibitor applied in both adsorption
and precipitation treatments. The mechanisms and parameters (pH, temperature, [Ca2+
],
[SI], etc.) involved were studied under dynamic condition. The full effluent scale
inhibitor concentration and mass balances of SI throughout the experiment were
collected and analyzed for use in future modelling.
6.2 STATIC COMPATIBILITY AND COUPLED ADSORPTION /
PRECIPITATION EXPERIMENTS
The aim of these experiments is to study the possible SI retention mechanisms onto
rocks due to either pure adsorption () or by coupled adsorption/precipitation ().
This theory predicts that, when all the measured apparent adsorption vs. final [SI]
(app/c1f) curves for different (m/V) ratios collapse onto a single curve, then this
indicates pure adsorption (). However, when these curves diverge for different values
of (m/V), then coupled adsorption/precipitation () is being observed. The theory
behind this is explained in this thesis.

Chapter 6: Conclusions and Recommendations
226
In Chapter 4, results on static compatibility and coupled adsorption/precipitation
experiments were presented using two phosphonate scale inhibitors, namely DETPMP
and OMTHP, and three types of minerals, e.g. sand, kaolinite and siderite with synthetic
Nelson Forties Formation Water (NFFW). The composition is given in Table 4.1;
NFFW has [Ca2+
] = 2000ppm and [Mg2+
] = 739ppm and all experiments were
performed at pH 4 and T = 95°C.
(i) DETPMP and OMTHP SIs onto SAND Mineral
At pH 4 and T = 95°C, both pure adsorption () and coupled adsorption/precipitation
() regions were observed for DETPMP and OMTHP onto sand in NFFW. Figure
4.11 and Figure 4.22 show these static "apparent adsorption" isotherms for DETPMP
and OMTHP onto sand, respectively. Pure adsorption was observed only at SI
concentrations below ~750ppm. Coupled adsorption/precipitation behaviour was
observed for SI concentrations above ~750ppm. For each (m/V) ratio, the isotherm
curves plateau at a level of ~ 0.25mg/g and 0.30mg/g for DETPMP and OMTHP
respectively at ~750ppm. In the coupled adsorption/precipitation region, the apparent
adsorption values range from ~2 - 12mg/g.
A considerable reduction is observed in [phosphorous], [Ca2+
] and [Mg2+
] as the
concentration of SI increases in both bulk solution and in the adsorption experiments for
both SIs. This M2+
reduction in solution is mainly associated with the precipitation of a
M2+
-DETPMP complex. The M2+
, particularly calcium ions, plays a major role in
adsorption and coupled adsorption/precipitation process by bridging between the SI
molecule and the rock surface.
(ii) DETPMP and OMTHP SIs onto KAOLINITE Mineral
The DETPMP/kaolinite system in NFFW brine also shows clear regions of pure
adsorption () and coupled adsorption/precipitation () at pH4 and T=95°C. Refer
to Figure 4.32 and Figure 4.41 for "apparent adsorption" isotherms for DETPMP and
OMTHP onto kaolinite, respectively. Pure adsorption was observed below [SI]
~800ppm and coupled adsorption/precipitation behaviour was found above [SI]
~800ppm. This conclusion is further strengthen by the observed changes in phosphorous

Chapter 6: Conclusions and Recommendations
227
(SI) concentration, where clear reduction in phosphorous (SI) was seen at ~800ppm and
phosphorous was also found in precipitates base on the EDAX signal at 800ppm.
From the app vs. [SI] curves for the OMTHP/kaolinite system in NFFW brine; both
pure adsorption () and coupled adsorption/precipitation () regions were also
observed at pH 4 and T=95°C. However, in this mineral/SI system, it is less clear
where the transition occurs between the two mechanisms. However, the observed
difference in the amounts of phosphorous concentration in solution ion data shows that
clear adsorption and coupled adsorption/precipitation regions do occur. Pure adsorption
is observed up to [SI] ~ 500ppm, and coupled adsorption/precipitation is observed for
[SI] > ~500ppm. This finding is further strengthened by observations on the filtered
precipitate and the associated ESEM-EDAX data. Another reason that might have
caused the less clear transition between the two regions of and is due to the very
high levels of DETPMP pure adsorption onto the kaolinite due to its very high specific
surface area. Both DETPMP and OMTHP SIs show pure adsorption levels onto
kaolinite minerals between ~ 7 to 13 mg/g at 800ppm SI.
Significant reduction is also observed in both [Ca2+
] and [Mg2+
] as the concentration of
SI increases in coupled adsorption/precipitation experiments for both SIs. This M2+
reduction in solution is mainly associated with the precipitation of a M2+
-
DETPMP/OMTHP complex.
(iii) DETPMP Scale Inhibitor onto SIDERITE Mineral
For the DETPMP/siderite system in NFFW brine, results similar to those for the
OMTHP/kaolinite system are observed where again the transition between pure
adsorption and coupled adsorption/precipitation is not clear, although both regions are
observed. From the solution ion data for the compatibility and adsorption tests, it
appears that pure adsorption is observed up to [SI] ~500ppm, and at higher
concentrations, then coupled adsorption/precipitation is observed. This finding is further
strengthened by ESEM-EDAX observations on the filtered precipitate. Again, the
reason for the less clear transition observed for the DETPMP/siderite system maybe due
to both (i) the high levels of adsorption of the DETPMP onto the siderite, and also (ii)

Chapter 6: Conclusions and Recommendations
228
the role of the higher levels of [Fe3+
] released in these lower pH (pH 4) experiments. At
1500ppm, 25ppm [Fe3+
] was observed in the bulk solution while at 15000ppm, 200ppm
[Fe3+
] was found (see Figure 4.50).
Again, significant reductions were observed in both [Ca2+
] and [Mg2+
] as the
concentration of SI increases in coupled adsorption/precipitation experiments for the
DETPMP/siderite system. This M2+
reduction in solution is mainly associated with the
precipitation of a M2+
-DETPMP complex and this has been confirmed by ESEM EDAX
observations.
6.3 NON-EQUILIBRIUM SAND PACK EXPERIMENTS ON BOTH
ADSORPTION AND PRECIPITATION FLOOD
Chapter 5 presents the experimental results from a novel series of variable rate sand
pack experiments for both adsorption and precipitation floods using a hexa-phosphonate
SI, OMTHP. The objective of performing these sand pack experiments was as follows;
(i) to carry out very well characterised “adsorption only” or “coupled
adsorption/precipitation” SI return experiments in sand packs (using systems that
have been fully characterised in static tests);
(ii) gather data where the level of characterisation is intended to give quantitative
results which can be used to test adsorption () and coupled adsorption
precipitation ( models of these processes; and
(iii) to quantify the extent of non-equilibrium (kinetic) effects on the return profile
of the inhibitor when applied under both adsorption and precipitation conditions.
(i) Methodology
The improved technique shows consistency in all the experiments performed. The pore
volume (and porosity) for all the sand pack were around 14.60 to 14.70ml with porosity
of 40 to 40.5%. Overall results from all the sand pack indicate that the assembled sand
pack flooding apparatus and packing technique are reliable.

Chapter 6: Conclusions and Recommendations
229
(ii) Non-Equilibrium Returns
The sand pack effluent results demonstrate clear non-equilibrium behaviour. That is, as
the brine velocity decreases, the inhibitor concentration level increases (and vice versa).
Figure 5.69 and Figure 5.70 show the variation in effluent concentration as the flow
rates changes. The direction of the non-equilibrium effect on the inhibitor concentration
level is the same for both adsorption and precipitation floods i.e. at slower rate the
effluent inhibitor concentration is higher, and vice versa.
(iii) Adsorption vs. Precipitation
For all the sand pack flood experiments, the main treatments (at room temperature,
20°C), for both adsorption and precipitation floods, show a deviation between SI and
lithium effluent behaviour indicating retention due to pure adsorption of SI. Calcium
and magnesium also plays some role but this is much clearer in the precipitation floods.
Table 5.34 clearly indicates that during the first 3 to 4 PV, the retention is due to pure
adsorption, as had been proven earlier in the static adsorption/compatibility tests.
During shut-in at 95°C after the main treatment, sharp decreases were observed in the
normalized SI, calcium and magnesium profiles for all the adsorption and precipitation
floods in the early post flush period. These drops are much more significant for
precipitation floods. It is a clear diagnostic that it is precipitation which is occurring in
the core during shut-in at elevated temperature. Note: For one of the adsorption flood,
sand pack E, there is no (or very little) calcium loss, which is probably due to low SI
concentration, [OMTHP] = 500ppm and/or low calcium concentration, [Ca2+
] =
428ppm.
Comparing the precipitation and adsorption treatments for the SI, it is found that the
effluent SI concentrations were always significantly higher in the precipitation
treatments. All adsorption floods (E, F & G) showed lower return effluent
concentrations over the main flow back period compared to the precipitation floods (A,
C & D). Figure 5.72 shows the effluent concentration profiles (at Q =20ml/hr) for all
these floods.

Chapter 6: Conclusions and Recommendations
230
(iv) Desorption and Dissolution
In sand pack C (precipitation flood), the post flush brine was normal FW contained both
calcium and magnesium ([Ca]=2000ppm; [Mg]=739ppm), whereas in sand pack D
(precipitation flood), the posflush was performed using 1% Na+ brine. Hence, in both
precipitation floods where the calcium concentration is 2000ppm (Pack C), the
solubility of SI is lower than that in the no calcium case (sand pack D). This is shown in
the return curves where the steady state SI return concentration for the Pack C flood
([Ca]=2000ppm) is lower than that in the Pack D flood ([Ca]=0) for the same flow rate,
Q.
(v) Inhibitor Retention
During shut-in at elevated temperature (95°C), for all the precipitation and adsorption
floods, the mobile inhibitor concentration declines significantly. As shown in Table
5.34, the normalized inhibitor concentration for adsorption flood range from 0.15 to
0.20 which is slightly lower than the precipitation flood from 0.2 to 0.25. It is clear
evidence that enhanced adsorption/precipitation occurs during the shut-in at elevated
temperature compared to room temperature.
Calcium is also reduced during the shut-in in the precipitation floods and only a very
slight drop is observed in the adsorption flood. For both precipitation floods (C and D),
the normalized figures for calcium are C/Co ~0.85 and 0.84, respectively. Whereas for
adsorption floods (E, F and G), the normalized values are C/Co ~0.96, 0.87 and 0.85,
respectively. We note the drop in calcium (and magnesium) concentrations in
adsorption floods but it is not observed in sand pack E, due to the low SI levels used in
this flood( [SI]=500ppm).
(vi) Irreversible Behaviour
Mass balance results for all the floods in this study showed that there is still a
significant amount of SI mass left in the sand pack even after sand is washed with
acidized Na+ (pH=1). Table 5.35 shows that the levels of SI mass remaining in the sand
pack are in the range of 5 to 8% of total mass throughput. The results indicate that there
was still SI left in the sand pack, which appears to be due to irreversible SI retention.

Chapter 6: Conclusions and Recommendations
231
6.4 SUMMARY
We believe that the experiments reported in this thesis represent one of the most
comprehensive data set of experimental SI work executed to date. The work ranges
from static adsorption and coupled adsorption precipitation SI/mineral tests to dynamic
pack flooding tests under almost identical conditions. Exactly the same system (i.e.
OMTHP SI, sand mineral, NFFW brine and conditions, pH 4 and T=95°C) was used in
bulk coupled adsorption/precipitation tests, as in the dynamic sand pack floods. The
outcome from static tests provided unambiguous information on whether the system
was in a pure adsorption () or a coupled adsorption/precipitation () process, which
was of relevance to the dynamic sand pack tests.
The dynamic sand pack tests investigated both adsorption and precipitation of the hexa-
phosphonate (OMTHP) including the effects of flow rate and solubility on the effluents
of SI concentration, [Ca2+
] and [Mg2+
]. This data provides enough information for
testing non-equilibrium flow models for describing coupled adsorption/precipitation
squeeze treatments. Therefore, in future this data will help in the development of more
suitable coupled adsorption/precipitation models describing non-equilibrium squeeze
processes. Using experiments of this type will enable us to develop more realistic
isotherms and rate kinetic functions for use subsequently in field applications. To our
knowledge, this is the most complete dataset of such floods which has been produced to
date in this field of study. Indeed, work is already in progress within the FAST group at
Heriot-Watt University to develop such kinetic coupled adsorption/precipitation ()
models (Sorbie, SPE130702, 2010).
6.5 RECOMMENDATIONS FOR FUTURE WORK
This thesis reports experimental work in the following areas:
(i) Experimental technique used to study static adsorption/compatibility tests and non-
equilibrium sand pack tests.
(ii) Static compatibility and coupled adsorption/precipitation experiments.
(iii) Non-equilibrium sand pack floods for both adsorption and precipitation treatments.

Chapter 6: Conclusions and Recommendations
232
Although, much has been discovered, there are still many aspects of adsorption and
precipitation processes that must be studied in detail in the future and some of the areas
for further study are listed below:
(i) Other Minerals: This work should be extended to include static adsorption and
compatibility tests for phosphonate SIs with kaolinite and siderite minerals. This thesis
already gives detail understanding of pure adsorption and coupled
adsorption/precipitation regions for these minerals based on adsorption isotherm and
solution ion data. But, it will be an improvement if this region can be decided solely
base on adsorption isotherms. Based on our understanding from this work, this can be
achieved by; (a) carefully characterizing the minerals to understand their detailed
surface chemistry and their particle size distributions. Homogenous and narrower
distributions are understood to provide consistent results compared to wider size
distribution, (b) understanding the impact of Fe3+
and Al3+
ions on adsorption and
precipitation.
This work can give reliable data to improve and test non-equilibrium coupled
adsorption/precipitation model. So far, the model is being tested base on phosphonate
SIs and sand minerals.
(ii) XRD/XPS Mechanistic Studies: To further understand the mechanism and
parameters that influence adsorption and coupled adsorption/precipitation, we believe
that much can be learned by using x-ray diffraction (XRD) and/or x-ray photoelectron
spectroscopy (XPS). In this work, ESEM-EDX was used extensively, which provides
sufficient information to identify the presence of the various elements involved (e.g. P,
Ca etc.). However, when the amount of these elements is very small, ESEM-EDX had
some difficulty to detect them accurately and was only able to give some qualitative
indications of when certain elements were present. The use of XRD and/or XPS would
provide more quantitative information on the elements presence on the mineral which
can be used to determine the atomic ratio even at microscopic level.
(iii) Adsorption/Precipitation of Polymeric SIs: It is recommended that similar static
adsorption/compatibility tests are carried out in future for polymer scale inhibitors

Chapter 6: Conclusions and Recommendations
233
before proceeding to non-equilibrium pack flood experiments. This work with
polymeric SIs should start with sand minerals and later extend to kaolinite, siderite, etc.
(iv) Effluent Characterisation of Inhibition Efficiency: The dynamic sand pack
flood at different rates should be extended to incorporate "inhibition efficiency" tests on
the effluent concentrations. These tests can be compared to static tests, and the objective
is to determine if the MIC measured for both static and dynamic tests are the same i.e.
has the species altered in any way from the “stock” solution which is usually used in
bulk inhibition efficiency tests.
(v) Dynamic Modelling: This data should be used by modellers for assessing non-
equilibrium flow models for application in laboratory core flood and field scale systems.
This data set is the most complete in existence for testing and developing non-
equilibrium coupled adsorption/precipitation ( squeeze models. It has data for
exactly the same bulk and dynamic systems and phase diagrams of
adsorption/precipitation () regimes are known. The effluent concentrations for SI
and all ancillary ions (Ca2+
, Mg2+
and Li+), and mass balance for SI are known. Using
experiments of this type will enable us to develop more realistic isotherms and rate
kinetic functions for use subsequently in field applications.

234
APPENDIX A: FULL DERIVATION OF COUPLED ADSORPTION/
PRECIPITATION MODEL
Static Adsorption: Figure A.1 shows a schematic of a static adsorption experiment. A
SI of initial concentration, c0 (ppm or mg/L), in a volume, V (L), is allowed to come to
equilibrium with a mass, m (g), of mineral. At equilibrium concentration of the SI, ceq,
then by material balance the adsorption level is as follows:
0( )eqV c c
m
(A.1)
where in the units used, then is in mg of SI/g of rock. Fig. A.2 shows measured
experimental static adsorption isotherms, (C), for DETPMP on crushed core material
at various pH values, 2, 4 and 6 at T = 25oC (Yuan et al, 1994). It is quite clear from
these results that the level of SI adsorption is also strongly dependent in pH as well as
on [SI], thus, =(C, pH) or =(C, [H+]). However, for simplicity purposes, the
assumption that is a function of C = [SI] only, and we will denote the equilibrium
adsorption isotherm as, ( )eq eqc , as shown in Fig. A.3. Following the idea in Fig. A.3,
we note that the initial mass of SI in the system is by definition given by 0Vc since all
the SI is in the aqueous phase. However, at equilibrium the mass of SI is partly in
solution ( . eqV c ) and partly adsorbed on the rock mineral ( ( )eq eqm c ) but since the
original mass is conserved, then:
0 ( ) .eq eq eqVc m c V c (A.2)
If the analytical form of the isotherm is known (e.g. it is a Freundlich or a Langmuir
isotherm with known parameters), then Eq. (A.2) gives a simple non-linear equation for
finding eqc which is the only unknown quantity. Another way to write Eq. (A.2) which
highlights how our later experiments are carried out is by dividing through by V to
obtain:

Appendix
235
0 ( )eq eq eq
mc c c
V
(A.3)
which indicates that the mass/volume ratio, (m/V), is an important parameter in these
adsorption experiments, as we will show later. We can also define a function ( )eqF c as
follows:
0( ) ( )eq eq eq eq
mF c c c c
V
(A.4)
where the correct equilibrium concentration, eqc , is given by the root of ( )eqF c i.e.
where:
( ) 0eqF c (A.5)
Figure A.1: Shows the process of simple static adsorption on a porous medium
comprising a mineral separate, of mass(m) e.g. sand, kaolinite, siderite etc. See units.

Appendix
236
(C) mg/g
Figure A.2: Experimental static adsorption isotherms, (C), for DETPMP on crushed
core material. At various pH values, 2, 4 and 6 at T = 25oC (Yuan et al, Adv. Oil.
Chem., 1994).
Figure A.3: Schematic showing how the static adsorption isotherm is reached as c0
ceq such that the mass conservation is consistent with the adsorption isotherm, (C).

Appendix
237
Numerical Examples for Adsorption: We illustrate the calculation of the equilibrium SI
concentration using a numerical example where we take the Freundlich form of
where:
( )eq eq eqc c
[c in ppm] (A.6)
With = 0.021 and = 0.73 where c is in ppm and is in mg showing different /g.
These parameters are not arbitrary since they relate to our experimental results which
will be presented below. However, this case serves as a useful numerical example to
demonstrate some of the calculations and for later use in the coupled
adsorption/precipitation calculations. If the molecular weight of the SI is given by MSI ,
then the Freundlich isotherm with molar concentration of c (M) would be:
'( )eq eq eqc c
[C in M] (A.7)
Where ' 1000 .SIM
. The Freundlich isotherm for this example is shown in Fig.
A.4 and, for various values of initial concentration, 0c , we can solve Eq. (A.4) to find
the equilibrium SI concentration, eqc . This is illustrated by cases A, B and C in this
figure where 3 values of 0c = 2000, 1500 and 1000ppm, lead to final equilibrium values
of, eqc = 1493, 1094 and 705ppm. Note that by taking a series of values of 4.05, 3.24
and 2.36 mg SI/g rock, we are able to build up the points on the static adsorption
isotherm as has been done for the case in Fig. A.2 above.

Appendix
238
Example Freundlich adsorption isotherm,
= aC^b (a= 0.021; b=0.73 - C in ppm) mg/g
0.0
1.0
2.0
3.0
4.0
5.0
6.0
0 500 1000 1500 2000
SI conc. (ppm)
-
SI
Ad
s.
(mg
/g)
Ads. isotherm
-> 1493ppm
-> 1094 ppm
-> 705 ppm
-AB
C
Figure A.4: The Freundlich isotherm of form, ( )eq eq eqc c
, where = 0.021 and
= 0.73 where c is in ppm and is in mg/g. Cases A, B and C show the numerical
calculation for initial concentrations of SI, 0c = 2000, 1500 and 1000ppm, respectively,
where the final equilibrium values are, eqc = 1493, 1094 and 705ppm.
The effect of the solid mass/liquid volume ratio, (m/V), can be seen by comparing
Cases C and D in Fig. A.5. Cases C and D have the same initial concentrations of SI,
0c = 1000ppm, but they have different (m/V) ratios; Case C (m/V) = 125 and Case D
(m/V) = 250. Note that, as we change (m/V) the final equilibrium point simply moves
“along the isotherm”. This is an important point since it will later help us to diagnose
when precipitation is occurring, as explained in detail below.

Appendix
239
Example Freundlich adsorption isotherm,
= aC^b (a= 0.021; b=0.73 - C in ppm) mg/g
0.0
1.0
2.0
3.0
4.0
5.0
6.0
0 500 1000 1500 2000
SI conc. (ppm)
-
SI
Ad
s.
(mg
/g)
Ads. isotherm
-> 1493ppm
-> 1094 ppm
-> 705 ppm
-
change (m/V) ratio
AB
C
D
Figure A.5: The Freundlich isotherm of form, ( )eq eq eqc c
, where = 0.021 and
= 0.73 where c is in ppm and is in mg/g. Case D is the same as Case C with initial
concentrations of SI, 0c = 1000ppm, but with different (m/V) ratios; Case C (m/V) =
125 and Case D (m/V) = 250.
Coupled Adsorption/Precipitation: We now extend the analysis above for pure
adsorption to the case where both adsorption and precipitation can occur
simultaneously. This is shown schematically in Fig. A.6 where we envisage that
precipitation occurs by the formation of the calcium salt of the SI, i.e. by precipitation
of SI_Ca. In general, the stoichiometry of this precipitation reaction is as follows:
. _ nSI n Ca SI Ca (A.8)
Where n Ca ions may bind to a single SI molecule. The solubility of this sparingly
soluble salt would be described by an equilibrium solubility product, spK , of the form:
[ ].[ ]n
spK SI Ca (A.9)

Appendix
240
Some additional notation is introduced in Fig. A.6 as follows:
10c and 1 fc - initial (t = 0) and final equilibrium (t ) SI Molar concs. (M);
20c and 2 fc - initial (t = 0) and final equilibrium (t ) Ca Molar conc. (M);
Γ – is the adsorption which depends on1 fc , 1 fc (mg/g);
Π – is the precipitation process depends on both 1 fc (SI conc.) and 2 fc (Ca
conc.) through spK as follows:
1 2.n
sp f fK c c in this notation when the system is at equilibrium; units of
spK Mn+1
;
pm is the actual mass of precipitate which forms.
Figure A.6: Schematic showing how both coupled adsorption and precipitation can
occur showing how this could be interpreted as an “apparent adsorption”, .App
From the above quantities, we note that the initial and final values of SI concentration
are 10c and 1 fc . Some of this SI which is “missing” from the bulk solution is adsorbed
and the remainder of it is part of the precipitate. However, if we assumed that all of this
“missing” SI is adsorbed, then we would calculate an “apparent adsorption”, .App , as
follows:
10 1
.
( )f
App
V c c
m
(A.10)

Appendix
241
which would clearly be an over-estimate of the actual adsorption (since some of this
would be precipitate) but it is what would be seen in an actual experiment if the above
formula were applied.
We now derive the main equations describing coupled adsorption/precipitation based on
the view of the process discussed above and shown schematically in Fig. A.6. As
before, the total masses of SI and Ca, which are conserved, are given by:
Total initial Mass of SI = 10. .SIV M c
and at equilibrium (after adsorption and precipitation), then,
Total mass of SI = 1 1. . . .1000
SI f f p
mV M c c m
(A.11)
Where is the fraction of the precipitate (of formula _ nSI Ca ) which is actually SI, i.e.
.
SI
SI Ca
M
M n M
(A.12)
Note that denominator of 1000 appears in Eq. (A.11) since m. is in mg and all other
masses in this equation are in g. Both adsorption and precipitation are contributing to
the change in SI concentration from 10c to 1 fc . However, the precipitate is the only
cause of the change in calcium concentration from 20c to 2 fc , and since the
stoichiometry is . _ nSI n Ca SI Ca , then the actual mass of precipitate must be
given by:
20 2 ( . )p f SI SI
Vm c c M n M
n (A.13)
We can now use the above equations for and Γ (C1f) in Eq. (A.11) to obtain the
following expression for the mass of SI:

Appendix
242
Total Mass of SI =
1 1 20 2. . . . ( . )1000 .
SISI f f f SI SI
SI Ca
Mm VV M c c c c M n M
M n M n
(A.14)
Which simplifies to:
Total Mass of SI =
1 1 20 2
.. . .
1000
SISI f f f
V MmV M c c c c
n
(A.15)
Thus, by material balance (conservation of mass of SI), we can write:
10 1 1 20 2. . . . .1000
SISI SI f f f
MmV M c V M c c c c
n
(A.16)
Which can be divided through by . SIV M to obtain:
10 1 1 20 2
1.
. 1000f f f
SI
mc c c c c
V M n
(A.17)
The main problem with the above equation is that it has 2 unknowns, 1 fc (SI conc.) and
2 fc (Ca conc.), which means that it cannot be solved as written. However, we can
eliminate the Ca concentration, 2 fc , by using the solubility product equation (if there
actually is a precipitate) for the _ nSI Ca - (i.e. 1 2.n
sp f fK c c ) to note that:
1/
2
1
n
sp
f
f
Kc
c
Hence, this expression for 2 fc can be substituted into Eq. (A.17) above to obtain the
equation for coupled adsorption/precipitation:

Appendix
243
1/
10 1 1 20
1
1.
. 1000
n
sp
f f
SI f
Kmc c c c
V M n c
(A.18)
As before, this equation can be rewritten in the final working form as:
1/
1 1 1 20 10
1
1( ) .
. 1000
n
sp
f f f
SI f
KmF c c c c c
V M n c
(A.19)
Where, at equilibrium adsorption/precipitation, we simply have to solve this equation
for 1 fc i.e. find the root of 1( ) 0fF c . Note that this is the same equation as Eq. (5.17)
for pure adsorption except for the additional coupled term describing precipitation,
1/
20
1
1n
sp
f
Kc
n c
.
Note that Eq. (A.18) applies if (and only if) there is definitely a precipitate i.e.
1 2.n
f fc c is not less than spK . If there is no precipitate, then the
substitution,
1/
2
1
n
sp
f
f
Kc
c
, does not apply and it happens that the quantity
1/
20
1
n
sp
f
Kc
c
< 0 which is unphysical. Hence in solving the main working Eq
(A.19), we can use it for all cases of adsorption only or coupled adsorption/precipitation
by setting the quantity
1/
20
1
n
sp
f
Kc
c
to its actual value if it is 0, or to zero
otherwise.

244
APPENDIX B: MATERIAL SAFETY DATA SHEET (MSDS)
I. DETPMP - Diethylene tetra-amine penta (methylenephosphonic acid)
II. OMTHP - Octamethylene tetra-amine hexa (methylenephosphonic acid)
III. HMDP - Hexametylene diamine tetra-methylene phosphonic acid
IV. HMTPMP - Bis(hexamethylene) tri-amine pentabis (methylene phosphonic
acid)

Appendix
245
I. HMTPMP - Bis(hexamethylene) tri-amine pentabis (methylene phosphonic acid)

Appendix
246

Appendix
247
N
N
N
P
P
P
P
P
O
O
O
O
O
HO
OH
HO
OH
HO
OH
HO
OH
OH
HO
Properties
Appearance - Brown liquid
Iron (as Fe) - 100ppm max
Chloride (as Cl) - 6% w/w max
Active Solids (as acids) - 45% w/w
pH (1% w/v soln, 20 C) - 2 max
SG (20 C) - 1.20 – 1.26
MWt. - 573.25 g/mol
Table B.1: Structure and properties of DETPMP

Appendix
248
II. OMTHP - Octamethylene tetra-amine hexa (methylenephosphonic acid)

Appendix
249

Appendix
250
N N
N N
P
P
P P
P
O O
O
O
HO
OH
HO
OH
HO
OH
OH
HO
OHO
OHP
O OH
HOProperties
Appearance - Amber liquid
Iron (as Fe) - < 30ppm
Chloride (as Cl) - < 6%
Active Solids (as acids) - 30% w/w
pH (1% w/v soln, 20 C) - 2
SG (20 C) - 1.34
MWt. - 738.40 g/mol
Table B.2: Structure and properties of OMTHP

Appendix
251
III. HMDP - Hexametylene diamine tetra-methylene phosphonic acid

Appendix
252

Appendix
253
N
N
P
P
P
P
O
O
O
O
HO
OH
HO
OH
HO
OH
OH
HO
Table B.3: Structure of HMDP
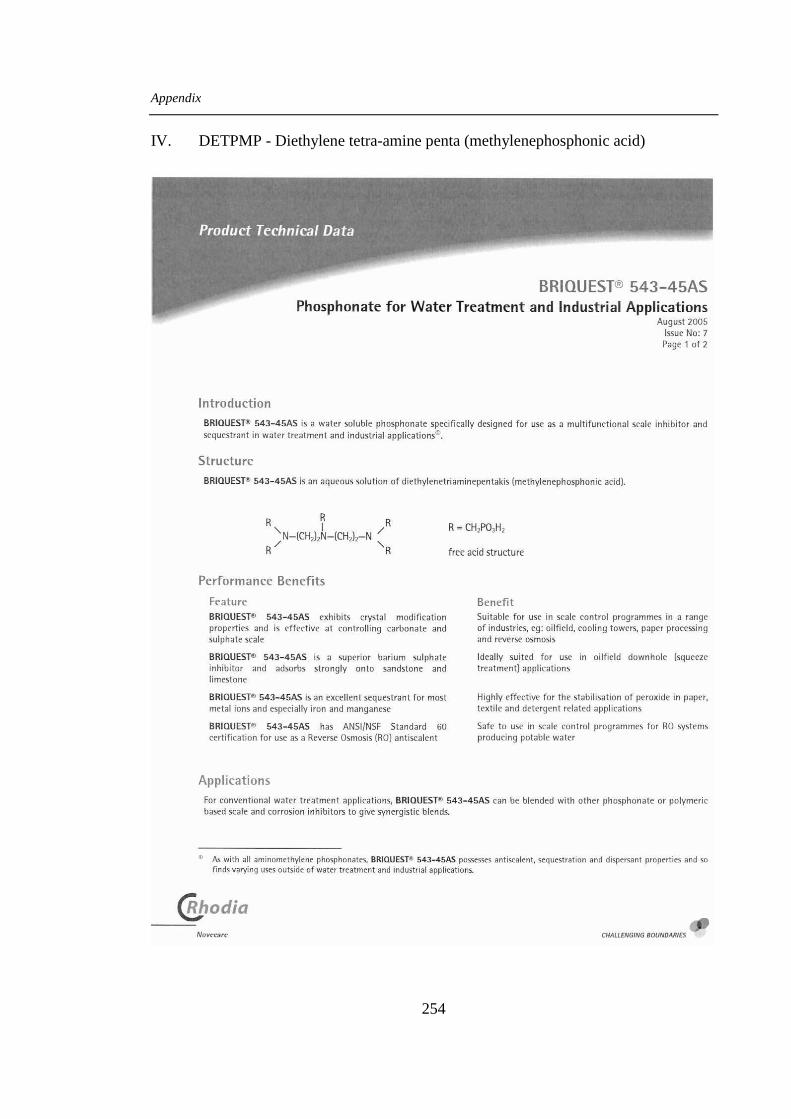
Appendix
254
IV. DETPMP - Diethylene tetra-amine penta (methylenephosphonic acid)

Appendix
255

Appendix
256
N
N
N
P
P
P
P
P
O
O
O
HO
OH
OH
HO
HO
OH
O
OHO
OH
HO
OH
Table B.4: Structure of HMTPMP

257
APPENDIX C: GENERAL EQUIPMENT AND APPARATUS
I. Inductively Coupled Plasma - Optical Emission Spectroscopy (ICP-OES)
II. Environmental Scanning Electron Microscopy - Energy Dispersive X-Ray
(ESEM-EDX)
III. Ultra Violet Spectrophotometer (UV)
IV. Particle Size Analyzer (PSA)

Appendix
258
I. Inductively Coupled Plasma - Optical Emission Spectroscopy (ICP-OES)
ICP-OES is known as an effective tool for measuring ion compositions in water
originating from industry as well as natural processes. In the oil and gas industry, many
laboratories routinely use this technique to determine the ionic composition of oilfield
brines. In this study, ICP results relating to scale inhibitor analysis were are presented,
where the detection limit is within the scope of the experiments. The inhibitors that
were analyzed are phosphonates, although poly-phosphino carboxylic acid (PPCA) SIs
were also tested (Bedford et al., 1994; Christian, 1994 and Ciba-Giegy Industrial
Chemicals (Now FMC Ltd., 1990). These methods had also been tested earlier between
synthetic and field produced brines within the FAST group; which produced accurate
results for both inhibitors, and in both type of brines (Mc Teir et al., 1993; Pennington,
1988). This information is essential as synthetic brines are used for all the experiments
in this study.
One of the ICP spectrophotometer currently being used by the Group is described below
and illustrated in Figure C.1:
Instrument Parameters:
Make: Jobin Yvon (Instruments S.A.)
Model: JY 138 Ultrace ICP Optical Emission Spectrometer with upgraded solid-
state generator and software V5 (JY Ultrace 138 ICP-OES Instruction
Manual)
Mode: Sequential
Analytical lines: Phosphorous at 177.441 and 214.914nm
The ICP-OES has now replaced the routine analysis once previously performed by the
Atomic Absorption Spectroscopy (AAS). For these studies, the analysis for the static
and non-equilibrium experiments performed within the FAST group are now analyzed
by ICP (Sorbie et al., 1992 and Graham et al., 1993, 1994, 1995, 1996). These
experiments require analysis for phosphonate SI, calcium, magnesium, lithium, and on
occasion, iron and aluminium. Phosphonate SI analysis was performed on the ICP,

Appendix
259
whereas poly-phosphino was conducted using wet chemical analysis which has better
sensitivity and repeatability. The wavelengths and calibration standards utilized for
phosphonate as well as PPCA analysis on the ICP are included. Many other elements,
including barium and strontium, which are routinely analyzed for barium sulphate
inhibition efficiency tests, have been analyzed within the FAST group.
The technique of ICP has the advantage of robustness with respect to solution
interferences which affect many wet chemical techniques, and can therefore be used to
determine residual levels of scale inhibitor in produced water (Kan et al., 1991). The
ICP-OES is less time consuming than the wet chemical assays the calibration
range/methods used have been adapted over time.
ICP is an instrumental analysis technique based on atomic emission spectrometry. The
quality of its results therefore depends primarily on the quality of the spectrometer used
to analyze the light emitted by the atoms in the sample introduced into the torch. ICP-
OES uses inert, optically transparent Argon gas to create a high temperature plasma (up
to 10,000oK), generated by radio magnetic fields induced by a copper coil. Samples are
introduced via an auto-sampler and nebulized into an aerosol before entering the plasma
where they are excited. The atoms in the plasma emit light (photons) with characteristic
wavelengths for each element. This light is recorded by one or more optical
spectrometers, which provide optimum sensitivity across the full wavelength range from
160-800nm, and when calibrated against standards this technique provides a
quantitative analysis of the original sample. Table C.1 presents the wavelengths and
concentrations of the calibration standards that are used for different elements.
The procedures followed for each of the elements is similar. However different
concentrations of calibration standards are employed for the different elements. The
measurement time for each element method is 2 seconds, mode 5 is used for single point
analysis and primary/secondary slits of 18/81 respectively are used. The exception to
this is the PPCA analysis, which uses the Gaussian mode of 2 and primary/secondary
slits of 18/15 respectively. In between samples there is a rinse time of 60sec before it
returns to analyze the samples. The sampling times allow for sample introduction; 3
minutes to analyze 1 element and 5-6 minutes to analyze 4 elements.

Appendix
260
Experimental Procedure:
1. Clean and start up the ICP. Allow to heat up for 0.5-1 hour with distilled water
flowing through the machine. The rinse solution between analysis is 5% Nitric
acid and flows for 60sec before moving back to the next sample.
2. Prepare the element calibration standards within the same matrix (normally
synthetic SW, FW or 1% NaCl solution) that the samples have been diluted in.
3. After the heat up period, select the method to be used to analyze the samples
ensuring that the same method shows in the box at the top of the analysis sheet.
This ensures that the correct elements are analyzed.
4. Set up an analysis run to auto-search, auto-attenuate and auto-search again on the
highest calibration standard. The next highest standard can now be auto-searched.
This process is continued until all of the element containing calibration standards
(not standard LOW, which is matrix solution) have been auto-searched. Once the
run begins check that the peaks observed are in the middle of the wavelength
window and the top standard is the full height of the screen.
5. The machine is now ready to calibrate. Set–up a run to calibrate for the elements
in the selected method/matrix.
6. After calibration has been achieved, i.e. a straight line through zero, with an R
square number of approximately 1, the ICP is now ready to analyze samples.
7. The samples are placed in the auto-sampler racks. Calibration standards are placed
in a rack at the end of the samples. When setting up the analysis run, begin with
selecting each of the standards to be analyzed as a sample, then analyze 10-12
samples before returning to the standards. Repeat this formation until all samples
are analyzed, ending with a set of standards.
8. At the bottom of the sample run, add in a description of the run to help with later
identification under the specific method. The analysis file is then saved onto the
computer.
9. The calculated concentrations, with respect to the previous calibration, are then
stored on the computer and printed out.
10. If the results for the calibration standards throughout the run have drifted from
their intended concentrations, then the samples can be drift corrected.

Appendix
261
Figure C.1: ICP-OES - JY 138 Ultrace
Element Wavelength (nm)
Calibration (Standard)
Barium 233.527 0, 10, 25, 50
Strontium 338.071 0, 10, 25, 50
Calcium 317.933 0, 50, 200
Magnesium 279.806 0, 25, 100
Iron 259.940 0, 10, 40
Lithium 670.784 0, 5, 20
Aluminium 308.215 0, 5, 50, 250
Silicon 212.412 or 250.690 0, 5, 50, 250
Sodium 330.237 <100ppm & 589.592 >100ppm
0, 10, 100, 1000
Cobalt 237.86 0, 2, 5
Chromium 205.55 0, 2, 5
Copper 324.754 or 224.700 0, 10, 100

Appendix
262
Nickel 221.64 0, 2, 5
Zinc 213.856 or 334.502 0, 10, 100
Molybdenum 202.03 0, 2, 5
Germanium 265.118 or 209.426 0, 10, 100
Boron 249.67 0, 10, 100
Potassium 766.490 0, 20, 100, 1000
Phosphorus - phosphonate 177.440 (0->50ppm) & 214.914 (0, 50, 500,2500)
0, 5, 50, 500, 2500
Phosphorus - PPCA 177.440 (0->50ppm) & 177.441 (0, 50, 500,2500)
0, 5, 50, 500, 2500
Lead 220.353 0, 5, 10
Tin 189.989 or 235.484 0, 10, 100
Tungsten 209.47 0, 2, 5
Sulphur 180.676 0, 5, 10 or
0, 10, 50, 250
Examples of Diluents: NaCl, DW, SW, FW, KCl/PVS, EDTA/KOH, DTPA/KOH, 5% Nitric acid and Acetic acid.
Table C.1: ICP-OES wavelengths and calibration standards used for different elements.

Appendix
263
II. Environmental Scanning Electron Microscopy - Energy Dispersive X-Ray
(ESEM-EDX)
For this study, a Philips XL30 Environmental Scanning Electron Microscope (ESEM),
with an Oxford Instruments cryo-stage, and an EDAX energy dispersive x-ray detector
(EDX) was used for the analysis. These can be used to image and/or analyze virtually
any substance, including wet, oily and out gassing samples that cannot be examined by
more conventional SEMs (http://www.pet.hw.ac.uk/cesem/intro.htm). This is presented
in Figure C.2.
An Environmental Scanning Electron Microscope (ESEM) is specifically designed to be
able to examine micro-structural and ultra-structural details of samples, within a SEM
chamber, in their uncoated natural state. An ESEM is able to examine wet, oily and out-
gassing samples, without any form of preparation, and is able to maintain specimens
within their natural state for prolonged periods within the ESEM viewing chamber. The
ESEM works at low vacuum (typically 2 - 6 Torr), and utilizes a chamber gas for
imaging, charge suppression and sample humidity.
ESEM is specifically suited to dynamic experimentation at the micron scale and below.
ESEM technology allows for dynamic experiments involving fluids, and the possibility
of imaging samples undergoing compression and tension. ESEM can therefore be
regarded as a micro dynamic experimentation chamber where materials can be
examined at a range of pressures, temperatures, under a variety of gases/fluids.
In simpler terms, scanning electron microscopy occurs when an electron beam is
scanned across the surface of a sample. As the electrons strike the sample, a variety of
signals are generated and it is the detection of these signals that produces an image or
the elemental composition of a sample. There are a number of detectors that can be used
under a number of different conditions, such as low or high vacuum, cryo-SEM and wet
ESEM work. These detectors themselves can be split into categories depending on how
they detect the sample signals. For instance, there are secondary electron detectors, solid
state backscattered detectors, the environmental secondary electron detector and
gaseous secondary electron detectors.

Appendix
264
In the XL30 ESEM, the two detectors for high vacuum mode are an Everhardt-Thornley
secondary electron detector and a solid state backscattered detector. Both these detectors
are permanently within the chamber whereas the various environmental detectors
available, all clip into the detector socket at the back of the chamber and are inserted as
and when required. A summary of detectors and their suitable detection conditions are
presented in Table C.2 (Philips XL30 ESEM Instruction manual).
The signals that provide the greatest amount of sample information in SEM are the
secondary electrons, backscattered electrons and X-rays. The processes behind these
techniques can be detailed as:
(a) Secondary electrons are emitted from the atoms occupying the top surface and are
therefore able to produce a readily interpretable image of the surface,
(b) Backscattered electrons are primary beam electrons that are ‘reflected’ from atoms
in the solid,
(c) X Spectrometry or EDX is the interaction of the primary beam with atoms in the
sample that causes shell transitions, resulting in the emission of x-rays. The
emitted X-rays have an energy, characteristic of the parent element. Detection and
measurement of the energy permits elemental analysis (Energy Dispersive X-ray
Spectroscopy or EDX). EDX can provide rapid qualitative, or with adequate
standards, quantitative analysis of elemental composition with a sampling depth of
1-2 microns. X-rays may also be used to form maps or line profiles, showing the
elemental distribution in a sample surface.
Before using ESEM or EDX, the user should always refer to the manufacturers
instruction manual (Philips XL30 ESEM Instruction manual) and receive training before
commencing work. However, a very general summary of the procedure is as follows;
a. Select the required detector.
b. Load samples into chamber.
c. Select mode – high, low, environmental and the corresponding conditions.
d. Ensure chamber is ready for use.
e. Focus the detector.

Appendix
265
f. The SEM is now ready to image/analyse the samples.
g. When the process is finished, release the samples from the chamber.
Figure C.2: ESEM - Philips XL30 at Heriot-Watt University
Detector Working Mode Position
Everhardt-Thornley secondary electron
High vacuum Permanently inside chamber
Backscattered detector
High vacuum
Permanently inside chamber, parked at back
Solid state backscattered detector
High or low vacuum (0.1 – 1.00 Torr)
Stored at back of chamber in a sleeve. To use, remove sleeve and mount under the pole piece.
Environmental secondary electron detector
Environmental
500micron detectors – P ≤ 10 Torr.
300micron detectors for higher P
Primarily SE but incorporates a substantial BSE signal. Detector is cap shaped and fits over the wet mode insert/bullet. Used in conjunction with a hook adaptor which plugs into the GSED (Gaseous SED)
Gaseous secondary electron detectors
Environmental, P ≈ 6 Torr Fits over end of wet mode bullet/insert and clips into GSED connector at back of

Appendix
266
500micron wet specimens remain hydrated at P ≤ 10 Torr.
1000micron – wider field of view but P ≤ 5 Torr
chamber
Large field gaseous secondary electron detector (LF-GSED)
Low vacuum (0.1-1.00 Torr).
Can be used in a water vapour atmosphere or another gas such as Nitrogen.
Contains a component of BSE. Used in conjunction with low vac/high vac bullet/insert and is plugged into the GSED connector socket at the back of ESEM chamber.
Gaseous backscattered secondary electron detector (GBSED)
Full environmental, P ≤ 10 Torr for 500micron aperture.
3 modes – SE, SE&BSE and BSE. Changes made by using pull-down ‘detectors’ menu. The detector must be worked at a distance of 10mm due to its size.
Bullet High or ≤ 1 Torr low vacuum Screwed into pole piece. It changes pumping regime of lower part of column and forms an attachment point for the various environmental and BSE detectors.
ESEM bullet Full wet ESEM work.
Low vacuum where high conical ESD detector cap is used to minimise the gas path length during EDX analysis.
Screwed into pole piece. It changes pumping regime of lower part of column and forms an attachment point for the various environmental and BSE detectors.
Table C.2: ESEM - Summary of detectors and their detection conditions

Appendix
267
III. Ultra Violet Spectrophotometer (UV)
For this study, the UV/VIS spectrophotometer was used for the determination of sodium
iodide (iodide ion) concentration in brines. This measurement was carried out in-line
during sand pack characterization to measure dead volume and pore volume of the sand
pack column. The instruments used for the study was the Campsec M302 (Figure C.3).
Experimental Procedure:
Sodium Iodide (iodide ion) concentrations were determined by measuring the
absorbance of the sample and using a calibration curve equation to determine the
concentration. The set up of the spectrophotometer to measure absorbance is detailed
below:
a. Switch the instrument on using the power on switch located at the right hand side,
towards the rear. Allow 15 minutes for the instrument to stabilize.
b. Set the required wavelength in nanometers (in this case is 230nm).
c. If working in the ultraviolet range (200-400nm) switch on the deuterium lamp using
the UV lamp push button switch (after 30 seconds the lamp lights and the LED is
illuminated) and allow up to 15 minutes for the lamp output to stabilize.
d. Set the Conc/%T/Abs control to Abs so the read-out appears in absorbance units.
e. To set the absorbance read-out to zero, place a 2 cm cuvette filled with distilled
water in the cell holder and close the sample compartment lid. Use either the auto
zero push button switch or 100%T control to set the absorbance to 0.
Other important points are;
Always consult the appropriate instruction manual for the specific model (Camspec
M302 UV/Vis Spectrophotometer Instruction manual). The cell should be washed out
with some of the sample solution, emptied and re-filled with the sample solution before
the absorbance is recorded. Wash out the cell with distilled water in between analysing
each sample and ensure the spectrophotometer remains at zero. It is essential that the
cell is orientated in the same direction for zeroing and for every analysis.

Appendix
268
Notes:
1. Always wipe the transparent faces of the cell with a clean tissue to remove any
drops of solution,
2. Check that there are no air bubbles on the inner walls of the cell,
3. The single most important aspect of inhibitor residual assay is to ensure that all
glassware is cleaned thoroughly prior to use.
These features can lead to erroneous absorbance readings.
Figure C.3: UV/Vis Spectrophotometer - Camspec M302

Appendix
269
IV. Particle Size Analyzer (PSA)
Particle size and its distribution are important information required prior to executing
static adsorption/precipitation or non-equilibrium sand pack experiments. For this study,
sand, kaolinite and siderite minerals were measured before being used in the various
experiments. Having a consistent size and distribution is important for the analysis as
adsorption/precipitation (particularly adsorption) onto these minerals very much
depends on their particle size and distribution (i.e. specific surface area). The Malvern
Master Sizer MS-20 was used to measure particle size and its distribution. Refer to
Figure C.4 (Malvern Master Sizer MS-20 Instruction Manual)
This machine uses the principle of laser diffraction to determine the particle size of the
minerals described in Chapter 4. The technique of laser diffraction is based around the
principle that particles passing through a laser beam will scatter light at an angle that is
directly related to their size.
Operation Procedure:
a. Turn on the instrument. The switch is located on the back left hand side. The
laser must also be switched on by turning the key adjacent to the switch.
b. Attach the appropriate lens to the flow cell. The following lens will analyze
these size ranges
Lens Size Range
300 mm 1.2 - 600 µm
100 mm 0.5 - 180 µm
45 mm 0.1 - 80 µm
c. Allow the instrument to warm up for 30 minutes.
d. Switch on the PC and select Malvern Mastersizer option (F1).
e. At the instrument parameters page type "easy" to select the "Easy" measurement
mode.

Appendix
270
f. Press F10 - Set Parameters.
g. Press the END key to change the following parameters
Presentation - "Std"
Focal Length - Input the lens to be used
Beam Length - "2.2nm" is standard
Data Storage - Facility does not work
Kill Data - "0" always set as this
h. Press F2 (Sample details) and input sample details.
i. Introduce mobile phase into sample cell and start stirrer (set to 1/3 of max speed)
so that fluid flows through the flow cell.
j. Press "a" to align the laser.
k. Press F3 (Set Zero). This sets the background level for the analysis. The mobile
phase should be flowing through the cell at this point.
l. Dropwise, add dispersion to be analysed to mobile phase.
m. Press F4 (Check Sample Concentration) to assess the sample concentration and
obstruction level (This value must be between 0.1 and 0.3). If below add more of
the dispersion until range is reached.
n. Press F5 to measure particle size distribution.
o. The results obtained are printed out as the table detailed overleaf.
Note:
Normally, an initial first pass measurement is made using the 300mm lens to
roughly ascertain the samples distribution. Following this, an approximate
particle size estimate can be made and the appropriate lens can then be used.
Following a change in lens, the flow cell must be emptied, rinsed clean and the
mobile phase is introduced to the cell. The complete procedure (from step 6 to
step 15) must then be performed.

Appendix
271
Figure C.4: Particle Size Analyzer - Malvern MS-20

272
REFERENCES
Bedford, C. T., Burns, P., Fallah, A., Garnham, P. J. and Barbour, W. J.: “A new assay
for phosphino carboxylate scale inhibitors at the 5ppm level,” presented at the Royal
Society of Chemistry Symposium - Chemistry in the Oil Industry, held at Ambleside
UK, 12-15 April 1994.
Bonnett, N, Fieler, E.R. and Hen, J.: "Application of a Novel Squeeze Scale Inhibitor in
the Beryl Field", SPE 23107, presented at the Offshore Europe Conference held in
Aberdeen, 3-6 September, 1991.
Boreng, R., Sorbie, K.S. and Yuan, M.D.: “The Underlying Theory and Modelling of
Scale Inhibitor Squeezes in Three Offshore Wells on the Norwegian Continental Shelf”,
Proceedings of the Fifth International Oilfield Chemicals Symposium, Geilo, Norway,
20-23 March 1994.
Bourne, H.M., Bolton, J., Heath, S.M. and Lawless, T.A.: “The importance of Non-
Equilibrium Core Floods for the Modelling of Scale Inhibitor Squeeze Treatments”,
paper presented at the Advances in Solving Oilfield Scale Problems Conference,
Organised by IBC Ld., Aberdeen, 7-8 October 1992.
Boyle, M.J. and Mitchell, R.W.: "Scale Inhibitor Problems Associated with North Sea
Oil Production", SPE8164, 1979.
Camspec M302 UV/Vis Spectrophotometer Instruction Manual.
Carlberg, B.L and Matthews, R.R.: "Scale Control Technology - A Review", paper for
22nd Annual S.W. Petroleum Short Course, pp. 263-270, Labbok, Texas, 17-18 April,
1975.
Carlberg, B.L. : “Scale Inhibitor Precipitation Squeeze for Non-Carbonate Reservoirs”,
SPE17008, presented at the SPE Production Technology Symposium, Lubbock, TX, 16-
17 November 1987.

References
273
Carlberg, B.L.: “Precipitation Squeeze Can Control Scale in High-Volume Wells”, Oil
and Gas Journal, December 1983.
Carrell, C.D: "The Occurence, Prevention and Treatment of Sulphate Scale in Shell
Expro", SPE16538, presented at Offshore Europe 87, Aberdeen, September 8-11, 1987.
Charleston, J.: "Scale Removal in the Virden, Manitoba, Area", SPE2160, presented at
the 43rd Annual Fall Meeting of SPE of AIME held in Houston, Texas, 29 September -
2 October, 1968.
Chen P. and Graham G.M.: “Examination of the Influence Flow Rate on Inhibitor
Return Concentrations in Non-Equilibrium Core Flooding of Generically Different
Scale Inhibitors Applied in Both Adsorption and Precipitation Treatments.” Presented at
The 11th
International Oil Field Chemicals Symposium, OFCS in Norway.
Christian G.D., 5th edition of Analytical Chemistry, John Wiley & Sons, Inc., 1994.
Ciba-Giegy Industrial Chemicals (Now FMC Ltd.), Product Information Bulletin:
“Bellasol S40/S45; Analytical procedure for their determination in oilfield brines,”
Manchester, January 1990. (Note: Ciba-Giegy Industrial Chemicals is now FMC Ltd.).
Cowan, J.C.: Water - Formed Scale Deposits, Gulf Publishing Co., Houston, 1976.
Durham, D.K.: "Equations for Prediction of Scale inhibitor Return after Squeeze
Treatment", Paper SPE presented at the 1983 California Regional Meeting held in
Ventura, California, March 23-25, 1983.
Flow Assurance Scale Team (FAST) Manual, Institute of Petroleum Engineering,
Heriot-Watt University, 2008.
Funkhouser, G.P. and Gdanski, R.D.: "Improved Adsorption-Isotherm Modelling for
Phosphonate Scale Inhibitors”, Proceedings of the NIF International Oilfield Chemistry
Symposium, Geilo, Norway, 1-4 April 2001.

References
274
Gdanski, R.D. and Funkhouser, G.P.: "Mineralogy Driven Scale Inhibitor Squeeze
Designs", Paper SPE 94510 presented at the SPE European Formation Damage
Conference held in Scheveningen, The Netherlands, 25-27 May 2005.
Gdanski, R.D. and Funkhouser, G.P.: "Successful Model of the Kinetic release of a
Phosphonate Scale Inhibitor", Presented at the 2001 NIF International Oil Field
Chemistry Symposium, Geilo, Norway, April 1-4, 2001.
Gdanski, R.D.: "Formation Mineralogy Impacts Scale Inhibitor Squeeze Designs",
presented at the 2008 SPE Europec/EAGE Annual Conference and Exhibition held in
Rome, Italy, 9-12 June 2008.
Goulding, P.S.: "Formation Damage Arising from Barium Sulphate Scale
Precipitation", PhD thesis, Heriot-Watt University, Edinburgh, 1987.
Graham G. M., Sorbie, K. S. and Littlehales I.: “The Accurate Detection and Assay of
Oilfield Scale Inhibitors in Real Field Brines,” presented at the conference Water
Management Offshore Organised by IBC Ltd, Marriott Hotel, Dyce, Aberdeen, 6-7
October, 1993.
Graham G. M., Sorbie, K. S., Boak, L. S., Taylor, K. and Blilie, L.A.: “Development
and Application of Accurate Detection and Assay Techniques for Oilfield Scale
Inhibitors in Produced Water Samples,” SPE No. 28997, presented at the SPE
International Symposium on Oilfield Chemistry, San Antonio, Texas. 14-17 February,
1994.
Graham G. M., Sorbie, K. S., Boak, L. S.: “Development of Accurate Assay Techniques
for Poly Vinyl Sulphonate (PVS) and Sulphonated Co-polymer (VS-Co) Oilfield Scale
Inhibitors,” presented at NIF 6th
International Oil Field Chemical Symposium, Geilo,
Norway, 19-22 March, 1995.
Graham G.M., Sorbie, K.S., Johnston*, A. and Boak, L.S.: “Complete Chemical
Analysis of Produced Water by Modern Inductively Coupled Plasma Spectroscopy

References
275
(ICP),” presented at NIF 7th
International Oil Field Chemical Symposium, Geilo,
Norway, 17-20 March, 1996.* Nalco Exxon Energy Chemicals.
Gregg, S.J.: The Surface Chemistry of Solids, Second Edition, Chapman & Hall Ltd.,
London, 1965.
Hong, S.A. and Shuler, P.J. : “A Mathematical Model for the Scale Inhibitor Squeeze
Process,” SPE16263, SPE (Production Engineering), pp.957-607, November 1998.
Hong, S.A. and Shuler, P.J.: “A Mathematical Model for the Scale Inhibitor Squeeze
Process”, SPE16263, presented at the SPE International Symposium on Oilfield
Chemistry, San Antonio, TX, 4-6 February 1987.
http://www.pet.hw.ac.uk/cesem/intro.htm
Hughes, C.T. and Whittinghan, K.P.: "The Selection of Scale Inhibitors for the Forties
Field", Paper EUR313 presented at the European Petroleum Conference held in
London, England, October 25-28, 1982.
Iler, R.K.: The chemistry of Silica, A Wiley - Interscience Publication, New York,
p.659, 1979.
Jakobsen, S.R., Read, P.A. and Schmidt, S.: "Extended Scale Inhibitor Squeeze Life in
pH Sensitive Sandstone Cores", UK Corrosion 89, Blackpool, November 8-10, 1989.
Johnson, K.S.: "Water Scaling Problems in the Oil Production Industry", presented at
the Symposium on Chemicals in Oil Industry, Royal Society of Chemistry Industrial
Division, North West Region, Manchester, 1983.
Jordan M. M., Sorbie, K. S., Marulier, M. F., Taylor, K., Hourston, K. and Griffin, P.:
"Implication of Produced Water Chemistry and Formation Mineralogy on Inhibitor
Adsorption/Desorption in Reservoir Sandstone and their Importance in the Correct
Selection of Scale Squeeze Chemicals." Presented at the 6th International Symposium
on Chemistry in the Oil Industry, Ambleside, Cumbria, UK, 14th - 17th April, 1997.

References
276
Jordan M.M., Sorbie, K.S., Marulier, M.F., Taylor, K., Hourston, K. and Griffin, P.:
“Implication of Produced Water Chemistry and Formation Mineralogy on Inhibitor
Adsorption/Desorption in Reservoir Sandstone and their Importance in the Correct
Selection of Scale Squeeze Chemicals.” Presented at the 6th
International Symposium on
Chemistry in the Oil Industry, Ambleside, Cumbria, UK, 14th
– 17th
April 1997.
Jordan, M.M, Sorbie, K.S, Chen, P, Armitage, P, Hammond P and, Taylor, K.: “The
Design of Polymer and Phosphonate Scale Inhibitor Precipitation Treatments and the
Importance of Precipitate Solubility in Extending Squeeze Lifetime", SPE37275
presented at the SPE International Symposium on Oilfield Chemistry, Houston Texas,
18-21 February 1997.
JY Ultrace 138 ICP-OES Instruction Manual
Kahrwad, M., Sorbie, K.S. and Boak, L.S.: “Coupled Adsorption/Precipitation of Scale
Inhibitors: Experimental Results and Modelling,” SPE 114108, presented at the SPE
International Oilfield Scale Conference, Aberdeen, UK, 28-29 May 2008.
Kan, A. T., Cao, X., Yan, X., Oddo, J.E. and Tomson, M.B.: "The Transport of
Chemical Scale Inhibitors and its Importance to the squeeze Procedure", Paper No. 33
presented at the NACE Annual Conference and Corrosion Show held in Nashville,
Tennessee, April 27-May 1, 1992.
Kan, A. T., Yan, L., Bedient, P.B., Oddo, J.E. and Tomson, M.B.: "Sorption and Fate of
Phosphonate Scale Inhibitors in the Sandstone Reservoir", Paper SPE 21714 presented
at the Production Operation Symposium held in Oklahoma, April 7-9, 1991.
Kan, A.T., Varughese, K. and Tomson, M. B.: “Determination of Low Concentrations
of Phosphonates in Brines,” SPE 21006, presented at the SPE International Symposium
on Oilfield Chemistry, Anaheim, 20-22 February, 1991.
Kerver, J .K. and Morgan , F.A.: “Corrosion Inhibitor Squeeze Technique: Laboratory
Adsorption – Desorption Studies”, Journal of Materials Protection, July, 1965 P69 -77.

References
277
Kerver, J.K. and Heilhecker, J.K.: “Scale Inhibition by the Squeeze Technique”, Journal
of Canadian Petroleum Technology, 8, No. 1, pp. 15-23, January–March, 1969.
King, G.E. and Skillman, H.L. and Herring, G.D.: "Control of Formation Damage at
Prudhoe Bay, Alaska by Inhibitor Squeeze Treatment", SPE12472, Journal Technology,
pp.1019-1034, June 1985.
King, G.E. and Warden, S.L.: “Introductory Work In Scale Inhibitor Squeeze
Performance : Core Tests and Field results”, SPE18485, presented at the SPE
International Symposium on Oilfield Chemistry, Houston, TX, 8-10 February 1989.
Lawless, T. A., Bourne, H. M., Heath, S. and Smith, R. N.: "Rock/Fluid Interactions
and Resulting Phase Behavior Considerations for the Scale Inhibitor Squeeze Design of
Carbonate Fields". Paper No. 53, presented at NACE Annual Conference and
Corrosion Show, Baltimore, Maryland, 27th February - 4th March, 1994.
Lecourtier, J., Lee, L.T. and Chauveteau, G.: “Adsorption of Polyacrylamides on
Siliceous Mineral”, Journal of Colloid and Interface Science, vol. 47, 1990, pp.219-231.
Malandrino, A., Yuan, M.D., Sorbie, K.S. and Jordan, M.M. : “Mechanistic Study and
Modelling Of Precipitation Scale Inhibitor Squeeze Processes”, SPE29001, Proceedings
of the SPE International Symposium on Oilfield Chemistry, San Antonio, TX, 14-17
February 1995.
Malvern Master Sizer MS-20 Instruction Manual
Matthews, R.R and Carlberg, B.L.: "Scale Control Technology - A Review", paper for
22nd Annual S.W. Petroleum Short Course, pp. 263-270, Labbok, Texas, 17-18 April,
1975.
Mazzolini, E., Bertrro, L. and Truefitt: "Scale Prediction and Laboratory Evaluation of
BaSO4 Scale Inhibitors for Seawater Flood in High Barium Environment", SPE20894
presented at Europec 90, Hague, Netherlands, 22-24 October 1990.

References
278
McTeir, M. D. K., Ravenscroft, P. D. and Rudkin, C.: “Modified Methods for the
Determination of Polyacrylic/Phosphinopolycarboxylic Acid and Polyvinylsulphonic
acid Scale Inhibitors in Oilfield Brines,” SPE 25160, presented at the SPE International
Symposium on Oilfield Chemistry, New Orleans, LA, 2-5 March, 1993.
Meyers, K.O., Skillman, H.J. and Herring, G.D.: "Control of Formation Damage at
Prudhoe Bay, Alaska, by Inhibitor Squeeze Treatment", SPE12472, Journal of
Petroleum Technology, pp. 1019-1034, June 1985.
Miles, L.: "New Well Treatment Inhibits Scale", Oil and Gas Journal, pp. 96-99, June
1970.
MSDS from Rhodia.
Olson, J.B, Moore, D.C and Holland-Jones, N.: “A Temperature Activated Extended
Lifetime Scale Inhibitor Squeeze System”, paper No. 25 presented at the NACE Annual
Conference, Nashville, TN, April 27 - May 1, 1992.
Pardue, J.E.: "A New Scale Inhibitor for Scale Squeeze Applications", Paper SPE21023
presented at the SPE International Symposium on Oilfield Chemistry, Anaheim, CA,
20-22 February 1991.
Pardue, J.E.: "Results of Field Tests with a New Extended Squeeze Life Scale Inhibitor",
Paper No. 35 presented at the NACE Annual Conference and Corrosion Show held in
Nashville, Tennessee, April 27-May 1, 1992.
Patton; Oilfield Water System 2nd
Edition, 1977.
Payne, G.E.: "A History of Downhole Scale Inhibition by Squeeze Treatments", SPE
16539/1, presented at Offshore at Offshore Europe 87, Aberdeen, 8-11 September,
1987.
Pennington, J.: “An Overview of Alternative Approaches to the Development of
Monitoring Methods for Scale Inhibitors in Oil-Field Produced Waters,” Proceedings of

References
279
the 3rd
International Symposium Chemicals in the Oil Industry, University of
Manchester, 19-20 April, 1988.
Philips XL30 ESEM Instruction Manual
Poetker, R.G. and Stone, J.D.: "Squeeze Inhibitor into Formation", Petroleum
Engineering, 1956, 28, No. 5, B-29.
Przybylinski, J.L.: "Adsorption and Desorption Characteristic of Mineral Scale
Inhibitors as related to the Design of Squeeze Treatment,” SPE 18486 presented at the
1989 SPE International Symposium on Oil-Field Chemistry, Houston, TX, 8-10
February, 1989.
Pucknell, J.: "Oilfield Scale", PhD thesis, Heriot-Watt University, Edinburgh, 1983.
Ray, J.M. and Fielde, M.: "Downhole Scale Inhibition in the Beatrice Field", Paper
presented at the 3rd International Symposium on Chemicals in the Oil Industry, Royal
Society of Chemistry Industrial Division, North West Region, Manchester, 19-20 April
1988.
Rogers, L.A., Varughese, K., Prestwich, S.M., Waggett, G.G., Salimi, M.H., Oddo, J.E,
Street Jr., E.H. and Tomson, M.B.: "Use of Inhibitors for Scale Control in Brine
Producing Gas and Oil Well", Journal of SPE Production Engineering, February 1990,
77-82.
Shaughnessy, C.M. and Kelly, W.E: "EDTA Removes Formation Damage at Prudhoe
Bay", Journal of Petroleum Engineering, pp. 1783-1791, October, 1983.
Smith, C.F., Nolan III, T.J. and Crenshaw, P.L.: "Removal and Inhibition of Calcium
Sulphate Scale in Waterflood Project", Journal of Petroleum Technology, pp. 1249-
1256, November, 1968.
Smith, F.W.: "Ion-Exchange Conditioning of Sandstones for Chemical Flooding",
Journal of Petroleum Technology, June, 1978.
Sorbie – personal communication, June 2011.

References
280
Sorbie, K. S., Yuan, M. D., Graham, G. M. and Todd, A. C.: “Appropriate Laboratory
Evaluation of Oilfield Scale Inhibitors,” presented at Advances in Solving Oilfield
Scaling Problems, Organised by IBC Ltd, Aberdeen, 7-8 October 1992.
Sorbie, K.S, Todd, A.C., Thornton, A.R. and Wat, R.M.S.: "The Interpretation and
Theoretical Modelling of Inhibitor/Tracer Corefloods", Paper SPE 20687 presented at
the SPE 65th Annual Technical Conference and Exhibition of the Society of Petroleum
Engineers, New Orleans, LA., 23-26 September 1990.
Sorbie, K.S, Wat, R.M.S., Todd, A.C., and McClosky, T.: "Derivation of Scale Inhibitor
Adsorption Isotherms for Oil Reservoir Squeeze Treatments", paper presented at the
150th Annual Chemical Congress, The Royal Society of Chemistry, at Imperial College,
London, 8-11 April 1991.
Sorbie, K.S. and Gdanski, R.D. : “A Complete Theory of Scale Inhibitor Transport and
Adsorption/Desorption in Squeeze Treatments,” SPE 95088, Proceedings of SPE 7th
International Symposium on Oilfield Scale, Aberdeen, UK, 11-12 May 2005.
Sorbie, K.S., Jiang, P., Yuan, M.D., Chen, P., Jordan, M. and Todd, A.C.: "The Effect of
pH, Calcium and Temperature on the Adsorption of Phosphonate Inhibitor onto
Consolidated and Crushed Sandstone", Paper SPE 26605 presented at the SPE 68th
Annual Technical Conference and Exhibition of the Society of Petroleum Engineers,
Houston, Texas, LA, 3-6 October 1993.
Sorbie, K.S., Todd, A.C., Thornton, A.R. and Wat, R.M.S.: "’The Interpretation and
Theoretical Modelling of Inhibitor/Tracer Corefloods", Paper SPE 20687 presented at
the SPE the 65th
Annual Technical Conference and Exhibition of the Society of
Petroleum Engineers, New Orleans, LA, 23-26 September 1990.
Sorbie, K.S., Todd, A.C., Thornton, A.R. and Wat, R.M.S.: “The interpretation and
Theoretical Modelling of Inhibitor/Tracer Corefloods”, SPE 20687 presented at the 65th
Annual Technical Conference and Exhibition of the Society of Petroleum Engineers,
New Orleans, L.A. (23-26 September, 1990); SPE (Production Engineering), September
1992.

References
281
Sorbie, K.S., Wat, R.M.S. and Todd, A.C. : "Interpretation and Theoretical Modelling
of Scale Inhibitor/Tracer Corefloods,” SPE (Production Engineering), pp.307-312,
August 1992.
Sorbie, K.S., Wat, R.M.S., Todd, A.C. and McClosky, T. : “Derivation of Scale
Inhibitor Adsorption Isotherms for Sandstone Reservoirs,” Royal Society of Chemistry
Publication – Chemical in the Oil Industry : Developments and Applications, edited by
P.H. Ogden, 1991.
Sorbie, K.S., Yuan, M.D., Chen, P., Todd, A.C. and Wat, R.M.S. : “The Effect of pH on
the Adsorption and Transport of Phosphonate Scale Inhibitor Through Porous Media,”
SPE 25165, Proceedings of the SPE International Symposium on Oilfield Chemistry,
Anaheim, CA, 20-22 February 1993.
Sorbie, K.S., Yuan, M.D., Chen, P., Todd, A.C., and Wat, R.M.S.: "The Effect of pH on
the Adsorption and Transport of Phosphonate Scale Inhibitor Through Porous Media",
Paper SPE 25165 presented at the SPE International Symposium on Oilfield Chemistry,
New Orleans, LA, U.S.A., March 2-5, 1993.
Sorbie, K.S., Yuan, M.D., Jordan, M.M. and Hourston, K.E.: “Application Of A Scale
Inhibitor Squeeze Model to Improve Field Squeeze Treatment Design”, SPE29001,
Proceedings of the SPE European Petroleum Conference (Europec 94), London, UK,
25-27 October 1994.
Sorbie, K.S., Yuan, M.D., Todd, A.C., and Wat, R.M.S.: "The Modelling and Design of
Scale Inhibitor Squeeze Treatments in Complex Reservoirs", Paper SPE 21024
presented at the SPE International Symposium on Oilfield Chemistry, Anaheim, CA,
20-22 February 1991.
Sorbie, K.S.: "The Improved Design of Scale Inhibitor Squeeze Treatments", paper
presented at the Water Management Offshore Conference, Aberdeen, UK, UK, 22-23
October, 1991.

References
282
Sorbie, K.S.: “A Genenal Coupled Kinetic Adsorption/Precipitation Transport Model
for Scale Inhibitor Retention in Porous Media: I. Model Formulation”, SPE 130702,
presented at the SPE International Conference on Oilfield Scale, Aberdeen, UK, 26-27
2010.
Tomson, M.B. and Rogers, L.A.: "Use of Inhibitor for Scale Control in Brine Producing
Gas and Oil Wells", Paper SPE presented at the 61st Annual Technical Conference and
Exhibition of the SPE 1986, New Orleans, LA, October 5-8, 1986.
Vazquez, O., Sorbie, K.S. and Mackay, E.J.: “A General Coupled Kinetic
Adsorption/Precipitation Transport Model for Scale Inhibitor Retention in Porous
Media: II. Sensitivity Calculations and Field Predictions”, presented at the SPE
International Conference on Oilfield Scale, Aberdeen, UK, 26-27 2010.
Vetter, O.J., Kandarpa, V., Schalge, A.L., Stration, M. and Veith, E.: "Test and
Evaluation Methodology for Scale Inhibitor Evaluations", Paper SPE16295 presented at
the SPE International Symposium on Oilfield Chemistry held in San Antonio, TX,
February 4-6, 1987.
Vetter, O.J., Kandarpa, V.: "Scale Inhibitor Evaluation for Oilfield and Geothermal
Operation", Paper SPE7846 presented at the 1979 SPE of AIME International
Symposium on Oilfield and Geothermal Chemistry held in Houston, TX, January 22-24,
1979.
Vetter, O.J.: "An Evaluation of Scale Inhibitors", Journal of Petroleum Technology,
August 1972.
Vetter, O.J.: "How Barium Sulphate is Formed: An Interpretation", Journal of
Petroleum Technology, pp. 1515-1524, December 1975.
Vetter, O.J.: "Oilfield Scale - Can We Handle It?", Journal of Petroleum Technology,
pp. 1402-1408, December 1976.

References
283
Vetter, O.J.: "The Chemical Squeeze Process- Some New Information on Some Old
Misconception", SPE3544, Journal of Petroleum Technology, pp. 339-353, March,
1973.
Wat, R.M.S., Montgomery, H.T.R., Maclean, A.F. and Bland, I.D.: "Squeeze
Application Using a Polymer Scale Inhibitor – A Case History", Presented at the 4th
International Oilfield Chemical Symposium, Geilo, Norway, 18 – 21 April 1993.
Walter, G.L.: Water analysis Handbook, Hach Company, Loveland, Colorado, p.651,
1989.
Yuan, M.D., Sorbie, K. S.. Todd, A. C., Atkinson, L. M., Riley, H. and Gurden, S.:
“The Modeling of Adsorption and Precipitation Scale Inhibitor Squeeze Treatments in
North Sea Fields”, SPE25165, presented at the SPE International Symposium on
Oilfield Chemistry, New Orleans, LA, 3-5 March 1993.
Yuan, M.D.: "Prediction of Sulphate Scaling Tendency and Investigation of Barium and
Strontium Sulphate Solid Solution Scale Formation", PhD thesis, Heriot-Watt
University, Edinburgh, 1989.
Zhang, H., Mackay, E.J., Chen, P. and Sorbie, K.S. : “Non-Equilibrium Adsorption and
Precipitation of Scale Inhibitors : Corefloods and Mathematical Modelling,” SPE
64755, Proceedings of the SPE International Oil Conference and Exhibition, Beijing,
China, 7-10 November 2000.