Embed Size (px)
Citation preview

ESTABLISH IBSE
Teaching & Learning Units
Volume 1
Light
Sound
Heating & Cooling
Direct Current Electricity
SEVENTH FRAMEWORK PROGRAMME | SCIENCE IN SOCEITY
COORDINATION & SUPPORT ACTION | GA No 244749
www.establish-fp7.eu
This teaching and learning resource
is presented in four volumes and
has been produced within the
scope of the ESTABLISH Project,
which has received funding from
the European Union’s Seventh
Framework Programme for
research, technological
development and demonstration
under grant agreement no 244749
(2010-2014).
This publication reflects only the
authors’ views and the European
Union is not liable for any use that
may be made of the information
contained therein.
ESTABLISH materials are
distributed under the Creative
Commons Attribution-
Noncommercial-Share Alike license
as described at
http://creativecommons.org/licenses
/by-nc-sa/4.0/
The editorial staff have handled this
content with much care, but they do
not take legal responsibility for
possible mistakes or flaws.
ISBN: 978-1-873769-21-8
Contact Information:
Project website:
www.establish-fp7.eu
www.castel.ie/establish
Email: [email protected]
ESTABLISH Project
Coordination &
Editorial Team:
Dr. Eilish McLoughlin,
Dr. Odilla Finlayson,
Dr. Deirdre McCabe,
Dr. Sarah Brady
ABOUT ESTABLISH
ABOUT ESTABLISH
ESTABLISH is a pan-European project
funded by the European Union’s
Seventh Framework Programme (FP7)
involving fourteen partners from across
eleven countries (Ireland, Sweden,
Poland, Czech Republic, Malta,
Slovakia, Estonia, Italy, Germany,
Netherlands, Cyprus). The aim of the
ESTABLISH project is to promote and
facilitate the use of inquiry-based
approaches in the teaching and
learning of science and technology
across Europe with second level
students (ages 12-18 years).
Through the collaborative efforts of
these partners, a series of 18 inquiry-
based science education (IBSE)
teaching and learning units have been
developed through piloting and trialling
with teachers in the classroom. These
units form the core resource for the
implementation of ESTABLISH teacher
education programmes.
These booklets provide background
information for teachers on the
ESTABLISH approach to IBSE and
presents several of these units which
focus on particular physics-related
themes selected to be appropriate for
the second level science curriculum.
These materials serve as exemplary materials for science teachers and instructors of
teacher professional development to experience the benefits of inquiry-based
science education approach and are offered openly to inspire, guide and stimulate
the further development of IBSE resources and practices. Electronic versions of
these units and associated classroom materials are available openly for download
from the project website at www.establish-fp7.eu and at www.castel.ie/establish.
The ESTABLISH project (2010-2014) is coordinated by Dr. Eilish McLoughlin, Dr.
Odilla Finlayson, Dr. Sarah Brady and Dr. Deirdre McCabe from the Centre for the
Advancement of Science and Mathematics Teaching and Learning (CASTeL) at
Dublin City University (DCU).
Participating Institution Country
Dublin City University Ireland
AG Education Services Ireland
Umea Universitet Sweden
Uniwersytet Jagiellonski Poland
Univerzita Karlova v Praze Czech
Republic
Acrosslimits Limited Malta
Univerzita Pavla Jozefa
Safárika v Košiciach Slovakia
Tartu Ulikool Estonia
Universita degli Studi di
Palermo Italy
Malmö University Sweden
Leibniz-Institut fuer die
Paedagogik der
Naturwissenschaften und
Mathematik an der
Universitat Kiel
Germany
Centre for Microcomputer
Applications Netherlands
Martin Luther Universitaet
Halle-Wittenberg Germany
Frederick University Cyprus
CONTENTS
Volume 1 LIGHT ............................................................................................................ 5
SOUND ........................................................................................................ 35
HEATING AND COOLING: DESIGNING A LOW ENERGY HOME .............. 83
DIRECT CURRENT ELECTRICITY ........................................................... 125
Volume 2 EXPLORING HOLES ..................................................................................... 5
CHEMICAL CARE ....................................................................................... 37
COSMETICS ............................................................................................... 92
PLASTIC & PLASTIC WASTE ................................................................... 142
CHITOSAN – FAT MAGNET? .................................................................... 196
Volume 3 DISABILITY ................................................................................................... 5
ECO-BIOLOGY ............................................................................................ 37
BLOOD DONATION ..................................................................................... 61
WATER IN THE LIFE OF MAN .................................................................... 93
Volume 4 FORENSIC SCIENCE ................................................................................... 5
MEDICAL IMAGING .................................................................................... 41
RENEWABLE ENERGY .............................................................................. 75
PHOTOCHEMISTRY ................................................................................... 96
PHOTOSYNTHESIS .................................................................................. 136

LIGHT
Page 5 of 165
LIGHT
The development of this unit has been led by the ESTABLISH partners:
Eilish McLoughlin and James Fryar
Dublin City University (DCU), Ireland

ESTABLISH: IBSE TEACHING & LEARNING UNIT
Page 6 of 165
UNIT CONTENTS
I. Unit Description ............................................................................... 7
II. IBSE Character ............................................................................... 8
III. Science Content Knowledge ........................................................... 9
IV. Pedagogical Content Knowledge ................................................... 10
V. Industrial Content Knowledge ........................................................ 12
VI. Learning Path(s) ............................................................................ 14
VII. Assessment ................................................................................... 16
VIII. Student Learning Activities ............................................................ 17
Activity 1.1: What are sources of light? ..................................................... 17
Activity 1.2: How does light travel? ........................................................... 18
Activity 1.3: Understanding shadows ........................................................ 19
Activity 1.4: Exploring white light and filters .............................................. 20
Activity 1.5: Exploring primary colours ...................................................... 21
Activity 1.6: Exploring plane mirrors.......................................................... 23
Activity 1.7: Exploring refraction ............................................................... 24
Activity 1.8: Exploring lenses .................................................................... 25
Activity 2.1: Investigating mirror images ................................................... 26
Activity 2.2: Investigating Snell’s Law ....................................................... 27
Activity 2.3: Studying real and apparent depths ........................................ 28
Activity 2.4: Investigating lenses ............................................................... 29
Activity 2.5: Optical Storage ...................................................................... 30
Activity 2.6: How do sunglasses work? ..................................................... 32
Activity 2.7: Why are sunsets red? ............................................................ 33
LIGHT
Page 7 of 165
I. Unit Description
The Light Unit is divided into two subunits that can be used independently or
sequentially, and within a hierarchical curriculum. The subunits follow the natural
divide typically employed in relation to the topic of Light: Subunit 1 is aimed at an
introductory level and takes a ‘ray-based’ approach, whereas Subunit 2 is more
appropriate for the higher stages of secondary school and incorporates ‘wave-
based’ phenomena. Light is a subject area that often involves curriculum-prescribed
demonstrations and experiments, for example the dispersion of white light by a
prism and image formation by lenses. The activities presented in this unit are
suitable for demonstrations / experiments in a format consistent with an IBSE
approach.
Subunit 1: Introducing Light
In this subunit, students examine the basic physical properties of light and its
interaction with materials in a predominately qualitative fashion. They learn that
sources of light have specific physical characteristics and these can determine
properties of light, such as its colour and intensity. They investigate the interaction
of light with matter and explore phenomena such as reflection and refraction.
Student level: Lower secondary school level, ages 11 – 15
Discipline(s) involved: Physics
Estimated duration: 5-6 class periods
Subunit 2: Investigating Light
In this subunit, students re-examine a number of the concepts of Subunit 1 in a
more quantitative way. They investigate refraction, the refractive index of materials,
and the formation of images by mirrors and lenses. Additional topics such as
polarization, diffraction, and scattering of light are introduced. Students also learn
that, through an understanding of its behaviour, light can be manipulated for
technological goals.
Student level: Higher secondary school level, ages 15+
Discipline(s) involved: Physics
Estimated duration: 5-6 class periods

ESTABLISH: IBSE TEACHING & LEARNING UNIT
Page 8 of 165
II. IBSE Character
Subunit 1: Introducing Light
As an introductory course on Light, the main IBSE approaches employed here are
interactive discussion/demonstration, guided discovery and guided inquiry. Through
the activities the students develop basic skills to perform and plan scientific inquiry:
Asking and answering appropriate questions
Planning and conducting simple scientific investigations
Giving priority to empirical evidence
Using empirical evidence as the basis for their explanations of phenomena
Communicating and discussing their observations and explanations
Revising explanations based on further investigations
Although light is a subject with which students have familiarity, questioning their
conceptual understanding can quickly reveal gaps that can be exploited to form the
basis of the subsequent investigations. The difficulty for the teacher lies in
balancing the requirement that students (re)evaluate and (re)develop their own
concepts, while simultaneously guiding them away from misconceptions and
misguided interpretations. Therefore a key part of the IBSE character of this unit is
to allow discussion between students of the pros and cons of particular lines of
thought, interpretation of data, and conclusions drawn.
Subunit 2: Investigating Light
As this subunit is aimed at the higher levels of secondary education, the main IBSE
approaches are guided discovery, guided inquiry, and bounded inquiry. Skills
developed by students include:
Performing experiments
Analysing results
Communicating results with the use of graphs
Comparing experimental results to theoretical models
Deciding if results support or falsify previous hypotheses
The difficulty for the teacher in this case arises if experimental errors are large and
students reach incorrect conclusions. An important part of maintaining the IBSE
nature of the investigations is to examine these results in the context of the wider
opinion, i.e. how one set of results compare to those of other students. The aim
should be to establish that a single experiment is insufficient to draw conclusions,
that the results from multiple experiments should be analysed as a whole, and to
LIGHT
Page 9 of 165
promote discussion on why certain methodologies employed by the students were
less error-prone than others.
III. Science Content Knowledge
Subunit 1: Introducing Light
In this subunit it is assumed that students have no prior formal knowledge of the
subject beyond their existing own conceptions. The activities introduce students to
the following ideas and concepts:
Objects may be classified by their optical characteristics
Light has physical properties such as colour and intensity
Shadows are caused by the absence of light
Light may not necessarily be visible to the naked eye
Light is emitted as a wave
The direction of propagation of these waves may be represented as rays
Mirrors reflect light and, for a plane mirror, the angle of incidence is equal to
the angle of reflection
The direction of light can change as it passes from one medium to another
White light is the combination of lots of different colours of light
White light can be produced using just red, green, and blue primary colours
Filters pass certain colours of light and absorb others
Lenses alter the direction of light and can be used to form images
Subunit 2: Investigating Light
In this subunit it is assumed that students have studied basic trigonometry and are
familiar with graphing data. The activities introduce students to the following
concepts and ideas:
An image is formed in a plane mirror and this image is located on the
opposite side of the mirror to the observer
Snell’s Law describes how the direction of light changes as it passes from
one medium to another
At a particular angle, light will be reflected from an interface rather than
transmitted as it passes from a high refractive index material to a low
refractive index material
When light travels from some medium to air, comparing the actual position or
width of an object to its apparent position or width allows one to determine
the refractive index of the medium

ESTABLISH: IBSE TEACHING & LEARNING UNIT
Page 10 of 165
The position and magnification of the image created by a lens depends on
the focal length and the distance of the object to the lens
Light can be polarised, and the intensity of light through two polarisers can be
described by Malus’s Law
Light can be diffracted by small objects and the width of the diffraction pattern
depends on the size of the objects
Different wavelengths of light can be scattered by varying amounts
IV. Pedagogical Content Knowledge
Light is a topic that exposes students to a fundamental aspect of science – different
models are employed depending on the information one wishes to obtain about a
physical system.
The properties of visible light (~400 – 700 nm) examined through the
activities are representative of electromagnetic waves (EM) in general.
EM waves are transverse, which can be demonstrated through polarization.
The ‘ray model’ can be used to understand the formation of shadows,
reflection and refraction. This model simplifies the analysis of situations
where the direction of light is altered.
The ‘wave model’ can also be used to understand shadows, reflection, and
refraction, but is required to understand phenomena such as polarization,
diffraction and interference.
Phenomena such as the decrease in measured intensity of light as a function
of distance, or partial absorption/transmission through neutral density filters,
are difficult to explain on the basis of the ‘ray model’. These can readily be
explained by the ‘wave model’ as changes in the amplitude.
The concept of energy is useful in explaining absorption/transmission, with
the energy loss occurring as a result of the interaction of light with materials.
It is the interaction with materials that result in reflection, refraction, shadows,
polarization, absorption, and diffraction.
Science Education research has revealed a number of student misconceptions
around the topic of Light:
A recurring theme in studies is that light is said by students to illuminate
objects and once ‘lit up’ these objects can then be seen. Students
conceptualise light as a ‘local brightness’ and the act of seeing is often not
considered to require that light travel directly to the eye.
Students often ask questions of the form: ‘If I can see light and it travels as a
ray, then why don’t I see bright rays crossing the room?’ This type of question
demonstrates that, although students may accept that light is present in the
LIGHT
Page 11 of 165
space around them, they fail to understand the relationship between the
image they see and the spatial-distribution of light in their environment
(thereby altering their view of objects depending on their position).
Students tend to classify light sources into those that are ‘natural’ and those
that are ‘artificial’ and, accordingly, can attribute unique properties to the light
produced in each case. Although the classification into ‘natural’ and ‘artificial’
sources is somewhat flawed (is a burning candle producing light through
natural or artificial means?), it nevertheless demonstrates that students have
actively attempted to distinguish between the properties of different light
sources and the properties of the light produced. This can form the basis for
a more scientific approach at classifying the optical properties of objects.
Students tend to relate the reflection of light specifically to mirrors and ‘shiny
surfaces’. They often fail to see the relevance of reflection in relation to the
visible objects within their environment that are not ‘sources’ of light.
Students often conceptualise that the image formed in a mirror is located on
the surface of the mirror rather than behind it.
Students often fail to understand the role of filters, even having studied the
dispersion of white light by a prism. Many students consider that filters ‘alter
the colour of light’ rather than allowing or preventing certain colours from
passing through them.
Further reading:
‘Student Conceptions of Light: A Case Study’, D. M. Watts, Phys. Educ. 20, 183
(1985)
‘Exploring Students’ Concepts of Light’, B. F. Stead and R. J. Osborne, Australian
Science Teacher’s Journal 26(3), 84 (1980)
‘Student Misconceptions about Light in Algeria’, D. Blizak, F. Chafiqi, and D. Kendil,
http://spie.org/etop/2009/etop2009_4.7.35.pdf (Proceedings of the 2009
Conference on Education and Training in Optics and Photonics).
SPIE is the International Society for Optics and Photonics (www.spie.org) and
maintains many excellent resources and tools for teachers and educators.
With regard to the features of an inquiry approach, teachers especially need to gain
pedagogical content knowledge enabling them to “engage students in asking and
answering scientific questions, designing and conducting investigations, collecting
and analysing data, developing explanations based on evidence, and
communicating and justifying findings”. This mainly involves teachers being able to:
Provide questions to frame unit and questions for discussion
Suggest approaches for using technology as laboratory and cognitive tools.
Suggest approaches for collecting and analysing data.
ESTABLISH: IBSE TEACHING & LEARNING UNIT
Page 12 of 165
Support students in designing their own investigations.
Suggest approaches to help students construct explanations based on
Evidence
Provide approaches for communicating science knowledge.
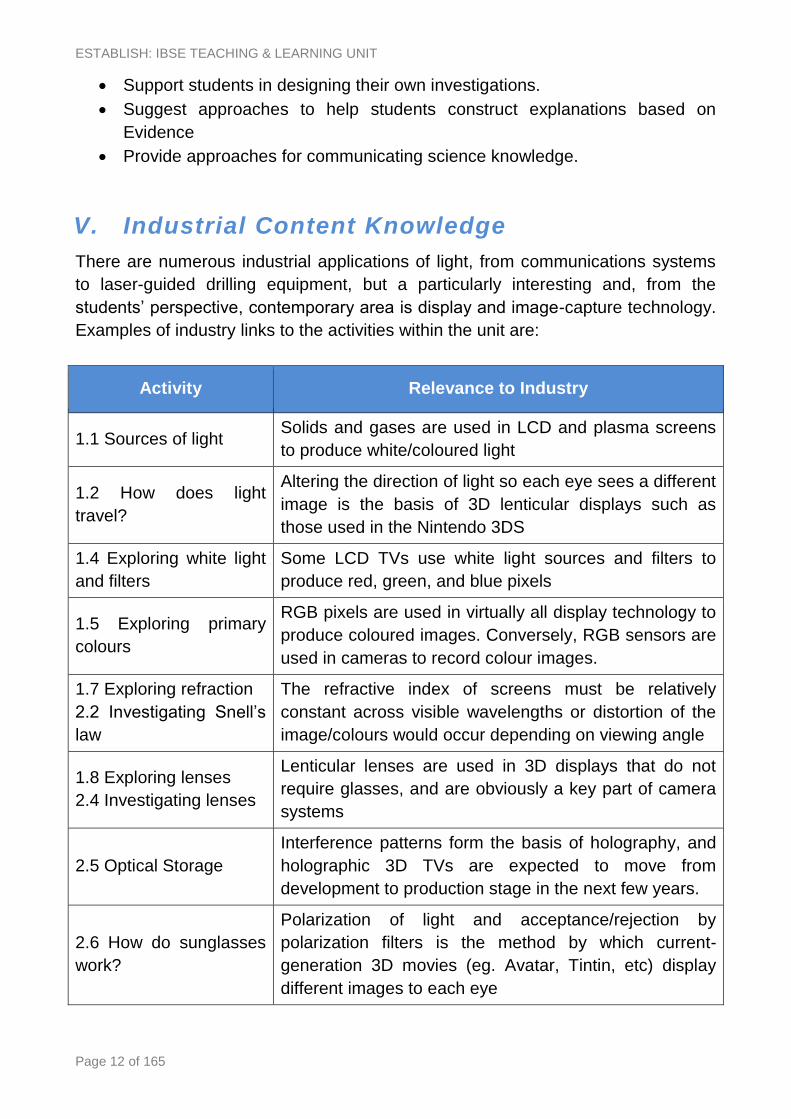
V. Industrial Content Knowledge
There are numerous industrial applications of light, from communications systems
to laser-guided drilling equipment, but a particularly interesting and, from the
students’ perspective, contemporary area is display and image-capture technology.
Examples of industry links to the activities within the unit are:
Activity Relevance to Industry
1.1 Sources of light Solids and gases are used in LCD and plasma screens
to produce white/coloured light
1.2 How does light
travel?
Altering the direction of light so each eye sees a different
image is the basis of 3D lenticular displays such as
those used in the Nintendo 3DS
1.4 Exploring white light
and filters
Some LCD TVs use white light sources and filters to
produce red, green, and blue pixels
1.5 Exploring primary
colours
RGB pixels are used in virtually all display technology to
produce coloured images. Conversely, RGB sensors are
used in cameras to record colour images.
1.7 Exploring refraction
2.2 Investigating Snell’s
law
The refractive index of screens must be relatively
constant across visible wavelengths or distortion of the
image/colours would occur depending on viewing angle
1.8 Exploring lenses
2.4 Investigating lenses
Lenticular lenses are used in 3D displays that do not
require glasses, and are obviously a key part of camera
systems
2.5 Optical Storage
Interference patterns form the basis of holography, and
holographic 3D TVs are expected to move from
development to production stage in the next few years.
2.6 How do sunglasses
work?
Polarization of light and acceptance/rejection by
polarization filters is the method by which current-
generation 3D movies (eg. Avatar, Tintin, etc) display
different images to each eye

LIGHT
Page 13 of 165
The activities within the Light unit can be readily shown to have ‘practical’ and
‘technological’ applications beyond the classroom. Professions requiring an
understanding of the behaviour of light with regard to imaging technology is not
limited to the production of screens and cameras, but includes such areas as
computer animation (where scenes are ‘rendered’ or ‘ray-traced’ to provide realistic
images), photography and cinematography (the use of filters, lenses, and lighting to
achieve a distinctive ‘look’ in films), and in special effects.
ESTABLISH: IBSE TEACHING & LEARNING UNIT
Page 14 of 165
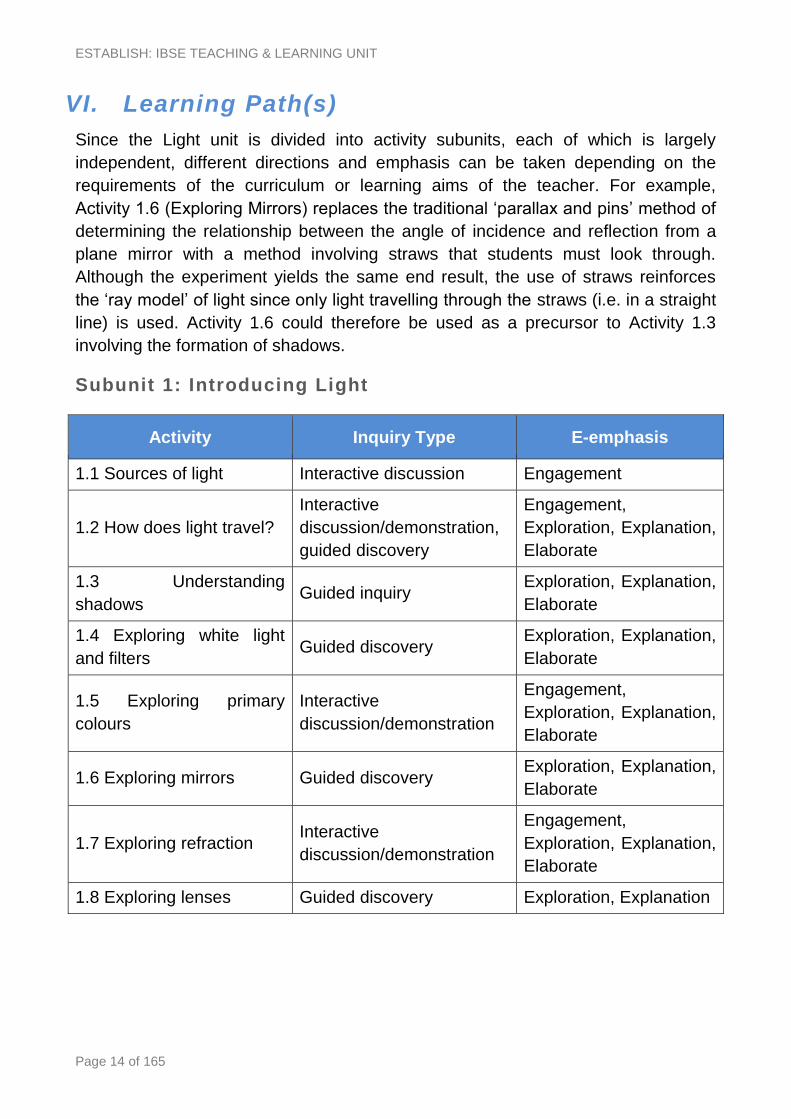
VI. Learning Path(s)
Since the Light unit is divided into activity subunits, each of which is largely
independent, different directions and emphasis can be taken depending on the
requirements of the curriculum or learning aims of the teacher. For example,
Activity 1.6 (Exploring Mirrors) replaces the traditional ‘parallax and pins’ method of
determining the relationship between the angle of incidence and reflection from a
plane mirror with a method involving straws that students must look through.
Although the experiment yields the same end result, the use of straws reinforces
the ‘ray model’ of light since only light travelling through the straws (i.e. in a straight
line) is used. Activity 1.6 could therefore be used as a precursor to Activity 1.3
involving the formation of shadows.
Subunit 1: Introducing Light
Activity Inquiry Type E-emphasis
1.1 Sources of light Interactive discussion Engagement
1.2 How does light travel?
Interactive
discussion/demonstration,
guided discovery
Engagement,
Exploration, Explanation,
Elaborate
1.3 Understanding
shadows Guided inquiry
Exploration, Explanation,
Elaborate
1.4 Exploring white light
and filters Guided discovery
Exploration, Explanation,
Elaborate
1.5 Exploring primary
colours
Interactive
discussion/demonstration
Engagement,
Exploration, Explanation,
Elaborate
1.6 Exploring mirrors Guided discovery Exploration, Explanation,
Elaborate
1.7 Exploring refraction Interactive
discussion/demonstration
Engagement,
Exploration, Explanation,
Elaborate
1.8 Exploring lenses Guided discovery Exploration, Explanation

LIGHT
Page 15 of 165
Subunit 2: Exploring Light
Activity Inquiry Type E-emphasis
2.1 Investigating mirror
images Guided discovery
Exploration, Explanation,
Elaborate
2.2 Investigating Snell’s
law Guided inquiry
Exploration, Explanation,
Elaborate
2.3 Studying real and
apparent depths
Interactive
discussion/demonstration,
guided discovery
Engagement,
Exploration, Explanation
2.4 Investigating lenses Guided inquiry
Engagement,
Exploration, Explanation,
Elaborate
2.5 Optical Storage Guided discovery Exploration, Explanation,
Elaborate
2.6 How do sunglasses
work? Guided inquiry
Engagement,
Exploration, Explanation,
Elaborate
2.7 Why are sunsets red? Interactive
discussion/demonstration
Engagement,
Exploration, Explanation

ESTABLISH: IBSE TEACHING & LEARNING UNIT
Page 16 of 165
VII. Assessment
Although the assessment strategy will ultimately depend on the nature of the
curriculum, it is preferable that such strategies would employ both a theoretical test
and a practical assignment. Some form of research project might also be
considered.
For younger students (Subunit 1) a research project might involve examining a
particular piece of technology, such as a Plasma/LCD TV screen or digital camera.
The assessment in this case might be based on how well students are able to link
aspects of their physics course to its construction and operation. For older students
(Subunit 2) a research project might involve a comparison of different technologies,
for example CRT and LCD displays, digital and film cameras, different strategies of
producing a 3D image (lenticular displays versus polarized glasses), or the
differences between CD and Blu-ray read heads.
A practical assignment could be based on any of the activities in the subunits, or
experiments on the curriculum that are not specifically covered but related to these
activities.
An example of a theoretical test is given at the end of this document. It can be
modified for either the younger or older student groupings, and could involve either
qualitatively or quantitatively determining the behaviour of light after interaction with
a number of optical components. In the case of the older groups, values could be
added, for example the wavelength of light or refractive index of the materials.
LIGHT
Page 17 of 165
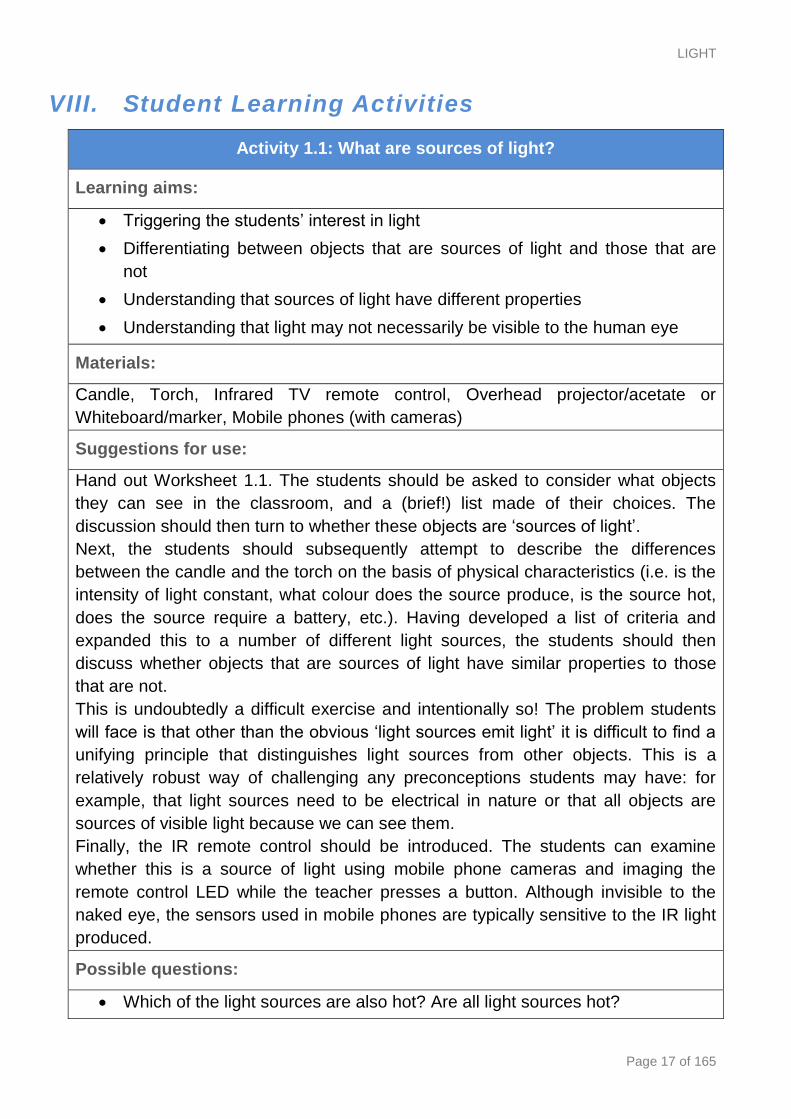
VIII. Student Learning Activities
Activity 1.1: What are sources of light?
Learning aims:
Triggering the students’ interest in light
Differentiating between objects that are sources of light and those that are
not
Understanding that sources of light have different properties
Understanding that light may not necessarily be visible to the human eye
Materials:
Candle, Torch, Infrared TV remote control, Overhead projector/acetate or
Whiteboard/marker, Mobile phones (with cameras)
Suggestions for use:
Hand out Worksheet 1.1. The students should be asked to consider what objects
they can see in the classroom, and a (brief!) list made of their choices. The
discussion should then turn to whether these objects are ‘sources of light’.
Next, the students should subsequently attempt to describe the differences
between the candle and the torch on the basis of physical characteristics (i.e. is the
intensity of light constant, what colour does the source produce, is the source hot,
does the source require a battery, etc.). Having developed a list of criteria and
expanded this to a number of different light sources, the students should then
discuss whether objects that are sources of light have similar properties to those
that are not.
This is undoubtedly a difficult exercise and intentionally so! The problem students
will face is that other than the obvious ‘light sources emit light’ it is difficult to find a
unifying principle that distinguishes light sources from other objects. This is a
relatively robust way of challenging any preconceptions students may have: for
example, that light sources need to be electrical in nature or that all objects are
sources of visible light because we can see them.
Finally, the IR remote control should be introduced. The students can examine
whether this is a source of light using mobile phone cameras and imaging the
remote control LED while the teacher presses a button. Although invisible to the
naked eye, the sensors used in mobile phones are typically sensitive to the IR light
produced.
Possible questions:
Which of the light sources are also hot? Are all light sources hot?
ESTABLISH: IBSE TEACHING & LEARNING UNIT
Page 18 of 165
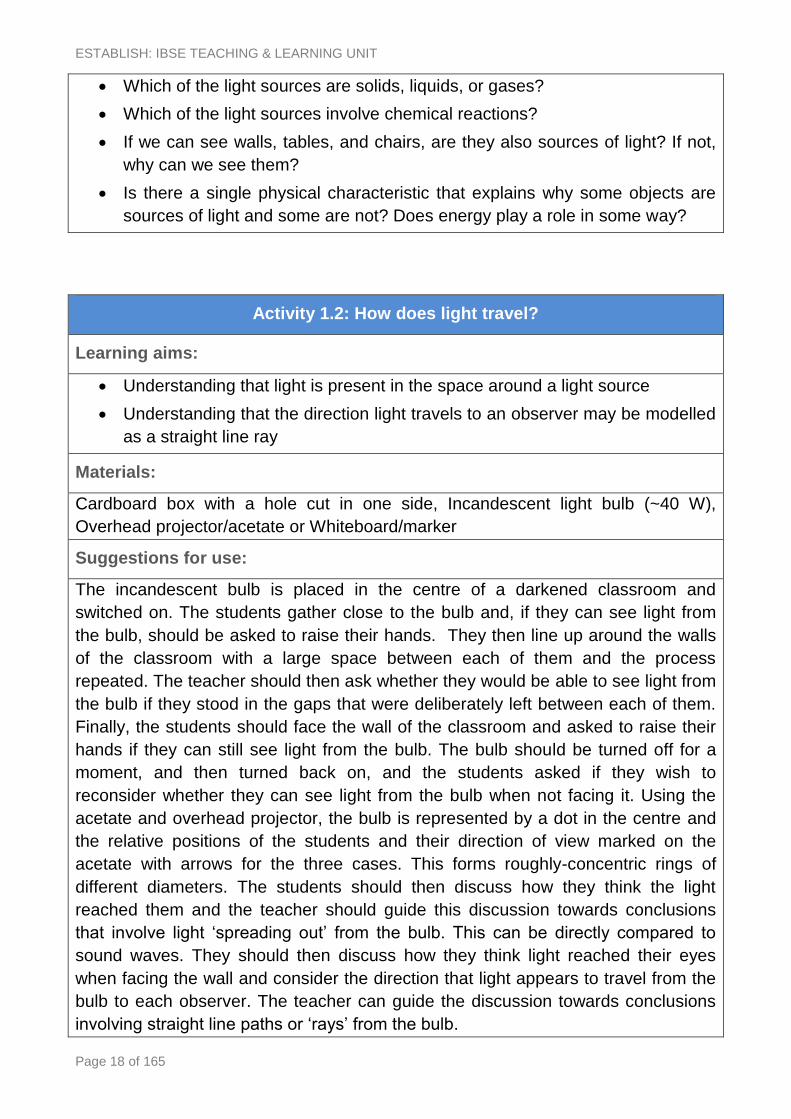
Which of the light sources are solids, liquids, or gases?
Which of the light sources involve chemical reactions?
If we can see walls, tables, and chairs, are they also sources of light? If not,
why can we see them?
Is there a single physical characteristic that explains why some objects are
sources of light and some are not? Does energy play a role in some way?
Activity 1.2: How does light travel?
Learning aims:
Understanding that light is present in the space around a light source
Understanding that the direction light travels to an observer may be modelled
as a straight line ray
Materials:
Cardboard box with a hole cut in one side, Incandescent light bulb (~40 W),
Overhead projector/acetate or Whiteboard/marker
Suggestions for use:
The incandescent bulb is placed in the centre of a darkened classroom and
switched on. The students gather close to the bulb and, if they can see light from
the bulb, should be asked to raise their hands. They then line up around the walls
of the classroom with a large space between each of them and the process
repeated. The teacher should then ask whether they would be able to see light from
the bulb if they stood in the gaps that were deliberately left between each of them.
Finally, the students should face the wall of the classroom and asked to raise their
hands if they can still see light from the bulb. The bulb should be turned off for a
moment, and then turned back on, and the students asked if they wish to
reconsider whether they can see light from the bulb when not facing it. Using the
acetate and overhead projector, the bulb is represented by a dot in the centre and
the relative positions of the students and their direction of view marked on the
acetate with arrows for the three cases. This forms roughly-concentric rings of
different diameters. The students should then discuss how they think the light
reached them and the teacher should guide this discussion towards conclusions
that involve light ‘spreading out’ from the bulb. This can be directly compared to
sound waves. They should then discuss how they think light reached their eyes
when facing the wall and consider the direction that light appears to travel from the
bulb to each observer. The teacher can guide the discussion towards conclusions
involving straight line paths or ‘rays’ from the bulb.
LIGHT
Page 19 of 165
The aim of this exercise is to establish in the students’ minds that light is a wave,
that light exists in the space around them, that light reflects from the wall, and that
light can be modelled using rays. These concepts are reinforced in Worksheet 1.2.
As an additional component, the students could be asked to consider where they
would need to stand to see the light from the bulb after a box (with a small hole in
the side) is placed over it. They can then test their ideas by performing a similar
‘hands-up’ experiment to that at the beginning of the activity, and can map the
positions from which they can see the light from the bulb. This can be used to show
the validity of the ‘ray’ model in predicting where the students need to stand to see
the light exiting the box.
Possible questions:
If you changed the size of the hole in the box, would this change where in the
room you could see the bulb?
What happens to the light that doesn’t come out of the hole in the box?
Activity 1.3: Understanding shadows
Learning aims:
Understanding that a shadow is the absence of light
Understanding what determines the size of the shadow on a screen
Materials:
Small torches or small incandescent bulbs, Small cardboard squares that are a few
cm on each side (to cast the shadow), Retort stands to hold the torch, White sheet
to use as a screen
Suggestions for use:
The students begin by drawing the arrangement of apparatus they would require to
observe a shadow on a screen. They, then, qualitatively investigate the formation of
shadows in an attempt to deduce what parameters affect its size, with the teacher
guiding them towards providing answers to the following questions:
1. If the projection screen and torch are fixed in place, how does the size of the
shadow change as the cardboard square is moved towards or away from the
torch?
2. If the torch and cardboard square are fixed in place, how does the size of the
shadow change as the projection screen is moved towards or away from the
cardboard square?
3. If the screen and cardboard square are fixed in place, how would the size of
the shadow change as the torch is moved towards or away from the
ESTABLISH: IBSE TEACHING & LEARNING UNIT
Page 20 of 165
cardboard square?
The challenge for the students is then to try and explain their observations based
on what they know about the propagation properties of light.
Possible questions:
If I place a green bottle in front of the bulb, I see a green ‘silhouette’ cast on
the wall. This grows in size and decreases in size depending on the bottle’s
distance from the screen and torch. Is this also a shadow?
Activity 1.4: Exploring white light and filters
Learning aims:
Understanding that white light is composed of many different colours
Understanding that filters only allow some colours through
Materials:
Torches with a narrow cardboard slit attached, glass prisms, good quality (i.e.
theatre quality) red, green, or blue transmission filters, coloured cardboard ‘screens’
Suggestions for use:
Hand out Worksheet 1.4.
Each student will project light from the narrow cardboard slit on their torch through
a prism and onto a white sheet of paper. They will see the familiar red, orange,
yellow, green, blue, indigo and violet rainbow colours. The students are then
presented with two alternative explanations for this phenomena: either the prism
‘converts’ white light into coloured light or white light is a mixture of colours that are
subsequently ‘separated’ by the prism through different angles.
Although students may already know the correct interpretation, they cannot
distinguish between these alternatives on the basis of their observations. They
should then be asked to suggest an experiment that could resolve this problem.
One experiment often suggested is the use of two prisms to show that the spectrum
of colours can be recombined to give back white light. This should be done as a
demonstration although it does not resolve the problem as presented – even with
two prisms it is still not clear whether the spectrum of colours is present in the white
light before the interaction with the prisms.
The students should then investigate the use of coloured filters. By placing a red,
green, or blue transmission filter between the prism and screen they will observe
that only the corresponding colour is transmitted. If they now place this filter
between the torch and prism, they will observe that red light is transmitted through
the filter, passes through the prism, and arrives at the screen. The students can
LIGHT
Page 21 of 165
repeat this process with different filters, hence proving that white light is a mixture
of different colours and these are spatially dispersed by the prism.
The key to this experiment is the quality of the filters. If this poses a problem in
terms of quantity, then the activity could be run as an interactive demonstration with
students invited to place filters in the appropriate positions and record the results.
A suitable resource for this activity is freezeray.com/physics.htm which gives an
interactive applet to investigate the effect of different coloured filters.
Possible questions:
If the sun produces white light, then what must happen to the light to make
leaves appear green in summer?
In autumn, why do leaves then appear red and orange?
How are rainbows formed?
Activity 1.5: Exploring primary colours
Learning aims:
Understanding that white light can be produced by mixing red, green and
blue light
Materials:
Overhead projector, sheet of card ~300 x 300 mm with three identical holes
approximately 15 x 30 mm in dimension, red, green and blue filters, 3 small plane
mirrors, Neutral Density filters with low optical density, magnifying glass
Suggestions for use:
Tape the red, green and blue filters over each of the holes in the sheet of card and
position this on the overhead projector to produce three distinct beams of coloured
light. Invite students to intercept each primary colour with a mirror, deflect it onto
the ceiling or whiteboard and hence observe and note the colour that results when
any two beams are mixed and when all three are mixed.
Next, the students should be asked to consider what would happen if the red,
green, or blue beam was not as intense as the others – for example, if red was
weaker than green, what colour would be produced by mixing them? The students
can then test their ideas by placing the neutral density filters on top of each of the
coloured filters and mixing the light.
Finally, the students should discuss whether any devices they know of produce
different colours by mixing just red, green, and blue light of different intensities.
They can verify that a TV, laptop or mobile phone screen does exactly this by
examining the pixels with a magnifying glass.
ESTABLISH: IBSE TEACHING & LEARNING UNIT
Page 22 of 165
Additional experiment: Using a single red, green, or blue filter and an OHP, project
a small coloured spot onto a screen and have the students stare at it for at least 1
minute. Once the filter is removed (and the OHP left on), the students will see a
small spot that persists for a moment in their vision that is a different colour to the
spot that was projected – most people see red where it was green and vice versa.
The human retina contains cone cells that are sensitive to red, green and blue
primary colours. Staring at a red spot breaks down the pigment in the red-sensitive
cone cells and when the filter is removed these ‘bleached’ cells will be less
sensitive than the green- and blue-sensitive cones, subsequently leading to the
persistence of a spot of different colour. This can be used as a demonstration that
the eye is sensitive to primary colours and that our perception of colour is due to
red, green, and blue mixing.
Possible questions:
Is it possible to create white light without using the seven colours of the
rainbow?
If you can create all visible colours by mixing red, green, and blue, then can
you detect all colours by just measuring how much red, green, and blue
arrives at a sensor?
Is this how the eye sees colour?
LIGHT
Page 23 of 165
Activity 1.6: Exploring plane mirrors
Learning aims:
Understanding that light rays travel in straight lines
Understanding that plane mirrors reflect light
Understanding that the angle of incidence equals the angle of reflection
Materials:
White sheets of paper, plane mirrors, retort stands, straight drinking straws, pencils,
protractors, rulers
Suggestions for use:
The activity begins with students being posed a question of the form: ‘If you look
through a straw at an object, what direction must the light travel from the object to
your eye in order for you to see it?’
The students are then asked to consider the same question but for two straws
forming a V-shape. What might one use to get light to alter its direction so that light
passing into the first straw could be seen through the second straw? The teacher
should guide the discussion towards the notion of ‘reflection’ from a mirror.
The students can then use Worksheet 1.6 and clamp a mirror at one edge so it is
held vertically by a retort stand. The bottom edge of the mirror should be in contact
with the mark on the paper. They can then position a drinking straw at some
random angle in front of the mirror and attempt to position a second straw so that
when they look through it, they will see the reflected light that passed through the
first straw.
The students should then be asked how they would need to alter the setup if they
changed the angle of one of the straws, or the angle of the mirror.
Possible questions:
Do you notice anything about the angles the straws have to be in order for
light to pass from one to the other?
Does this relationship hold when the mirror is angled?
What would happen to light at different points on the mirror if the surface of
the mirror was curved inwards or outwards?
ESTABLISH: IBSE TEACHING & LEARNING UNIT
Page 24 of 165
Activity 1.7: Exploring refraction
Learning aims:
Understanding that light is refracted when it travels from one medium to
another
Understanding that light can be reflected from and transmitted through an
interface
Materials:
Laser pointers (red, low wattage), large plastic lunch boxes with transparent/semi-
transparent walls, salt or milk, water, plastic sheets (e.g. bin bags), plastic spoons,
green or blue laser pointer
Suggestions for use:
The plastic sheets are placed on the desks in case of spillage. Students fill a plastic
lunch box with water and add salt or milk until the water appears cloudy. Plastic
spoons can be used in the case of salt to agitate the water during the
investigations. The lunch box should be positioned close to the edge of the desk to
allow for a wide range of possible angles.
The students begin by shining the laser pointers from air into the water and
investigating how the path of light alters as they change the angle. They should
draw a diagram to illustrate what they observe.
Next they investigate how the path of light changes if they shine the laser pointer
through the side of the lunch box, through the water, and into the air. Again, they
should draw a diagram to illustrate what they observe.
The teacher should then use the green or blue pointer side-by-side with a red
pointer to illustrate that light of different colours will refract by different amounts.
Possible questions:
How does the direction of light change when it travels from air into water?
How does the direction of light change when it travels from water into air?
Is it possible to pick an angle so that light travelling from water into air is
reflected from the interface between the media?
Why is not possible to see the beam of laser light passing through the air
when it can be seen passing through the water?
Why does a prism disperse white light into its constituent colours?
LIGHT
Page 25 of 165
Activity 1.8: Exploring lenses
Learning aims:
Understanding that lenses produce images
Understanding that lenses do not necessarily ‘magnify’ objects
Materials:
Incandescent bulbs, short focal-length bi-convex lenses, paper ‘screens’
Suggestions for use:
The students should take a bi-convex lens and attempt to form an image of their
bulb on their paper ‘screens’. This should take the form of a challenge to see how
small they can make their image by changing the relative positions of the bulb and
screen.
The students should then be asked to describe what they needed to do to minimise
the size of their images and whether the lens ‘magnifies’ the object. Next the
students should consider what must happen to the direction of light when it passes
through the lens if the image is smaller than the object.
Next the students remove the screen and look through the lens in an attempt to
‘magnify’ the bulb (i.e. in a magnifying glass configuration when the object is inside
the focal length). They should then be asked to describe where their eye and the bi-
convex lens need to be positioned to produce this ‘magnified’ image. If they now
place a screen where their eye was, is an image formed?
The students should consider what must happen to the direction of the light through
the lens in order to produce this ‘magnified’ image.
A suitable resource for this activity is freezeray.com/physics.htm which gives an
interactive applet to investigate the effect of different types of lenses.
This activity can lead on to discussing how the human eye works and how we can
correct for long- and short-sightedness. Again freezeray.com/physics.htm gives an
interactive applet to investigate the effect of different types of lenses on the human
eye.
Possible questions:
Why is the image upside-down when it is small? Does this fact change the
conclusion as to what happens to the direction of light when it passes through
the lens?
Why is no image formed on the sheet of paper when your eyes can see a
magnified image?
What is the purpose of wearing glasses?

ESTABLISH: IBSE TEACHING & LEARNING UNIT
Page 26 of 165
Activity 2.1: Investigating mirror images
Learning aims:
Understanding that the image in a plane mirror is not located at the mirror
surface
Materials:
Three thick whiteboard markers, Plane mirror, Retort stand, Paper, Pencil, Cocktail
sticks, Shiny metal tin
Suggestions for use:
The students should initially investigate the phenomenon of parallax by placing one
of the markers vertically on their desk and lining up the other two behind it. They
should describe what they observe when they look along this line of markers, with
one eye closed, and move their head sideways:
Does the nearest marker appear to move a greater or lesser distance than
the farthest marker?
Where would the markers need to be placed so they appear to move
together?
The students should then be asked to determine how they might use this method of
parallax to determine where the image in a plane mirror is formed. They can hold
the mirror vertically and use the paper to mark the locations of the object pen, the
mirror plane, and the image itself. The students should plot the path the light takes
to the eye, and the path to the image.
Finally, the students should set their tin on the sheet of paper and attempt to angle
a number of cocktail sticks on the paper so that they appear to lie parallel in the tin.
They should then attempt to explain how the image is formed in this convex mirror
based on their understanding of ray optics.
Possible questions:
Does the angle of incidence equal the angle of reflection for a curved mirror?
How does the curve affect the direction of light reflected from different points?
Where is the image formed in the convex mirror? What if it was concave?

LIGHT
Page 27 of 165
Activity 2.2: Investigating Snell’s Law
Learning aims:
Understanding that Snell’s Law describes the change in direction of light
moving from one medium to another
Understanding that at some angle, light will totally reflect from the interface
when travelling from high to low refractive index
Materials:
Red laser pointer, Block of glass, White paper, Pencil, Protractor
Suggestions for use:
The students should be given the materials and asked to discuss how they might
go about studying what happens to the direction of light when a laser passes from
air into glass and back into air. The students should examine questions such as:
How will I determine the direction that light takes through the glass?
How will I measure and quantify the direction into and through the glass?
How will the measurement be standardised so that the results from different
people can be compared and combined?
Which parameters of the experiment should I keep constant and which
should I alter?
Once I take my data, how will I tabulate and graph it to investigate the
relationship between the direction of light into and through the glass?
Next, the students perform the experiment they have devised and report their
results in Worksheet 2.2. If they have standardised their measurements, the data
can be entered into a software package such as Excel and projected on a screen
for the students to see. A plot of ‘angle of incidence’ versus ‘angle of refraction’ will
not yield a straight-line graph and the teacher should then show the students how
this changes if the Sine (or Cosine, depending on whether the students have
measured the angle from the normal or surface of the glass) of the angles are
plotted. The students can then use the slope of this line to extract the ‘refractive
index of glass’ (assuming the refractive index of air is 1) and hence extract Snell’s
Law. Finally the teacher should check if the data contains evidence that at some
angle the light did not escape from the block of glass, and whether any student
reports this observation. If not then the students should be instructed to check this,
and discuss why they failed to discover this phenomenon.
Possible questions:
ESTABLISH: IBSE TEACHING & LEARNING UNIT
Page 28 of 165
What property of the light changes to cause the change in angle as it passes
from one medium to another?
Is light reflected from the surface of the glass when the beam travels from air
to glass? Does this reflected beam change in intensity as the angle of light
onto the surface changes?
How might we use the total internal reflection of light to transmit a laser
beam?
Activity 2.3: Studying real and apparent depths
Learning aims:
Understanding that the refraction of light alters its direction
Understanding that refraction can affect the appearance and apparent depth
of objects
Understanding that comparing the real and apparent depths gives a measure
of refractive index
Materials:
Graduated cylinders of different volumes, Coin, thin circle of Cork with a diameter
equal to that of the coin, Mobile phones (with cameras)
Suggestions for use:
The students should drop the thin slice of cork into the graduated cylinder. Placing
their mobile phone on the top of the cylinder, they take a photograph of the cork. It
is important that the same optical/digital zoom settings are used throughout the
experiment. They then add some water and measure its height inside the cylinder
before photographing the now-floating piece of cork. The students should repeat
the process at least six times for different water levels and finally should measure
the height of the cylinder itself.
The purpose of this exercise is to allow the creation of a ‘calibration graph’ that
relates the diameter of the cork circle in image pixels to its distance from the
camera (obtained by subtracting the height of the water in the cylinder from the
height of the cylinder).
The students then empty the cylinder and drop a coin to its base. They photograph
the coin in the absence of water, then completely fill the cylinder and photograph
the coin through the water. By comparing the diameter of the coin (in pixels) when
imaged through the water to their calibration graph, they can determine the
apparent depth of the coin. This analysis can be performed by the students at
home. Since each student will have used different levels of water, a graph of real
depth versus apparent depth can be created in Excel that includes data from each

LIGHT
Page 29 of 165
of the students. The slope of this graph then gives the refractive index of water.
One simple method of analysing the images is to load them into software such as
Microsoft Picture Manager (found in Office tools) and crop the
photo so that only the coin remains. Since the coin is circular,
the image dimensions then give the diameter in pixels. The
experiment provides a good introduction to a number of topics.
Firstly, the calibration graph will not be linear and so students
must draw ‘best fit curves’. Secondly, it provides a good
example of experimental errors – cameras with a higher megapixel count will be
more accurate than those with lower counts, and the apparent diameter of the coin
is related to both the height of the cylinder (i.e. the distance of the camera from the
base of the cylinder) and the height of water added.
Possible questions:
Why does a swimming pool look shallower than it actually is?
Activity 2.4: Investigating lenses
Learning aims:
Understanding that the lens equation describes the position of the image,
given the object position and focal length
Understanding that the magnification of a lens is given by the ratio of image
to object distance
Materials:
Stands to hold (1) Bulb, (2) Short focal-length convex lens, (3) Paper screen, Metre
rule, Pencil
Suggestions for use:
The activity can progress in one of two directions: either the students have
previously studied the lens equation and the experiment will subsequently test the
law, or the students have not studied the equation and will derive it on the basis of
their results.
Firstly, the students should determine the focal length of their lens or verify the
value given. This can be achieved by focusing light from a distant object (the ceiling
lights are a good source) onto the desk and measuring the height of the lens from
the table. The students should then discuss the method by which they will
investigate the relationship between object and image distance using the
equipment supplied, and how they will graphically show the relationship. The
teacher should guide this discussion so that students will standardise all
ESTABLISH: IBSE TEACHING & LEARNING UNIT
Page 30 of 165
measurements of distance to be relative to the lens.
The students can then conduct an experiment by which they fix the screen in place,
adjust the position of the bulb relative to the screen, and subsequently move the
lens to produce an image. They should record and tabulate their data into columns
corresponding to object distance, image distance, and focal lengths. To investigate
the magnification, students should also measure the width of the bulb filament they
observe on the screen for each combination of image/object distance and compare
this to the actual width.
The students should then plot a graph of the relationship between image and object
distance. For students who have not covered the lens equation, the natural
tendency will be to plot object distance versus image distance (or vice versa) which
will generate a curved graph. The teacher should discuss with the students what
this shape might indicate in terms of the relationship, and the students can
subsequently plot the reciprocal of object distance versus the reciprocal of image
distance to yield a straight line.
Possible questions:
If you examine the x and y intercepts of the graph, what does this relate to?
(1/f)
What is the equation of the line if M is the slope? (M=v/u)
How does this slope relate to the width of the filament at each object/image
combination?
Activity 2.5: Optical Storage
Learning aims:
Understanding that light can be diffracted by small objects
Understanding that examining the diffraction pattern can tell us the dimension
of those objects
Understanding that the diffraction pattern depends on wavelength
Materials:
CD, DVD and/or Blu-ray discs, Red laser pointer, Retort stand, Graph paper
‘screen’, adjustable slits
Suggestions for use:
The students should be asked to consider the differences between a CD and
DVD/Blu-ray disc with the discussion being guided towards the amount of
information each disc can store (CD: 740 MB, DVD: 4.7 GB, Blu-ray: 25 GB for
LIGHT
Page 31 of 165
single sided discs). They should then be asked to compare the physical size of
each disc (120 mm diameter x 1.2 mm thick) and discuss why, if the discs are the
same physical dimensions, the information content is different.
Hand out Worksheet 2.5.
The students then set up their laser so it is incident at some angle on the CD
surface and should observe and sketch the diffraction pattern observed on the
screen. If the students have not previously covered the topic of diffraction, they are
likely to explain this pattern in terms of reflections from multiple objects. This
observation will conform to their knowledge of CDs having ‘pits’ on the surface.
They then replace the CD with a DVD and should note that the pattern is now
broader.
These observations should now be related to the amount of information stored on
each disc. The conceptual difficulty students may encounter is that the pattern
obtained from a DVD seems broader, which they may attribute to larger features on
the DVD. However, the storage capacity of the DVD is larger than a CD, which
suggests the features should be smaller!
The students should then investigate how the diffraction pattern changes as laser
light is passed through a slit that is made progressively narrower. This serves to
reconcile the broad pattern obtained from the DVD and the smaller features on that
disc.
The exercise can be used as an introduction to diffraction, with the teacher
providing the subsequent theory.
Possible questions:
What does the size of the pits mean in relation to the amount of information
that can be stored on the discs?
Why are red lasers used to read CDs but blue lasers are needed for Blu-ray
discs?
Why do optical microscopes have a limit on their magnification?

ESTABLISH: IBSE TEACHING & LEARNING UNIT
Page 32 of 165
Activity 2.6: How do sunglasses work?
Learning aims:
Understanding that light can be polarized
Understanding that the intensity through two polarizers may be described by
Malus’s Law
Materials:
Two polarizers, two neutral density filters
Suggestions for use:
The students should be asked to discuss how sunglasses work. Typical responses
will involve ‘coloured glass/plastic’ that ‘only allows some of the light through’ which
could be used as a starting point for a discussion on absorption, filters, and energy.
Next, the students are invited to examine the properties of ‘neutral density’ filters of
the kind found on most sunglasses and asked to consider the following questions:
If each filter only allows 50% of the light through it, what percentage is transmitted
through both filters when placed on top of one another?
This question establishes that the total transmission is found by multiplying (50% of
50% is 25% or 0.50 x 0.50 = 0.25). The students are then posed the question as to
whether the order or orientation of the filters makes a difference.
The students are then given Polaroid filters and asked to examine their properties:
Does the relative orientation of the filters change the light intensity transmitted? If
zero degrees is defined as the relative orientation providing maximum throughput,
what relationship in terms of angle gives minimum throughput?
Does the order of the filters make a difference?
The Worksheet includes an optional experiment utilising a data logger to examine
Malus’s Law.
Possible questions:
How can you use a polarizer to remove reflections from a surface?
How do 3D movies work and why do you have to wear glasses?
LIGHT
Page 33 of 165
Activity 2.7: Why are sunsets red?
Learning aims:
Understanding that light can be scattered by small particles
Understanding that scattering is wavelength dependent
Materials:
Large transparent plastic or glass container of water, Projector or Overhead
projector, White screen, Dropper containing Dettol
Suggestions for use:
The container of water should be placed in front of the projector and a beam of
white light passed through it. Alternatively, a circular hole can be cut in a sheet of
card and placed on an overhead projector. The container should then be placed
over the card to allow the circular beam to pass through the water.
The students should be asked to consider how the on-screen spot of light will
change as Dettol is added to the water. The teacher then gradually adds a few
drops of Dettol, causing the transmitted light to change colour from yellow, through
orange, to red.
The students should be asked to explain what they think is happening and should
be invited to examine the colour of light escaping from the sides of the water
container (blue light).
Possible questions:
What is the difference, in terms of the wave model, between blue and red
light?
What property of the Dettol determines which wavelength is scattered?
Why is the sky blue during the day and red at sunrise and sunset?
Why are clouds white?

ESTABLISH: IBSE TEACHING & LEARNING UNIT
Page 34 of 165

SOUND
Page 35 of 165
SOUND
The development of this unit has been led by the ESTABLISH partners:
Ewa Kedzierska, Ron Vonk, and Ton Ellermeijer,
Stichting Centrum voor Micro-Computer Applicaties (CMA), Netherlands.
ESTABLISH: IBSE TEACHING & LEARNING UNIT
Page 36 of 165
UNITS CONTENTS
I. Unit Description ............................................................................. 37
II. IBSE character .............................................................................. 38
III. Science Content Knowledge ......................................................... 40
IV. Pedagogical Content Knowledge ................................................... 42
V. Industrial Content Knowledge ........................................................ 43
VI. Learning paths ............................................................................... 46
VII. Assessment ................................................................................... 49
VIII. Student learning activities .............................................................. 50
Activity 1.1. Introduction to sound ............................................................ 50
Activity 1.2. How sounds are made? ........................................................ 51
Activity 1.3. Make sound visible ............................................................... 52
Activity 1.4. Analysis of voice sounds ...................................................... 53
Activity 1.5. How sound travels? .............................................................. 54
Activity 1.6. How fast sound travels? ....................................................... 56
Activity 1.7. Hearing sound ...................................................................... 57
Activity 1.8. How loud is too loud? ........................................................... 58
Activity 1.9. What have you learned about sound? .................................. 59
Activity 2.1. Resonance ........................................................................... 60
Activity 2.2. Fundamental frequency, double bass ................................... 62
Activity 2.3. Fundamental frequency, guitar ............................................. 64
Activity 2.4. Melde’s experiment .............................................................. 66
Activity 2.5. Harmonics of a guitar string .................................................. 68
Activity 2.6. Standing waves in air, closed-end air column ....................... 70
Activity 2.7. Standing waves in air: soprano saxophone .......................... 71
Activity 2.8. Timbre .................................................................................. 73
Activity 2.9. Beats .................................................................................... 74
Activity 2.10. Tuning the guitar ................................................................. 75
Activity 3.1. Sound graphs ....................................................................... 76
Activity 3.2. Model of human speech production ...................................... 77
Activity 3.3. Sound signal analysis ........................................................... 78
Activity 3.4. Human speech analysis ....................................................... 80
Activity 3.5. Human speech synthesis ..................................................... 81

SOUND
Page 37 of 165
I. Unit Description
The unit Sound is divided into 3 subunits, which can be used independently or
sequentially. Each subunit can take different directions and emphasis depending on
the curriculum and particular learning aims of the teacher.
The subunits 1 and 2 can also be used in a spiral type curriculum with subunit 1
focussed at an introductory level and subunit 2 at the higher stages of secondary
school level.
The subunit 3 offers an extension for higher secondary school level and introduces
students to the fascinating area of human speech.
The Sound unit is enriched with many ICT activities in which a sound sensor, an
interface and software are used to record sound and to analyse the resulting sound
waveforms.
Subunit 1: Exploring sound
In this subunit students study the basics of physics of sound. They learn that sound
is caused by vibrations, and they explore how sound travels. They learn about the
relationship of loudness and pitch to the amplitude and frequency of vibrations.
They investigate the sounds of the human vocal cords. They also learn about the
anatomy and functioning of the human ear and sound protection.
Student level: Lower secondary school level, students of age 11-15
Discipline involved: Physics
Estimated duration: 5-6 class periods
Subunit 2: String instruments and wind instruments
This subunit starts with an experiment of resonance in a model of a swing. Students
can feel that a minor influence can give a great effect. Further on, students perform
experiments with strings, including double bass, guitar and the Melde’s experiment
on standing waves. After experiments involving sound in air columns follow. At the
end of this subunit, some open inquiries are described that students can choose
from. The knowledge build in activities 1 to 7 is a good basis to start to work on
each of the activities 9 – 11.
Student level: Higher secondary school level, students of age 15-17
Discipline involved: Physics
Estimated duration: 5-7 class periods and 2 class periods of
independent working time
ESTABLISH: IBSE TEACHING & LEARNING UNIT
Page 38 of 165
Subunit 3: Human speech
In this subunit students study the principles of human speech, speech analysis and
synthesis. They learn fundamentals of human speech production, they record
different sound signals and learn how to read and interpret a time signal and a
spectrogram. They study how the human speech can be artificially produced.
Student level: Higher secondary school level, students of age 16-19
Discipline involved: Biophysics (Physics, Biology)
Estimated duration: 3 class periods
II. IBSE character
Subunit 1: Exploring sound
To introduce a new subject like sound, the teacher should address the student’s
curiosity with questions involving both known, or seemingly known, concepts and
unexpected holes in their understanding. This approach is therefore a form of the
inquiry-based method of ‘teaching by questioning’. The main problem here for most
teachers is the delicate balance between not saying too much and not answering
too soon while at the same time keeping track of time and not letting the students
go astray into unrealistic and unprofitable directions. Having said that, it should be
emphasized that not every scientifically unacceptable scenario or solution is
necessarily unprofitable. A proposed explanation may at the one hand be incorrect
but may at the other hand contain nice elements of scientific thinking and
motivation to solve the problem.
Being introductory at an elementary level, the main IBSE approaches employed
here are reflective discourse, interactive demonstration, guided discovery and
guided inquiry. Through the activities in this subunit students develop basic abilities
to do and understand scientific inquiry.
Asking and answering questions.
Planning and conducting simple investigations.
Employing tools to gather data.
Using data to construct reasonable explanations.
Communicating investigations and explanations.
Understanding that scientists use different kinds of investigations and tools to
develop explanations using evidence and knowledge.
Some activities are ICT activities in which a computer with sound sensor is used to
record sound waveforms.

SOUND
Page 39 of 165
Subunit 2: String instruments and wind instruments
The context of a guitar or other string instrument will trigger the student to do their
own investigations. What knowledge is required to build a guitar? Which physical
laws are there to keep in mind when building a guitar? To get to know this, students
analyse the playing of a double bass and the frets on a guitar. The knowledge
gathered in these activities is applied to the new context of air columns in wind
instruments.
The main IBSE approach in this subunit are guided discovery and open inquiry.
Inquiry based skills developed in this unit are amongst others:
Performing experiments.
Analyzing results obtained with experiments (or presented by the teacher).
Communicating results with the use of graphs.
Using results from one experiment (double bass) to analyze the results of
another experiment (frets of a guitar).
Using knowledge from one field of acoustics (strings) in another field of
acoustics (air columns).
In some activities the computer is used to record sound and to analyse the data.
Subunit 3: Human speech
The speech analysis and speech synthesis activities in this subunit are open inquiry
assignments. In these activities students have to formulate their own research
questions. This type of assignment is generally considered to be the highest level
of inquiry-based learning. In these activities student develop many fundamental
skills of inquiry-based science education like diagnosing problems, critiquing
experiments, planning investigations, searching for information, constructing
models, debating with peers, forming coherent arguments.
Afterwards, students should express their understanding in a discussion with their
peer students and the teacher, and or share their reports with another group for
peer reviewing. In this way, they confront and share their preliminary (group)
conclusions with others and come to final conclusions and explanations they
construed themselves.
It is expected that students gain a deeper understanding of the phenomena in this
approach and will probably remember the “new” knowledge longer through the
process of internalization.
ESTABLISH: IBSE TEACHING & LEARNING UNIT
Page 40 of 165
III. Science Content Knowledge
Subunit 1: Exploring sound
In this subunit, students are not supposed to have any (formal) prior knowledge of
the subject but some understanding of the concepts from their everyday life.
The activities in this subunit introduce students to the following concepts and ideas:
Sounds are produced by vibrating objects and vibrating columns of air.
Pitch and loudness are two characteristics of sound.
Changing the way an object vibrates can change the pitch or volume of the
sound produced
Pitch is determined by the frequency and loudness by the amplitude of
vibrations.
Sound is produced by human vocal folds as air moves through the tightened
folds.
Sound requires a medium (for example, air, glass, metal, wood) to travel
through.
Speed of sound is less than the speed of light.
The human ear has a membrane that vibrates when sound reaches it; the ear
and the brain translate these vibrations into sensation of sound. Exposure to
very loud sounds can cause damage to hearing.
Subunit 2: String instruments and wind instruments
As pre-requisite knowledge, students are supposed to be familiar with the concepts:
wavelength, amplitude, frequency, period, sine function. Of course these concepts
should be repeated in this subunit but a basic understanding is required to build
new knowledge.
The activities in this subunit introduce the students to the following concepts and
ideas:
Resonance
Fundamental frequency
Harmonics
Standing waves
Relation between the frequency and length of string/air column
Timbre.
As a source for the teacher, the available physics courses should be appropriate.
There are also numerous books that describe the relation between physics and
music.

SOUND
Page 41 of 165
A recommended source, focusing on the physics of musical instruments is the book
“Measured tones, the interplay of physics and music” by Ian Johnston (ISBN-10:
0750307625 ISBN-13: 978-0750307628).
Subunit 3: Human speech
The activities in this subunit introduce students to the human speech production
mechanism, human speech analysis and synthesis. The content is both about
biology and physics. For biology students learn about the human vocal system and
how the human speech is produced. In physics they create a model to describe
how the human speech is produced, they analyse the human sounds and learn how
human sounds can be created artificially.
As pre-requisite knowledge, students are supposed to know the concepts
frequency, amplitude, standing waves, resonance, fundamental frequency and
harmonics, and should be able to handle those both qualitatively and quantitatively.
Since this unit goes beyond a traditional school curriculum a model of human
speech production is given as reading text for students in the Worksheet: Model of
human speech production. The text is based on an article of Johan Sundberg “The
acoustics of the singing voice”, Sci. Am. 236, 82 (March 1977).
Some useful resources:
Johan Sundberg “The acoustics of the singing voice”, Sci. Am. 236, 82 (March
1977) (see http://www.zainea.com/voices.htm)
Timothy Moran, “Application of sound spectrum analysis”, Phys. Teach. 45, 94
(2007)
Klaus Fellbaum, Jorg Richer, ‘Human speech production based on a linear
predictive vocoder”, ESCA/Socrate workshop on Method and Tool Innovations
for Speech Science Education (1999), see
http://www2.spsc.tugraz.at/add_material/courses/scl/vocoder/.
The Java simulation ‘Model of the Human Speech Production’ allowing sound
analysis and synthesis is available at:
http://www2.spsc.tugraz.at/add_material/courses/scl/vocoder/simulation.html

ESTABLISH: IBSE TEACHING & LEARNING UNIT
Page 42 of 165
IV. Pedagogical Content Knowledge
General common students’ difficulties identified by Science Education Research
around “Sound” are:
Sounds can be produced without using any material objects.
Hitting an object harder changes the pitch of the sound produced.
Loudness and pitch of sounds are the same things.
The pitch of a tuning fork will change as it "slows down", (i.e. "runs" out of
energy)
Frequency is connected to loudness for all amplitudes.
Human voice sounds are produced by a large number of vocal cords that all
produce different sounds.
Sounds can travel through empty space (a vacuum).
Sounds cannot travel through liquids and solids.
Sound moves faster in air than in solids (air is "thinner" and forms less of a
barrier).
Sound moves between particles of matter (in empty space) rather than matter.
You can see and hear a distinct event at the same moment.
Music is strictly an art form; it has nothing to do with science.
In wind instruments, the instrument itself vibrates (not the internal air column).
Sound waves are transverse waves (like water and light waves).
Waves transport matter.
Waves do not have energy.
All waves travel the same way.
Big waves travel faster than small waves in the same medium.
When waves interact with a solid surface, the waves are destroyed.
Ultrasounds are extremely loud sounds.
Noise pollution is annoying, but it is essentially harmless.
Sounds made by vehicles (like the whistle of a train) change as the vehicles
move past the listener because something (like the train engineer) purposely
changes the pitch of the sound.
In actual telephones, sounds (rather than electrical impulses) are carried
through the wires.
Students have to apply their knowledge in new situations and this might reveal
misconceptions. The teacher should be aware of this, with asking questions to the
student the teacher can make the student reflect on their pre-knowledge.
SOUND
Page 43 of 165
By giving answers or presenting data the students can work with, the character of
the activity can become more closed. For example, without the graph or the demo
on YouTube, the activity about harmonics in the subunit 2 is bounded inquiry. The
question asked is ‘in what ways might a string vibrate?’ and the students have to
find their own way to answer this question. If students have enough prior
knowledge and endurance, they are able to come up with the preferred answers. If
not, the teacher has to decide how much he wants to help them (by doing a demo,
presenting the graph or showing the YouTube movie).
An unpredictable variety of alternative or even misconceptions in the understanding
of the content of the Human speech subunit is to be anticipated, as speech is such
an everyday phenomenon that probably everyone has created his own model or
mental picture of it. Special attention has to be devoted to common frequently felt
obscurities like:
How can it be that the same vowel pronounced by different persons may sound
completely different, yet one is able to recognise the vowel as such
immediately?
What are formants and in what way do they differ by age and gender?
Is the recorded spectral sound-pattern reproducible and recognizable?
It is here that the IBSE approach comes into play to provide a more tangible picture
of the phenomenon of speech to the students. One may expect that the
understanding achieved by own discoveries is less superficial and more concrete,
as it is more linked to reality.
V. Industrial Content Knowledge
Subunit 1: Exploring sound
To start illustrating the relevance of sound to industry at this introductory stage,
finding and mentioning professions (rather than the industries themselves) may be
more effective. With sound the industrial applications are clear almost immediately
e.g. through professions like musician, sound technician (TV broadcast), sound
mixer (concert), audiometrist (selling hearing aids), audiologist (making
audiograms), acoustic engineer, speech-trainer.
For example an audiologist can be invited to visit the class during activities about
sound hearing and sound protection to answer questions prepared by students.
To engage students in technological design they could design and build their own
simple models of the human eardrum or vocal cords.
ESTABLISH: IBSE TEACHING & LEARNING UNIT
Page 44 of 165
Subunit 2: String instruments and wind instruments
There is a lot of physics involved in designing and producing musical instruments.
For an existing instrument, one can make adjustments to change the sound of it.
There are differences between guitars and students can do research on which
instrument sounds better. How is better defined, can you do scientific
measurements to find out which instrument is better? How well tuned is a guitar,
what are the right positions for the frets on the fret board? What is meant with the
timbre of an instrument? The basic knowledge to start answering these questions is
implemented in the activities. In an open inquiry students will be able to answer
(some of) the above questions.
Examples of industry links for activities in this subunit are:
2.1. Resonance – constructions of buildings or bridges;
2.2. Fundamental frequency; double bass – designing musical instruments;
2.3. Fundamental frequency; guitar – designing musical instruments;
2.4. Melde’s experiment – constructions of buildings or bridges;.
2.7. Standing waves in air, soprano saxophone – differences and similarities of
wind instruments: clarinet, saxophone and oboe.
Subunit 3: Human speech
The first speech recognizer appeared in 1952 and consisted of a device for the
recognition of single spoken digits. There are many domains for the commercial
application of speech recognition for example:
Health care – for converting voice-recorded reports as dictated by physicians
and/or other healthcare professionals, into text format; medical analysis of voice
problems.
Military - speech recognizers have been operated successfully in fighter aircraft,
with applications including: setting radio frequencies, commanding an autopilot
system, setting steer-point coordinates and weapons release parameters, and
controlling flight displays.
Telephony - speech recognition is used mostly as a part of the user interface, for
creating pre-defined or custom speech commands.
Scientists have attempted to simulate human speech since the late 1700s, when
Wolfgang von Kempelen built a “speaking machine”. By the 1970s digital computing
enabled the first generation of modern teach-to-speech systems with fairly wide
use. Speech synthesis is now an assistive technology tool which use is significant
and widespread. The use of it includes delivery of up-to-the-minute news, reading
machines for handicapped, automotive voice controls and retrieving email over the
phone – or any systems where the vocabulary is large, the content changes

SOUND
Page 45 of 165
frequently or unpredictable, and a visual display isn’t practical. Speech synthesis
techniques are also used in entertainment productions such as games and
animations.

ESTABLISH: IBSE TEACHING & LEARNING UNIT
Page 46 of 165
VI. Learning paths
The topic of sound as outlined in this unit is made up of a series of subunits with a
series of activities. Each subunit can take different directions and emphasis
depending on the curriculum and particular learning aims of the teacher. The
activities could be formulated in various different combinations to achieve the
overall learning outcomes envisioned for the subunit. However in this section we
outline one possibility of the order and flow of the activities.
Subunit 1: Exploring sound
This subunit consists of 9 activities. The exemplary sequence of activities, in which
all activities are used, is given in the table below sequence.
Activity Inquiry Type E-emphasis
1.1 Introduction to sound Interactive discussion Engagement
1.2 How sounds are made? Guided inquiry Engagement,
Exploration,
Explanation,
Elaborate
1.3 Make sound visible Guided inquiry Exploration,
Explanation,
Elaborate
1.4 Analysis of voice sounds Guided discovery Engagement,
Exploration,
Explanation
1.5 How sound travels? Interactive
demonstration/
Bounded inquiry
Engagement,
Exploration,
Explanation,
Elaborate
1.6 How fast sound travel? Guided discovery Engagement,
Exploration,
Explanation,
Elaborate
1.7 Hearing sound Guided inquiry Explanation,
Evaluate
1.8 How loud is too loud? Guided inquiry Explanation,
Evaluate
1.9 What have you learned about
sound?
Interactive discussion Elaborate,
Evaluate
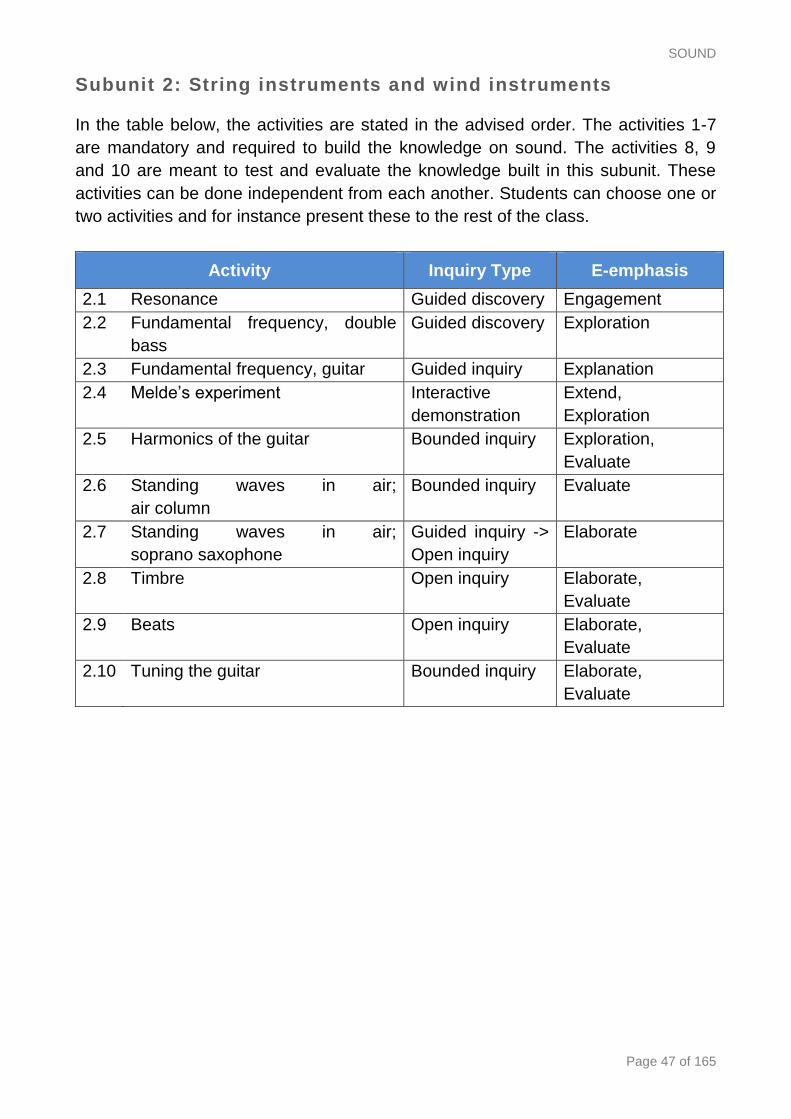
SOUND
Page 47 of 165
Subunit 2: String instruments and wind instruments
In the table below, the activities are stated in the advised order. The activities 1-7
are mandatory and required to build the knowledge on sound. The activities 8, 9
and 10 are meant to test and evaluate the knowledge built in this subunit. These
activities can be done independent from each another. Students can choose one or
two activities and for instance present these to the rest of the class.
Activity Inquiry Type E-emphasis
2.1 Resonance Guided discovery Engagement
2.2 Fundamental frequency, double
bass
Guided discovery Exploration
2.3 Fundamental frequency, guitar Guided inquiry Explanation
2.4 Melde’s experiment Interactive
demonstration
Extend,
Exploration
2.5 Harmonics of the guitar Bounded inquiry Exploration,
Evaluate
2.6 Standing waves in air;
air column
Bounded inquiry Evaluate
2.7 Standing waves in air;
soprano saxophone
Guided inquiry ->
Open inquiry
Elaborate
2.8 Timbre Open inquiry Elaborate,
Evaluate
2.9 Beats Open inquiry Elaborate,
Evaluate
2.10 Tuning the guitar Bounded inquiry Elaborate,
Evaluate
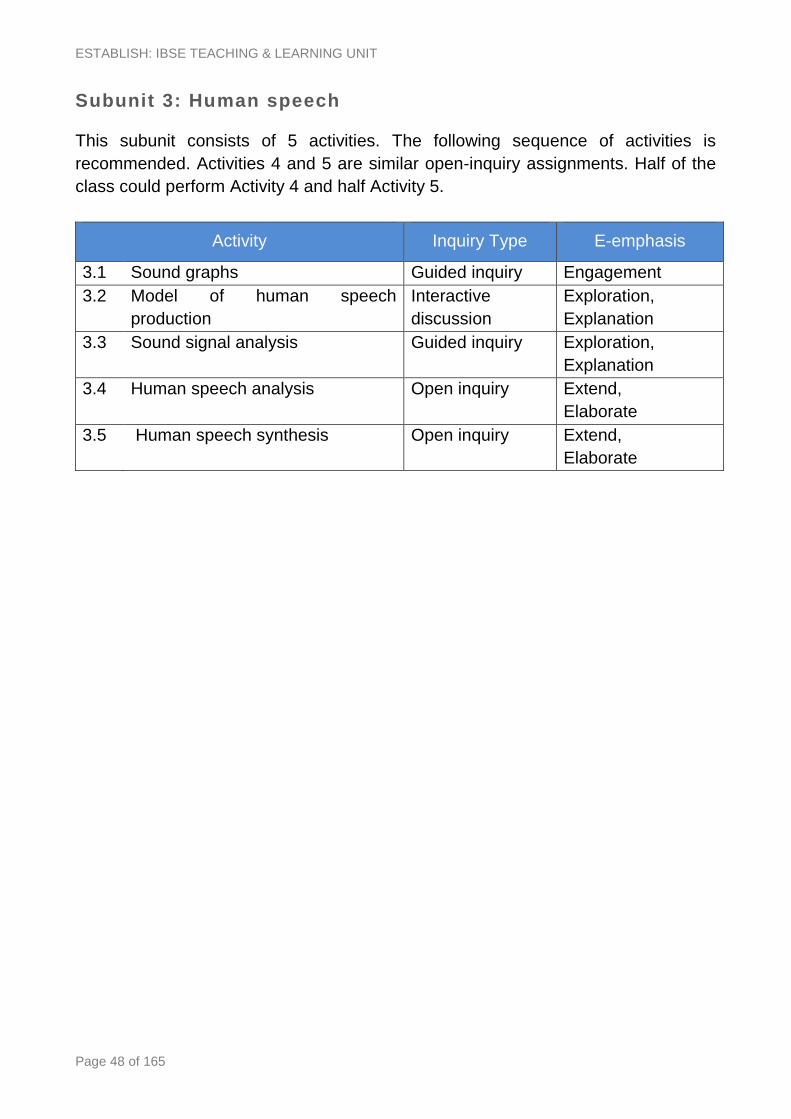
ESTABLISH: IBSE TEACHING & LEARNING UNIT
Page 48 of 165
Subunit 3: Human speech
This subunit consists of 5 activities. The following sequence of activities is
recommended. Activities 4 and 5 are similar open-inquiry assignments. Half of the
class could perform Activity 4 and half Activity 5.
Activity Inquiry Type E-emphasis
3.1 Sound graphs Guided inquiry Engagement
3.2 Model of human speech
production
Interactive
discussion
Exploration,
Explanation
3.3 Sound signal analysis Guided inquiry Exploration,
Explanation
3.4 Human speech analysis Open inquiry Extend,
Elaborate
3.5 Human speech synthesis Open inquiry Extend,
Elaborate
SOUND
Page 49 of 165
VII. Assessment
Subunit 1: Exploring sound
Preferably, the students’ assessment includes both a theoretical test
(understanding basic concepts, understanding of sound waveforms) as well as a
practical assignment.
Subunit 2: String instruments and wind instruments
The assessment might include both a theoretical test and a presentation about an
experiment or literature research. These presentations can differ for the (groups of)
students.
Subunit 3: Human speech
Preferably, the student’s assessment includes both a theoretical test and a practical
assignment. The theory of speech analysis may be tested as part of a school exam
on waves and oscillations.
Students can write a report on the findings of their practical assignment (open
inquiry activity) and present their results to the rest of the class. In addition, they
share the data acquisition/analysis part in digital form.

ESTABLISH: IBSE TEACHING & LEARNING UNIT
Page 50 of 165
VIII. Student learning activities
Activity 1.1. Introduction to sound
Learning aims:
Developing a concept map to realize the richness of sound as well in terms of
physics as well in terms of everyday life
Triggering student’s’ interest and curiosity about sound
Materials:
Laptop/data projector, or Overhead projector/acetate, or Whiteboard/marker
Suggestions for use:
Let students shut their eyes and be still and silent for 3 minutes. Tell them to
concentrate on what they hear. Have students open their eyes and list the sounds
they heard.
Then, together with the students, develop a
concept map to ascertain student’s prior
knowledge and to gain information regarding
preconceptions students may have in relation to
the topic of sound.
While doing this allow students to collectively give
their opinions on what they know about sound,
each time writing up the ideas onto the concept
map. Try to group similar terms or ideas together
so that by the end of the class discussion you
have a concept map with a structure, which will
relate to the series of lessons that you will teach
on this topic. Allow students, as a group, to tell
you all they know about sound. There may be
some idea’s missing from your concept map that you intend to cover in the lessons,
or ideas that you feel students may have just forgotten about. Ask probing and
guiding questions to get students to think about and come up with the ideas that
relate to content but are missing in the concept map.
Possible questions:
What do you know about sound?
What makes a sound loud/soft?
What was the loudest sound ever heard?
What makes a sound pleasant/unpleasant?
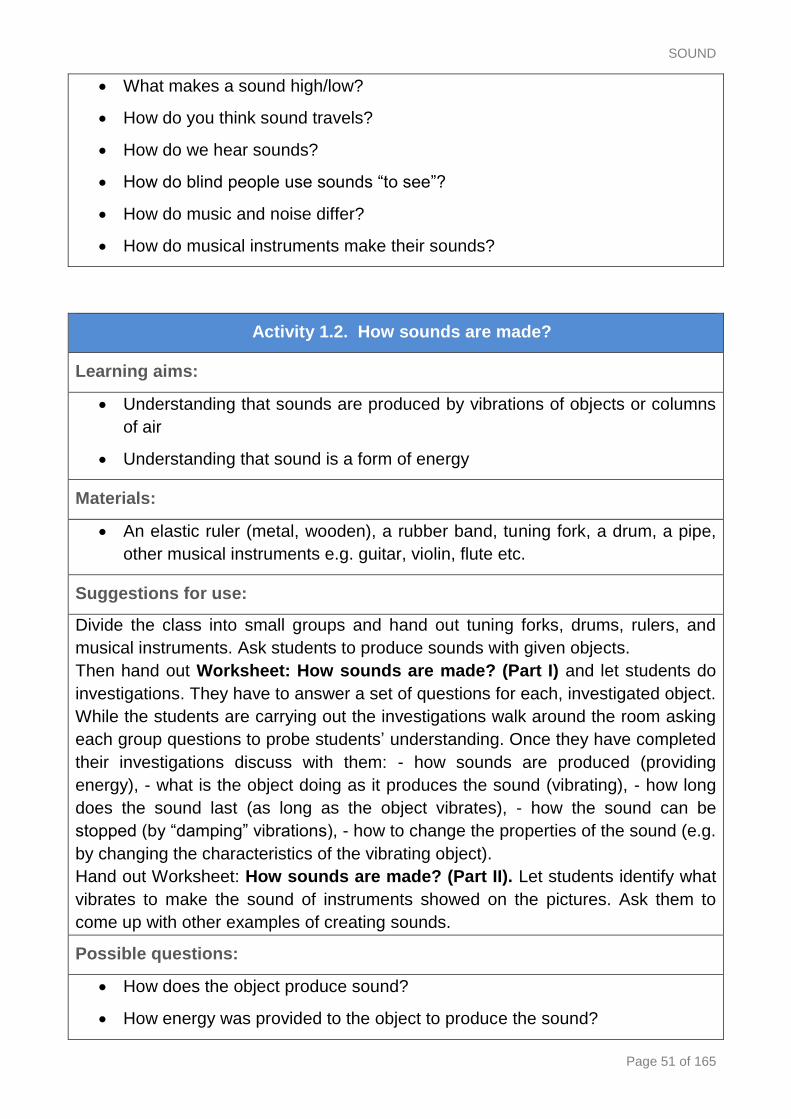
SOUND
Page 51 of 165
What makes a sound high/low?
How do you think sound travels?
How do we hear sounds?
How do blind people use sounds “to see”?
How do music and noise differ?
How do musical instruments make their sounds?
Activity 1.2. How sounds are made?
Learning aims:
Understanding that sounds are produced by vibrations of objects or columns
of air
Understanding that sound is a form of energy
Materials:
An elastic ruler (metal, wooden), a rubber band, tuning fork, a drum, a pipe,
other musical instruments e.g. guitar, violin, flute etc.
Suggestions for use:
Divide the class into small groups and hand out tuning forks, drums, rulers, and
musical instruments. Ask students to produce sounds with given objects.
Then hand out Worksheet: How sounds are made? (Part I) and let students do
investigations. They have to answer a set of questions for each, investigated object.
While the students are carrying out the investigations walk around the room asking
each group questions to probe students’ understanding. Once they have completed
their investigations discuss with them: - how sounds are produced (providing
energy), - what is the object doing as it produces the sound (vibrating), - how long
does the sound last (as long as the object vibrates), - how the sound can be
stopped (by “damping” vibrations), - how to change the properties of the sound (e.g.
by changing the characteristics of the vibrating object).
Hand out Worksheet: How sounds are made? (Part II). Let students identify what
vibrates to make the sound of instruments showed on the pictures. Ask them to
come up with other examples of creating sounds.
Possible questions:
How does the object produce sound?
How energy was provided to the object to produce the sound?

ESTABLISH: IBSE TEACHING & LEARNING UNIT
Page 52 of 165
What is the object doing as it produces the sound?
How long does the sound last?
How can you stop the sound?
How can you make the sound higher or lower and softer or louder?
Do you see the ends of the tuning fork vibrating? Why or why not?
How sound is produced by an organ pipe or flute? What vibrates there?
How sound is produced by a guitar or violin? What vibrates there?
Activity 1.3. Make sound visible
Learning aims:
Learning how to record sound with a sound sensor
Interpreting the recorded sound waveform graphs
Understanding that the sound signal is changing periodically
Introducing concepts of frequency, pitch and loudness
Exploring how the sound waveform is changing by changing loudness and
pitch
Materials:
A sound sensor, interface and software that displays sound waveforms (e.g.
CMA Coach 6)
Suggestions for use:
Start the activity by asking students: ‘What do you think a sound would look like if
we could see it?’ Have student volunteers come up to the board to illustrate.
Divide the class into groups, hand out Worksheet: Make sound visible (Part I)
and let students do their own investigations with a sound sensor and tuning forks. If
needed, help students to set up the experiment and perform measurements with
the computer.
Hand out Worksheet: Make sound visible (Part II), discuss the recorded sound
waveform and let students calculate the frequency of the recorded sound signal.
Then let them perform Investigation 1 and 2 and summarize their findings by
defining the properties of sound: loudness (defined by sound amplitude), pitch
(defined by sound frequency).
SOUND
Page 53 of 165
Possible questions:
How sounds can be made visible?
What is the frequency of vibrations?
Determine the frequencies of the tuning forks used in your experiments? How
did you figure this out?
Can you notice any relationship between the tuning forks appearance and
the sound they produce?
What determines pitch?
What determines loudness?
Activity 1.4. Analysis of voice sounds
Learning aims:
Understanding that the vibration of vocal cords creates our voice
Interpreting sound waveforms of a variety of voice sounds
Understanding differences between sound waveforms of different voice
sounds
Materials:
A sound sensor, interface and software that displays sound waveforms (e.g.
CMA Coach 6)
Suggestions for use:
Divide the class into small groups, hand out Worksheet: Analysis of voice sounds
(Part 1) and let students do activities described under Observation and
Investigation. Then discuss with them how voice sounds are made.
Then divide students to work with computers, hand out Worksheet: Analysis of
voice sounds (Part II). Let them do their own investigations with a sound sensor. If
needed help students to set up the experiment and perform measurements with the
computer.
Once students have completed their investigations summarize the results of their
investigation by discussing the results of their experiments.
Possible questions:
How voice sounds are made?
How the vocal cords work?

ESTABLISH: IBSE TEACHING & LEARNING UNIT
Page 54 of 165
What is the difference in waveforms of tuning fork and voice sounds?
What is the difference in waveforms of different vowels?
Activity 1.5. How sound travels?
Learning aims:
Recognising that the sound needs a medium to travel
Understanding that sound travels through different mediums, including solids,
liquids, and gases
Materials:
Sound source, bell jar, vacuum, a string telephone, balloon with water, water,
different medium for example wood, metal, glass, plastic, ceramic etc.
Suggestions for use:
Hand out Worksheet: How sounds travel (Part I), let students read and answer
questions.
Then show them the following demonstrations:
Place five coins, in a line next to each other, flat on the table. Flick a sixth coin so
that it hits the first coin in the line. Last coin in the line will move.
Place an alarm clock or an electric bell in a large bottle. Let the bell
ring in air. Then pomp the air out of the bottle and let the bell ring in
a vacuum.
Place a candle in front of a speaker. Turn on the speaker (frequency
5 – 10 Hz). The flame flickers indicating air movement.
(Instead of the demonstration the included video can be displayed).
1. Use a coiled spring (slinky); send pushes and pulls along the
spring.
Discuss with students their observations and help them to construct the following
ideas:
1. Energy can be transmitted through the particle of a substance.
2. Sound needs a medium to travel through; it cannot be transmitted in the
absence of particles.
3. Sounds waves are alternate compressions and expansions caused by the back-
forth motion of the particles of a medium.
Divide the class into groups and hand out Worksheet: How sounds travel (Part
II). Give each group a sound source and materials to investigate. These can be two
cans (or paper cups) connected with a string, a balloon with water, book, and
different medium like wood, metal, glass, plastic, ceramic, etc. In this activity
SOUND
Page 55 of 165
students are asked to design their own investigation to find out if sound can travel
through different materials and through which material(s) sound travels the best.
Walk around and give students some tips if necessary. Ask them about the designs
of their (fair) investigations.
Finally let each group present their conclusions, allow students to debate their
reasoning.
Possible questions:
How sound energy is transmitted?
Why can you not hear the bell ringing in the jar?
Can you hear the sound from a sound source when it is held in the air?
What medium was the sound travelling through in this case?
Does sound travel through string?
Can you hear your partner better when the string is wet or dry?
Does sound travel through glass? Wood? Etc?
Do sounds get weaker with distance?
ESTABLISH: IBSE TEACHING & LEARNING UNIT
Page 56 of 165
Activity 1.6. How fast sound travels?
Learning aims:
Understanding the speed of sound is lower then the speed of light
Determining the speed of sound in air by using the echo method
Understanding that the speed of sound depends on the medium
Materials:
A sound sensor, interface and software that displays sound waveforms (e.g.
CMA Coach 6), 1-m long cardboard or plastic tube
Suggestions for use:
Hand out Worksheet: How sounds travel (Part I), let students read and answer
Show a video clip of lightening in the sky. Hand out Worksheet: How fast sound
travels? (Part I) and ask students to answer question 1. Discuss with students why
we see the light before we hear the sound.
Then divide students into groups to work with computers. Hand out Worksheet:
How fast sound travels? (Part II) and let students perform computer measurements
to determine the speed of sound in air. If needed help students to set up the
experiment and perform measurements with the computer.
Once students have completed their investigations compare the sound speed
values determined by students with the theoretical value. Here you can also
discuss more examples of the use of echoes (ships navigation, animals using
“echolocation” etc.)
Let students find out the speed of sound in other materials. Discuss whether sound
travels better in liquids, gases, or solids?
Possible questions:
Why do you see lightning before you hear thunder?
What is the measurement method used to calculate the speed of sound in
air?
How do you calculate the speed?
What do you think can influence the speed of sound?
In which materials the speed of sound is the highest?
In which materials the speed of sound is the lowest?

SOUND
Page 57 of 165
Activity 1.7. Hearing sound
Learning aims:
Understanding that the ear detects sound vibrations
Understanding how the human ear works
Understanding that human hearing range lays between 20 and 20000
vibrations per second
Materials:
A sound sensor, interface and software that displays sound waveforms (e.g.
CMA Coach 6), a model of the human ear
Suggestions for use:
Hand out Worksheet: Hearing sound and let students read and answer questions
1 to 3. Then discuss how the human ear works. To visualize it you can use an
animation, for example: http://www.sciencekids.co.nz/videos/humanbody/ear.html.
There is a possibility for cross-curricular links here. It would be a good opportunity
to link to the biology topic of the ear.
Here students also could be engaged in technological design as they could design
and build their own simple models of the human eardrum.
As the last activity let students read question 4. Start a discussion about what they
can hear and what they cannot hear – and lead onto hearing ranges of humans and
animals
Possible questions:
When a compression in a sound wave in the air hits the eardrum, in which direction
does the eardrum move?
In which direction does the eardrum moves when an expansion of a sound wave
arises?
If you hear a bird sing with a frequency of 2000 vibrations per second, how many
times per second does the eardrum vibrates?
How does the ear response to a loud sound differ from its response to a soft
sound?
How does the ear response to a high sound differ from its response to a low
sound?
Why sounds aren't as loud when you cover your ear?
How does the ear strengthen the sound waves so that they will be strong enough to
affect the liquid of the inner ear?
Why you do not hear a dog whistle while your dog does?
ESTABLISH: IBSE TEACHING & LEARNING UNIT
Page 58 of 165
Activity 1.8. How loud is too loud?
Learning aims:
Understanding that sound intensity (loudness) is measured in decibels
Understanding that exposure to very loud sounds can cause damage to
hearing
Materials:
A sound sensor, interface and software that displays sound waveforms (e.g.
CMA Coach 6), a sound source, a shoe box, different isolation materials like
cotton wool, fabrics, egg boxes, foam, newspaper, etc.
Suggestions for use:
Divide the class into small groups to work with computers, hand out Worksheet:
Sound protection (Part I). Let students perform computer investigations to
determine the sound intensity of different sound sources and to determine the best
sound insulator. Once students completed their investigations discuss their results.
Then hand out Worksheet: Sound protection (Part II). Have students research
the effects of sound on their health (Research assignment: How loud is too loud?).
In their investigation they can use a nice interactive animation – ‘Interactive sound
ruler’ available via http://www.nidcd.nih.gov/health/education/decibel/decibel.asp.
Then use protective earmuffs to show students and have a class discussion on why
different professions might need to use these, and what would be the effects for
these people if the ear protection is not worn. Discuss the possible damages loud
sounds can have on human hearing.
This lesson would be an excellent time to invite an audiologist to visit the class.
Have students write questions for the speaker on slips beforehand. In this students
should be encouraged to relate their question with the research assignment.
Possible questions:
Why do you think construction workers wear earmuffs?
Can you think of any other profession who need to wear ear protection?
What might happen if these people don’t wear ear protection?
Which material is the best at stopping sound?
Which material is useless at stopping sound?
Does the twice the thickness of the material stop the sounds any better?
enough to affect the liquid of the inner ear?
SOUND
Page 59 of 165
Why you do not hear a dog whistle while your dog does?
Activity 1.9. What have you learned about sound?
Learning aims:
Elaborating concepts learned throughout the subunit
Materials:
Whiteboard/marker, or Laptop/data projector, or Overhead projector/acetate
Suggestions for use:
Use the concept map generated in the first activity to have an interactive group
discussion on what students have learned about sound. Students need to revisit
their original ideas. The final concept map should show a schematic summary what
was learned.
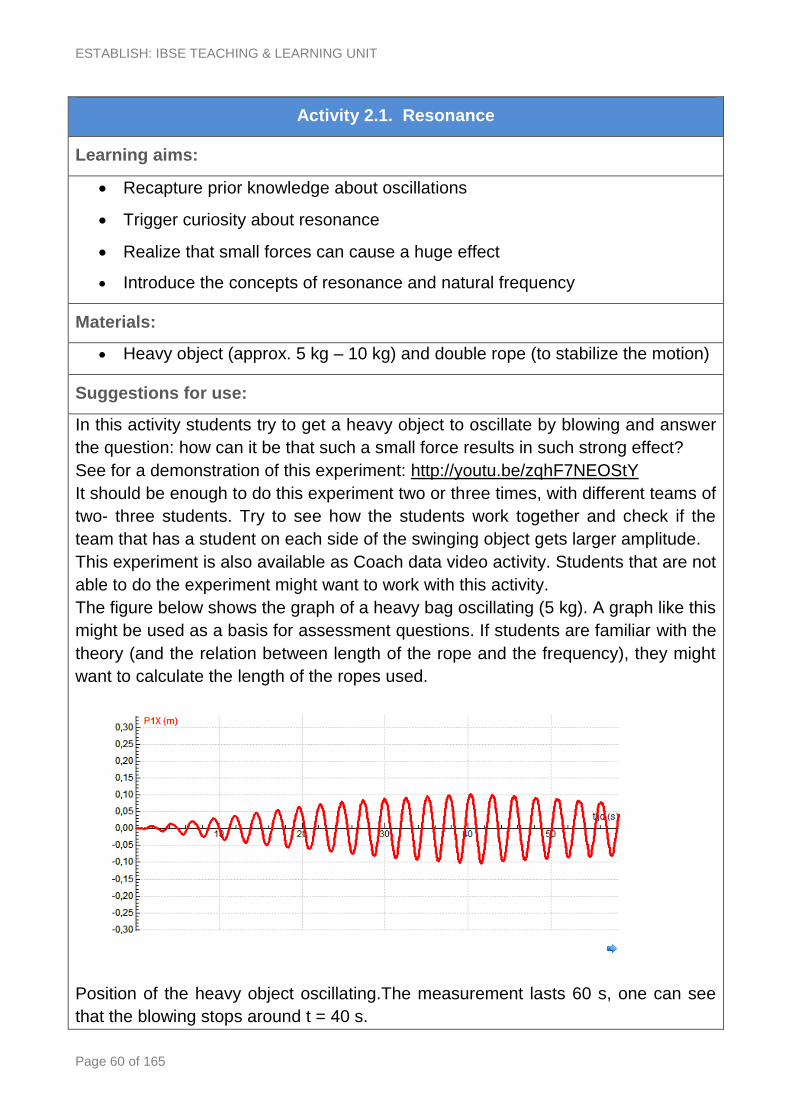
ESTABLISH: IBSE TEACHING & LEARNING UNIT
Page 60 of 165
Activity 2.1. Resonance
Learning aims:
Recapture prior knowledge about oscillations
Trigger curiosity about resonance
Realize that small forces can cause a huge effect
Introduce the concepts of resonance and natural frequency
Materials:
Heavy object (approx. 5 kg – 10 kg) and double rope (to stabilize the motion)
Suggestions for use:
In this activity students try to get a heavy object to oscillate by blowing and answer
the question: how can it be that such a small force results in such strong effect?
See for a demonstration of this experiment: http://youtu.be/zqhF7NEOStY
It should be enough to do this experiment two or three times, with different teams of
two- three students. Try to see how the students work together and check if the
team that has a student on each side of the swinging object gets larger amplitude.
This experiment is also available as Coach data video activity. Students that are not
able to do the experiment might want to work with this activity.
The figure below shows the graph of a heavy bag oscillating (5 kg). A graph like this
might be used as a basis for assessment questions. If students are familiar with the
theory (and the relation between length of the rope and the frequency), they might
want to calculate the length of the ropes used.
Position of the heavy object oscillating.The measurement lasts 60 s, one can see
that the blowing stops around t = 40 s.
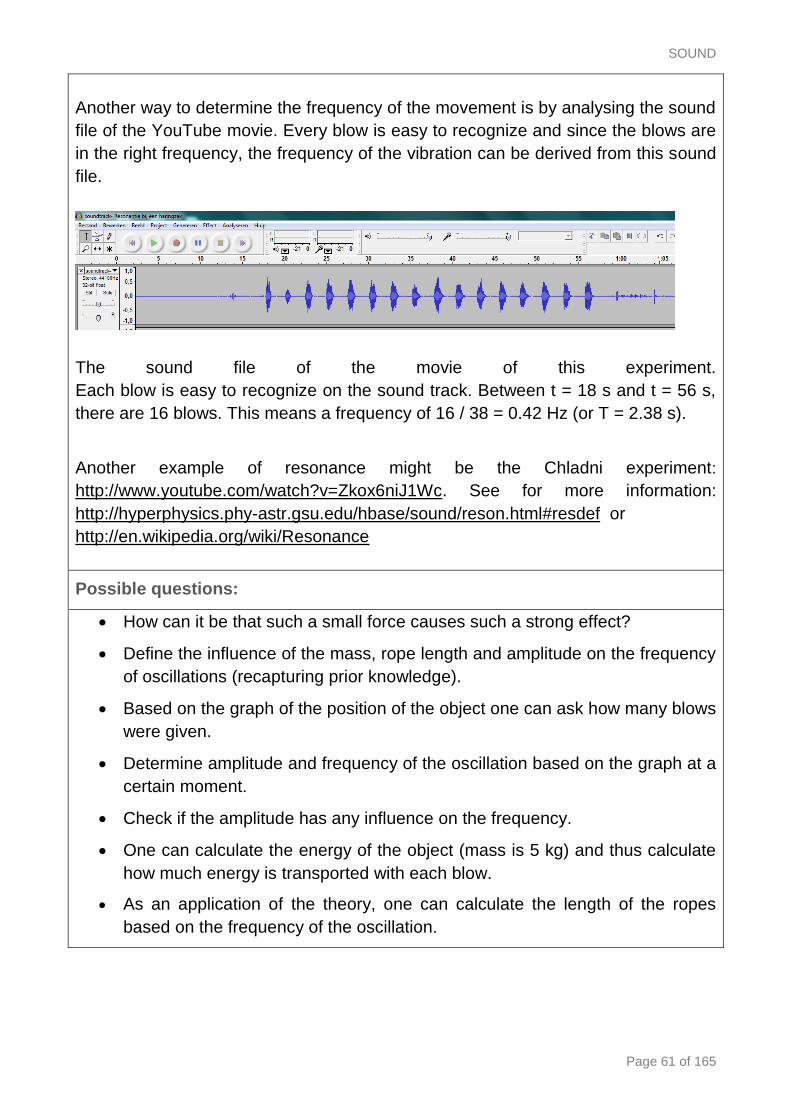
SOUND
Page 61 of 165
Another way to determine the frequency of the movement is by analysing the sound
file of the YouTube movie. Every blow is easy to recognize and since the blows are
in the right frequency, the frequency of the vibration can be derived from this sound
file.
The sound file of the movie of this experiment.
Each blow is easy to recognize on the sound track. Between t = 18 s and t = 56 s,
there are 16 blows. This means a frequency of 16 / 38 = 0.42 Hz (or T = 2.38 s).
Another example of resonance might be the Chladni experiment:
http://www.youtube.com/watch?v=Zkox6niJ1Wc. See for more information:
http://hyperphysics.phy-astr.gsu.edu/hbase/sound/reson.html#resdef or
http://en.wikipedia.org/wiki/Resonance
Possible questions:
How can it be that such a small force causes such a strong effect?
Define the influence of the mass, rope length and amplitude on the frequency
of oscillations (recapturing prior knowledge).
Based on the graph of the position of the object one can ask how many blows
were given.
Determine amplitude and frequency of the oscillation based on the graph at a
certain moment.
Check if the amplitude has any influence on the frequency.
One can calculate the energy of the object (mass is 5 kg) and thus calculate
how much energy is transported with each blow.
As an application of the theory, one can calculate the length of the ropes
based on the frequency of the oscillation.
ESTABLISH: IBSE TEACHING & LEARNING UNIT
Page 62 of 165
Activity 2.2. Fundamental frequency, double bass
Learning aims:
Determine qualitatively relation between string length and its fundamental
frequency
Discover that only certain lengths of the string are used when playing music
Materials:
Pen and paper
Coach 6 file with original data
Suggestions for use:
In this activity students analyse positions where a bass player places his fingers
during playing different notes. The students use the graph to answer the given
questions. During the activity they get a better understanding of what is showed in
the graph.
The questions 1 to 4 are easy to answer for most students. Question 5 goes a little
deeper and requires some calculations. It is up to the teacher to decide how much
help is needed here.
Depending on the spirit in the class and the skills in music, the teacher can decide
how much time is spend on question 6 (let the students guess which tune is
played). Even make a contest out of it (be sure to remove the link to the answer in
the worksheet) or let the students draw a graph for another simple tune.
Answers to the questions in the worksheet:
There are six different notes played (question 1) and the first time the A is played,
the finger is a bit too high (question 2). When the finger is too high, the string is too
long and the tone is too low (question 3). The semitone (question 4) between F#
and G is also clear from this picture.
In the picture below the graph of position of the finger of the bass player against
time is combined with a picture of a guitar. The positions match the positions of
frets of the guitar. The names of the tones played are also indicated.
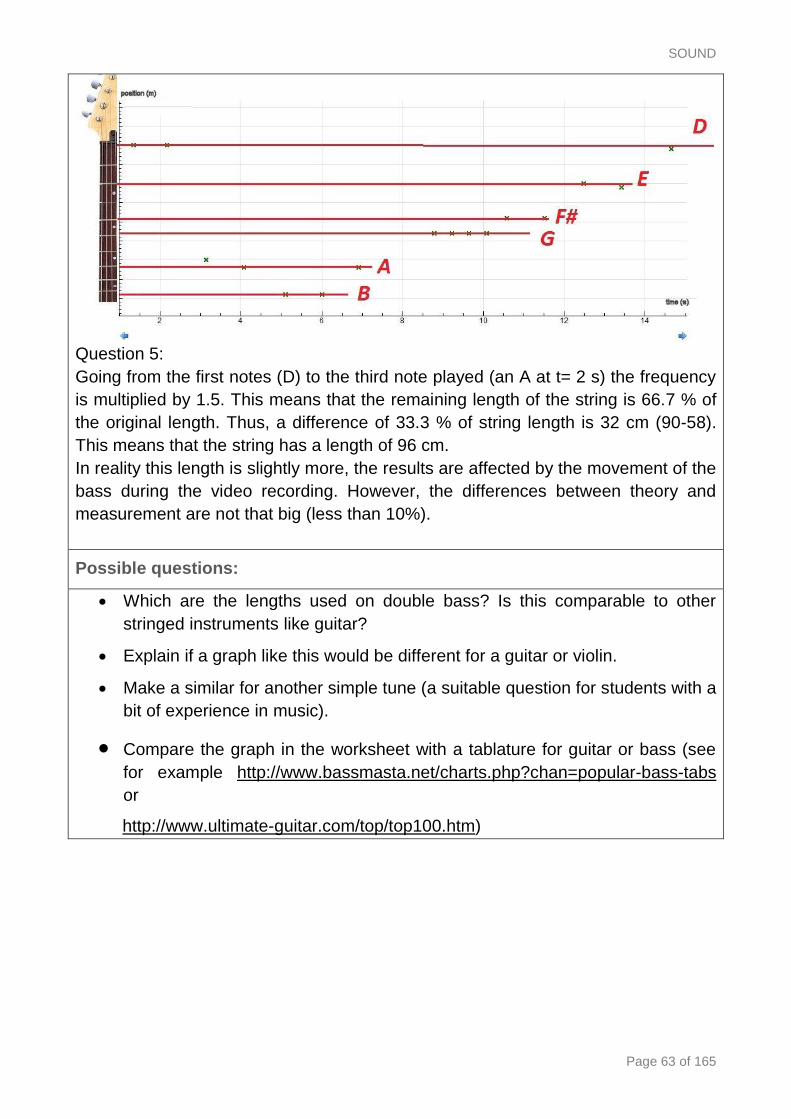
SOUND
Page 63 of 165
Question 5:
Going from the first notes (D) to the third note played (an A at t= 2 s) the frequency
is multiplied by 1.5. This means that the remaining length of the string is 66.7 % of
the original length. Thus, a difference of 33.3 % of string length is 32 cm (90-58).
This means that the string has a length of 96 cm.
In reality this length is slightly more, the results are affected by the movement of the
bass during the video recording. However, the differences between theory and
measurement are not that big (less than 10%).
Possible questions:
Which are the lengths used on double bass? Is this comparable to other
stringed instruments like guitar?
Explain if a graph like this would be different for a guitar or violin.
Make a similar for another simple tune (a suitable question for students with a
bit of experience in music).
Compare the graph in the worksheet with a tablature for guitar or bass (see
for example http://www.bassmasta.net/charts.php?chan=popular-bass-tabs or
http://www.ultimate-guitar.com/top/top100.htm)

ESTABLISH: IBSE TEACHING & LEARNING UNIT
Page 64 of 165
Activity 2.3. Fundamental frequency, guitar
Learning aims:
Determine relation between fundamental frequency f if the string and its
string length L.
Materials:
Guitar
Measuring ruler
A computer with a sound sensor and Sound analysis program.
Suggestions for use:
In this activity students measure the length of the string shorted by using guitar frets
and the corresponding natural frequency of the shorted string. Based on the
measurements they determine the relation between the natural frequency of the
string and its length (f ≈ 1/L).
It is highly recommended to do measurements with a real guitar and to have one
guitar for 3 or 4 students. Try to get some guitars from the music teacher or let the
students bring their own guitar. A bass guitar or any other fretted instrument
(ukulele, banjo, mandolin) will do as well.
It also might be useful to know some parts of the guitar by name, see the picture
below.
If there is no guitar available, the following data can be used:
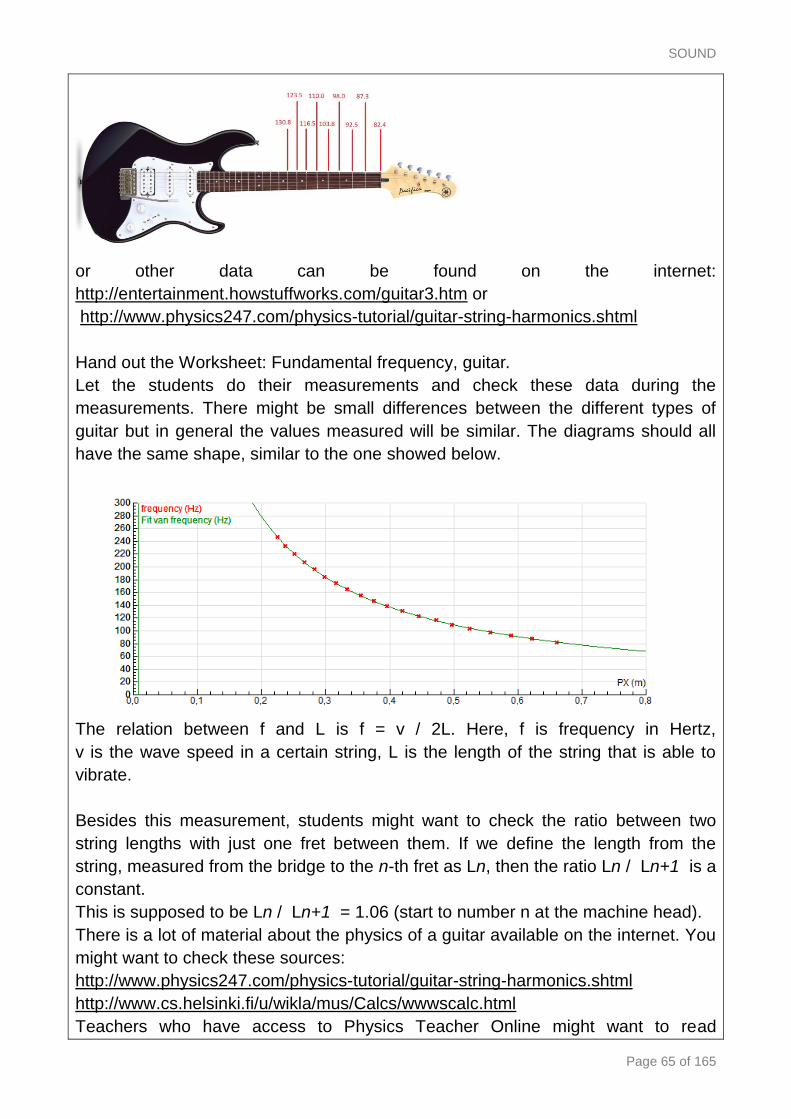
SOUND
Page 65 of 165
or other data can be found on the internet:
http://entertainment.howstuffworks.com/guitar3.htm or
http://www.physics247.com/physics-tutorial/guitar-string-harmonics.shtml
Hand out the Worksheet: Fundamental frequency, guitar.
Let the students do their measurements and check these data during the
measurements. There might be small differences between the different types of
guitar but in general the values measured will be similar. The diagrams should all
have the same shape, similar to the one showed below.
The relation between f and L is f = v / 2L. Here, f is frequency in Hertz,
v is the wave speed in a certain string, L is the length of the string that is able to
vibrate.
Besides this measurement, students might want to check the ratio between two
string lengths with just one fret between them. If we define the length from the
string, measured from the bridge to the n-th fret as Ln, then the ratio Ln / Ln+1 is a
constant.
This is supposed to be Ln / Ln+1 = 1.06 (start to number n at the machine head).
There is a lot of material about the physics of a guitar available on the internet. You
might want to check these sources:
http://www.physics247.com/physics-tutorial/guitar-string-harmonics.shtml
http://www.cs.helsinki.fi/u/wikla/mus/Calcs/wwwscalc.html
Teachers who have access to Physics Teacher Online might want to read

ESTABLISH: IBSE TEACHING & LEARNING UNIT
Page 66 of 165
‘Experimenting with Guitar Strings’ by Michael C. LoPresto:
http://tpt.aapt.org/resource/1/phteah/v44/i8/p509_s1?isAuthorized=no
Possible questions:
Does the relation f = v/2L corresponds with the information given in the
previous activity about the bass string (if frequency is multiplied by 1.5 than
the string length is divided by 1.5)?
What do you think how your resulting graph would look like if the tension of
the string would be higher?
What do you think how your resulting graph would look like if the string would
be thicker?
What do you think what the effect will be for the frequency if the temperature
is higher or lower?
Why has a guitar six strings?
Activity 2.4. Melde’s experiment
Learning aims:
Study the relation between the frequencies and standing waves in a vibrating
string
Understanding concept of fundamental frequency and harmonics
Materials:
Function generator and mechanical vibrator
String
Pulley and weights to adjust the tension in the string
Suggestions for use:
In this activity students perform ‘Melde’s experiment’ in which one end of a
stretched string is attached to a vibrating support and the other end passes over a
pulley to a hanging weight, which produces tension in a string. The stretched string
is set in motion by the vibrating support, but if the frequency of vibration is not one
of the natural frequencies (fundamental or harmonics) of the string the vibrational
amplitude of the string is very small. However when the frequency of the vibrating
support is the same as one of the natural frequencies the amplitude will be large
and will clearly show patters (nodes and antinodes) of standing waves.
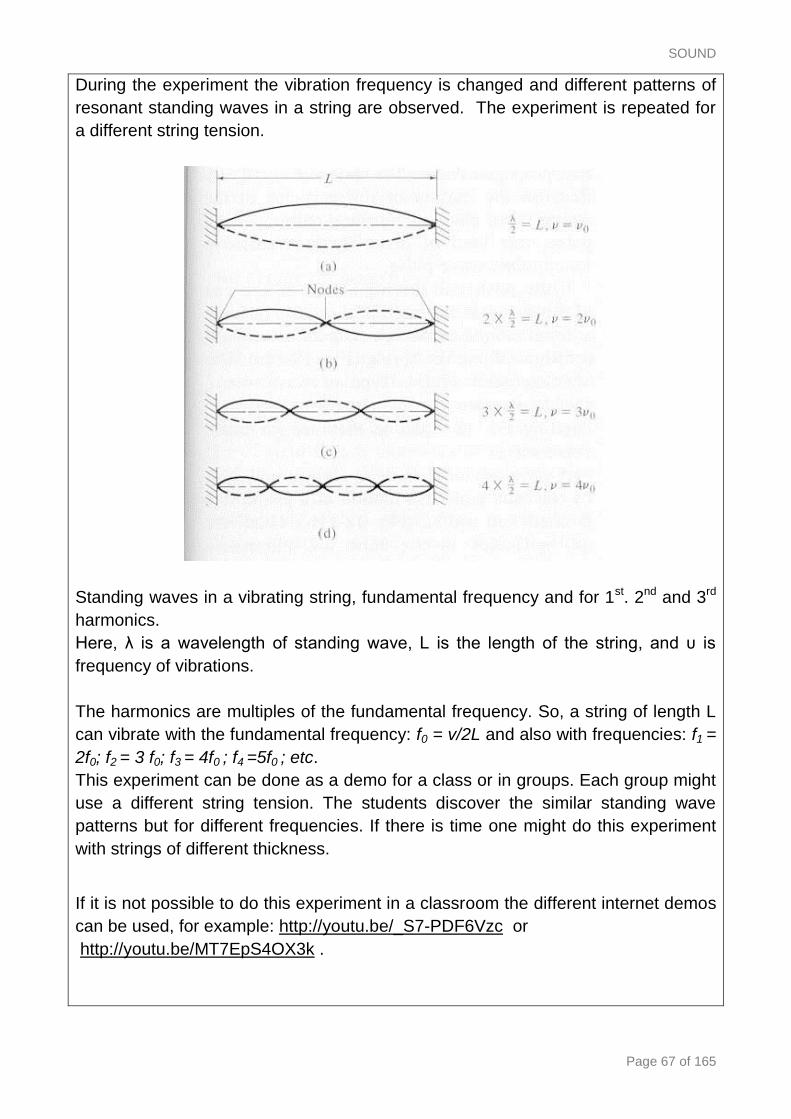
SOUND
Page 67 of 165
During the experiment the vibration frequency is changed and different patterns of
resonant standing waves in a string are observed. The experiment is repeated for
a different string tension.
Standing waves in a vibrating string, fundamental frequency and for 1st. 2nd and 3rd
harmonics.
Here, λ is a wavelength of standing wave, L is the length of the string, and υ is
frequency of vibrations.
The harmonics are multiples of the fundamental frequency. So, a string of length L
can vibrate with the fundamental frequency: f0 = v/2L and also with frequencies: f1 =
2f0; f2 = 3 f0; f3 = 4f0 ; f4 =5f0 ; etc.
This experiment can be done as a demo for a class or in groups. Each group might
use a different string tension. The students discover the similar standing wave
patterns but for different frequencies. If there is time one might do this experiment
with strings of different thickness.
If it is not possible to do this experiment in a classroom the different internet demos
can be used, for example: http://youtu.be/_S7-PDF6Vzc or
http://youtu.be/MT7EpS4OX3k .
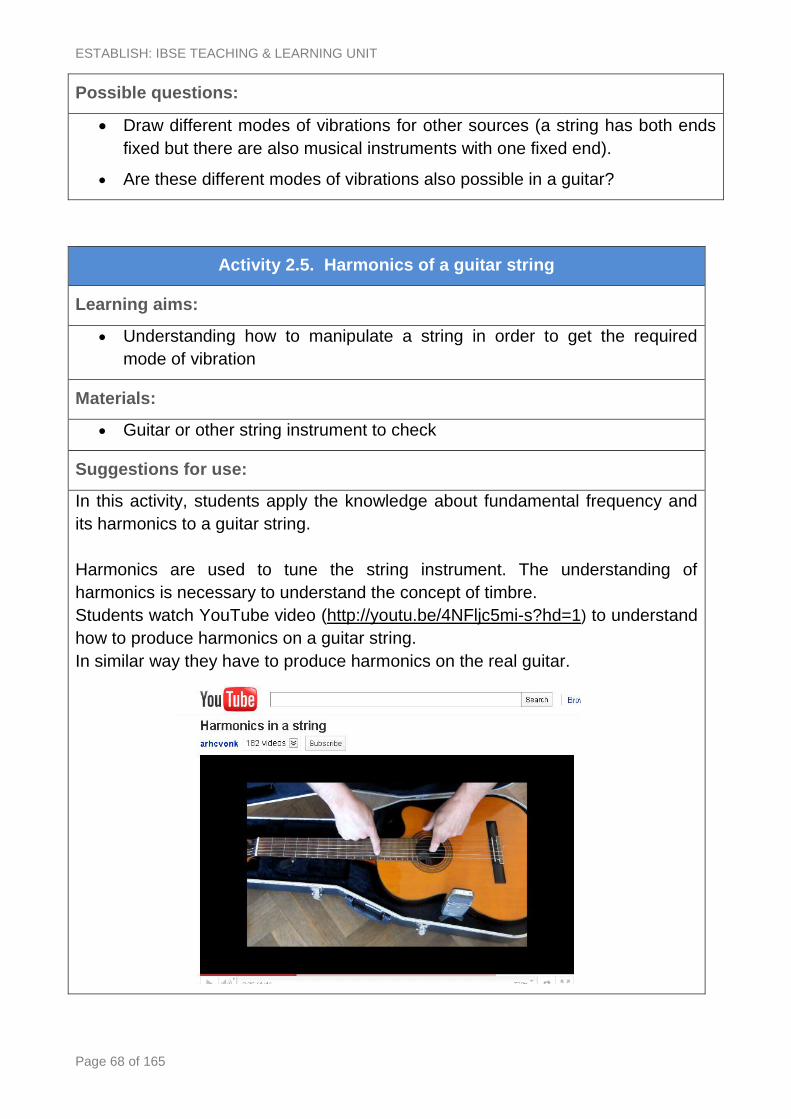
ESTABLISH: IBSE TEACHING & LEARNING UNIT
Page 68 of 165
Possible questions:
Draw different modes of vibrations for other sources (a string has both ends
fixed but there are also musical instruments with one fixed end).
Are these different modes of vibrations also possible in a guitar?
Activity 2.5. Harmonics of a guitar string
Learning aims:
Understanding how to manipulate a string in order to get the required
mode of vibration
Materials:
Guitar or other string instrument to check
Suggestions for use:
In this activity, students apply the knowledge about fundamental frequency and
its harmonics to a guitar string.
Harmonics are used to tune the string instrument. The understanding of
harmonics is necessary to understand the concept of timbre.
Students watch YouTube video (http://youtu.be/4NFljc5mi-s?hd=1) to understand
how to produce harmonics on a guitar string.
In similar way they have to produce harmonics on the real guitar.
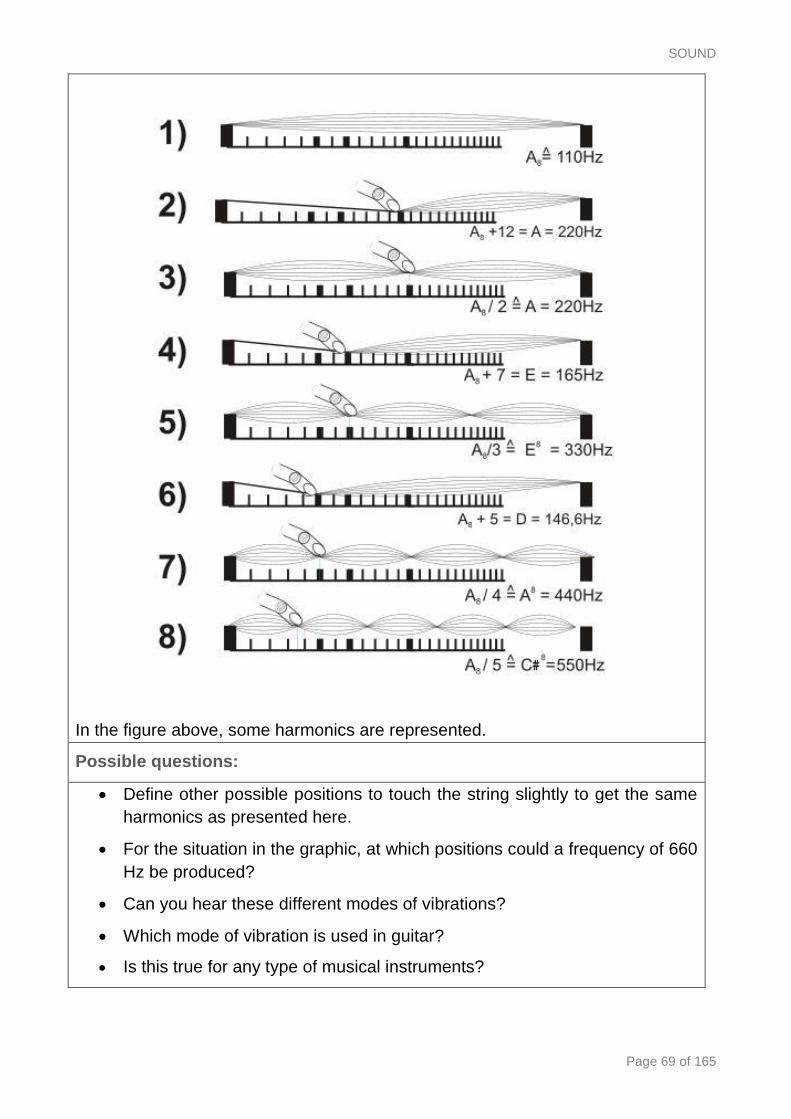
SOUND
Page 69 of 165
In the figure above, some harmonics are represented.
Possible questions:
Define other possible positions to touch the string slightly to get the same
harmonics as presented here.
For the situation in the graphic, at which positions could a frequency of 660
Hz be produced?
Can you hear these different modes of vibrations?
Which mode of vibration is used in guitar?
Is this true for any type of musical instruments?
ESTABLISH: IBSE TEACHING & LEARNING UNIT
Page 70 of 165
Activity 2.6. Standing waves in air, closed-end air column
Learning aims:
Understanding standing waves in closed-end air column
Investigate the resonance frequencies of standing waves
Materials:
Sound generator
Tube
Stand material
Suggestions for use:
In activity students examine the resonance frequencies of a closed-end column.
By changing the frequency of the signal generator the frequency at which air inside
of the tube is also changing. When the frequency of signal generator is closed the
natural frequency of the air column then resonance occurs and a loud sound
results.
It is up to the teacher to what extent the students are supported in this experiment.
Possible questions:
How can you, for a certain length of the tube, be sure to have the lowest
frequency required for resonance?
Draw the standing wave patterns for the fundamental frequency and the first
three harmonics.
What would happen with length of the air column or frequency if the speed of
sound is changed?
Predict what the effect will be for the frequency if the temperature is changed.
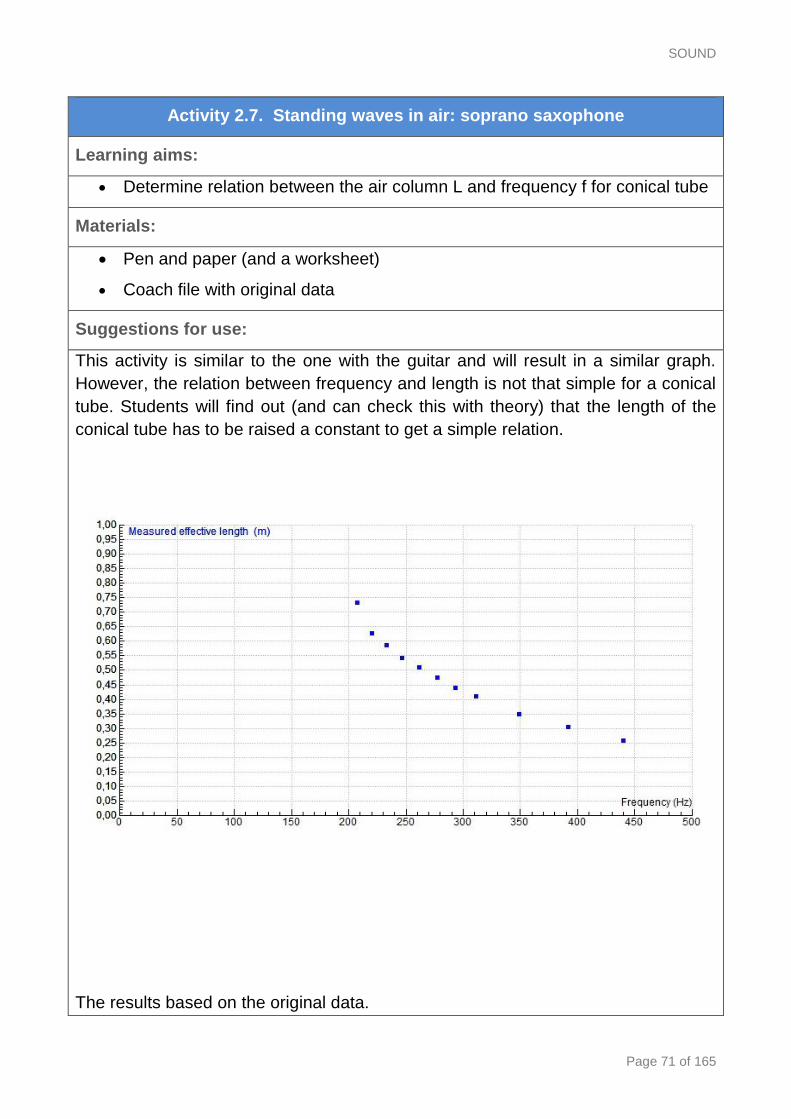
SOUND
Page 71 of 165
Activity 2.7. Standing waves in air: soprano saxophone
Learning aims:
Determine relation between the air column L and frequency f for conical tube
Materials:
Pen and paper (and a worksheet)
Coach file with original data
Suggestions for use:
This activity is similar to the one with the guitar and will result in a similar graph.
However, the relation between frequency and length is not that simple for a conical
tube. Students will find out (and can check this with theory) that the length of the
conical tube has to be raised a constant to get a simple relation.
The results based on the original data.
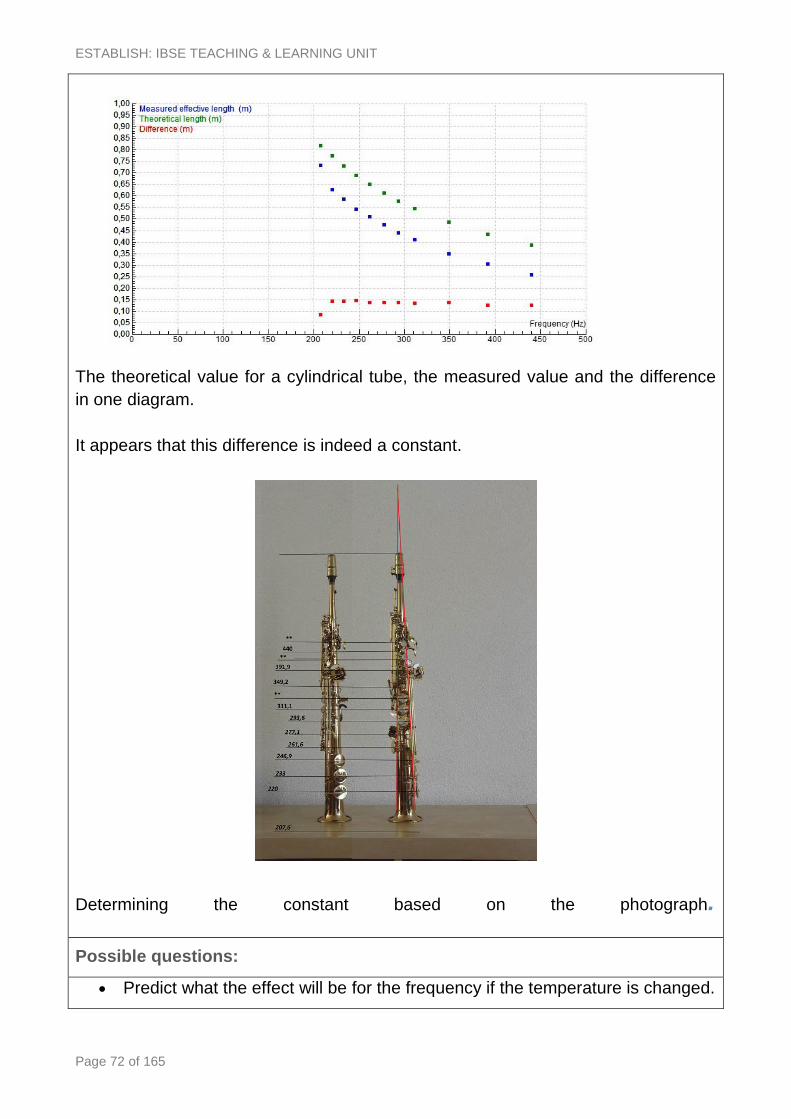
ESTABLISH: IBSE TEACHING & LEARNING UNIT
Page 72 of 165
The theoretical value for a cylindrical tube, the measured value and the difference
in one diagram.
It appears that this difference is indeed a constant.
Determining the constant based on the photograph.
Possible questions:
Predict what the effect will be for the frequency if the temperature is changed.
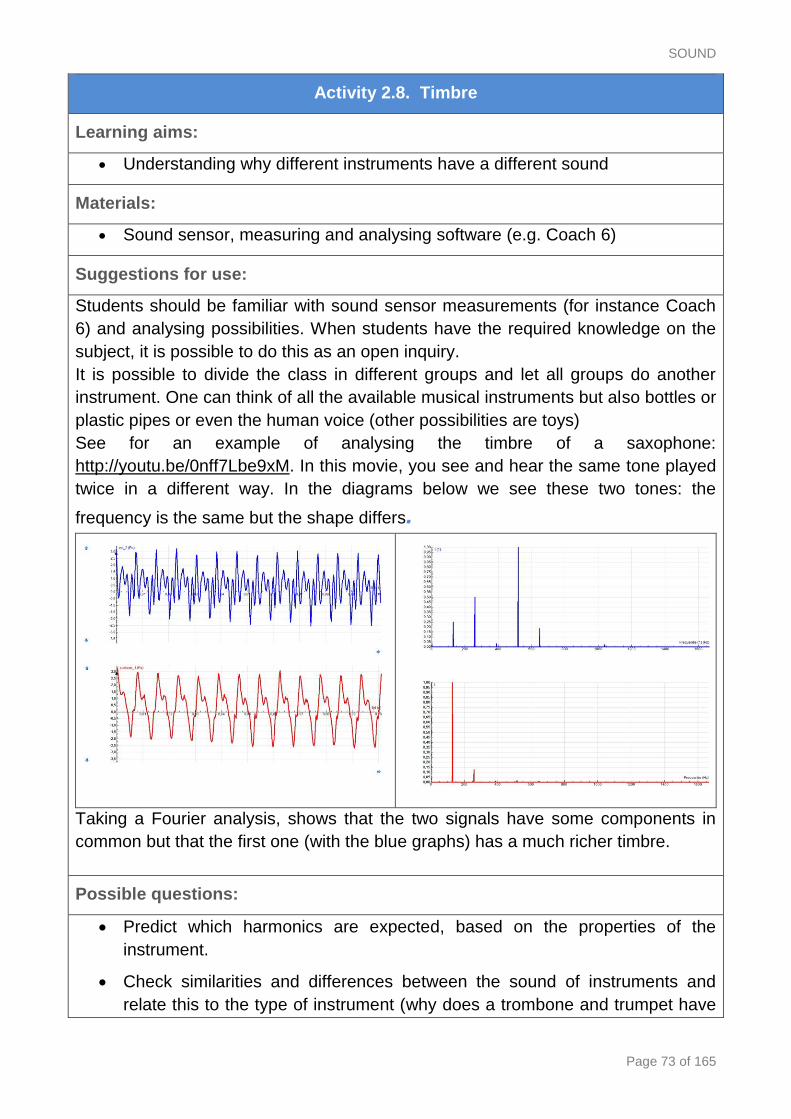
SOUND
Page 73 of 165
Activity 2.8. Timbre
Learning aims:
Understanding why different instruments have a different sound
Materials:
Sound sensor, measuring and analysing software (e.g. Coach 6)
Suggestions for use:
Students should be familiar with sound sensor measurements (for instance Coach
6) and analysing possibilities. When students have the required knowledge on the
subject, it is possible to do this as an open inquiry.
It is possible to divide the class in different groups and let all groups do another
instrument. One can think of all the available musical instruments but also bottles or
plastic pipes or even the human voice (other possibilities are toys)
See for an example of analysing the timbre of a saxophone:
http://youtu.be/0nff7Lbe9xM. In this movie, you see and hear the same tone played
twice in a different way. In the diagrams below we see these two tones: the
frequency is the same but the shape differs.
Taking a Fourier analysis, shows that the two signals have some components in
common but that the first one (with the blue graphs) has a much richer timbre.
Possible questions:
Predict which harmonics are expected, based on the properties of the
instrument.
Check similarities and differences between the sound of instruments and
relate this to the type of instrument (why does a trombone and trumpet have

ESTABLISH: IBSE TEACHING & LEARNING UNIT
Page 74 of 165
sounds that are closely related and why does a violin sounds very different)
Try to make ‘families’ of instruments and define the characteristics of sound
for each family
Activity 2.9. Beats
Learning aims:
Understanding beats
Materials:
Pen, paper, internet, tuning forks or musical instruments
Suggestions for use:
Though the concept of beats is on itself not very hard to understand, it requires
some pre- knowledge and in many situations it is no part of the standard
curriculum. However, when students have the basic knowledge on sound they
should be able to understand the concept of beats. Students can find their own
ways and sources to gather information.
Possible questions:
Find examples of beats occurring in daily life.
Are there musical instruments that use beats?
Develop an experiment where you demonstrate beats (may be related to
music but that is not obliged).
SOUND
Page 75 of 165
Activity 2.10. Tuning the guitar
Learning aims:
Apply gathered knowledge in a new situation
Evaluate knowledge
Materials:
Guitar, tuning fork
Suggestions for use:
Let the students tune a guitar in different ways. Let them find information on internet
about the different tuning methods. Perhaps the students know other ways as well.
The ways to tune the guitar are:
Using of beats
One way is to play the same tone on different strings (by shortening one of the
strings). Play these tones together, when the two strings are slightly out of tune,
beats will occur. When the strings are well tuned, there will be no beat.
See (and hear) for an example of beats on the double bass:
http://youtu.be/a0VWWbr6O1I. In this movie you see the double bass (starting out
of tune) and you can hear the sound of it. This sound is recorded with Coach and
you see the beats occurring in the pattern (Around t=32 s in the movie) When the
tuning of the strings is changed, you see less beats in the same time (t = 56 s): the
strings are more in tune then before. At the end of the movie there are almost no
beats ( t = 1 m 30 s ). Take notice that the graphs showed in this movie are all
given for a measure time of three seconds.
Using harmonics
By playing harmonics on different strings, the same tone should occur. Let the
students find out which frets are used for this.
Using resonance
When a string that produces a low tone, is shortened, there is a position
where this string produces the same tone as the string next to this. Find this
position and play the shortened string. When both strings are well tuned, the
not-shortened string will resonate.
See for an example of resonance with strings the next movie of a double bass:
http://youtu.be/d8uH7SeAtZA.
Possible questions:
Ask fellow students who play the guitar, which method they prefer to tune
ESTABLISH: IBSE TEACHING & LEARNING UNIT
Page 76 of 165
their guitar
Which way of tuning the guitar would you prefer?
Activity 3.1. Sound graphs
Learning aims:
Introducing of sound graphs (sound amplitude versus time)
Understand that sound graphs can be used for speech recognition
Materials:
A computer to play MP3 file and files: mama_papa.mp3.
Or
A computer with microphone, sound card and Sound analysis program.
For example Audacity is a free, open source, sound recorder and editor
program.
Free to download at http://audacity.sourceforge.net/download/.
Suggestions for use:
In this activity students are introduced to speech analysis. They analyse simple
sound graphs and try to recognise the sound waveforms of certain syllables and
words. The students’ tasks are given in Worksheet: Sound graphs. Let students
perform these tasks. If possible let them work in groups. The given mp3 files can be
played on the computer, if possible in the Audacity program.
Once students have completed their tasks discuss with them what speech analysis
is, how it can be used, what possibilities and difficulties of speech analysis are, etc.
This activity should encourage students’ interest in speech analysis.
Possible questions:
Do you know what speech analysis is?
Do you see any examples or applications of it?
What do you think of the present and future level of technology in this field?
Can you think of societal use and abuse of this technology?
Would you as a judge admit evidence based on speech analysis in court?
Could voice recognition be abused?
Can you come up with commercial applications in the field of advertisement
and security?
SOUND
Page 77 of 165
Activity 3.2. Model of human speech production
Learning aims:
Understanding the model of the human speech production
Understanding of physics concepts (sound spectrum resonance, formants)
Materials:
Text about model of human speech production is given in the worksheet
Other internet resources concerning modelling human speech
Suggestions for use:
In this activity students focus on a model of the human vocal system and physics
concepts related to this model.
Hand out Worksheet: Model of human speech production and let students read
the text. Then discuss with them the given bio-physics model and mechanism of
speech production.
Show them the animation of vocal folds at:
http://www.humnet.ucla.edu/humnet/linguistics/faciliti/demos/vocalfolds/vocalf
olds.htm
Show them X-ray sample movies of human speech:
http://psyc.queensu.ca/~munhallk/05_database.htm
Extend the discussion by asking the questions given below.
Possible questions:
Does temperature influence the pitch of your voice or the pitch of your
musical instrument, respectively? In what way? Can you explain the
underlying mechanism of this phenomenon?
Donald Duck is known for his high-pitched speech. Breathing helium will give
you temporarily a similar voice. Could you explain this? What property of the
intermediating gas is responsible?
What are the voice differences between man/female, loud/soft, sung/spoken?
How could we recognize a vowel from its formants?
ESTABLISH: IBSE TEACHING & LEARNING UNIT
Page 78 of 165
Activity 3.3. Sound signal analysis
Learning aims:
Interpreting the recorded speech waveforms
Determining formants of the recorded speech waveforms by using sound
signal analysis tools (e.g. Fast Fourier Transform or Liner Prediction)
Understanding a spectrogram
Materials:
A sound sensor, interface and software that displays sound waveforms and
allows to perform sound analysis (e.g. CMA Coach 6 or Raven Lite program
which also produce Sound spectrogram)
Suggestions for use:
In this activity students use a sound sensor to record the human voice sounds.
Software for recording and analyzing sound is required. It can be for example:
Coach 6 software together with a sound sensor and interface, or
Raven Lite program, an application originally developed for use by
ornithologists studying bird sounds, can be downloaded at:
http://store.birds.cornell.edu/Raven_Lite_p/ravenlite.htm and used for free, or
Java simulation: Model of the Human Speech Production, which includes as
well sound analysis as sound synthesis, available at:
http://www2.spsc.tugraz.at/add_material/courses/scl/vocoder/simulation.html
By using Signal analysis tools like Fourier Transform or Linear Prediction students
can display the frequency spectrum of the recorded sounds and find the frequency
components.
Analyzing a simple sine wave signal produced by a tuning fork is especially
illuminating, since frequencies can be calculated in different ways and compared.
Further students investigate sounds of different vowels and determine the formants
of these vowels.
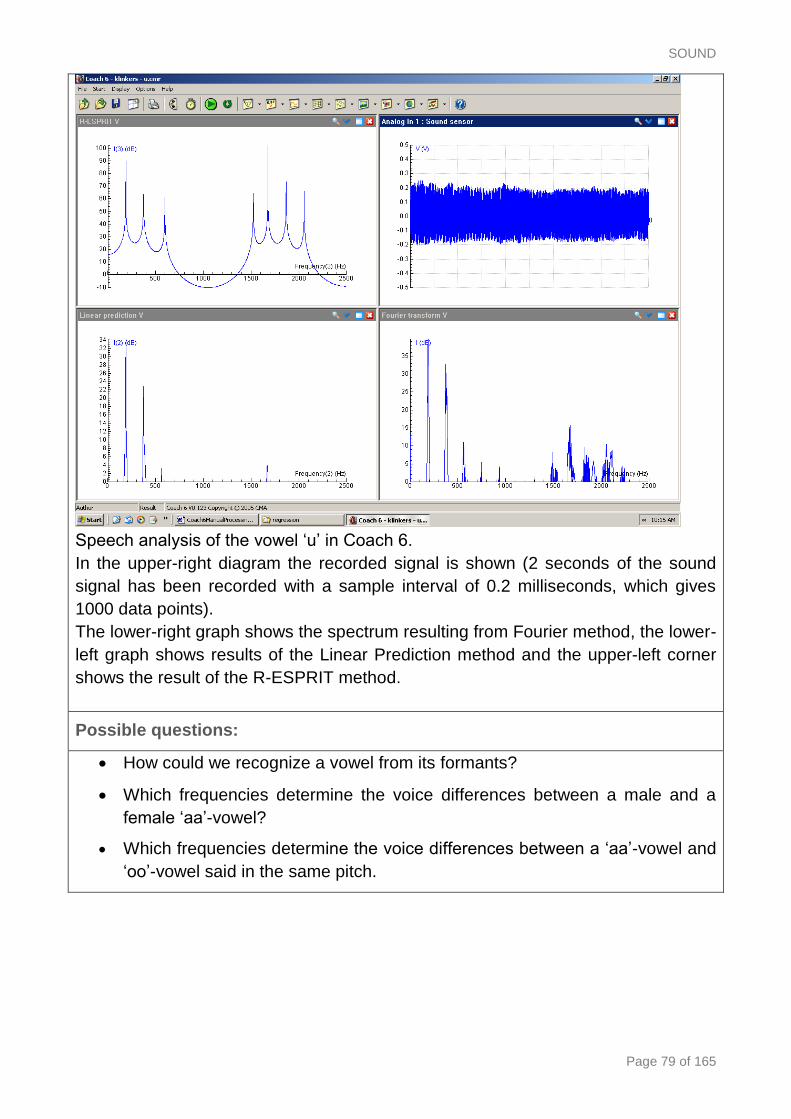
SOUND
Page 79 of 165
Speech analysis of the vowel ‘u’ in Coach 6.
In the upper-right diagram the recorded signal is shown (2 seconds of the sound
signal has been recorded with a sample interval of 0.2 milliseconds, which gives
1000 data points).
The lower-right graph shows the spectrum resulting from Fourier method, the lower-
left graph shows results of the Linear Prediction method and the upper-left corner
shows the result of the R-ESPRIT method.
Possible questions:
How could we recognize a vowel from its formants?
Which frequencies determine the voice differences between a male and a
female ‘aa’-vowel?
Which frequencies determine the voice differences between a ‘aa’-vowel and
‘oo’-vowel said in the same pitch.

ESTABLISH: IBSE TEACHING & LEARNING UNIT
Page 80 of 165
Activity 3.4. Human speech analysis
Learning aims:
Investigating the formants of various vowels
Finding and formulating a research question concerning the human speech
analysis
Materials:
A sound sensor, interface and software that displays sound waveforms (e.g.
CMA Coach 6, Ravel Lite or Java simulation Model of the Human Speech
Production
http://www2.spsc.tugraz.at/add_material/courses/scl/vocoder/simulation.html
Suggestions for use:
In this activity students investigate the human speech analysis.
This is an open inquiry in which students learn to find and formulate their own
research question without strict guidance of their teacher. They learn to setup and
successfully finish (possibly adjust along the way) their own practical experiment.
With their conclusions, they practice critical thinking. Finally, they get a good picture
of the content and (societal, industrial) applications of speech analysis.
The research questions given below give an idea of the scope of possibilities in this
subject, they are not meant to share with the students beforehand, as finding their
own research question is an important element of this assignment.
Possible research questions:
Below, a number of the research questions are listed:
What, if any, is the difference in amplitude and frequency between vowels ‘a’
, ‘e’, ‘o’, and ‘u’? Which property can be used best to distinguish them?
How to approach orally the sound of a tuning fork?
Analysis and recognition of the sound pattern of the word Earth.
How do we recognize gender in the same vowels ‘a’, ‘e’ and ‘u’? Man versus
woman!
Is there a difference (if so, which?) between the various ways of pronouncing
the vowel ‘a’: with a pinched nose, behind a cloth, singing, whispering etc.
Comparison of the spectrum of a flute and a singing voice, producing the
same note.
Which (of the lowest five) formant is typical for the sound or the voice, and

SOUND
Page 81 of 165
which for the pitch (height of the tone)?
What feature is the most characteristic for a given vowel produced by
different people: the relations between the formant frequencies and/or their
amplitudes or the absolute differences between them?
Activity 3.5. Human speech synthesis
Learning aims:
Investigating which parameters and how influence the quality of artificial
created human speech
Finding and formulating a research question concerning the human speech
synthesis
Materials:
Software that is able to synthesis recorder sound waveforms (e.g. Java
simulation Model of the Human Speech Production
http://www2.spsc.tugraz.at/add_material/courses/scl/vocoder/simulation.html)
Suggestions for use:
In this activity students investigate the human speech synthesis.
This is an open inquiry in which students learn to find and formulate their own
research question without strict guidance of their teacher. They learn to setup and
successfully finish (possibly adjust along the way) their own practical experiment.
With their conclusions, they practice critical thinking. Finally, they get a good picture
of the content and (societal, industrial) applications of speech analysis.
The research questions given below give an idea of the scope of possibilities in this
subject, they are not meant to share with the students beforehand, as finding their
own research question is an important element of this assignment.
Possible research questions:
Below, a number of the research questions are listed:
How to make a computer or a robots talk?
What parameters influence the quality of synthetic speech system?
What are applications of the human speech synthesis technology?

ESTABLISH: IBSE TEACHING & LEARNING UNIT
Page 82 of 165
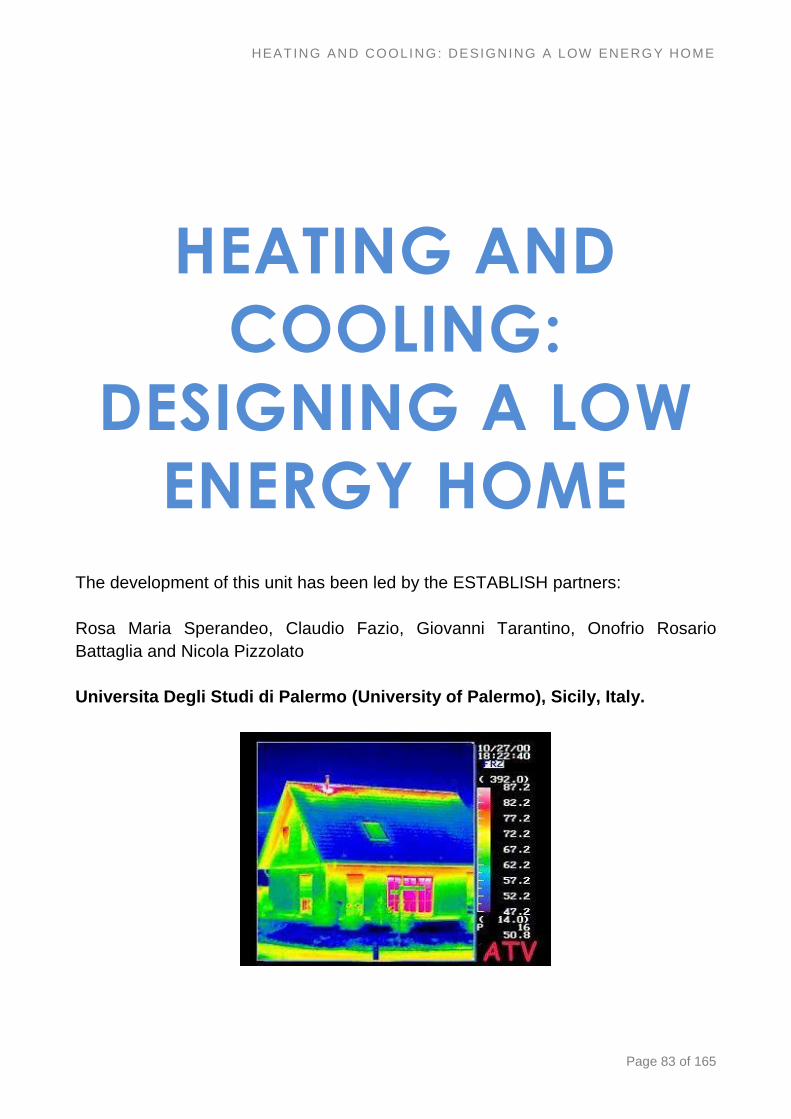
HEATING AND COOLING: DESIGNING A LOW ENERGY HOME
Page 83 of 165
HEATING AND
COOLING:
DESIGNING A LOW
ENERGY HOME
The development of this unit has been led by the ESTABLISH partners:
Rosa Maria Sperandeo, Claudio Fazio, Giovanni Tarantino, Onofrio Rosario
Battaglia and Nicola Pizzolato
Universita Degli Studi di Palermo (University of Palermo), Sicily, Italy.

ESTABLISH: IBSE TEACHING & LEARNING UNIT
Page 84 of 165
UNIT CONTENTS
I. Unit Description ............................................................................. 85
II. IBSE Character ............................................................................. 85
III. Science Content Knowledge ......................................................... 86
IV. Pedagogical Content Knowledge ................................................... 87
V. Industrial Content Knowledge ........................................................ 88
VI. Learning Path(s) ............................................................................ 93
VII. Student Learning Activities ............................................................ 99
Activity 1.1: How to maintain heat in your house model ............................ 99
Activity 1.2: How is the temperature distributed inside your house model? ...
....................................................................................................... 100
Activity 1.3: What is the effect of sunlight on the temperature inside your
house model? ......................................................................................... 101
Activity 2.1: Observing ice melting in plates of different materials ........... 101
Activity 2.2: Measuring insulation properties of different materials .......... 103
Activity 3.1: Observing convection currents ............................................ 105
Activity 3.2: Natural and forced cooling ................................................... 106
Activity 4.1: Build and use home-made radiometers ............................... 108
Activity 4.2: Illuminating objects of different colours ................................. 112
Activity 4.3: Radiation from hot and cool bodies ...................................... 113
Activity 4.4: An open Inquiry about Infrared Thermography ..................... 115
Activity 4.5: Analysis of the cooling processes of an hot body in different
conditions. Cooling in air and in a vacuum environment .......................... 118
HEATING AND COOLING: DESIGNING A LOW ENERGY HOME
Page 85 of 165
I. Unit Description
This unit is aimed at engaging students in designing and building an energy-
efficient scale model house through the understanding of relevant concepts of
energy flow in thermal systems. It is developed into 4 subunits that analyse the
different processes of thermal energy transfer (conduction, convection and
radiation). The project intends also to introduce pupils to infrared thermography,
thermal imaging and thermograms, i.e. infrared imaging science.
The content area of the unit is energy and power in thermal systems. The subunits
are suitable for 14-16 year old students while the data analysis and more
theoretical parts of the unit are suitable for 16-18 year old students.
The estimated duration of the whole unit is 30 hours. However, it can be used
partially.
The unit uses hands-on activities, scientific simulations and probe-ware
measurements as tools to develop an Inquiry Based Approach.
II. IBSE Character
This unit can be used to develop students’ ability to plan investigations, develop
hypothesis, distinguish alternatives, searching for information, constructing models
and debating with peers. It covers different types of inquiry activities, from
interactive demonstration to open inquiry. The main problem dealt with the unit is
divided in sub-problems faced in the different subunits that develop by increasing
student participation and independence.
The unit can be implemented in different ways, and for each subunit, emphasis can
be placed on different elements of inquiry. However, in each subunit a progression
in assigning autonomy to student is foreseen by making the suggested questions
more general.
In each subunit, the teacher may start with either a series of questions or with an
interactive demonstration, like in subunit 2, where the initial demonstration poses
the problem to be investigated and inquiry can be developed in different steps
(some of them are suggested by the activities that lead to questions for further
investigations). All the activities may be guided, bounded or lead into open inquiry
settings. However, the initial activities given in each subunit will form the
background for further open inquiry activities to be performed by students.
In order to focus on the different skills connected with the inquiry process, the
starting point of each activity is a well-defined problem whose solution requires
students’ engagement, raising questions and developing hypotheses. The teacher
control of students’ activities is mainly connected with students’ expertise in
autonomous work and during the succession of the proposed activities the degree
of teacher’s guidance decreases.
Details about the inquiry types and E-emphasis will be supplied for each sub-unit.
ESTABLISH: IBSE TEACHING & LEARNING UNIT
Page 86 of 165
III. Science Content Knowledge
Core physics concepts of this study are: thermal energy, heat and temperature.
Such concepts involve many difficulties that often are connected with different
definitions in textbooks. For this reason we, here, clarify the main definitions of the
involved concepts.
In the unit, we discuss Thermal Energy arising from the fact that particles of matter
are in constant motion and that this motion relates directly to the state of matter of
the object (solids, liquids, or gases). Temperature affects how fast these particles
move. The higher the temperature the faster the particles move. Moving particles
possess kinetic energy.
Temperature is defined as a measure of the average kinetic energy of the particles
of an object.
Thermal Energy is the total sum of all the energies of the object particles.
As a consequence, thermal energy and temperature are related though different:
temperature is proportional to the average kinetic energy of the particles; thermal
energy is the total amount of the kinetic energy of the object particles.
Transfer of thermal energy between systems can happen through three different
processes:
Conduction – direct contact
Convection – through a fluid
Radiation – by electromagnetic waves
The term heat involves the quantity of energy transferred from one place in a body
or thermodynamic system to another place, or beyond the boundary of one system
to another one due to thermal contact when the systems are at different
temperatures. In this description, it is an energy transfer to the body in any other
way than the mechanical work performed on the body
Transfer by conduction is the transfer of thermal energy between regions of
matter due to a temperature gradient. Heat spontaneously flows from a region of
higher temperature to a region of lower temperature, temperature differences
approaching thermal equilibrium.
On a microscopic scale, conduction occurs as rapidly moving or vibrating atoms
and molecules interact with neighbouring particles, transferring some of their kinetic
energy. Heat is transferred by conduction when adjacent atoms vibrate against one
another, or as electrons move from one atom to another. Conduction is the most
significant mean of heat transfer within a solid or between solid objects in thermal
contact. Conduction is greater in solids because the network of relatively fixed
spatial bounds between atoms helps to transfer energy between them by vibration.
Transfer by convection is the transfer of thermal energy through a substance by
mean of currents of fluids (liquids and gases).
HEATING AND COOLING: DESIGNING A LOW ENERGY HOME
Page 87 of 165
Transfer by radiation is transfer by electromagnetic waves. These waves may
pass through all matter states and also through the vacuum space by transferring
energy called radiant energy.
Transfer by conduction and convection involves a direct contact between bodies at
different temperatures. In this case we say that heat is exchanged between the two
bodies. Transfer by radiation involves interaction between one body and the
electromagnetic radiation emitted by the other body.
Concerning the specific content objectives, these involve the ability to:
Differentiate between heat and temperature;
Understand the concept of thermal equilibrium and thermal process;
Differentiate among conduction, convection, and radiation;
Give examples of how conduction, convection, and radiation are considered
in choosing materials for buildings and designing a house model;
Explain how environmental factors such as wind, solar radiation, and
temperature affect the design of a house and the choice of the materials.
IV. Pedagogical Content Knowledge
PCK involved in the Unit is related to the analysed physics topics, as well as to its
IB approach. With reference to the domain of physics topics, relevant elements are
the following:
To make teachers aware of expected difficulties, misconceptions and/or
alternative conceptions in the understanding of the content (as for example
“Heat as energy contained in a body”, “Temperature as a measure of heat in
a body”, “Different bodies placed in the same environment have different
temperatures”)
To gain ability in using Scientific Instructional Representations (models,
mathematical representations, etc.) by connecting them and making evident
their rationale to fit students' reasoning
To be aware of students’ learning difficulties in sketching microscopic
behaviours
To connect physics concepts with everyday phenomena
To relate observation of phenomena with students' representations and
models
With regard to the features of IBSE approach, teachers especially need to gain
pedagogical content knowledge enabling them to “engage students in asking and
answering scientific questions, designing and conducting investigations, collecting
and analysing data, developing explanations based on evidence, and
communicating and justifying findings”. This mainly involves teachers:
Providing questions to frame unit and questions for discussion
Suggesting approaches for using technologies as laboratory and cognitive
tools.
ESTABLISH: IBSE TEACHING & LEARNING UNIT
Page 88 of 165
Suggesting approaches for collecting and analysing data.
Supporting students in designing their own investigations.
Suggesting approaches to help students construct explanations Based on
Evidence
Providing approaches for promoting science communication Baseline feature.
V. Industrial Content Knowledge
Thermal insulation has a lot of industrial applications, as it reduces of the effects
of the various processes of heat transfer between objects in thermal contact or in
range of radiative influence. Examples go from building construction and
mechanical insulation for pipes, aircrafts and refrigerators to clothing.
V.1: Related Industrial Topics
Building materials: concrete, insulators, films, rigid structural foam, pipes and
conduits, barrier layers (water, air, radon)
Solar thermal technologies, control systems, storage of heat, heat recovery
Photovoltaic panels, storage systems (batteries), thermo-cameras, inverters,
links to electricity grid
Measurement of heat conductivity, heat loss; thermal imaging
External cladding
V.2: Industry Link: Building Materials – Insulation Properties,
Thermocameras
Focal Organisations: Cement Roadstone Holdings, Istituto Giordano S.p.A., R&D
innovAction, FLIR Systems, inc.
Cement Roadstone Holdings (CRH) is a leading international building
materials manufacturer and distributor. The company was founded in Ireland
in 1970 by the merger of Irish Cement Ltd. and Roadstone Ltd. and now
operates in 35 countries globally with annual sales of over €20 billion. CRH
shares are listed on the Irish, London and New York stock exchanges. The
product range is vast and includes cement, lime, aggregates, asphalt, ready-
mixed concrete, pre-cast concrete products, clay products, glass and
insulation materials. Energy efficiency is a major focus of the European
Construction Industry and some of the most efficient buildings in the world are
being constructed using products manufactured by CRH companies.
HEATING AND COOLING: DESIGNING A LOW ENERGY HOME
Page 89 of 165
Instituto Giordano S.p.A. (IG) is a Contract Research Organisation, classified as a
“Centre of Excellence” in the assistance of Industrial SMEs in R&D, Innovation and
Technology Transfer activities.
Established in 1959, IG today employs 120 employees (50% graduates) + 130
inspectors. IG 2010 turnover was more than11 Million Euros. More than 285
thousands certificates and test reports issued up to July 2011. IG’s fields of activity
comprise: Testing. R&D and TT on Building/Construction Materials & Components,
Heat Technology, Fire Safety, Thermo-mechanical and Plants, Transportation,
Electric, Chemistry, Naval.
R&D innovAction (R&DI) aims at identifying innovative solutions to improve the
competitive advantages of its customers in terms of compliance with technical and
economic sustainability. Based in Milan (Italy), it carries out research, development,
industrialization and commercialization of innovative products and services at high
technological content, mainly in the field of Materials, Process, Energy Efficiency,
Renewables and Environment. R&D innovAction cooperates with leading
companies in Italy and abroad to develop new Services for energy efficiency by
monitoring consumption and providing Energy Management support to identify
inefficiencies.
FLIR Systems, Inc. is a leading manufacturer of innovative imaging systems that
include infrared cameras, aerial broadcast cameras and machine vision systems.
Pioneers in the commercial infrared camera industry, the company has been
supplying thermography and night vision equipment to science, industry, law
enforcement and the military for over 50 years. From predictive maintenance,
condition monitoring, non-destructive testing, R&D, medical science, temperature
measurement and thermal testing to law enforcement, surveillance, security and
manufacturing process control, FLIR offers the widest selection of infrared cameras
for beginners to pros.
Examples of ICK application on Thermal insulation
1. Heating and Insulation in the home
An effective way to save energy in the home is to reduce heating costs. In terms of
construction, this can be achieved by:
• building a structure that is free of draughts.
• improving insulation levels
• avoiding large temperature fluctuations by utilising the thermal mass.of
materials.
Building materials providers supply products to assist with all of these measures.
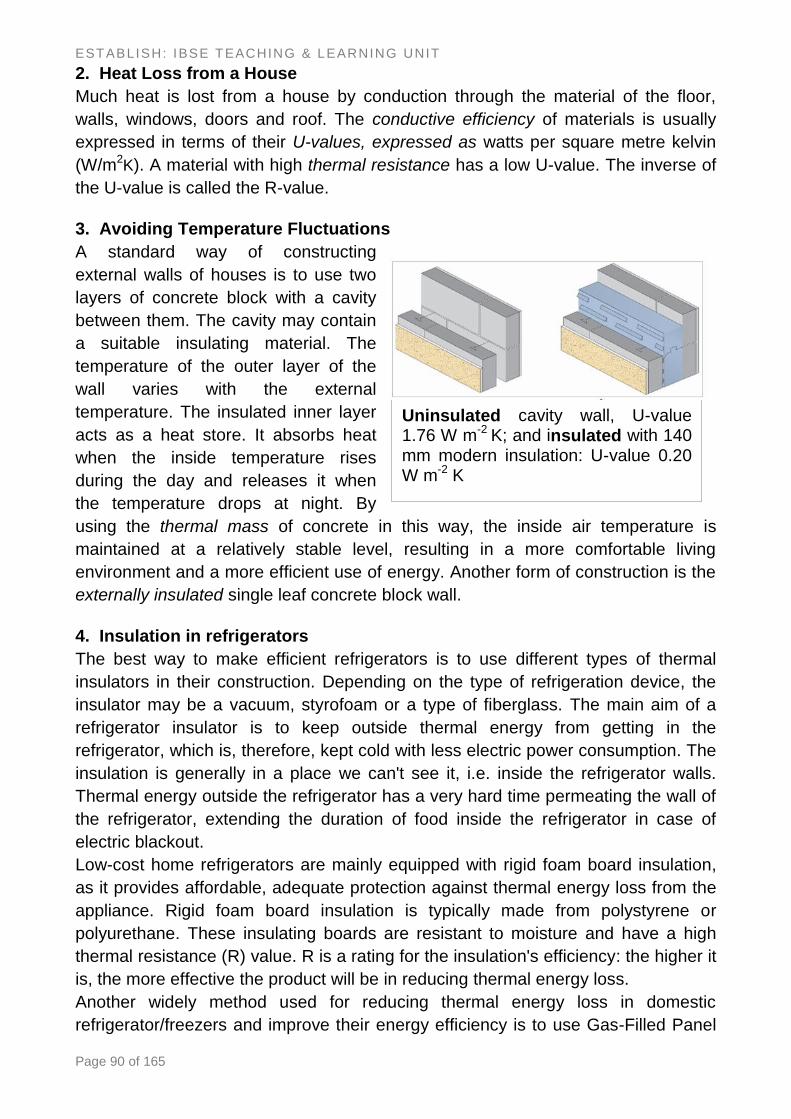
ESTABLISH: IBSE TEACHING & LEARNING UNIT
Page 90 of 165
2. Heat Loss from a House
Much heat is lost from a house by conduction through the material of the floor,
walls, windows, doors and roof. The conductive efficiency of materials is usually
expressed in terms of their U-values, expressed as watts per square metre kelvin
(W/m2K). A material with high thermal resistance has a low U-value. The inverse of
the U-value is called the R-value.
3. Avoiding Temperature Fluctuations
A standard way of constructing
external walls of houses is to use two
layers of concrete block with a cavity
between them. The cavity may contain
a suitable insulating material. The
temperature of the outer layer of the
wall varies with the external
temperature. The insulated inner layer
acts as a heat store. It absorbs heat
when the inside temperature rises
during the day and releases it when
the temperature drops at night. By
using the thermal mass of concrete in this way, the inside air temperature is
maintained at a relatively stable level, resulting in a more comfortable living
environment and a more efficient use of energy. Another form of construction is the
externally insulated single leaf concrete block wall.
4. Insulation in refrigerators
The best way to make efficient refrigerators is to use different types of thermal
insulators in their construction. Depending on the type of refrigeration device, the
insulator may be a vacuum, styrofoam or a type of fiberglass. The main aim of a
refrigerator insulator is to keep outside thermal energy from getting in the
refrigerator, which is, therefore, kept cold with less electric power consumption. The
insulation is generally in a place we can't see it, i.e. inside the refrigerator walls.
Thermal energy outside the refrigerator has a very hard time permeating the wall of
the refrigerator, extending the duration of food inside the refrigerator in case of
electric blackout.
Low-cost home refrigerators are mainly equipped with rigid foam board insulation,
as it provides affordable, adequate protection against thermal energy loss from the
appliance. Rigid foam board insulation is typically made from polystyrene or
polyurethane. These insulating boards are resistant to moisture and have a high
thermal resistance (R) value. R is a rating for the insulation's efficiency: the higher it
is, the more effective the product will be in reducing thermal energy loss.
Another widely method used for reducing thermal energy loss in domestic
refrigerator/freezers and improve their energy efficiency is to use Gas-Filled Panel
Uninsulated cavity wall, U-value 1.76 W m
-2 K; and insulated with 140
mm modern insulation: U-value 0.20 W m
-2 K
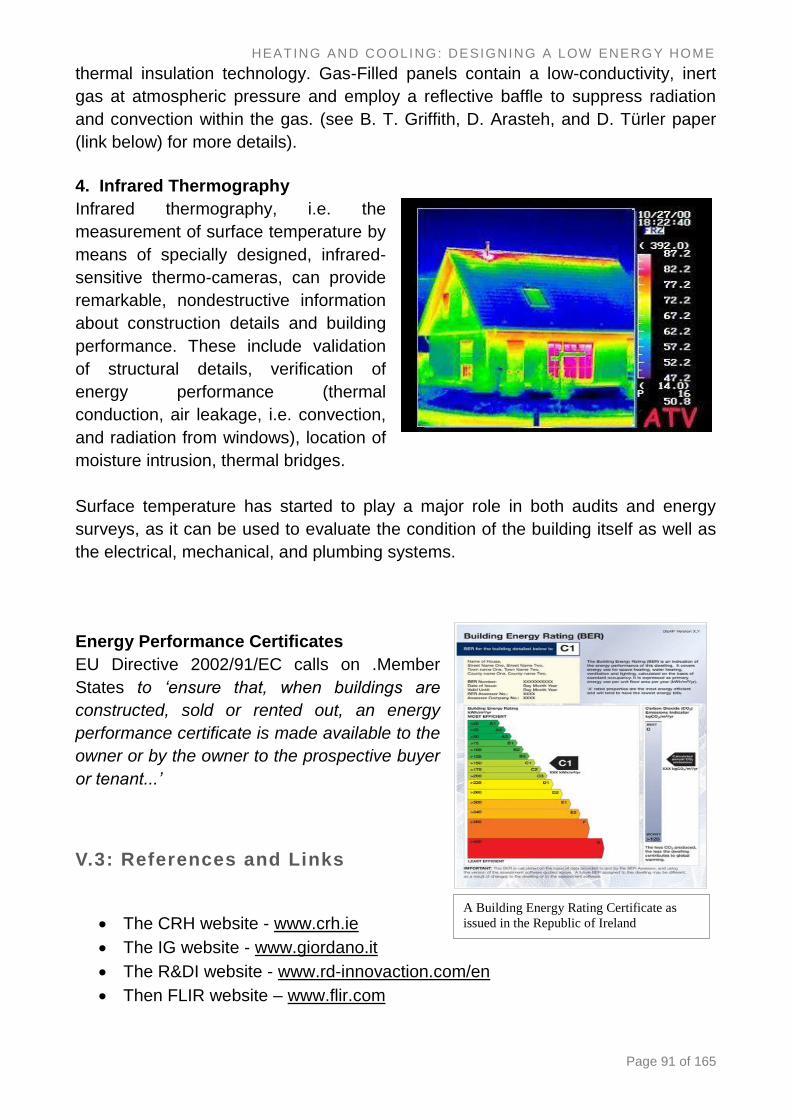
HEATING AND COOLING: DESIGNING A LOW ENERGY HOME
Page 91 of 165
thermal insulation technology. Gas-Filled panels contain a low-conductivity, inert
gas at atmospheric pressure and employ a reflective baffle to suppress radiation
and convection within the gas. (see B. T. Griffith, D. Arasteh, and D. Türler paper
(link below) for more details).
4. Infrared Thermography
Infrared thermography, i.e. the
measurement of surface temperature by
means of specially designed, infrared-
sensitive thermo-cameras, can provide
remarkable, nondestructive information
about construction details and building
performance. These include validation
of structural details, verification of
energy performance (thermal
conduction, air leakage, i.e. convection,
and radiation from windows), location of
moisture intrusion, thermal bridges.
Surface temperature has started to play a major role in both audits and energy
surveys, as it can be used to evaluate the condition of the building itself as well as
the electrical, mechanical, and plumbing systems.
Energy Performance Certificates
EU Directive 2002/91/EC calls on .Member
States to ‘ensure that, when buildings are
constructed, sold or rented out, an energy
performance certificate is made available to the
owner or by the owner to the prospective buyer
or tenant...’
V.3: References and Links
The CRH website - www.crh.ie
The IG website - www.giordano.it
The R&DI website - www.rd-innovaction.com/en
Then FLIR website – www.flir.com
A Building Energy Rating Certificate as
issued in the Republic of Ireland
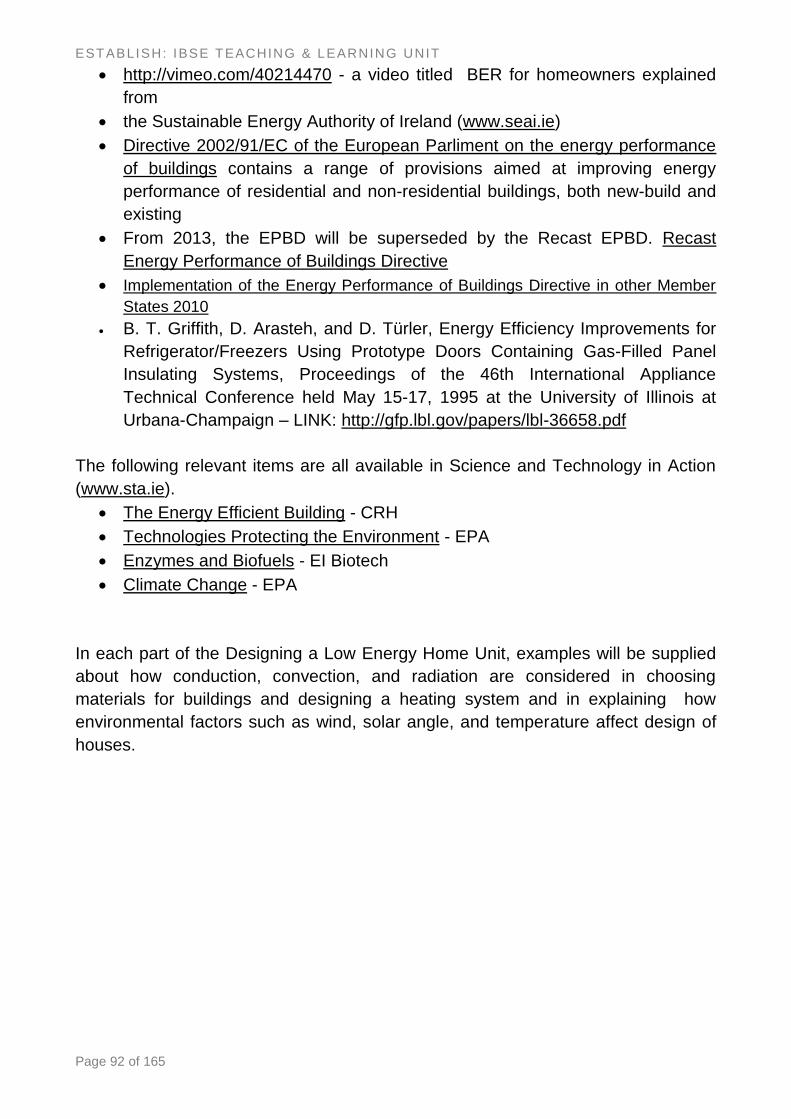
ESTABLISH: IBSE TEACHING & LEARNING UNIT
Page 92 of 165
http://vimeo.com/40214470 - a video titled BER for homeowners explained
from
the Sustainable Energy Authority of Ireland (www.seai.ie)
Directive 2002/91/EC of the European Parliment on the energy performance
of buildings contains a range of provisions aimed at improving energy
performance of residential and non-residential buildings, both new-build and
existing
From 2013, the EPBD will be superseded by the Recast EPBD. Recast
Energy Performance of Buildings Directive
Implementation of the Energy Performance of Buildings Directive in other Member
States 2010
B. T. Griffith, D. Arasteh, and D. Türler, Energy Efficiency Improvements for
Refrigerator/Freezers Using Prototype Doors Containing Gas-Filled Panel
Insulating Systems, Proceedings of the 46th International Appliance
Technical Conference held May 15-17, 1995 at the University of Illinois at
Urbana-Champaign – LINK: http://gfp.lbl.gov/papers/lbl-36658.pdf
The following relevant items are all available in Science and Technology in Action
(www.sta.ie).
The Energy Efficient Building - CRH
Technologies Protecting the Environment - EPA
Enzymes and Biofuels - EI Biotech
Climate Change - EPA
In each part of the Designing a Low Energy Home Unit, examples will be supplied
about how conduction, convection, and radiation are considered in choosing
materials for buildings and designing a heating system and in explaining how
environmental factors such as wind, solar angle, and temperature affect design of
houses.
HEATING AND COOLING: DESIGNING A LOW ENERGY HOME
Page 93 of 165
VI. Learning Path(s)
The learning path is developed through 4 sub-units that face the different aspects of
constructing an energy-efficient scale model house.
Subunit 1
This unit guides students in the construction of a model house and makes explicit
the different factors that contribute in heat dispersion and energy consumption to
keep the house warm. Each factor is analysed in the other sub-units and are
developed around a particular problem that guides the inquiry.
This sub unit introduces basic concepts such as heating/cooling rates, energy
conservation, conduction, convection, and radiation, and engineering elements
such as insulation, glazing, thermal storage, and passive heating and cooling. It
also aims at recalling previous learned concepts of heat, temperature and thermal
equilibrium by taking into account the well-known misconceptions held by students
at this school level.
At the end of this subunit, students should have a basic understanding of some
physical processes, such as how heat transfer occurs between the house and the
environment under different weather conditions.
Students will be involved in constructing a scale model house using a hands-on kit
supplied by the teacher. They will learn to use sensors to measure the heat gain or
loss and evaluate insulation. They will explore different heating and cooling factors
using the tools provided and other low-cost materials on hand. For instance, a light
bulb (covered by an aluminium foil) models the heather, the effects of wind can be
simulated using an electric fan, and sun shining heating by using a lamp .
The subunit involves 3 student learning activities:
Activity 1.1 aimed at the construction of different kinds of house models and at
evaluating the main difficulties in maintain them warm;
Activity 1.2 aimed at analysing the distribution of temperature inside the house
model;
Activity 1.3 aimed at analysing the heating effects of light on the house models.
The following table characterises the three activities from the point of view of the
required type of inquiry and considering the 5E model of the Learning Cycle
(Engage, Explore, Explain, Extend, Evaluate).

ESTABLISH: IBSE TEACHING & LEARNING UNIT
Page 94 of 165
Activity Student Task Inquiry Type E-emphasis
1.1 Discussing and experimenting
how to maintain heat in a
house model
Interactive demonstration
Guided discovery
Engage
Explore
1.2 Experimenting distribution of
temperature inside the house
model
Guided inquiry
Bounded Inquiry
Engage
Explore
Explain
1.3 Hypothesizing and
experimenting the sunshine
effects on the house model
temperature
Guided inquiry
Bounded Inquiry
Open Inquiry is also
possible
Engage
Explore
Extend
Subunit 2
This unit analyses the role of different materials in heat dispersion by developing
the relevant concepts connected with energy transfer through conduction.
This subunit analyses the transfer of thermal energy between regions of matter due
to a temperature gradient. Conduction characterizes the heat flows through the
region of matter itself, as opposed to requiring bulk motion of the matter as in
convection. Conduction takes place in all forms of matter, viz. solids, liquids, and
gases but does not require any bulk motion of matter. However it mainly
characterizes heat transfer in solids, since in liquids and gases convection is the
main process of heat transfer.
OBJECTIVES OF THE SUBUNIT:
To be aware that the nature of material influence transfer of thermal energy between two thermal systems
Students will rank the materials used, according to their thermal conductivity.
Students will use experimental evidence to decide on an everyday problem.
Students will work in groups in order to design and carry out an experimental investigation.
Students will reflect on the purpose and nature of experimental activities they carried out in the unit
The subunit is developed in 2 activities.
The following table characterises the two activities from the point of view of the
required type of inquiry and considering the 5E model of the Learning Cycle.

HEATING AND COOLING: DESIGNING A LOW ENERGY HOME
Page 95 of 165
Activity Student Task Inquiry Type E-emphasis
2.1 Observing ice liquefying in
plates of different materials
Interactive demonstration
Guided discovery
Engage
Explore
2.2 Measuring isolation properties
of different materials
Guided inquiry
Bounded Inquiry
Open Inquiry is also
possible
Engage
Explore
Extend
Subunit 3
This unit analyses energy transfer in fluid material and the main concepts
connected with the convection process.
This subunit analyses the transfer of thermal energy due to a bulk, macroscopic
movement of matter (fluids or gases) from a hot region to a cool region.
The starting point is the analysis of Activity 1.2 of subunit 1 that will be supported by
further observations performed in Activity 3.1 whose objective is to make evident
the currents of hot fluids moving from hot to cold regions.
This activity will end by supplying an explicative model, i.e. a qualitative mechanism
of functioning explaining natural convection on the base of density differences
among fluid volumes at different temperature. Such a model will be used in order to
explain the “stack effect” or the “chimney effect”, where rising hot air pushes
outward at the top of a building and cold air is drawn inward at the bottom.
A second activity (Activity 3.2) will analyse the effect of moving air on surface
temperatures by confronting results of two experiments measuring natural cooling
and forced cooling. Data can be analysed at different levels by characterising
phenomena qualitatively or quantitatively in dependence of the classroom
mathematical knowledge.
The following table characterises the two activities from the point of view of the
required type of inquiry and considering the 5E model of the Learning Cycle.
Activity Student Task Inquiry Type E-emphasis
3.1 Observing convection currents Interactive demonstration
Bounded Inquiry
Engage
Explore
3.2 Experimenting different kinds
of convection
Guided inquiry Engage
Explore
Elaborate
Extend

ESTABLISH: IBSE TEACHING & LEARNING UNIT
Page 96 of 165
Subunit 4
This unit introduces the concept of energy transfer by radiation, analysing the
different effects of solar radiation spectrum.
This subunit analyses the transfer of energy due to radiation and explores thermal
radiation. In dependence of classroom curriculum, the development of activities
here described needs a recall or introduction of the main concepts connected with
electromagnetic radiation. The deepening level of such introduction is dependent
from the knowledge level of the classroom as well as from previous students’
curriculum.
Usually pupils are more familiar with heat transfer by conduction because of their
experiences of everyday-life phenomena. The physical concept of energy
propagation by radiation is introduced to the class usually by reporting the example
of the light radiation travelling from the Sun to the Earth across the empty space,
without any support from conduction and convection, which both need a medium.
This example, even if quite convincing, is not strong enough to persist into the
student imagery of energy propagation, probably because of the absence of any
practical activity which can help the class to directly experience the transfer of
energy by radiation. The following experimental activities are proposed as an
inquiry based learning path aimed at the practical exploration of energy
transmission by thermal radiation.
The main concepts to recall can be synthesised as follows.
Radiation is the common name for electromagnetic energy travelling through
space. It can travel very fast (the light speed c = 2.998 x 10⁸ m/s), also through the
vacuum. It doesn’t need material to travel in. It has many forms, including visible
light, infrared (IR), ultraviolet (UV), X-rays, microwaves, and radio waves. These are
all the same form of energy, just with different frequencies and amounts of energy.
Different frequencies of radiation interact with matter differently and this fact makes
them seem more different to us than they really are. In many everyday situations
we observe bodies heated by radiation gaining thermal energy, which is mostly
transferred by infrared (IR) and visible radiation.
During the development of the subunits, new instruments will be analysed: the
infrared thermometers and cameras.
The starting point is the analysis of Activity 1.3 of subunit 1 that pointed out that
light can warm the walls of our house models and this warming effect is increased if
the wall colour is dark or black.
The first problem to face is that to better measure the heating effects of radiation by
constructing a simple “radiometer” (see Activity 4.1).
Activity 4.2 will measure the heating effect of sun radiation on bodies of different
colours.
Activities 4.3 will show that our radiometers are able to make evident a radiation
different than the visible one and introduce the IR radiation.

HEATING AND COOLING: DESIGNING A LOW ENERGY HOME
Page 97 of 165
One of the last two activities can be chosen by the teacher according to the level of
the classroom.
Activity 4.4 will propose an open inquiry approach to the analysis of IR apparatuses
(video, images, thermometers, etc.)
Activity 4.5 proposes a video were the same experiment is performed in presence
and absence of atmospheric air in order to deepen the knowledge of IR radiation.
The following table characterises the activities from the point of view of the required
type of inquiry and considering the 5E model of the Learning Cycle.
Activity Student Task Inquiry Type E-emphasis
4.1 Build and use home-made
radiometers
Interactive demonstration
Engage
Explore
4.2 Illuminating objects of different
colours.
Interactive demonstration
Guided inquiry
Bounded Inquiry
Engage
Explore
Elaborate
4.3 Radiation from hot and cool
bodies
Guided inquiry
Bounded Inquiry
Open Inquiry is also
possible
Engage
Explore
Extend
4.4 An open Inquiry about Infrared
thermography
Open Inquiry Engage
Explore
Elaborate
Extend
4.5 Analysis of the cooling
processes of a hot body in
different conditions. Cooling in
air and in a vacuum
environment.
Bounded Inquiry
Open Inquiry is also
possible
Engage
Explore
Elaborate
Extend
ESTABLISH: IBSE TEACHING & LEARNING UNIT
Page 98 of 165
I. Assessment
In all Subunits the students’ assessment should include both a theoretical test
(understanding basic concepts) as a practical assignment. Assessments of
students’ understanding of operative procedures such as observation,
hypothesizing, explaining, etc. is also to be taken into account.
Examples of prototypical question are given in each subunit. A practical assignment
could be based on any of the activities in the subunits, or experiments on the
curriculum that are not specifically covered but related to these activities.
An example of a theoretical test is given at the end of this document. It can be
modified for either the younger or older student groupings, and could involve either
qualitatively or quantitatively determining the behaviour of light after interaction with
a number of optical components. In the case of the older groups, values could be
added, for example the wavelength of light or refractive index of the materials.
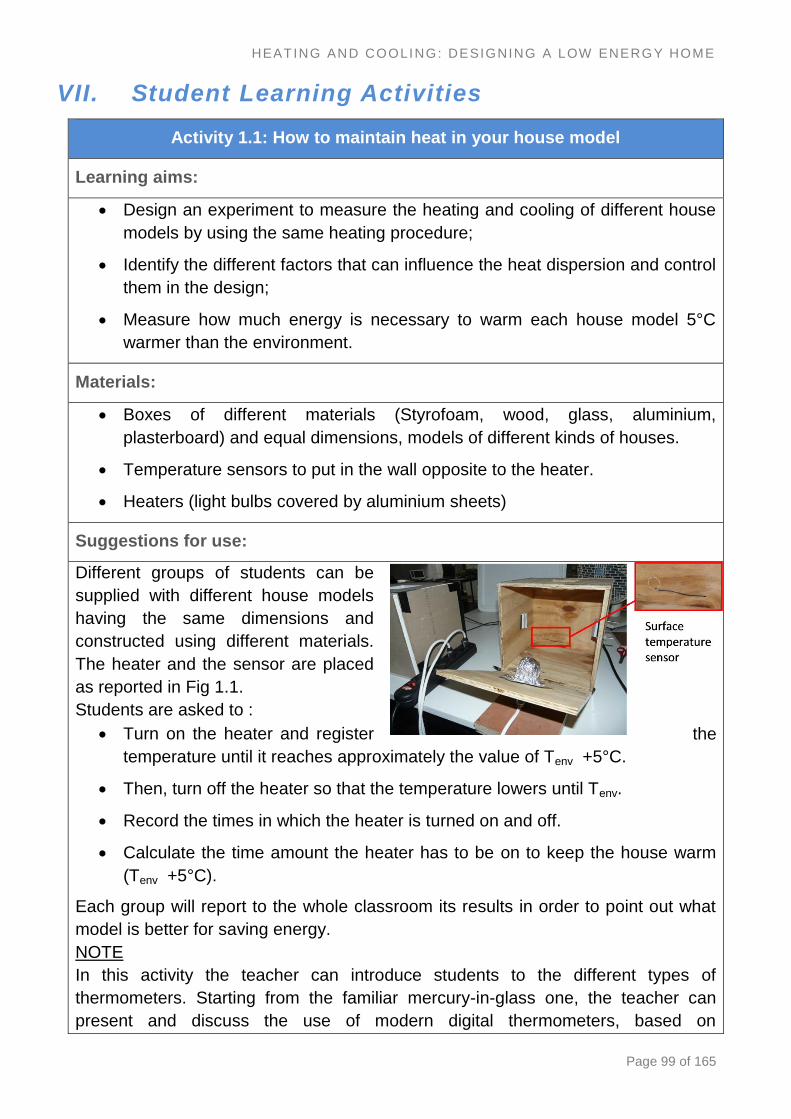
HEATING AND COOLING: DESIGNING A LOW ENERGY HOME
Page 99 of 165
VII. Student Learning Activities
Activity 1.1: How to maintain heat in your house model
Learning aims:
Design an experiment to measure the heating and cooling of different house
models by using the same heating procedure;
Identify the different factors that can influence the heat dispersion and control
them in the design;
Measure how much energy is necessary to warm each house model 5°C
warmer than the environment.
Materials:
Boxes of different materials (Styrofoam, wood, glass, aluminium,
plasterboard) and equal dimensions, models of different kinds of houses.
Temperature sensors to put in the wall opposite to the heater.
Heaters (light bulbs covered by aluminium sheets)
Suggestions for use:
Different groups of students can be
supplied with different house models
having the same dimensions and
constructed using different materials.
The heater and the sensor are placed
as reported in Fig 1.1.
Students are asked to :
Turn on the heater and register the
temperature until it reaches approximately the value of Tenv +5°C.
Then, turn off the heater so that the temperature lowers until Tenv.
Record the times in which the heater is turned on and off.
Calculate the time amount the heater has to be on to keep the house warm
(Tenv +5°C).
Each group will report to the whole classroom its results in order to point out what
model is better for saving energy.
NOTE
In this activity the teacher can introduce students to the different types of
thermometers. Starting from the familiar mercury-in-glass one, the teacher can
present and discuss the use of modern digital thermometers, based on

ESTABLISH: IBSE TEACHING & LEARNING UNIT
Page 100 of 165
semiconductor probes, and infrared ones, that allow measurement of the
temperature of distant objects, without having to have a "physical" contact with it.
Then, microcomputer based temperature sensors can be presented and, in
particular, the surface type one, that will be extensively used in this and in the
following activities.
As a last step, photos of thermograms can be shown, in order to introduce students to thermal/colour analysis, a subject that will be deepened in the fourth subunit.
Possible questions:
How do you think you could reduce the power necessary to maintain heat in
the house?
What would you change about your house to minimize the necessary power
to keep the house warm and why?
Activity 1.2: How is the temperature distributed inside your house model?
Learning aims:
Understanding that variations of temperature are present inside the house in
places at different distances from the heater and at different heights from the
floor.
Materials:
As in Activity 1.1
Two temperature sensors per student
Suggestions for use:
Students are requested to analyse temperature distribution inside the house. A
preliminary discussion will guide students to identify the factors that affect the
temperature in a given position. Distance from the heater and height from the floor
can be identified as relevant factors.
Students are requested to design appropriate experiments that take into account
the control of the relevant variables.
Two sensors at the same distance from the heater and at different height
from the floor
Two sensors at the same distance from the heater and at the same height
from the floor
Possible questions:
What can you say about the efficiency of a heater mounted high on the wall
of a room
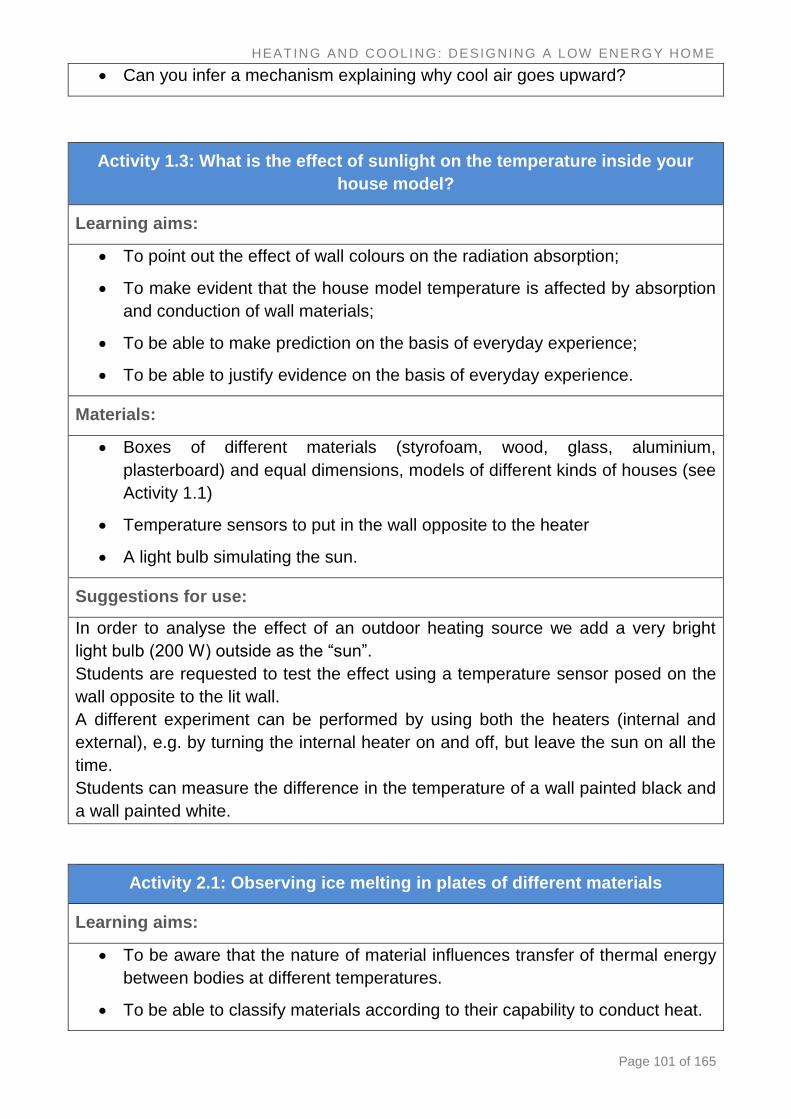
HEATING AND COOLING: DESIGNING A LOW ENERGY HOME
Page 101 of 165
Can you infer a mechanism explaining why cool air goes upward?
Activity 1.3: What is the effect of sunlight on the temperature inside your
house model?
Learning aims:
To point out the effect of wall colours on the radiation absorption;
To make evident that the house model temperature is affected by absorption
and conduction of wall materials;
To be able to make prediction on the basis of everyday experience;
To be able to justify evidence on the basis of everyday experience.
Materials:
Boxes of different materials (styrofoam, wood, glass, aluminium,
plasterboard) and equal dimensions, models of different kinds of houses (see
Activity 1.1)
Temperature sensors to put in the wall opposite to the heater
A light bulb simulating the sun.
Suggestions for use:
In order to analyse the effect of an outdoor heating source we add a very bright
light bulb (200 W) outside as the “sun”.
Students are requested to test the effect using a temperature sensor posed on the
wall opposite to the lit wall.
A different experiment can be performed by using both the heaters (internal and
external), e.g. by turning the internal heater on and off, but leave the sun on all the
time.
Students can measure the difference in the temperature of a wall painted black and
a wall painted white.
Activity 2.1: Observing ice melting in plates of different materials
Learning aims:
To be aware that the nature of material influences transfer of thermal energy
between bodies at different temperatures.
To be able to classify materials according to their capability to conduct heat.
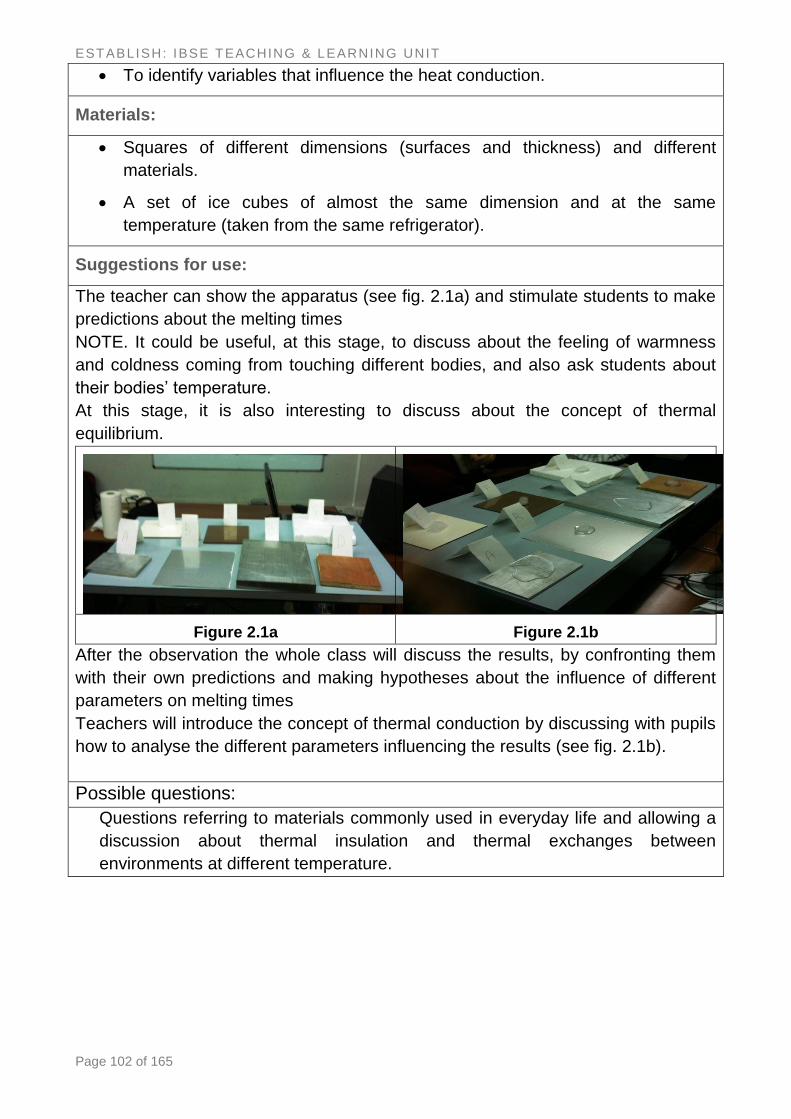
ESTABLISH: IBSE TEACHING & LEARNING UNIT
Page 102 of 165
To identify variables that influence the heat conduction.
Materials:
Squares of different dimensions (surfaces and thickness) and different
materials.
A set of ice cubes of almost the same dimension and at the same
temperature (taken from the same refrigerator).
Suggestions for use:
The teacher can show the apparatus (see fig. 2.1a) and stimulate students to make
predictions about the melting times
NOTE. It could be useful, at this stage, to discuss about the feeling of warmness
and coldness coming from touching different bodies, and also ask students about
their bodies’ temperature.
At this stage, it is also interesting to discuss about the concept of thermal
equilibrium.
Figure 2.1a Figure 2.1b
After the observation the whole class will discuss the results, by confronting them
with their own predictions and making hypotheses about the influence of different
parameters on melting times
Teachers will introduce the concept of thermal conduction by discussing with pupils
how to analyse the different parameters influencing the results (see fig. 2.1b).
Possible questions:
Questions referring to materials commonly used in everyday life and allowing a
discussion about thermal insulation and thermal exchanges between
environments at different temperature.
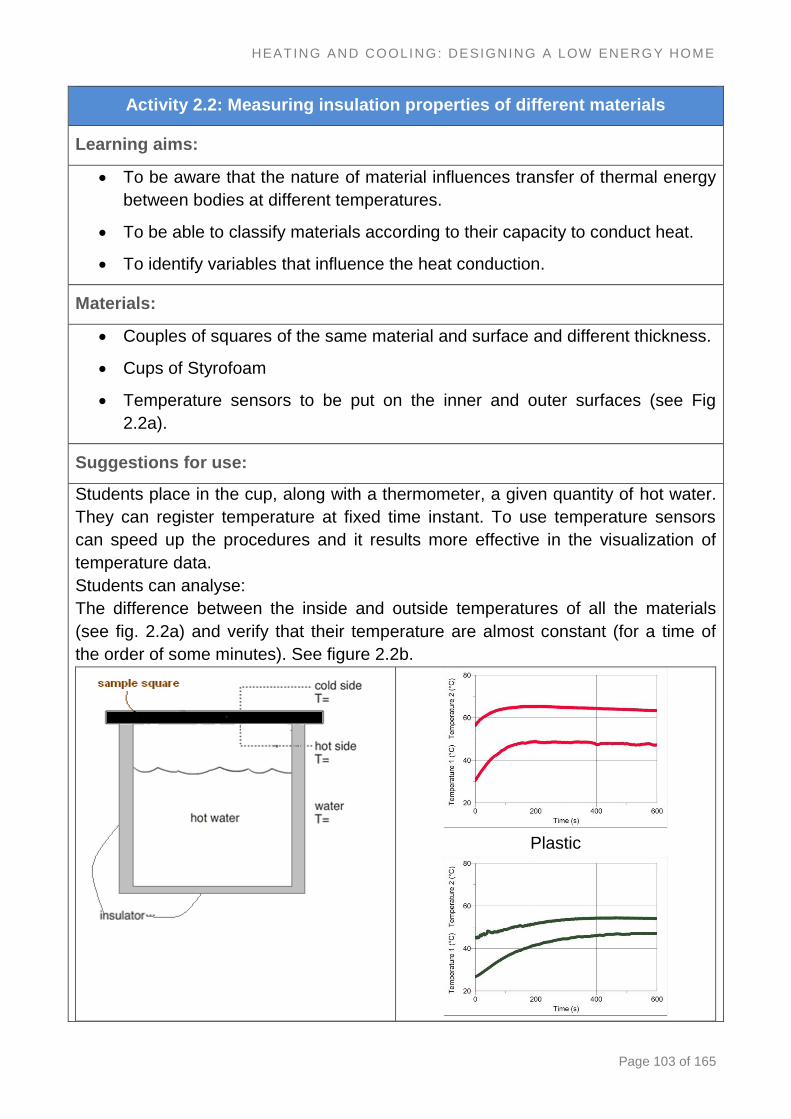
HEATING AND COOLING: DESIGNING A LOW ENERGY HOME
Page 103 of 165
Activity 2.2: Measuring insulation properties of different materials
Learning aims:
To be aware that the nature of material influences transfer of thermal energy
between bodies at different temperatures.
To be able to classify materials according to their capacity to conduct heat.
To identify variables that influence the heat conduction.
Materials:
Couples of squares of the same material and surface and different thickness.
Cups of Styrofoam
Temperature sensors to be put on the inner and outer surfaces (see Fig
2.2a).
Suggestions for use:
Students place in the cup, along with a thermometer, a given quantity of hot water.
They can register temperature at fixed time instant. To use temperature sensors
can speed up the procedures and it results more effective in the visualization of
temperature data.
Students can analyse:
The difference between the inside and outside temperatures of all the materials
(see fig. 2.2a) and verify that their temperature are almost constant (for a time of
the order of some minutes). See figure 2.2b.
Plastic

ESTABLISH: IBSE TEACHING & LEARNING UNIT
Page 104 of 165
Aluminium
Figure 2.2a Figure 2.2b
The whole class can analyse the data of groups that used squares of the same
thickness and order the materials from the greatest to the lowest temperature
difference and define (on the basis of measurements) which material they think is
the best conductor and the best insulator.
Teachers will discuss with pupils how to analyse the different parameters
influencing the results
NOTE
Students compare the results of their experiments to their predictions and proceed
in identifying and justifying any differences.
Possible questions:
Outline differences of materials used in the construction of different kinds of
buildings with respect to thermal insulation.
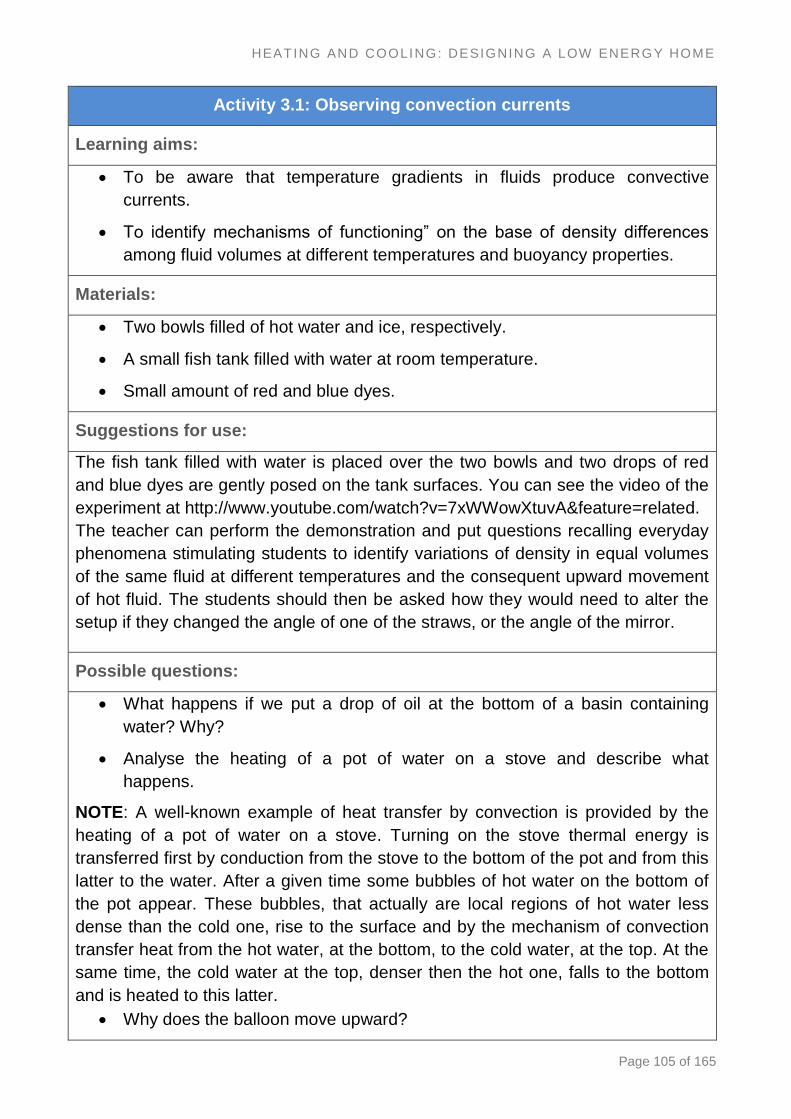
HEATING AND COOLING: DESIGNING A LOW ENERGY HOME
Page 105 of 165
Activity 3.1: Observing convection currents
Learning aims:
To be aware that temperature gradients in fluids produce convective
currents.
To identify mechanisms of functioning” on the base of density differences
among fluid volumes at different temperatures and buoyancy properties.
Materials:
Two bowls filled of hot water and ice, respectively.
A small fish tank filled with water at room temperature.
Small amount of red and blue dyes.
Suggestions for use:
The fish tank filled with water is placed over the two bowls and two drops of red
and blue dyes are gently posed on the tank surfaces. You can see the video of the
experiment at http://www.youtube.com/watch?v=7xWWowXtuvA&feature=related.
The teacher can perform the demonstration and put questions recalling everyday
phenomena stimulating students to identify variations of density in equal volumes
of the same fluid at different temperatures and the consequent upward movement
of hot fluid. The students should then be asked how they would need to alter the
setup if they changed the angle of one of the straws, or the angle of the mirror.
Possible questions:
What happens if we put a drop of oil at the bottom of a basin containing
water? Why?
Analyse the heating of a pot of water on a stove and describe what
happens.
NOTE: A well-known example of heat transfer by convection is provided by the
heating of a pot of water on a stove. Turning on the stove thermal energy is
transferred first by conduction from the stove to the bottom of the pot and from this
latter to the water. After a given time some bubbles of hot water on the bottom of
the pot appear. These bubbles, that actually are local regions of hot water less
dense than the cold one, rise to the surface and by the mechanism of convection
transfer heat from the hot water, at the bottom, to the cold water, at the top. At the
same time, the cold water at the top, denser then the hot one, falls to the bottom
and is heated to this latter.
Why does the balloon move upward?
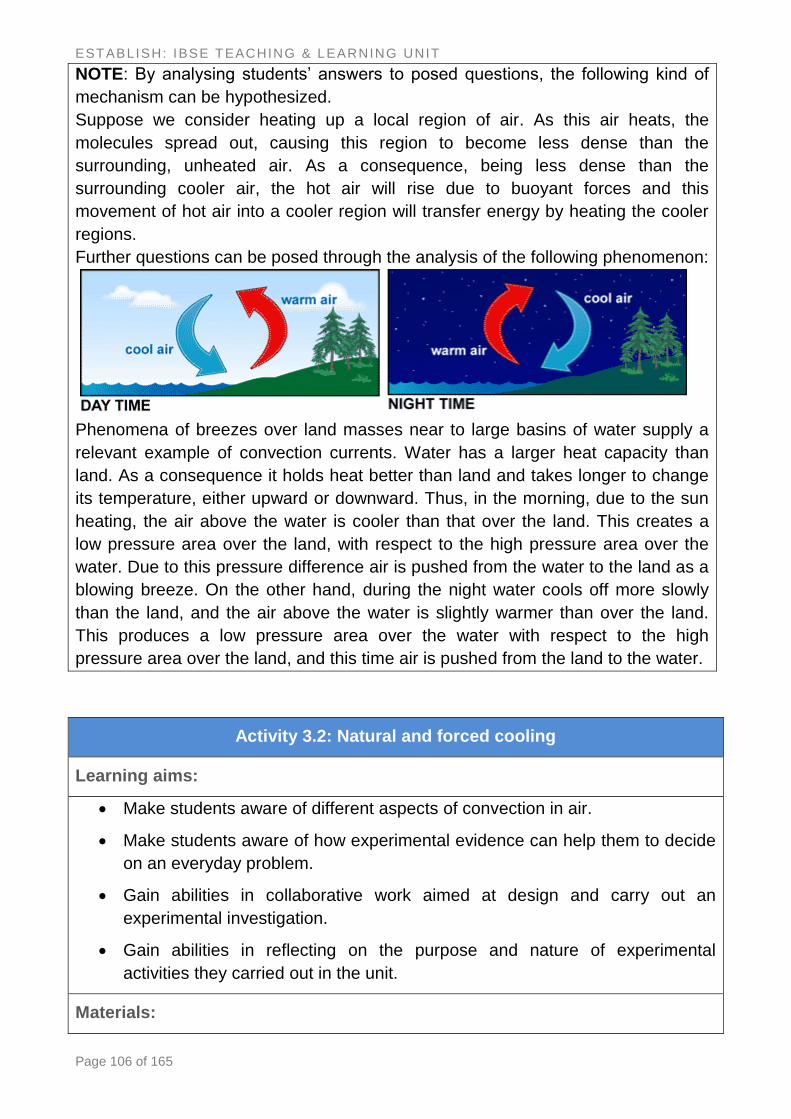
ESTABLISH: IBSE TEACHING & LEARNING UNIT
Page 106 of 165
NOTE: By analysing students’ answers to posed questions, the following kind of
mechanism can be hypothesized.
Suppose we consider heating up a local region of air. As this air heats, the
molecules spread out, causing this region to become less dense than the
surrounding, unheated air. As a consequence, being less dense than the
surrounding cooler air, the hot air will rise due to buoyant forces and this
movement of hot air into a cooler region will transfer energy by heating the cooler
regions.
Further questions can be posed through the analysis of the following phenomenon:
Phenomena of breezes over land masses near to large basins of water supply a
relevant example of convection currents. Water has a larger heat capacity than
land. As a consequence it holds heat better than land and takes longer to change
its temperature, either upward or downward. Thus, in the morning, due to the sun
heating, the air above the water is cooler than that over the land. This creates a
low pressure area over the land, with respect to the high pressure area over the
water. Due to this pressure difference air is pushed from the water to the land as a
blowing breeze. On the other hand, during the night water cools off more slowly
than the land, and the air above the water is slightly warmer than over the land.
This produces a low pressure area over the water with respect to the high
pressure area over the land, and this time air is pushed from the land to the water.
Activity 3.2: Natural and forced cooling
Learning aims:
Make students aware of different aspects of convection in air.
Make students aware of how experimental evidence can help them to decide
on an everyday problem.
Gain abilities in collaborative work aimed at design and carry out an
experimental investigation.
Gain abilities in reflecting on the purpose and nature of experimental
activities they carried out in the unit.
Materials:
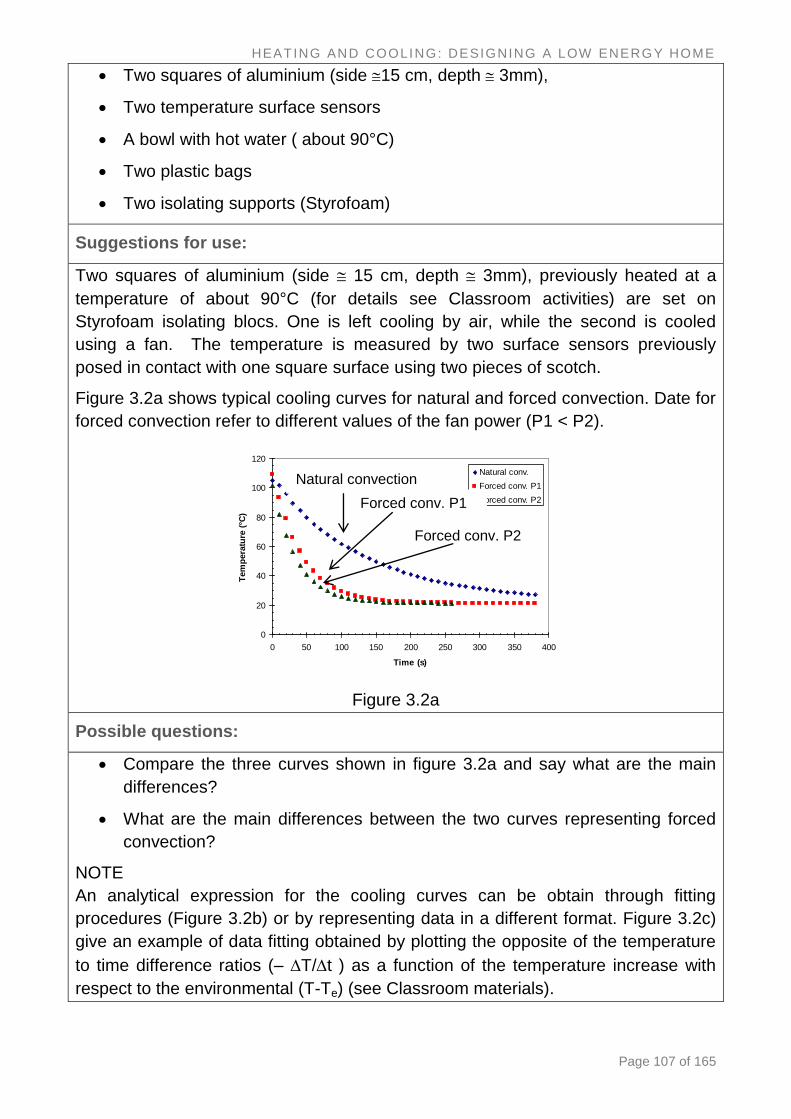
HEATING AND COOLING: DESIGNING A LOW ENERGY HOME
Page 107 of 165
Two squares of aluminium (side 15 cm, depth 3mm),
Two temperature surface sensors
A bowl with hot water ( about 90°C)
Two plastic bags
Two isolating supports (Styrofoam)
Suggestions for use:
Two squares of aluminium (side 15 cm, depth 3mm), previously heated at a
temperature of about 90°C (for details see Classroom activities) are set on
Styrofoam isolating blocs. One is left cooling by air, while the second is cooled
using a fan. The temperature is measured by two surface sensors previously
posed in contact with one square surface using two pieces of scotch.
Figure 3.2a shows typical cooling curves for natural and forced convection. Date for
forced convection refer to different values of the fan power (P1 < P2).
0
20
40
60
80
100
120
0 50 100 150 200 250 300 350 400
Time (s)
Tem
pera
ture
(°C
)
Natural conv.
Forced conv. P1
Forced conv. P2
Figure 3.2a
Possible questions:
Compare the three curves shown in figure 3.2a and say what are the main
differences?
What are the main differences between the two curves representing forced
convection?
NOTE
An analytical expression for the cooling curves can be obtain through fitting
procedures (Figure 3.2b) or by representing data in a different format. Figure 3.2c)
give an example of data fitting obtained by plotting the opposite of the temperature
to time difference ratios (– T/t ) as a function of the temperature increase with
respect to the environmental (T-Te) (see Classroom materials).
Natural convection
Forced conv. P1
Forced conv. P2

ESTABLISH: IBSE TEACHING & LEARNING UNIT
Page 108 of 165
y = 82,835e-0,0071x
R2 = 0,9993
y = 103,78e-0,0257x
R2 = 0,9954
y = 80,394e-0,0283x
R2 = 0,9997
0
20
40
60
80
100
120
0 50 100 150 200 250 300 350 400
Time (s)
(T-T
e)
(°C
)Natural conv.
Forced conv. P1
Forced conv. P2
Exponential fits
Figure 3.2b
y = 0,0075x - 0,0086
R2 = 0,9924
y = 0,021x + 0,0035
R2 = 0,9985
y = 0,0242x + 0,0034
R2 = 0,999
0,0
0,2
0,4
0,6
0,8
1,0
1,2
1,4
1,6
0 20 40 60 80 100
(T-Te) (°C)
-
T/
t (°
C/s
)
Natural conv.
Forced conv. P1
Forced conv. P2
Linear fits
Figure 3.2c
Activity 4.1: Build and use home-made radiometers
Learning aims:
The aim of this activity is to show the evidence of the energy transmission by
thermal radiation, with respect to heat conduction and convection, between a
source of radiation and a home-made radiometer.
Materials:
We assemble three home-made radiometers and carry out our experimental
activities by using the following materials:
N. 3 thin aluminium plates (for example, obtained by cutting some “Pepsi”
cans);
N. 3 surface temperature sensors, interfaced to PC;
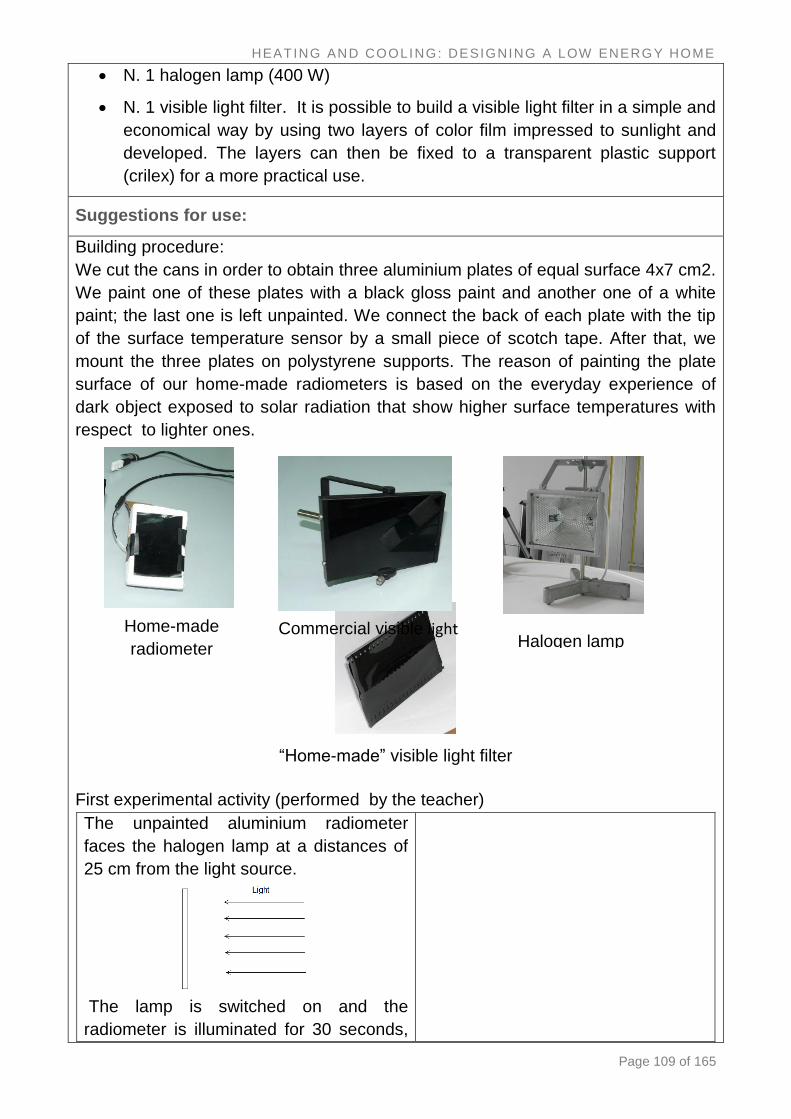
HEATING AND COOLING: DESIGNING A LOW ENERGY HOME
Page 109 of 165
N. 1 halogen lamp (400 W)
N. 1 visible light filter. It is possible to build a visible light filter in a simple and
economical way by using two layers of color film impressed to sunlight and
developed. The layers can then be fixed to a transparent plastic support
(crilex) for a more practical use.
Suggestions for use:
Building procedure:
We cut the cans in order to obtain three aluminium plates of equal surface 4x7 cm2.
We paint one of these plates with a black gloss paint and another one of a white
paint; the last one is left unpainted. We connect the back of each plate with the tip
of the surface temperature sensor by a small piece of scotch tape. After that, we
mount the three plates on polystyrene supports. The reason of painting the plate
surface of our home-made radiometers is based on the everyday experience of
dark object exposed to solar radiation that show higher surface temperatures with
respect to lighter ones.
“Home-made” visible light filter
First experimental activity (performed by the teacher)
The unpainted aluminium radiometer
faces the halogen lamp at a distances of
25 cm from the light source.
The lamp is switched on and the
radiometer is illuminated for 30 seconds,
Home-made
radiometer Halogen lamp Commercial visible light
filter
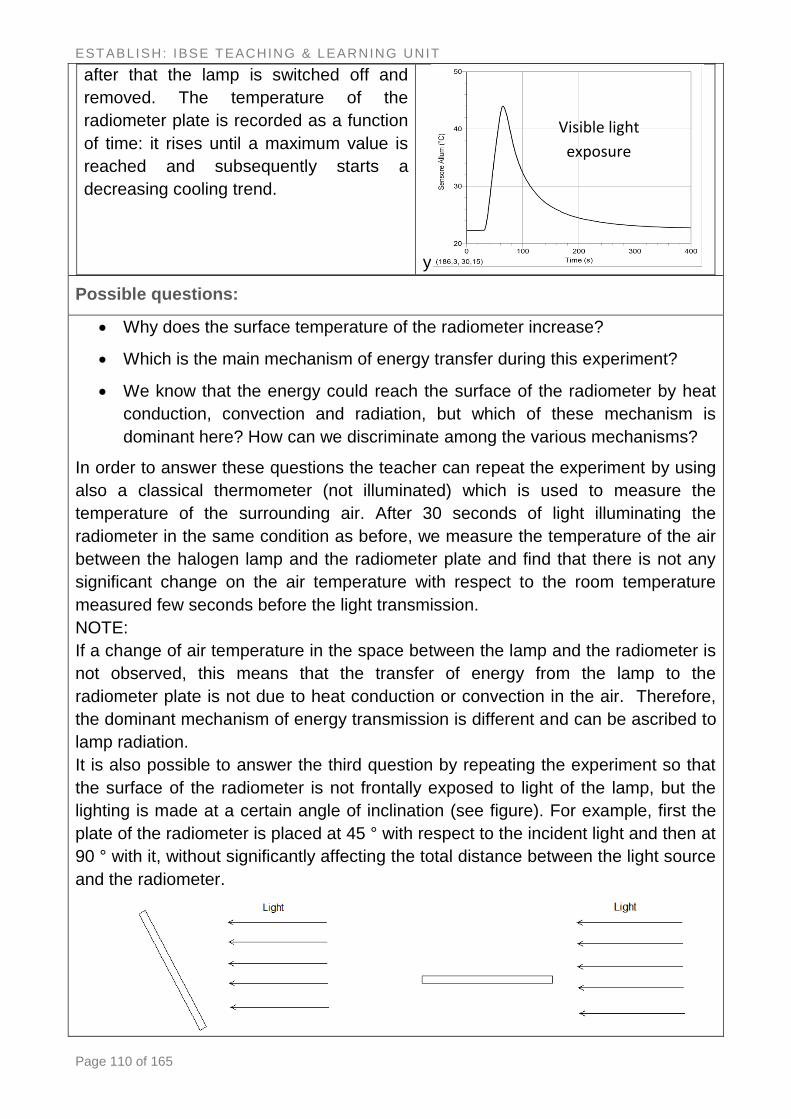
ESTABLISH: IBSE TEACHING & LEARNING UNIT
Page 110 of 165
after that the lamp is switched off and
removed. The temperature of the
radiometer plate is recorded as a function
of time: it rises until a maximum value is
reached and subsequently starts a
decreasing cooling trend.
y
Possible questions:
Why does the surface temperature of the radiometer increase?
Which is the main mechanism of energy transfer during this experiment?
We know that the energy could reach the surface of the radiometer by heat
conduction, convection and radiation, but which of these mechanism is
dominant here? How can we discriminate among the various mechanisms?
In order to answer these questions the teacher can repeat the experiment by using
also a classical thermometer (not illuminated) which is used to measure the
temperature of the surrounding air. After 30 seconds of light illuminating the
radiometer in the same condition as before, we measure the temperature of the air
between the halogen lamp and the radiometer plate and find that there is not any
significant change on the air temperature with respect to the room temperature
measured few seconds before the light transmission.
NOTE:
If a change of air temperature in the space between the lamp and the radiometer is
not observed, this means that the transfer of energy from the lamp to the
radiometer plate is not due to heat conduction or convection in the air. Therefore,
the dominant mechanism of energy transmission is different and can be ascribed to
lamp radiation.
It is also possible to answer the third question by repeating the experiment so that
the surface of the radiometer is not frontally exposed to light of the lamp, but the
lighting is made at a certain angle of inclination (see figure). For example, first the
plate of the radiometer is placed at 45 ° with respect to the incident light and then at
90 ° with it, without significantly affecting the total distance between the light source
and the radiometer.
Visible light
exposure

HEATING AND COOLING: DESIGNING A LOW ENERGY HOME
Page 111 of 165
The experiment will show that the greater the angle between the surface of the
radiometer and the incident light, the lower the temperature change detected by the
radiometer. If the heating was to be ascribed to conduction through the air, there
should be no significant difference between the various cases of inclination of the
radiometer, while in case of irradiation the angle formed between the radiometer
and the incident light should critically influence the variation of temperature
detected by the radiometer, as it happens.
The temperature increase of object exposed to solar light is a well known
phenomenon. We already know that the solar light propagates through empty
space and heats up the atmosphere and the objects on the Earth surface.
What happens if we eliminate the visible component of the radiation emitted
by the lamp?
In order to further explore the transmission of energy by thermal radiation the
teacher can repeat the same experiment as before, but now filtering the visible light
incoming on the radiometer plate. An increase of the radiometer surface
temperature, even in the case of total absence of visible light, is evident.
The temperature increase and the following cooling trend is recorded as a function
of time and compared with that observed in the presence of light. The maximum
value of the temperature reached in this latter case is lower than the one measured
without filter (see figure).
In order to further explore the
transmission of energy by thermal
radiation the teacher can repeat the
same experiment as before, but now
filtering the visible light incoming on
the radiometer plate. An increase of
the radiometer surface temperature,
even in the case of total absence of
visible light, is evident.
The temperature increase and the
following cooling trend is recorded as
a function of time and compared with
that observed in the presence of
light. The maximum value of the
temperature reached in this latter
case is lower than the one measured
without filter (see figure).
Questions:
In this case the light is absent, what is now transmitting the energy?”
The teacher can invite some students to experience this “invisible radiation” by
Visible light filtered
Temperature
without filtering
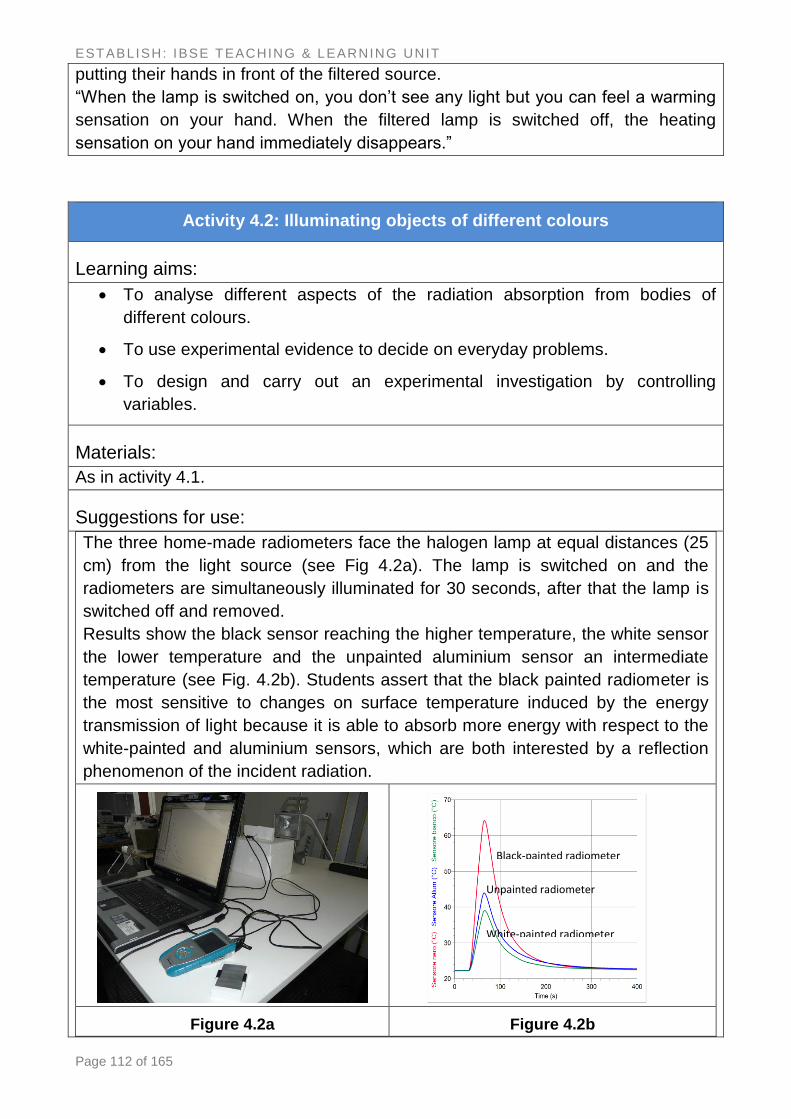
ESTABLISH: IBSE TEACHING & LEARNING UNIT
Page 112 of 165
putting their hands in front of the filtered source.
“When the lamp is switched on, you don’t see any light but you can feel a warming
sensation on your hand. When the filtered lamp is switched off, the heating
sensation on your hand immediately disappears.”
Activity 4.2: Illuminating objects of different colours
Learning aims:
To analyse different aspects of the radiation absorption from bodies of
different colours.
To use experimental evidence to decide on everyday problems.
To design and carry out an experimental investigation by controlling
variables.
Materials:
As in activity 4.1.
Suggestions for use:
The three home-made radiometers face the halogen lamp at equal distances (25
cm) from the light source (see Fig 4.2a). The lamp is switched on and the
radiometers are simultaneously illuminated for 30 seconds, after that the lamp is
switched off and removed.
Results show the black sensor reaching the higher temperature, the white sensor
the lower temperature and the unpainted aluminium sensor an intermediate
temperature (see Fig. 4.2b). Students assert that the black painted radiometer is
the most sensitive to changes on surface temperature induced by the energy
transmission of light because it is able to absorb more energy with respect to the
white-painted and aluminium sensors, which are both interested by a reflection
phenomenon of the incident radiation.
Figure 4.2a Figure 4.2b
Black-painted radiometer
Unpainted radiometer
White-painted radiometer
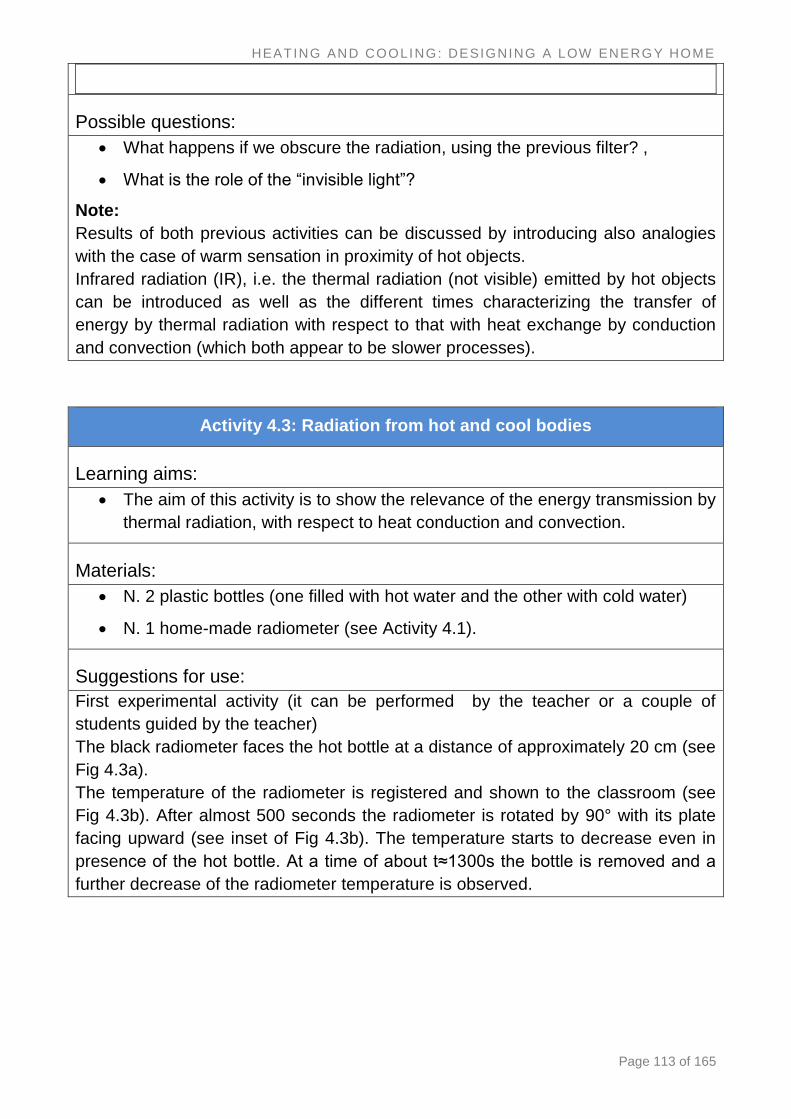
HEATING AND COOLING: DESIGNING A LOW ENERGY HOME
Page 113 of 165
Possible questions:
What happens if we obscure the radiation, using the previous filter? ,
What is the role of the “invisible light”?
Note:
Results of both previous activities can be discussed by introducing also analogies
with the case of warm sensation in proximity of hot objects.
Infrared radiation (IR), i.e. the thermal radiation (not visible) emitted by hot objects
can be introduced as well as the different times characterizing the transfer of
energy by thermal radiation with respect to that with heat exchange by conduction
and convection (which both appear to be slower processes).
Activity 4.3: Radiation from hot and cool bodies
Learning aims:
The aim of this activity is to show the relevance of the energy transmission by
thermal radiation, with respect to heat conduction and convection.
Materials:
N. 2 plastic bottles (one filled with hot water and the other with cold water)
N. 1 home-made radiometer (see Activity 4.1).
Suggestions for use:
First experimental activity (it can be performed by the teacher or a couple of
students guided by the teacher)
The black radiometer faces the hot bottle at a distance of approximately 20 cm (see
Fig 4.3a).
The temperature of the radiometer is registered and shown to the classroom (see
Fig 4.3b). After almost 500 seconds the radiometer is rotated by 90° with its plate
facing upward (see inset of Fig 4.3b). The temperature starts to decrease even in
presence of the hot bottle. At a time of about t≈1300s the bottle is removed and a
further decrease of the radiometer temperature is observed.
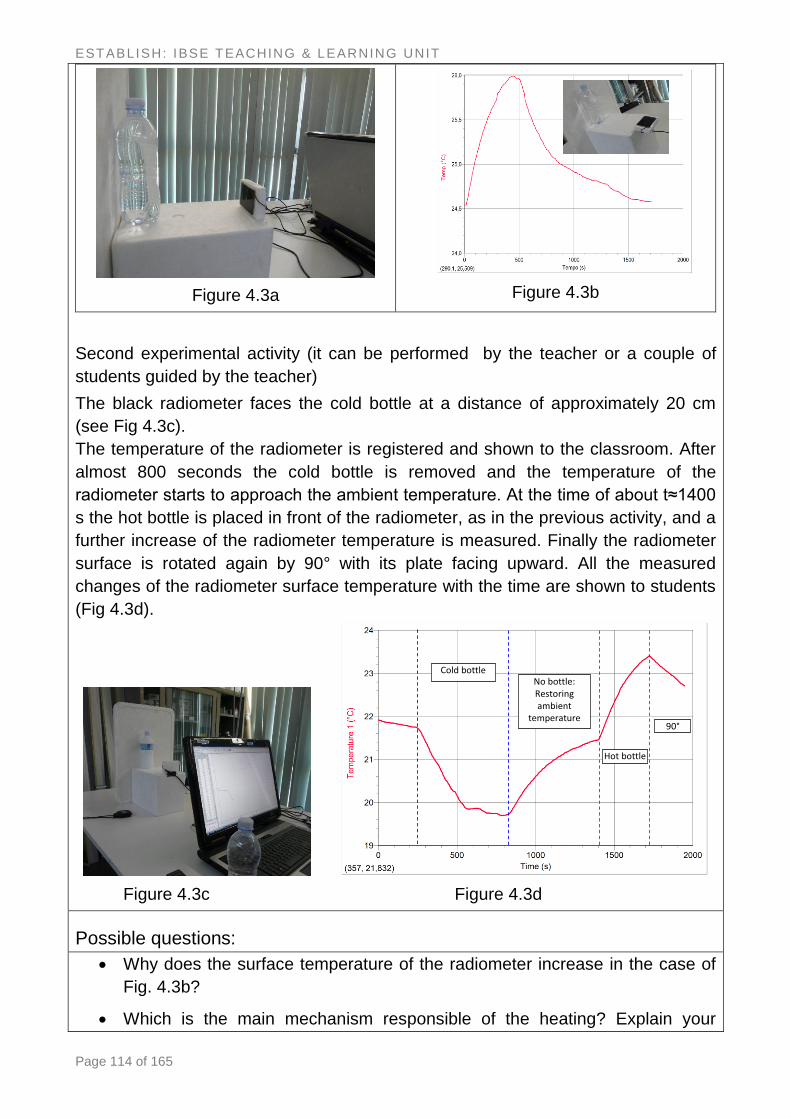
ESTABLISH: IBSE TEACHING & LEARNING UNIT
Page 114 of 165
Figure 4.3a
Figure 4.3b
Second experimental activity (it can be performed by the teacher or a couple of
students guided by the teacher)
The black radiometer faces the cold bottle at a distance of approximately 20 cm
(see Fig 4.3c).
The temperature of the radiometer is registered and shown to the classroom. After
almost 800 seconds the cold bottle is removed and the temperature of the
radiometer starts to approach the ambient temperature. At the time of about t≈1400
s the hot bottle is placed in front of the radiometer, as in the previous activity, and a
further increase of the radiometer temperature is measured. Finally the radiometer
surface is rotated again by 90° with its plate facing upward. All the measured
changes of the radiometer surface temperature with the time are shown to students
(Fig 4.3d).
Cold bottle
Hot bottle
90°
No bottle: Restoring ambient
temperature
Figure 4.3c Figure 4.3d
Possible questions:
Why does the surface temperature of the radiometer increase in the case of
Fig. 4.3b?
Which is the main mechanism responsible of the heating? Explain your
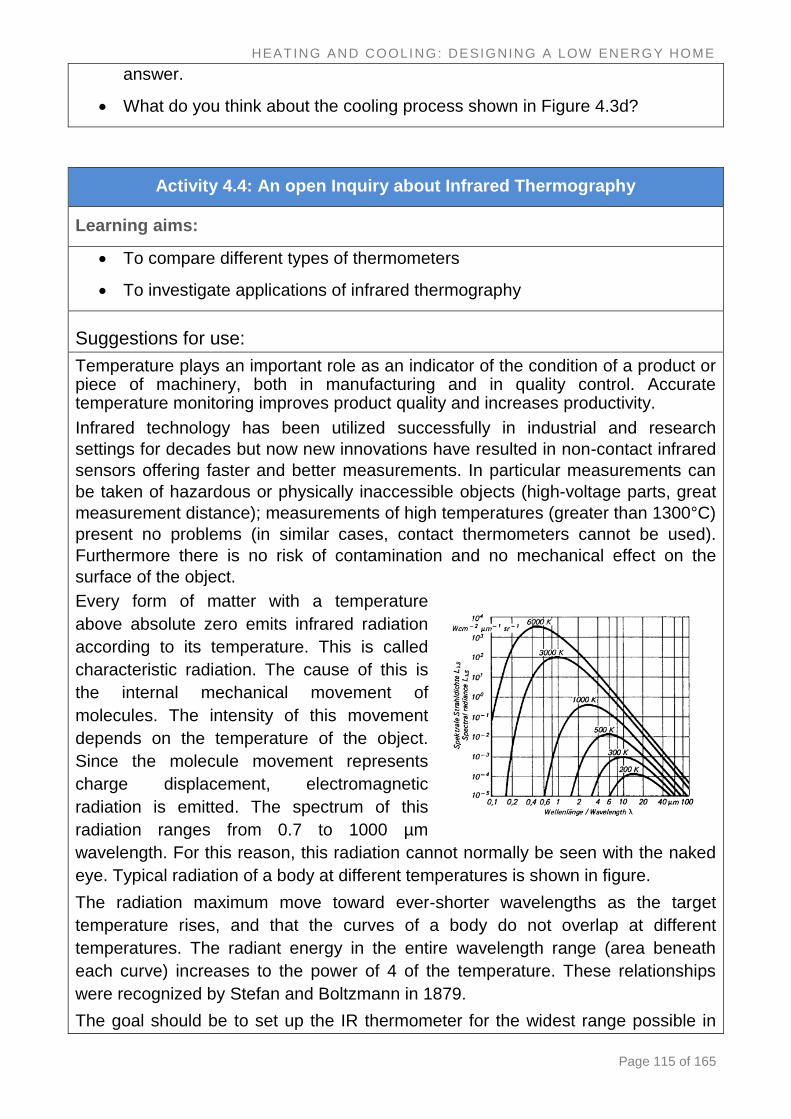
HEATING AND COOLING: DESIGNING A LOW ENERGY HOME
Page 115 of 165
answer.
What do you think about the cooling process shown in Figure 4.3d?
Activity 4.4: An open Inquiry about Infrared Thermography
Learning aims:
To compare different types of thermometers
To investigate applications of infrared thermography
Suggestions for use:
Temperature plays an important role as an indicator of the condition of a product or piece of machinery, both in manufacturing and in quality control. Accurate temperature monitoring improves product quality and increases productivity.
Infrared technology has been utilized successfully in industrial and research
settings for decades but now new innovations have resulted in non-contact infrared
sensors offering faster and better measurements. In particular measurements can
be taken of hazardous or physically inaccessible objects (high-voltage parts, great
measurement distance); measurements of high temperatures (greater than 1300°C)
present no problems (in similar cases, contact thermometers cannot be used).
Furthermore there is no risk of contamination and no mechanical effect on the
surface of the object.
Every form of matter with a temperature
above absolute zero emits infrared radiation
according to its temperature. This is called
characteristic radiation. The cause of this is
the internal mechanical movement of
molecules. The intensity of this movement
depends on the temperature of the object.
Since the molecule movement represents
charge displacement, electromagnetic
radiation is emitted. The spectrum of this
radiation ranges from 0.7 to 1000 µm
wavelength. For this reason, this radiation cannot normally be seen with the naked
eye. Typical radiation of a body at different temperatures is shown in figure.
The radiation maximum move toward ever-shorter wavelengths as the target
temperature rises, and that the curves of a body do not overlap at different
temperatures. The radiant energy in the entire wavelength range (area beneath
each curve) increases to the power of 4 of the temperature. These relationships
were recognized by Stefan and Boltzmann in 1879.
The goal should be to set up the IR thermometer for the widest range possible in
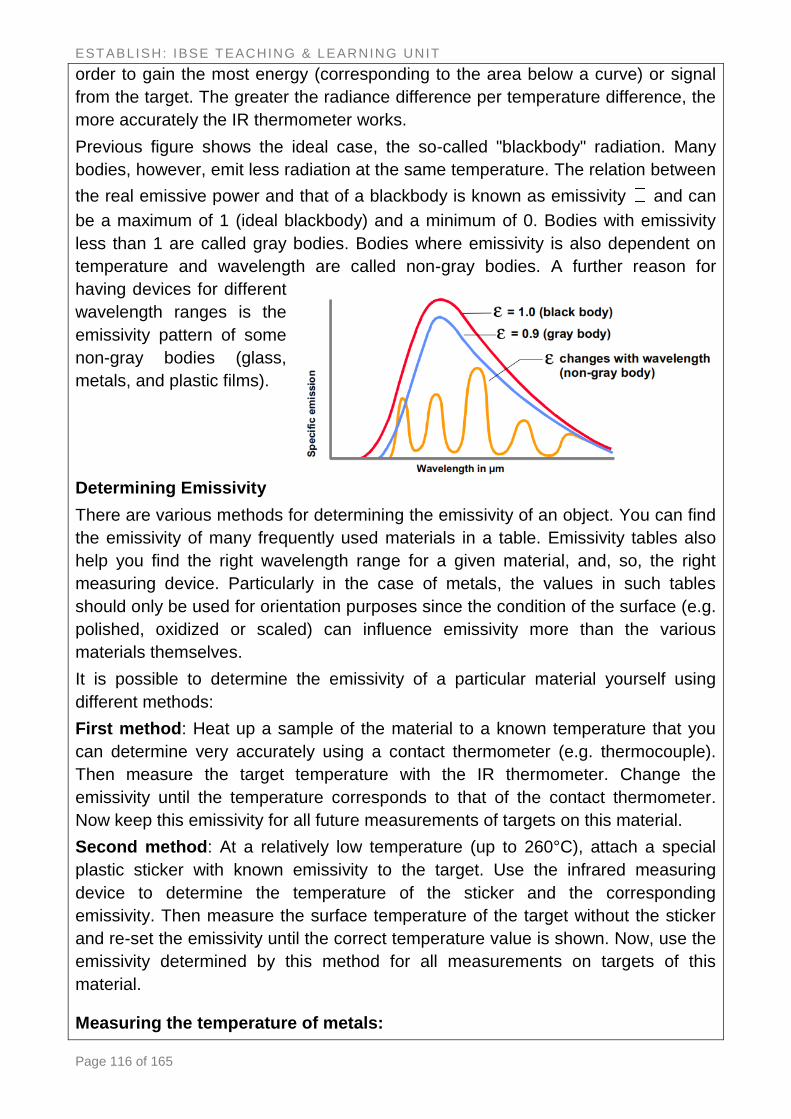
ESTABLISH: IBSE TEACHING & LEARNING UNIT
Page 116 of 165
order to gain the most energy (corresponding to the area below a curve) or signal
from the target. The greater the radiance difference per temperature difference, the
more accurately the IR thermometer works.
Previous figure shows the ideal case, the so-called "blackbody" radiation. Many
bodies, however, emit less radiation at the same temperature. The relation between
the real emissive power and that of a blackbody is known as emissivity and can
be a maximum of 1 (ideal blackbody) and a minimum of 0. Bodies with emissivity
less than 1 are called gray bodies. Bodies where emissivity is also dependent on
temperature and wavelength are called non-gray bodies. A further reason for
having devices for different
wavelength ranges is the
emissivity pattern of some
non-gray bodies (glass,
metals, and plastic films).
Determining Emissivity
There are various methods for determining the emissivity of an object. You can find
the emissivity of many frequently used materials in a table. Emissivity tables also
help you find the right wavelength range for a given material, and, so, the right
measuring device. Particularly in the case of metals, the values in such tables
should only be used for orientation purposes since the condition of the surface (e.g.
polished, oxidized or scaled) can influence emissivity more than the various
materials themselves.
It is possible to determine the emissivity of a particular material yourself using
different methods:
First method: Heat up a sample of the material to a known temperature that you
can determine very accurately using a contact thermometer (e.g. thermocouple).
Then measure the target temperature with the IR thermometer. Change the
emissivity until the temperature corresponds to that of the contact thermometer.
Now keep this emissivity for all future measurements of targets on this material.
Second method: At a relatively low temperature (up to 260°C), attach a special
plastic sticker with known emissivity to the target. Use the infrared measuring
device to determine the temperature of the sticker and the corresponding
emissivity. Then measure the surface temperature of the target without the sticker
and re-set the emissivity until the correct temperature value is shown. Now, use the
emissivity determined by this method for all measurements on targets of this
material.
Measuring the temperature of metals:
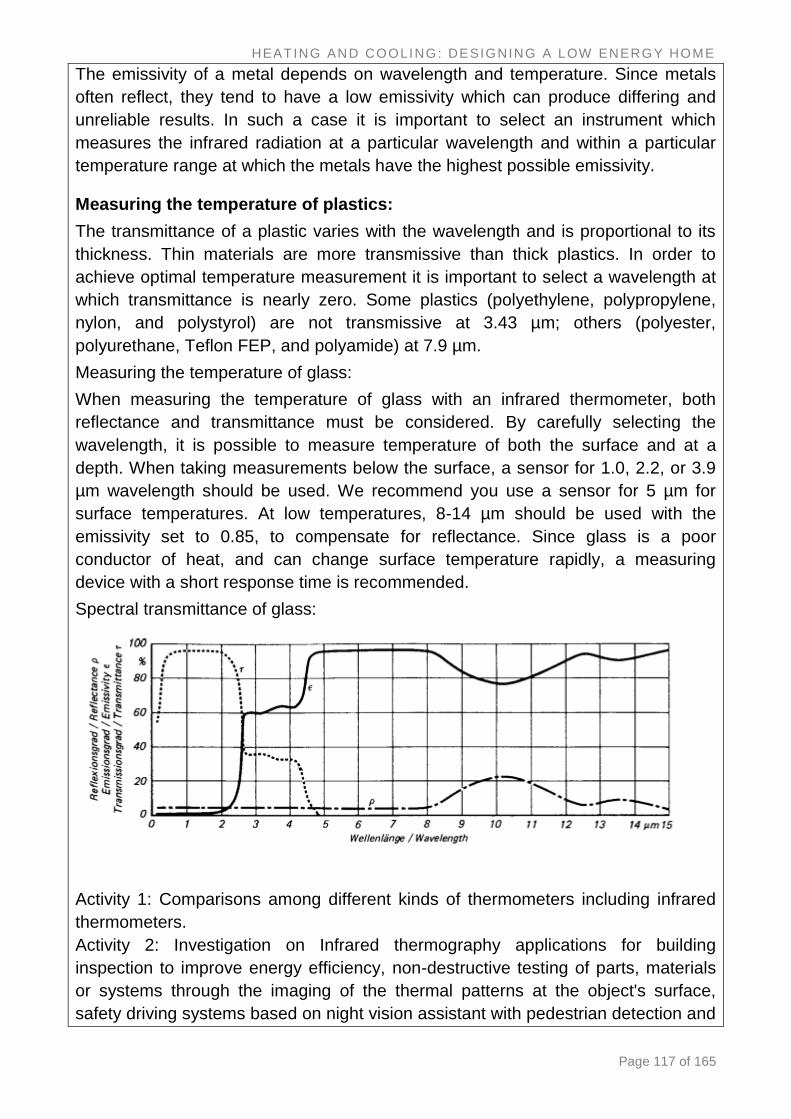
HEATING AND COOLING: DESIGNING A LOW ENERGY HOME
Page 117 of 165
The emissivity of a metal depends on wavelength and temperature. Since metals
often reflect, they tend to have a low emissivity which can produce differing and
unreliable results. In such a case it is important to select an instrument which
measures the infrared radiation at a particular wavelength and within a particular
temperature range at which the metals have the highest possible emissivity.
Measuring the temperature of plastics:
The transmittance of a plastic varies with the wavelength and is proportional to its
thickness. Thin materials are more transmissive than thick plastics. In order to
achieve optimal temperature measurement it is important to select a wavelength at
which transmittance is nearly zero. Some plastics (polyethylene, polypropylene,
nylon, and polystyrol) are not transmissive at 3.43 µm; others (polyester,
polyurethane, Teflon FEP, and polyamide) at 7.9 µm.
Measuring the temperature of glass:
When measuring the temperature of glass with an infrared thermometer, both
reflectance and transmittance must be considered. By carefully selecting the
wavelength, it is possible to measure temperature of both the surface and at a
depth. When taking measurements below the surface, a sensor for 1.0, 2.2, or 3.9
µm wavelength should be used. We recommend you use a sensor for 5 µm for
surface temperatures. At low temperatures, 8-14 µm should be used with the
emissivity set to 0.85, to compensate for reflectance. Since glass is a poor
conductor of heat, and can change surface temperature rapidly, a measuring
device with a short response time is recommended.
Spectral transmittance of glass:
Activity 1: Comparisons among different kinds of thermometers including infrared
thermometers.
Activity 2: Investigation on Infrared thermography applications for building
inspection to improve energy efficiency, non-destructive testing of parts, materials
or systems through the imaging of the thermal patterns at the object's surface,
safety driving systems based on night vision assistant with pedestrian detection and

ESTABLISH: IBSE TEACHING & LEARNING UNIT
Page 118 of 165
warning, searching the darkness for missing people. Analysis of Infrared images
and inferences about their thermal conditions.
(See the slideshow at www.uop-perg.unipa.it/establish/videoIR1_eng2.wmv )
Activity 4.5: Analysis of the cooling processes of an hot body in different
conditions. Cooling in air and in a vacuum environment
Learning aims:
The aim of this activity is to study the way a body cools in different
environmental situations.
Materials:
A 150 W, 10W ceramic resistor.
A K type Thermocouple;
Transducer voltage - temperature module for thermocouple (for example
Fluke 80TK already prepared for type K thermocouple);
Multimeter with a resolution of at least 0.1 mV in d.c.;
Electrical cables;
DC 40 V power supply
Bell vacuum glass;
Vacuum grease;
Rubber hose vacuum;
Rotary vacuum pump;
Pressure gauge;
PC software for data acquisition (for example, LabView, Coach, LoggerPro,
DataMate)
Suggestions for use:
The analysis of heating and cooling in different environment conditions is
performed by using a ceramic heating element (see figure 4.5a).
Figure 4.5a

HEATING AND COOLING: DESIGNING A LOW ENERGY HOME
Page 119 of 165
As a first step, the resistance is secured to a rigid support set on a Teflon base,
where all the electrical connections (rigid wires) that are necessary both to the
heating of the resistance and the reading of the temperature values are also
anchored (see Fig. 4.5b and Fig. 4.5c).
Figure 4.5b Figure 4.5c
As a second step, the edge of a vacuum bell is greased using vacuum grease, so
that it can adhere well to the base (generally a glass disk), eliminating all the
inevitable roughness that would not allow a good seal of the vacuum.
Figure 4.5d
The resistance is then enclosed into the bell which is resting on a base which in
turn is resting on a metal platform in order to provide high rigidity.
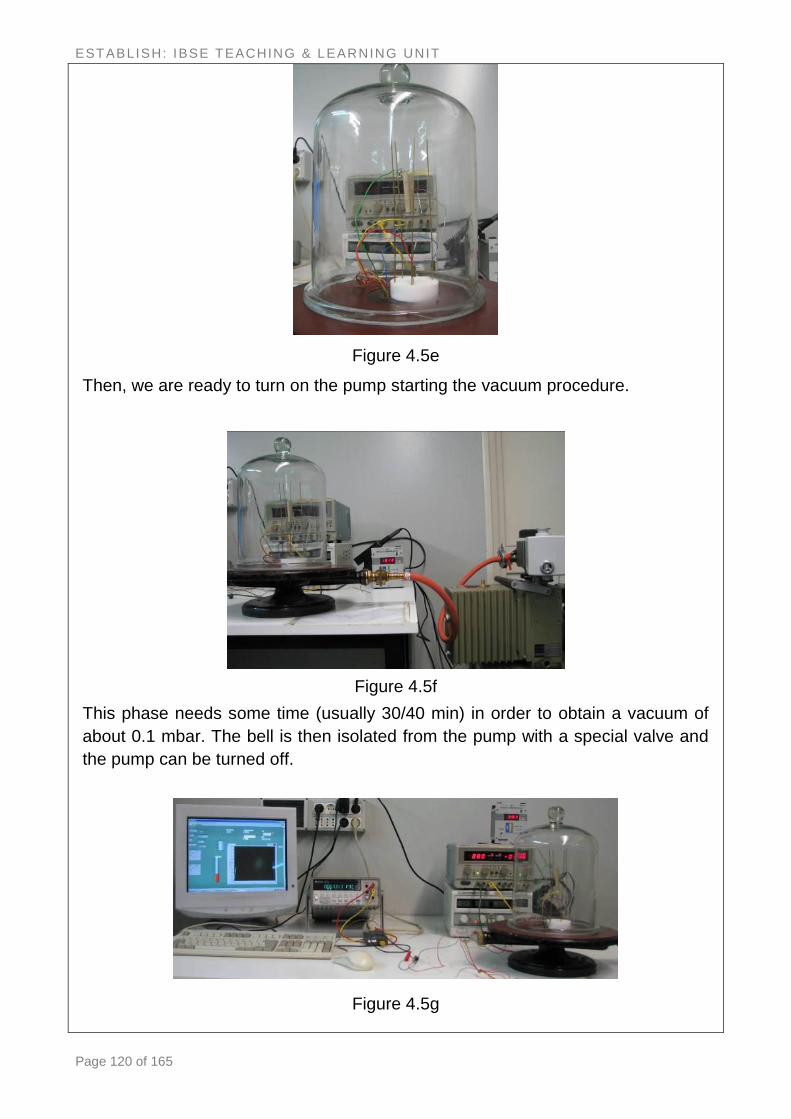
ESTABLISH: IBSE TEACHING & LEARNING UNIT
Page 120 of 165
Figure 4.5e
Then, we are ready to turn on the pump starting the vacuum procedure.
Figure 4.5f
This phase needs some time (usually 30/40 min) in order to obtain a vacuum of
about 0.1 mbar. The bell is then isolated from the pump with a special valve and
the pump can be turned off.
Figure 4.5g
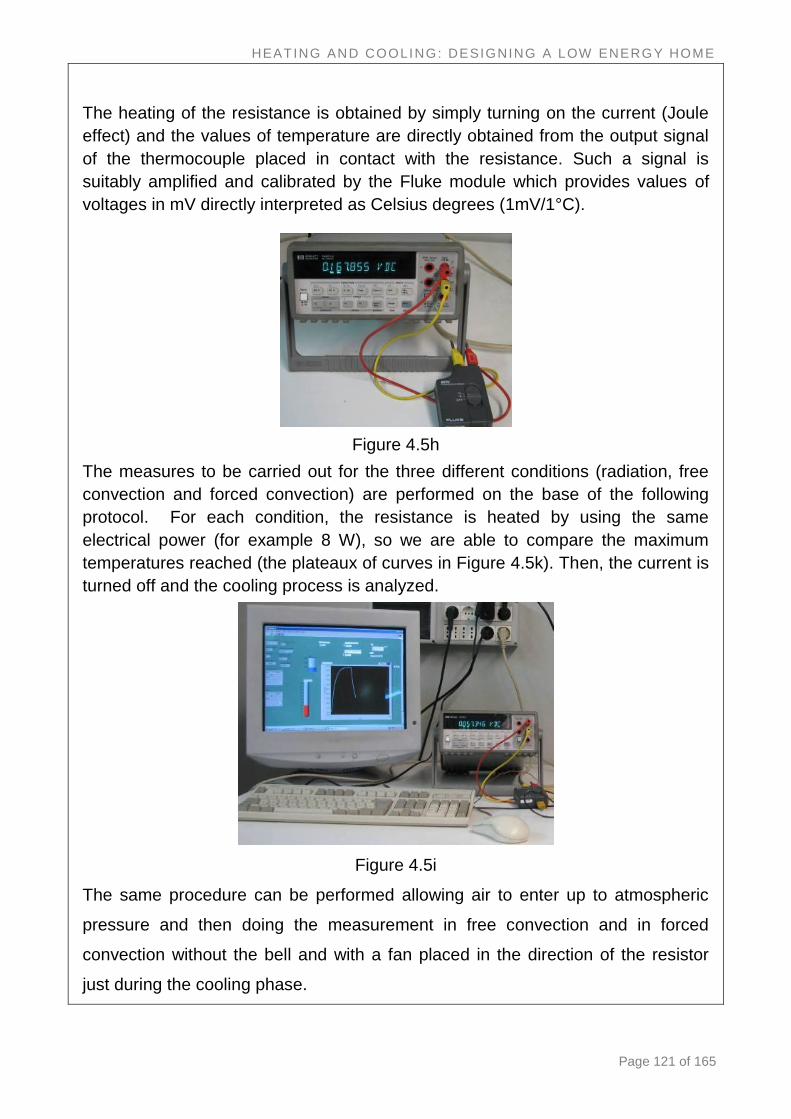
HEATING AND COOLING: DESIGNING A LOW ENERGY HOME
Page 121 of 165
The heating of the resistance is obtained by simply turning on the current (Joule
effect) and the values of temperature are directly obtained from the output signal
of the thermocouple placed in contact with the resistance. Such a signal is
suitably amplified and calibrated by the Fluke module which provides values of
voltages in mV directly interpreted as Celsius degrees (1mV/1°C).
Figure 4.5h
The measures to be carried out for the three different conditions (radiation, free
convection and forced convection) are performed on the base of the following
protocol. For each condition, the resistance is heated by using the same
electrical power (for example 8 W), so we are able to compare the maximum
temperatures reached (the plateaux of curves in Figure 4.5k). Then, the current is
turned off and the cooling process is analyzed.
Figure 4.5i
The same procedure can be performed allowing air to enter up to atmospheric
pressure and then doing the measurement in free convection and in forced
convection without the bell and with a fan placed in the direction of the resistor
just during the cooling phase.
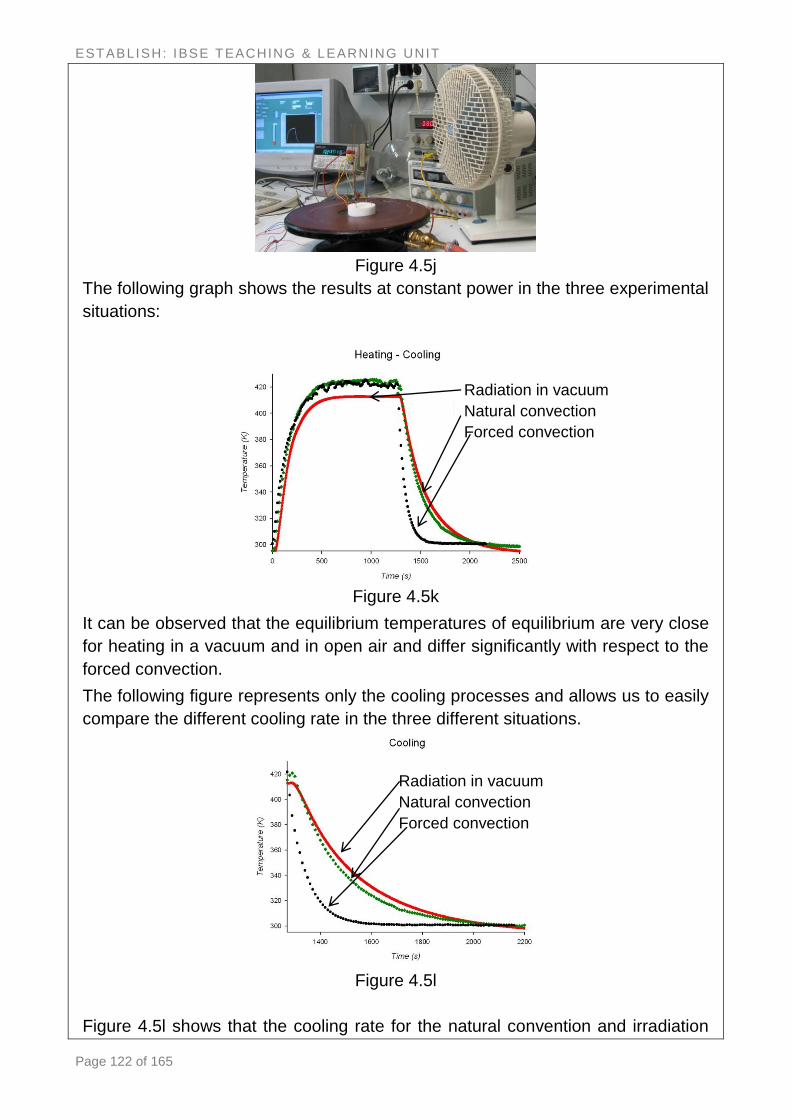
ESTABLISH: IBSE TEACHING & LEARNING UNIT
Page 122 of 165
Figure 4.5j
The following graph shows the results at constant power in the three experimental
situations:
Figure 4.5k
It can be observed that the equilibrium temperatures of equilibrium are very close
for heating in a vacuum and in open air and differ significantly with respect to the
forced convection.
The following figure represents only the cooling processes and allows us to easily
compare the different cooling rate in the three different situations.
Figure 4.5l
Figure 4.5l shows that the cooling rate for the natural convention and irradiation
Radiation in vacuum
Natural convection
Forced convection
Radiation in vacuum
Natural convection
Forced convection
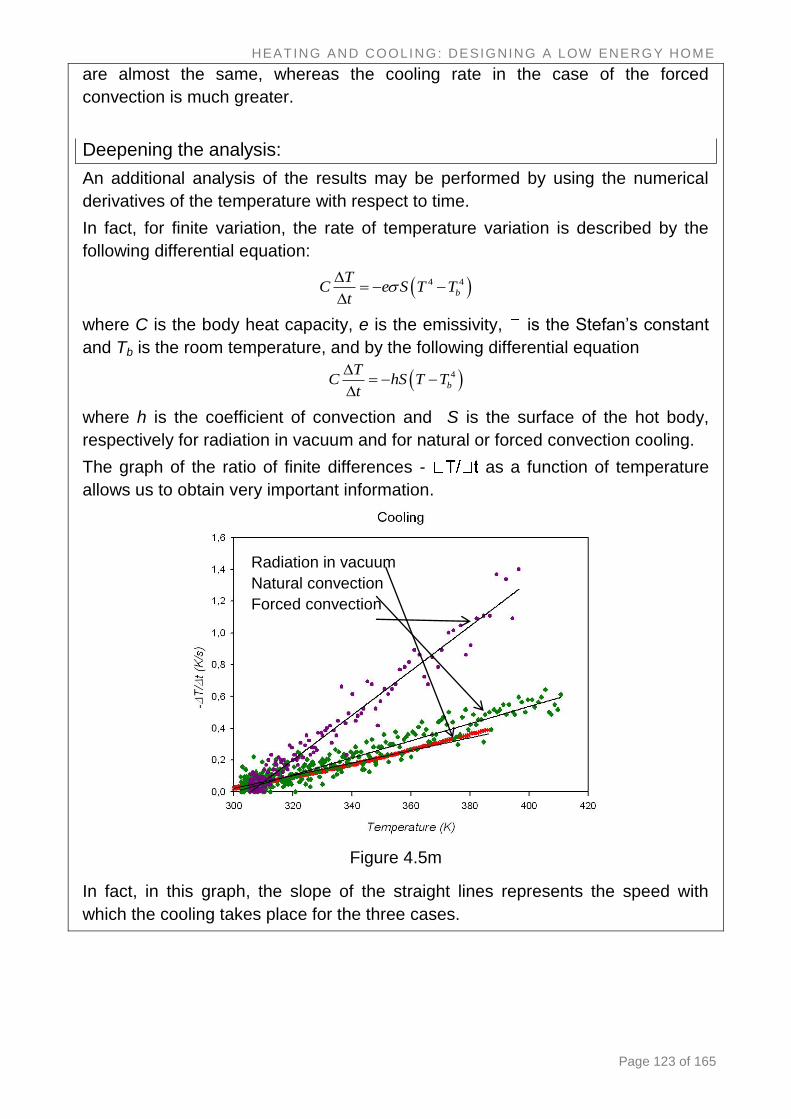
HEATING AND COOLING: DESIGNING A LOW ENERGY HOME
Page 123 of 165
are almost the same, whereas the cooling rate in the case of the forced
convection is much greater.
Deepening the analysis:
An additional analysis of the results may be performed by using the numerical
derivatives of the temperature with respect to time.
In fact, for finite variation, the rate of temperature variation is described by the
following differential equation:
4 4
b
TC e S T T
t
- -
where C is the body heat capacity, e is the emissivity, is the Stefan’s constant
and Tb is the room temperature, and by the following differential equation
4
b
TC hS T T
t
- -
where h is the coefficient of convection and S is the surface of the hot body,
respectively for radiation in vacuum and for natural or forced convection cooling.
The graph of the ratio of finite differences - as a function of temperature
allows us to obtain very important information.
Figure 4.5m
In fact, in this graph, the slope of the straight lines represents the speed with
which the cooling takes place for the three cases.
Radiation in vacuum
Natural convection
Forced convection
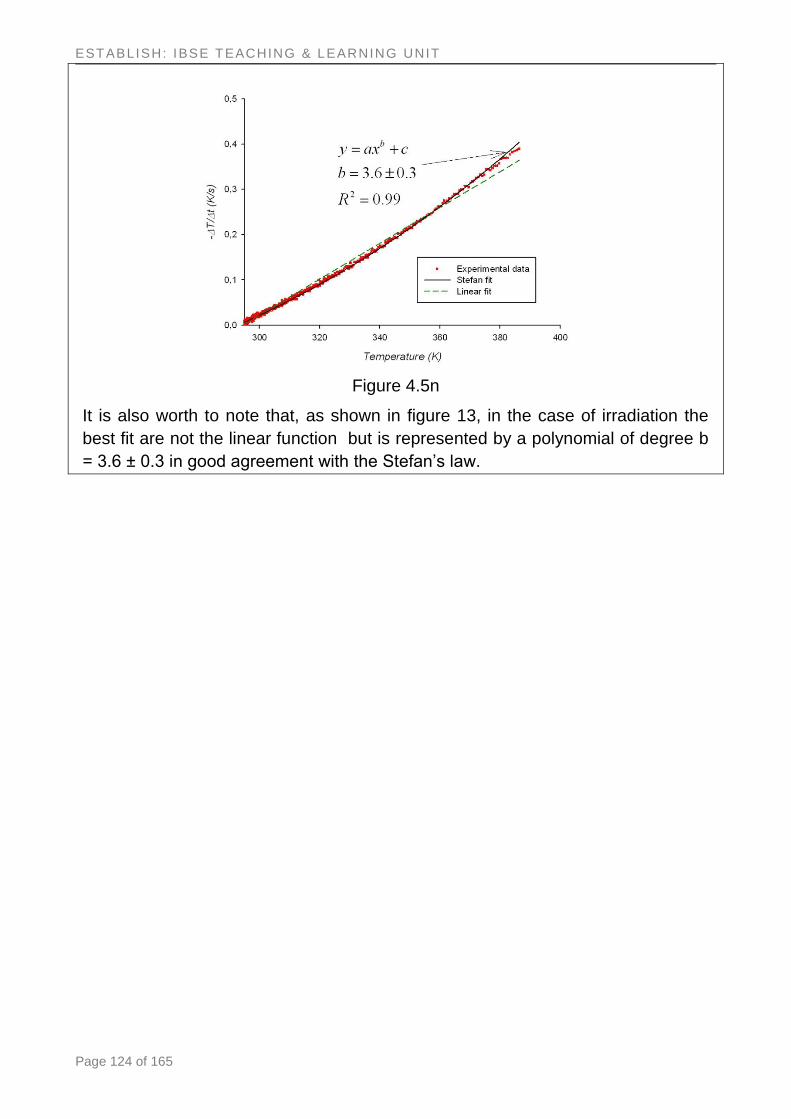
ESTABLISH: IBSE TEACHING & LEARNING UNIT
Page 124 of 165
Figure 4.5n
It is also worth to note that, as shown in figure 13, in the case of irradiation the
best fit are not the linear function but is represented by a polynomial of degree b
= 3.6 ± 0.3 in good agreement with the Stefan’s law.
DIRECT CURRENT ELECTRICITY
Page 125 of 165
DIRECT CURRENT
ELECTRICITY
The development of this unit has been led by the ESTABLISH partners:
Zuzana Jeskova, Marian Kires and Ludmila Onderova,
Univerzita Pavla Jozefa Safarika v Kosiciach (University of Kosice), Slovakia.
ESTABLISH: IBSE TEACHING & LEARNING UNIT
Page 126 of 165
UNIT CONTENTS
I. Unit Description ........................................................................... 127
II. IBSE Character ........................................................................... 127
III. Science Content Knowledge ....................................................... 127
IV. Pedagogical Content Knowledge ................................................. 129
V. Industrial Content Knowledge ...................................................... 130
VI. Learning Path(s) .......................................................................... 132
VII. Assessment ................................................................................. 134
VIII. Student Learning Activities .......................................................... 135
Activity 1: Electric current, battery and bulb ........................................... 135
Activity 2: What materials conduct electric current? ............................... 136
Activity 3: Determine the connections inside a black box ....................... 137
Activity 4: Measuring current and voltage .............................................. 138
Activity 5: Electric elements in a DC circuit ............................................ 139
Activity 6: Resistance and temperature (build your own thermometer) .. 141
Activity 7: Model of the electric circuit (why is it more or less resistive) .. 143
Activity 8: Does human body obeys Ohm’s Law? .................................. 152
Activity 9: Intriguing behaviour of bulbs ................................................. 153
Activity 10: Build your own battery ......................................................... 156
Activity 11: Battery and its basic parameters .......................................... 157
Activity 12: Batteries in series and in parallel ......................................... 160
Activity 13: How electric eel kills its prey ................................................ 161
Activity 14: How much energy supplies a battery? ................................. 162
Activity 15: Batteries and their reasonable use ...................................... 163
Activity 16: Other alternative electrical sources ..................................... 165
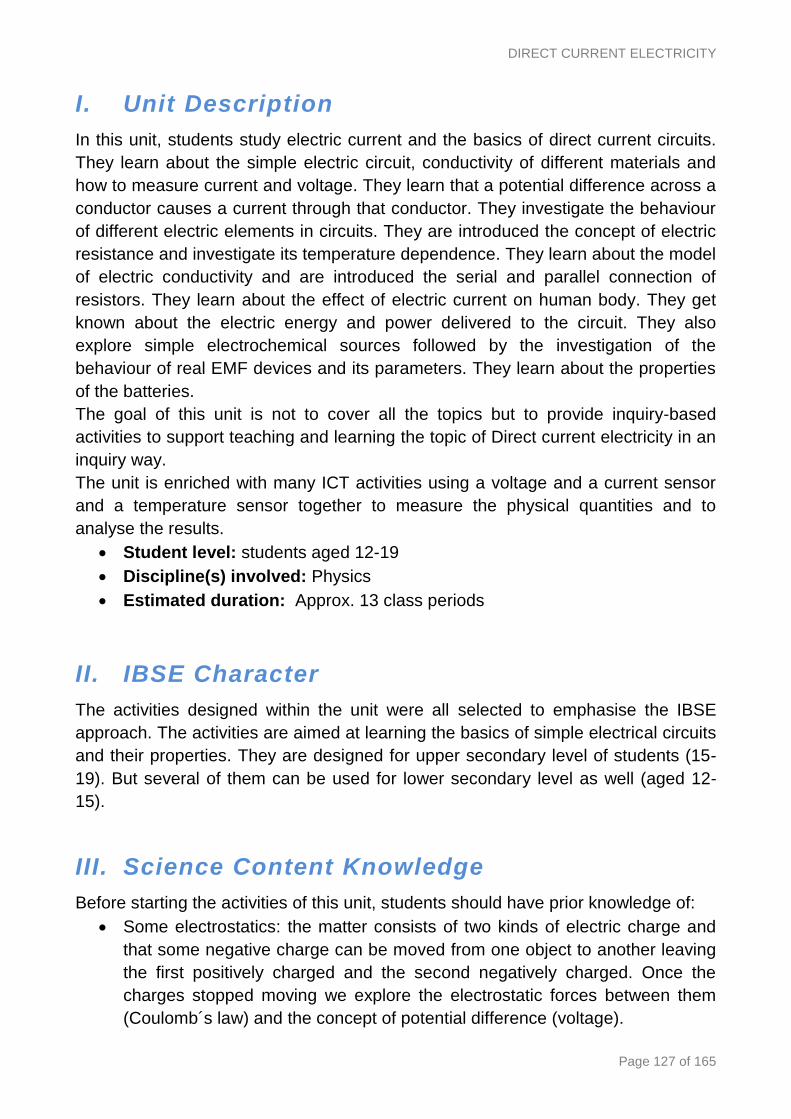
DIRECT CURRENT ELECTRICITY
Page 127 of 165
I. Unit Description
In this unit, students study electric current and the basics of direct current circuits.
They learn about the simple electric circuit, conductivity of different materials and
how to measure current and voltage. They learn that a potential difference across a
conductor causes a current through that conductor. They investigate the behaviour
of different electric elements in circuits. They are introduced the concept of electric
resistance and investigate its temperature dependence. They learn about the model
of electric conductivity and are introduced the serial and parallel connection of
resistors. They learn about the effect of electric current on human body. They get
known about the electric energy and power delivered to the circuit. They also
explore simple electrochemical sources followed by the investigation of the
behaviour of real EMF devices and its parameters. They learn about the properties
of the batteries.
The goal of this unit is not to cover all the topics but to provide inquiry-based
activities to support teaching and learning the topic of Direct current electricity in an
inquiry way.
The unit is enriched with many ICT activities using a voltage and a current sensor
and a temperature sensor together to measure the physical quantities and to
analyse the results.
Student level: students aged 12-19
Discipline(s) involved: Physics
Estimated duration: Approx. 13 class periods
II. IBSE Character
The activities designed within the unit were all selected to emphasise the IBSE
approach. The activities are aimed at learning the basics of simple electrical circuits
and their properties. They are designed for upper secondary level of students (15-
19). But several of them can be used for lower secondary level as well (aged 12-
15).
III. Science Content Knowledge
Before starting the activities of this unit, students should have prior knowledge of:
Some electrostatics: the matter consists of two kinds of electric charge and
that some negative charge can be moved from one object to another leaving
the first positively charged and the second negatively charged. Once the
charges stopped moving we explore the electrostatic forces between them
(Coulomb´s law) and the concept of potential difference (voltage).
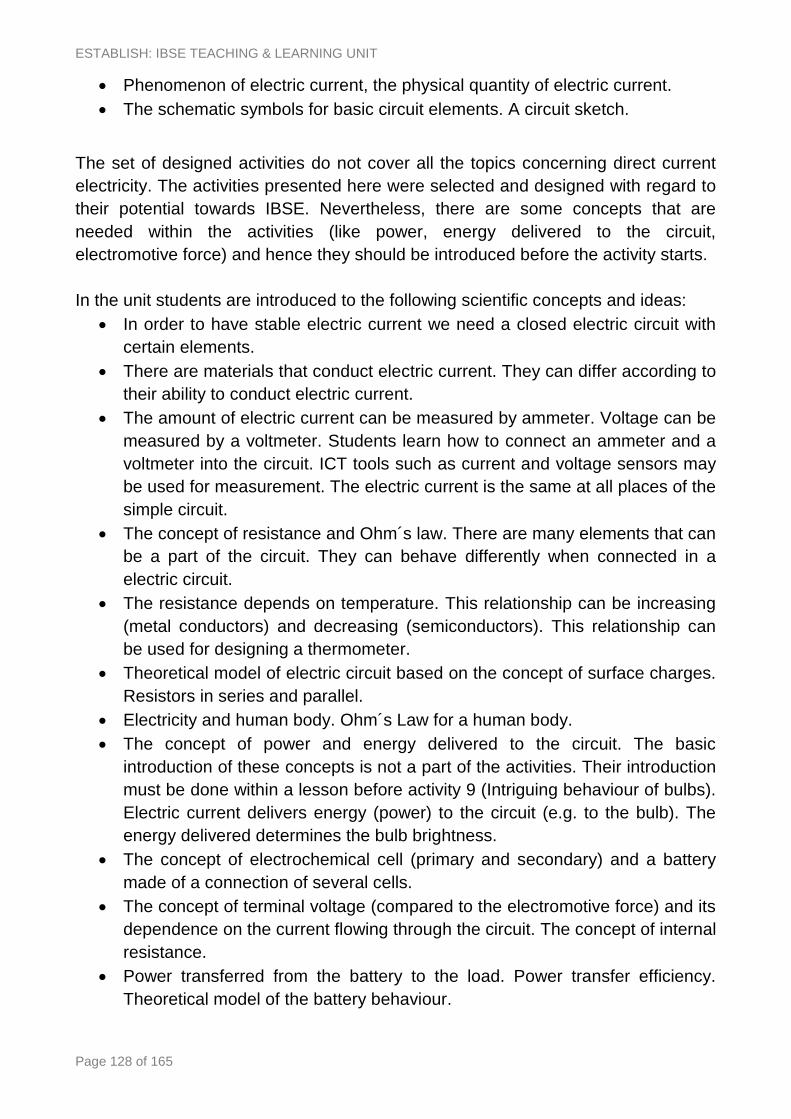
ESTABLISH: IBSE TEACHING & LEARNING UNIT
Page 128 of 165
Phenomenon of electric current, the physical quantity of electric current.
The schematic symbols for basic circuit elements. A circuit sketch.
The set of designed activities do not cover all the topics concerning direct current
electricity. The activities presented here were selected and designed with regard to
their potential towards IBSE. Nevertheless, there are some concepts that are
needed within the activities (like power, energy delivered to the circuit,
electromotive force) and hence they should be introduced before the activity starts.
In the unit students are introduced to the following scientific concepts and ideas:
In order to have stable electric current we need a closed electric circuit with
certain elements.
There are materials that conduct electric current. They can differ according to
their ability to conduct electric current.
The amount of electric current can be measured by ammeter. Voltage can be
measured by a voltmeter. Students learn how to connect an ammeter and a
voltmeter into the circuit. ICT tools such as current and voltage sensors may
be used for measurement. The electric current is the same at all places of the
simple circuit.
The concept of resistance and Ohm´s law. There are many elements that can
be a part of the circuit. They can behave differently when connected in a
electric circuit.
The resistance depends on temperature. This relationship can be increasing
(metal conductors) and decreasing (semiconductors). This relationship can
be used for designing a thermometer.
Theoretical model of electric circuit based on the concept of surface charges.
Resistors in series and parallel.
Electricity and human body. Ohm´s Law for a human body.
The concept of power and energy delivered to the circuit. The basic
introduction of these concepts is not a part of the activities. Their introduction
must be done within a lesson before activity 9 (Intriguing behaviour of bulbs).
Electric current delivers energy (power) to the circuit (e.g. to the bulb). The
energy delivered determines the bulb brightness.
The concept of electrochemical cell (primary and secondary) and a battery
made of a connection of several cells.
The concept of terminal voltage (compared to the electromotive force) and its
dependence on the current flowing through the circuit. The concept of internal
resistance.
Power transferred from the battery to the load. Power transfer efficiency.
Theoretical model of the battery behaviour.

DIRECT CURRENT ELECTRICITY
Page 129 of 165
Batteries connected in series and parallel. EMF and internal resistance of
these batteries.
The properties of battery. Battery capacity. Energy supplied by the battery.
Other important parameters.
Everyday use of batteries. Environmental aspects of battery disposal.
Alternative electric sources (fuel cell, photovoltaic cell)
The detailed explanation of the model of electric circuit can be found in the articles:
Haertl, H.: The electric Circuit as a System: A New Approach,
Eur.J.Sci.Educ., 1982, vol.4, No.1, 45-55
Sherwood, B., A., Chabay, R., W. A unified treatment of electrostatics and
circuits, available at:
http://matterandinteractions.org/Content/Articles/circuit.pdf>
IV. Pedagogical Content Knowledge
Electricity is one of the basic areas of physics that is important at all levels of
physics teaching. At the primary level, young children gain experience with simple
electric circuits. At the secondary level, electricity is taught more systematically. In
this sense, the activities can be used at different levels. For lower secondary level
students (aged 12-15), it is recommended to carry out activities 1, 2, 3, 4, 5.1, 5.2,
8, and 10.
Electricity is one of the most difficult concepts for students to grasp. It is around us
but at the same time it is invisible. Current and voltage are difficult to understand
because they cannot be observed directly. As a result, there are many
misconceptions concerning electricity identified by physics education research.
The most common misconceptions concerning electric circuits involve:
Current is used up in a bulb. It is consumed while running through the resistor
so that less current is flowing back to the battery.
There is no potential difference across an open switch because V=IR and
there is no I.
Ohm´s Law applies to all circuit elements (not just resistors).
Electrons move quickly (near the speed of light) through a circuit. That’s why
when we connect the bulb to the battery, it lights up immediately.
Charges slow down as they go through the resistor.
A conductor has no resistance.
The resistance of a parallel combination is larger than the largest resistance.
Battery is a source of electric current. Battery either outputs zero current (if
nothing is attached to it) or outputs a standard amount of current,

ESTABLISH: IBSE TEACHING & LEARNING UNIT
Page 130 of 165
independent of what is attached to the battery. EMF and potential difference
are synonymous.
There is no current between the terminals of a battery.
Charges that flow in circuit are from battery.
Current and voltage are the same.
The activities are designed to confront these common misconceptions. To reveal
misconceptions, the teacher should ask questions so that the student can confront
his/her pre-knowledge with the results gained in the experiment. The activity Model
of the electric circuit ( why is it more or less resistive) presents an approach to
teaching electric circuit concepts described by Herman Haertl that successfully
addresses some of the standard student misconceptions.
The activities are designed for particular levels of inquiry. But it is up to the teacher
and the level of his students to change the activity to more open investigation or
vice versa.
V. Industrial Content Knowledge
This topic can involve a lot of industrial and everyday applications. We use electric
devices in everyday life. It should be stressed that to make the electric devices
work, a closed electric circuit is needed.
Electric circuit elements are parts of electric devices. Changing the electric
resistance of resistors can change the current in the circuit and hence we can
change the brightness of a lamp, the speed of a race car, etc. Electric resistance is
used in archaeology for electrical resistance survey of the potential excavation
sites.
Light-dependent resistors are used to switch the light on at night.
Diodes gave basis for the wide development of electronics. Light-emitting diodes
are widely used instead of bulbs.
Teaching about different elements in electric circuit gives opportunity to visit a place
where electronic devices are dismantled into electronic components and separated.
The excursion can lead to discussion about possible environmental problems
connected with electronic waste.
The temperature dependence of metal or semiconductor (thermistor) resistance
leads to the application of this in thermometer design.
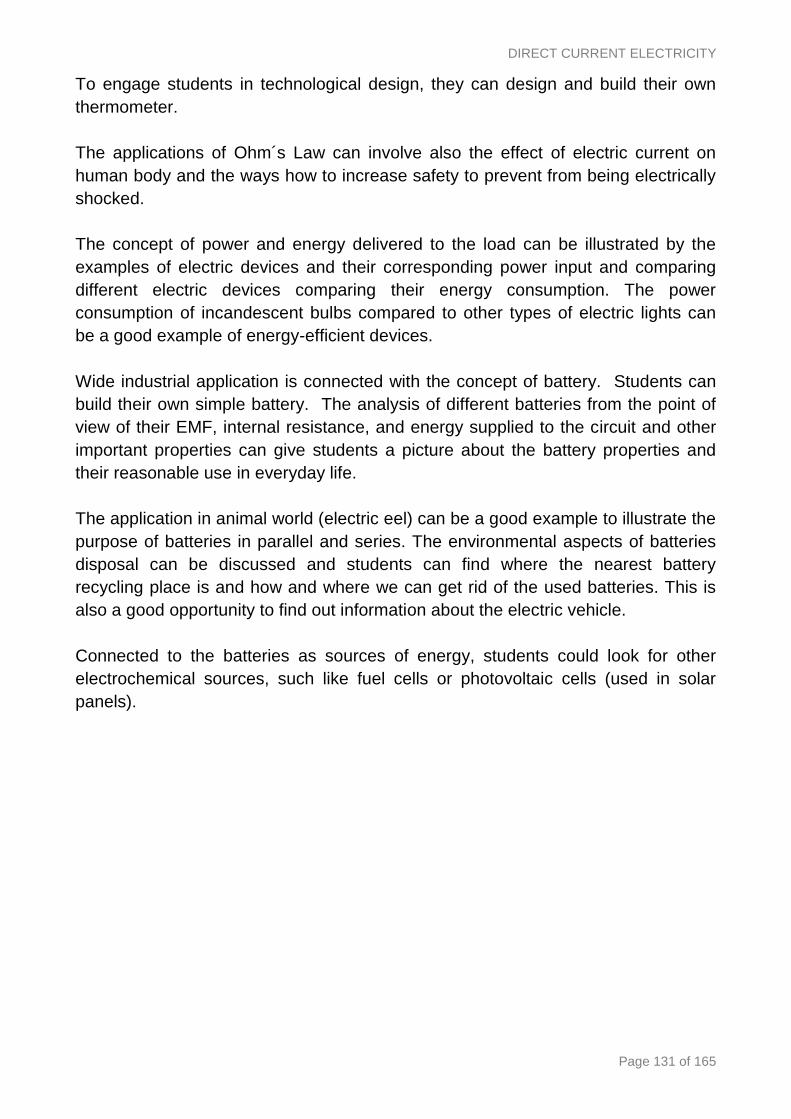
DIRECT CURRENT ELECTRICITY
Page 131 of 165
To engage students in technological design, they can design and build their own
thermometer.
The applications of Ohm´s Law can involve also the effect of electric current on
human body and the ways how to increase safety to prevent from being electrically
shocked.
The concept of power and energy delivered to the load can be illustrated by the
examples of electric devices and their corresponding power input and comparing
different electric devices comparing their energy consumption. The power
consumption of incandescent bulbs compared to other types of electric lights can
be a good example of energy-efficient devices.
Wide industrial application is connected with the concept of battery. Students can
build their own simple battery. The analysis of different batteries from the point of
view of their EMF, internal resistance, and energy supplied to the circuit and other
important properties can give students a picture about the battery properties and
their reasonable use in everyday life.
The application in animal world (electric eel) can be a good example to illustrate the
purpose of batteries in parallel and series. The environmental aspects of batteries
disposal can be discussed and students can find where the nearest battery
recycling place is and how and where we can get rid of the used batteries. This is
also a good opportunity to find out information about the electric vehicle.
Connected to the batteries as sources of energy, students could look for other
electrochemical sources, such like fuel cells or photovoltaic cells (used in solar
panels).
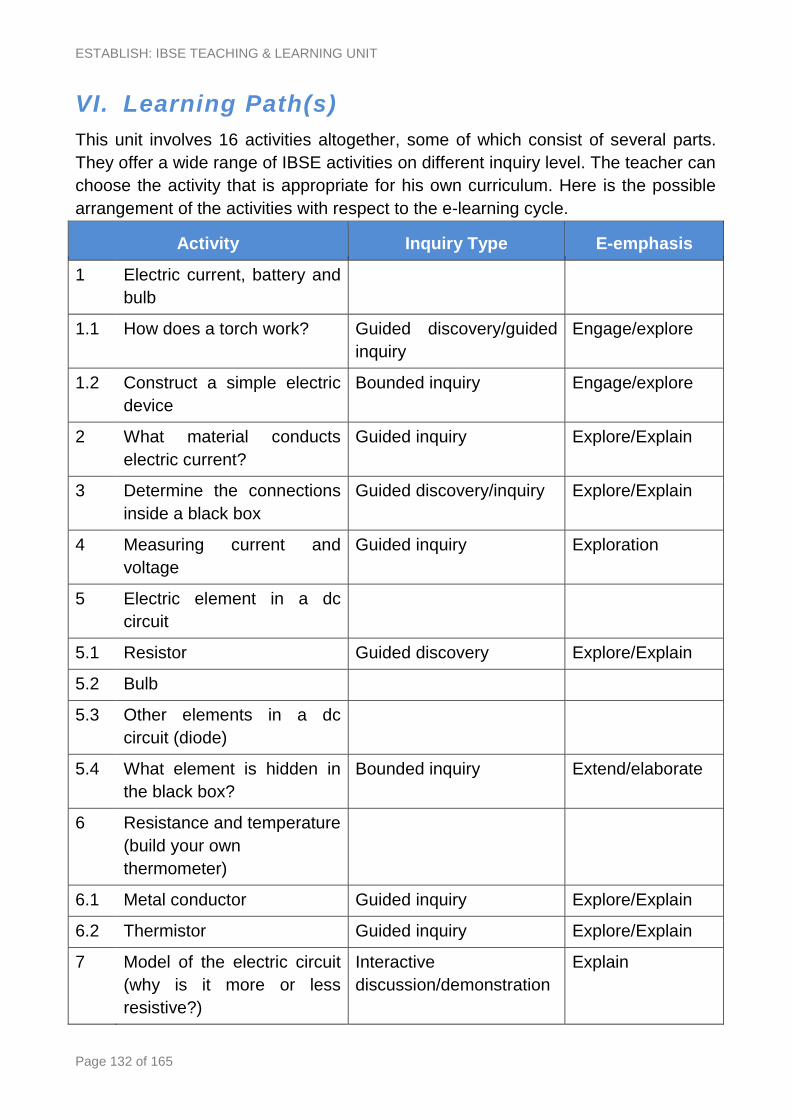
ESTABLISH: IBSE TEACHING & LEARNING UNIT
Page 132 of 165
VI. Learning Path(s)
This unit involves 16 activities altogether, some of which consist of several parts.
They offer a wide range of IBSE activities on different inquiry level. The teacher can
choose the activity that is appropriate for his own curriculum. Here is the possible
arrangement of the activities with respect to the e-learning cycle.
Activity Inquiry Type E-emphasis
1 Electric current, battery and
bulb
1.1 How does a torch work? Guided discovery/guided
inquiry
Engage/explore
1.2 Construct a simple electric
device
Bounded inquiry Engage/explore
2 What material conducts
electric current?
Guided inquiry Explore/Explain
3 Determine the connections
inside a black box
Guided discovery/inquiry Explore/Explain
4 Measuring current and
voltage
Guided inquiry Exploration
5 Electric element in a dc
circuit
5.1 Resistor Guided discovery Explore/Explain
5.2 Bulb
5.3 Other elements in a dc
circuit (diode)
5.4 What element is hidden in
the black box?
Bounded inquiry Extend/elaborate
6 Resistance and temperature
(build your own
thermometer)
6.1 Metal conductor Guided inquiry Explore/Explain
6.2 Thermistor Guided inquiry Explore/Explain
7 Model of the electric circuit
(why is it more or less
resistive?)
Interactive
discussion/demonstration
Explain
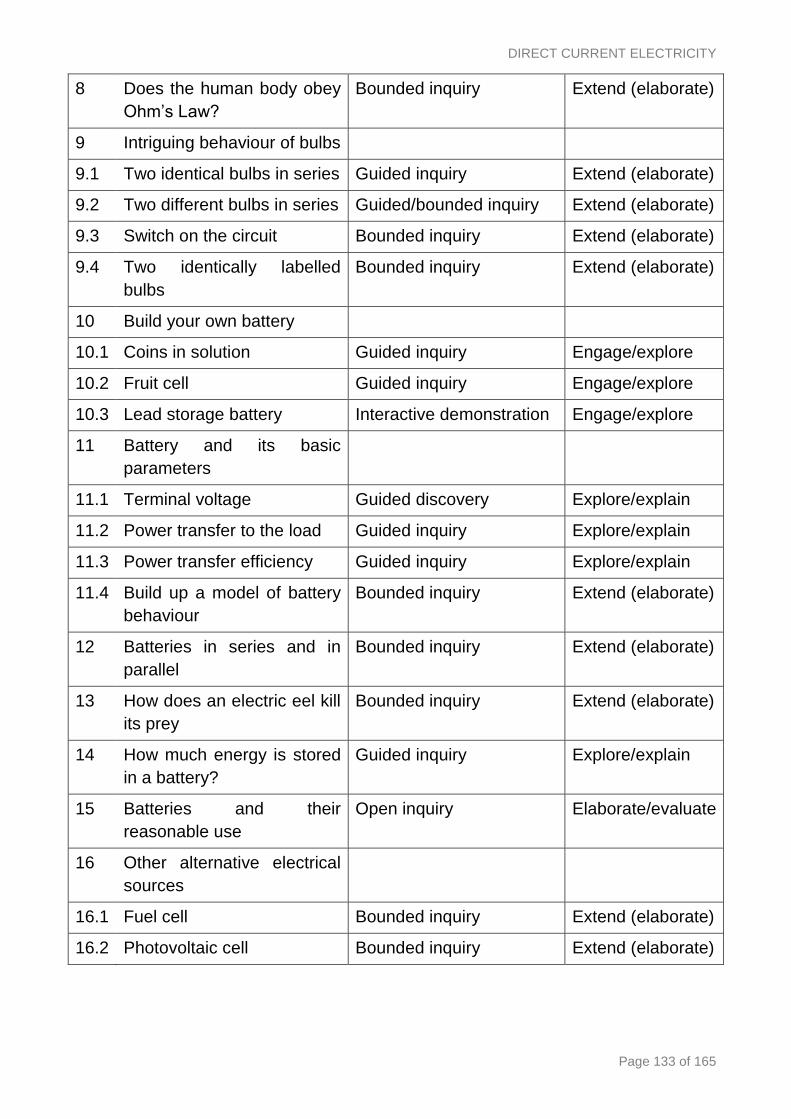
DIRECT CURRENT ELECTRICITY
Page 133 of 165
8 Does the human body obey
Ohm’s Law?
Bounded inquiry Extend (elaborate)
9 Intriguing behaviour of bulbs
9.1 Two identical bulbs in series Guided inquiry Extend (elaborate)
9.2 Two different bulbs in series Guided/bounded inquiry Extend (elaborate)
9.3 Switch on the circuit Bounded inquiry Extend (elaborate)
9.4 Two identically labelled
bulbs
Bounded inquiry Extend (elaborate)
10 Build your own battery
10.1 Coins in solution Guided inquiry Engage/explore
10.2 Fruit cell Guided inquiry Engage/explore
10.3 Lead storage battery Interactive demonstration Engage/explore
11 Battery and its basic
parameters
11.1 Terminal voltage Guided discovery Explore/explain
11.2 Power transfer to the load Guided inquiry Explore/explain
11.3 Power transfer efficiency Guided inquiry Explore/explain
11.4 Build up a model of battery
behaviour
Bounded inquiry Extend (elaborate)
12 Batteries in series and in
parallel
Bounded inquiry Extend (elaborate)
13 How does an electric eel kill
its prey
Bounded inquiry Extend (elaborate)
14 How much energy is stored
in a battery?
Guided inquiry Explore/explain
15 Batteries and their
reasonable use
Open inquiry Elaborate/evaluate
16 Other alternative electrical
sources
16.1 Fuel cell Bounded inquiry Extend (elaborate)
16.2 Photovoltaic cell Bounded inquiry Extend (elaborate)

ESTABLISH: IBSE TEACHING & LEARNING UNIT
Page 134 of 165
VII. Assessment
The activities 1, 2,3,4,5 are aimed at basic knowledge about simple electric circuit.
The assessment can include practical assignments on constructing a simple circuit
and measuring voltage and current.
The activities 5,6,7,8 involve V-A characteristics (Ohm´s Law), the temperature
dependence of resistance and resistors in series and parallel. The assessment of
the conceptual understanding of these concepts can include theoretical test as well
as a presentation based on searching information on the effect of electricity on
human body.
Activity 9 is aimed at the conceptual understanding of the concept of power
delivered to the circuit. A theoretical test can be appropriate to check the
understanding.
The activities 10-16 aimed at the understanding the concept of battery and its
parameters can be assessed by a theoretical test. A presentation or a written report
on the results of open inquiry based on searching information about batteries
(activity 15) can be assessed when presenting results in front of the class.
In all the activities where students use guided/ bounded inquiry to carry out an
investigation on a specific topic and they collect and analyze data to draw
conclusions consequently, the written report on the labwork can be a part of the
assessment, as well.
DIRECT CURRENT ELECTRICITY
Page 135 of 165
VIII. Student Learning Activities
Activity 1: Electric current, battery and bulb
Learning aims:
To understand how a potential difference can cause an electric current
through a conductor
To learn to design and construct simple electric circuits using batteries, bulbs,
wires and switches
To learn to draw circuit diagrams using symbols
Materials:
A few cheap torches that can be taken apart,
Three bulbs (e.g. 4.5V/0.3A), Zinc-carbon battery (4.5V), leads, one-way
switch, two-way switch
Suggestions for use:
Divide the class into small groups of 2-4 students and hand out the worksheet:
Electric current, battery and bulb. The students working in groups go step-by-
step from simple observation to guided discovery up to bounded inquiry.
Let students play in groups with a torch and dismantle and examine its
components. Students should identify three basic components: a switch, a bulb and
a battery that are connected in series. They learn that a closed circuit is needed for
current to flow. The torch case can be a part of the circuit. After this first simple
investigation, they learn to build their own simple electric circuit from a battery, a
bulb, leads and a switch.
Once the students know to light up a single bulb, they can design and build some
simple electric devices using extra switches, wires and bulbs. They are asked to
invent and construct more complicated circuits with series or parallel connection of
bulbs using switches. Even if the students do not know what goes on in electric
circuit in details, this task can motivate them to think and investigate in order to find
out the appropriate solution. Once they have completed the investigation, they
summarize the results and present them to the other groups. In cases of limited
materials or time, each group can construct one of the suggested electric circuits.
Possible questions:
What are the basic components of the torch?
What makes the bulb light up?
What components can a simple electric circuit be made of?
ESTABLISH: IBSE TEACHING & LEARNING UNIT
Page 136 of 165
What influences the bulb brightness?
How is the current direction set?
How do different switches work?
Activity 2: What materials conduct electric current?
Learning aims:
To learn to design and construct simple electric circuits using batteries, bulbs,
wires and switches
To understand that there are different types of materials conducing or not
conducting electric current
Materials:
• Zinc-carbon battery (4.5V), leads, wires of similar size and different materials,
pencil lead, match, piece of plastic, distilled water, tap (salty, sweet) water, glass,
porcelain, china plate with metal strip, etc.
Suggestions for use:
Divide the class into small groups of 2-3 and hand out Classroom Material: What
material conducts electric current?
Once the students can construct simple electric circuits, they can be asked to plan
and design their own experiment to examine different materials and their
conductivity. They should use a bulb as an indicator of current. Once they have
completed the investigation, they summarize the results and present them to the
other groups. I In cases of limited materials or time, each group can investigate
several of them. Finally we can do a contest on the longest electric circuit that
makes the bulb light up.
Possible questions:
What physical quantity does the bulb brightness indicate?
How do different materials connected into the circuit influence the brightness
of the bulb?
Compare the current flowing through the circuit in each case.
Which materials are good conductors and which are not?
Why is it important to know if the material conducts electricity?
DIRECT CURRENT ELECTRICITY
Page 137 of 165
Activity 3: Determine the connections inside a black box
Learning aims:
To deepen and widen students’ knowledge about the simple electric circuit.
Materials:
Black boxes with four connectors (that are mutually interconnected in
different ways inside each box using wires or resistors), bulbs, batteries (or
some other convenient source of DC voltage), leads.
Suggestions for use:
We divide the class into groups of three. Each group has the necessary equipment
ready on their table. We hand them out the Black box’s secret worksheet and let
the students perform their own experiments in a guided discovery/inquiry way. At
the beginning, they should answer introductory questions that should update their
knowledge necessary for independent investigation. In accordance with the
principles of inquiry based learning, students first draw possible ways of
interconnection, then they propose a procedure for investigation and finally, they
perform an experiment to reveal the internal structure of the boxes. They use a
power source, wires and a bulb to indicate the current (present or not, strong or
less strong) through a selected path. During the independent investigation, the
teacher observes and moderates the individual work of the students by asking
questions. (In case of a less advanced class, the questions are answered one by
one and the correctness of the answers of different groups is checked in the form of
a class-wide discussion). After the experiments are finished, the contents of the
black boxes are revealed – the students check the correctness of their
investigations and they try to analyse the cause of any mistakes they have made.
Possible questions:
What internal connection corresponds to the situation when the bulb lights
up?
What internal connection corresponds to the situation when the bulb lights up
but it shines dimmer than in the previous case?
When is the brightness of a bulb connected in an electric circuit lower and
when higher?
What internal connection corresponds to the situation when the bulb does not
shine at all?
What is understood by the term “black box”?
ESTABLISH: IBSE TEACHING & LEARNING UNIT
Page 138 of 165
Where can we find black boxes in everyday life?
Activity 4: Measuring current and voltage
Learning aims:
To understand the measurement of two basic physical quantities that
describes the operation of electric circuits: current and voltage using current
and voltage sensor (alternatively an ammeter and a voltmeter)
To understand that current is the same at all points in simple circuits
To understand how voltage is distributed across different parts of a simple
electric circuit.
Materials:
Battery (e.g. zinc-carbon or fresh alkaline, 4.5V), two bulbs (e.g. 4.5V/0.3A),
leads, computer, interface and software (e.g. COACH 6), current sensor, voltage
sensor (ammeter and voltmeter eventually)
Suggestions for use:
Divide the class into small groups of 2-3 and hand out Classroom Material:
Measuring current and voltage. This is a simple activity aimed at developing
basic skills concerning measurement of current and voltage in a simple electric
circuit with the help of sensors and understanding about current and voltage in
the simple circuit. It is important that students work in small groups so each
student has a chance to manipulate with the circuit components. Students learn
that to measure the voltage across an element in a circuit, the voltage sensor has
to be connected in parallel, and to measure the current flowing through it the
current sensor has to be connected in series with it. They learn that the current is
the same at different points of a simple electric circuit and that it is not used up by
the circuit element. They learn how the voltage is distributed across different
parts of the electric circuits. Students follow the instructions in the worksheet,
answering the questions and predicting the behaviour of the circuit.
Possible questions:
Is the current the same at different points of a simple electric circuit? Explain.
Is the voltage the same across the battery and the bulb in a simple electric
circuit? Explain.
Is there a circuit element with zero voltage across it?
What is the voltage expected to be at the two ends of the same wire?

DIRECT CURRENT ELECTRICITY
Page 139 of 165
How is the voltage across a battery influenced by the number of bulbs
connected in series?
How is the current through a circuit influenced by the number of bulbs
connected in series?
Is the battery a source of a constant current or a constant voltage?
Activity 5: Electric elements in a DC circuit
Learning aims:
Understanding that the potential difference across the conductor causes a
current through it
Exploring the relationship between the current flowing through a conductor
and a potential difference across it.
Interpreting the current – voltage diagram of a conductor
Understanding the concept of resistance
Investigating the behaviour of different electric elements in a direct electric
circuit
Interpreting the current – voltage diagram of different electric elements
Materials:
Variable power source (up to 10V), leads, resistors of different values of resistance
(e.g. 20 or higher), bulb (e.g. 6V/0.05A), other electric elements (e.g.
semiconducting diode) limiting resistor to be used in a circuit with diode, computer,
interface and software (e.g. CMA Coach6), current sensor, voltage sensor (if
computer with interface is not available, ammeter and voltmeter can be used)
Suggestions for use:
Divide the class into small groups of 2-3 and hand out Classroom Material:
Electric element in a DC circuit. In this activity, students carry out an experiment
in order to investigate the relationship between the current flowing through a
resistor and the voltage across it and to understand the concept of resistance. We
expect students to be confident enough in measuring current and voltage with the
help of sensors.
Firstly, they are introduced the concepts of resistor and resistance – as a physical
quantity defined asI
VR . During the investigation students discover that this
relationship is linear and they learn to understand the current-voltage diagram and
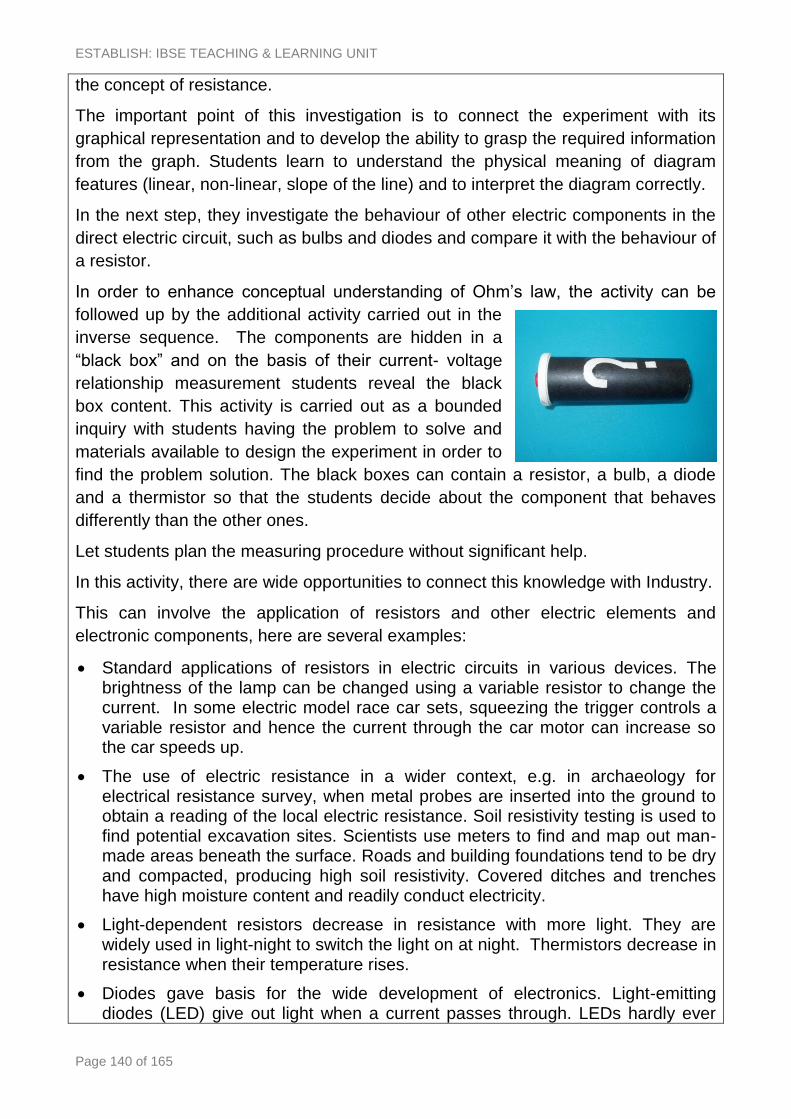
ESTABLISH: IBSE TEACHING & LEARNING UNIT
Page 140 of 165
the concept of resistance.
The important point of this investigation is to connect the experiment with its
graphical representation and to develop the ability to grasp the required information
from the graph. Students learn to understand the physical meaning of diagram
features (linear, non-linear, slope of the line) and to interpret the diagram correctly.
In the next step, they investigate the behaviour of other electric components in the
direct electric circuit, such as bulbs and diodes and compare it with the behaviour of
a resistor.
In order to enhance conceptual understanding of Ohm’s law, the activity can be
followed up by the additional activity carried out in the
inverse sequence. The components are hidden in a
“black box” and on the basis of their current- voltage
relationship measurement students reveal the black
box content. This activity is carried out as a bounded
inquiry with students having the problem to solve and
materials available to design the experiment in order to
find the problem solution. The black boxes can contain a resistor, a bulb, a diode
and a thermistor so that the students decide about the component that behaves
differently than the other ones.
Let students plan the measuring procedure without significant help.
In this activity, there are wide opportunities to connect this knowledge with Industry.
This can involve the application of resistors and other electric elements and
electronic components, here are several examples:
Standard applications of resistors in electric circuits in various devices. The brightness of the lamp can be changed using a variable resistor to change the current. In some electric model race car sets, squeezing the trigger controls a variable resistor and hence the current through the car motor can increase so the car speeds up.
The use of electric resistance in a wider context, e.g. in archaeology for electrical resistance survey, when metal probes are inserted into the ground to obtain a reading of the local electric resistance. Soil resistivity testing is used to find potential excavation sites. Scientists use meters to find and map out man-made areas beneath the surface. Roads and building foundations tend to be dry and compacted, producing high soil resistivity. Covered ditches and trenches have high moisture content and readily conduct electricity.
Light-dependent resistors decrease in resistance with more light. They are widely used in light-night to switch the light on at night. Thermistors decrease in resistance when their temperature rises.
Diodes gave basis for the wide development of electronics. Light-emitting diodes (LED) give out light when a current passes through. LEDs hardly ever
DIRECT CURRENT ELECTRICITY
Page 141 of 165
fail, and are used instead of bulbs.
Teaching this topic provides a good opportunity to visit a place where electronic
devices (such like TV sets, radios, computers, mobile phones, etc.) are dismantled
into electronic components and separated according to their possible reuse. When
dealing with electronic waste a question of their influence on the environment
should be taken into account and may be discussed.
Possible questions:
What does the voltage applied across a circuit element cause to happen?
Do different elements (resistor, bulb, diode) behave the same way in a DC
circuit?
How is the current flowing through an element influenced by the voltage
applied across it? Does the current increase, decrease or stay constant when
applying increasing voltage? What is the mathematical relationship between
current and voltage (I-V relationship) for a circuit element?
How could you distinguish between several elements knowing their I-V
diagram?
Activity 6: Resistance and temperature (build your own thermometer)
Learning aims:
Understanding that the resistance of the electric element can depend on its
temperature
Understanding that different elements react on increasing temperature
differently
Exploring the relationship between the resistance of a metal conductor and
its temperature
Exploring the relationship between the resistance of other elements like
thermistor and its temperature
Interpreting the resistance – temperature diagram of a metal conductor and
that of a thermistor
Understanding the use of resistance thermometer for measuring temperature
Materials:
Variable power source (up to 10V), leads, computer, interface and software (e.g.
CMA Coach6), current sensor, voltage sensor, temperature sensor (if computer
with interface is not available, ammeter and voltmeter and thermometer can be
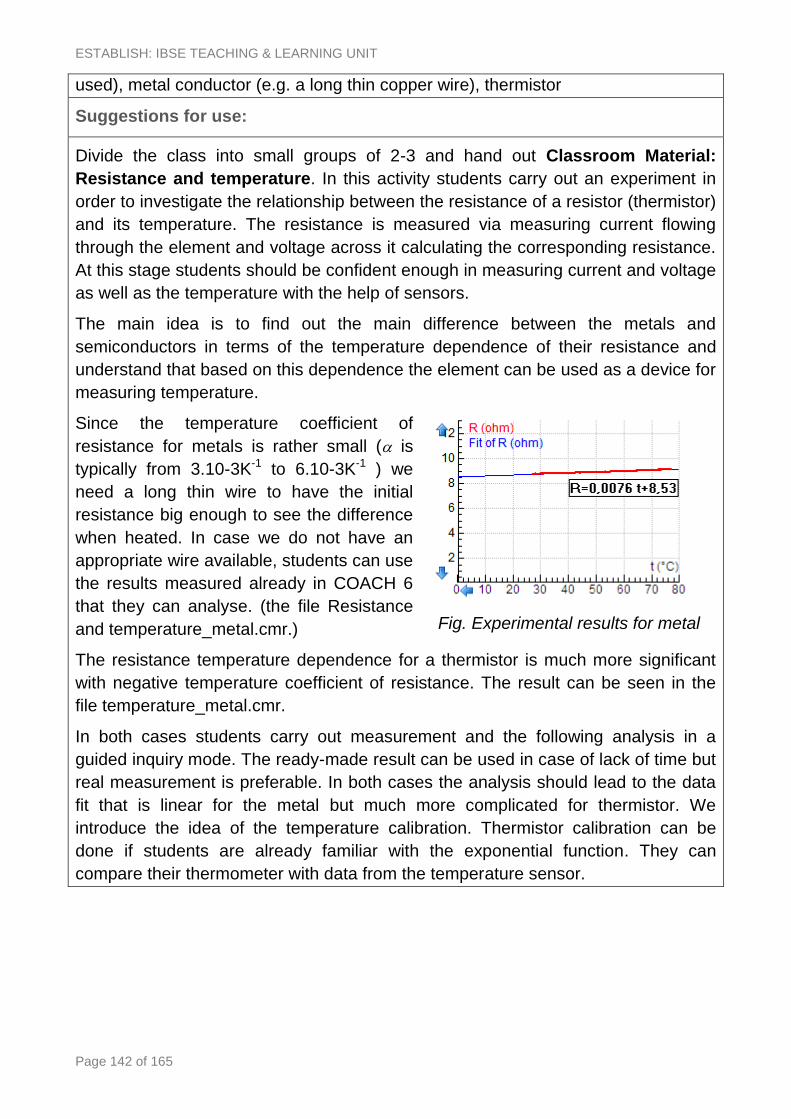
ESTABLISH: IBSE TEACHING & LEARNING UNIT
Page 142 of 165
used), metal conductor (e.g. a long thin copper wire), thermistor
Suggestions for use:
Divide the class into small groups of 2-3 and hand out Classroom Material:
Resistance and temperature. In this activity students carry out an experiment in
order to investigate the relationship between the resistance of a resistor (thermistor)
and its temperature. The resistance is measured via measuring current flowing
through the element and voltage across it calculating the corresponding resistance.
At this stage students should be confident enough in measuring current and voltage
as well as the temperature with the help of sensors.
The main idea is to find out the main difference between the metals and
semiconductors in terms of the temperature dependence of their resistance and
understand that based on this dependence the element can be used as a device for
measuring temperature.
Since the temperature coefficient of
resistance for metals is rather small ( is
typically from 3.10-3K-1 to 6.10-3K-1 ) we
need a long thin wire to have the initial
resistance big enough to see the difference
when heated. In case we do not have an
appropriate wire available, students can use
the results measured already in COACH 6
that they can analyse. (the file Resistance
and temperature_metal.cmr.)
The resistance temperature dependence for a thermistor is much more significant
with negative temperature coefficient of resistance. The result can be seen in the
file temperature_metal.cmr.
In both cases students carry out measurement and the following analysis in a
guided inquiry mode. The ready-made result can be used in case of lack of time but
real measurement is preferable. In both cases the analysis should lead to the data
fit that is linear for the metal but much more complicated for thermistor. We
introduce the idea of the temperature calibration. Thermistor calibration can be
done if students are already familiar with the exponential function. They can
compare their thermometer with data from the temperature sensor.
Fig. Experimental results for metal
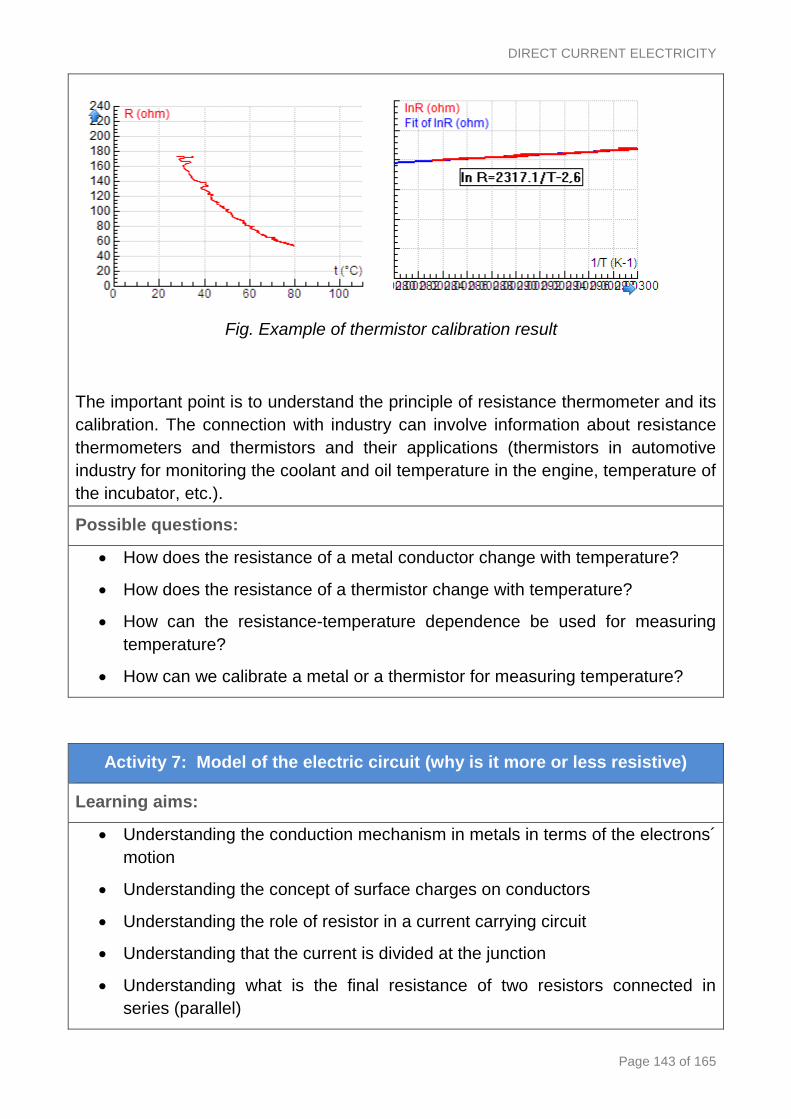
DIRECT CURRENT ELECTRICITY
Page 143 of 165
Fig. Example of thermistor calibration result
The important point is to understand the principle of resistance thermometer and its
calibration. The connection with industry can involve information about resistance
thermometers and thermistors and their applications (thermistors in automotive
industry for monitoring the coolant and oil temperature in the engine, temperature of
the incubator, etc.).
Possible questions:
How does the resistance of a metal conductor change with temperature?
How does the resistance of a thermistor change with temperature?
How can the resistance-temperature dependence be used for measuring
temperature?
How can we calibrate a metal or a thermistor for measuring temperature?
Activity 7: Model of the electric circuit (why is it more or less resistive)
Learning aims:
Understanding the conduction mechanism in metals in terms of the electrons´
motion
Understanding the concept of surface charges on conductors
Understanding the role of resistor in a current carrying circuit
Understanding that the current is divided at the junction
Understanding what is the final resistance of two resistors connected in
series (parallel)
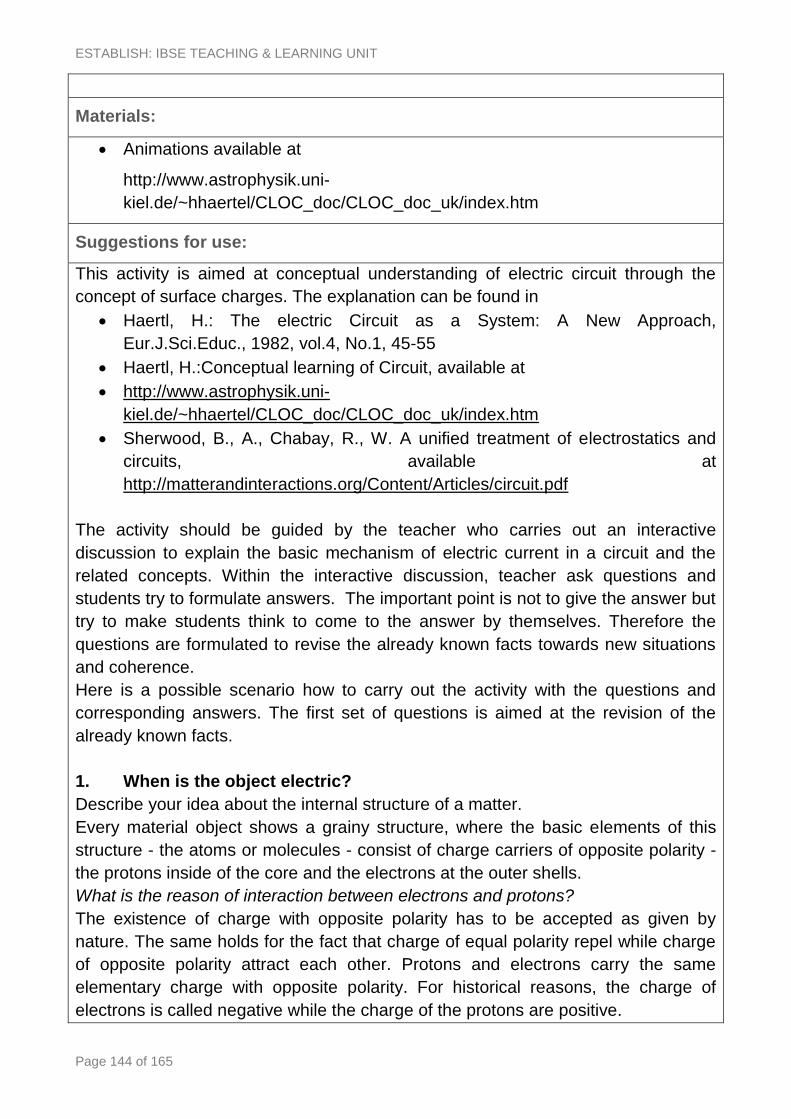
ESTABLISH: IBSE TEACHING & LEARNING UNIT
Page 144 of 165
Materials:
Animations available at
http://www.astrophysik.uni-
kiel.de/~hhaertel/CLOC_doc/CLOC_doc_uk/index.htm
Suggestions for use:
This activity is aimed at conceptual understanding of electric circuit through the
concept of surface charges. The explanation can be found in
Haertl, H.: The electric Circuit as a System: A New Approach,
Eur.J.Sci.Educ., 1982, vol.4, No.1, 45-55
Haertl, H.:Conceptual learning of Circuit, available at
http://www.astrophysik.uni-
kiel.de/~hhaertel/CLOC_doc/CLOC_doc_uk/index.htm
Sherwood, B., A., Chabay, R., W. A unified treatment of electrostatics and
circuits, available at
http://matterandinteractions.org/Content/Articles/circuit.pdf
The activity should be guided by the teacher who carries out an interactive
discussion to explain the basic mechanism of electric current in a circuit and the
related concepts. Within the interactive discussion, teacher ask questions and
students try to formulate answers. The important point is not to give the answer but
try to make students think to come to the answer by themselves. Therefore the
questions are formulated to revise the already known facts towards new situations
and coherence.
Here is a possible scenario how to carry out the activity with the questions and
corresponding answers. The first set of questions is aimed at the revision of the
already known facts.
1. When is the object electric?
Describe your idea about the internal structure of a matter.
Every material object shows a grainy structure, where the basic elements of this
structure - the atoms or molecules - consist of charge carriers of opposite polarity -
the protons inside of the core and the electrons at the outer shells.
What is the reason of interaction between electrons and protons?
The existence of charge with opposite polarity has to be accepted as given by
nature. The same holds for the fact that charge of equal polarity repel while charge
of opposite polarity attract each other. Protons and electrons carry the same
elementary charge with opposite polarity. For historical reasons, the charge of
electrons is called negative while the charge of the protons are positive.
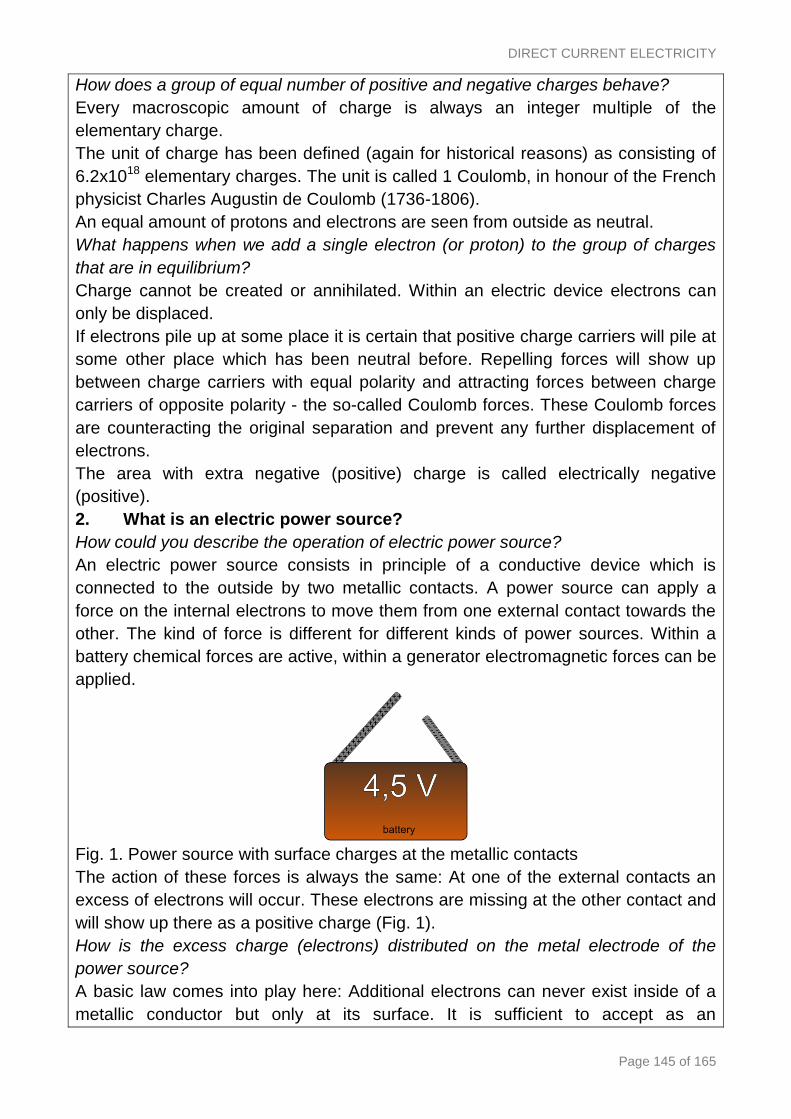
DIRECT CURRENT ELECTRICITY
Page 145 of 165
How does a group of equal number of positive and negative charges behave?
Every macroscopic amount of charge is always an integer multiple of the
elementary charge.
The unit of charge has been defined (again for historical reasons) as consisting of
6.2x10¹⁸ elementary charges. The unit is called 1 Coulomb, in honour of the French
physicist Charles Augustin de Coulomb (1736-1806).
An equal amount of protons and electrons are seen from outside as neutral.
What happens when we add a single electron (or proton) to the group of charges
that are in equilibrium?
Charge cannot be created or annihilated. Within an electric device electrons can
only be displaced.
If electrons pile up at some place it is certain that positive charge carriers will pile at
some other place which has been neutral before. Repelling forces will show up
between charge carriers with equal polarity and attracting forces between charge
carriers of opposite polarity - the so-called Coulomb forces. These Coulomb forces
are counteracting the original separation and prevent any further displacement of
electrons.
The area with extra negative (positive) charge is called electrically negative
(positive).
2. What is an electric power source?
How could you describe the operation of electric power source?
An electric power source consists in principle of a conductive device which is
connected to the outside by two metallic contacts. A power source can apply a
force on the internal electrons to move them from one external contact towards the
other. The kind of force is different for different kinds of power sources. Within a
battery chemical forces are active, within a generator electromagnetic forces can be
applied.
Fig. 1. Power source with surface charges at the metallic contacts
The action of these forces is always the same: At one of the external contacts an
excess of electrons will occur. These electrons are missing at the other contact and
will show up there as a positive charge (Fig. 1).
How is the excess charge (electrons) distributed on the metal electrode of the
power source?
A basic law comes into play here: Additional electrons can never exist inside of a
metallic conductor but only at its surface. It is sufficient to accept as an
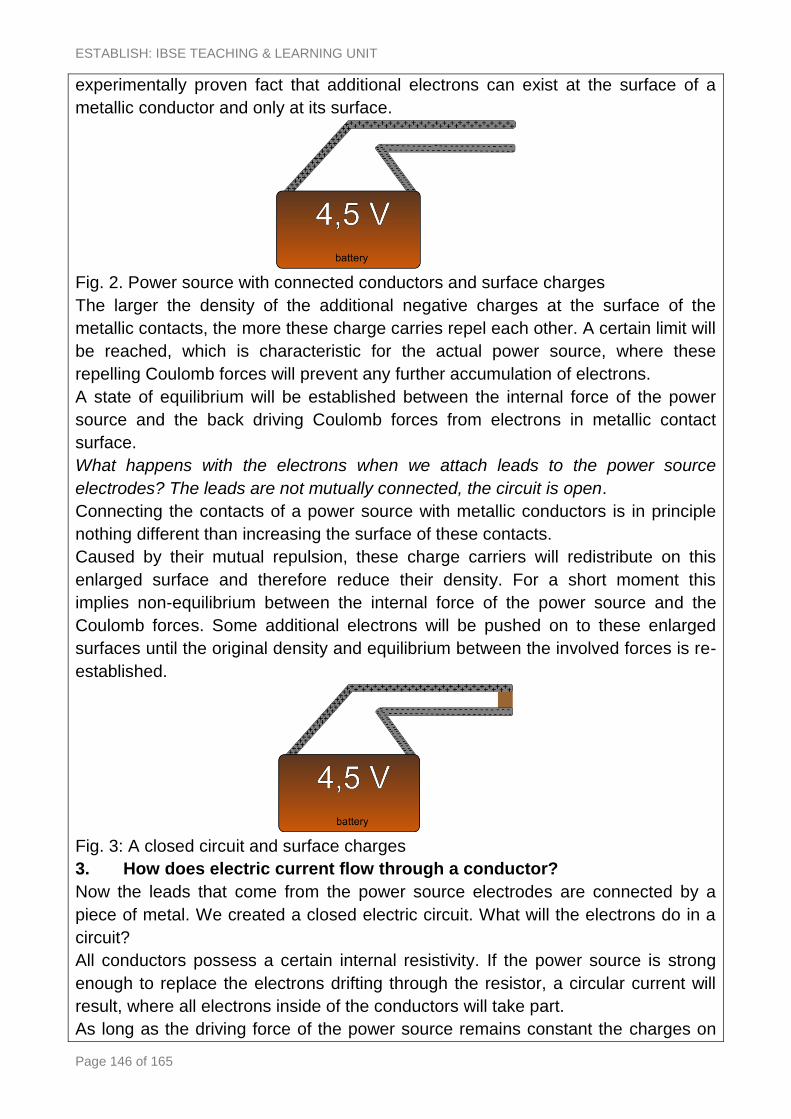
ESTABLISH: IBSE TEACHING & LEARNING UNIT
Page 146 of 165
experimentally proven fact that additional electrons can exist at the surface of a
metallic conductor and only at its surface.
Fig. 2. Power source with connected conductors and surface charges
The larger the density of the additional negative charges at the surface of the
metallic contacts, the more these charge carries repel each other. A certain limit will
be reached, which is characteristic for the actual power source, where these
repelling Coulomb forces will prevent any further accumulation of electrons.
A state of equilibrium will be established between the internal force of the power
source and the back driving Coulomb forces from electrons in metallic contact
surface.
What happens with the electrons when we attach leads to the power source
electrodes? The leads are not mutually connected, the circuit is open.
Connecting the contacts of a power source with metallic conductors is in principle
nothing different than increasing the surface of these contacts.
Caused by their mutual repulsion, these charge carriers will redistribute on this
enlarged surface and therefore reduce their density. For a short moment this
implies non-equilibrium between the internal force of the power source and the
Coulomb forces. Some additional electrons will be pushed on to these enlarged
surfaces until the original density and equilibrium between the involved forces is re-
established.
Fig. 3: A closed circuit and surface charges
3. How does electric current flow through a conductor?
Now the leads that come from the power source electrodes are connected by a
piece of metal. We created a closed electric circuit. What will the electrons do in a
circuit?
All conductors possess a certain internal resistivity. If the power source is strong
enough to replace the electrons drifting through the resistor, a circular current will
result, where all electrons inside of the conductors will take part.
As long as the driving force of the power source remains constant the charges on
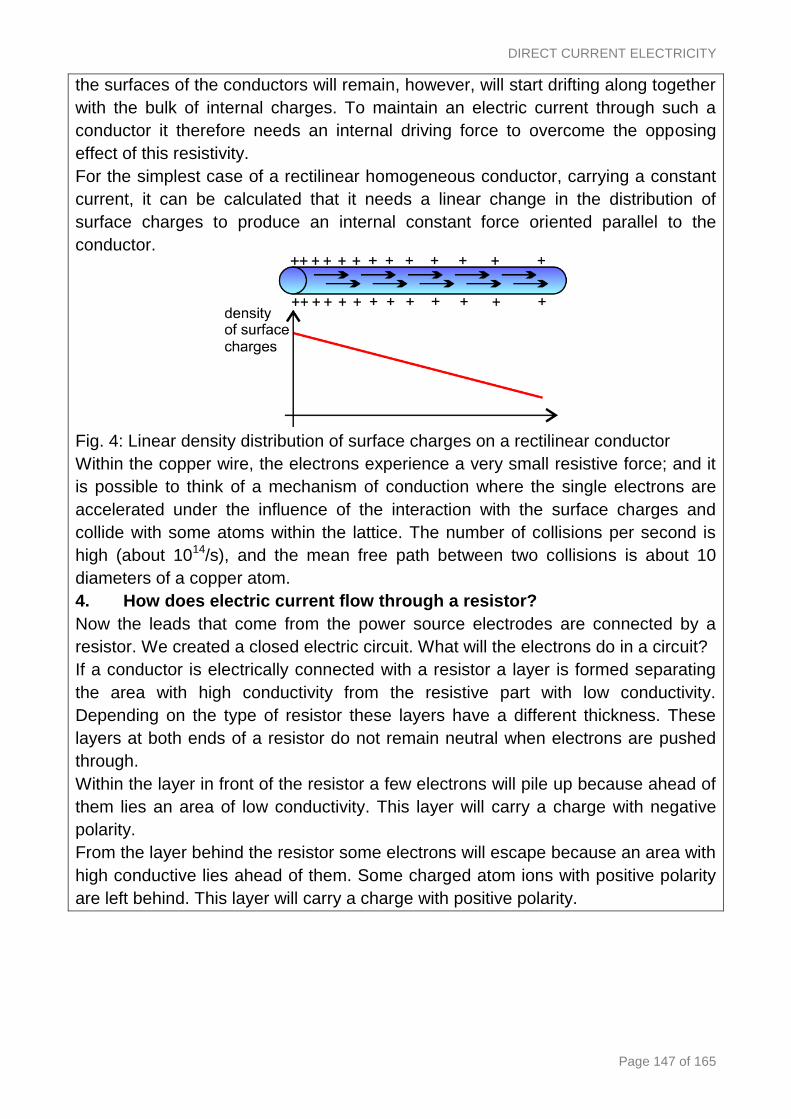
DIRECT CURRENT ELECTRICITY
Page 147 of 165
the surfaces of the conductors will remain, however, will start drifting along together
with the bulk of internal charges. To maintain an electric current through such a
conductor it therefore needs an internal driving force to overcome the opposing
effect of this resistivity.
For the simplest case of a rectilinear homogeneous conductor, carrying a constant
current, it can be calculated that it needs a linear change in the distribution of
surface charges to produce an internal constant force oriented parallel to the
conductor.
Fig. 4: Linear density distribution of surface charges on a rectilinear conductor
Within the copper wire, the electrons experience a very small resistive force; and it
is possible to think of a mechanism of conduction where the single electrons are
accelerated under the influence of the interaction with the surface charges and
collide with some atoms within the lattice. The number of collisions per second is
high (about 1014/s), and the mean free path between two collisions is about 10
diameters of a copper atom.
4. How does electric current flow through a resistor?
Now the leads that come from the power source electrodes are connected by a
resistor. We created a closed electric circuit. What will the electrons do in a circuit?
If a conductor is electrically connected with a resistor a layer is formed separating
the area with high conductivity from the resistive part with low conductivity.
Depending on the type of resistor these layers have a different thickness. These
layers at both ends of a resistor do not remain neutral when electrons are pushed
through.
Within the layer in front of the resistor a few electrons will pile up because ahead of
them lies an area of low conductivity. This layer will carry a charge with negative
polarity.
From the layer behind the resistor some electrons will escape because an area with
high conductive lies ahead of them. Some charged atom ions with positive polarity
are left behind. This layer will carry a charge with positive polarity.
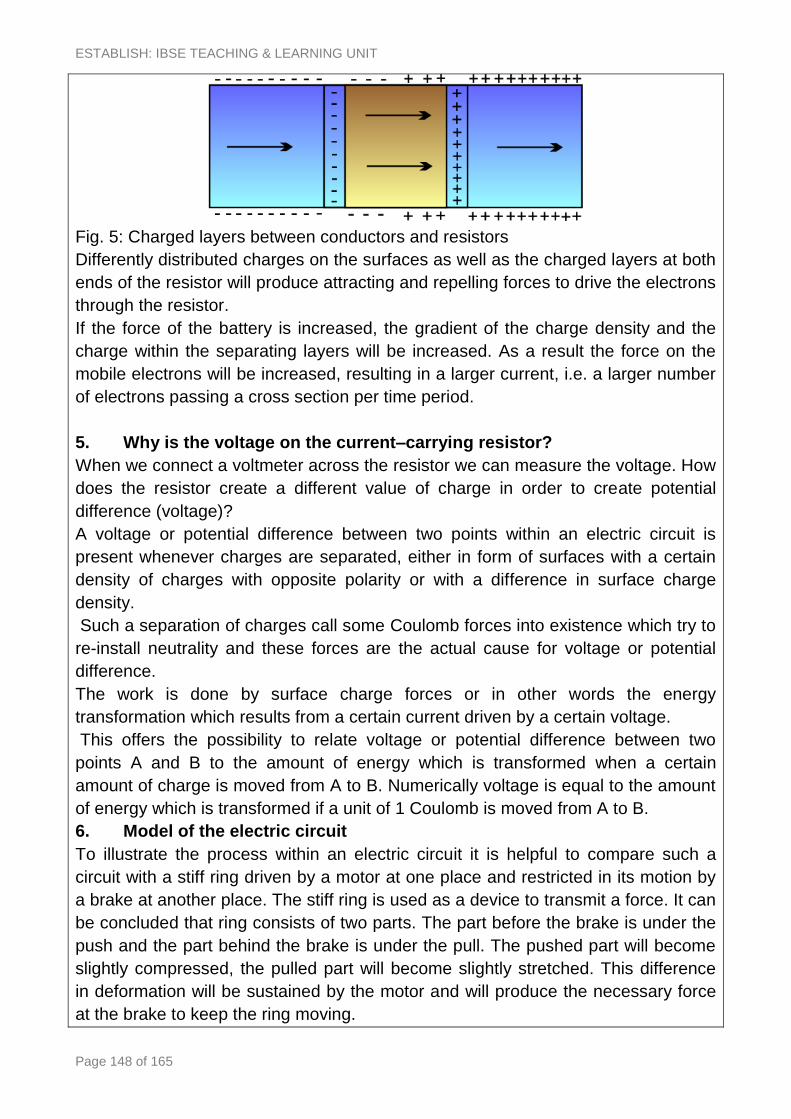
ESTABLISH: IBSE TEACHING & LEARNING UNIT
Page 148 of 165
Fig. 5: Charged layers between conductors and resistors
Differently distributed charges on the surfaces as well as the charged layers at both
ends of the resistor will produce attracting and repelling forces to drive the electrons
through the resistor.
If the force of the battery is increased, the gradient of the charge density and the
charge within the separating layers will be increased. As a result the force on the
mobile electrons will be increased, resulting in a larger current, i.e. a larger number
of electrons passing a cross section per time period.
5. Why is the voltage on the current–carrying resistor?
When we connect a voltmeter across the resistor we can measure the voltage. How
does the resistor create a different value of charge in order to create potential
difference (voltage)?
A voltage or potential difference between two points within an electric circuit is
present whenever charges are separated, either in form of surfaces with a certain
density of charges with opposite polarity or with a difference in surface charge
density.
Such a separation of charges call some Coulomb forces into existence which try to
re-install neutrality and these forces are the actual cause for voltage or potential
difference.
The work is done by surface charge forces or in other words the energy
transformation which results from a certain current driven by a certain voltage.
This offers the possibility to relate voltage or potential difference between two
points A and B to the amount of energy which is transformed when a certain
amount of charge is moved from A to B. Numerically voltage is equal to the amount
of energy which is transformed if a unit of 1 Coulomb is moved from A to B.
6. Model of the electric circuit
To illustrate the process within an electric circuit it is helpful to compare such a
circuit with a stiff ring driven by a motor at one place and restricted in its motion by
a brake at another place. The stiff ring is used as a device to transmit a force. It can
be concluded that ring consists of two parts. The part before the brake is under the
push and the part behind the brake is under the pull. The pushed part will become
slightly compressed, the pulled part will become slightly stretched. This difference
in deformation will be sustained by the motor and will produce the necessary force
at the brake to keep the ring moving.

DIRECT CURRENT ELECTRICITY
Page 149 of 165
Fig. 6 The stiff ring model of the electric circuit
The similarities between the electric circuit and a stiff ring with a drive and brake
can be summarized as follows:
Stiff ring Electric circuit
The stiff ring serves to transmit a force The electric circuit transmit a force
Matter moves in a circle Electrons move in a circle
Matter is not consumed Electrons are not consumed
The stiff ring is pushed by the motor on
one side and pulled on the other side
Electron gas is pushed at one side and
pulled on the other side by the power
source
The stiff ring is compressed or
stretched by the motor.
The density of the charges at the
surface is changed.
Restricted models for the electric current
In comparison with the stiff ring, the bicycle chain, the drive belt, blood circuit or
circular systems like hot water system can be used as model for the electric circuit
in a much more restricted manner. These systems do not transmit a force but
mainly energy-rich matter. The transmission of energy is therefore couple to the
motion of the transmitting medium. Within an electric circuit the electrons are
drifting with a rather low velocity while the energy is spread out with nearly the
speed of light.
As problematic model for the electric circuit could be also models, where the single
components can be driven individually (e.g. trucks on the highway). In contrast to
such a system electron do not have an own drive but are driven by an external
power source.
7. Simulation of current and voltage in a circuit
Students can construct simple electric circuits with the help of interactive applet in
order to understand the surface charges distribution.
The current is visualised graphically at selected locations in the form of triangles.
The voltage along the components is related to the density of surface charges
(display perpendicular to the circuit).

ESTABLISH: IBSE TEACHING & LEARNING UNIT
Page 150 of 165
Fig. 7 Simulation of current and voltage as interactive applet
8. When do electrons pull together (resistors in series)
The resistance of the circuit element describes its ability to act against the current
flowing through it. If we connect the resistors in series then the current must act
against the resistance of all the connected resistors. What is the final resistance of
all the resistors connected in series?
In each of the resistors there is a surface charge at the area between the resistor
and the lead. The total difference between the surface charges before and after the
resistor equals the sum of the charges at each of the resistors.
Hence the total resistance of resistors connected in series is a sum of the
resistance of each of the connected resistors.
Students use interactive simulation for visualization of the current and voltage in the
series circuits.
Fig. 8 Series circuit with resistors
9. How is the current divided in a junction?
In an electric circuit with a branching point, the current is split up at the branching
point according to the resistors within the different parallel branches.
How can you explain the mechanism to divide the current in a junction?
Shortly after closing the circuit with parallel branches the same current flows
through each of the branches. At the points where the resistors are connected in a
junction the surface charges start to pile up. Their density is influenced by the value
of resistance in the branch. The larger the resistor in such a branch, the smaller the
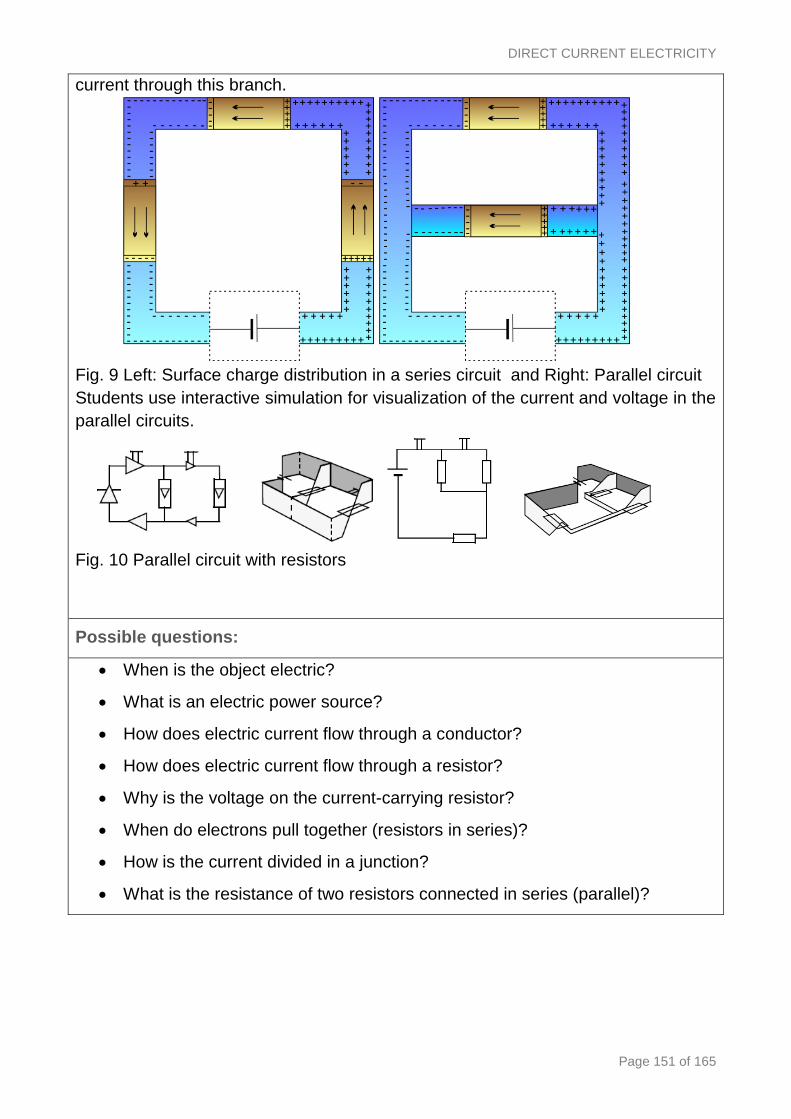
DIRECT CURRENT ELECTRICITY
Page 151 of 165
current through this branch.
Fig. 9 Left: Surface charge distribution in a series circuit and Right: Parallel circuit
Students use interactive simulation for visualization of the current and voltage in the
parallel circuits.
Fig. 10 Parallel circuit with resistors
Possible questions:
When is the object electric?
What is an electric power source?
How does electric current flow through a conductor?
How does electric current flow through a resistor?
Why is the voltage on the current-carrying resistor?
When do electrons pull together (resistors in series)?
How is the current divided in a junction?
What is the resistance of two resistors connected in series (parallel)?
ESTABLISH: IBSE TEACHING & LEARNING UNIT
Page 152 of 165
Activity 8: Does human body obeys Ohm’s Law?
Learning aims:
Understanding that the human body acts like a resistor obeying Ohm´s law
Understanding what determines the danger of electricity
Understanding the effects of electricity on human body
Introducing the applications of electric current through a human body (e.g. in
medicine)
Materials:
Text about the effects of electricity on human body
Internet resources on the effects of electricity on human body and about
other applications of electricity in human body
Suggestions for use:
In this activity students study the text about the effect of electricity on human body
or they can use internet or other resources to study the topic. They can then
prepare a short presentation on the effects of electric current on human body. A
group of students can do this activity on their own, looking up information in
different sources, then preparing a presentation on the topic and sharing it with their
peers. The interdisciplinary physics-biology approach can be enhanced by
searching information about the physiological effects of electricity (burning, muscle
contraction, heart fibrillation).
There are also good examples of the deliberate uses of the application of Ohm’s
law for a human body, e.g. medical uses or bioelectrical impedance analysis for
estimating body composition. Another group of students can study these
applications and prepare a presentation to be discussed in the class.
Possible questions:
Is the human body a good conductor of electricity?
What will happen if electricity travels through you?
Is it a voltage or a current that causes electric shock?
Why are people good conductors of electricity?
Why should you never touch anything electrical while you have wet hands or
while standing in water?
How can you increase your safety to prevent yourself from being electrically
DIRECT CURRENT ELECTRICITY
Page 153 of 165
shocked?
What are the medical uses of electric current in your body?
Activity 9: Intriguing behaviour of bulbs
Learning aims:
Conceptual understanding the concept of electric energy and power delivered
to a resistor by investigating the behaviour of bulbs in dc circuit
Materials:
Two identical bulbs (e.g. 6V/0.3A, 6V/0.1A), two identical bulbs (e.g. 6V/0.05A),
power source (6V), leads, computer, interface and software (e.g. CMA Coach6),
current sensor, voltage sensor differential (if computer with interface is not
available, ammeter and voltmeter can be used)
Suggestions for use:
Before starting this activity, students are already introduced to the connection of
resistors in series and the concept of energy and power dissipated in the resistor. In
this activity, students have two problems to investigate based on the behaviour of
bulbs in a DC circuit. Both of them can be solved as guided (or bounded) inquiry
activities depending on the students´ level. In both cases, students work in groups
of 2-3. Supposing we have two different bulbs and a power source with voltage
standard to light each separate bulb, we can light the bulbs separately as well as
connecting them in series. From understanding these simple experiments new
problems can emerge.
Problem 1, activity 1.2:
If we put two identical bulbs in the holders they shine equally brightly. If we put two
identical bulbs (different from the first ones) they also shine equally brightly. When
we put two different ones in the holders, then one lights up but the other does not
(or very faintly).
In a guided inquiry, students carry out experiments according to the instructions in
their worksheets. They investigate what physical quantity is responsible for the bulb
brightness in order to find out that energy (or power) dissipated is crucial. They
make measurements using sensors on the current through the bulb and voltage
across it to determine the power dissipated in each of the bulb. If two bulbs are
connected in series, the power dissipated in each of them drops. In steady state,
the one that draws power closer to its normal condition will shine; the other one will
barely glow at all.
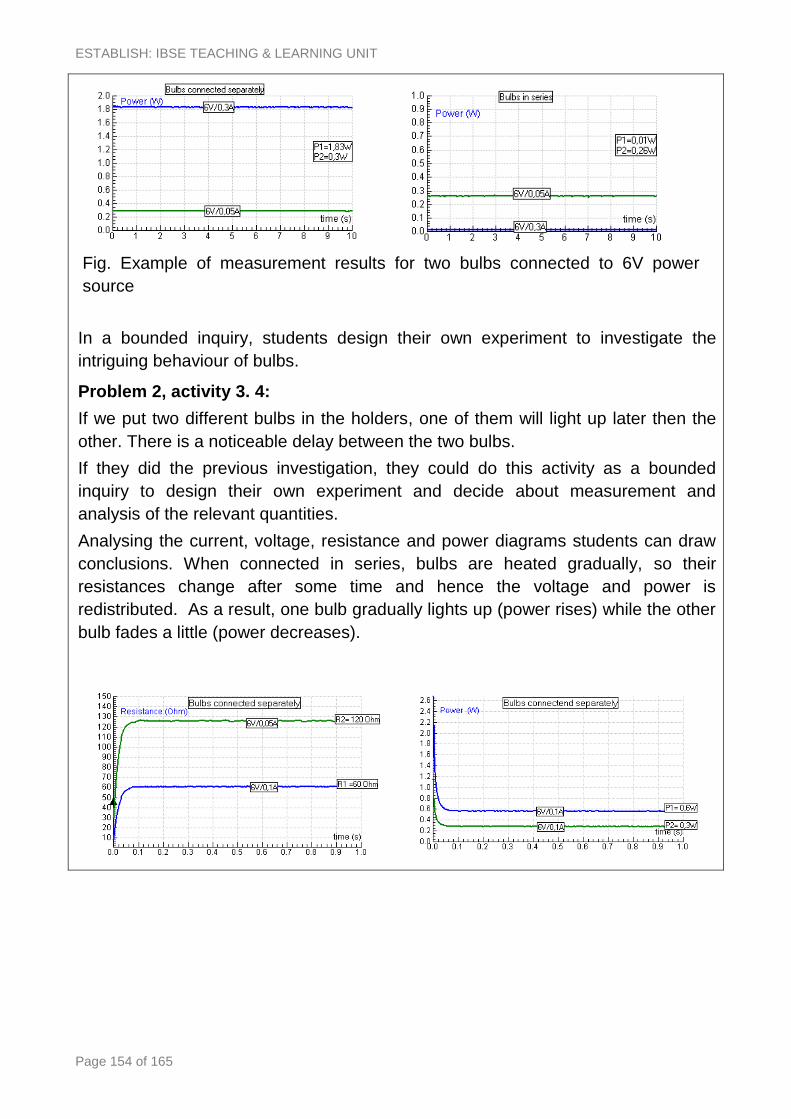
ESTABLISH: IBSE TEACHING & LEARNING UNIT
Page 154 of 165
Fig. Example of measurement results for two bulbs connected to 6V power
source
In a bounded inquiry, students design their own experiment to investigate the
intriguing behaviour of bulbs.
Problem 2, activity 3. 4:
If we put two different bulbs in the holders, one of them will light up later then the
other. There is a noticeable delay between the two bulbs.
If they did the previous investigation, they could do this activity as a bounded
inquiry to design their own experiment and decide about measurement and
analysis of the relevant quantities.
Analysing the current, voltage, resistance and power diagrams students can draw
conclusions. When connected in series, bulbs are heated gradually, so their
resistances change after some time and hence the voltage and power is
redistributed. As a result, one bulb gradually lights up (power rises) while the other
bulb fades a little (power decreases).
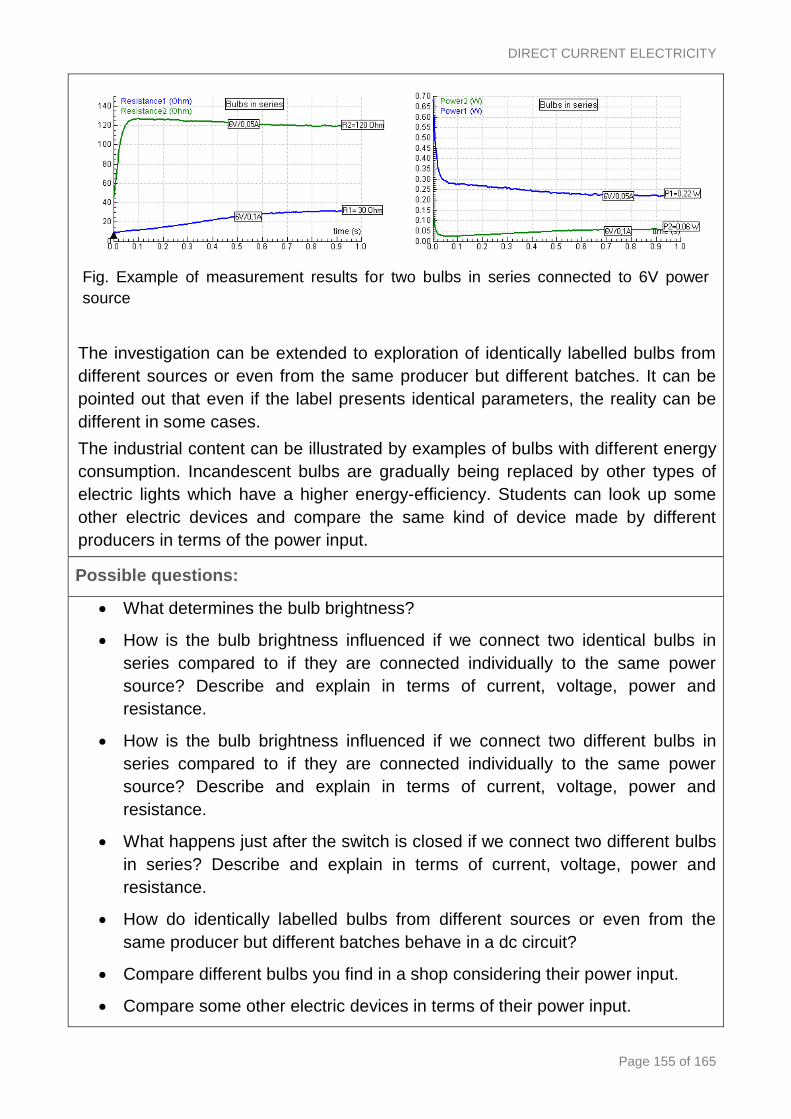
DIRECT CURRENT ELECTRICITY
Page 155 of 165
Fig. Example of measurement results for two bulbs in series connected to 6V power
source
The investigation can be extended to exploration of identically labelled bulbs from
different sources or even from the same producer but different batches. It can be
pointed out that even if the label presents identical parameters, the reality can be
different in some cases.
The industrial content can be illustrated by examples of bulbs with different energy
consumption. Incandescent bulbs are gradually being replaced by other types of
electric lights which have a higher energy-efficiency. Students can look up some
other electric devices and compare the same kind of device made by different
producers in terms of the power input.
Possible questions:
What determines the bulb brightness?
How is the bulb brightness influenced if we connect two identical bulbs in
series compared to if they are connected individually to the same power
source? Describe and explain in terms of current, voltage, power and
resistance.
How is the bulb brightness influenced if we connect two different bulbs in
series compared to if they are connected individually to the same power
source? Describe and explain in terms of current, voltage, power and
resistance.
What happens just after the switch is closed if we connect two different bulbs
in series? Describe and explain in terms of current, voltage, power and
resistance.
How do identically labelled bulbs from different sources or even from the
same producer but different batches behave in a dc circuit?
Compare different bulbs you find in a shop considering their power input.
Compare some other electric devices in terms of their power input.

ESTABLISH: IBSE TEACHING & LEARNING UNIT
Page 156 of 165
Activity 10: Build your own battery
Learning aims:
Understanding the basic principles of the electrochemical cell as a voltage
source
Discovering which combination of materials produce a voltage
Distinguishing between the chargeable and non-chargeable batteries and
main differences between these two types of batteries.
Materials:
Coins of different metal, salt solution (acid, alkaline solution eventually), paper
tissue, lemon, alligator clips, scalpel, graphite pencil (C), iron nail (Fe), magnesium
strip (Mg), zinc strip (Zn), led strips, beaker for electrolysis, sulphuric acid solution
(10%), power supply (6V), two-way switch, interface and software (e.g. CMA
Coach6), voltage sensor (if computer with interface is not available, voltmeter can
be used)
Suggestions for use:
Divide the class into small groups of 2-3 and hand out Classroom Material: Build
your own battery.
The first two activities are aimed at construction of primary cells made from simple
materials and can be carried out in groups as guided inquiry activities. If we lack
time or materials, each group could study different combination of materials and
then all the findings are put together and conclusions are drawn within a class
discussion.
The third activity on building the secondary cell can be carried out as an interactive
experiment presented by the teacher who carries out voltage measurement during
charging/discharging with the help of voltage sensor connected to the computer (or
voltmeter). Nevertheless, students can use their worksheets to record the findings.
While doing the experiment, teacher interacts with students to discuss and answer
the questions in the worksheet.
These activities are good examples to highlight industrial applications. Batteries are
devices that students often use so this is a good starting point to attract their
attention and continue investigation and inquiry. The environmental aspects can be
also mentioned about the batteries disposal and their recycling.
Possible questions:
How is the electrical energy produced in an electrochemical cell?
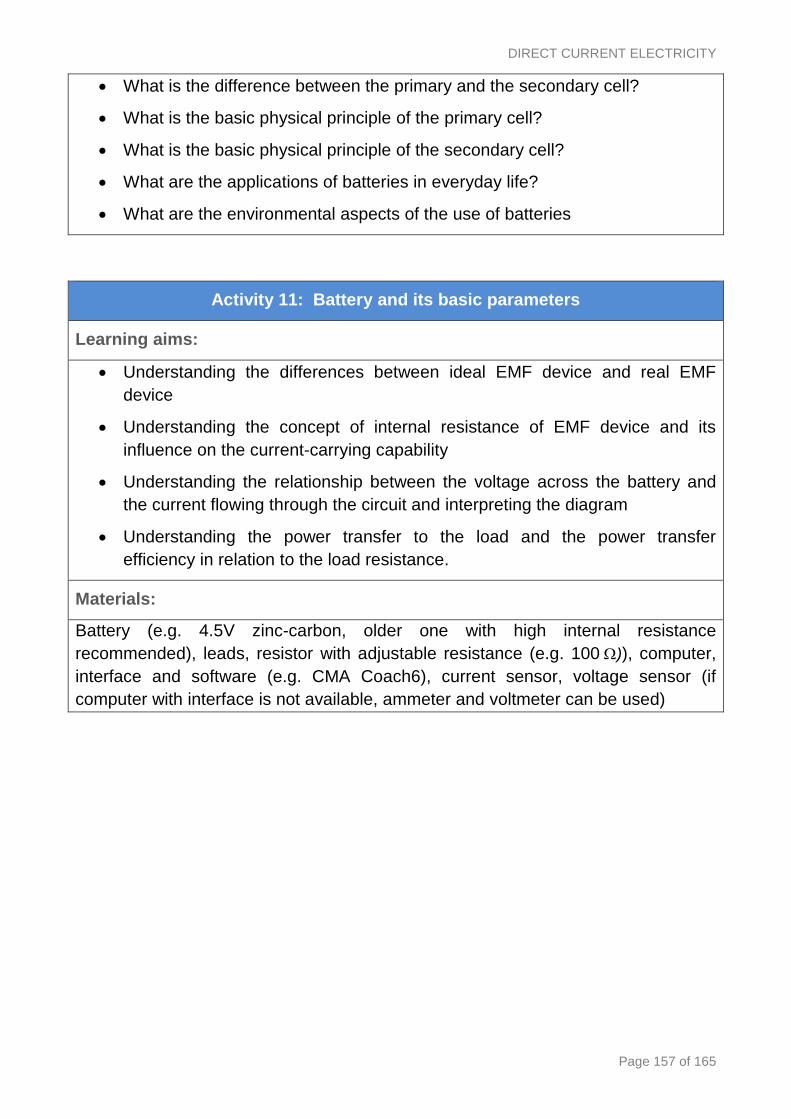
DIRECT CURRENT ELECTRICITY
Page 157 of 165
What is the difference between the primary and the secondary cell?
What is the basic physical principle of the primary cell?
What is the basic physical principle of the secondary cell?
What are the applications of batteries in everyday life?
What are the environmental aspects of the use of batteries
Activity 11: Battery and its basic parameters
Learning aims:
Understanding the differences between ideal EMF device and real EMF
device
Understanding the concept of internal resistance of EMF device and its
influence on the current-carrying capability
Understanding the relationship between the voltage across the battery and
the current flowing through the circuit and interpreting the diagram
Understanding the power transfer to the load and the power transfer
efficiency in relation to the load resistance.
Materials:
Battery (e.g. 4.5V zinc-carbon, older one with high internal resistance
recommended), leads, resistor with adjustable resistance (e.g. 100 )), computer,
interface and software (e.g. CMA Coach6), current sensor, voltage sensor (if
computer with interface is not available, ammeter and voltmeter can be used)
ESTABLISH: IBSE TEACHING & LEARNING UNIT
Page 158 of 165
Suggestions for use:
In this activity students learn about the battery and its properties that influence its
use. Before starting this activity students are already introduced Ohm’s Law, the
concept of energy and power dissipated in the resistor. They understand the
concept of electromotive force (in terms of work or energy) and internal resistance
of the EMF device. Firstly they are introduced that the energy produced by the EMF
device is transferred via resistive dissipation in the external part (load with the total
resistance R) and internal part of the circuit (with internal resistance Ri):
tIRtRItIV
QVVQQV
ie
ie
222
Hence the voltage across the external part of the circuit (i.e. the terminal voltage)
can be expressed as IRVV ie - .
The theoretical background introduction is followed up by four small activities. To
carry them out, divide the class into small groups of 2-3 and hand out Classroom
Material: Battery and its properties. Each group of students can investigate the
behaviour of different battery and finally the results can be compared and
discussed within a class discussion.
In order to gain expected results, the battery used in the experiment should have
quite a large internal resistance (significantly larger than that of the current probe
and the connections) so the minimum external resistance can be set to lower value
than the battery internal resistance itself. The zinc-carbon 4.5V battery works well
since its internal resistance increases significantly as a result of aging.
In the first activity, students explore the behaviour of real battery in a DC circuit
measuring the voltage between its terminals in relation to the current through the
circuit. Using a current and a voltage sensor, they record the voltage-current
relationship and they interpret the diagram. Students learn that the terminal voltage
of real EMF device is always less than the EMF because there is an internal
resistance, Ri. An ideal EMF device has zero internal resistance. They understand
that the internal resistance of the power source influences its current-carrying
capability. The activity is carried out in a guided discovery mode.
In the following two activities, they investigate the power transfer from the battery to
the load and its efficiency in relation to the load resistance. They carry out guided
inquiry in order to discover the condition for the maximum power transfer and
maximum efficiency.
The connection with industry can be stressed by giving examples in which
maximum power transfer or maximum power transfer efficiency is used. The
efficiency of power transfer from the source to the load increases as the load
resistance increases. However, the maximum power transfer is achieved when the
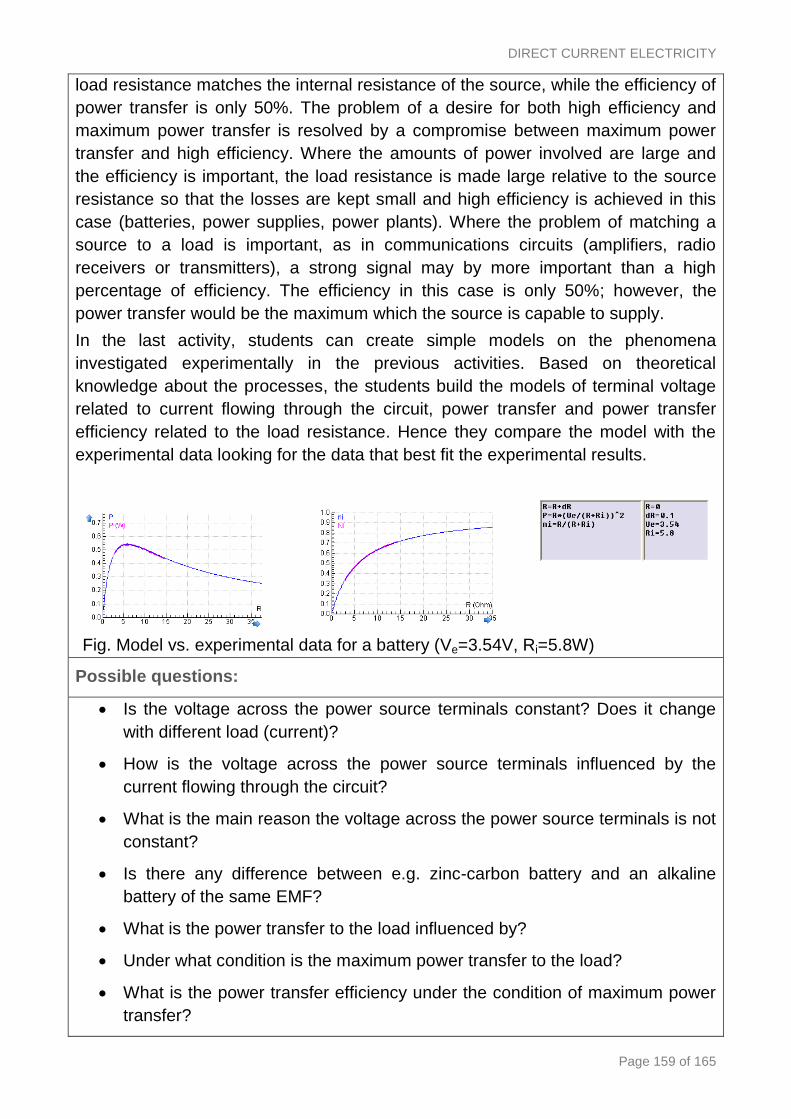
DIRECT CURRENT ELECTRICITY
Page 159 of 165
load resistance matches the internal resistance of the source, while the efficiency of
power transfer is only 50%. The problem of a desire for both high efficiency and
maximum power transfer is resolved by a compromise between maximum power
transfer and high efficiency. Where the amounts of power involved are large and
the efficiency is important, the load resistance is made large relative to the source
resistance so that the losses are kept small and high efficiency is achieved in this
case (batteries, power supplies, power plants). Where the problem of matching a
source to a load is important, as in communications circuits (amplifiers, radio
receivers or transmitters), a strong signal may by more important than a high
percentage of efficiency. The efficiency in this case is only 50%; however, the
power transfer would be the maximum which the source is capable to supply.
In the last activity, students can create simple models on the phenomena
investigated experimentally in the previous activities. Based on theoretical
knowledge about the processes, the students build the models of terminal voltage
related to current flowing through the circuit, power transfer and power transfer
efficiency related to the load resistance. Hence they compare the model with the
experimental data looking for the data that best fit the experimental results.
Fig. Model vs. experimental data for a battery (Ve=3.54V, Ri=5.8W)
Possible questions:
Is the voltage across the power source terminals constant? Does it change
with different load (current)?
How is the voltage across the power source terminals influenced by the
current flowing through the circuit?
What is the main reason the voltage across the power source terminals is not
constant?
Is there any difference between e.g. zinc-carbon battery and an alkaline
battery of the same EMF?
What is the power transfer to the load influenced by?
Under what condition is the maximum power transfer to the load?
What is the power transfer efficiency under the condition of maximum power
transfer?
ESTABLISH: IBSE TEACHING & LEARNING UNIT
Page 160 of 165
Under what condition is the maximum power transfer efficiency reached?
What is the main goal: to achieve the maximum power transfer or maximum
power transfer efficiency?
Activity 12: Batteries in series and in parallel
Learning aims:
Understanding what is the purpose of batteries in series and how the series
connection of batteries influences its characteristics
Understanding what is the purpose of batteries in parallel and how the
parallel connection of batteries influences its characteristics
Materials:
Two (or more) batteries (e.g. 4.5V zinc-carbon battery), leads, resistor with
adjustable resistance (e.g. 100 ), computer, interface and software (e.g. CMA
Coach6), current sensor, voltage sensor (if computer with interface is not available,
ammeter and voltmeter can be used)
Suggestions for use:
In this activity, students investigate the behaviour of batteries connected in series
and in parallel in order to find out the purpose of these connections. They should be
already familiar with the battery characteristics in terms of EMF and internal
resistance as well as with the series and parallel connection of resistors.
Divide the class into small groups of 2-3 and hand out Classroom Material: Battery
in series and in parallel. The activity can be carried out in a bounded inquiry
mode. They can investigate the connection of identical or different batteries.
Students plan the experimental procedure on their own and draw conclusions about
the EMF and internal resistance of a battery that is equivalent to series or parallel
connections. They can investigate the power supplied to the load.
Linear fits to terminal voltage vs. current allow students to extract values for EMF
and internal resistance and compare the calculated maximum power and the load
resistance at which it occurs with the experimental data.
Possible questions:
How does the EMF and internal resistance change if batteries are connected
in series (parallel)?
Discuss the connection of two identical and two different batteries.
How to connect two batteries for maximum power transfer to the load?
DIRECT CURRENT ELECTRICITY
Page 161 of 165
Activity 13: How electric eel kills its prey
Learning aims:
Applying knowledge about the properties of batteries connected in
series/parallel in a real life situation
Understanding the effects of electricity on a living organism
Materials:
Text about the electric eel
Internet resources on how the electric eel creates electricity
Suggestions for use:
In this activity, students apply previously gained knowledge in a real life situation of
the animal world. Students study the text or use other internet resources about the
electric eel. On the basis of it they can prepare a short presentation analysing and
explaining the fact that the electric eel can manage to produce a current in order to
kill its prey without shocking itself. The interdisciplinary physics-biology approach
can be enhanced by looking up information about the anatomy and physiology of
electric eel (electric ray, electric catfish, etc.) and its organs producing electricity.
The activity can be carried out in a bounded inquiry mode, e.g. as a home
assignment. Students in groups or individually search information in order to
present and discuss it in front of the class.
Possible questions:
How can the electric eel manage to produce a current that large without
shocking itself?
What are the EMF devices of the electric eel? How are they connected?
Draw a sketch of its EMF devices.
What is the typical voltage produced by the electric eel?
Explain why the eel kills its prey and does not hurt itself.
What other animals hunt prey in the same way?

ESTABLISH: IBSE TEACHING & LEARNING UNIT
Page 162 of 165
Activity 14: How much energy supplies a battery?
Learning aims:
Understanding that battery stores energy that is consumed by load
Understanding how much charge and energy is supplied by a battery
measuring current and voltage in a circuit.
Understanding the properties of good battery in terms of life and economy
Understanding what parameters producers take into account in order to build
a battery appropriate for its application.
Materials:
Batteries of the same size (e.g., AAA, AA, C, D) and different producers,
connecting leads, computer, interface and software (e.g. CMA Coach6), voltage
sensor (not necessarily), current sensor (if current sensor is not available, the
resistor of known value RA is recommended, e.g. RA=1 in order to measure
current)
Suggestions for use:
The activity is aimed at understanding the battery properties in terms of energy it
can supply to the circuit and what battery is considered to be good. During one
lesson, students set several measuring spots depending on how many batteries are
going to be measured. They can use the same EMF value batteries from different
producers (non-chargeable and chargeable, eventually). They measure current and
voltage across the external load during battery discharging. Since the measurement
can last up to 24 hours, it is recommended to start the measurement during one
lesson and the next day to save the results. Then, students working in groups of 2-
3 analyse the results. Each group analyses one of the measured batteries. Firstly,
they determine battery capacity from the area under current-time graph. Then they
analyse the power delivered to the external part of the circuit and hence they count
the energy amount delivered to the circuit by determining the area under power vs.
time graph. Finally, the groups compare their results for batteries of different
producers in term of energy delivered to the load and they draw conclusions.
Measurements can be made in a guided inquiry manner according to the
instructions in the worksheet. Teacher can also use the activity in a bounded inquiry
mode depending on the students’ level of understanding
This activity offers a lot of industrial applications. They include the knowledge about
other properties of the battery that are important for the consumer (chargeable,
non-chargeable, voltage, current, energy supply, life, economy, price, weight, self-
discharging of batteries, memory effects of chargeable batteries).

DIRECT CURRENT ELECTRICITY
Page 163 of 165
The activity can be followed by an open inquiry assignment aimed at formulating
some other research questions considering the properties of batteries, e.g. the self-
discharge, the effect of temperature on the battery performance, the memory
effect, battery performance when the operation is interrupted several times (the
effect on the terminal voltage and current), etc. Students design an experiment in
order to answer the research question.
Possible questions:
What energy is stored in a battery?
How much charge is stored in a battery?
What is the energy delivered into the circuit during the battery discharging?
What parameters should be taken into account when you buy a battery for a
certain purpose?
Research questions can include:
What do we mean by self-discharge, memory effect?
What is the influence of temperature on the battery performance?
How does the battery work when its operation is interrupted several times?
Activity 15: Batteries and their reasonable use
Learning aims:
Understanding the industrial and environmental aspects of batteries.
Understanding the basic principles and properties of batteries to learn about
the applications of batteries in everyday life regarding their purpose of use.
Understanding the environmental aspects of batteries (disposal and
recycling).
Materials:
Internet resources, available printed resources
Suggestions for use:
Once they understand the principles and properties of batteries, students can work
on the industrial applications and environmental and ecological aspects of batteries.
This activity is aimed at small home assignments meant as project work to search
for information on a selected problem and prepare a short presentation for the
class. The activity can be carried out as an open inquiry assignment. Student

ESTABLISH: IBSE TEACHING & LEARNING UNIT
Page 164 of 165
working in groups can formulate their own problem to solve. They use internet
resource and other available printed resources to search relevant information.
Possible questions:
Possible assignments to carry out an open inquiry on industrial and environmental
aspects of batteries can include:
Look for information about non-rechargeable batteries that are available in
stores. Find out what materials they consist of, what are the voltages
produced and energy supplied and what they are mainly used for.
Look for information about chargeable batteries, e.g. a car battery. Describe
its properties and name the possible problems the user can come across
with.
Look for information about chargeable batteries that are available in stores.
Find out what materials they consist of, what are the voltages produced and
energy supplied and what they are mainly used for.
Compare batteries of the same size and EMF from different producers.
Battery electric vehicle and its future perspective.
What rules should people follow in regard to batteries disposal and recycling
(where is a battery recycling place close to your school?).
What are the environmental hazards of batteries?
DIRECT CURRENT ELECTRICITY
Page 165 of 165
Activity 16: Other alternative electrical sources
Learning aims:
Introduce other electrochemical sources, such like a fuel cell
Introduce a photovoltaic cell
Materials:
Internet sources, other sources about the fuel cell and a photovoltaic cell
Suggestions for use:
This activity can be carried out as a bounded inquiry. Students are given a task to
prepare a presentation on the alternative electrical sources, like fuel cell and
photovoltaic cell. They are expected to prepare a presentation for their peers. Some
of the resources can include:
http://en.wikipedia.org/wiki/Photovoltaics#Solar_cells
http://en.wikipedia.org/wiki/Fuel_cell
Possible questions:
How does photovoltaic cell work?
What is the photovoltaic cell used for?
How does the fuel cell work?
What are the applications of the cells?