Embed Size (px)
Citation preview

ESS Construction ProposalLoKI - A broad-band SANS instrument
ProposersDr. Andrew J Jackson, ESS & Lund University, Sweden
Dr. Kalliopi Kanaki, ESS, Sweden
Scientific PartnersProf. Lise Arleth, Copenhagen University, Denmark
Dr. Joachim Kohlbrecher, Paul Scherrer Institue, SwitzerlandProf. Adrian Rennie, Uppsala University, Sweden


Executive Summary
Small angle neutron scattering is a technique that is applied across a spectrum of scientificdisciplines, with users from chemistry, physics, biology, materials science, engineeringand geoscience. LoKI is designed primarily with the needs of the soft matter, biophysicsand materials science communities in mind and the trend in all of these fields is towardscomplexity and heterogeneity.
Complexity manifests itself in the study of multi-component systems studied as a functionof multiple environmental conditions (e.g. pressure, temperature, shear, magnetic field)simultaneously. In order to be able to examine the possible parameter space, a combi-nation of faster measurements, measurements on smaller sample volumes, and measure-ments with good signal-to-noise is required.
Heterogeneity is seen both spatially and temporally. Spatial heterogeneity is manifestedas different structure at different length scales, from the nanometre scale to the millimetrescale. This can be driven by applied stimuli such as shear, flow, electrical or magneticfields, or by intrinsic structural features of the material. Examples of the former are shearbanding in surfactant systems and the flow re-orientation of polymers. Examples of thelatter are nano-composite materials, multi-component gels, and porosity in rocks. To ad-dress this spatial heterogeneity requires a wide Q range to examine the sub-micrometrelength scales and small beams to examine the heterogeneity on the millimetre scale. Fur-thermore, since these heterogeneities are often driven by non-equilibrium conditions, theaccessible Q range must be measured simultaneously. Temporal heterogeneity is seen inthe form of stimulus-response experiments (e.g. shear relaxation), in the kinetics of for-mation of materials when the components of the material are mixed (e.g. mixed micelleformation) and in the growth of biomolecule aggregates such as fibrils. In order to ex-amine these systems with sufficient time resolution a high neutron flux is required and awide simultaneous Q range is needed.
Not only are the systems of interest becoming more complex and heterogeneous, but theyare also becoming smaller in volume. Examples of this are the small amounts of proteincomplexes that can be purified and deuterated, thin film systems such as organic photo-voltaics, and bio-mimetic or polymer membranes.
The ability to reach Q values above the typical 0.8 to 1.0 A−1 opens up significant ar-eas of new science when combined with wide-angle scattering studies and the rapidlyadvancing fields of materials simulation. The study of, for example, ionic liquids andtheir ordering in the presence of solutes calls for the combination of SANS, wide-anglescattering and atomistic or coarse-grained molecular dynamics simulations. The analysistechniques used in biological solution scattering, such as ab-initio shape reconstruction,require data out to high Q as do studies of nano-composite materials where the size of theparticles or domains may be only a few nanometres.
LoKI is designed to address these needs by providing a high flux - at least 10 times thecurrent leading reactor based instrument - and a broad simultaneous Q range of at leastthree orders of magnitude. This is achieved by the choice of instrument length (10m colli-mation + 10m sample to detector distance instrument with the sample position 20 m fromthe moderator) and a large solid angle of detector coverage.
Whilst some of the types of experiment mentioned above are done at present, they areoften tour-de-force studies pushing the capabilities of today’s instruments. LoKI will pro-vide a world leading combination of high neutron flux and wide simultaneous Q rangewith the ability to study smaller samples and with these characteristics, LoKI will enablescientists to answer the challenging materials science questions of tomorrow in fields fromhealth and aging, to sustainability and energy security.

Contents
1 Scientific Impact 1
2 User Base and Demand 3
3 Description of Instrument Concept and Performance 53.1 Introduction . . . . . . . . . . . . . . . . . . . . . . . . . . . . . . . . . . . . . . . 53.2 Instrument Objectives . . . . . . . . . . . . . . . . . . . . . . . . . . . . . . . . . 53.3 Instrument Overview . . . . . . . . . . . . . . . . . . . . . . . . . . . . . . . . . . 63.4 Beam Delivery . . . . . . . . . . . . . . . . . . . . . . . . . . . . . . . . . . . . . . 63.5 Sample Area . . . . . . . . . . . . . . . . . . . . . . . . . . . . . . . . . . . . . . . 123.6 Detectors . . . . . . . . . . . . . . . . . . . . . . . . . . . . . . . . . . . . . . . . . 123.7 Estimates of Instrument Performance . . . . . . . . . . . . . . . . . . . . . . . . 15
4 Strategy and Uniqueness 21
5 Technical Maturity 235.1 Location . . . . . . . . . . . . . . . . . . . . . . . . . . . . . . . . . . . . . . . . . 235.2 Risk Management . . . . . . . . . . . . . . . . . . . . . . . . . . . . . . . . . . . . 23
6 Costing 27

1 Scientific Impact
Small angle neutron scattering is a technique that is applied across a spectrum of scientificdisciplines, with users from chemistry, physics, biology, materials science, engineering andgeoscience. LoKI is designed primarily with the needs of the soft matter, biophysics and ma-terials science communities in mind and the trend in all of these fields is towards complexityand heterogeneity.
Complexity manifests itself in the study of multi-component systems studied as a functionof multiple environmental conditions (e.g. pressure, temperature, shear, magnetic field) si-multaneously. In order to be able to examine the possible parameter space, a combinationof faster measurements, measurements on smaller sample volumes, and measurements withgood signal-to-noise is required.
Heterogeneity is seen both spatially and temporally. Spatial heterogeneity is manifested asdifferent structure at different length scales, from the nanometre scale to the millimetre scale.This can be driven by applied stimuli such as shear, flow, electrical or magnetic fields, orby intrinsic structural features of the material. Examples of the former are shear bandingin surfactant systems and the flow re-orientation of polymers. Examples of the latter arenano-composite materials, multi-component gels, and porosity in rocks. To address this spa-tial heterogeneity requires a wide Q range to examine the sub-micrometre length scales andsmall beams to examine the heterogeneity on the millimetre scale. Furthermore, since theseheterogeneities are often driven by non-equilibrium conditions, the accessible Q range mustbe measured simultaneously.
Temporal heterogeneity is seen in the form of stimulus-response experiments (e.g. shear re-laxation), in the kinetics of formation of materials when the components of the material aremixed (e.g. mixed micelle formation) and in the growth of biomolecule aggregates such asfibrils. In order to examine these systems with sufficient time resolution a high neutron fluxis required and a wide simultaneous Q range is needed.
Not only are the systems of interest becoming more complex and heterogeneous, but they arealso becoming smaller in volume. Examples of this are the small amounts of protein com-plexes that can be purified and deuterated, thin film systems such as organic photovoltaics,and bio-mimetic or polymer membranes. In these cases it is vital that the instrumental back-ground be as low as possible in order to discern the small scattering signal obtained.
Through the use of neutron event recording, which identifies the time of arrival of each neu-tron at the detector, LoKI will allow the scientist to make this decision on the fly and variablyas a function of Q. This is valuable for materials such as block-copolymer blends where thereare strong peaks in the data that require high resolution but the inter-peak scattering is oflower intensity and so requires more neutron counts but can make use of lower resolution.In particular there is a need to have good Q resolution at high Q, for example in studies offibres, liquid crystals or multi-lamellar systems such as lipid or surfactant vesicles. The abilityto make use of longer wavelength, higher time resolution, neutrons at high angles will be keyto being able to make use of post-measurement resolution tuning. This requirement demandsa large solid angle of detectors and thus potentially a large area detector close to the sample.
The ability to reach Q values above the typical 0.8 to 1.0 A−1 opens up significant areas of newscience when combined with wide-angle scattering studies and the rapidly advancing fieldsof materials simulation. The study of, for example, ionic liquids and their ordering in thepresence of solutes calls for the combination of SANS, wide-angle scattering and atomistic orcoarse-grained molecular dynamics simulations. The analysis techniques used in biologicalsolution scattering, such as ab-initio shape reconstruction, require data out to high Q as do
1

studies of nano-composite materials where the size of the particles or domains may be only afew nanometres.
Non-equilibrium studies often use complex sample environment and require strong integra-tion of the sample environment with the neutron measurement in order to tie sample condi-tions tightly to the measured scattering. Space is also required for the use of in-situ comple-mentary measurement techniques, for example light or x-ray scattering, or UV spectroscopysimultaneously with the neutron scattering measurement. LoKI has a flexible sample areathat can be easily re-tooled for different experiments through the use of interchangeable sam-ple environment platforms.
Whilst some of the types of experiment mentioned above are done at present, they are oftentour-de-force studies pushing the capabilities of today’s instruments. LoKI provides a worldleading combination of high neutron flux and wide simultaneous Q range with the ability tostudy small samples.
With these characteristics, LoKI will enable scientists to answer the challenging materialsscience questions of tomorrow in fields from health and aging, to sustainability and energysecurity.
2 User Base and Demand
The community of small angle scattering users is large in number and covers a wide rangeof scientific disciplines. Demand for access to SANS beamtime is high, with major scatteringcentres regularly having oversubscription levels of 3 or more. It is indicative of the demandthat as more SANS instruments have been built, oversubscription has remained high.
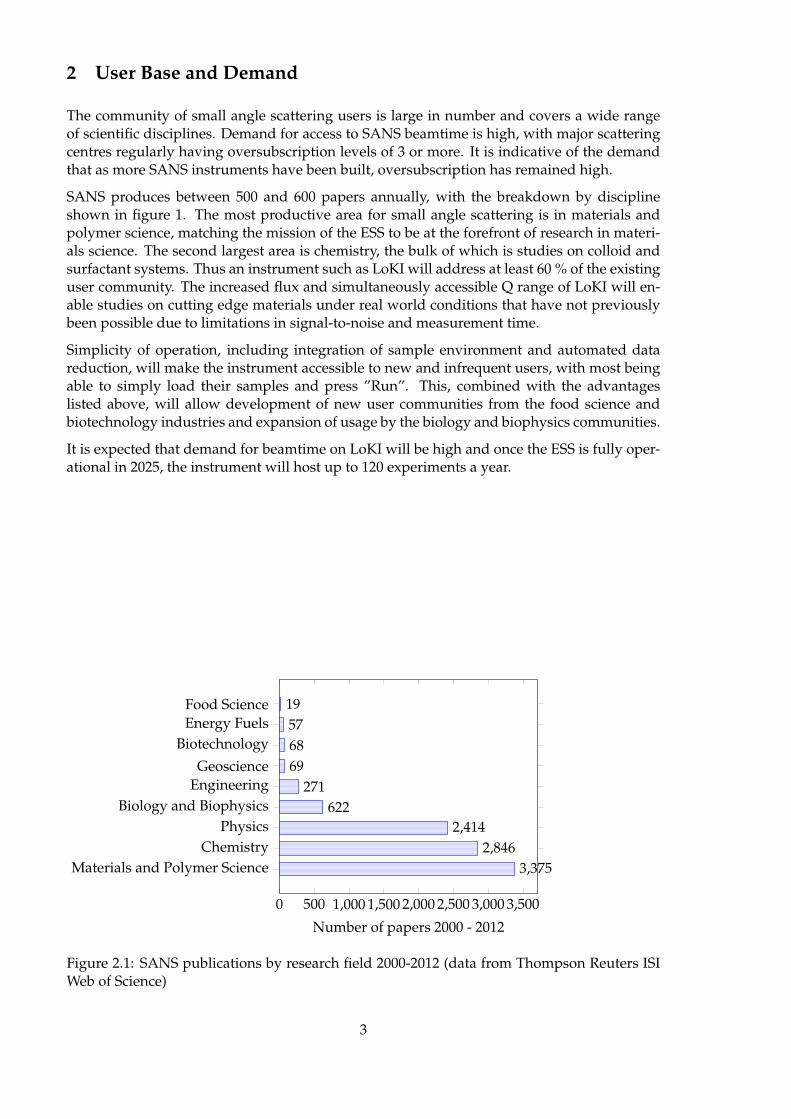
SANS produces between 500 and 600 papers annually, with the breakdown by disciplineshown in figure 1. The most productive area for small angle scattering is in materials andpolymer science, matching the mission of the ESS to be at the forefront of research in materi-als science. The second largest area is chemistry, the bulk of which is studies on colloid andsurfactant systems. Thus an instrument such as LoKI will address at least 60 % of the existinguser community. The increased flux and simultaneously accessible Q range of LoKI will en-able studies on cutting edge materials under real world conditions that have not previouslybeen possible due to limitations in signal-to-noise and measurement time.
Simplicity of operation, including integration of sample environment and automated datareduction, will make the instrument accessible to new and infrequent users, with most beingable to simply load their samples and press ”Run”. This, combined with the advantageslisted above, will allow development of new user communities from the food science andbiotechnology industries and expansion of usage by the biology and biophysics communities.
It is expected that demand for beamtime on LoKI will be high and once the ESS is fully oper-ational in 2025, the instrument will host up to 120 experiments a year.
0 500 1,000 1,500 2,000 2,500 3,000 3,500
Food ScienceEnergy Fuels
Biotechnology
GeoscienceEngineering
Biology and BiophysicsPhysics
ChemistryMaterials and Polymer Science
19576869
271622
2,4142,846
3,375
Number of papers 2000 - 2012
Figure 2.1: SANS publications by research field 2000-2012 (data from Thompson Reuters ISIWeb of Science)
3


3 Description of Instrument Concept and Performance
3.1 Introduction
In order to maximise the utility of the instantaneous flux that will be available at the ESS, itis important to design SANS instruments that can use the whole pulse and access as wide aspossible a Q range in a single measurement. Indeed, the SANS STAP has recommended thatthree orders of magnitude in Q simultaneously should be our target. Historically, SANS in-struments at reactor sources have had variable collimation and moveable detectors to enablea wide Q range to be examined. There is now a trend towards using multiple detector banksto access more scattering angle at the same time and this proposal considers such a method inextremis with a novel detector geometry using new detector technologies based on 10B thinfilm systems.
Figure 3.1: Time Resolution as a function of wavelength (contours) and maximum Bandwidthat a given distance from the source (grey line, right hand scale)
Figure 2 shows the time resolution and bandwidth as a function of distance from the mod-erator at ESS. In order to access the maximum possible Q range, ideally we would place ourdetectors close to the source in order to maximise the accessible bandwidth. However thiscomes at the cost of rather poor resolution, even for SANS, and tight space constraints. Thuswe balance the bandwidth with resolution and space requirements for sample environment.The primary focus, however, is maximising simultaneously accessible Q.
In order to achieve a very broad dynamic Q range, a large solid angle of detectors is requiredand to this end, two options for detector layout are presented.
3.2 Instrument Objectives
1) Broad simultaneous Q range: Q < 1× 10⁻³ A−1 to Q > 1 A−1 with pinhole collimationgeometry.
2) High flux making maximum use of the high source brightness at the ESS.
3) Flexible sample area to allow for a variety of sample environment equipment.
4) Simplicity of operation for non-experts including automated data reduction.
5

3.3 Instrument Overview
LoKI has a maximum sample-to-detector distance of 10 m and a maximum collimation lengthof 10 m. This is dictated by the balance of bandwidth and achieving a sufficiently low angleof scattering. Once space for the initial optical components has been included, this leads to amaximum source-to-detector distance of 30 m.
The instrument will therefore have an overall length (moderator to back of detector tank) ofup to 40m including shielding. Figure 3.2 shows the baseline layout of the instrument.
The instrument will have two operation modes:
Mode 1: A chopper is used running at the source frequency. This mode provides for operationacross the frame boundary and provides the maximum bandwidth whilst avoiding frameoverlap.
Mode 2: The same chopper as Mode 1 is used but running at half the source frequency. Thismode provides for measurement across two source frames and doubles the bandwidth com-pared to Mode 1.
3.4 Beam Delivery
The guide size is 3 cm x 3 cm throughout the whole instrument.
Bender
A bender is used to avoid line-of-sight to the moderator and also acts as a short wavelengthcut-off filter. In order to get twice out of line-of-sight and to keep the bender within themonolith, the radius must be 78 m and the length 4 m (Figure 3.3). In addition to obtainingan offset of twice line-of-sight at the sample position, the bender gives more than one timesline-of-sight offset at the start of the collimation section.
Simulations of bender transmission (Figure 3.4) show that 4 channels with an m=4 coatingprovide greater than 80% of the transmission of a straight m=4 guide above 4A , and greaterthan 80% of the transmission of a straight m=1 guide above 2A .
The increases in transmission seen for an m=4 over that of an m=3 bender could be the resultof simply transporting higher divergence neutrons that will not be useful in the instrument.Figure 3.5 shows the vertical and horizontal divergence at the end of the bender as a functionof wavelength and guide coating. The maximum useable divergence is±0.4◦ in each directionand the white boxes thus show the useable neutrons. We can see that m=3 is clearly betterthan m=2 in both directions and that m=4 is transporting more high divergence neutronsoutside the useable range than m=3 as expected. However, this may be a reasonable trade-offas the useful range is better filled at m=4, at least in terms of the horizontal divergence.
Wavelength Band Selection
Wavelength selection and frame overlap prevention is performed using two double-disc chop-pers. The first chopper, located at 6.5 m from the source, has two co-rotating discs, each witha 120◦ opening. This provides for an adjustable chopper aperture through variation of thephasing between the two discs. The second chopper, located at 9.8 m from the source, isidentical to the first and provides the frame overlap prevention.
As introduced above, LoKI provides two modes of operation offering different wavelengthbands and hence different Q ranges.

Figure 3.2: Baseline instrument layout (to scale, dimensions in mm)

Figure 3.3: Top view of the guide system showing avoidance of line-of-sight using 4m longbender
Figure 3.4: Simulated bender transmission for m = 3 and m = 4 multi-channel benders.
Mode 1 has the choppers running at 14 Hz. To access the wavelength band from 3 A to 10.5A (1.8 A to 11.6 A with penumbra), an open time of 15.16 ms is required as seen in Figure 3.6.The timing of the chopper with respect to the source can be adjusted such that different rangesof wavelength can be selected. Such an offset is shown in Figure 3.7 where 10.5 A to 18.0 A (9.3A to 19.1 A with penumbra) neutrons are selected. This allows the scientist to select for lowerQ values whilst still using every pulse from the source. Such operation will also improve thewavelength resolution, as longer wavelengths will be used.
Mode 2 has the choppers running at 7 Hz. This allows access to the wavelength band from3 A to 19.9 A (1.8 A to 21.0 A with penumbra), using every other source pulse as shown inFigure 3.8. In order to achieve this range whilst still completely filling the frame the opentime of the choppers must be adjusted, by changing the phasing of the discs, to be longerthan twice that of 14Hz operation.
Prompt Pulse
Operating in Mode 2, where every other frame is skipped, means that whilst the chopperswill block the cold neutrons from the source the fast neutrons in the prompt pulse will not

-2
-1
0
1
2
Horiz
onta
l Div
erge
nce
(deg
rees
)
302520151050Wavelength (Å)
m=4-2
-1
0
1
2
Horiz
onta
l Div
erge
nce
(deg
rees
)302520151050
Wavelength (Å)
m=3-2
-1
0
1
2Ho
rizon
tal D
iver
genc
e (d
egre
es)
302520151050Wavelength (Å)
m=2
-2
-1
0
1
2
Vert
ical
Div
erge
nce
(deg
rees
)
302520151050Wavelength (Å)
m=4-2
-1
0
1
2
Vert
ical
Div
erge
nce
(deg
rees
)
302520151050Wavelength (Å)
m=3-2
-1
0
1
2
Vert
ical
Div
erge
nce
(deg
rees
)
302520151050Wavelength (Å)
m=2
Figure 3.5: Simulated divergence at the bender exit for m = 2, m = 3 and m = 4 multi-channelbenders. The white box indicates the useable divergence-wavelength space.
be blocked. This could appear twice in every measurement frame as extraneous signal on thedetectors, rendering up to 12 ms of the frame unusable as the prompt pulse is expected toextend beyond the nominal pulse width of 3 ms. The use of the bender to take the sampleposition twice out of line-of-sight from the moderator means that such neutrons should notreach the instrument directly down the guide. However, if the shielding is inadequate, theprompt signal may still appear. This requires study by the ESS target and instrument supportdivisions and is discussed further under Risk Management in section 5.
Chopper Speed
Modes 1 and 2 both employ relatively slow choppers (840 rpm and 420 rpm respectively) andthus the amount of time it takes to open or close the guide as the chopper passes could be aproblem. Using a 70 cm diameter chopper, the guide crossing time at 14 Hz is approximately1.2 ms for a 3 cm guide. At 7 Hz it is twice that value, 2.4 ms. In each mode, this leads to apossible reduction in the minimum and maximum accessible wavelengths by introducing asmall frame overlap which can be mitigated by simply rejecting events in the overlap range.This is not, however, a significant performance issue since the flux in the overlap region willbe very low already.
Guides and Collimation
Following the first chopper pair, there is a static section of m=1 guide, extending to a position9.6 m from the source, to restore uniformity to the distribution of neutrons over the guide exit.

Figure 3.6: (top) Time-distance diagram showing the available wavelength band of 3 to 10.5A (1.8 to 11.6 A) available in Mode 1. (bottom) Monte-carlo simulated spectrum at the sampleposition for 5m (solid line) and 10 m (dashed line) collimation.

Figure 3.7: Time-distance diagram showing and alternative use of the choppers to give anavailable wavelength band of 10.5 to 18.0 A (9.3 to 19.1 A) available in Mode 1.
Collimation of the beam will be performed using apertures and two regions of automaticallyinterchangeable guides. The interchangeable sections of guide will be 4.8 m long and 3 m longrespectively (see figure 3.2). Automatically changeable apertures will be located at the start ofthe collimation section (10 m from source), after the first interchangeable section (15 m fromsource) just outside the common shielding bunker and after the second interchangeable guidesection (18m from the source). A manually interchangeable evacuated flight path will beprovided between the end of the guide at 18m and the sample position at 20m with differentlengths available to accommodate different sample environment.
As part of the initial engineering design phase, the possibility of keeping the guides in placewhilst having only the apertures change to adjust the collimation will be investigated.
Optional Instrument Optics
The final 3m section of interchangeable guide and 2m of evacuated flight path is outsidethe heavy common shielding. It will thus have more space for possible additional compo-nents such as focussing optics in the form of magnesium fluoride lenses or concentric mirrors(Wolter optics). The study of the possibilities for using focussing optics to achieve lower Qwith larger samples, and thus at higher flux, is ongoing.
This space between the end of the guide (at 18m) and the sample could also be used to housea set of SESANS coils to allow for simultaneous SANS and SESANS using a high resolutiondetector in the beamstop. It is desirable to measure the direct beam for normalisation of thedata in any case (see section 3.6). In order to accommodate this option, it may be necessary forthe detector vacuum vessel to move backwards to increase the space available. This option

Figure 3.8: Time-distance diagram showing and alternative use of the choppers to give anavailable wavelength band of 3 to 19.9 A (1.8 to 21.0 A) available in Mode 1.
will be considered further during the engineering design phase in collaboration with the workunit on spin-echo SANS.
3.5 Sample Area
The sample area allows for the use of relatively large (up to 2 m along and 3 m perpendicularto the beam direction) sample environment.
A system of removable sample environment packages is used that can be set up off line andthen inserted into position reproducibly (similar to the system used on SANS2D at ISIS). Thisallows for for rapid changeover between users and simpler setup of sample environmentgiven the likely limited access space at the sample position. This system is particularly valu-able when setting up equipment such as rheometers and shear cells, where the sample aper-tures need to be carefully aligned with the gap in the cell. It also ensures that complex sampleenvironment can be tested offline without it having to be dismantled again to insert it at thebeam position.
3.6 Detectors
SANS instrument have for many years made use of 3He based area detectors or 3He basedtubes placed to form area detectors. There is a worldwide shortage of 3He that is unlikely toimprove and so alternative detector technologies are being developed in a collaboration be-tween neutron scattering facilities. Whilst many of these new detectors look very promising,it will not be clear for at least a few years how well they perform in real world use.

Figure 3.9: Layout of the proposed Boron-10 ”lined tube” detector (to scale)
Figure 3.10: Detail of the proposed 10B ”lined tube” detector.
Thus, two possible detector configurations that meet the scientific requirements are described.The final design of the instrument will use one of these based on the results of the initialengineering design phase and on the direction taken by developments in detector design andavailability of technologies.
”Lined Tube”
The baseline design of the instrument has a novel detector configuration making use of thecharacteristics of 10B thin film based detectors as shown in figures 10 and 11. Here 10B baseddetectors lie on the outside of a cylindrical vacuum vessel. The shallow angle that neutronsintersect the detector elements results in efficient capture of the neutron and high detectionefficiency across the wavelength band of the instrument.
The detector elements are 10 cm wide by 40 cm long and have wires at 5 cm spacing runningperpendicular to the beam direction. This provides good resolution along Q but relativelypoor resolution perpendicular to Q. This is acceptable for azimuthally symmetric scatteringthat can be averaged to a 1 dimensional scattering curve, but is not suitable for studies oforiented systems where good azimuthal resolution is required. A second set of detectionwires running along the beam direction, or a micro-strip type cathode readout, will providethe necessary azimuthal resolution for such studies.
A high resolution (2 mm or better) detector will be placed in the rear of the detector vesseland a scintillator based technology will most likely be used.
To avoid cross-talk between detectors across the detector vessel, a cone of neutron absorb-

Figure 3.11: Possible scheme of cross-talk prevention and vessel strengthening through theinclusion of ribs running around the internal circumference of the vaccum tank between de-tection elements.
ing material (as shown in Figure 3.9) is mounted such that the rear detector is still viewable.Whilst there is a gap in measured angle, there is no gap in Q due to the wavelength band cov-ered. The cone will be of a bellows type design to allow the rear detector to move along thebeam axis within the vacuum vessel. This allows the optimum collimation to be maintainedwhen the detector vessel is moved to accommodate sample environment. Alternatively, ab-sorbing ribs will be fitted around the circumference of the tank to separate the detection ele-ments as shown in Figure 3.11. This has the advantage that the ribs also act as stiffening forthe vacuum vessel, allowing the walls to be thinner. These options will be explored in furtherdetail during the initial engineering phase of construction.
Energy Resolution
The efficiency of detection in 10B thin films varies with wavelength (Figure 3.12) and hence itmay be possible to make use of multiple layers of films to perform coarse energy discrimina-tion and hence accumulate neutrons in time-of-flight and energy histograms. Such a systemhas the potential to allow for the separation of inelastic incoherent scattering from the mea-sured signal without requiring a reduction in incoming flux. This possibility is the subject ofon-going studies with results due in March 2013. If such a system proves feasible, it couldbe easily implemented on the ”lined tube” style detector system by adding a second layer ofdetection elements and tuning the thickness of the boron layer used in different parts of thedetector array.
”Window Frame”
The alternative layout has a ”window frame” style of detector layout as seen in figure 3.13.The first detector has an area of 3 m x 3 m with a 1 m x 1m window in the centre. The seconddetector has an area of 2.4 m x 2.4 m with a 0.4 m x 0.4 m window in the centre. The reardetector has an area of 0.5 m x 0.5 m.
The first two sets of detectors are fixed, whilst the rear detector can move forward on a car-riage to match the 5 m collimation setting if the lowest Q is not required. All of the detectorssit inside a common vacuum vessel with a rectangular cross section.

distance from sample (m)0 2 4 6 8 10
effic
ienc
y
0
0.1
0.2
0.3
0.4
0.5
0.6
0.7
0.8
0.9
1
back-scattering
transmission
)Åwavelength (0 2 4 6 8 10 12 14 16 18 20
effic
ienc
y
0
0.1
0.2
0.3
0.4
0.5
0.6
0.7
0.8
0.9
1
mµlayer thickness 1
mµlayer thickness 3
Figure 3.12: (left) Efficiency of a single layer of 10B as a function of distance along the ”linedtube” detector at 2 A and 12A. (right) Efficiency of a single 1 µm or 3 µm layer of 10B as afunction of wavelength
Figure 3.13: Layout of the proposed ”window frame” detectors (to scale)
The technology used for the detectors is expected to be 10B based for the first two, lower reso-lution detectors, with an alternative such as anger cameras used for the rear, high-resolutiondetector. The front detectors will require a resolution of 8 mm or better and the rear detec-tor will require a resolution of 2 mm or better. The first two detector banks could also beimplemented using 3He tubes.
Beamstop
In order to make transmission measurements without requiring beam attenuation, the beam-stops will be instrumented with detectors capable of providing a time-of-flight spectrum.
3.7 Estimates of Instrument Performance
Q Range and Resolution
The size of aperture used and the spread of wavelengths determine the Q resolution, withlarger beam sizes on the detector giving poorer angular resolution. The Q resolution in SANScan be defined in the simplest case as (Mildner and Carpenter 1984)

Distance (m) Wavelength (A) Time-fo-flight (ms) ∆t/t22 2 11.1 0.27
12 66.7 0.0525 2 12.6 0.24
12 69.5 0.0430 2 22.8 0.13
12 68.3 0.04
Table 3.1: Time-of-flight resolution as a function of wavelength and source to detector distance
(σQ)2 = k2
[R2
1
4L21+
R22
4L′2+
(δR)2
12L22+
R2
4L22
(δλ
λ
)](3.1)
where R1 and R2 are the radii of the source and sample apertures, L1 and L2 are the source-to-sample and sample-to-detector distances respectively, 1/L’ = 1/L1 + 1/L2, R is the radialdistance from the beam centre and ∆R is the width of the azimuthal averaging ring.
The instruments at the ESS will all operate with event mode data recording i.e. each neutronevent will be recorded with a time stamp related to the accelerator clock such that the time-of-flight of each neutron may be calculated. The uncertainty in arrival time at the detector willbe dominated by the pulse length giving a ∆t of ∼3 ms. Thus the uncertainty in wavelengthwill vary with wavelength and with distance from the source. It will therefore be possible tomake decisions about trade offs in counting statistics and resolution after the fact during datareduction, where variable binning schemes will be possible.
To discuss the resolution, therefore, we should examine the possible limiting cases. As anexample, Table 3.1 shows the time-of-flight for the lower and upper ends of the wavelengthband used at each detector distance in the window frame configuration operated in Mode 1.The balance of contributions to the resolution determines the detector resolution required.
In order to calculate Q ranges, the traditional optimum SANS collimation has been usedwhere the source aperture (Ap1) is twice the diameter of the sample aperture (Ap2). Theaccessible Q ranges are given based on the ”full-flux” bandwidth as defined and shown insection 3.4 and thus represent a conservative estimate since there will still be significant num-bers of short wavelength neutrons in the penumbra of the chopper. The minimum Q reportedhere is that at 1.5 times the beam radius on the rear detector.
Table 3.2 gives the Q range accessible in mode 1 for the ”line tube” style detector and Table3.3 gives those for the ”window frame” style detector.
Thus we can see that either of the detector options will provide the 3 orders of magnitudein Q required, however the ”window frame” style of detector provides a broader Q rangeand accesses the Q range above 1 A−1. The ”lined tube” style detector could be made widerin diameter or perhaps flared close to the sample in order to access higher Q values. Suchoptions are under investigation.
Neutron Beam Intensity
In order to estimate the performance of the instrument in terms of neutron count rates at thesample and on the detectors, monte carlo simulations have been performed including the fullfront end of the instrument consisting of:
Bender 4m long, 4 channels, m=4 coating on all surfaces, 78 m radius of curvature

Ap2 Diam (mm) L1 (m) L2 (m) Qmin(×10−3A−1) Qmax (A−1) Qmax/Qmin10 2 5 7.63 0.98 1285 2 5 3.82 0.98 2564 2 5 1.53 0.98 64010 5 5 3.59 0.98 2725 5 5 1.79 0.98 5474 5 5 0.72 0.98 136110 10 10 1.79 0.98 5475 10 10 0.90 0.98 10894 10 10 0.36 0.98 2722
Table 3.2: Accessible Q range for the ”lined tube” detector in Mode 1 with a wavelength rangeof 3 A to 10.5 A
Ap2 Diam (mm) L1 (m) L2 (m) Qmin(×10−3A−1) Qmax (A−1) Qmax/Qmin10 2 5 7.63 1.66 2185 2 5 3.82 1.66 4354 2 5 1.53 1.66 108510 5 5 3.59 1.66 4625 5 5 1.79 1.66 9274 5 5 0.72 1.66 230510 10 10 1.79 1.66 9275 10 10 0.90 1.66 18444 10 10 0.36 1.66 4611
Table 3.3: Accessible Q range for the ”window frame” detector in Mode 1 with a wavelengthrange of 3 A to 10.5 A
Choppers Positioned at 6.5m and 9.8m with a 40 cm guide break at each position
Guides m=1 coating, guide break for aperture at 10 m (extra space after chopper)
Apertures Source aperture set to twice radius of sample aperture. Sample aperture set to 10mm and 5 mm diameter.
Collimation Simulations were performed at 10 m and 5 m collimation. In the case of 5 mcollimation, the rear detector was moved forward to 5 m from the sample.
The virtual sample used was of elastic scattering from 1 mm of water.
All simulations have been performed using the ”Window Frame” detector layout as suffi-ciently detailed simulations of the ”Lined Tube” style detector are still ongoing and will beused during the initial engineering phase to determine the best detector layout. The detectorefficiency was assumed to be 100% at all wavelengths. Whilst this is unlikely to be the case,it is a good approximation to the detector used at D22 and so is a reasonable comparison andwe aim to design our detectors for high efficiency at all wavelengths.
Table 3.4 gives the flux on sample and minimum accessible Q as a function of sample apertureand wavelength range and figures 3.14 - 3.16 show the count rate as a function of Q for variousconfigurations of the instrument. Equivalent configurations of D22 were also simulated usingthe McStas mode kindly provided by E. Farhi at the ILL and are show in the figures along withthe LoKI results.

Figure 3.14: Simulated elastic scattering from a 10mm diameter × 1mm thick sample of H2Oon LoKI with 10m collimation and on D22 with 10.5m collimation and 4.5 A neutrons.
Figure 3.15: Simulated elastic scattering from a 10mm diameter × 1mm thick sample of H2Oon LoKI with 5m collimation and on D22 with 4.5m collimation and 4.5 A neutrons.

Ap2 Diam (mm) L1 (m) Qmin(×10−3A−1) Flux (n/cm2/s) Current (n/s)10 2 7.63 7.64E+08 9.73E+085 2 3.82 4.78E+07 2.43E+082 2 1.53 1.22E+06 3.89E+0710 5 3.59 1.44E+08 1.84E+085 5 1.79 9.03E+06 4.60E+072 5 0.72 2.31E+05 7.35E+0610 10 1.79 3.98E+07 5.07E+075 10 0.90 2.49E+06 1.27E+072 10 0.36 6.37E+04 2.03E+06
Table 3.4: Flux and current on sample and minimum Q as a function of sample aperture sizeand collimation
Figure 3.16: Simulated elastic scattering from a 5mm diameter × 1mm thick sample of H2Oon LoKI with 10m collimation and on D22 with 10.5m collimation and 4.5 A neutrons.


4 Strategy and Uniqueness
As discussed in sections 1 and 2, SANS is a technique with broad applicability that is in highdemand. In order to provide for the whole science case in terms of demand, three SANSinstruments should be constructed at the ESS. This is comparable to other major neutronscattering centres (NIST will soon have 4 SANS instruments and 1 USANS, ILL has 3 SANSinstruments and a USANS instrument, and there are 4 SANS located at FRM II). Within Eu-rope, the instruments most similar to LoKI are D33 at ILL (currently in commissioning) andSANS2D at ISIS, whilst D22 at ILL is widely considered to be the world-leading SANS instru-ment.
Once multiple instruments are required to meet demand, it makes sense to optimise each fordifferent segments of the scientific community in order to maximise the overall impact of thesuite. In order to cover the huge range of science that SANS can address in the most effectivefashion the strategy for SANS at ESS calls for three instruments:
Broad Band Small Sample SANS Aimed at the soft matter, biophysics and materials sciencecommunities, with a wide simultaneous Q range at least 3 orders of magnitude in Qthrough the use of large area of detectors and wide wavelength band. Designed tomaximize use of integrated intensity at cost of lower resolution.
General Purpose Polarized SANS Aimed at hard matter and industrial process studies, witha flexible sample area, flexible optics, polarization and polarization analysis. Multipledetector banks for at least 2 orders of magnitude simultaneous Q range. High resolu-tion, with options for GISANS and VSANS.
High Throughput / BioSANS Aimed at the structural biology community, being a compactinstrument with a biologically relevant length scale. Optimized for small samples andhigh throughput (e.g. flow through cells), it should have end-to-end automated pro-cessing and initial analysis of data (cf BioSAXS beamlines).
The first of these is represented by the instrument discussed here, LoKI. An example of thesecond is the work of the German SANS work package at Julich and an example of the last isthe work of the Swiss-Danish SANS work package.
The order of construction should be as listed in order to build the two instruments with thebroadest applicability first. LoKI, as the broad band small sample SANS instrument, shouldbe constructed first as there is greater scope for a new user community to be built around aninstrument with high flux and a very wide simultaneous Q range as discussed in section 2.
Furthermore, the benefits of a dedicated BioSANS instrument will be achieved by fitting au-tomated sample handling equipment to LoKI and having dedicated periods of operation forbiological scattering experiments where the instrument would be operated only in one con-figuration. The requirements of the biological community for automated data reduction andanalysis will also be of interest outside that field and so should be developed for all beamlines.
LoKI offers a world-leading combination of flux and simultaneous Q range and will be uniquelyplaced to deliver high impact publications in soft matter, materials science and bioscience.
21


5 Technical Maturity
SANS is a well-established technique, and time-of-flight SANS instruments have been in op-eration for over 20 years. This instrument has no significantly out of the ordinary componentsother than the detector, and there the demands on the technology are not infeasible. The com-bination of these components means that a world-leading instrument can be built with lowtechnical risk.
5.1 Location
In order to mount and manage the complex sample environments that will be used on thisinstrument as well as change samples, side access to the sample area will be required. Thissuggests that an outside edge position on one of the 4 sectors is preferred. To minimise thebackground, a position facing backwards from the target (i.e. on the proton beam incomingside of the target) is preferred. However, the outside position closest to the incoming protonbeam is not favoured due to space constraints and the risk of background from the protonbeam scraper.
The length of the instrument and the space required for the sample position, the detectorvessel and associated shielding means that two 5 degree segments from the monolith will berequired, thus blocking one beamport in addition to the one used by the instrument. Thelocation of the instrument to the left or right of the proton beam will have implications as aresult of those locations having different beam heights. Whilst the lined tube style detectoris relatively compact and so does not need a lot space, the window frame style detectorsneed at least 2.5 m from the beam centre to the floor in order to fit in the 3 m high detectorbank and the rails for the detector tank to move. Furthermore, in order to accommodate thenecessary sample environment equipment and associated rotation and translation stages andgoniometers, a beam height of at least 2 m above the floor is required.
In the currently envisaged beam hall layout, these requirements sugget that the instrumentbe located in the hall with a beam height of 3 m that is facing back from the target. However,it is envisaged that this will be the ”magnet free” hall to allow for operation of any spin-echospectrometers. It is, at this stage, unclear what ”magnet free” will mean in practice, but it isassumed that low-field electromagnets will be possible.
5.2 Risk Management
The instrument is largely based on existing technology and contains relatively few compo-nents, so the overall technological risk is low. The risks associated with some specific parts ofthe instrument are discussed here.
There are also generic schedule risks associated with the overall progress of the ESS construc-tion project, but they are not considered here, as they do not affect either the scope or budgetproposed.
Shielding
There is a great deal of uncertainty about the high-energy background that will be created bythe ESS source. Low instrumental background is essential for the sorts of measurements thatthis instrument will be aiming to make possible. The instrument design attempts to mitigatesome of this risk by avoiding direct line of sight to the moderator, however it is not clearwhat degree of shielding of the detectors will be required. The impact of inadequate detector
23

shielding would be severe given the proximity of the instrument to the target. More shieldingresulting in greater cost can mitigate this risk.
Simulations of the radiation emitted from the target monolith and along the guides are inprogress at the ESS and during the initial engineering design phase the instrument supportdivisions will work to accurately design the shielding to the needs of the instrument.
The relatively open ”optics hutch” envisaged between the common shielding bunker and thesample position is a possible risk for increased background. This will be taken into accountduring the shielding design process, and can be mitigated by filling the space with shielding.This might, of course, remove the option of having focussing optics or SESANS.
Beam Delivery System
There are risks associated with the use of high m-value guide coatings close to the target.It is possible that the coatings, if deposited on borofloat glass, will degrade rapidly in thehigh radiation environment, thus affecting instrument performance, as fewer neutrons willbe delivered. The chance of this is moderate, but the impact would be high. Choosing lowerm-value coatings can mitigate this risk, albeit at a loss of performance, but this would be aperformance that would not degrade over time.
The ESS optics group has determined that this risk will be adequately mitigated through theuse of substrates that do not contain boron. The most likely candidates are metal substratesor ”Zerodur” ceramic substrates.
Detectors
The detector systems represent the largest technological risk in this proposal. Two possibledetector layouts using a mixture of detector technologies are proposed.
Lined Tube
The ”lined tube” detector system is based around the use of 10B thin films at a grazing inci-dence angle. This represents a moderate development risk as such a detector has not beenused for neutron scattering before and such detectors are not yet available. However, the ESSis putting significant effort and resources into these technologies and rapid progress is beingmade.
Window Frame
The use of 3He detectors for the first two banks whilst of low risk in development terms,represents a high risk in terms of availability of supply. A relatively large area ( 14 m2 in the”window frame” configuration) of detectors is required and supplying this with 3He couldbe challenging. There are also questions about the ability of helium detectors to cope with thepossible counting rate.
The alternative detector choice for that large area is 10B thin film based technology, eitherinclined blades or stacked layers depending on the required resolution. This represents amoderate development risk as such detectors are not yet available in large areas.
High-resolution low angle detector
In either of the detector layouts presented, the low angle detector at the rear is based onscintillator technology, such as Anger cameras or wavelength-shifting fibres. Such detectorsare currently in use at other facilities and are well understood. As such this does not represent

a significant risk. There are questions as to the count rate capacity of such detectors but withthe pace of detector development, it is anticipated that alternatives will be available.
In all cases, any detector design that requires research and development work carries a sched-ule risk. It is possible that the necessary detectors will prove more complex to develop thanenvisaged, or that the capacity to manufacture sufficient detectors in a timely fashion willnot be available. This risk can be mitigated by increased allocation of resources by the ESSinstrument support division to the detector group. Furthermore, in the case of either of thedetector layouts, detectors can be installed as they become available over the commissioningperiod, thus diminishing the schedule risk at the cost of lower initial performance.
Supporting Facilities
The availability of excellent sample environment equipment, sufficient laboratory space forsample handling and preparation, and non-neutron characterisation equipment will be vitalto achieving the full potential of this instrument. If the ESS does not provide for these needsthen the high performance of the instrument will not be fully utilised and research impactwill be weakened.


6 Costing
Three different options are presented for the detectors as discussed in section 3.6, namely thelined tube with 10B ,window frames with 3He and window frames with 10B. In all cases thehigh-resolution low angle detector at the rear is based on Anger cameras. All cases includethe cost of an instrumented beam stop that can provide a time-of-flight spectrum.
Window frames with 3He 14 m2 of 8 mm 3He tubes.
Total cost = 19.6 M
Window frames with 10B 14 m2 of 8 mm pitch 10B multi-layer detectors.
Assumes detector cells 15 layers deep such that the total area of coating is ∼200 m2
Total cost = 14.2 M
Lined Tube with 10B 34 m2 of 5 cm pitch 10B inclined geometry detectors.
Assumes detector cells on average 2 layers deep (optimisation of number of layers bydistance has not yet been done) such that the total area of coating is∼70m2. This costingincludes readout channels in both directions to improve azimuthal resolution.
Total cost = 11.6 M
If the cost of instrument control, data reduction and data analysis software developmentand deployment is included then the cost of the instrument is increased by 720 k based on6 person-years of effort over the project, assuming some common development with otherinstruments.
The costing is presented in more details in tables below and is broken down into the fourphases of the instrument construction project. The staff effort is estimated in person-monthsassuming a cost of 10 k/person-month. The costs are also broken down into the followingcategories:
Integrated Design The effort from the Lead Scientist and engineer, as well as other scientistsand engineers involved in the overall instrument design
Systems Integration Systems engineering activities to ensure compatibility between compo-nents and compliance with ESS standards.
Detectors and Data Acquisition Detector systems complete with all electronics. The cost es-timates are based on discussions with the ESS Detector group and hardware costs in-clude installation.
Optical Components The beam delivery system including the bender, guide, the guide hous-ing and alignment system and collimation slits. The cost estimates are based on a con-fidential market survey by the ESS Neutron Optics group. The hardware costs includeinstallation.
Choppers The chopper systems for bandwidth selection and frame overlap suppression
Detector Vessel The vacuum vessel for the detectors, including pumps, windows, mountingand installation. Sample Environment: The necessary goniometers, rotation and trans-lation stages for mounting sample environment and necessary SANS specific sampleenvironment such as a Rheometer, sample changers, flow cell, electromagnet etc.
27
Shielding The shielding solutions required for radiation protection and background reduc-tion, including shutter systems. The requirements and costing model for the shieldingis unclear at the moment, so the current estimate is an engineering estimate from theESS Neutron Optics group.
Instrument Specific Support Equipment This includes mechanical components not costedelsewhere. Instrument Infrastructure: The buildings and facilities not provided as partof the Conventional Facilities budget, such as cabins, mezzanines, raised floor areas etc.As no definite floor plan exists at the moment, the estimate here is based on informationfrom SNS and ISIS.
The majority of the costs are incurred in the Procurement and Installation phase, but some ofthe major procurements could be initiated in the Final Design phase at the discretion of theChief Instrument Engineer.
This cost estimate should be regarded as very preliminary and indicative of the relative costprofile between the various components. The uncertainty in the cost estimates will be signifi-cantly reduced once a preliminary engineering design is available.

in k€
Phas
e 1
(Des
ign
and
Plan
ning
)Ph
ase
1 (D
esig
n an
d Pl
anni
ng)
Phas
e 1
(Des
ign
and
Plan
ning
)Ph
ase
2 (F
inal
Des
ign)
Phas
e 2
(Fin
al D
esig
n)Ph
ase
2 (F
inal
Des
ign)
Phas
e 3
(Pro
cure
men
t and
In
stal
latio
n)Ph
ase
3 (P
rocu
rem
ent a
nd
Inst
alla
tion)
Phas
e 3
(Pro
cure
men
t and
In
stal
latio
n)Ph
ase
4 (B
eam
Tes
ting
and
Col
d C
omm
issi
onin
g)Ph
ase
4 (B
eam
Tes
ting
and
Col
d C
omm
issi
onin
g)Ph
ase
4 (B
eam
Tes
ting
and
Col
d C
omm
issi
onin
g)To
tal
Tota
lTo
tal
Har
dwar
eSt
aff (
k€)
Staf
f (m
onth
s)H
ardw
are
Staf
f (k€
)St
aff (
mon
ths)
Har
dwar
eSt
aff (
k€)
Staf
f (m
onth
s)H
ardw
are
Staf
f (k€
)St
aff (
mon
ths)
Har
dwar
eSt
aff (
k€)
Staf
f (m
onth
s)St
aff (
year
s)In
tegr
ated
Des
ign
Sy
stem
s In
tegr
atio
n
Det
ecto
rs a
nd D
ata
Acqu
isiti
onO
ptic
al C
ompo
nent
s
Cho
pper
sD
etec
tor V
esse
lSa
mpl
e En
viro
nmen
t Sh
ield
ing
Inst
rum
ent S
peci
fic S
uppo
rt E
quip
men
tIn
stru
men
t Inf
rast
ruct
ure
To
tal
Gra
nd to
tal (
no V
AT)
036
036
060
060
048
048
024
024
016
8016
814
.00
00
00
303
012
012
060
60
210
211.75
030
30
303
1150
060
620
012
012
1170
024
024
2.00
030
30
303
500
303
2060
652
015
015
1.25
030
30
303
250
303
2030
327
012
012
1.00
030
30
303
1500
303
010
115
0010
010
0.83
00
00
303
500
101
200
606
700
100
100.83
030
30
606
1500
606
2060
615
2021
021
1.75
00
00
303
100
120
1220
303
120
180
181.50
030
30
303
100
606
2030
312
015
015
1.25
054
054
090
090
1595
010
0010
050
070
070
1645
031
4031
426
.17
1959
019
590
1959
019
590
1959
019
590
1959
019
590
1959
019
590
1959
019
590
1959
019
590
1959
019
590
Figu
re6.
1:C
osti
ngfo
rLo
KIw
ith
”win
dow
fram
e”st
yle
dete
ctor
sus
ing
3 He

in k€Phase 1 (D
esign and Planning)Phase 1 (D
esign and Planning)Phase 1 (D
esign and Planning)Phase 2 (Final D
esign)Phase 2 (Final D
esign)Phase 2 (Final D
esign)Phase 3 (Procurem
ent and Installation)
Phase 3 (Procurement and
Installation)Phase 3 (Procurem
ent and Installation)
Phase 4 (Beam Testing and C
old C
omm
issioning)Phase 4 (Beam
Testing and Cold
Com
missioning)
Phase 4 (Beam Testing and C
old C
omm
issioning)TotalTotalTotal
Hardw
areStaff (k€)
Staff (months)
Hardw
areStaff (k€)
Staff (months)
Hardw
areStaff (k€)
Staff (months)
Hardw
areStaff (k€)
Staff (months)
Hardw
areStaff (k€)
Staff (months)
Staff (years)Integrated D
esign System
s Integration D
etectors and Data Acquisition
Optical C
omponents
Choppers
Detector Vessel
Sample Environm
ent ShieldingInstrum
ent Specific Support Equipment
Instrument Infrastructure
Total
Grand total (no VAT)
0360
360
60060
0480
480
24024
01680
16814.00
00
00
303
0120
120
606
0210
211.75
030
30
303
600060
6200
12012
6200240
242.00
030
30
303
50030
320
606
520150
151.25
030
30
303
25030
320
303
270120
121.00
030
30
303
150030
30
101
1500100
100.83
00
00
303
50010
1200
606
700100
100.83
030
30
606
150060
620
606
1520210
211.75
00
00
303
100120
1220
303
120180
181.50
030
30
303
10060
620
303
120150
151.25
0540
540
90090
104501000
100500
70070
109503140
31426.17
14090140901409014090140901409014090140901409014090140901409014090140901409014090
Figure6.2:C
ostingfor
LoKIw
ith”w
indowfram
e”style
detectorsusing
10B

in k€
Phas
e 1
(Des
ign
and
Plan
ning
)Ph
ase
1 (D
esig
n an
d Pl
anni
ng)
Phas
e 1
(Des
ign
and
Plan
ning
)Ph
ase
2 (F
inal
Des
ign)
Phas
e 2
(Fin
al D
esig
n)Ph
ase
2 (F
inal
Des
ign)
Phas
e 3
(Pro
cure
men
t and
In
stal
latio
n)Ph
ase
3 (P
rocu
rem
ent a
nd
Inst
alla
tion)
Phas
e 3
(Pro
cure
men
t and
In
stal
latio
n)Ph
ase
4 (B
eam
Tes
ting
and
Col
d C
omm
issi
onin
g)Ph
ase
4 (B
eam
Tes
ting
and
Col
d C
omm
issi
onin
g)Ph
ase
4 (B
eam
Tes
ting
and
Col
d C
omm
issi
onin
g)To
tal
Tota
lTo
tal
Har
dwar
eSt
aff (
k€)
Staf
f (m
onth
s)H
ardw
are
Staf
f (k€
)St
aff (
mon
ths)
Har
dwar
eSt
aff (
k€)
Staf
f (m
onth
s)H
ardw
are
Staf
f (k€
)St
aff (
mon
ths)
Har
dwar
eSt
aff (
k€)
Staf
f (m
onth
s)St
aff (
year
s)In
tegr
ated
Des
ign
Sy
stem
s In
tegr
atio
n
Det
ecto
rs a
nd D
ata
Acqu
isiti
onO
ptic
al C
ompo
nent
s
Cho
pper
sD
etec
tor V
esse
lSa
mpl
e En
viro
nmen
t Sh
ield
ing
Inst
rum
ent S
peci
fic S
uppo
rt
Equi
pmen
tIn
stru
men
t Inf
rast
ruct
ure
To
tal
Gra
nd to
tal (
no V
AT)
036
036
060
060
048
048
024
024
016
8016
814
.00
00
00
303
012
012
060
60
210
211.75
030
30
303
4000
606
200
120
1242
0024
024
2.00
030
30
303
500
303
2060
652
015
015
1.25
030
30
303
250
303
2030
327
012
012
1.00
030
30
303
1000
303
010
110
0010
010
0.83
00
00
303
500
101
200
606
700
100
100.83
030
30
606
1500
606
2060
615
2021
021
1.75
00
00
303
100
120
1220
303
120
180
181.50
030
30
303
100
606
2030
312
015
015
1.25
054
054
090
090
7950
1000
100
500
700
7084
5031
4031
426
.17
1159
011
590
1159
011
590
1159
011
590
1159
011
590
1159
011
590
1159
011
590
1159
011
590
1159
011
590
Figu
re6.
3:C
osti
ngfo
rLo
KIw
ith
”lin
edtu
be”
10B
dete
ctor
s