Embed Size (px)
Citation preview

1
Chinese ClimateESRL hosts Chinese scientists working to build a national network of greenhouse gas measurements
ESRL QuarterlyFall 2010
InsideDirector’s Corner 2
By the Numbers: LA Ozone 2
Robbing the West 3
Ozone Hole Persists 6
International Success 7
Sammie for Solomon 7
Model Students 8
Testing the Wind 8
Pointing Fingers 9
Achievement 10
Raindrops... 12
How do you find leaks in a tank of precisely measured carbon dioxide? How often must instruments be calibrated, to ensure accuracy of atmospheric measurements? A team of 16 meteorologists from the Chinese Meteorological Agency (CMA) visited ESRL in September, seeking answers to those and dozens of other questions. The delegation of scientists is hoping to expand CMA’s current network of five sites where CO2 and other greenhouse gases are measured consistently.CMA’s Lingxi Zhou, who has worked closely with ESRL’s Global Monitoring Division for nearly a decade, set up the 10-day visit—the “Workshop on High-Accuracy Greenhouse Gas Measurements”—for her staff.“She thought it was important for people at these five sites to see what we’re doing, and why,” said GMD’s Pieter Tans. Tans and his colleagues spent days with the Chinese meteorologists, discussing greenhouse gas networks from the broadest of scales (the density of sites needed to address various research or policy questions)
see page 8see page 5
Oscillating CloudsESRL scientists uncover oscillating patterns in clouds; finding has implications for climate change
see page 4
Rain clouds within a large cloud field respond to signals from other clouds, much like chirping crickets or flashing fireflies on a summer night, according to a new ESRL-led study. Published in Nature in August, the finding has significant implications for our understanding of climate change.Graham Feingold (CSD) and his colleagues showed for the first time that interactions between certain types of neighboring clouds can result in synchronized rain patterns within a large cloud system. “Clouds organize in distinct patterns that are fingerprints of myriad physical processes,” Feingold explained.
Visitors to the home of tJet, one of NOAA’s most powerful new supercomputers, have to yell to be heard over the roar in the room. tJet is running simulations of tropical cyclones, and it seems as if the computer is invoking the sound of the storms. But ESRL’s Scott Nahman (Global Systems Division, GSD), points to the closet-sized air conditioning system that keeps the supercomputer in optimum conditions. The fans may be loud, but “this is the first high-efficiency system in the building,” Nahman said. The new unit could save NOAA several thousand dollars on electricity next year, he estimated. That’s just one record among several for ESRL’s summertime supercomputing upgrades, including the Intel-based tJet supercomputer. Installed in early August and running hurricane forecast experiments by the end of that month, tJet is one of the two most powerful research supercomputers in NOAA. With more than 10,000 new cores, tJet is faster and more efficient than its predecessor—the 3,500-core Nehalem Jet
tJet Roars to LifeNew ESRL supercomputer supports hurricane research, including experimental FIM forecasts
News from NOAA’s Earth System Research Laboratory
Dusty snow robs water from the Colorado River, page 3. Tom Painter/JPL

2
Director’s Corner
“I’ve looked at clouds from both sides now . . .”
The words of a popular song written decades ago have relevance to the science going on today in ESRL.
On the front page of this issue is a discussion of the August Nature paper by Chemical Science Division’s (CSD) Graham Feingold and a team that looked at a type of cloud field seen over large areas of the globe. In the paper, an interesting temporal sequence of the cellular structure of cloud fields is discussed, as is the role of aerosols within them. The role of aerosols in cloud, including how they affect planetary albedo (reflection of sunlight) has been a fundamental research topic for climate scientists. The large areas of stratus cloud, particularly prevalent over oceans off the west coast of continents, play a major role in the Earth’s radiation balance. If added greenhouse gases reduce the area covered by this type of cloud, that would enhance global warming (a positive feedback). Conversely, if these cloud fields increase, it would slow the rise in global temperature. Clouds are important at all length and time scales—they are one of the best examples of fractals in nature. Thus, understanding the emergent behavior of the clouds seen in these studies should be helpful in improving atmospheric prediction from the shortest time scales (weather) to the longest (climate). There is another interesting body of cloud-related work in ESRL’s Physical Sciences Division (PSD), led by George Kiladis. He has used satellite imagery and other techniques to look at tropical waves. As a graduate student, I recall having to repeat the derivation of a very elegant analysis of atmospheric waves in the “equatorial waveguide,” originally done by Taroh Matsuno (and later by Adrian Gill). Kiladis and collaborators have used Outgoing Longwave Radiation (essentially cloud structures observed from satellites) to determine the structure of tropical waves, and find a whole bestiary of such cloud clusters, including Kelvin Waves, eastward and westward propagating Rossby waves, and inertia-gravity waves. These equatorial
cloud structures—most notably the Madden-Julien Oscsillation (a type of cloud cluster that propagates westward along the tropical band, taking many weeks to cross the Pacific)—offer the exciting potential of extending predictions beyond the chaotic limits of a few weeks to allow significant predictability in the range of a couple of months. I regard the over-emphasis of the meteorological community on mid-latitude meteorology (where most meteorologists live) as having limited the progress that we could be making in the tropics. For example, spectral models are great for mid-latitude cyclones, but are poor in the tropical belt for several reasons, most notably because their resolution is less there than in mid-latitudes. This was part of the rationale behind ESRL’s development of global models on icosahedral grids, and the results in the FIM model have shown improved tropical skill. Within ESRL’s Global Systems Division (GSD), there are important new advances in computing and global modeling. In computing, Mark Govett and collaborators are leading in the next big revolution in geophysical supercomputing: using Graphical Processing Units (GPUs) to run atmospheric models. Govett’s group has demonstrated speed-ups greater than 30 times using GPUs on the new Nonhydrostatic Icosahedral Model (led by Jin Luen Lee of GSD). A calculation by Jaques Middelecoff estimates that given the growth of GPU speeds, it may be possible to run twice-daily 10-day global cloud-resolving models (horizontal resolution of four kilometers or less) as early as 2012.Advances in geophysical prediction typically follow a sequence: they start with observations, followed by scientific understanding of the relevant processes, and ultimately are incorporated into predictive models. Here in ESRL, we can see the entire process in action. A dream of mine would be that GSD’s new cloud-resolving global models would use the advances from CSD and PSD to capture clouds realistically in weather and climate prediction in a way that is unequaled elsewhere in the world.At ESRL, we look at clouds from all sides now.
—Alexander MacDonald
The distance that ozone and possibly other pollutants from the Los Angeles Basin can travel due to the “mountain chimney effect” of Southern California’s San Gabriel Mountains, pictured. At the fall AMS Mountain Meteorology Conference, Andy Langford and Bob Banta (CSD) discussed results from airborne lidar measurements of ozone made above the Los Angeles Basin in 2009. Their results—also published in Geophysical Research Letters with Christoph Senff, Raul Alvarez, and Michael Hardesty of CSD—indicate that the mountains push polluted air up into the free troposphere, where it can travel as far as western Colorado. More: search for doi:10.1029/2010GL042507.
By the Numbers Los Angeles ozone reaches Colorado 1,000 miles
3
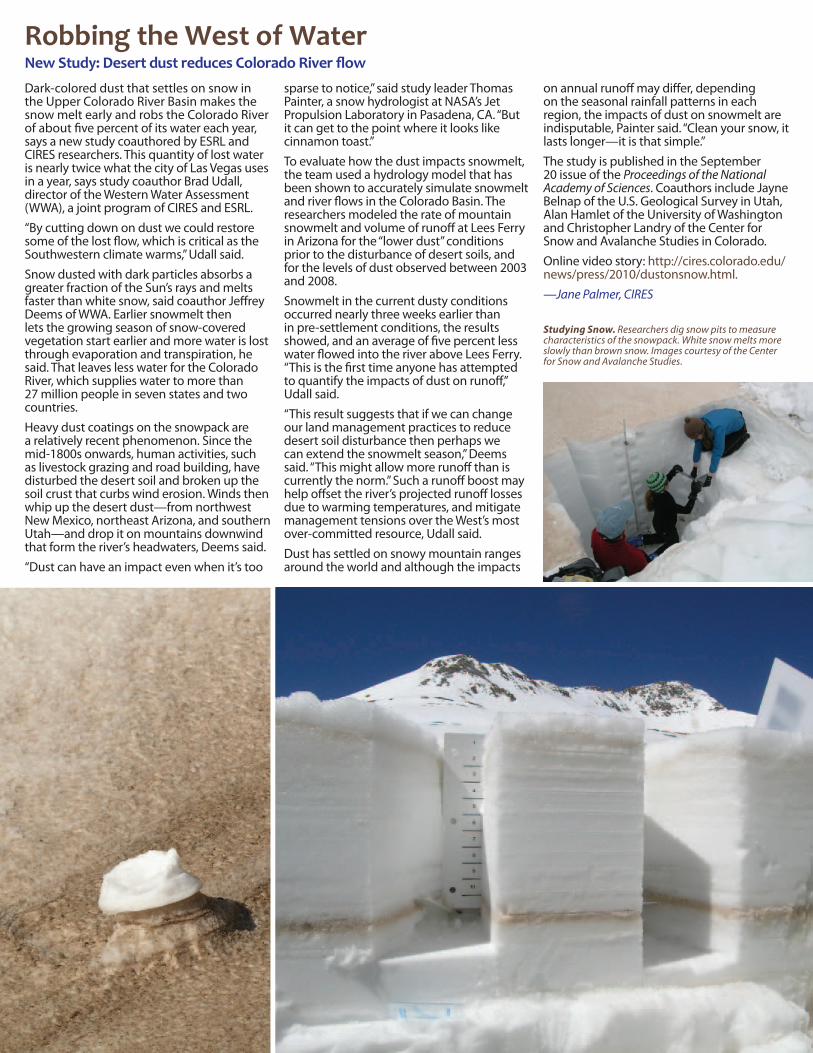
Dark-colored dust that settles on snow in the Upper Colorado River Basin makes the snow melt early and robs the Colorado River of about five percent of its water each year, says a new study coauthored by ESRL and CIRES researchers. This quantity of lost water is nearly twice what the city of Las Vegas uses in a year, says study coauthor Brad Udall, director of the Western Water Assessment (WWA), a joint program of CIRES and ESRL.“By cutting down on dust we could restore some of the lost flow, which is critical as the Southwestern climate warms,” Udall said. Snow dusted with dark particles absorbs a greater fraction of the Sun’s rays and melts faster than white snow, said coauthor Jeffrey Deems of WWA. Earlier snowmelt then lets the growing season of snow-covered vegetation start earlier and more water is lost through evaporation and transpiration, he said. That leaves less water for the Colorado River, which supplies water to more than 27 million people in seven states and two countries.Heavy dust coatings on the snowpack are a relatively recent phenomenon. Since the mid-1800s onwards, human activities, such as livestock grazing and road building, have disturbed the desert soil and broken up the soil crust that curbs wind erosion. Winds then whip up the desert dust—from northwest New Mexico, northeast Arizona, and southern Utah—and drop it on mountains downwind that form the river’s headwaters, Deems said. “Dust can have an impact even when it’s too
sparse to notice,” said study leader Thomas Painter, a snow hydrologist at NASA’s Jet Propulsion Laboratory in Pasadena, CA. “But it can get to the point where it looks like cinnamon toast.”To evaluate how the dust impacts snowmelt, the team used a hydrology model that has been shown to accurately simulate snowmelt and river flows in the Colorado Basin. The researchers modeled the rate of mountain snowmelt and volume of runoff at Lees Ferry in Arizona for the “lower dust” conditions prior to the disturbance of desert soils, and for the levels of dust observed between 2003 and 2008.Snowmelt in the current dusty conditions occurred nearly three weeks earlier than in pre-settlement conditions, the results showed, and an average of five percent less water flowed into the river above Lees Ferry. “This is the first time anyone has attempted to quantify the impacts of dust on runoff,” Udall said.“This result suggests that if we can change our land management practices to reduce desert soil disturbance then perhaps we can extend the snowmelt season,” Deems said. “This might allow more runoff than is currently the norm.” Such a runoff boost may help offset the river’s projected runoff losses due to warming temperatures, and mitigate management tensions over the West’s most over-committed resource, Udall said.Dust has settled on snowy mountain ranges around the world and although the impacts
on annual runoff may differ, depending on the seasonal rainfall patterns in each region, the impacts of dust on snowmelt are indisputable, Painter said. “Clean your snow, it lasts longer—it is that simple.”The study is published in the September 20 issue of the Proceedings of the National Academy of Sciences. Coauthors include Jayne Belnap of the U.S. Geological Survey in Utah, Alan Hamlet of the University of Washington and Christopher Landry of the Center for Snow and Avalanche Studies in Colorado.Online video story: http://cires.colorado.edu/news/press/2010/dustonsnow.html.—Jane Palmer, CIRES
Robbing the West of WaterNew Study: Desert dust reduces Colorado River flow
Studying Snow. Researchers dig snow pits to measure characteristics of the snowpack. White snow melts more slowly than brown snow. Images courtesy of the Center for Snow and Avalanche Studies.

4
...Clouds, from page 1
4
“Precipitation can generate fascinating honeycomb-like patterns that are clearly visible from satellites. Cloud fields organize in such a way that their components ‘communicate’ with one another and produce regular, periodic rainfall events.”The new study also examines how suspended particles, or aerosols, in the atmosphere can influence cloud and rain patterns as well as climate change.The team—which also includes Ilan Koren of the Weizmann Institute, Hailong Wang of the Pacific Northwest National Laboratory, Huiwen Xue of Peking University, and Alan Brewer of CSD—used satellite imagery to identify cloud systems with a “cellular, almost honeycomb-like structure.” In such systems, thick clouds form the walls of the honeycomb, and cloud-free zones form open cells between the walls. The team observed that these cellular structures constantly rearrange themselves, with cloud walls dissolving and open cells forming in their place, while walls form where open cells once existed.The scientists were able to reproduce this rearrangement or oscillation of the cloud
honeycomb pattern in computer models, which helped them identify the driving factor – rain. Then, they analyzed scanning laser measurements from a ship cruising under cloud systems to verify the model results.“Together, these analyses demonstrated that the rearrangement is a result of precipitation, and that clouds belonging
to this kind of system rain almost in unison,” Feingold said.The synchronization starts with falling rain, which cools the air as it descends. This creates downward air currents. These downdrafts hit the surface, flow outward, and collide with each other,
forming updrafts. The air flowing up creates new clouds in previously open sky, just as older clouds dissipate. Then the new clouds rain, and the oscillating pattern repeats itself.“Once precipitation ensues and an open structure has formed, it is difficult to revert the cloud field to a closed-cell, or overcast state,” Feingold said. “Rain keeps the oscillating, open honeycomb pattern in motion, which allows more sun to reach Earth’s surface.”
The scientists say that their findings point to a significant influence of particulate matter, or aerosols, on the large-scale structure of clouds and, therefore, on climate change. Scientists have long known that aerosols can influence local rain formation and block solar energy from reaching the Earth’s surface—for an overall surface cooling effect.However, until recently, the scientific community has not considered the self-organization that results from these effects. Computer simulations for this study indicate that high aerosol concentrations favor the formation of large, dense cloud fields with less open space and less rain. This creates a more reflective cloud pattern and cooling of the surface. Low particulate levels in computer models resulted in rain and the open honeycomb structure with an oscillating pattern. The open honeycomb structure in a large cloud field lets more sunlight reach the surface, and hence results in surface warming.“Our work also suggests that we should expand our thinking about interactions between aerosols and clouds,” Feingold said. “Integrating our current focus on fundamental physical processes with broader studies on system dynamics could give us a more complete understanding of climate change.”—by Linda Joy, NOAA
Rain is the driving factor behind cloud
oscillations and honeycomb-like
patterns.
Top, satellite image of cellular structure in a marine stratus cloud field. Below, three images from a computer model animation of factors that lead to open and closed cells. The model reproduced oscillations seen in real clouds. Full animation: http://www.esrl.noaa.gov/csd/news/2010/85_0818.html

5
(nJet) installed in the summer of 2009 and already full, said ESRL’s Leslie Hart, the high-performance computing senior software engineer for NOAA’s Office of the Chief Information Officer. “Science is a core vacuum,” Hart said. “We needed more resolution for this hurricane work.” By September, ESRL researchers were using tJet’s parallel processors to make detailed comparisons of the hurricane forecasting prowess of several global forecast models, from the operational Global Forecast System (GFS) and European Center for Medium-Range Weather Forecasts (ECMWF) to ESRL’s experimental FIM (the Flow-following, finite-volume isocahedral model). At issue is how closely those models forecast the real-world tracks of hurricanes and changes in the storms’ intensity, said Stan Benjamin, Chief of GSD’s Assimilation and Modeling branch. Efforts to improve global tropical storm forecasts, he said, are reaching in several directions, all enabled by tJet: Experiments with higher horizontal resolution; ensemble forecasting with multiple runs; experiments with new data-assimilation schemes; and inclusion of chemistry and aerosols.ESRL researchers currently conduct a 15-km FIM run once per day out to 10-day projection, to examine the effect of higher-resolution for tropical cyclone forecasts. Last year, when ESRL conducted tests of an older version of FIM at 15-km resolution, it had to be done on an NSF-funded supercomputer in Texas with limited availability. tJet has also accelerated experiments to consider the effects of inline chemistry in FIM on tropical cyclone forecasts.So far, FIM is performing well, Benjamin said, with track and intensity forecasts that are about as skillful as those generated by the operational GFS—FIM is sometimes better, sometimes worse, but with improved intensity forecasts in the 15-km FIM. The experimental FIM model performs very well at predicting high-level winds, he said, and perhaps most importantly, FIM represents an approach that’s independent of other global models. That makes it especially useful for forecasters who project many possible futures with ensembles of independent models. Ensembles let forecasters pin probabilities on predictions. “FIM and GFS may be equal in overall skill, but FIM comes to different solutions,” Benjamin said. “So we’re very confident that the global ensemble will be better with the additional diversity of FIM.” FIM is a strong candidate to be added as an experimental model to the global multi-model ensemble system at the National
Centers for Environmental Prediction (NCEP) in 2012.ESRL researchers are also using tJet to study the impact of various data assimilation techniques on hurricane forecasts. Assimilation schemes are used to incorporate meteorological observations into the initial conditions of forecast models. Mike Fiorino (GSD) is evaluating the performance of two key assimilation schemes—the still-experimental Ensemble Kalman Filter (EnKF), developed by Jeff Whitaker, Tom Hamill, Phil Pegion, and others in ESRL’s Physical Sciences Division, and the operational NCEP Gridpoint Statistical Interpolation—when used with FIM. The EnKF is also run on ESRL’s tJet.“We are getting signals that the EnKF improves Eastern Pacific track forecasts,” Fiorino said. “This is the kind of result that will capture the attention of forecasters…but it may mean that this season’s set of storms happen to be the sort the EnKF/model handles well.” Fiorino said we will need many more experimental runs to make firm conclusions about the hurricane forecast performance of various models and assimilation schemes. But already, interesting patterns are emerging—such as the fact that FIM consistently did better with Eastern Pacific storms than those in the Western Pacific
Ocean. Figuring out why may well help his colleagues improve the models and assimilation schemes.It’s quite helpful to have in-house the computing power necessary for such research, Benjamin said. In the past, he and his colleagues had to port FIM code to other centers—such as the Texas Advanced Computing Center—and wait in queues for the processing time required to run a forecast at resolution as fine as 15-km scale.“Now we can do more science and less queue management,” Benjamin said. tJet also means that he and his colleagues can make quick variations to runs, depending on recent results, and to test high-resolution ensemble forecasts (with 30+ ensemble members) using FIM and GFS. These ESRL-tJet ensemble-based forecasts have had particularly high skill for tropical cyclone forecasts this fall.tJet was funded through the 2009 Hurricane Forecast Improvement Project (HFIP), in which NOAA is working with academic and private-sector partners to improve scientific understanding and prediction of tropical storms, hurricane intensity, hurricane tracking, and the dangerous storm surges associated with tropical storms. More on FIM, including output of daily runs: http://fim.noaa.gov/.
...FIM Hurricanes, from page 1
Installing tJet. Photo by Will von Dauster, ESRL.

6
Antarctic Ozone Hole Persists, At Least for AwhileMajor success in reducing ozone-depleting substances may not pay off in the Antarctic for several more years
August in Antarctica means the Sun starts rising over the horizon again, following four months of darkness. For NOAA Corps officer Nick Morgan (GMD), stationed at the South Pole, the month also marks the moment when he begins measuring ozone in earnest. For most of the year, Morgan and his colleagues launch giant plastic balloons into the air about weekly. Tethered to the balloons are instruments that take ozone readings up to about 18 miles high. Then, in the Antarctic spring (August through October), sunlight-sparked chemical reactions begin eating away at ozone. Scientists start making measurements more often, and by October, Morgan or his colleagues are outside in minus 80°F temperatures about every other day. Morgan and other scientists around the world are watching those data carefully, looking for evidence that the Antarctic ozone hole is beginning to heal after decades of hurt. There’s scant evidence yet, from the balloon-borne instrumnets or others on the ground and on satellites: At the end of September, total ozone was at its annual low of 122 Dobson units. Typical fall, winter, and summertime levels are 250-300 Dobson units. The worst-of-the-year ozone levels have averaged 108 during the last 24 years.It will be difficult to establish a clear-cut
recovery trend in Antarctic ozone levels because seasonal cycles and other variable natural factors—from the temperature of the atmosphere to the stability of atmospheric layers—can make ozone levels dip and soar from one day to another, says NOAA ESRL scientist Bryan Johnson. But the time is coming, probably within a few decades, when ozone depletion will no longer be observed each spring, Johnson said. “And within the next decade or so,” Johnson says, “observations are anticipated to begin showing reduced severity of the ozone hole.” As soon as the Sun crosses the horizon again during the Antarctic spring, sunlight-triggered chemical reactions involving air pollutants begin destroying ozone in a region of the atmosphere called the stratosphere. The stratospheric ozone layer protects Earth from some damaging ultraviolet radiation, so an ozone hole means more of that radiation can hit the surface and trigger elevated rates of skin cancer and crop damage.In the Antarctic, the ingredients for ozone depletion line up perfectly around September: Sunlight, low temperatures in the stratosphere, polar stratospheric clouds that help catalyze the destructive chemistry, and the continued presence of ozone-depleting chemicals, many of them released
decades ago. Most years, those conditions ease by early December, and the hole closes.“The ozone hole has taken somewhat of a back seat in the public eye,” Morgan wrote in a recent blog post from the South Pole. “And maybe that is a sign of success.”Levels of most ozone-depleting substances in the atmosphere have declined significantly since the 1987 Montreal Protocol was signed, he noted. That international treaty initiated the phasing out of chemicals called chlorofluorocarbons (CFCs), then used widely in refrigeration, as solvents, and in aerosol spray cans. The chemicals were breaking down in the stratosphere, and reactive parts—chlorine and bromine atoms—triggered ozone destruction, when conditions are ripe (sunlight, polar stratospheric clouds, cold temperatures). International scientists contributing to the quadrennial 2010 Ozone Assessment— including many NOAA scientists—have calculated that although global stratospheric ozone may recover by midcentury, the ozone hole in the Antarctic will likely persist longer. More: http://esrl.noaa.gov/gmd/dv/spo_oz/ and http://icestories.exploratorium.edu/dispatches/south-pole-ozonesonde-launch/ (video).
An ozonesonde release in Antarctica, NOAA photos.

7
International Environmental Success2010 asessment of ozone layer highlights roles of climate change, lauds Montreal ProtocolClimate change and the ozone layer are intricately coupled, and climate change will become increasingly important to the future ozone layer as ozone-depleting substances diminish in the atmosphere. Those are among the key conclusions of the 2010 Scientific Assessment of Ozone Depletion, a state-of-the-science volume produced by the United Nations Environment Programme and World Meteorological Organization every four years. ESRL scientists co-authored the report.The 2010 Ozone Assessment’s executive summary, compiled with extensive contributions from ESRL and others in NOAA, was made public in September. The full report will be out early next year. Among the conclusions:
• The Montreal Protocol is working. Levels of most major ozone-depleting substances have dropped in the last 20 years, preventing further degradation of the ozone layer and preventing many cases of skin cancer and crop damage.
• Because some ozone-depleting substances are also greenhouse gases, this has helped mitigate climate change.
• Ozone in the Antarctic polar region will take longer to recover than elsewhere, since Antarctic air is more isolated from the rest of the globe.
• The Antarctic ozone hole, which forms every spring, contributes to changes in surface climate, especially in wind and temperature patterns.
• Some replacement substances for phased-out ozone-depleting chemicals are powerful greenhouse gases.
About 300 scientists from around the world are contributing to the 2010 Ozone Assessment, including 26 from ESRL, who served as authors, contributors, reviewers, editors, and in other support roles. More: http://www.unep.org/PDF/PressReleases/898_ExecutiveSummary_EMB.pdf.
Sammie for Solomon Sam Kittner
2009 Ozone-Depleting Gas IndexESRL updates index to guide and monitor the recovery of the ozone layerIn September, ESRL’s Global Monitoring Division published the annual Ozone Depleting Gas Index (ODGI), which is a measure of overall atmospheric abundance of ozone-depleting chemicals called halons. ODGI is defined as 100 at the peak of halon levels (in 1994), and has been dropping steadily, due to the actions of an international treaty, the Montreal Protocol, and its amendments. More: http://www.esrl.noaa.gov/gmd/odgi/.
In recognition of pioneering work that altered the course of atmospheric research, ESRL senior scientist Susan Solomon (CSD) was awarded the Career Achievement Service to America medal September 15.“It’s been a privilege doing science to serve the American public, and receiving this wonderful award is one of the most humbling experiences of my life,” said Solomon.Solomon is the second NOAA scientist to win a Samuel J. Heyman Service to America Medal, or “Sammie.” In 2008, Eddie Bernard, director of NOAA’s Pacific Marine Environmental Laboratory in Seattle, won for his work in establishing an international tsunami detection and forecast system.“At NOAA, I am proud to say that our standards for achievement are quite high. We have a team of scientists who are consistently producing awe-inspiring and important work. They provide much of the knowledge we need to address many of our world’s environmental challenges,” said Jane Lubchenco, under secretary of commerce for oceans and atmosphere and NOAA administrator. “But Susan exceeds anyone’s standards. The nation has benefited from her three decades at NOAA, and we celebrate her accomplishments.”
Solomon is best known for her groundbreaking work identifying the cause of the ozone hole. She and her colleagues showed that this ozone depletion is caused by unusual chemistry involving human-made chlorofluorocarbons that occurs under the extremely cold conditions of Antarctica. Solomon’s work was one of the scientific cornerstones on which the international Montreal Protocol was built, which curbed the use of ozone-destroying substances.“Science is there to inform, but the choices of what to do are up to all of us,” Solomon often says, referring to how science is used to make an important policy decision.Solomon recently led a key study focused on global warming. The research demonstrated how changes in surface temperature, rainfall, and sea level are largely irreversible for more than 1,000 years after carbon dioxide emissions are completely stopped.In 2002, she was elected co-chair of Working Group I of the Intergovernmental Panel on Climate Change that published The Physical Science Basis in 2007. The IPCC was a co-winner of the Nobel Peace Prize that year.
100
95
90
85
80
75
70
65
60
Mid-Latitude
Antarctic
1990 1992 1994 1996 1998 2000 2002 2004 2006 2008

8
For three days this summer, 25 students sat at computers at the National Center for Atmospheric Research (NCAR), running some of the most cutting-edge Earth system models around, models usually only accessible to experienced scientists. The students—from Colorado State University’s Center for Multiscale Modeling of Atmospheric Processes (CMMAP) and other universities—listened to lectures and initiated model runs on a supercomputer. One enthusiastic student wrote on the workshop evaluation, “I liked getting hands-on experience with a supercomputing facility (a first for me.) I also liked meeting people in the field.” ESRL scientists from the Global Systems Division (GSD), and colleagues from Colorado State University, NCAR, NOAA’s National Centers for Environmental Prediction, and NASA led this first Summer School on Atmospheric Modeling (SSAM). The goal of the collaboration between those partners and NOAA’s Global Interoperability Program (at ESRL) was to build the professional skills of undergraduate and graduate students interested in global modeling for weather forecasting. “This is the first time we’ve been proactive about getting a new modeling system out there for graduate students to test and use,” said GSD Director Steven Koch. “We’re hoping to pull a new generation of young scientists into the world of global Earth system modeling.”This summer focused on ESRL’s new global Flow-Following Finite-Volume Icosahedral Model (FIM). Students were required to have senior-undergraduate training in atmospheric science with a focus on large-scale dynamics. Familiarity with numerical methods for modeling was recommended. The three-day summer school presented an overview of FIM, with detail about the model’s innovative dynamical core and physical parameterizations. Classes included discussions on computational performance and hands-on experience with
FIM. The students learned about hybrid vertical coordinates, geodesic numerics, FIM diagnostics, computational issues, and vertical discretization as they evaluated the accuracy of summer and winter forecasts. Students reported that they appreciated training on research-and-development systems, especially when their lecturers were the very scientists and engineers who developed those systems. “I liked most the interaction with the scientists who built the model and the lectures concerning the creation/working of the model,” wrote one student. They also liked the open interactions among modelers, including lively discussions about multiple approaches to solving some of the problems they deal with. Tom Henderson, a GSD software engineer supporting the effort, said that he and his colleagues put in many hours over weeks to prepare content, graphics, and slides for the lectures; to coordinate sessions; to test models; and address technical problems. “It was a pleasure to see the genuine interest of all these NOAA scientists in educating the next generation of global modelers,” wrote David Randall of CMMAP in a letter of appreciation to ESRL Director Sandy MacDonald. Randall also thanked the behind-the-scenes staff from NCAR for “superb support” of SSAM. “Not only did SSAM benefit the students tremendously as documented by their many favorable comments, but presenters benefitted as well,” Randall said. “SSAM helped raise the profile of FIM, bringing well-deserved credit to ESRL and its Global Systems Division.”Next summer SSAM will be hosted at NOAA’s Geophysical Fluid Dynamics Laboratory, and the focus will be on the AM3 atmospheric model. Organizers will incorporate lessons learned during this student-modeling workshop, such as performing more dry runs for hands-on sessions.But overall, Koch said, this first SSAM was a successful attempt to initiate young talent into atmospheric science. —by Annie Reiser
Model StudentsESRL scientists help lead summer school in Earth system modeling
ESRL researchers will work closely with two wind forecasting companies during the next year, to see if high-resolution observations and forecasts of wind can improve the operation of wind farms and electric grid systems.In September, the U.S. Department of Energy awarded $3.4 million to AWS Truepower, LLC, of Albany, NY, and WindLogics, Inc., of Saint Paul, MN, to evaluate the benefit of new observations and forecast techniques developed by NOAA, and to provide better forecasts for wind power production.In partnership with those companies and the DOE, ESRL and NOAA’s Air Resources Laboratory will deploy custom instruments, including wind-profiling radars, to wind farms to collect detailed meteorological data. ESRL scientists will assimilate those data into high-
Testing the WindNOAA and Industry Partner to Improve Wind Energy Production
to the smallest (the need for precise, well calibrated reference gas standards against which to make measurements.)Without careful and constant calibration of instruments, archiving of data, and ongoing comparisons between independent measurements, the results are not worth much, Tans said, and CMA is clearly interested in setting up a system of measurements that are credible nationally and internationally. “It’s in our interest, too, to help them,” Tans said. “China is now the biggest emitter of greenhouse gases.”
Although the Chinese visitors sought advice and expertise from ESRL, they have some advantages over ESRL, Tans said, notably funding. “China is clearly making a large investment in new instruments,” he said. “They are buying very good instruments—but you also have to adopt the best procedures, and there, maybe we can help.” GMD Director James Butler said that at the end of the workshop, a delegation of CMA signed an official agreement with NOAA to share data and cooperate on research.
...Chinese Visitors, from page 1
A working visit to ESRL by members of the Chinese Meteo-rological Agency coincided with the Boulder Laboratories Employee Association annual picnic. Photo by Will von Dauster, ESRL.

9
Pointing FingersWhen the weather gets weird, how to place blame?
resolution weather forecast models focused on the needs of the wind power industry—including turbine-height winds. Researchers at NOAA, AWS, and Windlogics will then evaluate whether the new observations and high-resolution modeling efforts improve forecasts—and how the industry uses those forecasts.To meet consumer power demand, grid operators need more accurate information about power generation by wind turbines, said Melinda Marquis (ESRL Director’s Office) who is leading the renewable energy project. With better information about the contributions of wind farms, grid operators may be able to rely less on traditional power sources—from coal to natural gas—that emit climate-warming greenhouse gases. More: http://www.energy.gov/news/9479.htm
Testing the WindNOAA and Industry Partner to Improve Wind Energy Production
Massive floods in Pakistan this summer uprooted 20 million people. A heat wave and wildfires in Russia conspired to kill thousands more. Nevada is hotter than ever. Such news is distressing on many levels to Kelly Redmond, Deputy Director of the Western Regional Climate Center in Reno, NV. First are the human lives and livelihoods lost. But there’s also the struggle of federal scientists to explain—on time scales of interest to policy makers and everyday people—what happened.Redmond’s phone has been ringing a lot recently. “Why’s it so hot in Nevada?” one reporter asked. “What’s going on in California?” asked another. “Is this climate change?” He can’t always answer. “We hear the same questions over and over after extreme events,” said ESRL’s Marty Hoerling, who organized an international
meeting on the attribution of climate-related events in Broomfield in August. “Why did it happen? Has this ever happened before? When could it happen again?” About 50 scientists (including Redmond), communications experts, water managers, and other users of climate information spent two days identifing what can be done to find and communicate answers that might be useful to people. To start, researchers often need to dissect the relative roles of natural variability (such as El Niño-Southern Oscillation), random weather, and climate change in a weather disaster—a drought, a flood, or deadly heat. Such “attribution” investigations aren’t easy and may require careful analysis of historic data, substantial computing power to evaluate climate projections, and time to asses published scientific papers on various climate patterns that might have contributed. Yet the answers are often of critical importance to people on the ground,
said ESRL’s Roger Pulwarty (PSD and the National Integrated Drought Information System). If a climate pattern is variable, perhaps depending on natural oscillations in sea-surface temperatures, then a period of crippling aridity, for example, might end soon with rain. If an attribution study shows a strong role of climate change, the conclusions may be different.“If the trend is persistent, well, that matters a great deal in terms of the scenarios that people in the Four Corners region develop to deal with it,” Pulwarty said. Peter Stott from the UK Meteorology Office, told the group he had hoped to arrive better prepared for the meeting, but was inundated with media calls about severe weather in Pakistan and Russia. “Last week was a bit of an object lesson in why we need this sort of activity,” Stott said. After Europe’s deadly 2003 heat wave, Stott and his colleagues conducted a careful attribution study and found that the deadly conditions in Europe were two to four times more likely in a warmed world than in the absence of climate change.That kind of clear result, communicated well, is an incredibly powerful message for many people, said Ed Maibach, Director of the Center for Climate Change Communication at George Mason University, and Susan Hassol of Climate Communication, who participated in the workshop. Maibach offered lessons from his research into how people make decisions—including the sobering news that scientific “findings” seldom have much impact. “Experience trumps analysis,” Maibach said. “If we want people to grapple with this, we need local, concrete, real stories.” Workshop participants agreed that to respond to public interest in extreme events and decision makers’ needs, attribution efforts must be timely, even “near real-time.” That’s challenging, given that strong science and review take time. During the meeting, breakout groups discussed ways to respond to user need with quick turn-around science and communications. Suggestions were diverse: An international team of attribution experts could be “activated” when extreme events approach. Or response could be staged, starting with a quick assessment of historic data to help the media put events into context and ending with a full attribution study conducted, knowing that it may not be done on time to catch the wave of public interest. Workshop participants also agreed that in general, a strong attribution enterprise would make it possible to improve projections of future climate, including extreme events. “The events we’ve seen this summer, the urgency compels us,” said Hoerling. “We want to do this faster and more effectively.”
More International Collaboration: IndiaA delegation of officials from the Indian Ministry of Environmental Science (MoES) also visited ESRL this fall. NOAA and MoES officials worked out the final details in an Implementation Agreement for NOAA to provide technical assistance setting up greenhouse gas measurements in India, and for the two-way exchange of air samples and data.
Michelle L’Heureux (NOAA Climate Prediction Center) and Mike Alexander (ESRL PSD) talk during the attribu-tion conference. Photo by Will von Dauster, ESRL.

10
More news, publications, and honors from NOAA’s Earth System Research Laboratory
Tiksi Observatory ESRL scientists were among
those celebrating the opening of Tiksi Hydrometeorological Climate Observatory at 73oN, on a patch of windswept Russian tundra. On August 25, representatives from several countries celebrated the installation of state-of-the-art equipment at the site, which will take long-term climate masurements. Taneil Uttal (PSD) helped lead the effort to equip and open Tiksi. Data will be freely available to the international community.
Full Tiksi story: http://www.research.noaa.gov/spotlite/archive/2010/articles/tiksi_russiaclimateobservatory.html.
News in Brief
Alexander Petrovich Makshtas, Arctic and Antarctic Research Institute of Roshydromet. Photo by Taneil Uttal, ESRL.
Climate StabilizationESRL’s Susan Solomon (CSD) chaired
the committee that wrote a National Research Council report released in July, Climate Stabilization Targets: Emissions, Concentrations, and Impacts over Decades to Millennia. The report quantifies the relationships between emission, concentration, warming, and future impacts. It examines the implications of a range of future greenhouse gas emissions levels, including likely impacts and the potential for serious or irreversible climate changes. More: http://dels.nas.edu/Report/Climate-Stabilization-Targets-Emissions-Concentrations/12877).
Achievement
Black Carbon in Profile During a multi-year mission nicknamed
HIPPO, ESRL scientists and colleagues from many other institutions have been profiling the atmosphere from pole to pole, and from near the surface to high in the atmosphere. Among the data being gathered are concentrations of particles containing “black carbon” (soot) emitted from biomass burning, diesel engines, cook stoves, and other sources. Black carbon absorbs sunlight rather than merely reflecting it (as so many other air pollution particles do) so scientists have been keen to understand more about its global distribution.
So far, the sizes of black carbon particles have been surprisingly uniform around the globe, Josh Schwarz (CSD) and colleagues reported in Geophysical Research Letters this fall. The team also found that air quality models overestimate black carbon levels by, on average, a factor of five in remote regions. Although that is probably due to several factors, including stronger sources in the Northern Hemisphere and differences in modeled and actual advection processes at the time of the measurements, the paper identifies a model problem, too: Models underestimate aerosol removal processes.
More: doi:10.1029/2010GL044372.
MADIS Milestone The ESRL-developed Metorological
Assimilation Data Ingest System (MADIS) is now running operationally at the National Weather Service. MADIS achieved “Initial Operating Capability” in September. The system collects, integrates, quality controls and distributes weather observations from NOAA and non-NOAA organizations, making the data available for increasingly high-resolution weather and climate models. More: http://madis.noaa.gov/.
ESRL Director Sandy MacDonald and NOAA Administra-tor Jane Lubchenco at an ESRL workshop. Photo by Will von Dauster, ESRL.
Prediction Workshop ESRL hosted the Earth System
Prediction Capability (ESPC) workshop in September, with high-level officials from NOAA, the Navy, the Air Force, NASA, the Department of Energy, and the White House Office of Science and Technology Policy. About 70 participants discussed establishing a range of operational products that “nowcast” (describe Earth systems at present) and forecast 30 years in future. Participants included Navy Rear Admiral David Titley and NOAA Administrator Jane Lubchenco.“ These efforts will help us understand...more about how our ocean, atmosphere, land, ice, and more interact—and how people interact with the environment,” Lubchenco said in her keynote address. “The forest fires raging just outside Boulder are just one example of how the lives of people are so directly linked with weather, climate, and land use.” Details: http://www.esrl.noaa.gov/research/events/espc/.
Summer Students About 45 high school, undergraduate,
and graduate students worked at ESRL and the David Skaggs Research Center this summer, as part of the Practical Hands-on Application to Science Education (PHASE). Student projects ranged from producing a video about a global atmospheric sampling program to an evaluation of air quality trends in California. This year’s internship programs included two high school students sponsored by the National Center for Atmospheric Research; special needs students; and students from groups underrepresented in the sciences.
One of ESRL’s students, Hollings Scholar Chris Slocum, won first place in the Hollings Scholars presentations in Silver Spring, MD, at the end of the summer; and Justin Krosschell won third place.
More about NOAA’s student programs in Boulder: http://www.esrl.noaa.gov/outreach/student_programs/.

11
8th Grade Science DaysNearly 300 8th grade students visited
the David Skaggs Research Center during the 8th Grade Science Days in October, organized by tour coordinator Hilary Peddicord and outreach specialist Carol Knight. The students learned about weather forecasting, climate change, and what it’s like to work at the South Pole. They watched a Science on a Sphere® presentation, helped launch a weather balloon, took part in a real laser experiment, and used sunspot data to calculate the Sun’s rotation.
Public tour information: http://www.esrl.noaa.gov/outreach/tours.html.
Published ESRL’s peer-reviewed publications are available in a searchable database:http://www.esrl.noaa.gov/search/pubs/Division Publication pages:GMD: www.esrl.noaa.gov/gmd/publications/PSD: www.esrl.noaa.gov/psd/pubs/CSD: www.esrl.noaa.gov/csd/pubs/GSD: www.esrl.noaa.gov/gsd/publications/
Houston Emissions DownHaze often hovers over Houston,
from chemical pollution produced by petroleum processing facilities. But that haze may be thinning a bit, according to a new ESRL-led study. The researchers found a drop in emissions of some chemicals. But the new findings—which have implications for petrochemical-producing cities around the world—come with a catch: Industry still significantly underestimates the amounts of some reactive chemicals being released into the air. More: Search doi:10.1029/2009JD013645 or see http://cires.colorado.edu/news/press/2010/houstonNox.html.
Three ESRL researchers received prestigious Gold Medals from the Department of Commerce this fall: Mark Cunningham (GMD) received a Department of Commerce Gold Medal “for heroic efforts treating injured Samoans following the 2009 tsunami and providing emergency power for the sole phone link in Eastern Samoa.” Susan Solomon (CSD) and Roger Pulwarty (PSD) shared a Group Gold Medal with several other NOAA colleagues, “for producing a major scientific report detailing the impacts of global climate change in the United States.”
Honors
ESRL Director Sandy MacDonald speaks with summer students. Photo by Will von Dauster, ESRL.
Laurel Watts and her NI Graphical System Design Achievement Award. Photo by Will von Dauster, ESRL.
Gulf Air Quality When the Deepwater Horizon oil
spill occurred, ESRL scientists led a quick-response mission to collect air quality data from the region, from the instrument-packed NOAA P3 aircraft. The scientists measured levels of nearly 100 air pollutants, from areas in the vicinity of the spill, downwind, and along the coast. Data are now publicly available. At and near the spill, common air pollutants such as ozone, nitrogen oxides, and carbon monoxide, were at levels typical to those found in urban areas of U.S. cities. Downwind of the slick, several hydrocarbons were in much higher concentrations than typically found in cities.
Scientists also measured large amounts of black carbon in smoke from a controlled burn of crude oil on the water’s surface.
The air chemistry flights were conducted to support the efforts of the Environmental Protection Agency and Occupational Safety and Health Administration to assess air quality for coastal residents and oil spill response workers.
More: http://www.noaanews.noaa.gov/stories2010/PDFs/NOAA_P3_Gulf%20Mission%20Report_final.pdf.
Laurel Watts (CSD) led a team that was awarded the 2010 National Instruments Graphical System Design Achievement Award, for design of a system to control an ozone instrument flown on a Global Hawk UAS during an atmospheric science mission over the Pacific Ocean.Tom Hamill and Jeff Whitaker (PSD) were awarded 14,500,000 processor hours on Department of Energy high-performance computational resources for creating a next-generation multi-decadal “reforecast” dataset, which will be used for renewable energy forecasts and other applications.
Several ESRL scientists have been selected to participate as leading authors and reviewers for parts of the next Intergovernmental Panel on Climate Change (IPCC) assessment: Ed Dlugokencky (GMD, lead author of Working Group I, Chapter 2: Observations: Atmosphere and Surface); Judith Perlwitz (PSD and CIRES, lead author of Working Group I, Chapter 10: Detection and Attribution of Climate Change: From Global to Regional); Roger Pulwarty (PSD, coordinating lead author of Working Group II, Chapter 15: Adaptation Planning and Implementation); Pieter Tans (GMD, review editor of Working Group I, Chapter 6: Carbon and Other Biogeochemical Cycles); and A.R. Ravishankara (CSD Director, review editor of Working Group 1, Chapter 8: Anthropogenic and Natural Radiative Forcing). The IPCC’s next assessment, the fifth, will be published between 2013 and 2014.Leslie Hartten (PSD) was recognized for 10 years of mentoring student scientists through the Significant Opportunities in Atmospheric Research and Science program, administered by the National Center for Atmospheric Research.

12
Earth System Research Laboratory 325 Broadway, Boulder, CO 80305http://www.esrl.noaa.gov
ESRL Quarterly Editor: Katy Human, [email protected] Photographer: Will von DausterOther Contributors: Barb DeLuisi, Morgan Heim, Linda Joy, Jane Palmer Annie Reiser
www.esrl.noaa.gov/news/quarterly
ESRL Leadership Alexander MacDonald, Director John Schneider, Deputy DirectorDonald Mock, Executive Director, NOAA Boulder LaboratoriesA.R. Ravishankara, Chemical Sciences Division DirectorJames Butler, Global Monitoring Division DirectorSteven Koch, Global Systems Division DirectorWilliam Neff, Physical Sciences Division Director
At NOAA’s Earth System Research Laboratory, we observe, understand, and predict the Earth system through research that advances NOAA’s environmental information and services, from minutes to millennia on global to local scales. ESRL’s partners are the Cooperative Institute for Research in Environmental Sciences at the University of Colorado at Boulder, and the Cooperative Institute for Research in the Atmosphere at Colorado State University in Fort Collins.
One overcast day in July, ESRL’s David Kingsmill watched raindrops falling on the rainbow-colored umbrella he held. This was a decidedly unusual rainstorm, however. The drops were not falling from the sky, but from a “rain chamber” outside the Exploratorium in San Francisco. Kingsmill (PSD) and ESRL colleagues are helping develop a new exhibit with the Exploratorium, an internationally acclaimed “museum of science, art and human perception.” Last year, NOAA signed on a five-year educational partnership to co-develop interactive exhibits, online learning experiences and professional development workshops for the learning institution. “The Exploratorium provides a really good vehicle for delivering our message to the public,” said Kingsmill. “People can literally get their hands on what we are doing at NOAA.”Shortly after the partnership was announced, Exploratorium staff visited ESRL, to learn more about NOAA science. Kingsmill and his colleagues wowed the museum’s Mary Miller, Thomas Humphrey, and others with a laboratory demonstration of rain-measuring instruments used to study the connection between climate and weather in the water cycle. The group began brainstorming how these instruments—and the science on which they are based—might be presented to the public in a unique and engaging way.During the next few months, staff from the two institutions shared a flurry of ideas. The teams got to thinking, “While it’s true that the weather can’t be controlled in the real world, what about in a closet-sized exhibit?” The concept of a rain chamber was born. The Exploratorium exhibit would employ rain gauges, which measure the volume of rain, and “disdrometers,” which count individual raindrops and characterize their size and fall speed. Kingsmill consulted with exhibit fabricators on rain formation so that the rain produced by the chamber was realistic enough.Another important part of developing the exhibit was demonstrating ESRL’s equipment to Exploratorium visitors and staff, to determine their interests and their baseline level of scientific knowledge before figuring out what kinds of visual aids would be helpful in an exhibit. Kingsmill and Allen White (also PSD), spent time at the Exploratorium this summer doing just that. Being right at the museum made it easy to test new ideas practically on the spot. For example, after conducting demonstrations of the instruments in one area of the museum, they realized that it made more sense to move them next to existing exhibits on fog and raindrops to provide visitors with additional context.
Raindrops Keep Falling on my DisdrometerESRL partners with leading science museum to develop hands-on science exhibit
Dave Kinsmill tests a disdrometer—and an umbrella—outside the Exploratorium in San Francisco. Photo courtesy of the Exploratorium.
“One of the great things about working at the Exploratorium was each day saying, ‘How’d it go?’ and ‘What can we do differently?’” said Kingsmill. The culminating demonstration of the summer was an evaluation on Sept. 15. Kingsmill used new prototype visuals and a tabletop version of the rain chamber to engage visitors. Exploratorium staff observed from a distance and then interviewed people as they left the area. One finding was that most of the visitors could understand individual exhibits, but struggled to see how they were related to each other. That evaluation, and feedback from the other demonstrations, will help guide the development of a more permanent exhibit.The rain chamber exhibit will continue to evolve for the next couple years as ESRL and the Exploratorium design complementary pieces to help tell the story of rain and explain the connection between scientific instrumentation and big issues such as flooding and climate change. — with Barb DeLuisi