Embed Size (px)
Citation preview

1
Investor information Vienna, 27 February 2015
Erste Group: Preliminary result 2014 2014 closed with profitable quarter, as loan growth re-emerges, asset quality improves and capital position strengthens; outlook confirmed
Financial data Income statement
in EUR million Q4 13 Q3 14 Q4 14 2013 2014
Net interest income 1,169.2 1,126.0 1,125.6 4,685.0 4,495.2 Net fee and commission income 462.8 465.8 497.1 1,806.5 1,869.8 Net trading and fair value result 34.6 28.4 75.8 218.8 242.3 Operating income 1,731.8 1,695.8 1,760.5 6,995.1 6,877.9 Operating expenses -971.7 -887.3 -1,003.6 -3,896.1 -3,787.3 Operating result 760.1 808.5 756.9 3,099.0 3,090.7 Net impairment loss on non-fair value financial assets -529.4 -878.8 -484.3 -1,774.4 -2,159.2 Post-provision operating result 230.8 -70.3 272.6 1,324.7 931.4 Net result attributable to owners of the parent -370.3 -554.2 42.0 60.3 -1,442.0 Net interest margin (on average interest-bearing assets) 2.73% 2.68% 2.66% 2.69% 2.65% Cost/income ratio 56.1% 52.3% 57.0% 55.7% 55.1% Provisioning ratio (on average gross customer loans) 1.65% 2.75% 1.51% 1.37% 1.69% Tax rate -67.2% -23.7% 49.6% 47.2% -63.4% Return on equity -12.8% -21.7% 1.7% 0.5% -13.6%
Balance sheet
in EUR million Dec 13 Sep 14 Dec 14 Dec 13 Dec 14
Cash and cash balances 9,301 8,010 7,835 9,301 7,835 Trading, financial assets 51,269 51,051 50,131 51,269 50,131 Loans and receivables to credit institutions 8,377 7,166 7,442 8,377 7,442 Loans and receivables to customers 119,945 120,451 120,834 119,945 120,834 Intangible assets 2,441 1,456 1,441 2,441 1,441 Miscellaneous assets 8,786 8,839 8,604 8,786 8,604 Total assets 200,118 196,973 196,287 200,118 196,287 Financial liabilities - held for trading 6,475 8,488 7,746 6,475 7,746 Deposits from banks 17,299 16,483 14,803 17,299 14,803 Deposits from customers 122,415 120,061 122,583 122,415 122,583 Debt securities issued 33,124 31,211 31,140 33,124 31,140 Miscellaneous liabilities 6,020 7,078 6,573 6,020 6,573 Total equity 14,785 13,652 13,443 14,785 13,443 Total liabilities and equity 200,118 196,973 196,287 200,118 196,287 Loan/deposit ratio 98.0% 100.3% 98.6% 98.0% 98.6% NPL ratio 9.6% 8.9% 8.5% 9.6% 8.5% NPL coverage (exc collateral) 63.1% 68.8% 68.9% 63.1% 68.9% CET 1 ratio (phased-in) 11.4% 10.8% 10.6% 11.4% 10.6%
Adoption of IFRS 10 led to retrospective consolidation of several entities and additionally the new implemented structure of income statement and balance sheet resulted in retrospective changes in the presentation.

2
HIGHLIGHTS P&L 2014 compared with 2013; balance sheet 31 December 2014 compared with 31 December 2013 Net interest income declined to EUR 4,495.2 million (EUR 4,685.0 million), mainly due to the persistently low interest rate environment and FX translation effects. Net fee and commission income increased to EUR 1,869.8 million (EUR 1,806.5 million) on the back of an improved result from securities business and asset management. The net trading and fair value result rose to EUR 242.3 million (EUR 218.8 million). Operating income amounted to EUR 6,877.9 million (-1.7%; EUR 6,995.1 million). General administrative expenses declined to EUR 3,787.3 million (-2.8%; EUR 3,896.1 million), mainly due to lower personnel expenses on the back of lower average headcount and decreased depreciation and amortisa-tion. This led to an operating result of EUR 3,090.7 million (-0.3%; EUR 3,099.0 million) and an improved cost/income ratio of 55.1% (55.7%). Net impairment loss on financial assets not measured at fair value through profit or loss went up to EUR 2,159.2 million or 169 basis points of average customer loans (+21.7%; EUR 1,774.4 million or 137 basis points). This rise was attributable in particular to additional risk costs in Romania incurred in connection with the accelerated NPL reduction. The NPL ratio declined substantially to 8.5% (9.6%) on the back of successful NPL sales in Romania. The NPL coverage ratio improved significantly to 68.9% (63.1%). Other operating result amounted to EUR -1,752.9 million (EUR -1,008.6 million). This was primarily due to the write-down of goodwill in the amount of EUR 475.0 million as well as of brand and customer relationships in Ro-mania of EUR 489.8 million in total. At EUR 256.3 million (EUR 311.0 million) levies on banking activities were again significant: EUR 130.5 million (EUR 166.5 million) in Austria, EUR 31.5 million (EUR 41.2 million) in Slovakia and EUR 94.2 million (EUR 103.4 million) in Hungary – including EUR 47.9 million in banking tax. In addition, the item other operating result included EUR 336.8 million in expenses resulting from the consumer loan law passed by the Hungarian parliament. The net burden of the law and the conversion of the foreign-currency loans was EUR 312.2 million. Taxes on income rose to EUR 509.4 million due to a negative change in deferred taxes (net) in the amount of EUR 197.0 million. The net result attributable to owners of the parent amounted to EUR -1,442.0 million (EUR 60.3 million). Total equity (IFRS) declined to EUR 13.4 billion (EUR 14.8 billion). Common equity tier 1 capital (CET 1, Ba-sel 3 phased-in) decreased to EUR 10.6 billion versus EUR 11.2 billion (Basel 2.5). Total risk (risk-weighted assets including credit, market and operational risk, Basel 3 phased-in) increased to EUR 100.6 billion (EUR 97.9 billion). The common equity tier 1 ratio (CET 1, Basel 3 phased-in) stood at 10.6% versus 11.4% (Basel 2.5). The common equity tier 1 ratio (CET 1, Basel 3 final) increased quarter on quarter from 10.5% to 10.6%. The total capital ratio (Basel 3 phased-in) stood at 15.7% versus 16.3% (Basel 2.5). Total assets amounted to EUR 196.3 billion (EUR 200.1 billion). Loans and advances to customers (net) increased moderately to EUR 120.8 billion (EUR 119.9 billion). The loan-to-deposit ratio stood at 98.6% (98.0%)

3
OUTLOOK Operating environment anticipated to be conducive to credit expansion Real GDP growth is expected to be between 2% and 3% in all major CEE markets, except Croatia, driven by rising domestic demand. For Austria, a real GDP growth below 1% is forecast. Return on tangible equity (ROTE) expected at 8-10% in 2015 (YE 14 TE: EUR 8.4 billion) Operating result is expected to decline in the mid-single digits on the back of lower but sustainable operating results in Hungary (due to FX conversion related effects of lower average volume and the expected reversal of a positive 2014 trading effect in 2015) and Romania (lower unwinding impact) as well as the persistent low interest rate environment. For 2015, loan growth in the low single digits and a significant decline in risk costs are anticipated. Banking lev-ies are expected to amount to about EUR 360 million in 2015, including contributions to European bank resolu-tion and deposit insurance funds. Related discussions with the Austrian government are still ongoing. Risks to guidance Consumer protection initiatives for example potential pre-election CHF legislation in Croatia as well as geopoliti-cal risks (Eastern Ukraine conflict, Greece) could have a negative impact on Erste Group’s operating environ-ment. PERFORMANCE IN DETAIL January-December 2014 compared with January-December 2013 in EUR million 2013 2014 Change
Net interest income 4,685.0 4,495.2 -4.1% Net fee and commission income 1,806.5 1,869.8 3.5% Net trading and fair value result 218.8 242.3 10.7% Operating income 6,995.1 6,877.9 -1.7% Operating expenses -3,896.1 -3,787.3 -2.8% Operating result 3,099.0 3,090.7 -0.3% Net impairment loss on financial assets not measured at fair value through profit or loss -1,774.4 -2,159.2 21.7% Other operating result -1,008.6 -1,752.9 73.8%
Levies on banking activities -311.0 -256.3 -17.6% Pre-tax result from continuing operations 378.4 -803.2 n/a Taxes on income -178.5 -509.4 >100.0% Net result for the period 199.9 -1,312.6 n/a
Net result attributable to non-controlling interests 139.6 129.4 -7.3% Net result attributable to owners of the parent 60.3 -1,442.0 n/a
Net interest income Net interest income declined to EUR 4,495.2 million (EUR 4,685.0 million), mainly due to continuing subdued loan demand in a low interest rate environment. The net interest margin (net interest income as a percentage of average interest-bearing assets) contracted from 2.69% to 2.65%. Net fee and commission income Net fee and commission income increased to EUR 1,869.8 million (EUR 1,806.5 million) due, among others, to improved results from the securities business, asset management, and brokerage commissions. Net trading and fair value result The net trading and fair value result rose to EUR 242.3 million (EUR 218.8 million), mainly due to valuation re-sults for securities and derivatives held for trading. Swaps entered into with the Hungarian National Bank to se-cure refinancing of foreign-currency loans had a positive impact of EUR 32.4 million. A corresponding negative counter effect was shown in other operative result.

4
General administrative expenses in EUR million 2013 2014 Change
Personnel expenses 2,232.4 2,184.2 -2.2% Other administrative expenses 1,146.0 1,136.9 -0.8% Depreciation and amortisation 517.7 466.1 -10.0% General administrative expenses 3,896.1 3,787.3 -2.8%
General administrative expenses declined to EUR 3,787.3 million (EUR 3,896.1 million) (currency-adjusted: -1.5%). Personnel expenses decreased to EUR 2,184.2 million (EUR 2,232.4 million) (currency-adjusted: -1.1%). Further cost savings were achieved in other administrative expenses which decreased on the back of lower office-related expenses to EUR 1,136.9 million (EUR 1,146.0 million) (currency-adjusted: +1.1%). Depre-ciation and amortisation declined to EUR 466.1 million (EUR 517.7 million) (currency-adjusted: -1.5%). The line item other administrative expenses included deposit insurance contributions in the amount of EUR 87.6 mil-lion (EUR 77.2 million). The line item depreciation and amortisation included the straight-line amortisation of intangible assets (i.e. customer relationships) in the amount of EUR 37.0 million (EUR 65.2 million). The headcount increased slightly by 0.9% partly due to the expanded consolidation scope to 46,067; average headcount went down to 45,996 (46,842). Headcount as of end of the period Dec 13 Dec 14 Change
Domestic 15,659 15,550 -0.7% Erste Group, EB Oesterreich and subsidiaries 8,388 8,324 -0.8% Haftungsverbund savings banks 7,271 7,226 -0.6%
Abroad 30,011 30,517 1.7% Česká spořitelna Group 10,432 10,504 0.7% Banca Comercială Română Group 7,020 7,054 0.5% Slovenská sporiteľňa Group 4,206 4,275 1.6% Erste Bank Hungary Group 2,778 2,766 -0.4% Erste Bank Croatia Group 2,584 2,754 6.6% Erste Bank Serbia 922 955 3.6% Savings banks subsidiaries 1,100 1,166 6.0% Other subsidiaries and foreign branch offices 969 1,043 7.6%
Total 45,670 46,067 0.9%
Operating result Driven by lower net interest income, operating income declined to EUR 6,877.9 million (-1.7%; EUR 6,995.1 million). As general administrative expenses were reduced at the same time to EUR 3.787,3 million (-2.8%; EUR 3,896.1 million), the operating result remained stable at EUR 3,090.7 million (-0.3%: EUR 3,099.0 million). Gains/losses from financial assets and liabilities not measured at fair value through profit or loss (net) Gains/losses from financial assets and liabilities not measured at fair value through profit and loss (net) declined to EUR 18.3 million (EUR 62.4 million), mainly due to the negative contribution from the repurchase of financial liabilities. Net impairment loss on financial assets not measured at fair value through profit or loss (net) Net impairment loss on financial assets (net) rose to EUR 2,159.2 million (EUR 1,774.4 million), mainly due to higher risk costs in Romania. This development was largely attributable to the rise in the balance of the alloca-tion and release of provisions for the lending business together with the costs of direct loan write-offs offset by income received from the recovery of loans already written off to EUR 2,120.4 million (EUR 1,726.5 million). Net impairment loss on financial assets not measured at fair value through profit or loss, based on the average vol-ume of customer loans, amounted to 169 basis points (137 basis points). In addition, this line item included net impairment loss on financial assets – held to maturity and financial assets – available for sale in the amount of EUR -38.8 million (EUR -47.9 million). Other operating result Other operating result amounted to EUR -1,752.9 million (EUR -1,008.6 million). This was primarily attributable to write-downs: overall, goodwill write-downs amounted to EUR 475.0 million (thereof EUR 319.1 million in Ro-
5
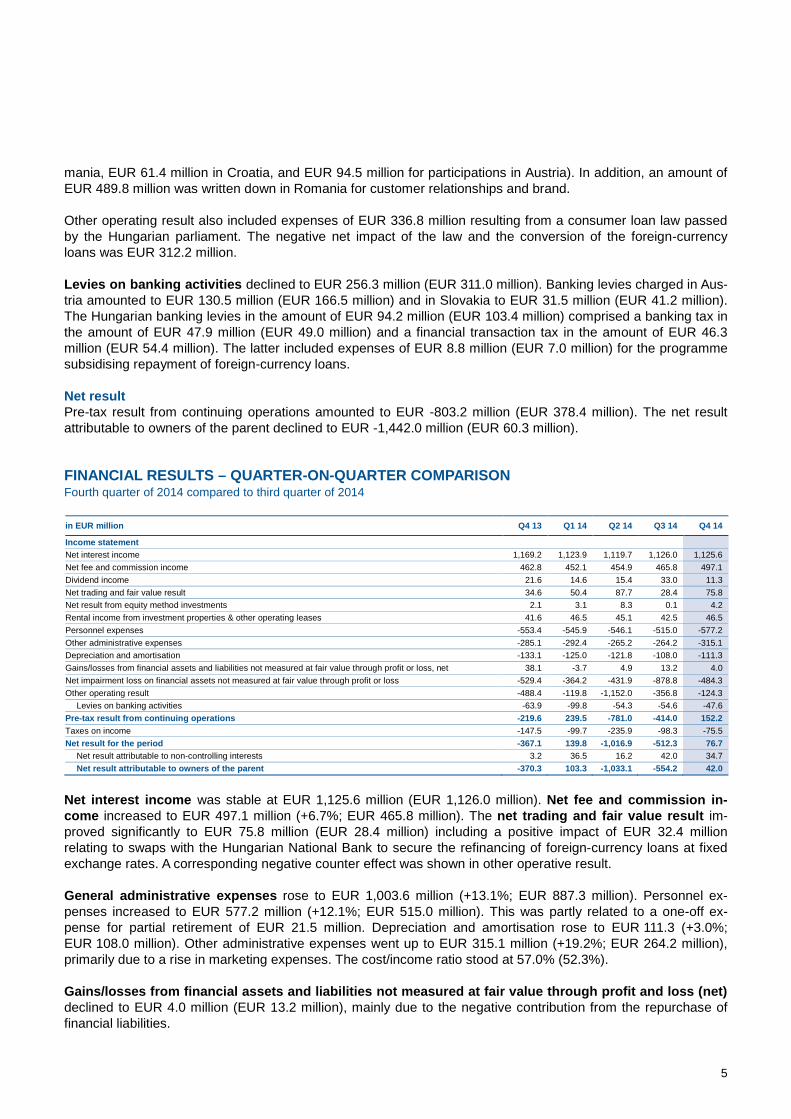
mania, EUR 61.4 million in Croatia, and EUR 94.5 million for participations in Austria). In addition, an amount of EUR 489.8 million was written down in Romania for customer relationships and brand. Other operating result also included expenses of EUR 336.8 million resulting from a consumer loan law passed by the Hungarian parliament. The negative net impact of the law and the conversion of the foreign-currency loans was EUR 312.2 million. Levies on banking activities declined to EUR 256.3 million (EUR 311.0 million). Banking levies charged in Aus-tria amounted to EUR 130.5 million (EUR 166.5 million) and in Slovakia to EUR 31.5 million (EUR 41.2 million). The Hungarian banking levies in the amount of EUR 94.2 million (EUR 103.4 million) comprised a banking tax in the amount of EUR 47.9 million (EUR 49.0 million) and a financial transaction tax in the amount of EUR 46.3 million (EUR 54.4 million). The latter included expenses of EUR 8.8 million (EUR 7.0 million) for the programme subsidising repayment of foreign-currency loans. Net result Pre-tax result from continuing operations amounted to EUR -803.2 million (EUR 378.4 million). The net result attributable to owners of the parent declined to EUR -1,442.0 million (EUR 60.3 million). FINANCIAL RESULTS – QUARTER-ON-QUARTER COMPARISON Fourth quarter of 2014 compared to third quarter of 2014 in EUR million Q4 13 Q1 14 Q2 14 Q3 14 Q4 14
Income statement Net interest income 1,169.2 1,123.9 1,119.7 1,126.0 1,125.6 Net fee and commission income 462.8 452.1 454.9 465.8 497.1 Dividend income 21.6 14.6 15.4 33.0 11.3 Net trading and fair value result 34.6 50.4 87.7 28.4 75.8 Net result from equity method investments 2.1 3.1 8.3 0.1 4.2 Rental income from investment properties & other operating leases 41.6 46.5 45.1 42.5 46.5 Personnel expenses -553.4 -545.9 -546.1 -515.0 -577.2 Other administrative expenses -285.1 -292.4 -265.2 -264.2 -315.1 Depreciation and amortisation -133.1 -125.0 -121.8 -108.0 -111.3 Gains/losses from financial assets and liabilities not measured at fair value through profit or loss, net 38.1 -3.7 4.9 13.2 4.0 Net impairment loss on financial assets not measured at fair value through profit or loss -529.4 -364.2 -431.9 -878.8 -484.3 Other operating result -488.4 -119.8 -1,152.0 -356.8 -124.3
Levies on banking activities -63.9 -99.8 -54.3 -54.6 -47.6 Pre-tax result from continuing operations -219.6 239.5 -781.0 -414.0 152.2 Taxes on income -147.5 -99.7 -235.9 -98.3 -75.5 Net result for the period -367.1 139.8 -1,016.9 -512.3 76.7
Net result attributable to non-controlling interests 3.2 36.5 16.2 42.0 34.7 Net result attributable to owners of the parent -370.3 103.3 -1,033.1 -554.2 42.0
Net interest income was stable at EUR 1,125.6 million (EUR 1,126.0 million). Net fee and commission in-come increased to EUR 497.1 million (+6.7%; EUR 465.8 million). The net trading and fair value result im-proved significantly to EUR 75.8 million (EUR 28.4 million) including a positive impact of EUR 32.4 million relating to swaps with the Hungarian National Bank to secure the refinancing of foreign-currency loans at fixed exchange rates. A corresponding negative counter effect was shown in other operative result. General administrative expenses rose to EUR 1,003.6 million (+13.1%; EUR 887.3 million). Personnel ex-penses increased to EUR 577.2 million (+12.1%; EUR 515.0 million). This was partly related to a one-off ex-pense for partial retirement of EUR 21.5 million. Depreciation and amortisation rose to EUR 111.3 (+3.0%; EUR 108.0 million). Other administrative expenses went up to EUR 315.1 million (+19.2%; EUR 264.2 million), primarily due to a rise in marketing expenses. The cost/income ratio stood at 57.0% (52.3%). Gains/losses from financial assets and liabilities not measured at fair value through profit and loss (net) declined to EUR 4.0 million (EUR 13.2 million), mainly due to the negative contribution from the repurchase of financial liabilities.

6
Net impairment loss on financial assets not measured at fair value through profit or loss went down to EUR -484.3 million (EUR -878.8 million), mostly due to higher risk costs in Romania in the previous quarter. Other operating result amounted to EUR -124.3 million (EUR -356.8 million). In previous periods, all charges resulting from the Hungarian consumer loan law were reported under this item, in the third quarter in the amount of EUR 230.5 million. In the fourth quarter total expenses for the Hungarian consumer loan law were recalculat-ed, which resulted in lower expenses by EUR 24.0 million. Levies on banking activities amounted to EUR 47.6 million (EUR 54.6 million). Thereof, EUR 12.4 million (EUR 11.7 million) were paid in Hungary: financial transaction taxes of EUR 10.1 million (EUR 9.4 million) plus EUR 2.3 million (EUR 2.3 million) for the programme subsidising repayment of foreign-currency loans. In Austria, banking taxes amounted to EUR 35.2 million (EUR 32.1 million). In Slovakia, no banking tax was payable in the fourth quarter (EUR 10.8 million). Pre-tax result stood at EUR 152.2 million (EUR -414.0 million. The net result attributable to owners of the parent amounted to EUR 42.0 million (EUR -554.2 million). DEVELOPMENT OF THE BALANCE SHEET 31 December 2014 compared with 31 December 2013 in EUR million Dec 13 Dec 14 Change
Assets Cash and cash balances 9,301 7,835 -15.8% Trading, financial assets 51,269 50,131 -2.2% Loans and receivables to credit institutions 8,377 7,442 -11.2% Loans and receivables to customers 119,945 120,834 0.7% Intangible assets 2,441 1,441 -41.0% Miscellaneous assets 8,786 8,604 -2.1% Total assets 200,118 196,287 -1.9% Liabilities and equity Financial liabilities - held for trading 6,475 7,746 19.6% Deposits from banks 17,299 14,803 -14.4% Deposits from customers 122,415 122,583 0.1% Debt securities issued 33,124 31,140 -6.0% Miscellaneous liabilities 6,020 6,573 9.2% Total equity 14,785 13,443 -9.1% Total liabilities and equity 200,118 196,287 -1.9%
Trading and investment securities declined slightly to EUR 50.1 billion (EUR 51.3 billion). The rise in the line item financial assets – available for sale did not fully offset the decline in the line items financial assets – held to maturity, financial assets – held for trading, and financial assets – at fair value through profit or loss. Loans and receivables to credit institutions (net) decreased to EUR 7.4 billion (EUR 8.4 billion). Loans and receivables to customers (net) rose to EUR 120.8 billion (EUR 119.9 billion) despite continuing subdued credit demand in some business segments and significant declines in Romania and Hungary. Allowances for loans and receivables to customers shown as part of loans and receivables to customers decreased to EUR 7.5 billion (EUR 7.8 billion). The NPL ratio, non-performing loans as a percentage of loans to customers, declined significantly to 8.5% (9.6%). The NPL coverage ratio improved to 68.9% (63.1%). Due to the recognition of impairments including goodwill, customer relationships and brand, intangible assets declined to EUR 1.4 billion (EUR 2.4 billion). Miscellaneous assets were largely unchanged at EUR 8.6 billion (EUR 8.8 billion) despite a write-down of deferred tax assets. Financial liabilities – held for trading increased to EUR 7.7 billion (EUR 6.5 billion) due to interest yield changes. Deposits from banks decreased to EUR 14.8 billion (EUR 17.3 billion), reflecting a decline in overnight deposits from credit institutions. Deposits from customers increased moderately to EUR 122.6 billion (EUR 122.4 bil-
7
lion) despite a negative impact of EUR 1.8 billion related to the final deconsolidation of the Czech pension fund. The loan-to-deposit ratio stood at 98.6% (98.0%). Debt securities in issue, in particular bonds as well as mortgage and public sector covered bonds, declined to EUR 31.1 billion (EUR 33.1 billion) due to redemptions. Miscellaneous liabilities rose to EUR 6.6 billion (EUR 6.0 billion). Erste Group’s total equity (IFRS) declined to EUR 13.4 billion (EUR 14.8 billion). After regulatory deductions and filter according to the CRR, tier 1 capital (Basel 3 phased-in) amounted to EUR 10.6 billion (year-end 2013, Basel 2.5: EUR 11.6 billion), common equity tier 1 capital (CET1, Basel 3 phased-in) stood at EUR 10.6 billion (year-end 2013, Basel 2.5: EUR 11.2 billion). Total risk (risk-weighted assets including credit, market and op-erational risk, Basel 3 phased-in) increased to EUR 100.6 billion (EUR 97.9 billion). As of 2014, Erste Group calculates consolidated regulatory capital according to Basel 3. In 2014, the calculation follows the requirements as defined within the capital requirements regulation (CRR) taking into consideration transitional provisions as defined within the Austrian "CRR-Begleitverordnung". These transitional provisions define the percentages applicable to eligible capital instruments and regulatory deduction items as well as filters. The total capital ratio (Basel 3 phased-in) in relation to the total risk (total eligible qualifying capital in relation to total risk pursuant to CRR) was 15.7% as of 31 December 2014 (year-end 2013, Basel 2.5: 16.3%), well above the legal minimum requirement. The tier 1 ratio (Basel 3 phased-in), which includes the capital requirements for credit, market and operational risk, stood at 10.6% (year-end 2013, Basel 2.5: 11.8%). The common equity tier 1 ratio (Basel 3 phased-in) amounted to 10.6% as of 31 December 2014 (year-end 2013, Basel 2.5: 11.4%). SEGMENT REPORTING January- December 2014 compared with January- December 2013 Erste Group introduced a new segment reporting, starting from 1 January 2014 that is based on the matrix organisation and provides comprehensive information to assess the business line and geographic performance. However, the segmentation criteria for corporate business were also changed with no retrospective adjustments. The former local large corporate business (included in the SME segment in 2013) was reallocated either to the Large Corporates segment or to the SME segment, depending on annual turnover thresholds. The tables and information below provide a brief overview and focus on selected and summarised items. At www.erstegroup.com additional information is available in Excel format.

8
BUSINESS SEGMENTS Retail in EUR million 2013 2014 Change
Net interest income 2,216.8 2,175.1 -1.9% Net fee and commission income 1,053.4 1,050.3 -0.3% Net trading and fair value result 62.2 59.8 -3.8% Operating income 3,361.0 3,317.4 -1.3% Operating expenses -1,839.2 -1,814.3 -1.4% Operating result 1,521.8 1,503.1 -1.2% Cost/income ratio 54.7% 54.7% Net impairment loss on financial assets not measured at fair value through profit or loss -466.0 -671.7 44.1% Other result -93.0 -393.2 >100.0% Net result attributable to owners of the parent 739.0 271.7 -63.2% Return on allocated capital 37.3% 13.6%
The Retail segment comprises the entire business with private individuals, free professionals and micros in the responsibility of account managers in the retail network of the local banks cooperating with their specialised sub-sidiaries (such as factoring, leasing and asset management companies). The decrease in net interest income was driven by lower income from unwinding as well as lower deposit vol-umes and margins in Romania and shrinking loan volumes and margins in Hungary. These developments were partly offset by positive contributions from deposits in Austria and growing lending business in Slovakia. Rental income increased due to the consolidation of a leasing subsidiary in Croatia. Cost saving measures in the Czech Republic and Romania led to a reduction in operating expenses. Although the decrease in costs could not fully offset the net interest income decline and operating result decreased, cost/income ratio remained stable. The deterioration of net impairment loss on financial assets not measured at FV through P&L was driven by signifi-cantly higher risk costs in Romania on the back of the accelerated NPL reduction. The line item other result in-cluded expenses related to the Hungarian consumer loan law in an amount of EUR 304.4 million (further expenses of EUR 32.4 million related to the conversion of the foreign currency loans were included in the seg-ment Asset/Liability Management & Local Corporate Center). This triggered the significant decrease of the net result attributable to the owners of the parent. SME in EUR million 2013 2014 Change
Net interest income 671.0 569.4 -15.1% Net fee and commission income 231.2 198.4 -14.2% Net trading and fair value result 29.1 31.9 9.7% Operating income 937.9 832.7 -11.2% Operating expenses -288.0 -292.8 1.7% Operating result 650.0 539.9 -16.9% Cost/income ratio 30.7% 35.2% Net impairment loss on financial assets not measured at fair value through profit or loss -455.0 -461.1 1.3% Other result -34.2 0.6 n/a Net result attributable to owners of the parent 109.9 50.4 -54.2% Return on allocated capital 6.8% 3.6%
The SME segment consists of business with clients which are in the responsibility of the local corporate account managers, mainly consisting of micros, SMEs, small public sector companies and small financial institutions (e.g. third party leasing companies). The decline in net interest income and in net fee and commission income were primarily related to the realloca-tion of a local large corporate portfolio, which in 2013 had been shown in the SME segment, to the Large Corpo-rate segment: Operating expenses increased slightly; the cost/income ratio rose. Net impairment loss on financial assets not measured at FV through profit and loss went up moderately. The other result improved main-ly due to one-off income related to an insurance payment in Austria. The net result attributable to the owners of the parent declined.

9
Asset/Liability Management & Local Corporate Center in EUR million 2013 2014 Change
Net interest income 220.5 164.7 -25.3% Net fee and commission income -102.6 -65.3 -36.4% Net trading and fair value result -92.2 24.7 n/a Operating income 86.7 184.6 >100.0% Operating expenses -120.6 -112.9 -6.5% Operating result -33.9 71.8 n/a Cost/income ratio >100.0% 61.1% Net impairment loss on financial assets not measured at fair value through profit or loss -5.0 1.2 n/a Other result -85.1 -214.2 >100.0% Net result attributable to owners of the parent 20.8 -174.8 n/a Return on allocated capital 0.6% -9.9%
The ALM & LCC segment includes all local asset/liability management functions as well as the one from Erste Group Bank AG and the local corporate centers which comprise all non-core banking activities, non-profit servic-ing participations and reconciliation items to local entity results. Net interest income decreased considerably mainly due to lower ALM contribution driven by flat curves and low interest rate environment as well as high spreads for Austrian banks. The increase in net fee and commission income was primarily related to the positive impact from lower fee expenses in Austria. The net trading and fair value result improved substantially due to a better result from derivatives. Operating expenses also improved mainly due to lower personnel expenses in Romania. Thus, the operating result improved significantly. The other result deteriorated as a consequence of the impairment of real estate property and intangible assets in Banca Comercială Română as well as one-off revenues earned in 2013 in the Czech Republic. The line item other re-sult also included expenses related to the conversion of the foreign currency loans In Hungary in an amount of EUR 32.4 million. Taxes on income in 2013 benefited from a positive one-off impact from the release of deferred tax liabilities in Romania in the amount of EUR 127.7 million. Consequently, the net result attributable to the owners of the parent decreased significantly. Savings Banks in EUR million 2013 2014 Change
Net interest income 814.7 891.8 9.5% Net fee and commission income 396.4 419.3 5.8% Net trading and fair value result 22.0 1.1 -94.8% Operating income 1,304.5 1,379.0 5.7% Operating expenses -926.5 -932.1 0.6% Operating result 378.0 446.9 18.2% Cost/income ratio 71.0% 67.6% Net impairment loss on financial assets not measured at fair value through profit or loss -229.2 -199.4 -13.0% Other result -3.7 -15.4 >100.0% Net result attributable to owners of the parent 22.4 18.4 -18.0% Return on allocated capital 4.4% 9.0%
The Savings Banks segment includes the savings banks which are members of the Haftungsverbund (cross-guarantee system) of the Austrian savings banks sector except for Erste Bank Oesterreich, Tiroler Sparkasse, Salzburger Sparkasse, and Sparkasse Hainburg. The increase in net interest income was attributable to the reduction of deposit interest rates due to the lower interest rate environment and a change in deposit structure. Together with the improved net fee and commission income it offset the drop in net trading and fair value result. Total operating income increased. Although operating expenses went up slightly, cost/income ratio improved. Net impairment loss on financial assets not measured at FV through profit and loss decreased. The decline in other result was mainly caused by valuation effects. The banking tax increased to EUR 15.9 million (EUR 8.9 million) due to the revised banking tax regulation.

10
Large Corporates in EUR million 2013 2014 Change
Net interest income 185.3 214.1 15.5% Net fee and commission income 86.0 99.2 15.4% Net trading and fair value result 8.4 9.3 10.9% Operating income 279.6 322.5 15.3% Operating expenses -67.7 -85.0 25.6% Operating result 211.9 237.5 12.1% Cost/income ratio 24.2% 26.4% Net impairment loss on financial assets not measured at fair value through profit or loss -229.2 -386.2 68.5% Other result -34.5 14.8 n/a Net result attributable to owners of the parent -45.1 -113.1 >100.0% Return on allocated capital -5.6% -15.1%
The Large Corporates segment comprises the business with large corporate customers whose annual turnover exceeds a defined threshold that varies depending on the country. The increase in net interest income and net commission income was largely attributable to the reallocation of a local large corporate portfolio to the Large Corporates segment (shown in the segment SME in 2013), partially offset by negative impacts on the income attributable to unwinding effects related to the Romanian Large Corpo-rates portfolio. Net trading and fair value result improved moderately. The increase in operating expenses was also mainly driven by the portfolio reallocation. Overall, the operating result improved. The cost/income ratio increased. Net impairment loss on financial assets not measured at FV through profit and loss increased sub-stantially on the back of higher risk provisions for loans and receivables in Romania, partially offset by decreas-ing risk provisions in Austria and Slovakia. The improvement in other result was largely attributable to lower provisions for commitments and guarantees in Romania and Austria. Net result attributable to the owners of the parent deteriorated. Commercial Real Estate in EUR million 2013 2014 Change
Net interest income 170.0 150.1 -11.7% Net fee and commission income 14.3 15.8 10.1% Net trading and fair value result 5.9 -6.2 n/a Operating income 276.7 205.7 -25.6% Operating expenses -134.0 -88.2 -34.1% Operating result 142.7 117.5 -17.7% Cost/income ratio 48.4% 42.9% Net impairment loss on financial assets not measured at fair value through profit or loss -380.5 -364.3 -4.3% Other result -50.3 -45.9 -8.8% Net result attributable to owners of the parent -257.0 -279.6 8.8% Return on allocated capital -28.5% -36.1%
The Commercial Real Estate segment covers the real estate value chain (lending, leasing, real estate invest-ment, project development and construction services as well as infrastructure business) for corporate clients, project developers, real estate investors, municipalities and other public sector agencies. The decline in net interest income was mainly attributable to the deconsolidation of leasing entities of Immorent as well as the non-recurrence of a positive one-off effect. Net fee and commission income improved slightly on the back of higher fees in Czech, Slovak and Hungarian real estate portfolios. The decline in the net trading and fair value result was attributable to FX revaluation losses in Immorent. Rental income declined mostly due to the deconsolidation of Immorent leasing entities. The decline in operating expenses was driven by strict cost man-agement and the deconsolidation of leasing entities. The operating result decreased but cost/income ratio im-proved. Net impairment loss on financial assets not measured at FV through profit and loss reflected an improvement in risk structure, but remained at a high level; mainly driven by Erste Group Bank AG, Immorent, BCR and EB Hungary. The other result was impacted by higher gains from repossessed assets in Hungary and development projects in Immorent. Net result attributable to the owners of the parent declined further.
11
Other Corporate in EUR million 2013 2014 Change
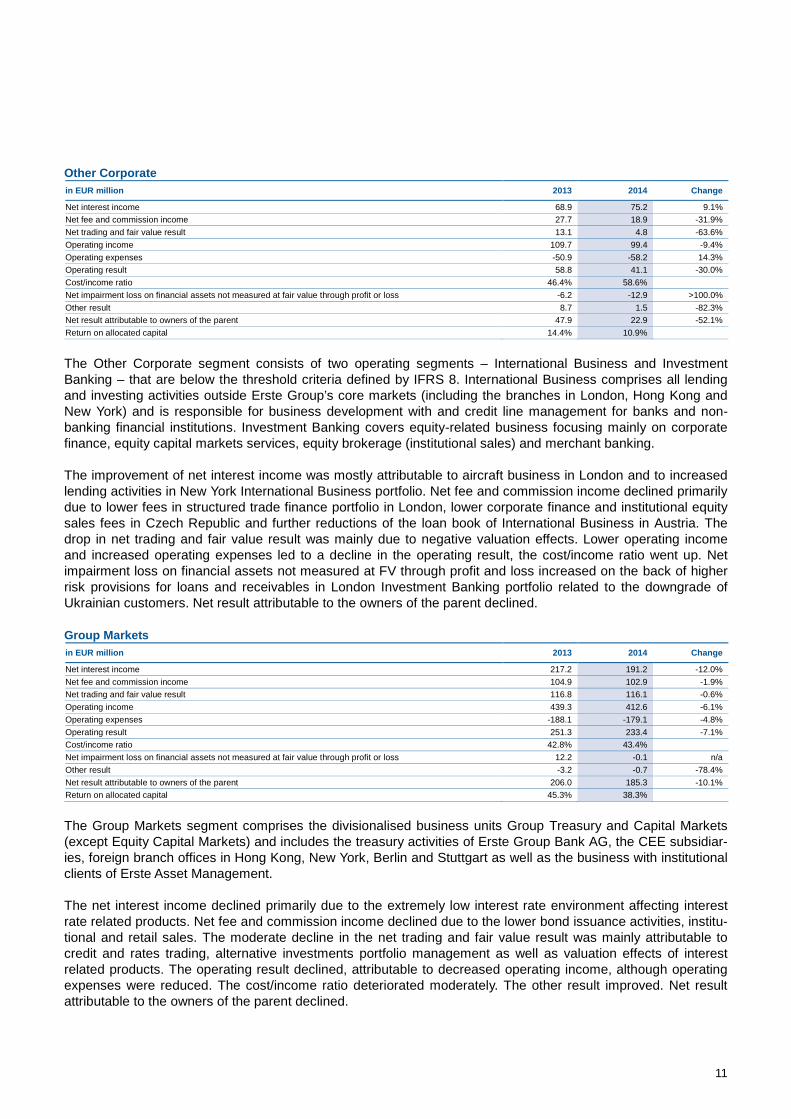
Net interest income 68.9 75.2 9.1% Net fee and commission income 27.7 18.9 -31.9% Net trading and fair value result 13.1 4.8 -63.6% Operating income 109.7 99.4 -9.4% Operating expenses -50.9 -58.2 14.3% Operating result 58.8 41.1 -30.0% Cost/income ratio 46.4% 58.6% Net impairment loss on financial assets not measured at fair value through profit or loss -6.2 -12.9 >100.0% Other result 8.7 1.5 -82.3% Net result attributable to owners of the parent 47.9 22.9 -52.1% Return on allocated capital 14.4% 10.9%
The Other Corporate segment consists of two operating segments – International Business and Investment Banking – that are below the threshold criteria defined by IFRS 8. International Business comprises all lending and investing activities outside Erste Group’s core markets (including the branches in London, Hong Kong and New York) and is responsible for business development with and credit line management for banks and non-banking financial institutions. Investment Banking covers equity-related business focusing mainly on corporate finance, equity capital markets services, equity brokerage (institutional sales) and merchant banking. The improvement of net interest income was mostly attributable to aircraft business in London and to increased lending activities in New York International Business portfolio. Net fee and commission income declined primarily due to lower fees in structured trade finance portfolio in London, lower corporate finance and institutional equity sales fees in Czech Republic and further reductions of the loan book of International Business in Austria. The drop in net trading and fair value result was mainly due to negative valuation effects. Lower operating income and increased operating expenses led to a decline in the operating result, the cost/income ratio went up. Net impairment loss on financial assets not measured at FV through profit and loss increased on the back of higher risk provisions for loans and receivables in London Investment Banking portfolio related to the downgrade of Ukrainian customers. Net result attributable to the owners of the parent declined. Group Markets in EUR million 2013 2014 Change
Net interest income 217.2 191.2 -12.0% Net fee and commission income 104.9 102.9 -1.9% Net trading and fair value result 116.8 116.1 -0.6% Operating income 439.3 412.6 -6.1% Operating expenses -188.1 -179.1 -4.8% Operating result 251.3 233.4 -7.1% Cost/income ratio 42.8% 43.4% Net impairment loss on financial assets not measured at fair value through profit or loss 12.2 -0.1 n/a Other result -3.2 -0.7 -78.4% Net result attributable to owners of the parent 206.0 185.3 -10.1% Return on allocated capital 45.3% 38.3%
The Group Markets segment comprises the divisionalised business units Group Treasury and Capital Markets (except Equity Capital Markets) and includes the treasury activities of Erste Group Bank AG, the CEE subsidiar-ies, foreign branch offices in Hong Kong, New York, Berlin and Stuttgart as well as the business with institutional clients of Erste Asset Management. The net interest income declined primarily due to the extremely low interest rate environment affecting interest rate related products. Net fee and commission income declined due to the lower bond issuance activities, institu-tional and retail sales. The moderate decline in the net trading and fair value result was mainly attributable to credit and rates trading, alternative investments portfolio management as well as valuation effects of interest related products. The operating result declined, attributable to decreased operating income, although operating expenses were reduced. The cost/income ratio deteriorated moderately. The other result improved. Net result attributable to the owners of the parent declined.

12
Group Corporate Center in EUR million 2013 2014 Change
Net interest income 136.1 70.2 -48.5% Net fee and commission income 137.6 69.1 -49.8% Net trading and fair value result 20.9 -11.3 n/a Operating income 361.8 183.3 -49.3% Operating expenses -669.0 -710.5 6.2% Operating result -307.2 -527.2 71.6% Cost/income ratio >100.0% >100.0% Net impairment loss on financial assets not measured at fair value through profit or loss -15.4 -64.7 >100.0% Other result -425.1 -655.7 54.2% Net result attributable to owners of the parent -783.6 -1,423.1 81.6% Return on allocated capital -12.7% -28.7%
The Group Corporate Center segment covers mainly centrally managed activities and items that are not directly allocated to other segments. It includes the Corporate Center of Erste Group Bank AG, internal non-profit service providers, goodwill impairments and the free capital of Erste Group. The net interest income decrease was mainly attributable to the decreasing 5y moving average rate and thus a lower capital benefit from the free capital of the group. Net fee and commission income declined considerably due to higher fee expenses from internal service providers. However, at group level the impact was neutral due to consolidation shown in Intercompany Elimination. Operating expenses went up as a consequence of a change in the methodology of cost reimbursements. The corresponding positive counter effect was shown in other result (at group level the impact was neutral due to consolidation). The deterioration of the other result was driven mainly by higher goodwill impairments of EUR 475.0 million (2013: EUR 380.8 million), whereby Romania ac-counted for EUR 319.1 million, Croatia for EUR 61.4 million and Austrian participations for EUR 94.5 million as well as the write-down of the entire remaining value of customer relationships and brand of BCR of EUR 470.7 million. A negative change in deferred taxes had a further unfavorable impact on the result of the segment. GEOGRAPHICAL SEGMENTS Erste Bank Oesterreich & Subsidiaries in EUR million 2013 2014 Change
Net interest income 559.6 613.5 9.6% Net fee and commission income 332.2 354.9 6.8% Net trading and fair value result 11.3 8.7 -22.5% Operating income 943.2 1,020.3 8.2% Operating expenses -606.9 -630.7 3.9% Operating result 336.3 389.6 15.9% Cost/income ratio 64.3% 61.8% Net impairment loss on financial assets not measured at fair value through profit or loss -77.5 -104.5 34.7% Other result -34.4 6.2 n/a Net result attributable to owners of the parent 160.5 214.5 33.7% Return on allocated capital 14.8% 20.8%
The EBOe & Subsidiaries segment comprises Erste Bank Oesterreich and its main subsidiaries (e.g. sBauspar-kasse, Salzburger Sparkasse, Tiroler Sparkasse, Sparkasse Hainburg). The increase in net interest income was primarily attributable to deposit repricing and a change in deposit struc-ture. Net fee and commission income increased due to the merger with Brokerjet as well as higher payment and insurance fees. The decrease of net trading and fair value result was mainly due to lower valuation gains from derivatives. Although operating expenses increased due to the merger with Brokerjet, higher pension plan con-tributions as well as increased IT and marketing expenses, operating result and cost/income ratio improved. Net impairment loss on financial assets not measured at FV through profit and loss increased due to higher portfolio provisions. Other result was positively affected by a one-off income from insurance payments, whereas 2013 was impacted by impairment of carrying amounts from participations. Overall, the net result attributable to own-ers of the parent improved considerably. Savings Banks The geographical segment Savings Banks is identical to the business segment Savings Banks.

13
Other Austria in EUR million 2013 2014 Change
Net interest income 412.4 395.4 -4.1% Net fee and commission income 180.2 174.0 -3.5% Net trading and fair value result 34.9 3.1 -91.2% Operating income 714.9 621.5 -13.1% Operating expenses -365.1 -323.3 -11.4% Operating result 349.8 298.1 -14.8% Cost/income ratio 51.1% 52.0% Net impairment loss on financial assets not measured at fair value through profit or loss -440.1 -269.2 -38.8% Other result -27.4 -7.2 -73.7% Net result attributable to owners of the parent -121.1 -31.0 -74.4% Return on allocated capital -7.3% -2.1%
The Other Austria segment comprises Erste Group Bank AG (Holding) with its Large Corporates, Commercial Real Estate, Other Corporate and Group Markets business, Erste Group Immorent AG and Erste Asset Man-agement GmbH. The decline in net interest income was mainly attributable to the deconsolidation of leasing entities in Immorent as well as the non-recurrence of a positive one-off effect and to lower income from money market and bonds due to low interest rate environment that was partially compensated by new business in London and New York branches. As an increased volume of assets under management from retail and institutional clients did not fully off-set lower fees in investment banking and lower treasury sales results, net fee and commission income de-clined. The net trading and fair value result decreased primarily due to lower treasury results of Erste Group Bank AG, namely from strategic positions and hedge funds, the yield curve and spreads impact as well as the fair value market pricing of the structured credit portfolio of International Business in Vienna. In addition, the trad-ing result of Immorent decreased mainly due to valuation losses and unfavourable developments of FX rates. Consequently, the operating result declined. Net impairment loss on financial assets not measured at FV through profit and loss improved substantially on the back of lower specific risk provisions in the large corporate business and the commercial real estate business in Erste Group Bank AG as well as in Immorent but remained at an elevated level. The net result attributable to the owners of the parent improved, nevertheless it remained nega-tive. Czech Republic in EUR million 2013 2014 Change
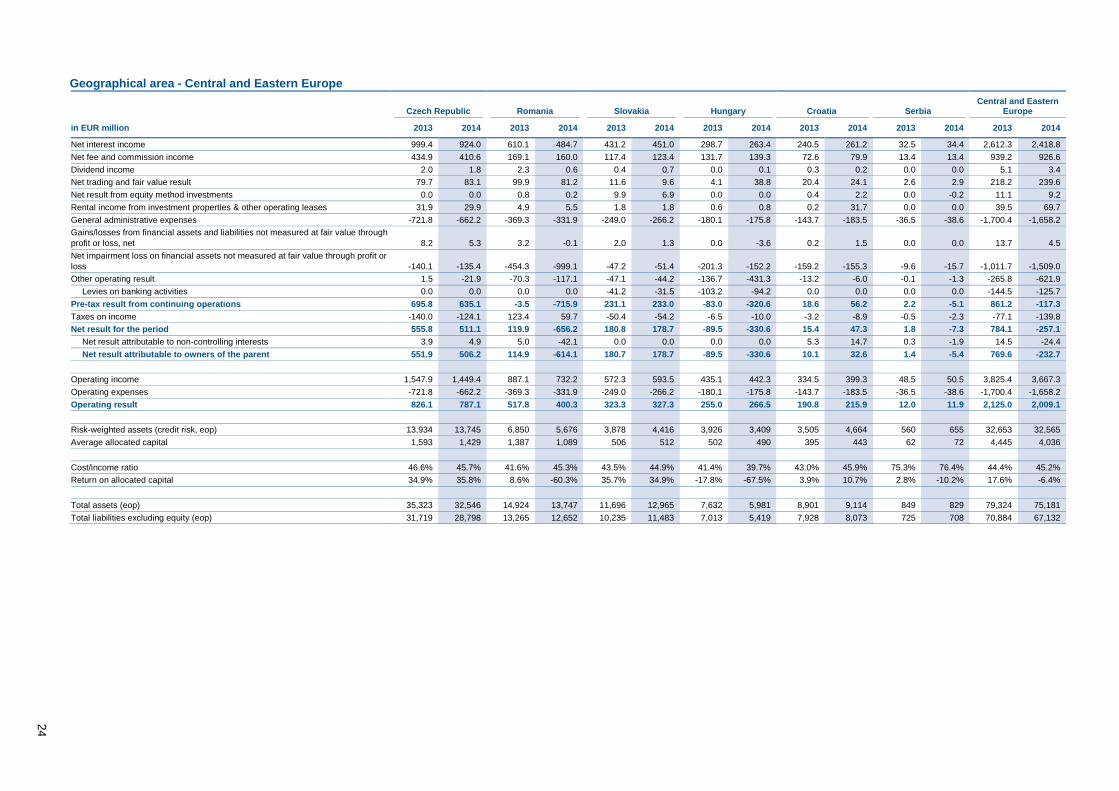
Net interest income 999.4 924.0 -7.5% Net fee and commission income 434.9 410.6 -5.6% Net trading and fair value result 79.7 83.1 4.2% Operating income 1,547.9 1,449.4 -6.4% Operating expenses -721.8 -662.2 -8.3% Operating result 826.1 787.1 -4.7% Cost/income ratio 46.6% 45.7% Net impairment loss on financial assets not measured at fair value through profit or loss -140.1 -135.4 -3.4% Other result 9.8 -16.6 n/a Net result attributable to owners of the parent 551.9 506.2 -8.3% Return on allocated capital 34.9% 35.8%
The devaluation of the CZK due to the intervention of the Czech National Bank in November 2013 had a signifi-cant negative impact on the EUR figures of the Czech Republic segment. Net interest income in the Czech Re-public segment (comprising Česká spořitelna Group) decreased due to the persistently low interest rate environment and subdued loan demand, especially for consumer loans; mortgage loan volumes increased though. Net fee and commission income remained flat in local currency terms. Net trading and FV result in-creased due to improved result from foreign exchange transactions. Lower operating expenses related to cost reduction measures could not off-set the decrease in the operating income resulting in a decline of operating result. However, operating result in local currency terms went up and the cost/income ratio improved. The devia-tion in net impairment loss on financial assets not measured at FV through P&L was mainly attributable to the FX impact. Other result declined due to the non-recurrence of a one-off positive effect from 2013, but also due to impairments on own buildings and real estate funds. Overall, these developments led to a decline in the net re-sult attributable to the owners of the parent.

14
Slovakia in EUR million 2013 2014 Change
Net interest income 431.2 451.0 4.6% Net fee and commission income 117.4 123.4 5.1% Net trading and fair value result 11.6 9.6 -17.2% Operating income 572.3 593.5 3.7% Operating expenses -249.0 -266.2 6.9% Operating result 323.3 327.3 1.2% Cost/income ratio 43.5% 44.9% Net impairment loss on financial assets not measured at fair value through profit or loss -47.2 -51.4 8.8% Other result -45.0 -43.0 -4.6% Net result attributable to owners of the parent 180.7 178.7 -1.1% Return on allocated capital 35.7% 34.9%
The increase in net interest income in the Slovakia segment (comprising Slovenská sporitel’ňa Group) was main-ly attributable to higher new business volumes, namely housing and consumer loans, and a changed deposit structure. Despite the cancellation of loan account fees imposed by legislation, the net fee and commission in-come improved due to current account, insurance and securities fees. The decrease in the net trading and fair value result was driven by valuation losses from derivatives. The increase in operating expenses was mostly related to the EUR 8.9 million payment into the deposit insurance fund (no corresponding payment in 2013) and higher personnel expenses. Owing to improved operating income, the operating result increased. The cost/income ratio increased. Net impairment loss on financial assets not measured at FV through profit and loss increased due to allocation of higher provisions in the commercial real estate business while large corporates developed positively. Other result improved slightly due to a decrease of banking tax (no payment in the fourth quarter of 2014). The net result attributable to the owners of the parent declined moderately. Romania in EUR million 2013 2014 Change
Net interest income 610.1 484.7 -20.6% Net fee and commission income 169.1 160.0 -5.4% Net trading and fair value result 99.9 81.2 -18.7% Operating income 887.1 732.2 -17.5% Operating expenses -369.3 -331.9 -10.1% Operating result 517.8 400.3 -22.7% Cost/income ratio 41.6% 45.3% Net impairment loss on financial assets not measured at fair value through profit or loss -454.3 -999.1 >100.0% Other result -67.1 -117.2 74.7% Net result attributable to owners of the parent 114.9 -614.1 n/a Return on allocated capital 8.6% -60.3%
Net interest income in the Romania segment (comprising Banca Comercială Română Group) decreased after sharp key rate cuts in 2013 and 2014, but also due to lower income from unwinding and declining corporate business. Net fee and commission income declined mainly due to lower fees from loans, current accounts and transaction banking. Net trading and fair value result declined due to a lower result from derivatives. Conse-quently, operating income decreased. Operating expenses decreased on the back of cost reduction measures. The operating result declined and the cost/income ratio deteriorated. The net impairment loss on financial assets not measured at FV through profit and loss increased on the back of the announced accelerated NPL reduction. The net result attributable to the owners of the parent decreased significantly.
15
Hungary in EUR million 2013 2014 Change
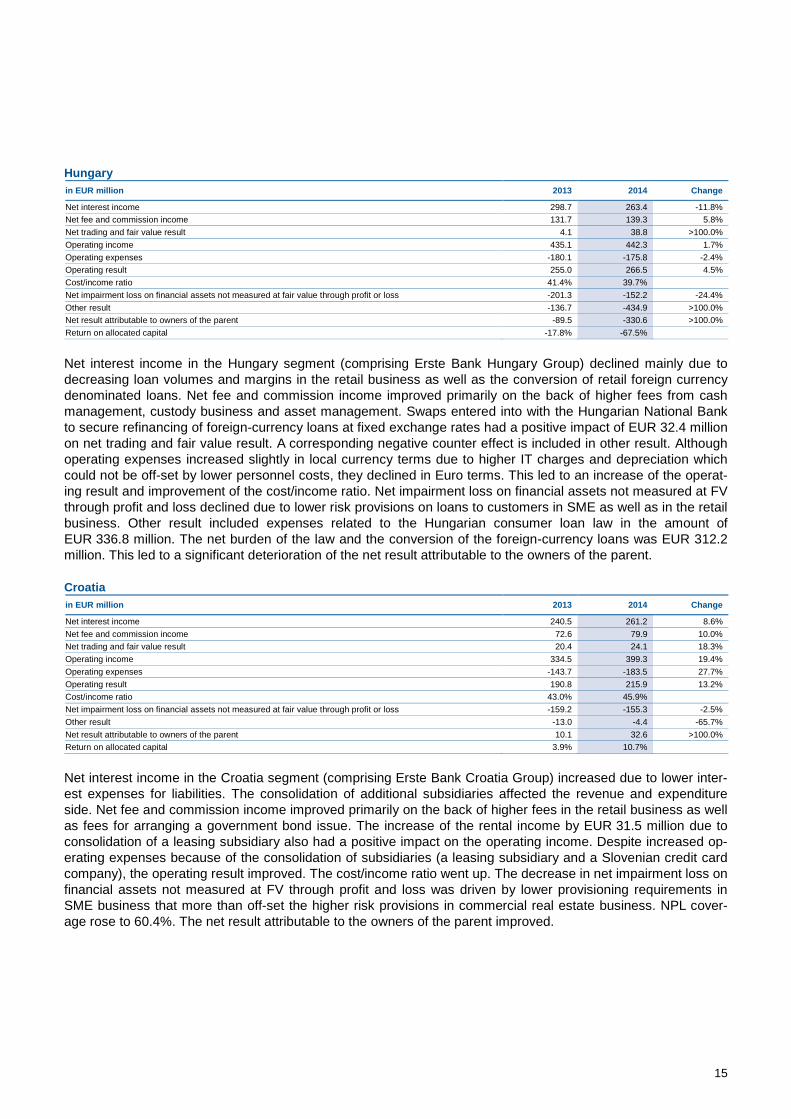
Net interest income 298.7 263.4 -11.8% Net fee and commission income 131.7 139.3 5.8% Net trading and fair value result 4.1 38.8 >100.0% Operating income 435.1 442.3 1.7% Operating expenses -180.1 -175.8 -2.4% Operating result 255.0 266.5 4.5% Cost/income ratio 41.4% 39.7% Net impairment loss on financial assets not measured at fair value through profit or loss -201.3 -152.2 -24.4% Other result -136.7 -434.9 >100.0% Net result attributable to owners of the parent -89.5 -330.6 >100.0% Return on allocated capital -17.8% -67.5%
Net interest income in the Hungary segment (comprising Erste Bank Hungary Group) declined mainly due to decreasing loan volumes and margins in the retail business as well as the conversion of retail foreign currency denominated loans. Net fee and commission income improved primarily on the back of higher fees from cash management, custody business and asset management. Swaps entered into with the Hungarian National Bank to secure refinancing of foreign-currency loans at fixed exchange rates had a positive impact of EUR 32.4 million on net trading and fair value result. A corresponding negative counter effect is included in other result. Although operating expenses increased slightly in local currency terms due to higher IT charges and depreciation which could not be off-set by lower personnel costs, they declined in Euro terms. This led to an increase of the operat-ing result and improvement of the cost/income ratio. Net impairment loss on financial assets not measured at FV through profit and loss declined due to lower risk provisions on loans to customers in SME as well as in the retail business. Other result included expenses related to the Hungarian consumer loan law in the amount of EUR 336.8 million. The net burden of the law and the conversion of the foreign-currency loans was EUR 312.2 million. This led to a significant deterioration of the net result attributable to the owners of the parent. Croatia in EUR million 2013 2014 Change
Net interest income 240.5 261.2 8.6% Net fee and commission income 72.6 79.9 10.0% Net trading and fair value result 20.4 24.1 18.3% Operating income 334.5 399.3 19.4% Operating expenses -143.7 -183.5 27.7% Operating result 190.8 215.9 13.2% Cost/income ratio 43.0% 45.9% Net impairment loss on financial assets not measured at fair value through profit or loss -159.2 -155.3 -2.5% Other result -13.0 -4.4 -65.7% Net result attributable to owners of the parent 10.1 32.6 >100.0% Return on allocated capital 3.9% 10.7%
Net interest income in the Croatia segment (comprising Erste Bank Croatia Group) increased due to lower inter-est expenses for liabilities. The consolidation of additional subsidiaries affected the revenue and expenditure side. Net fee and commission income improved primarily on the back of higher fees in the retail business as well as fees for arranging a government bond issue. The increase of the rental income by EUR 31.5 million due to consolidation of a leasing subsidiary also had a positive impact on the operating income. Despite increased op-erating expenses because of the consolidation of subsidiaries (a leasing subsidiary and a Slovenian credit card company), the operating result improved. The cost/income ratio went up. The decrease in net impairment loss on financial assets not measured at FV through profit and loss was driven by lower provisioning requirements in SME business that more than off-set the higher risk provisions in commercial real estate business. NPL cover-age rose to 60.4%. The net result attributable to the owners of the parent improved.

16
Serbia in EUR million 2013 2014 Change
Net interest income 32.5 34.4 5.9% Net fee and commission income 13.4 13.4 0.1% Net trading and fair value result 2.6 2.9 11.9% Operating income 48.5 50.5 4.3% Operating expenses -36.5 -38.6 5.8% Operating result 12.0 11.9 -0.4% Cost/income ratio 75.3% 76.4% Net impairment loss on financial assets not measured at fair value through profit or loss -9.6 -15.7 63.0% Other result -0.1 -1.3 >100.0% Net result attributable to owners of the parent 1.4 -5.4 n/a Return on allocated capital 2.8% -10.2%
Net interest income in the Serbia segment (comprising Erste Bank Serbia Group) increased mainly as a result of higher margins from consumer loans in retail business. In addition, Asset/Liability management benefitted from liquidity surplus placements. Operating expenses increased mostly due to higher workout and IT costs as well as the consolidation of a leasing company. The increase in net impairment loss on financial assets not measured at FV through profit and loss was driven by the increase of coverage for SME clients. As a result the net result at-tributable to the owners of the parent turned negative. Other in EUR million 2013 2014 Change
Net interest income 286.0 175.7 -38.6% Net fee and commission income -41.5 -4.9 -88.2% Net trading and fair value result -67.7 -10.3 -84.8% Operating income 207.2 189.9 -8.3% Operating expenses -297.2 -242.9 -18.3% Operating result -90.0 -53.0 -41.1% Cost/income ratio >100.0% >100.0% Net impairment loss on financial assets not measured at fair value through profit or loss -15.8 -77.1 >100.0% Other result -628.6 -1,100.9 75.1% Net result attributable to owners of the parent -771.1 -1,411.2 83.0% Return on allocated capital -10.7% -24.4%
The residual segment Other consists mainly of centralised service providers, the Group Asset/Liability Manage-ment and the Corporate Center of Erste Group Bank AG as well as the reconciliation to the consolidated ac-counting result (e.g. intercompany elimination, dividend elimination), goodwill impairments, amortisation of customer relationships and free capital. The decline of the net interest income in the residual segment Other was mainly driven by the lower capital ben-efit from the free capital of the group. Net trading and fair value result improved significantly as revaluation re-sults from derivatives and own issues turned positive. The decline in operating expenses also contributed to the improvement of the operating result. The deterioration of the other result was driven mainly by higher goodwill impairments of EUR 475.0 million (2013: EUR 380.8 million), whereby Romania accounted for EUR 319.1 mil-lion, Croatia for EUR 61.4 million and Austrian participations for EUR 94.5 million as well as the write-down of the entire remaining value of customer relationships and brand of BCR of EUR 470.7 million. In addition, a nega-tive change in deferred taxes also had an unfavorable impact on the result of the segment.
17
Presentation of results via audio webcast and telephone conference for portfolio managers and analysts Date Friday 27 February 2015 Time 9:00 Vienna / 8:00 London / 3:00 New York Live audio webcast http://www.erstegroup.com/investorrelations (slide presentation)
The presentation will be held in English. Dial-in for analysts Please dial in 5-10 minutes prior to the start time using one of the following
numbers and the Confirmation Code 2779502
UK: +44(0)20 3427 1908 National free phone 0800 279 5736 US: +1212 444 0896 National free phone 1877 280 2296
Replay Will be available at http://www.erstegroup.com/en/Investors/Webcasts-Videos. For more information, please contact: Erste Group, Investor Relations, Graben 21, 1010 Vienna, Austria, Fax: +43 5 0100 9 13112 Email: [email protected] Internet: http://www.erstegroup.com/investorrelations http://twitter.com/ErsteGroupIR http://slideshare.net/Erste_Group Thomas Sommerauer Tel +43 5 0100 17326, Email: [email protected] Peter Makray Tel +43 5 0100 16878, Email: [email protected] Simone Pilz Tel +43 5 0100 13036, Email: [email protected] Gerald Krames Tel +43 5 0100 12751, Email: [email protected] This information is also available on http://www.erstegroup.com/en/Investors/News and on the Erste Group Investor Relations App for iPad, iPhone and Android (http://www.erstegroup.com/en/Investors/IR_App)
18
Appendix
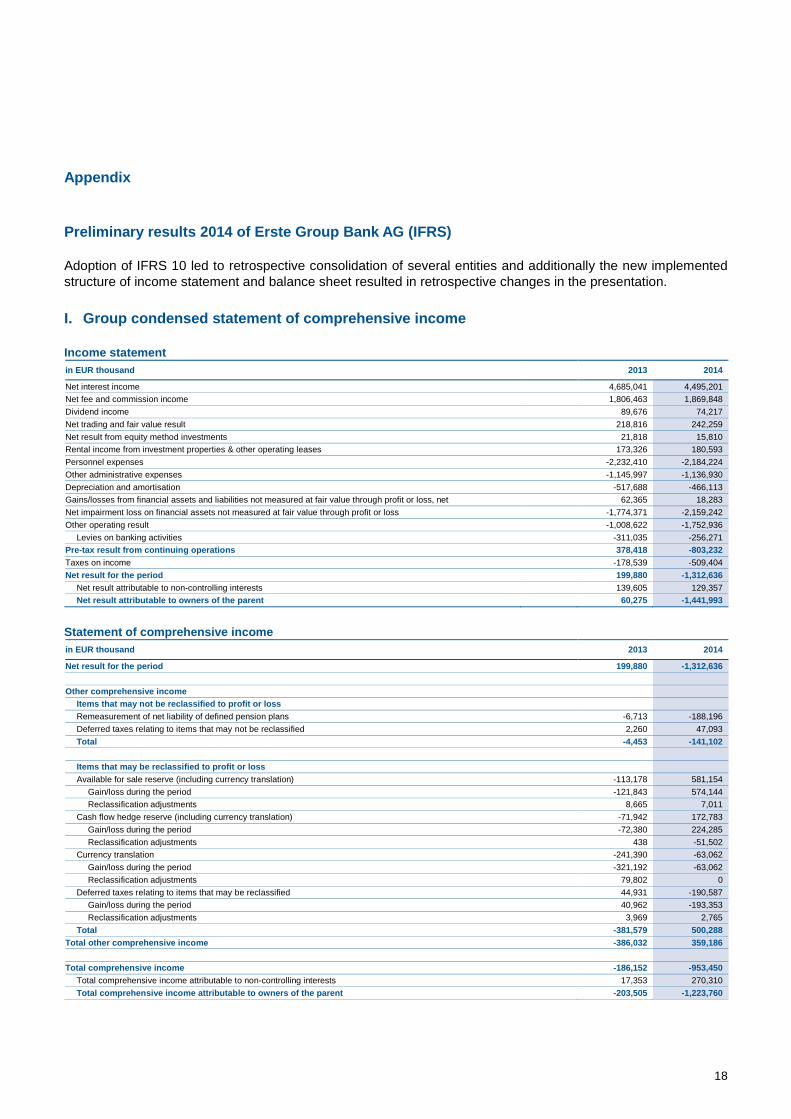
Preliminary results 2014 of Erste Group Bank AG (IFRS)
Adoption of IFRS 10 led to retrospective consolidation of several entities and additionally the new implemented structure of income statement and balance sheet resulted in retrospective changes in the presentation.
I. Group condensed statement of comprehensive income
Income statement in EUR thousand 2013 2014
Net interest income 4,685,041 4,495,201 Net fee and commission income 1,806,463 1,869,848 Dividend income 89,676 74,217 Net trading and fair value result 218,816 242,259 Net result from equity method investments 21,818 15,810 Rental income from investment properties & other operating leases 173,326 180,593 Personnel expenses -2,232,410 -2,184,224 Other administrative expenses -1,145,997 -1,136,930 Depreciation and amortisation -517,688 -466,113 Gains/losses from financial assets and liabilities not measured at fair value through profit or loss, net 62,365 18,283 Net impairment loss on financial assets not measured at fair value through profit or loss -1,774,371 -2,159,242 Other operating result -1,008,622 -1,752,936
Levies on banking activities -311,035 -256,271 Pre-tax result from continuing operations 378,418 -803,232 Taxes on income -178,539 -509,404 Net result for the period 199,880 -1,312,636
Net result attributable to non-controlling interests 139,605 129,357 Net result attributable to owners of the parent 60,275 -1,441,993
Statement of comprehensive income in EUR thousand 2013 2014
Net result for the period 199,880 -1,312,636 Other comprehensive income
Items that may not be reclassified to profit or loss Remeasurement of net liability of defined pension plans -6,713 -188,196 Deferred taxes relating to items that may not be reclassified 2,260 47,093 Total -4,453 -141,102 Items that may be reclassified to profit or loss Available for sale reserve (including currency translation) -113,178 581,154
Gain/loss during the period -121,843 574,144 Reclassification adjustments 8,665 7,011
Cash flow hedge reserve (including currency translation) -71,942 172,783 Gain/loss during the period -72,380 224,285 Reclassification adjustments 438 -51,502
Currency translation -241,390 -63,062 Gain/loss during the period -321,192 -63,062 Reclassification adjustments 79,802 0
Deferred taxes relating to items that may be reclassified 44,931 -190,587 Gain/loss during the period 40,962 -193,353 Reclassification adjustments 3,969 2,765
Total -381,579 500,288 Total other comprehensive income -386,032 359,186 Total comprehensive income -186,152 -953,450
Total comprehensive income attributable to non-controlling interests 17,353 270,310 Total comprehensive income attributable to owners of the parent -203,505 -1,223,760

19
II. Group condensed balance sheet
in EUR thousand Dec 13 Dec 14
Assets Cash and cash balances 9,300,683 7,835,417 Financial assets - held for trading 12,283,046 10,530,878
Derivatives 6,342,237 7,173,380 Other trading assets 5,940,808 3,357,498
Financial assets - at fair value through profit or loss 528,984 349,583 Financial assets - available for sale 20,677,648 22,373,356 Financial assets - held to maturity 17,779,013 16,877,214 Loans and receivables to credit institutions 8,376,688 7,442,288 Loans and receivables to customers 119,944,501 120,833,976 Derivatives - hedge accounting 1,943,645 2,871,607 Property and equipment 2,319,501 2,264,041 Investment properties 950,572 950,168 Intangible assets 2,440,833 1,440,946 Investments in associates and joint ventures 207,594 194,984 Current tax assets 100,398 107,310 Deferred tax assets 719,015 301,469 Assets held for sale 74,774 291,394 Other assets 2,470,898 1,622,702 Total assets 200,117,792 196,287,334 Liabilities and equity Financial liabilities - held for trading 6,474,745 7,746,381
Derivatives 6,086,938 7,188,386 Other trading liabilities 387,807 557,994
Financial liabilities - at fair value through profit or loss 2,339,171 2,072,725 Deposits from banks 0 0 Deposits from customers 459,964 319,960 Debt securities issued 1,879,207 1,752,765 Other financial liabilities 0 0
Financial liabilities measured at amortised cost 170,785,614 166,921,248 Deposits from banks 17,299,491 14,802,602 Deposits from customers 121,955,141 122,262,612 Debt securities issued 31,244,697 29,386,741 Other financial liabilities 286,286 469,294
Derivatives - hedge accounting 644,319 725,928 Changes in fair value of portfolio hedged items 733,747 1,225,473 Provisions 1,447,605 1,652,688 Current tax liabilities 84,519 91,050 Deferred tax liabilities 169,392 98,778 Liabilities associated with assets held for sale 0 0 Other liabilities 2,653,713 2,309,605 Total equity 14,784,966 13,443,457
Equity attributable to non-controlling interests 3,465,959 3,605,371 Equity attributable to owners of the parent 11,319,006 9,838,086
Total liabilities and equity 200,117,792 196,287,334
20
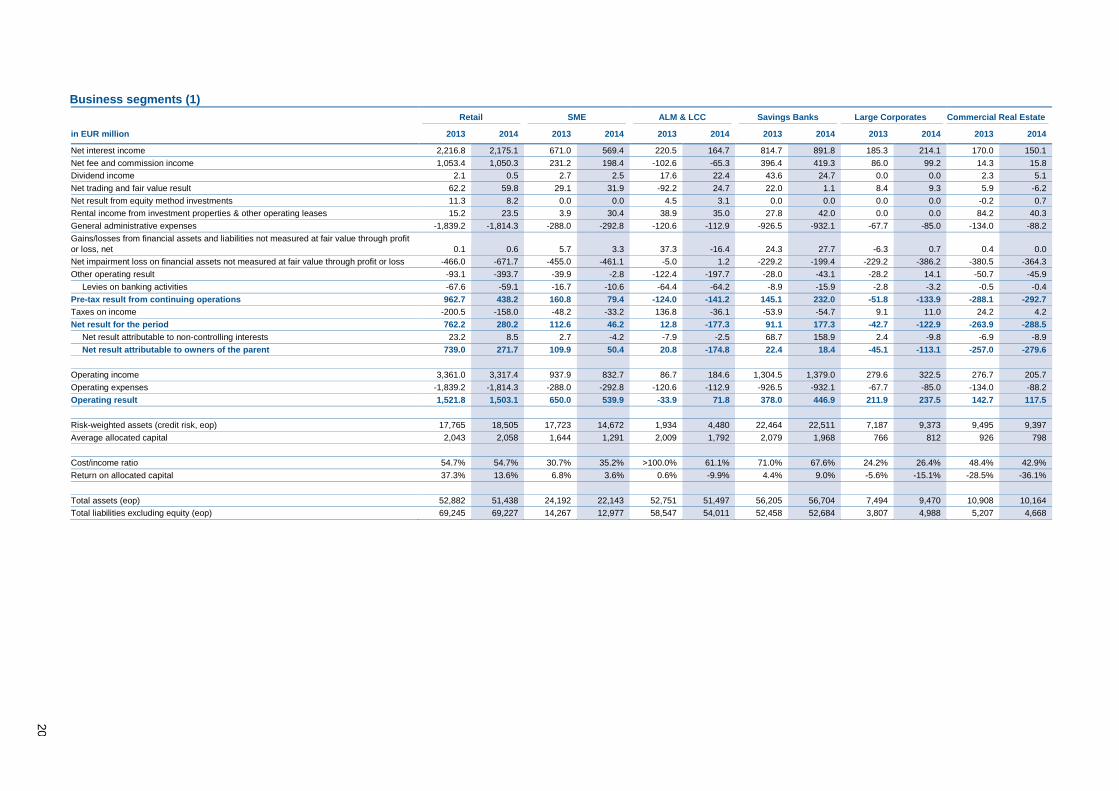
Business segments (1)
Retail SME ALM & LCC Savings Banks Large Corporates Commercial Real Estate
in EUR million 2013 2014 2013 2014 2013 2014 2013 2014 2013 2014 2013 2014
Net interest income 2,216.8 2,175.1 671.0 569.4 220.5 164.7 814.7 891.8 185.3 214.1 170.0 150.1 Net fee and commission income 1,053.4 1,050.3 231.2 198.4 -102.6 -65.3 396.4 419.3 86.0 99.2 14.3 15.8 Dividend income 2.1 0.5 2.7 2.5 17.6 22.4 43.6 24.7 0.0 0.0 2.3 5.1 Net trading and fair value result 62.2 59.8 29.1 31.9 -92.2 24.7 22.0 1.1 8.4 9.3 5.9 -6.2 Net result from equity method investments 11.3 8.2 0.0 0.0 4.5 3.1 0.0 0.0 0.0 0.0 -0.2 0.7 Rental income from investment properties & other operating leases 15.2 23.5 3.9 30.4 38.9 35.0 27.8 42.0 0.0 0.0 84.2 40.3 General administrative expenses -1,839.2 -1,814.3 -288.0 -292.8 -120.6 -112.9 -926.5 -932.1 -67.7 -85.0 -134.0 -88.2 Gains/losses from financial assets and liabilities not measured at fair value through profit or loss, net 0.1 0.6 5.7 3.3 37.3 -16.4 24.3 27.7 -6.3 0.7 0.4 0.0 Net impairment loss on financial assets not measured at fair value through profit or loss -466.0 -671.7 -455.0 -461.1 -5.0 1.2 -229.2 -199.4 -229.2 -386.2 -380.5 -364.3 Other operating result -93.1 -393.7 -39.9 -2.8 -122.4 -197.7 -28.0 -43.1 -28.2 14.1 -50.7 -45.9
Levies on banking activities -67.6 -59.1 -16.7 -10.6 -64.4 -64.2 -8.9 -15.9 -2.8 -3.2 -0.5 -0.4 Pre-tax result from continuing operations 962.7 438.2 160.8 79.4 -124.0 -141.2 145.1 232.0 -51.8 -133.9 -288.1 -292.7 Taxes on income -200.5 -158.0 -48.2 -33.2 136.8 -36.1 -53.9 -54.7 9.1 11.0 24.2 4.2 Net result for the period 762.2 280.2 112.6 46.2 12.8 -177.3 91.1 177.3 -42.7 -122.9 -263.9 -288.5
Net result attributable to non-controlling interests 23.2 8.5 2.7 -4.2 -7.9 -2.5 68.7 158.9 2.4 -9.8 -6.9 -8.9 Net result attributable to owners of the parent 739.0 271.7 109.9 50.4 20.8 -174.8 22.4 18.4 -45.1 -113.1 -257.0 -279.6
Operating income 3,361.0 3,317.4 937.9 832.7 86.7 184.6 1,304.5 1,379.0 279.6 322.5 276.7 205.7 Operating expenses -1,839.2 -1,814.3 -288.0 -292.8 -120.6 -112.9 -926.5 -932.1 -67.7 -85.0 -134.0 -88.2 Operating result 1,521.8 1,503.1 650.0 539.9 -33.9 71.8 378.0 446.9 211.9 237.5 142.7 117.5 Risk-weighted assets (credit risk, eop) 17,765 18,505 17,723 14,672 1,934 4,480 22,464 22,511 7,187 9,373 9,495 9,397 Average allocated capital 2,043 2,058 1,644 1,291 2,009 1,792 2,079 1,968 766 812 926 798 Cost/income ratio 54.7% 54.7% 30.7% 35.2% >100.0% 61.1% 71.0% 67.6% 24.2% 26.4% 48.4% 42.9% Return on allocated capital 37.3% 13.6% 6.8% 3.6% 0.6% -9.9% 4.4% 9.0% -5.6% -15.1% -28.5% -36.1%
Total assets (eop) 52,882 51,438 24,192 22,143 52,751 51,497 56,205 56,704 7,494 9,470 10,908 10,164 Total liabilities excluding equity (eop) 69,245 69,227 14,267 12,977 58,547 54,011 52,458 52,684 3,807 4,988 5,207 4,668

21
Business segments (2) Other Corporate Group Markets Group Corporate Center Intragroup Elimination Total group
in EUR million 2013 2014 2013 2014 2013 2014 2013 2014 2013 2014
Net interest income 68.9 75.2 217.2 191.2 136.1 70.2 -15.5 -6.6 4,685.0 4,495.2 Net fee and commission income 27.7 18.9 104.9 102.9 137.6 69.1 -142.4 -38.8 1,806.5 1,869.8 Dividend income 0.0 0.5 0.5 2.4 20.7 16.4 0.0 -0.1 89.7 74.2 Net trading and fair value result 13.1 4.8 116.8 116.1 20.9 -11.3 32.7 12.0 218.8 242.3 Net result from equity method investments 0.0 0.0 0.0 0.0 6.2 3.9 0.0 0.0 21.8 15.8 Rental income from investment properties & other operating leases 0.0 0.1 0.0 0.0 40.3 35.1 -36.9 -25.7 173.3 180.6 General administrative expenses -50.9 -58.2 -188.1 -179.1 -669.0 -710.5 387.9 485.9 -3,896.1 -3,787.3 Gains/losses from financial assets and liabilities not measured at fair value through profit or loss, net 8.3 0.1 0.0 0.0 -7.5 -0.9 0.1 3.2 62.4 18.3 Net impairment loss on financial assets not measured at fair value through profit or loss -6.2 -12.9 12.2 -0.1 -15.4 -64.7 0.0 0.0 -1,774.4 -2,159.2 Other operating result 0.4 1.5 -3.1 -0.7 -417.6 -654.7 -225.9 -429.9 -1,008.6 -1,752.9
Levies on banking activities 0.0 0.0 -2.5 -2.1 -147.6 -100.8 0.0 0.0 -311.0 -256.3 Pre-tax result from continuing operations 61.3 29.8 260.3 232.7 -747.8 -1,247.5 0.0 0.0 378.4 -803.2 Taxes on income -13.3 -6.9 -51.8 -43.9 19.1 -191.8 0.0 0.0 -178.5 -509.4 Net result for the period 47.9 22.9 208.5 188.8 -728.6 -1,439.4 0.0 0.0 199.9 -1,312.6
Net result attributable to non-controlling interests 0.0 -0.1 2.5 3.5 55.0 -16.2 0.0 0.0 139.6 129.4 Net result attributable to owners of the parent 47.9 22.9 206.0 185.3 -783.6 -1,423.1 0.0 0.0 60.3 -1,442.0
Operating income 109.7 99.4 439.3 412.6 361.8 183.3 -162.1 -59.3 6,995.1 6,877.9 Operating expenses -50.9 -58.2 -188.1 -179.1 -669.0 -710.5 387.9 485.9 -3,896.1 -3,787.3 Operating result 58.8 41.1 251.3 233.4 -307.2 -527.2 225.8 426.6 3,099.0 3,090.7 Risk-weighted assets (credit risk, eop) 3,335 2,672 1,782 2,756 3,173 2,739 0 0 84,858 87,105 Average allocated capital 332 209 460 493 5,745 5,010 0 0 16,004 14,431 Cost/income ratio 46.4% 58.6% 42.8% 43.4% >100.0% >100.0% >100.0% >100.0% 55.7% 55.1% Return on allocated capital 14.4% 10.9% 45.3% 38.3% -12.7% -28.7% 1.2% -9.1%
Total assets (eop) 3,698 3,656 24,590 18,022 13,048 12,093 -45,649 -38,899 200,118 196,287 Total liabilities excluding equity (eop) 58 93 16,117 11,456 11,265 11,716 -45,638 -38,977 185,333 182,844
22
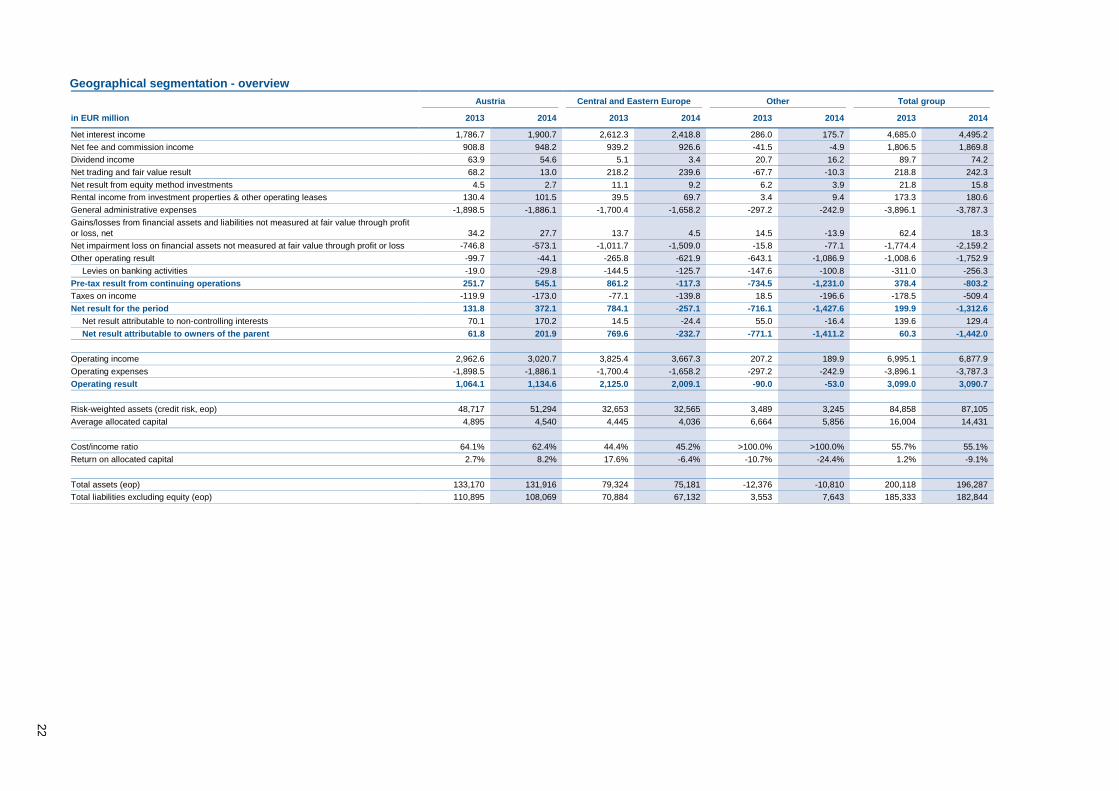
Geographical segmentation - overview Austria Central and Eastern Europe Other Total group
in EUR million 2013 2014 2013 2014 2013 2014 2013 2014
Net interest income 1,786.7 1,900.7 2,612.3 2,418.8 286.0 175.7 4,685.0 4,495.2 Net fee and commission income 908.8 948.2 939.2 926.6 -41.5 -4.9 1,806.5 1,869.8 Dividend income 63.9 54.6 5.1 3.4 20.7 16.2 89.7 74.2 Net trading and fair value result 68.2 13.0 218.2 239.6 -67.7 -10.3 218.8 242.3 Net result from equity method investments 4.5 2.7 11.1 9.2 6.2 3.9 21.8 15.8 Rental income from investment properties & other operating leases 130.4 101.5 39.5 69.7 3.4 9.4 173.3 180.6 General administrative expenses -1,898.5 -1,886.1 -1,700.4 -1,658.2 -297.2 -242.9 -3,896.1 -3,787.3 Gains/losses from financial assets and liabilities not measured at fair value through profit or loss, net 34.2 27.7 13.7 4.5 14.5 -13.9 62.4 18.3 Net impairment loss on financial assets not measured at fair value through profit or loss -746.8 -573.1 -1,011.7 -1,509.0 -15.8 -77.1 -1,774.4 -2,159.2 Other operating result -99.7 -44.1 -265.8 -621.9 -643.1 -1,086.9 -1,008.6 -1,752.9
Levies on banking activities -19.0 -29.8 -144.5 -125.7 -147.6 -100.8 -311.0 -256.3 Pre-tax result from continuing operations 251.7 545.1 861.2 -117.3 -734.5 -1,231.0 378.4 -803.2 Taxes on income -119.9 -173.0 -77.1 -139.8 18.5 -196.6 -178.5 -509.4 Net result for the period 131.8 372.1 784.1 -257.1 -716.1 -1,427.6 199.9 -1,312.6
Net result attributable to non-controlling interests 70.1 170.2 14.5 -24.4 55.0 -16.4 139.6 129.4 Net result attributable to owners of the parent 61.8 201.9 769.6 -232.7 -771.1 -1,411.2 60.3 -1,442.0
Operating income 2,962.6 3,020.7 3,825.4 3,667.3 207.2 189.9 6,995.1 6,877.9 Operating expenses -1,898.5 -1,886.1 -1,700.4 -1,658.2 -297.2 -242.9 -3,896.1 -3,787.3 Operating result 1,064.1 1,134.6 2,125.0 2,009.1 -90.0 -53.0 3,099.0 3,090.7 Risk-weighted assets (credit risk, eop) 48,717 51,294 32,653 32,565 3,489 3,245 84,858 87,105 Average allocated capital 4,895 4,540 4,445 4,036 6,664 5,856 16,004 14,431 Cost/income ratio 64.1% 62.4% 44.4% 45.2% >100.0% >100.0% 55.7% 55.1% Return on allocated capital 2.7% 8.2% 17.6% -6.4% -10.7% -24.4% 1.2% -9.1%
Total assets (eop) 133,170 131,916 79,324 75,181 -12,376 -10,810 200,118 196,287 Total liabilities excluding equity (eop) 110,895 108,069 70,884 67,132 3,553 7,643 185,333 182,844

23
Geographical area - Austria EBOe & Subsidiaries Savings Banks Other Austria Austria
in EUR million 2013 2014 2013 2014 2013 2014 2013 2014
Net interest income 559.6 613.5 814.7 891.8 412.4 395.4 1,786.7 1,900.7 Net fee and commission income 332.2 354.9 396.4 419.3 180.2 174.0 908.8 948.2 Dividend income 17.0 22.0 43.6 24.7 3.3 7.9 63.9 54.6 Net trading and fair value result 11.3 8.7 22.0 1.1 34.9 3.1 68.2 13.0 Net result from equity method investments 4.6 2.1 0.0 0.0 -0.2 0.7 4.5 2.7 Rental income from investment properties & other operating leases 18.4 19.2 27.8 42.0 84.2 40.4 130.4 101.5 General administrative expenses -606.9 -630.7 -926.5 -932.1 -365.1 -323.3 -1,898.5 -1,886.1 Gains/losses from financial assets and liabilities not measured at fair value through profit or loss, net 1.1 -0.4 24.3 27.7 8.9 0.4 34.2 27.7 Net impairment loss on financial assets not measured at fair value through profit or loss -77.5 -104.5 -229.2 -199.4 -440.1 -269.2 -746.8 -573.1 Other operating result -35.4 6.7 -28.0 -43.1 -36.3 -7.6 -99.7 -44.1
Levies on banking activities -9.7 -13.8 -8.9 -15.9 -0.4 0.0 -19.0 -29.8 Pre-tax result from continuing operations 224.4 291.4 145.1 232.0 -117.7 21.7 251.7 545.1 Taxes on income -59.1 -65.1 -53.9 -54.7 -6.8 -53.2 -119.9 -173.0 Net result for the period 165.3 226.3 91.1 177.3 -124.5 -31.5 131.8 372.1
Net result attributable to non-controlling interests 4.8 11.8 68.7 158.9 -3.5 -0.5 70.1 170.2 Net result attributable to owners of the parent 160.5 214.5 22.4 18.4 -121.1 -31.0 61.8 201.9
Operating income 943.2 1,020.3 1,304.5 1,379.0 714.9 621.5 2,962.6 3,020.7 Operating expenses -606.9 -630.7 -926.5 -932.1 -365.1 -323.3 -1,898.5 -1,886.1 Operating result 336.3 389.6 378.0 446.9 349.8 298.1 1,064.1 1,134.6 Risk-weighted assets (credit risk, eop) 11,342 12,589 22,464 22,511 14,911 16,194 48,717 51,294 Average allocated capital 1,114 1,088 2,079 1,968 1,703 1,484 4,895 4,540 Cost/income ratio 64.3% 61.8% 71.0% 67.6% 51.1% 52.0% 64.1% 62.4% Return on allocated capital 14.8% 20.8% 4.4% 9.0% -7.3% -2.1% 2.7% 8.2%
Total assets (eop) 42,162 43,106 56,205 56,704 34,803 32,106 133,170 131,916 Total liabilities excluding equity (eop) 40,034 40,728 52,458 52,684 18,403 14,657 110,895 108,069
24
Geographical area - Central and Eastern Europe
Czech Republic Romania Slovakia Hungary Croatia Serbia Central and Eastern
Europe
in EUR million 2013 2014 2013 2014 2013 2014 2013 2014 2013 2014 2013 2014 2013 2014
Net interest income 999.4 924.0 610.1 484.7 431.2 451.0 298.7 263.4 240.5 261.2 32.5 34.4 2,612.3 2,418.8 Net fee and commission income 434.9 410.6 169.1 160.0 117.4 123.4 131.7 139.3 72.6 79.9 13.4 13.4 939.2 926.6 Dividend income 2.0 1.8 2.3 0.6 0.4 0.7 0.0 0.1 0.3 0.2 0.0 0.0 5.1 3.4 Net trading and fair value result 79.7 83.1 99.9 81.2 11.6 9.6 4.1 38.8 20.4 24.1 2.6 2.9 218.2 239.6 Net result from equity method investments 0.0 0.0 0.8 0.2 9.9 6.9 0.0 0.0 0.4 2.2 0.0 -0.2 11.1 9.2 Rental income from investment properties & other operating leases 31.9 29.9 4.9 5.5 1.8 1.8 0.6 0.8 0.2 31.7 0.0 0.0 39.5 69.7 General administrative expenses -721.8 -662.2 -369.3 -331.9 -249.0 -266.2 -180.1 -175.8 -143.7 -183.5 -36.5 -38.6 -1,700.4 -1,658.2 Gains/losses from financial assets and liabilities not measured at fair value through profit or loss, net 8.2 5.3 3.2 -0.1 2.0 1.3 0.0 -3.6 0.2 1.5 0.0 0.0 13.7 4.5 Net impairment loss on financial assets not measured at fair value through profit or loss -140.1 -135.4 -454.3 -999.1 -47.2 -51.4 -201.3 -152.2 -159.2 -155.3 -9.6 -15.7 -1,011.7 -1,509.0 Other operating result 1.5 -21.9 -70.3 -117.1 -47.1 -44.2 -136.7 -431.3 -13.2 -6.0 -0.1 -1.3 -265.8 -621.9
Levies on banking activities 0.0 0.0 0.0 0.0 -41.2 -31.5 -103.2 -94.2 0.0 0.0 0.0 0.0 -144.5 -125.7 Pre-tax result from continuing operations 695.8 635.1 -3.5 -715.9 231.1 233.0 -83.0 -320.6 18.6 56.2 2.2 -5.1 861.2 -117.3 Taxes on income -140.0 -124.1 123.4 59.7 -50.4 -54.2 -6.5 -10.0 -3.2 -8.9 -0.5 -2.3 -77.1 -139.8 Net result for the period 555.8 511.1 119.9 -656.2 180.8 178.7 -89.5 -330.6 15.4 47.3 1.8 -7.3 784.1 -257.1
Net result attributable to non-controlling interests 3.9 4.9 5.0 -42.1 0.0 0.0 0.0 0.0 5.3 14.7 0.3 -1.9 14.5 -24.4 Net result attributable to owners of the parent 551.9 506.2 114.9 -614.1 180.7 178.7 -89.5 -330.6 10.1 32.6 1.4 -5.4 769.6 -232.7
Operating income 1,547.9 1,449.4 887.1 732.2 572.3 593.5 435.1 442.3 334.5 399.3 48.5 50.5 3,825.4 3,667.3 Operating expenses -721.8 -662.2 -369.3 -331.9 -249.0 -266.2 -180.1 -175.8 -143.7 -183.5 -36.5 -38.6 -1,700.4 -1,658.2 Operating result 826.1 787.1 517.8 400.3 323.3 327.3 255.0 266.5 190.8 215.9 12.0 11.9 2,125.0 2,009.1 Risk-weighted assets (credit risk, eop) 13,934 13,745 6,850 5,676 3,878 4,416 3,926 3,409 3,505 4,664 560 655 32,653 32,565 Average allocated capital 1,593 1,429 1,387 1,089 506 512 502 490 395 443 62 72 4,445 4,036 Cost/income ratio 46.6% 45.7% 41.6% 45.3% 43.5% 44.9% 41.4% 39.7% 43.0% 45.9% 75.3% 76.4% 44.4% 45.2% Return on allocated capital 34.9% 35.8% 8.6% -60.3% 35.7% 34.9% -17.8% -67.5% 3.9% 10.7% 2.8% -10.2% 17.6% -6.4%
Total assets (eop) 35,323 32,546 14,924 13,747 11,696 12,965 7,632 5,981 8,901 9,114 849 829 79,324 75,181 Total liabilities excluding equity (eop) 31,719 28,798 13,265 12,652 10,235 11,483 7,013 5,419 7,928 8,073 725 708 70,884 67,132